Embed Size (px)
Citation preview

FOR RELEASE MAY 14, 2014
Young Adults, Student Debt
and Economic
Well-being
FOR FURTHER INFORMATION
ON THIS REPORT:
Richard Fry, Senior Economist
Kim Parker , Director of Social Trends Research
Molly Rohal, Communications Associate
202.419.4372
www.pewresearch.org
RECOMMENDED CITATION: Richard Fry, 2014. “Young Adults, Student Debt and Economic Well-being.” Washington, D.C.: Pew
Research Center’s Social and Demographic Trends project, May.
NUMBERS, FACTS AND TRENDS SHAPING THE WORLD

1
www.pewresearch.org
EMBARGOED COPY – NOT FOR PUBLICATION OR DISTRIBUTION UNTIL 00:00 a.m./p.m. EDT, MONTH DATE, YEAR EMBARGOED COPY – NOT FOR PUBLICATION OR DISTRIBUTION UNTIL 00:00 a.m./p.m. EDT, MONTH DATE, YEAR
PEW RESEARCH CENTER
About This Report
This report presents an economic and demographic portrait of households headed by persons
younger than 40 and owing student debt. It compares them to similar households that do not have
outstanding student loan balances. The analysis is based on the Survey of Consumer Finances,
which also provides a richer demographic context than is available in credit report data.
This report is a collaborative effort based on the input and analysis of the following individuals.
Alan Murray, the center’s president, and Claudia Deane, the center’s director of research practices,
provided editorial guidance. Kim Parker, director of social trends research, provided editorial
oversight and compiled the section on public opinion among young, college-educated adults.
Richard Fry, senior economist, wrote the report and analyzed the Survey of Consumer Finances.
Rakesh Kochhar, associate director of the Hispanic trends project reviewed the report and
provided editorial guidance. Charts and tables were finalized by Eileen Patten, research analyst.
Number-checking was done by Anna Brown, research assistant. The report was copy-edited by
Marcia Kramer of Kramer Editing Services. Find related reports online at
http://www.pewsocialtrends.org/topics/student-loans/
Paul Taylor, Executive Vice President
Kim Parker, Director of Social Trends Research
Richard Fry, Senior Economist
Eileen Patten, Research Analyst
Anna Brown, Research Assistant

2
www.pewresearch.org
PEW RESEARCH CENTER
A Note on Terminology
Throughout the report a “young household” or “young adult household” refers to a household
headed by a person younger than 40 (including a small number of households with heads younger
than 18).
Household characteristics are assigned on the basis of the characteristics of the head of the
household.
A “college-educated” household refers to a household headed by a person whose highest education
is a bachelor’s degree or more. A “not college-educated” household refers to a household headed
by a person whose highest education is less than a bachelor’s degree.
A “student debtor” refers to a household owing outstanding education-related installment debt
and includes loans that are currently in deferment as well as loans in their scheduled repayment
period. The student debt of all household members is included in the household’s student debt.
“Net worth” and “wealth” are used interchangeably and refer to the difference between the value of
assets owned by a household (such as home, stocks and savings accounts) and its liabilities (such
as mortgages, credit card debt and loans for education).

3
www.pewresearch.org
EMBARGOED COPY – NOT FOR PUBLICATION OR DISTRIBUTION UNTIL 00:00 a.m./p.m. EDT, MONTH DATE, YEAR EMBARGOED COPY – NOT FOR PUBLICATION OR DISTRIBUTION UNTIL 00:00 a.m./p.m. EDT, MONTH DATE, YEAR
PEW RESEARCH CENTER
About Pew Research Center
Pew Research Center is a nonpartisan fact tank that informs the public about the issues, attitudes
and trends shaping America and the world. It does not take policy positions. It conducts public
opinion polling, demographic research, media content analysis and other empirical social science
research. The center studies U.S. politics and policy views; media and journalism; internet and
technology; religion and public life; Hispanic trends; global attitudes; and U.S. social and demo-
graphic trends. All of the center’s reports are available at www.pewresearch.org. Pew Research
Center is a subsidiary of The Pew Charitable Trusts.
Alan Murray, President
Michael Dimock, Vice President, Research
Elizabeth Mueller Gross, Vice President
Paul Taylor, Executive Vice President, Special Projects
Andrew Kohut, Founding Director
© Pew Research Center 2014

4
www.pewresearch.org
PEW RESEARCH CENTER
Overview
BY Richard Fry
Student debt burdens are weighing on the
economic fortunes of younger Americans, as
households headed by young adults owing
student debt lag far behind their peers in terms
of wealth accumulation, according to a new Pew
Research Center analysis of government data.
About four-in-ten U.S. households (37%) headed
by an adult younger than 40 currently have
some student debt—the highest share on record,
with the median outstanding student debt load
standing at about $13,ooo.
An analysis of the most recent Survey of
Consumer Finances finds that households
headed by a young, college-educated adult
without any student debt obligations have about
seven times the typical net worth ($64,700) of
households headed by a young, college-educated
adult with student debt ($8,700). And the
wealth gap is also large for households headed
by young adults without a bachelor’s degree:
Those with no student debt have accumulated
roughly nine times as much wealth as debtor
households ($10,900 vs. $1,200). This is true
despite the fact that debtors and non-debtors have nearly identical household incomes in each
group.
While these stark differences in wealth accumulation are accounted for in part by outstanding
student debt, that’s only part of the story. Since the typical young student debtor household has
about $13,000 in outstanding student loan obligations and the overall wealth gap is much larger,
clearly other factors are also at work. Specifically, student debtor households are accumulating less
wealth, in part, because they tend to owe relatively large amounts of other debt as well, from car
loans to credit card debt. Among the young and college educated, the typical total indebtedness
(including mortgage debt, vehicle debt and credit cards, as well as student debt) of student debtor

5
www.pewresearch.org
EMBARGOED COPY – NOT FOR PUBLICATION OR DISTRIBUTION UNTIL 00:00 a.m./p.m. EDT, MONTH DATE, YEAR EMBARGOED COPY – NOT FOR PUBLICATION OR DISTRIBUTION UNTIL 00:00 a.m./p.m. EDT, MONTH DATE, YEAR
PEW RESEARCH CENTER
households ($137,010) is almost twice the
overall debt load of similar households with no
student debt ($73,250). Among less-educated
households, the total debt load of student
debtors ($28,300) is more than ten times that
of similar households not owing student debt
($2,500).
While taking on debt to fund a college degree
is associated with having a lower net worth, a
more complete financial profile suggests a
bachelor’s degree does pay off in other ways,
particularly in terms of household income. The
typical household income of college-educated
student debtors ($57,941) is nearly twice that
of households whose heads do not have a
bachelor’s degree ($32,528). And as a recent
Pew Research report found, the income gap
between today’s young college graduates and
those without a college degree is much wider
than it was for previous generations of young
adults.
This analysis of student debt does not address the broader question of which factors may be
leading student debtors to carry more overall debt. It may be the case that the burden of student
debt makes it more difficult for young adults to gain financial traction in other areas of their lives.
It may also be the case that with the rising share of young adults enrolling in college these days,
economic gaps between those who borrow for college and those who do not may be widening.
Recent Pew Research Center survey findings echo the link between student debt and individual
economic well-being.1 Among young adult college graduates, those who took out loans to finance
their education are less satisfied overall with their personal financial situation than are those who
1 These findings are based on a Pew Research Center survey conducted Oct. 7-27, 2013, among 2,002 adults nationwide. In this context,
“college graduates” include both associate and bachelor’s degree holders. For full survey results, see “The Rising Cost of Not Going to
College,” Feb. 11, 2014.
Student Debtors Carry a Heavier
Overall Debt Load
Median total indebtedness of young households
Note: Total indebtedness includes all types of debt: mortgage debt, vehicle loans, credit cards, other debt, as well as student debt. Young households are households with heads younger than 40. Households are characterized based on the educational attainment of the household head. “College educated” refers to those with a bachelor’s degree or more. Student debtor households have outstanding student loan balances or student loans in deferment.
Source: Pew Research Center tabulations of the 2010 Survey of Consumer Finances
PEW RESEARCH CENTER
$137,010
$73,250
$28,300
$2,500
COLLEGE EDUCATED
Has student debt
Has student debt
No student debt
No student debt
NOT COLLEGE EDUCATED

6
www.pewresearch.org
PEW RESEARCH CENTER
did not borrow money for college. Young
adults who borrowed for college are also less
likely to see an immediate payoff for the
investment they made in their education.
Student Debt and Other Types of Debt
Comparing young households with similar
levels of education, student debtors in many
cases are more likely to owe other specific
kinds of debts. For example, among college-
educated households, student debtors are
more likely to owe vehicle debt (43% vs. 27%)
and credit card debt (60% vs. 39%). Though
the differences are somewhat less dramatic, a
similar pattern holds among less-educated
young households.
Though student debtor households tend to
have larger total debt loads, indebtedness
needs to be assessed in the context of the
household’s economic resources. In other
words, households with greater income and
assets may be able to take on more debt. Using
the conventional total debt-to-income ratio,
where debt is measured as a share of income,
college-educated student debtors are by far the
most indebted.2 The median college-educated
student debtor has total debt equal to about
two years’ worth of household income (205%).
By comparison, college-educated households
without student debt and less educated
households with student debt have total debts
2 The debt-to-income ratio reported is based on dividing each household’s total debt by its household income. (Households reporting zero
income are assigned $1 of household income so that the ratio can be calculated.) The median of the distribution of the debt-to-income ratio is
reported.
Student Debtors More Likely to Owe
On Cars, Credit Cards
% of young households carrying each type of debt
Note: Young households are households with heads younger than 40. Households are characterized based on the educational attainment of the household head. “College educated” refers to those with a bachelor’s degree or more. Student debtor households have outstanding student loan balances or student loans in deferment. Mortgage debt includes debt for other residential properties, for example, vacation homes, as well as mortgages and other borrowing on a primary residence. “Other installment debt” refers to loans that have fixed payments and a fixed term, excluding student loans or vehicle loans. The “other debt” category includes loans on cash value life insurance policies, borrowing against pension accounts and borrowing on margin accounts, as well as open-ended lines of credit other than a home equity line.
Source: Pew Research Center tabulations of the 2010 Survey of Consumer Finances
PEW RESEARCH CENTER
56
43
9
60
7
36
41
17
46
11
56
27
9
39
7
32
32
15
34
7
Mortgage
Vehicle
Other installment
Credit card
Other
Mortgage
Vehicle
Other installment
Credit card
Other
Has student debt
No student debt
COLLEGE EDUCATED
NOT COLLEGE EDUCATED

7
www.pewresearch.org
EMBARGOED COPY – NOT FOR PUBLICATION OR DISTRIBUTION UNTIL 00:00 a.m./p.m. EDT, MONTH DATE, YEAR EMBARGOED COPY – NOT FOR PUBLICATION OR DISTRIBUTION UNTIL 00:00 a.m./p.m. EDT, MONTH DATE, YEAR
PEW RESEARCH CENTER
on the order of one year’s worth of household income (108% and 100%, respectively).
Aggregate household debt among all households peaked in late 2008 in the aftermath of the
financial crisis (Federal Reserve Bank of New York, 2014). The Survey of Consumer Finances
shows that younger households were reducing their overall indebtedness at a faster clip than older
households between 2007 and 2010 (Fry, 2013). This is very consistent with the large declines in
homeownership among younger households since 2005 (Emmons and Noeth, 2014).
Even as younger households were outpacing their elders in total debt reduction, however, the
outstanding volume of student debt rose over the course of the recession. By the end of 2009,
student debt eclipsed credit card debt as the second-largest type of debt owed by American
households, after mortgages.
The puzzle of declining total indebtedness in the face of rising student loan debt can be resolved by
examining debt burdens among younger households. Judged at the median, young households
without student debt have indeed experienced declining debt burdens since 2007. For example,
among college-educated households lacking student debt, the median debt-to-income ratio fell
from 2007 (127%) to 2010 (108%). But the decline in indebtedness has not been uniform among
Median Debt-to-Household-Income Ratio Much Higher for Student Debtors
Median total debt as % of household income, among young households
COLLEGE EDUCATED NOT COLLEGE EDUCATED
Note: Young households are households with heads younger than 40. Households are characterized based on the educational attainment of the household head. “College educated” refers to those with a bachelor’s degree or more. Student debtor households have outstanding student loan balances or student loans in deferment. The debt-to-income ratio is tabulated for each household. The median ratio is reported. Households reporting zero income were reset to $1 of income in order to compute the ratio.
Source: Pew Research Center tabulations of the 2001 to 2010 Survey of Consumer Finances
PEW RESEARCH CENTER
73.9
138.5 127.1 107.9
108.3
181.2 190.7
204.6
2001 2004 2007 2010
Has student debt
No student debt
31.7 27.5 33.2 10.2
76.3 94.5 86.8
100.2
2001 2004 2007 2010
Has student debt
No student debt

8
www.pewresearch.org
PEW RESEARCH CENTER
young households. Debt-to-income ratios have tended to increase among student debtors, whether
college educated or not.
The remainder of this report analyzes the economic well-being and satisfaction of young student
debtors as well as their demographic characteristics. Section 1 presents the basic economic
outcomes of student debtor households and looks at total indebtedness in the context of household
income and assets. It concludes with recent Pew Research survey findings of young college
graduates on their financial well-being. Section 2 turns to demographics and highlights the greater
education and occupational prestige of young households owing student debt.
About the Data Findings in this report are based on the Survey of Consumer Finances (SCF), which is sponsored by the Federal Reserve
Board of Governors and the Department of Treasury. It has been conducted every three years since 1983 and is
designed to provide detailed information on the finances of U.S. households. The most recent data are from the 2010
SCF. A virtue of the SCF is that it has detailed demographic information on the head of the household. Additional detail
on the collection and nature of the SCF is available in Bricker, et. al., 2012. The SCF sample typically consists of
approximately 4,500 households, but the most recent survey included about 6,500 households. This report focuses on
the finances of the 1,711 households whose heads are younger than 40. All results are appropriately weighted. By
education and student debt status, the unweighted counts of young households are as follows:
Unweighted Sample Sizes
Has student debt No student debt
College educated 295 305
Not college educated 313 798
Note: Among households with heads younger than 40. Households are characterized based on the educational attainment of the household head. “College educated” refers to those with a bachelor’s degree or more. Student debtor households have outstanding student loan balances or student loans in deferment.
Source: Pew Research Center tabulations of the 2010 Survey of Consumer Finances
PEW RESEARCH CENTER
Among the college educated, the mean age of the student debtors is about a year younger than households not owing
student debt (30.8 vs. 31.9). Among households without at least a bachelor’s degree, student debtors are about 1.5
years younger on average (29.0 vs. 30.7).
9
www.pewresearch.org
EMBARGOED COPY – NOT FOR PUBLICATION OR DISTRIBUTION UNTIL 00:00 a.m./p.m. EDT, MONTH DATE, YEAR EMBARGOED COPY – NOT FOR PUBLICATION OR DISTRIBUTION UNTIL 00:00 a.m./p.m. EDT, MONTH DATE, YEAR
PEW RESEARCH CENTER
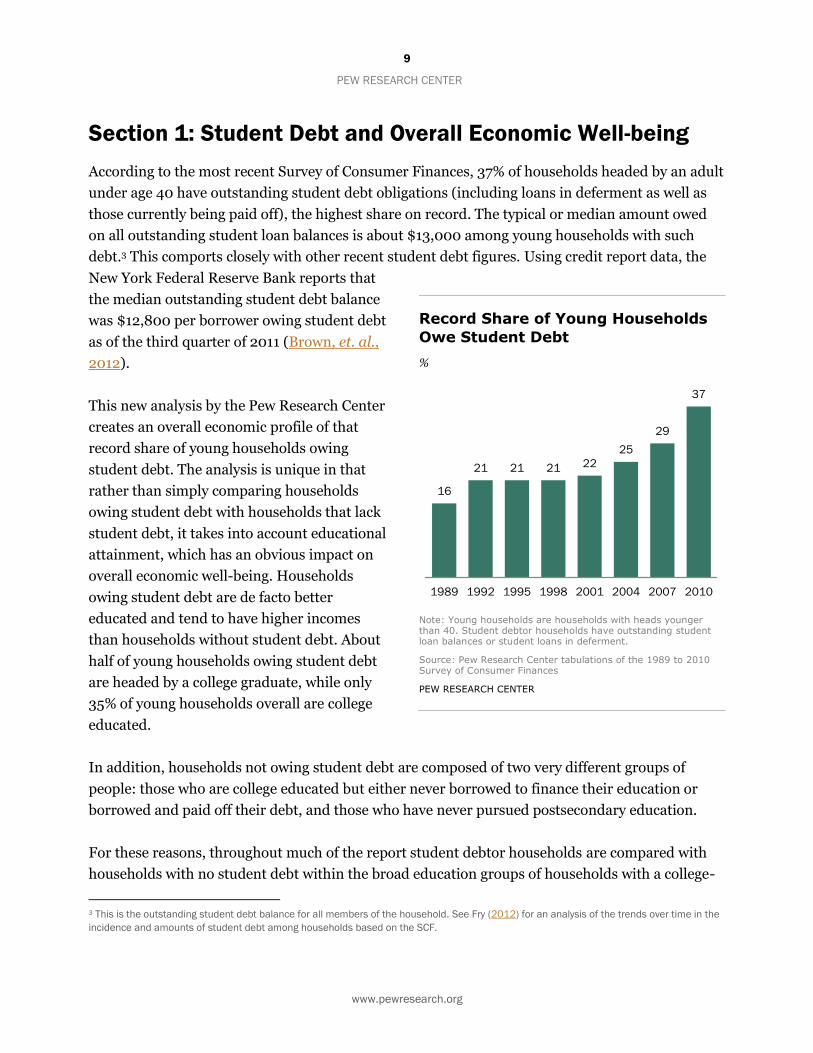
Section 1: Student Debt and Overall Economic Well-being
According to the most recent Survey of Consumer Finances, 37% of households headed by an adult
under age 40 have outstanding student debt obligations (including loans in deferment as well as
those currently being paid off), the highest share on record. The typical or median amount owed
on all outstanding student loan balances is about $13,000 among young households with such
debt.3 This comports closely with other recent student debt figures. Using credit report data, the
New York Federal Reserve Bank reports that
the median outstanding student debt balance
was $12,800 per borrower owing student debt
as of the third quarter of 2011 (Brown, et. al.,
2012).
This new analysis by the Pew Research Center
creates an overall economic profile of that
record share of young households owing
student debt. The analysis is unique in that
rather than simply comparing households
owing student debt with households that lack
student debt, it takes into account educational
attainment, which has an obvious impact on
overall economic well-being. Households
owing student debt are de facto better
educated and tend to have higher incomes
than households without student debt. About
half of young households owing student debt
are headed by a college graduate, while only
35% of young households overall are college
educated.
In addition, households not owing student debt are composed of two very different groups of
people: those who are college educated but either never borrowed to finance their education or
borrowed and paid off their debt, and those who have never pursued postsecondary education.
For these reasons, throughout much of the report student debtor households are compared with
households with no student debt within the broad education groups of households with a college-
3 This is the outstanding student debt balance for all members of the household. See Fry (2012) for an analysis of the trends over time in the
incidence and amounts of student debt among households based on the SCF.
Record Share of Young Households
Owe Student Debt
%
Note: Young households are households with heads younger than 40. Student debtor households have outstanding student loan balances or student loans in deferment.
Source: Pew Research Center tabulations of the 1989 to 2010 Survey of Consumer Finances
PEW RESEARCH CENTER
16
21 21 21 22
25
29
37
1989 1992 1995 1998 2001 2004 2007 2010

10
www.pewresearch.org
PEW RESEARCH CENTER
educated head and households not headed by a college graduate. Doing so alleviates the tendency
to conflagrate the role of student debt with the higher incomes of student debtors.
The Income and Wealth of Student Debtors
The typical household income of student
debtor households within these broad
educational categories is virtually identical to
households without student debt. The median
household income of the young and college
educated is about $58,000 regardless of
student debt. Among less-educated
households, median household income is
approximately $32,000 regardless of student
debt obligations.
But there is a second important metric in
understanding a household’s overall economic
situation: its net worth. While income is what
a household receives annually, net worth is the
household’s nest egg, or what it has
accumulated over time. Formally, net worth is
the value of the household’s assets (both
nonfinancial assets, for example, homes and
cars, as well as financial assets) minus the
value of all the household’s debts, or what it
owns minus what it owes.
Most young households have very modest
amounts of wealth because it takes time to
accumulate assets. But young student debtor
households have much less wealth than their peers not owing such debt. Among the college
educated, those lacking student debt had a median wealth of $64,700 in 2010.4 By comparison
those owing student debt had a median wealth of only $8,700. Among households headed by a
young adult without a bachelor’s degree, those with no student debt had a median net worth of
$10,900, while those with student debt had about a tenth of that ($1,200).
4 The national median wealth level for all households of all ages was $77,000 (Bricker, et. al., 2012).
Income Doesn’t Differ by Student
Debt Status; Net Worth Does
Among young households
MEDIAN HOUSEHOLD INCOME
MEDIAN NET WORTH
Note: Young households are households with heads younger than 40. Households are characterized based on the educational attainment of the household head. “College educated” refers to those with a bachelor’s degree or more. Student debtor households have outstanding student loan balances or student loans in deferment. Net worth is the value of the household assets minus household debts.
Source: Pew Research Center tabulations of the 2010 Survey of Consumer Finances
PEW RESEARCH CENTER
$57,941
$32,528
$57,941
$31,512
College educated
Not college educated
Has student debt No student debt
$8,700
$1,200
$64,700
$10,900
College educated
Not college educated
Has student debt No student debt

11
www.pewresearch.org
EMBARGOED COPY – NOT FOR PUBLICATION OR DISTRIBUTION UNTIL 00:00 a.m./p.m. EDT, MONTH DATE, YEAR EMBARGOED COPY – NOT FOR PUBLICATION OR DISTRIBUTION UNTIL 00:00 a.m./p.m. EDT, MONTH DATE, YEAR
PEW RESEARCH CENTER
In sum, student debtors have very similar incomes but much lower net worth than households not
owing student debt.
The Assets and Debts of Student Debtors
Do student debtors have less wealth because
they have more debts, fewer assets, or both?
Student debtors clearly tend to have a higher
overall debt load than those without any
outstanding student debt, and their greater
indebtedness is only partly attributable to
their student loans. The typical young
household owing student debt has about
$13,000 in outstanding education debt. The
differences in total indebtedness surpass that
amount.
The typical total indebtedness of young,
college-educated households owing student
debt ($137,010) is nearly twice that of their
counterparts not owing student debt
($73,250). These debts include all types of
debt: mortgage debt, vehicle loans and credit
card debt, as well as student debt. Among
young less-educated households, the
difference in indebtedness is even more stark.
Less-educated student debtors owed about
$28,300 in total, compared with $2,500
among those without education debt.
On the asset side, the median differences are
not uniform. Among college-educated
households, student debtors own fewer total assets ($148,500) than those lacking student debt
($197,000). But among households headed by a young adult without a bachelor’s degree, student
debtors tend to have more total assets ($27,500) than those without student debt ($18,600).
Total Assets and Total Debts of
Young Households, by Student Debt
Status
MEDIAN TOTAL ASSETS
MEDIAN TOTAL DEBT
Note: Young households are households with heads younger than 40. Households are characterized based on the educational attainment of the household head. “College educated” refers to those with a bachelor’s degree or more. Student debtor households have outstanding student loan balances or student loans in deferment. Total debt includes mortgage debt, other installment debt and credit card debt, as well as outstanding student debt. The medians are calculated among all households, including those without any assets or without any debt.
Source: Pew Research Center tabulations of the 2010 Survey of Consumer Finances
PEW RESEARCH CENTER
$148,500
$27,500
$197,000
$18,600
College educated
Not college educated
Has student debt No student debt
$137,010
$28,300
$73,250
$2,500
College educated
Not college educated
Has student debt No student debt

12
www.pewresearch.org
PEW RESEARCH CENTER
Debt Measures
Indebtedness should be evaluated in the
context of the household’s wider finances. One
common measure is the leverage ratio, a
simple comparison of outstanding debts to
household assets. Younger households tend to
be more highly leveraged than older
households, and student debtor households
tend to be more leveraged than households
that do not owe student debt.5 Among the
young and college-educated, student debtor
households are nearly twice as leveraged as
their counterparts lacking student debt—67%
vs. 34%. Overall, leverage is higher among
younger households whose heads do not have
a bachelor’s degree. And within those
households, those owing student debt are
more highly leveraged than those not owing
student debt (74% of total assets vs. 47%,
respectively).
This leverage ratio is a group-wide average
that does not take account of the distribution
of debt among households.6 An alternative
approach would be to compare each
household’s debts to its income and examine
the median debt-to-income ratio. In other
words, how many years of income would the
typical young household require to pay off all
its debts? If the household head is college
educated and owes student debt, it would take
a little over two years of household income (205%) to retire all debts. For the typical college-
educated household with no student debt, it would take about half this time (a little over a year of
its income, or 108%). Among less-educated households owing student debt the typical household
5 For all households of all ages the national leverage ratio is 16% (Bricker, et. al., 2012). 6 If, for example, one household owed all the outstanding debt and owned all the assets, the leverage ratio (as constructed) would be the
same.
Total Debts Compared with Total
Assets of Young Households,
by Student Debt Status
Leverage ratio
Total Debts Compared to Household
Income of Young Households,
by Student Debt Status
Median total debt-to-household-income ratio
Note: Young households are households with heads younger than 40. Households are characterized based on the educational attainment of the household head. “College educated” refers to those with a bachelor’s degree or more. Student debtor households have outstanding student loan balances or student loans in deferment. The “leverage ratio” is the sum of the total debt of all households as a percent of the sum of their assets. Debt-to-household income is tabulated for each household. The median of the distribution is reported. For households reporting zero income their household income was set to $1 in order to compute the ratio.
Source: Pew Research Center tabulations of the 2010 Survey of Consumer Finances
PEW RESEARCH CENTER
66.6
74.3
34.5
46.5
College educated
Not college educated
Has student debt No student debt
204.6
100.2
107.9
10.2
College educated
Not college educated
Has student debt No student debt

13
www.pewresearch.org
EMBARGOED COPY – NOT FOR PUBLICATION OR DISTRIBUTION UNTIL 00:00 a.m./p.m. EDT, MONTH DATE, YEAR EMBARGOED COPY – NOT FOR PUBLICATION OR DISTRIBUTION UNTIL 00:00 a.m./p.m. EDT, MONTH DATE, YEAR
PEW RESEARCH CENTER
has indebtedness exactly equal to a year’s worth of household income (100%). Their counterparts
without student debt would need only a tenth of a year of household income to retire all debts
(10%).
Trends in Overall Indebtedness
Aggregate household debt over all households peaked in 2008 (Brown, et. al., 2010). In spite of
rising student debt, it has been younger households who have been in the vanguard of reducing
debt in the aftermath of the Great Recession (Fry, 2013). A basic reason for this is that the retreat
from homeownership since 2004 has been led by younger families (Emmons and Noeth, 2014). If
the family does not own its home, it does not have a mortgage and is therefore free of the largest
component of household debt.
Judged on the basis of the typical debt-to-income ratio, the decline in household indebtedness
among younger households has not been uniform. Among college-educated households owing
student debt, the typical debt-to-income ratio increased from 191% in 2007 to 205% in 2010. By
contrast, the debt-to-income ratio of college-educated households without student debt
Median Total Debt to Household Income for Young Households, by Student
Debt Status, 1989-2010
Median total debt as % of household income
COLLEGE EDUCATED NOT COLLEGE EDUCATED
Note: Young households are households with heads younger than 40. Households are characterized based on the educational attainment of the household head. “College educated” refers to those with a bachelor’s degree or more. Student debtor households have outstanding student loan balances or student loans in deferment. Debt-to-household income is tabulated for each household. The median of the distribution is reported. For households reporting zero income, their household income was set to $1 in order to compute the ratio.
Source: Pew Research Center tabulations of the 1989 to 2010 Survey of Consumer Finances
PEW RESEARCH CENTER
57.6 68.2 65.1
83.8 73.9
138.5 127.1 107.9 103.7 97.5 104.0 101.9
108.3
181.2 190.7
204.6
1989 1995 2001 2007
Has student debt
No student debt
2010
24.5 18.6 28.9 30.7 31.7 27.5 33.2 10.2
42.9
65.2 52.5
92.0 76.3
94.5 86.8
100.2
1989 1995 2001 2007
Has student debt
No student debt
2010

14
www.pewresearch.org
PEW RESEARCH CENTER
obligations fell from 127% in 2007 to 108% in 2010. A similar divergence in the trends in
indebtedness is evident among less-educated households. The only young households that have
experienced a decrease in their debt-to-income ratio since 2007 are those without student debt.
Financial Distress
By a number of benchmarks, young student debtors appear to be experiencing greater financial
stress than comparable households lacking education debt.
The median young household with debts spends about 18% of monthly household income to
service those debts. A common benchmark of financial distress is when households must devote
more than 40% of monthly income to repay debts (Bricker, et. al., 2012; Chiteji, 2007). Under this
criterion, student debtors do not seem to be disproportionately burdened. Among young, college-
educated households, about 15% of student debtors exceed the 40% threshold. Among those
lacking student debt, 17% of households exceed the 40% threshold. Among young and less-
educated households, those lacking student debt are more likely to be devoting large amounts of
their monthly income to debt service (14%) than student debtors (9%). Student debtors include
households whose student loans are currently deferred, however. The monthly debt payments of
student debtors currently in repayment is not available.
Common Measures of Financial Distress of Young Households,
By Student Debt Status
%
-----------COLLEGE EDUCATED----------- --------NOT COLLEGE EDUCATED--------
Has student debt No student debt Has student debt No student debt
Monthly debt service to income exceeds 40% 15 17 9 14
Making late payments on debt 9 3 18 15
Total debt exceeds the value of assets 41 5 47 8
Among homeowners, underwater 21 11 17 15
Note: Young households are households with heads younger than 40. Households are characterized based on the educational attainment of the household head. “College educated” refers to those with a bachelor’s degree or more. Student debtor households have outstanding student loan balances or student loans in deferment. Monthly debt service is the estimated minimum amount monthly that the household pays to service its debt (including interest payments and minimum repayment of principal). Making late payments on debt refers to the share of debtors who were 60 or more days late with their payments on any of their loans in the preceding year. An underwater household has negative home equity in its primary residence.
Source: Pew Research Center tabulations of the 2010 Survey of Consumer Finances
PEW RESEARCH CENTER

15
www.pewresearch.org
EMBARGOED COPY – NOT FOR PUBLICATION OR DISTRIBUTION UNTIL 00:00 a.m./p.m. EDT, MONTH DATE, YEAR EMBARGOED COPY – NOT FOR PUBLICATION OR DISTRIBUTION UNTIL 00:00 a.m./p.m. EDT, MONTH DATE, YEAR
PEW RESEARCH CENTER
Student debtors do seem to have more difficulty making timely debt payments. About 9% of
college-educated student debtors were 60 or more days late with their payments on any of their
loans. By comparison, only 3% of similarly educated debtors lacking student debt were late in their
payments.
In theory, a household can liquidate its assets in order to pay off outstanding debts. By this
measure, young, heavily leveraged student debtors are clearly in a more financially precarious
position than other young households. About four-in-ten college-educated student debtors possess
total debts exceeding the value of their assets, hence asset liquidation will not entirely meet their
outstanding debts in the event of job losses and other unforeseen economic shocks. Among their
counterparts without student debt, only 5% have outstanding debts in excess of current assets.
Similar wide divergence in the incidence of negative net worth (debts in excess of assets) is
apparent among less-educated young households (47% versus 8%).
Finally, we can examine distress in the housing market. A minority of young adult households own
their primary residence. But, when they do, student debtors are more likely than households
without student debt to be “underwater,” i.e., the outstanding mortgage balance as well as other
loans secured by the primary residence exceeds the value of the residence. For example, 21% of
college-educated student debtors are underwater on their primary residence, compared with 11%
lacking student debt.7
7 Among all the nation’s homeowners regardless of age, 8% were underwater (Bricker, et. al., 2012).

16
www.pewresearch.org
PEW RESEARCH CENTER
The Specifics of Debt
A household’s total debts can be broken down into six major debt categories: debt secured by
residential property, vehicle loans, student loans, other installment debt, credit card debt, and
other debt. Without exception, young student debtors are at least as likely as young non-student
debtors to owe each type of debt, and they are often more likely to have such debts.
Among young households headed by a college graduate, those with student debt are more likely
than non-student debtors to have outstanding vehicle debt (43% vs. 27%), significantly more likely
to have credit card debt (60% vs. 39%), and just as likely to have housing-related debt (56%).
Among young households whose heads lack at least a bachelor’s degree, student debtors are more
likely than those without student debt to owe on vehicle loans, credit card debt and other types of
debt and are just as likely to have a mortgage and other installment debt.
Young Households Owing Specific Types of Debt, by Student Debt Status
%
-----------COLLEGE EDUCATED----------- --------NOT COLLEGE EDUCATED--------
Has student debt No student debt Has student debt No student debt
Any debt 100 79 100 65
Type of debt
Secured by residential property 56 56 36 32
Vehicle loans 43 27 41 32
Student loans 100 --- 100 ---
Other installment debt 9 9 17 15
Credit card debt 60 39 46 34
Other debt 7 7 11 7
Note: Young households are households with heads younger than 40. Households are characterized based on the educational attainment of the household head. “College educated” refers to those with a bachelor’s degree or more. Student debtor households have outstanding student loan balances or student loans in deferment. Debt secured by residential property includes debt for other residential properties, for example, vacation homes, as well as mortgages and other borrowing on a primary residence. “Other installment debt” refers to loans that have fixed payments and a fixed term, excluding student loans or vehicle loans. The “other debt” category includes loans on cash value life insurance policies, borrowing against pension accounts and borrowing on margin accounts, as well as open-ended lines of credit other than a home equity line.
Source: Pew Research Center tabulations of the 2010 Survey of Consumer Finances
PEW RESEARCH CENTER

17
www.pewresearch.org
EMBARGOED COPY – NOT FOR PUBLICATION OR DISTRIBUTION UNTIL 00:00 a.m./p.m. EDT, MONTH DATE, YEAR EMBARGOED COPY – NOT FOR PUBLICATION OR DISTRIBUTION UNTIL 00:00 a.m./p.m. EDT, MONTH DATE, YEAR
PEW RESEARCH CENTER
In regard to the outstanding amounts of debt, there do not appear to be notably large differences
between student debtors and others in the specific types of debt. Obviously student debtors owe
student debt and others do not, but for the other five types of debt, differences at the median in the
outstanding balances are modest.8
8 The underlying sample sizes for the other installment debt and other debt categories should be noted. Since about 10% of young
households owe these kinds of debt and, for example, roughly 300 households represent the college-educated student debtors and 300
households represent non-student debtors, the medians for these two debt categories are based on roughly 30 households each.
Median Debt Amounts Owed Among Young Households Carrying That Debt,
by Student Debt Status
-----------COLLEGE EDUCATED----------- --------NOT COLLEGE EDUCATED--------
Has student debt No student debt Has student debt No student debt
Type of debt
Secured by residential property $162,000 $167,000 $95,000 $105,000
Vehicle loans $12,400 $11,000 $11,000 $8,500
Student loans $19,400 --- $9,000 ---
Other installment debt $2,780 $7,000 $2,900 $2,400
Credit card debt $3,300 $2,500 $1,480 $1,480
Other debt $2,000 $6,000 $2,300 $2,000
Note: Young households are households with heads younger than 40. Households are characterized based on the educational attainment of the household head. “College educated” refers to those with a bachelor’s degree or more. Student debtor households have outstanding student loan balances or student loans in deferment. Debt secured by residential property includes debt for other residential properties, for example, vacation homes, as well as mortgages and other borrowing on a primary residence. “Installment debt” refers to loans that have fixed payments and a fixed term, such as student loans, and loans for consumer durables, such as automobiles, furniture and appliances. The “other debt” category includes loans on cash value life insurance policies, borrow ing against pension accounts and borrowing on margin accounts, as well as open-ended lines of credit other than a home equity line.
Source: Pew Research Center tabulations of the 2010 Survey of Consumer Finances
PEW RESEARCH CENTER

18
www.pewresearch.org
PEW RESEARCH CENTER
Public Opinion Findings
A Pew Research Center survey conducted in late 2013 found a significant link between student
debt and economic well-being. Young adults
who took out loans to finance their educations
are less satisfied overall with their personal
financial situation than are those who did not
borrow money for college.
Among adults ages 18 to 39 with two- or four-
year degrees who borrowed for college, 70%
say they are satisfied with their personal
financial situation. Fully three-in-ten (29%)
are not satisfied with their personal finances.
By comparison, 84% of young, college
graduates who did not take out student loans
say they are satisfied with their personal
financial situation, while only 14% are
dissatisfied.
Whether or not they borrowed money for
college, most young college graduates say the investment they made in their education has paid
off. However, the survey findings suggest the payoff may be more immediate for those who did not
take out student loans. Survey respondents were asked whether their college education had paid
off for them financially, given what they and their families paid for that education. Young adults
who had taken out student loans to finance their education were less likely than those who did not
borrow for college to say that their education has paid off.
Among young adult college graduates who borrowed money for college, 63% say the investment
they made in their education has paid off. By comparison, among those who did not borrow money
for college, 81% say college has paid off for them. Overall, 84% of young college graduates who
borrowed money for school say that college has either paid off for them or will in the future.
Most Young Adults Who Borrowed
for College See Eventual Payoff
% who say …
Note: Based on adults ages 18-39 with a two-year or four-year college degree not currently enrolled in college (n=493). Figures may not total to net due to rounding.
Source: Pew Research Center survey, Oct. 7-27, 2013 (N=2,002)
PEW RESEARCH CENTER
81
63
7
20
Did not borrow
Borrowed
Net
Will pay off in
the future
Education
has paid off
88
84
19
www.pewresearch.org
EMBARGOED COPY – NOT FOR PUBLICATION OR DISTRIBUTION UNTIL 00:00 a.m./p.m. EDT, MONTH DATE, YEAR EMBARGOED COPY – NOT FOR PUBLICATION OR DISTRIBUTION UNTIL 00:00 a.m./p.m. EDT, MONTH DATE, YEAR
PEW RESEARCH CENTER
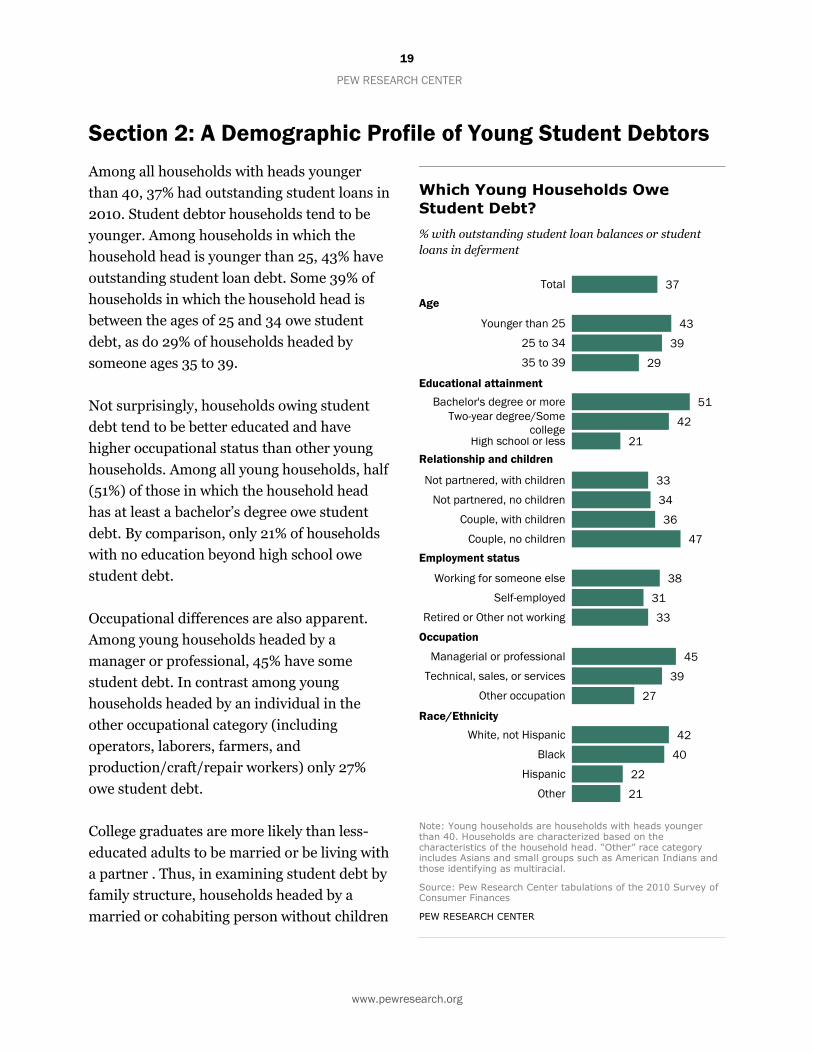
Section 2: A Demographic Profile of Young Student Debtors
Among all households with heads younger
than 40, 37% had outstanding student loans in
2010. Student debtor households tend to be
younger. Among households in which the
household head is younger than 25, 43% have
outstanding student loan debt. Some 39% of
households in which the household head is
between the ages of 25 and 34 owe student
debt, as do 29% of households headed by
someone ages 35 to 39.
Not surprisingly, households owing student
debt tend to be better educated and have
higher occupational status than other young
households. Among all young households, half
(51%) of those in which the household head
has at least a bachelor’s degree owe student
debt. By comparison, only 21% of households
with no education beyond high school owe
student debt.
Occupational differences are also apparent.
Among young households headed by a
manager or professional, 45% have some
student debt. In contrast among young
households headed by an individual in the
other occupational category (including
operators, laborers, farmers, and
production/craft/repair workers) only 27%
owe student debt.
College graduates are more likely than less-
educated adults to be married or be living with
a partner . Thus, in examining student debt by
family structure, households headed by a
married or cohabiting person without children
Which Young Households Owe
Student Debt?
% with outstanding student loan balances or student
loans in deferment
Note: Young households are households with heads younger than 40. Households are characterized based on the characteristics of the household head. “Other” race category includes Asians and small groups such as American Indians and those identifying as multiracial.
Source: Pew Research Center tabulations of the 2010 Survey of Consumer Finances
PEW RESEARCH CENTER
37
43
39
29
51
42
21
33
34
36
47
38
31
33
45
39
27
42
40
22
21
Total
Younger than 25
25 to 34
35 to 39
Bachelor's degree or more
Some college
High school or less
Not partnered, with children
Not partnered, no children
Couple, with children
Couple, no children
Working for someone else
Self-employed
Retired or Other not working
Managerial or professional
Technical, sales, or services
Other occupation
White, not Hispanic
Black
Hispanic
Other
Age
Educational attainment
Occupation
Employment status
Relationship and children
Race/Ethnicity
Two-year degree/Some
college

20
www.pewresearch.org
PEW RESEARCH CENTER
(47%) are significantly more likely to owe student debt than households headed by those without a
partner (about a third owe student debt).
Among racial and ethnic groups, young white and black households are most likely have education
debt (42% and 40%, respectively), and young Hispanic households are about half as likely to owe
such debt (22%).
The Assets of Student Debtors
Prior economic studies have
examined the relationship
between student debt and
ownership of assets on the
basis of credit report data
(Brown and Caldwell, 2013).
The limitation here is that
credit report data do not
directly measure asset
ownership, while the Survey of
Consumer Finances possesses
detailed information on both
nonfinancial and financial
asset ownership. The most
recent survey does not provide
strong evidence that young student debtors are less likely to own homes or cars.
Among households headed by those who do not at least have a bachelor’s degree, student debtors
tend to be more likely to own a vehicle. Otherwise, there are not many differences in asset
ownership between student debtors and student debt-free households.
Asset Ownership of Young Households,
by Student Debt Status
% owning asset
------COLLEGE EDUCATED------ --NOT COLLEGE EDUCATED--
Has
student debt No
student debt Has
student debt No
student debt
Primary residence 55 60 39 37
Vehicle 90 88 83 77
Business 10 12 8 8
Note: Young households are households with heads younger than 40. Households are characterized based on the educational attainment of the household head. “College educated” refers to those with a bachelor’s degree or more. Student debtor households have outstanding student loan balances or student loans in deferment.
Source: Pew Research Center tabulations of the 2010 Survey of Consumer Finances
PEW RESEARCH CENTER

21
www.pewresearch.org
EMBARGOED COPY – NOT FOR PUBLICATION OR DISTRIBUTION UNTIL 00:00 a.m./p.m. EDT, MONTH DATE, YEAR EMBARGOED COPY – NOT FOR PUBLICATION OR DISTRIBUTION UNTIL 00:00 a.m./p.m. EDT, MONTH DATE, YEAR
PEW RESEARCH CENTER
References
Bricker, Jesse, Arthur B. Kennickell, Kevin B. Moore, and John Sabelhaus, 2012. “Changes in U.S.
Family Finances from 2007 to 2010: Evidence from the Survey of Consumer Finances.”
Bulletin 98-2. Washington, D.C.: Board of Governors of the Federal Reserve, June.
http://www.federalreserve.gov/pubs/bulletin/2012/PDF/scf12.pdf
Brown, Meta, Andrew Haughwout, Donghoon Lee, and Wilbert van der Klaauw, 2010. “The
Financial Crisis at the Kitchen Table: Trends in Household Debt and Credit.” New York:
Federal Reserve Bank of New York Staff Report No. 480, December.
http://www.ny.frb.org/research/staff_reports/sr480.html
Brown, Meta, Andrew Haughwout, Donghoon Lee, Maricar Mabutas, and Wilbert van der Klaauw,
2012. “Grading Student Loans.” Liberty Street Economics blog. New York: Federal Reserve
Bank of New York, March.
http://libertystreeteconomics.newyorkfed.org/2012/03/grading-student-
loans.html#.U0MJwvldV8E
Brown, Meta, and Sydnee Caldwell, 2013. “Young Student Loan Borrowers Retreat from Housing
and Auto Markets.” Liberty Street Economics blog. New York: Federal Reserve Bank of
New York, April. http://libertystreeteconomics.newyorkfed.org/2013/04/young-student-
loan-borrowers-retreat-from-housing-and-auto-markets.html#.U0bfiPldV8E
Chiteji, Ngina S., 2007. “To Have and to Hold: An Analysis of Young Adult Debt,” in The Price of
Independence: The Economics of Early Adulthood, edited by Sheldon Danziger and Cecilia
E. Rouse. New York: Russell Sage Foundation.
Elliott, William, and IlSung Nam, 2013. “Is Student Debt Jeopardizing the Short-Term Financial
Health of U.S. Households?” Federal Reserve Bank of St. Louis Review,
September/October 2013, vol. 95, no. 5, pp. 405-24. St. Louis.
http://research.stlouisfed.org/publications/review/13/09/Elliott.pdf
Emmons, William R., and Bryan J. Noeth, 2014. “Housing Crash Continues to Overshadow Young
Families’ Balance Sheets.” St. Louis: Center for Household Financial Stability at the St.
Louis Federal Reserve Bank, February.
http://www.stlouisfed.org/publications/itb/articles/?id=2481

22
www.pewresearch.org
PEW RESEARCH CENTER
Federal Reserve Bank of New York, 2014. “Quarterly Report on Household Debt and Credit.” New
York: February. http://www.newyorkfed.org/householdcredit/2013-
Q4/HHDC_2013Q4.pdf
Fry, Richard, 2012. “A Record One-in-Five Households Now Owe Student Loan Debt: Burden
Greatest on Young, Poor.” Washington, D.C.: Pew Research Center Social and
Demographic Trends Project, September. http://www.pewsocialtrends.org/2012/09/26/a-
record-one-in-five-households-now-owe-student-loan-debt/
Fry, Richard, 2013. “Young Adults After the Recession: Fewer Homes, Fewer Cars, Less Debt.”
Washington, D.C.: Pew Research Center Social and Demographic Trends Project, February.
http://www.pewsocialtrends.org/2013/02/21/young-adults-after-the-recession-fewer-
homes-fewer-cars-less-debt/