Embed Size (px)
Citation preview
2014/2015 Trends in Compensation
Society for Information Management
Minnesota ChapterPresented by:
Maureen DriscollPrincipal, Compensation Consulting
Today’s Presenter
– Maureen Driscoll• Principal with Verisight’s compensation consulting group• 35 years of compensation experience• 23 years of consulting experience
2
Agenda
– Trend data• Verisight’s 2014/2015 Compensation, Retirement and
Benefits Trend Survey– Total rewards philosophy– Base pay considerations
• Job families and career pathing– Variable pay considerations– Nontraditional rewards– What employees want: rewards of work
3
Why is This Topic Important?
• Attracting and retaining skilled employees is critical• 81% of IT professionals are open to hearing about new job
opportunities, even if they are happily employed*• IT professionals report receiving an average of 34 job
solicitations each week*• Total compensation costs usually represent the greatest expense to
organizations• Turnover is costly
• Saratoga Institute 1x salary• World At Work 1.5x salary
*Minneapolis/St. Paul Business Journal-Dec 2014
4
Verisight and McGladrey 2014/2015 Compensation, Retirement
and Benefits Trends Report
2014/2015 Compensation, Retirement and Benefits Trends Report
2014/2015 Compensation, Retirement and Benefits Trends Report
• Fourth annual survey• More than 1,000 participants from across the country• Respondents span a range of industries• Deepest penetration in manufacturing, not-for-profit, health care and
professional services industries
6
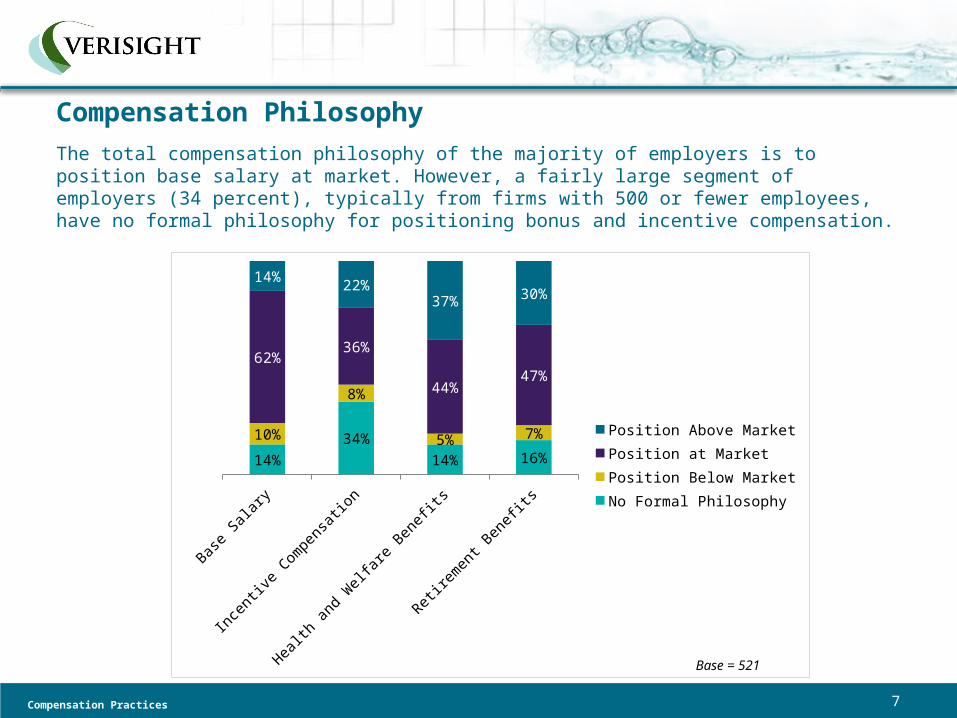
The total compensation philosophy of the majority of employers is to position base salary at market. However, a fairly large segment of employers (34 percent), typically from firms with 500 or fewer employees, have no formal philosophy for positioning bonus and incentive compensation.
Compensation Philosophy
Compensation Practices
Base
Salar
y
Ince
ntive
Compen
satio
n
Health
and W
elfa
re B
enefi
ts
Retire
men
t Ben
efits
14%
34%
14% 16%
10%
8%
5% 7%
62%36%
44%47%
14%22%
37% 30%
Position Above Market
Position at Market
Position Below Market
No Formal Philosophy
Base = 521
7
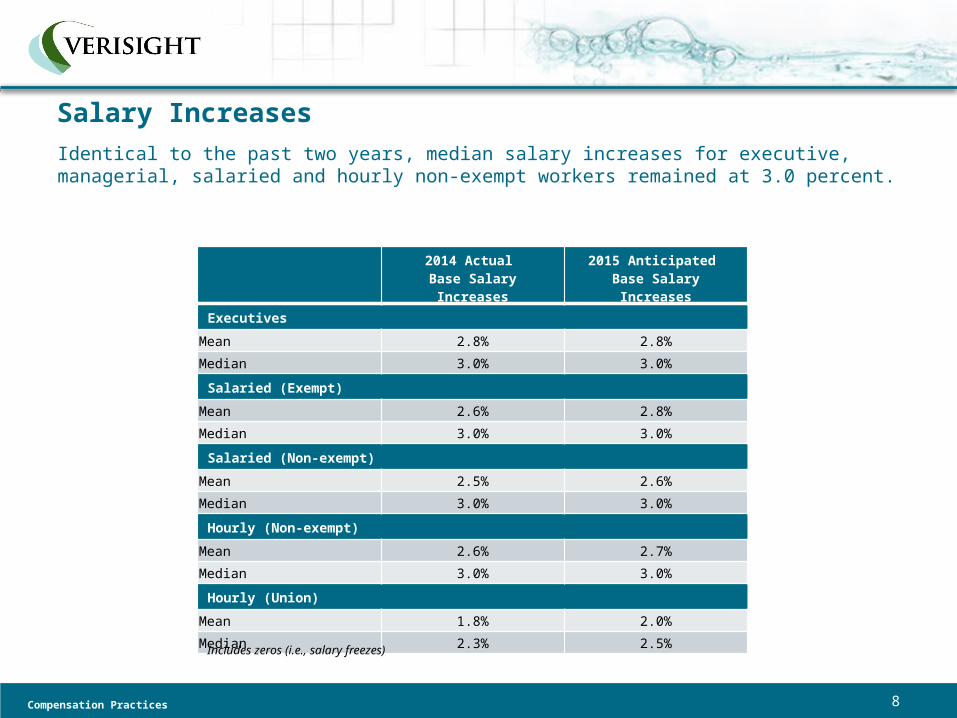
Salary IncreasesIdentical to the past two years, median salary increases for executive, managerial, salaried and hourly non-exempt workers remained at 3.0 percent.
Compensation Practices
2014 Actual Base Salary Increases
2015 Anticipated Base Salary Increases
Executives
Mean 2.8% 2.8%
Median 3.0% 3.0%
Salaried (Exempt)
Mean 2.6% 2.8%
Median 3.0% 3.0%
Salaried (Non-exempt)
Mean 2.5% 2.6%
Median 3.0% 3.0%
Hourly (Non-exempt)
Mean 2.6% 2.7%
Median 3.0% 3.0%
Hourly (Union)
Mean 1.8% 2.0%
Median 2.3% 2.5%
Includes zeros (i.e., salary freezes)
8
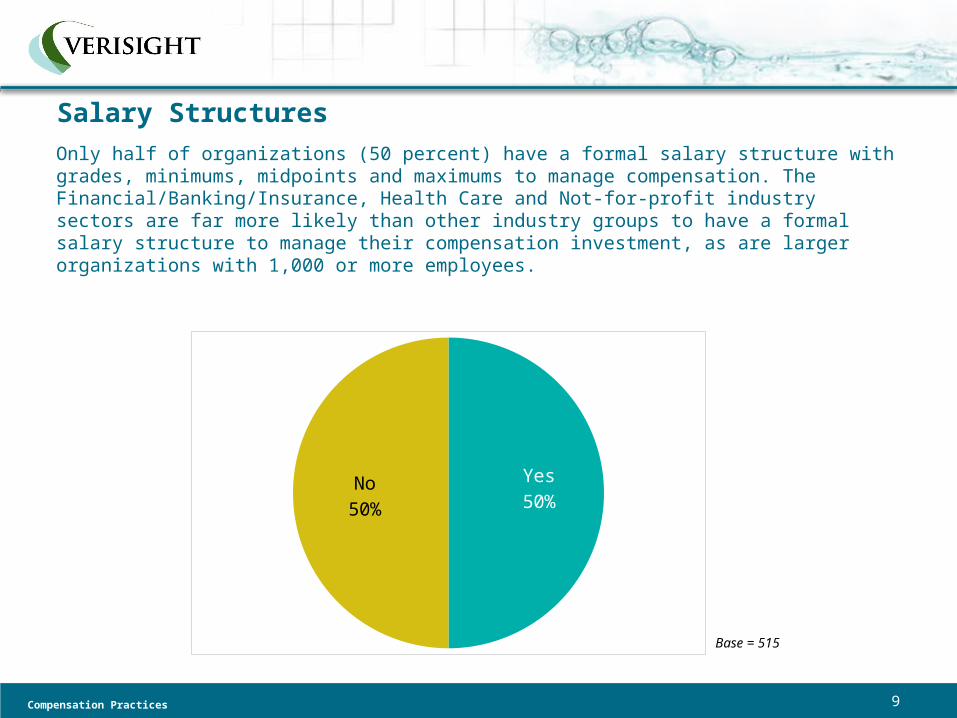
Salary StructuresOnly half of organizations (50 percent) have a formal salary structure with grades, minimums, midpoints and maximums to manage compensation. The Financial/Banking/Insurance, Health Care and Not-for-profit industry sectors are far more likely than other industry groups to have a formal salary structure to manage their compensation investment, as are larger organizations with 1,000 or more employees.
Compensation Practices
Yes50%
No50%
Base = 515
9
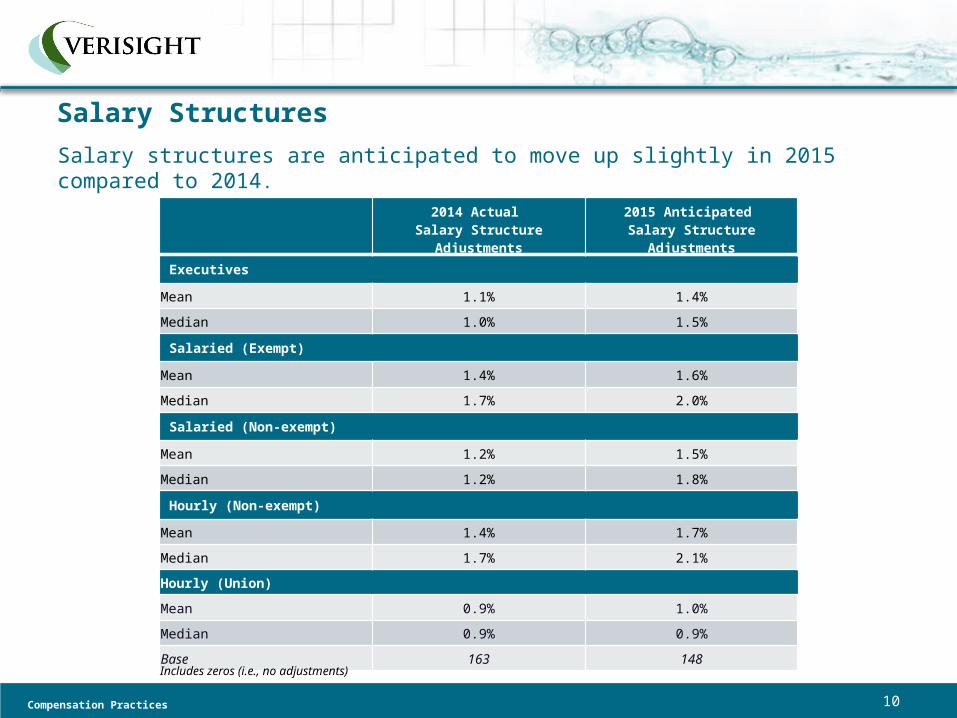
Salary Structures
Salary structures are anticipated to move up slightly in 2015 compared to 2014.
Compensation Practices
2014 Actual Salary Structure
Adjustments
2015 Anticipated Salary Structure
Adjustments
Executives
Mean 1.1% 1.4%
Median 1.0% 1.5%
Salaried (Exempt)
Mean 1.4% 1.6%
Median 1.7% 2.0%
Salaried (Non-exempt)
Mean 1.2% 1.5%
Median 1.2% 1.8%
Hourly (Non-exempt)
Mean 1.4% 1.7%
Median 1.7% 2.1%
Hourly (Union)
Mean 0.9% 1.0%
Median 0.9% 0.9%
Base 163 148Includes zeros (i.e., no adjustments)
10
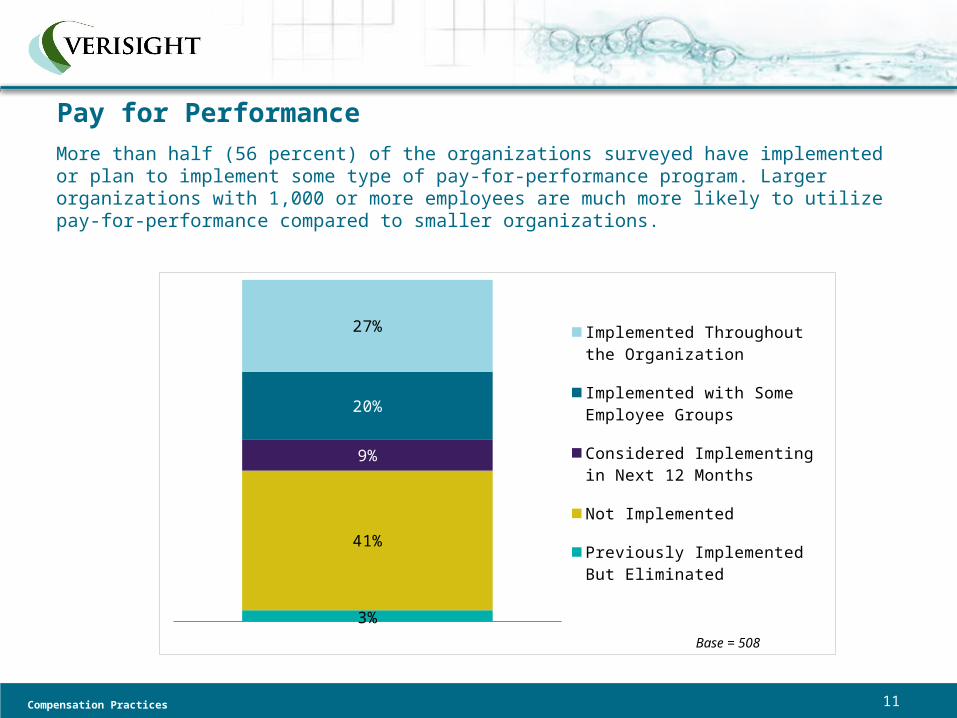
Pay for PerformanceMore than half (56 percent) of the organizations surveyed have implemented or plan to implement some type of pay-for-performance program. Larger organizations with 1,000 or more employees are much more likely to utilize pay-for-performance compared to smaller organizations.
Compensation Practices
3%
41%
9%
20%
27% Implemented Throughout the Organization
Implemented with Some Employee Groups
Considered Implementing in Next 12 Months
Not Implemented
Previously Implemented But Eliminated
Base = 508
11
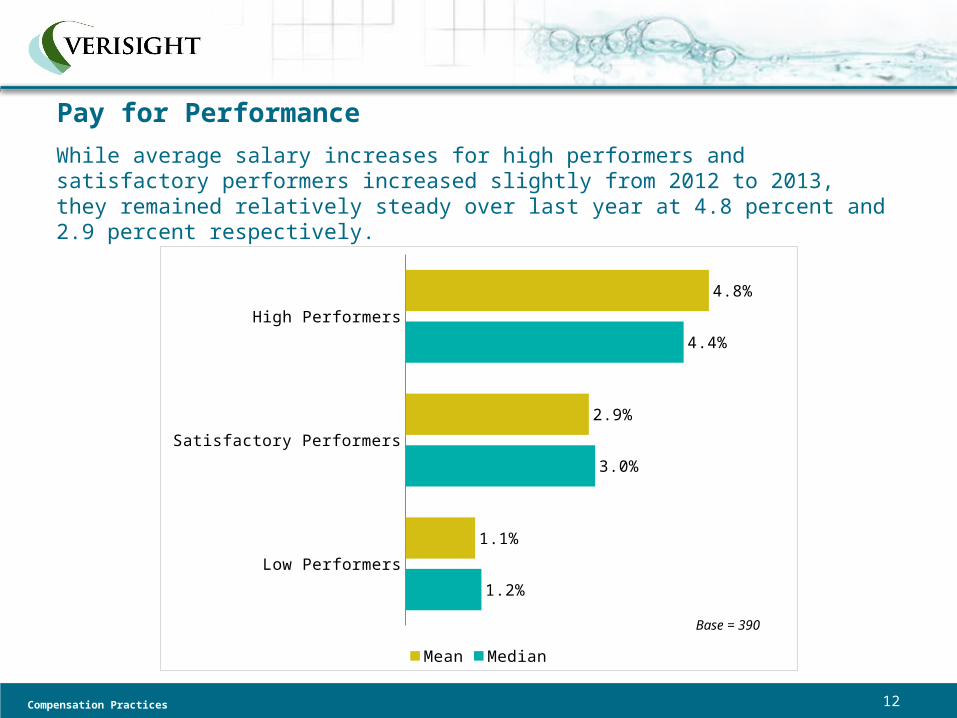
Pay for Performance
While average salary increases for high performers and satisfactory performers increased slightly from 2012 to 2013, they remained relatively steady over last year at 4.8 percent and 2.9 percent respectively.
Compensation Practices
Low Performers
Satisfactory Performers
High Performers
1.2%
3.0%
4.4%
1.1%
2.9%
4.8%
Mean Median
Base = 390
12
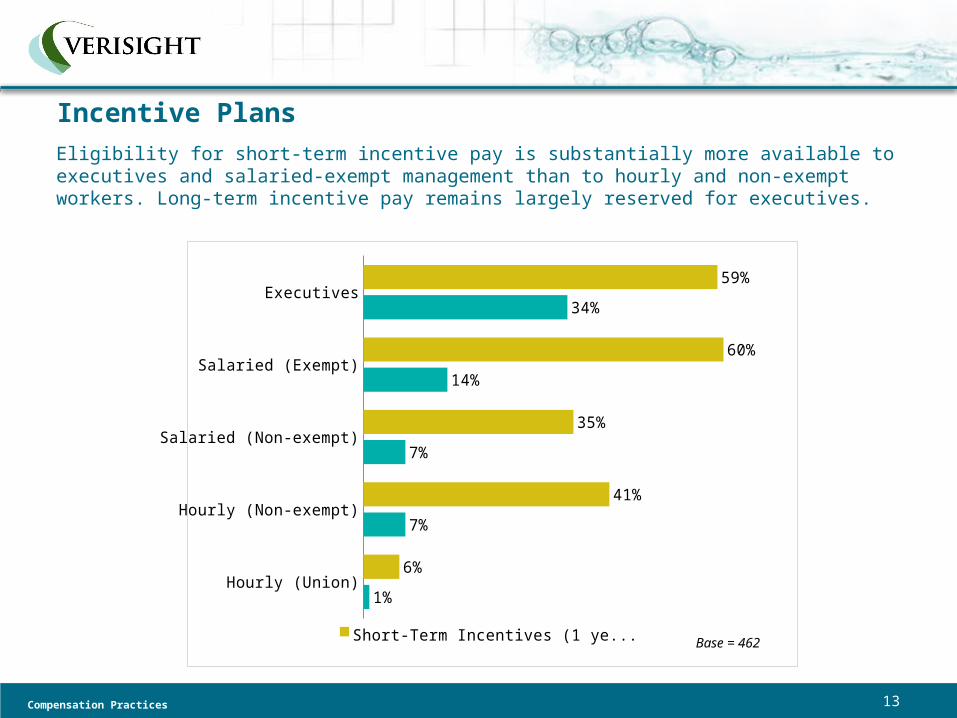
Incentive PlansEligibility for short-term incentive pay is substantially more available to executives and salaried-exempt management than to hourly and non-exempt workers. Long-term incentive pay remains largely reserved for executives.
Compensation Practices
Hourly (Union)
Hourly (Non-exempt)
Salaried (Non-exempt)
Salaried (Exempt)
Executives
1%
7%
7%
14%
34%
6%
41%
35%
60%
59%
Short-Term Incentives (1 year or less) Base = 462
13
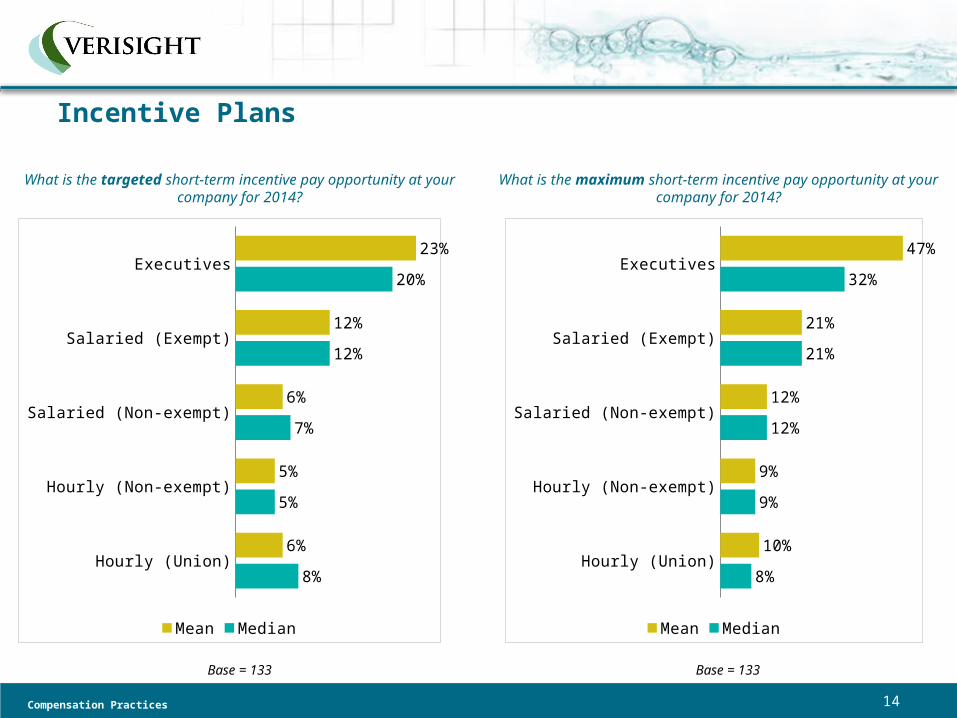
Incentive Plans
Compensation Practices
What is the targeted short-term incentive pay opportunity at your company for 2014?
Hourly (Union)
Hourly (Non-exempt)
Salaried (Non-exempt)
Salaried (Exempt)
Executives
8%
5%
7%
12%
20%
6%
5%
6%
12%
23%
Mean Median
Base = 133
Hourly (Union)
Hourly (Non-exempt)
Salaried (Non-exempt)
Salaried (Exempt)
Executives
8%
9%
12%
21%
32%
10%
9%
12%
21%
47%
Mean Median
Base = 133
What is the maximum short-term incentive pay opportunity at your company for 2014?
14
Exec
utiv
es
Sala
ried
(Exe
mpt
)
Sala
ried
(Non
-exe
mpt
)
Hourly
(Non
-exe
mpt
)
Hourly
(Uni
on)
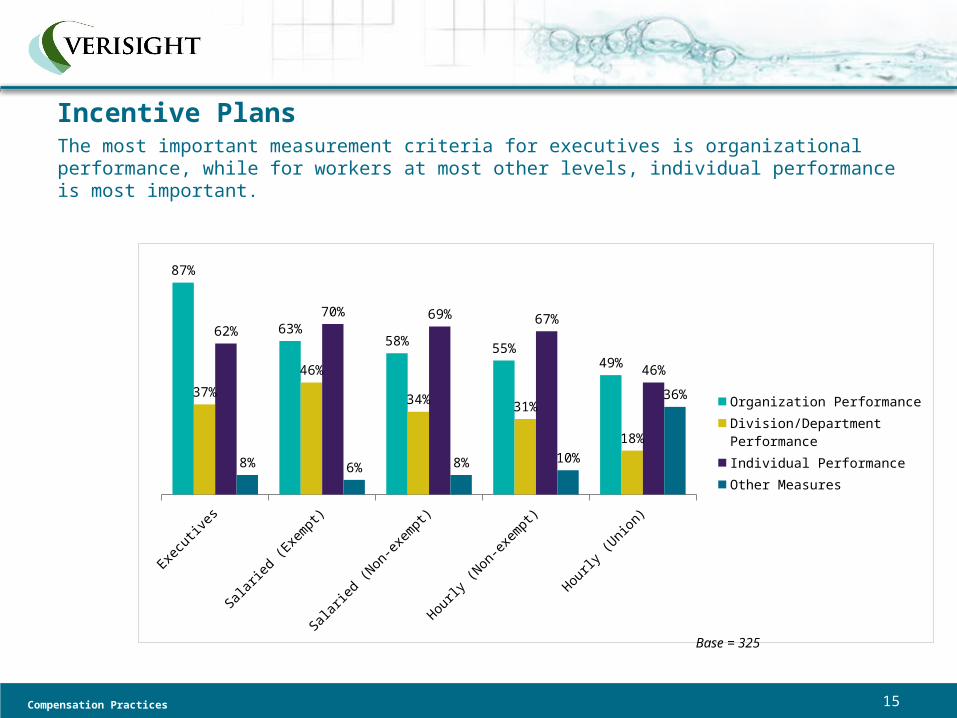
87%
63%58%
55%49%
37%
46%
34%31%
18%
62%
70% 69% 67%
46%
8% 6% 8% 10%
36%Organization PerformanceDivision/Department PerformanceIndividual PerformanceOther Measures
Incentive PlansThe most important measurement criteria for executives is organizational performance, while for workers at most other levels, individual performance is most important.
Compensation Practices
Base = 325
15
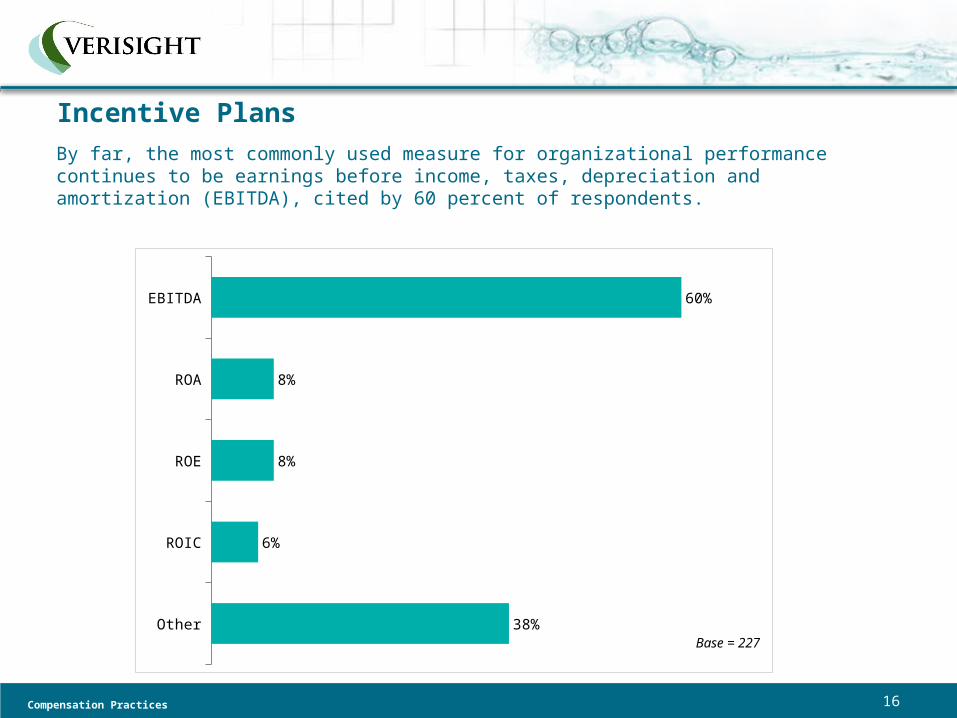
Incentive PlansBy far, the most commonly used measure for organizational performance continues to be earnings before income, taxes, depreciation and amortization (EBITDA), cited by 60 percent of respondents.
Compensation Practices
Other
ROIC
ROE
ROA
EBITDA
38%
6%
8%
8%
60%
Base = 227
16
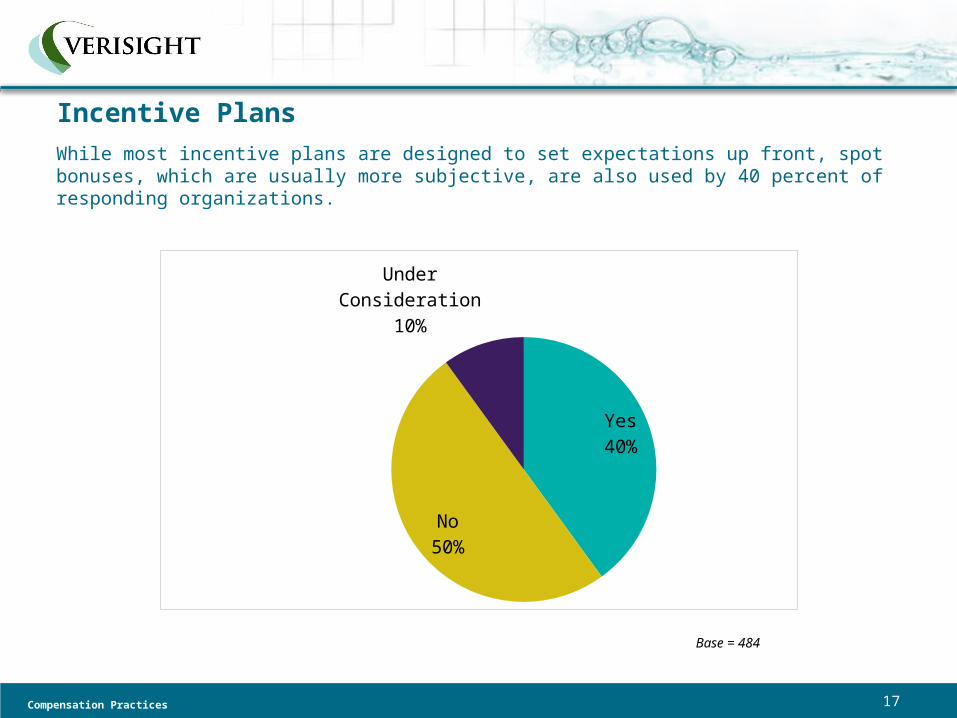
Incentive PlansWhile most incentive plans are designed to set expectations up front, spot bonuses, which are usually more subjective, are also used by 40 percent of responding organizations.
Compensation Practices
Yes40%
No50%
Under Consideration10%
Base = 484
17
Total Rewards Philosophy
18
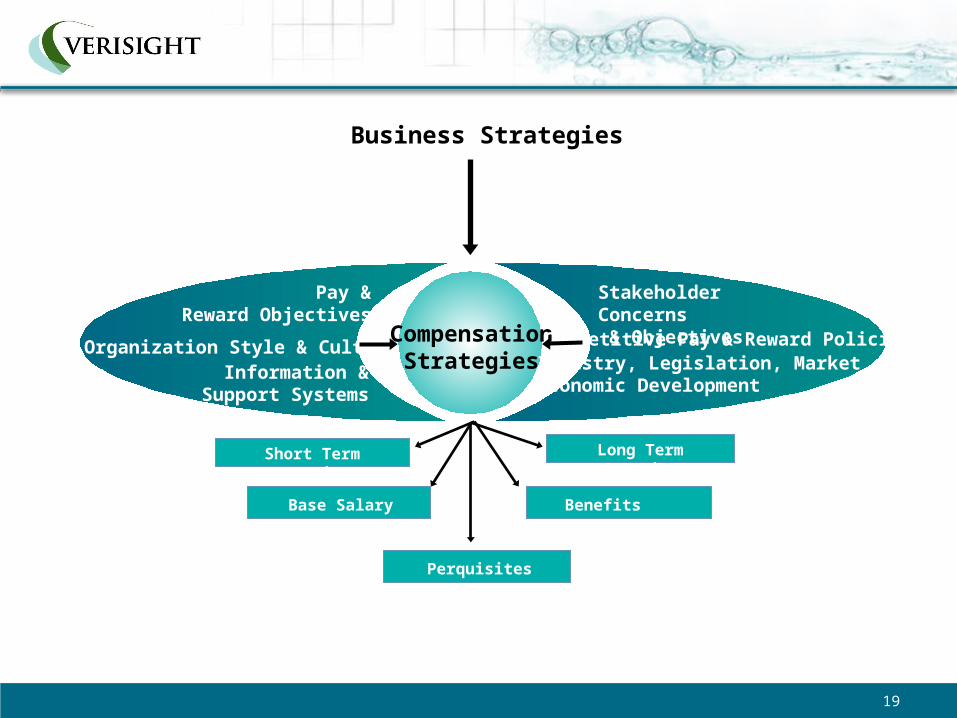
CompensationStrategies
Business Strategies
Long Term IncentivesShort Term Incentives
Base Salary Benefits
Perquisites
Pay &Reward Objectives
Organization Style & CultureInformation &
Support Systems
Stakeholder Concerns & ObjectivesCompetitive Pay & Reward PoliciesIndustry, Legislation, Market &Economic Development
19
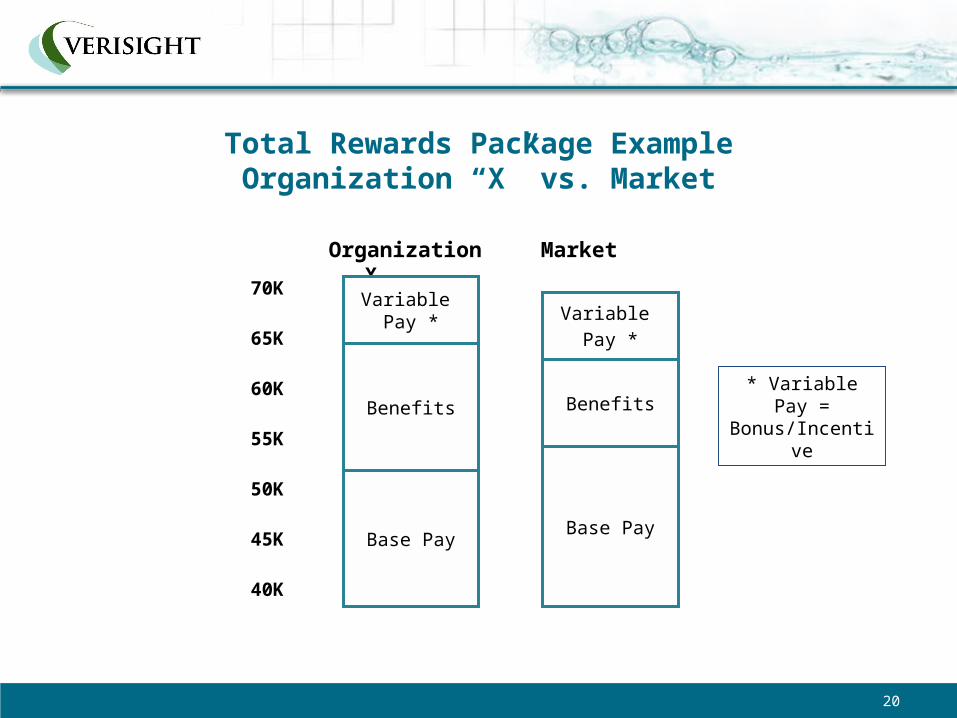
Total Rewards Package ExampleOrganization “X” vs. Market
70K
65K
60K
55K
50K
45K
40K
Organization X Market
Base Pay
Benefits
Variable Pay *
Base Pay
Benefits
Variable
Pay *
* Variable Pay = Bonus/Incentive
20
Elements of a Total Rewards Philosophy
• Reward program objectives (overall and for each element)• Market position (who and how competitive against)• Reward mix (base versus variable pay versus benefits)• Reward focus (individual versus group)• Basis of job value (internal versus external)• Structure (traditional versus non-traditional)
21
Sample Philosophy Questions for Leadership
• What results/outcomes will be connected with what reward system?• Who are our labor market competitors? How should our rewards
compare to the market – overall and for each reward element? Does this differ by employee group (such as IT)?
• Which is more important – how jobs compare to one another internally, or how they compare to the external market?
22
Outcome
• Serves as a blueprint for the design of the company’s total rewards program
• Written document that is a powerful communication tool for employees and applicants
• Articulates the company’s “value proposition”– Tangibles and intangibles– Why should they work for you?
23
Base Pay Considerations
24
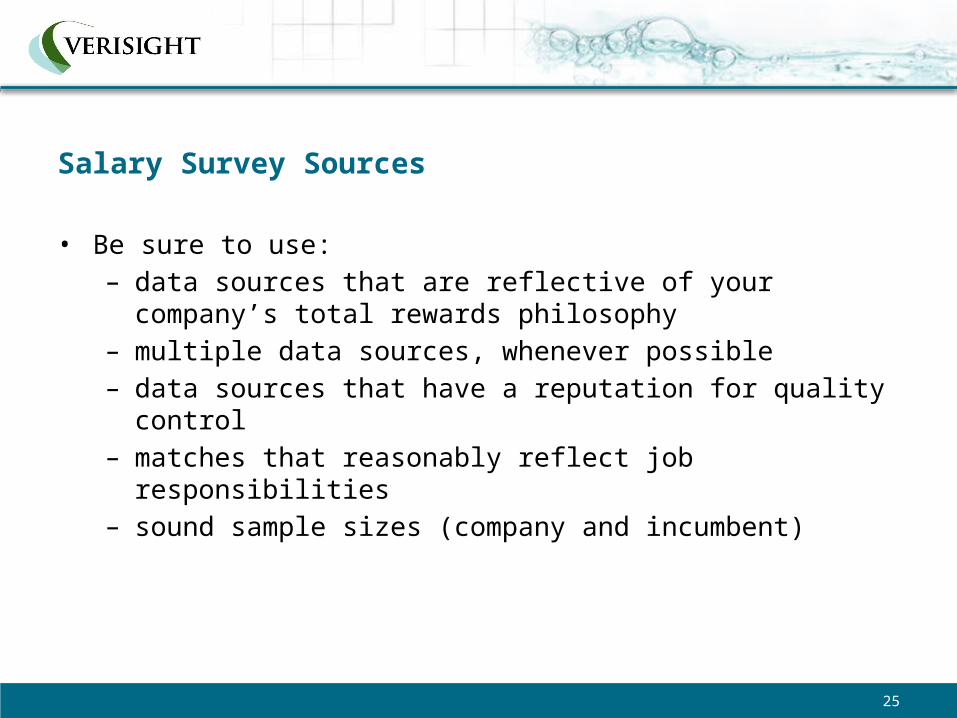
Salary Survey Sources
• Be sure to use:– data sources that are reflective of your company’s total rewards
philosophy– multiple data sources, whenever possible – data sources that have a reputation for quality control– matches that reasonably reflect job responsibilities– sound sample sizes (company and incumbent)
25
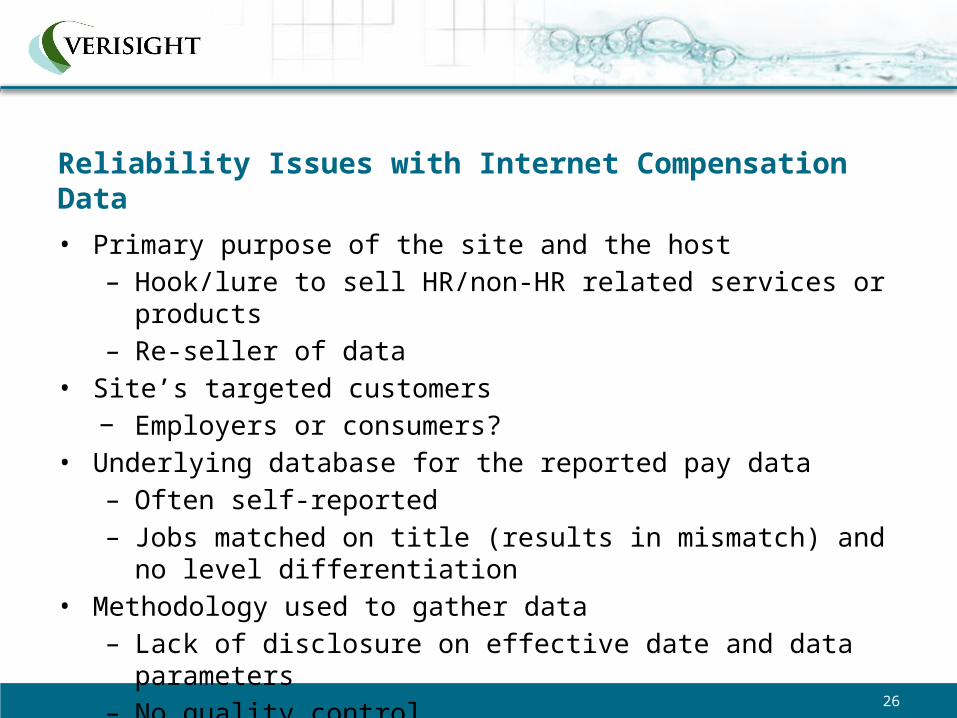
Reliability Issues with Internet Compensation Data
• Primary purpose of the site and the host– Hook/lure to sell HR/non-HR related services or products– Re-seller of data
• Site’s targeted customers− Employers or consumers?
• Underlying database for the reported pay data– Often self-reported– Jobs matched on title (results in mismatch) and no level
differentiation• Methodology used to gather data
– Lack of disclosure on effective date and data parameters– No quality control
26
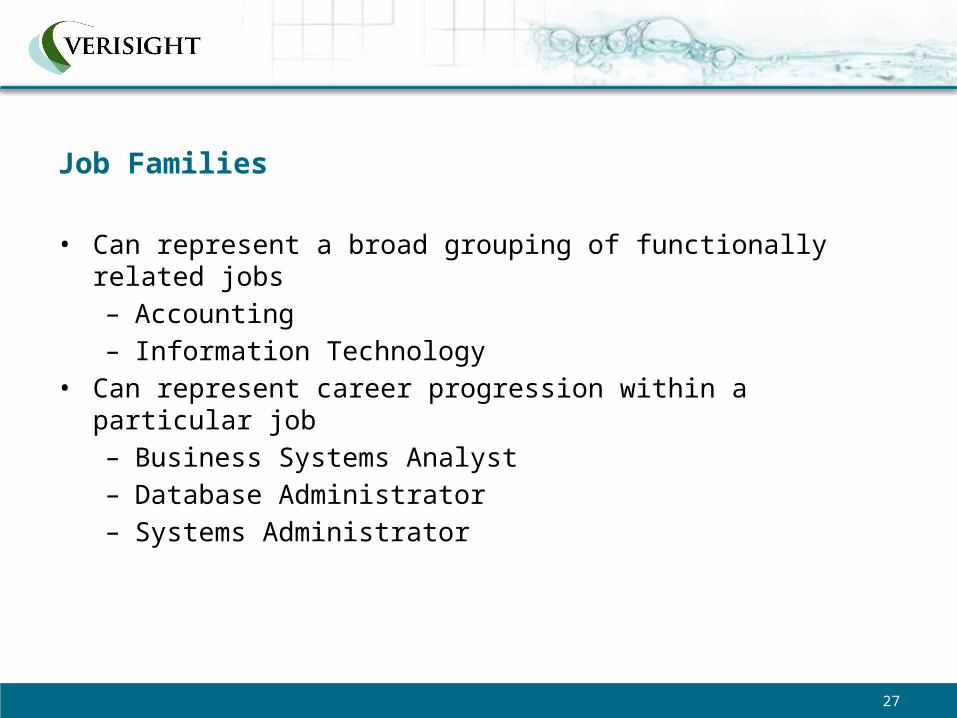
Job Families
• Can represent a broad grouping of functionally related jobs– Accounting– Information Technology
• Can represent career progression within a particular job– Business Systems Analyst– Database Administrator– Systems Administrator
27
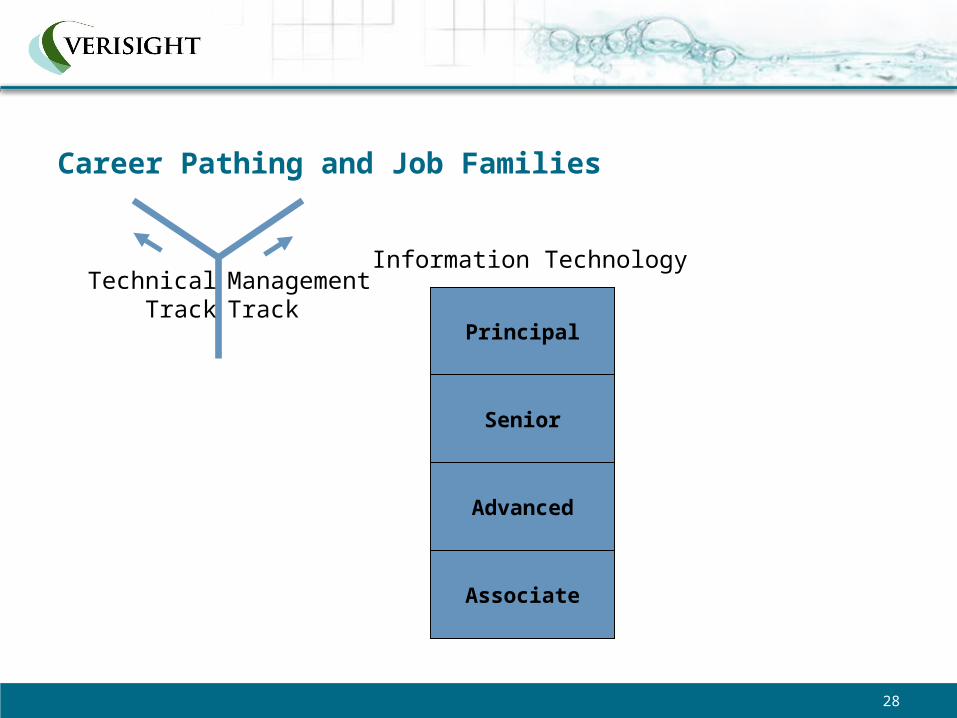
TechnicalTrack
ManagementTrack
Advanced
Associate
Senior
Principal
Information Technology
Career Pathing and Job Families
28
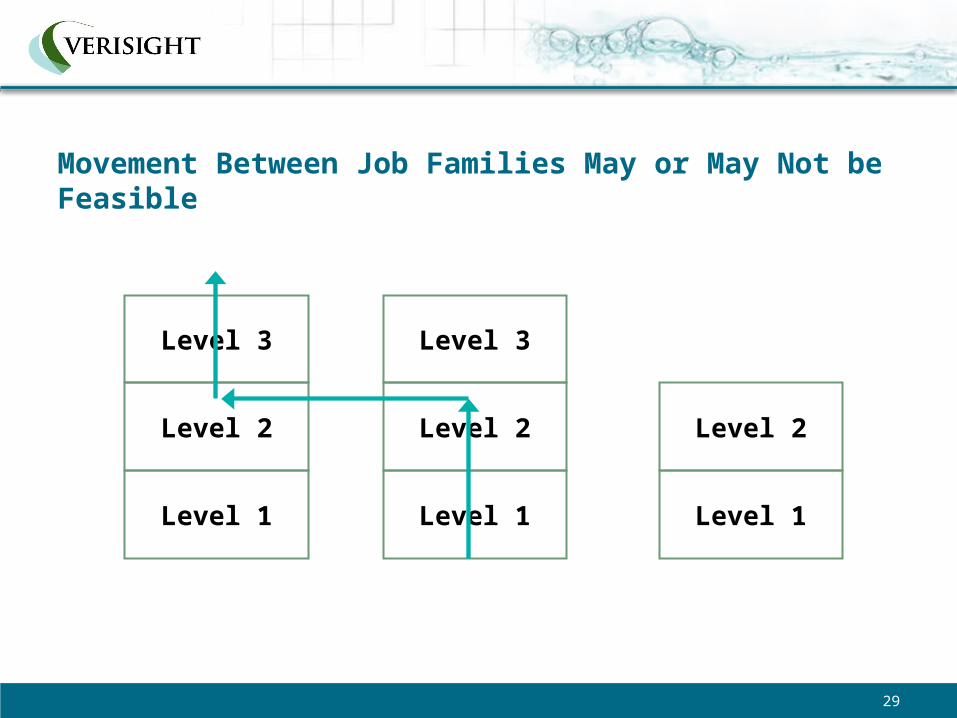
Level 2
Level 1
Level 3
Level 2
Level 1
Level 3
Level 2
Level 1
Movement Between Job Families May or May Not be Feasible
29
Job Family Leveling Criteria - Examples
• Education and Experience• Knowledge, Skills and Abilities• Credentials, Licenses or Designations• Problem Solving/Decision Making• Freedom to Act• Relationships
30
Job Family/Career Pathing Example
• Large Twin Cities employer• IT Department with the following job families:
– Systems Analysis– Systems Administration– Business Systems Analysis– Data Base Administration– Telecommunications– Project management
31
Job Family/Career Pathing Example (continued)
• Each family has 3 or 4 generic “levels” based on generally defined criteria.
• This is the primary tool to:– Describe what is needed to advance to higher levels
within each family– Assist employees and their managers/supervisors in
establishing a development plan
32
Job Family/Career Pathing Example (continued)
• Technical toolbox:– identifies the specific technical competencies
(knowledge, skills and/or abilities) needed within a given job family
• can include identification of ascending and descending skills
– complementary tool to identify training and development needs for the respective job families
– should be consistent with the company’s technology management, architecture and business strategies
33
Succession Planning
• IT professionals report receiving an average of 34 job solicitations each week*
• Attrition, promotion and organizational change can happen quickly and unexpectedly
• Critical that companies put programs in place to cultivate high-potential internal talent who can step into key roles when needed
• A strong succession management program serves as a powerful retention tool in a highly competitive market for IT talent
*Minneapolis/St. Paul Business Journal-Dec 2014
34
Variable Pay Considerations
35
Types of Variable Pay Systems
• Bonuses (usually “after the fact”)– Recognition– Project completion– Sign-on/hiring– Retention– Spot awards– Discretionary
• Short-term incentives (“before the fact”)
– Formula driven– May reflect balanced score
card• Long-term incentives (usually
3-5 years)– Usually only available at
upper management levels– Balance short- and long-
term decision making– Retention
36
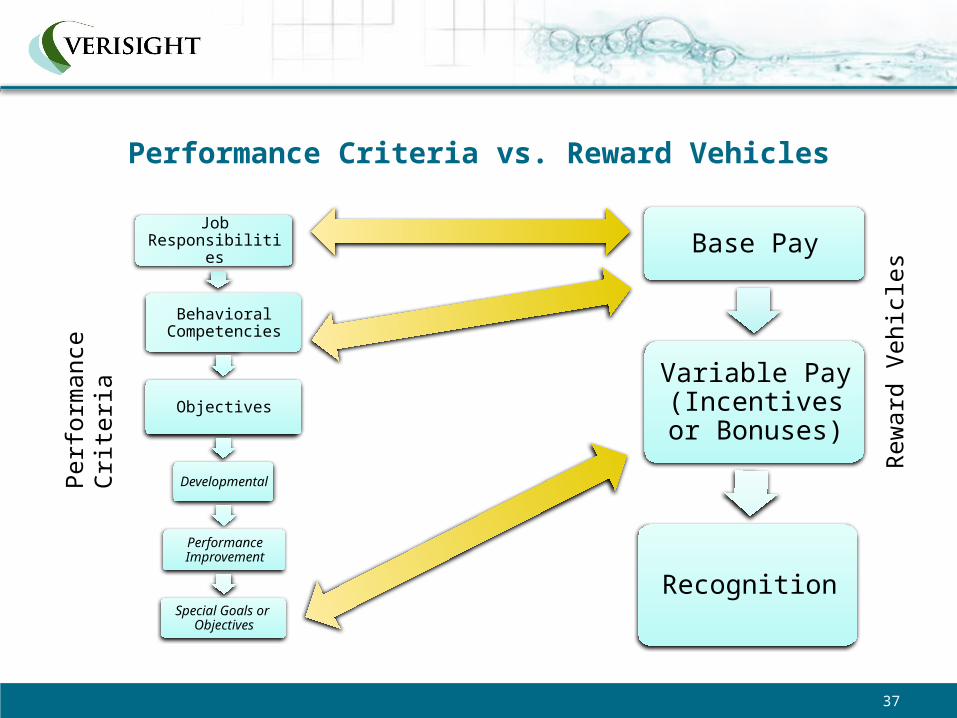
Performance Criteria vs. Reward Vehicles
Job Responsibilities
Behavioral Competencies
Objectives
Developmental
Performance Improvement
Special Goals or Objectives
Base Pay
Variable Pay (Incentives or
Bonuses)
Recognition
Per
form
ance
Crit
eria
Rew
ard
Veh
icle
s
37
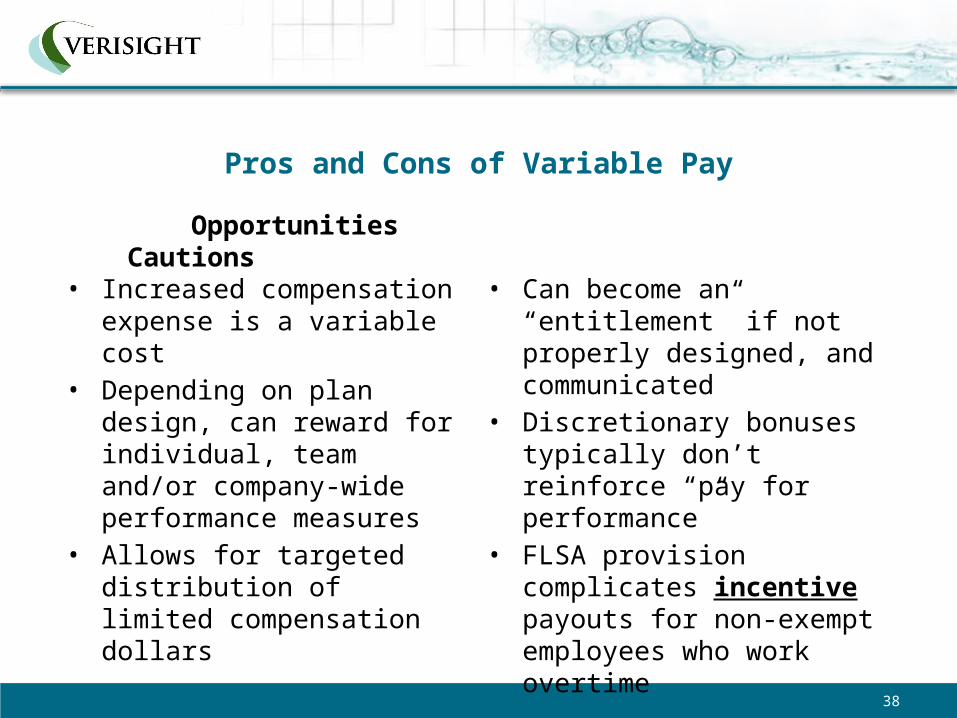
Pros and Cons of Variable Pay
• Increased compensation expense is a variable cost
• Depending on plan design, can reward for individual, team and/or company-wide performance measures
• Allows for targeted distribution of limited compensation dollars
• Can become an “entitlement” if not properly designed, and communicated
• Discretionary bonuses typically don’t reinforce “pay for performance”
• FLSA provision complicates incentive payouts for non-exempt employees who work overtime
Opportunities Cautions
38
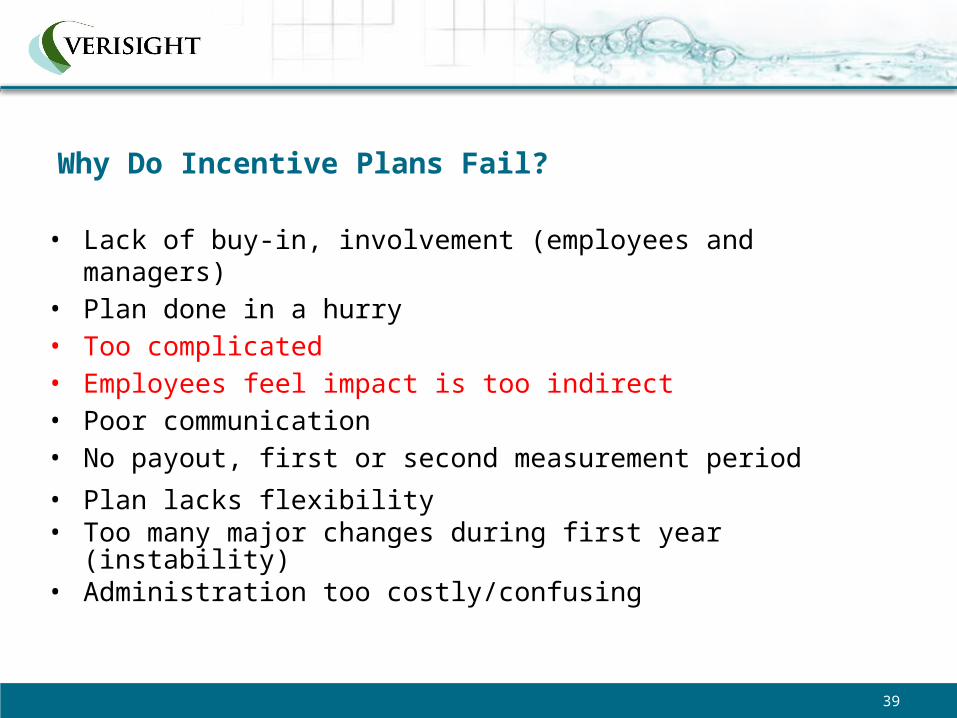
Why Do Incentive Plans Fail?
• Lack of buy-in, involvement (employees and managers)• Plan done in a hurry• Too complicated• Employees feel impact is too indirect• Poor communication• No payout, first or second measurement period
• Plan lacks flexibility• Too many major changes during first year (instability)• Administration too costly/confusing
39
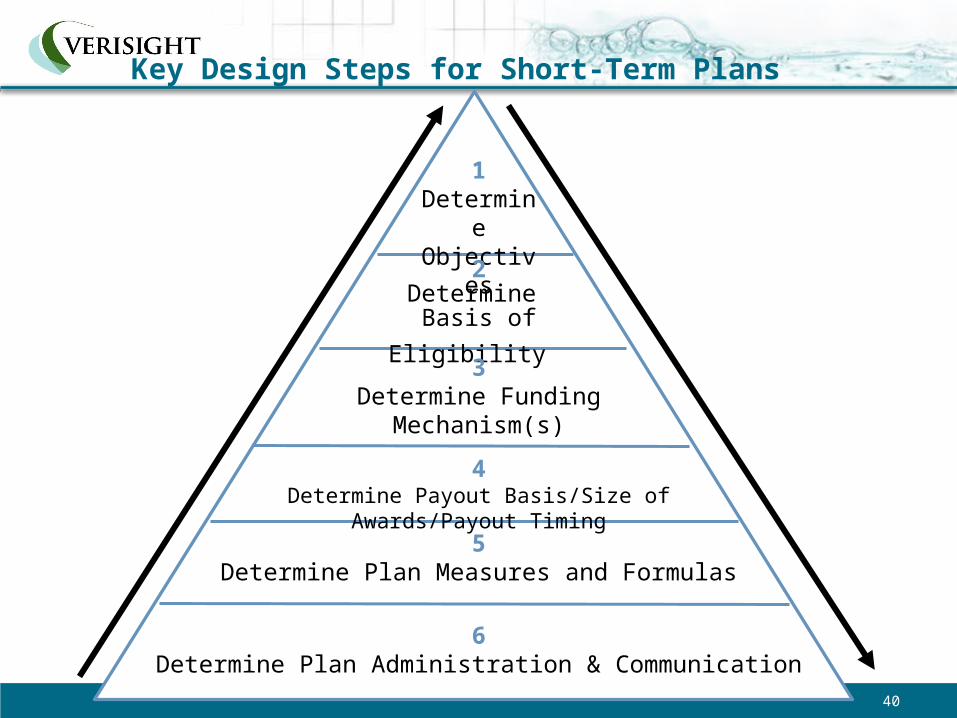
Key Design Steps for Short-Term Plans
1Determine Objectives
2Determine
Basis of Eligibility 3
Determine Funding Mechanism(s)
4Determine Payout Basis/Size of Awards/Payout Timing
5Determine Plan Measures and Formulas
6Determine Plan Administration & Communication
40

Nontraditional Rewards
41
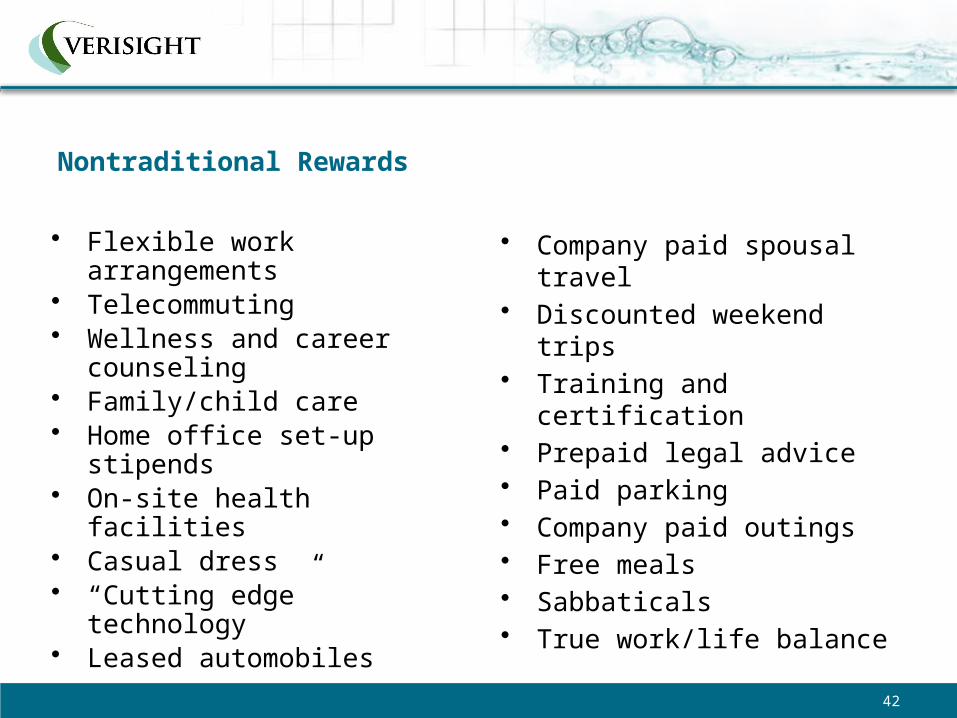
Nontraditional Rewards
• Flexible work arrangements• Telecommuting• Wellness and career counseling• Family/child care• Home office set-up stipends• On-site health facilities• Casual dress• “Cutting edge” technology• Leased automobiles
• Company paid spousal travel• Discounted weekend trips• Training and certification• Prepaid legal advice• Paid parking• Company paid outings• Free meals• Sabbaticals• True work/life balance
42
What Employees Want: Rewards of Work
43
What Employees Want: Rewards of Work
• Study co-sponsored by World At Work and Sibson & Company• 1200+ respondents in U.S.• Questions:
– How do they feel about rewards of work?– What do they value?– What leads them to remain?
44
What Employees Want: Rewards Of Work (continued)
• Five categories studied:– Direct financial (pay)– Indirect financial (benefits)– Work content (work itself)– Careers (long-term opportunity)– Affiliation (feelings of belonging)
WorldatWork and Sibson & Co. survey of 1200+ U.S. companies regarding employees feelings about rewards of work, related values, and retention
45
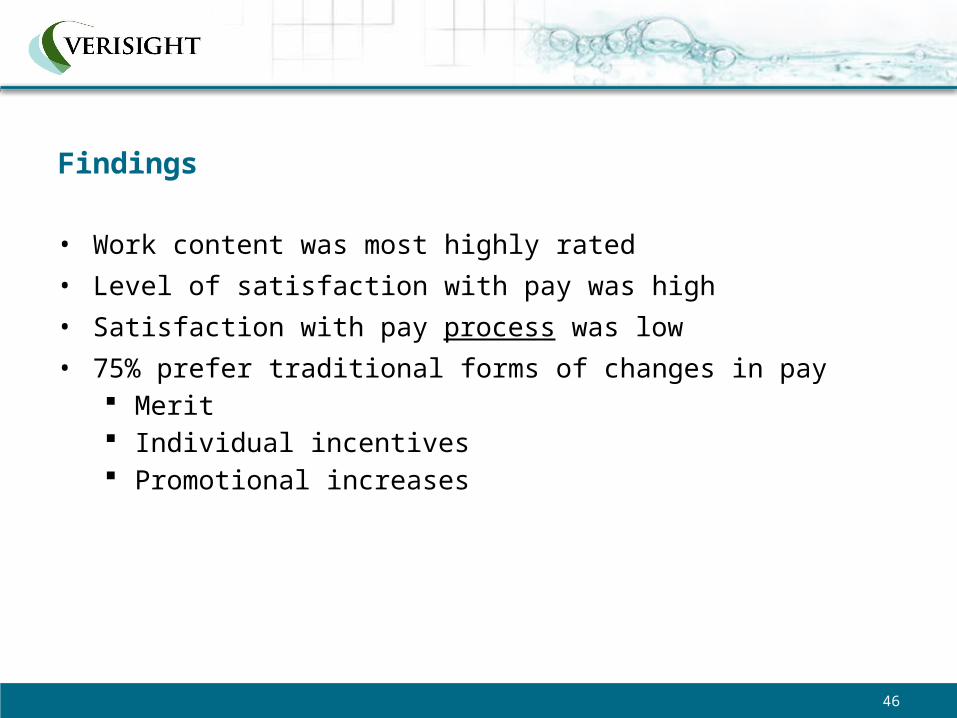
Findings
• Work content was most highly rated
• Level of satisfaction with pay was high
• Satisfaction with pay process was low
• 75% prefer traditional forms of changes in pay Merit Individual incentives Promotional increases
46
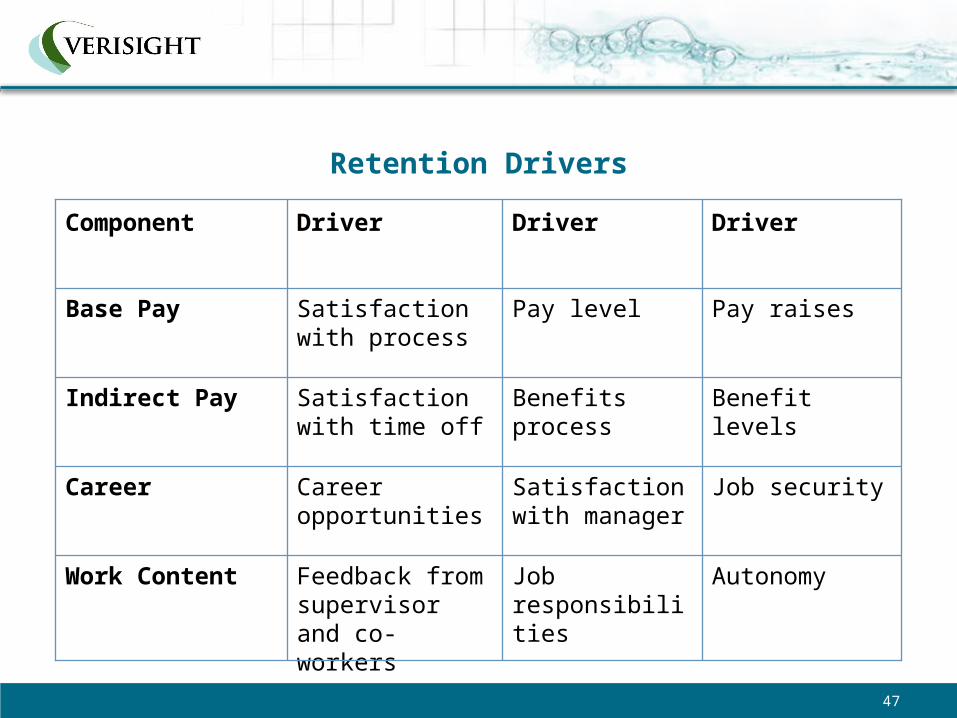
Job securitySatisfaction with manager
Career opportunitiesCareer
AutonomyJob responsibilitiesFeedback from supervisor and co-workers
Work Content
Benefit levelsBenefits processSatisfaction with time off
Indirect Pay
Pay raisesPay levelSatisfaction with process
Base Pay
DriverDriverDriverComponent
Retention Drivers
47
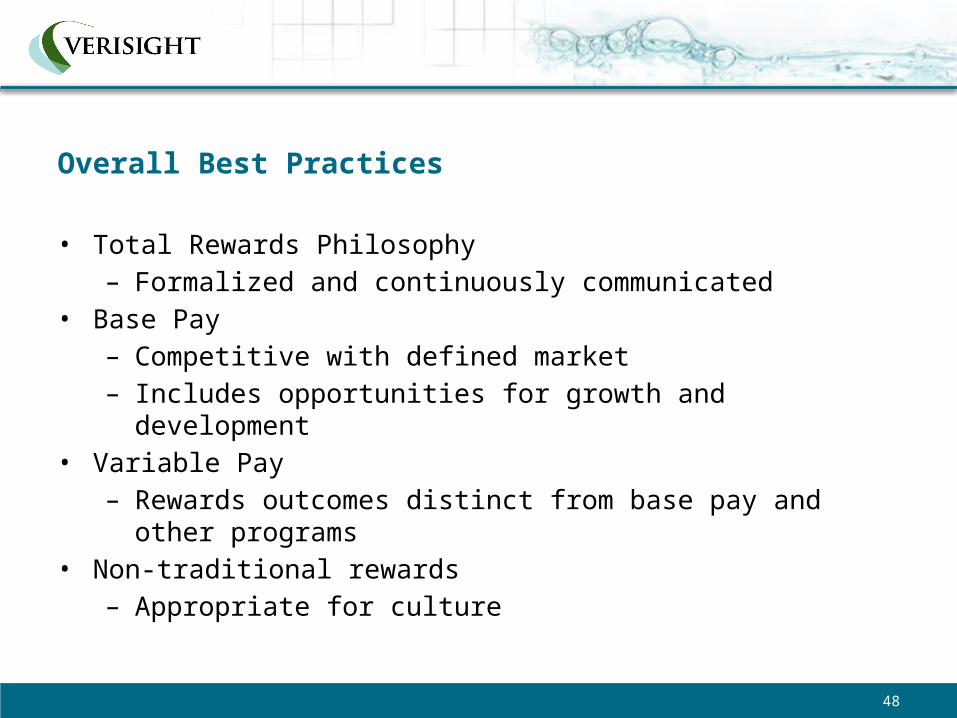
Overall Best Practices
• Total Rewards Philosophy– Formalized and continuously communicated
• Base Pay– Competitive with defined market– Includes opportunities for growth and development
• Variable Pay– Rewards outcomes distinct from base pay and other programs
• Non-traditional rewards– Appropriate for culture
48