Embed Size (px)
Citation preview
Investor PresentationBNP Paribas High Yield & Leveraged Finance Conference
London, January 15, 2015
1
Disclaimer
This presentation has been prepared solely for use at this leveraged finance conference. By attending the conference where this presentation is made, or by reading or reviewing the presentation slides, you agree to be bound by the following limitations.
This presentation has been prepared for information and background purposes only and the information contained herein (unless otherwise indicated) has been provided by Xella International S.A. (the “Company”) solely for informational purposes. For the purposes of this notice, the presentation that follows shall mean and include the slides that follow, the oral presentation of the slides by the Company or any person on behalf of the Company, any question-and-answer session that follows the oral presentation, hard copies of this document and any materials distributed in connection with the presentation (collectively, the “Presentation”). It is confidential and does not constitute or form part of, and should not be construed as, an offer or invitation to subscribe for, underwrite or otherwise acquire, any securities of the Company or any member of its group nor should it or any part of it form the basis of, or be relied on in connection with, any contract to purchase or subscribe for any securities of the Company, any member of its group, Xefin Lux S.C.A. or Xella HoldCo Finance S.A. or with any other contract or commitment whatsoever.
This presentation includes “'forward-looking statements.” These statements contain the words “anticipate,” “believe,” “intend,”“estimate,” “expect” and words of similar meaning. All statements other than statements of historical facts included in this presentation, including, without limitation, those regarding the Company’s financial position, business strategy, plans and objectives of management for future operations (including development plans and objectives relating to the Company’s projects and services) are forward-looking statements. By their nature, such forward-looking statements involve known and unknown risks, uncertainties and other important factors that could cause the actual results, performance or achievements of the Company to be materially different from results,performance or achievements expressed or implied by such forward-looking statements. Such forward-looking statements are based on numerous assumptions regarding the Company’s present and future business strategies and the environment in which the Company will operate in the future. These forward-looking statements speak only as at the date of this presentation. Each of the Company, its relevant group entities and their respective agents, employees and advisers, expressly disclaim any obligation or undertaking to update any forward-looking statements contained herein. Investors are urged to consider these factors carefully in evaluating the forward-looking statements in this presentation.
2
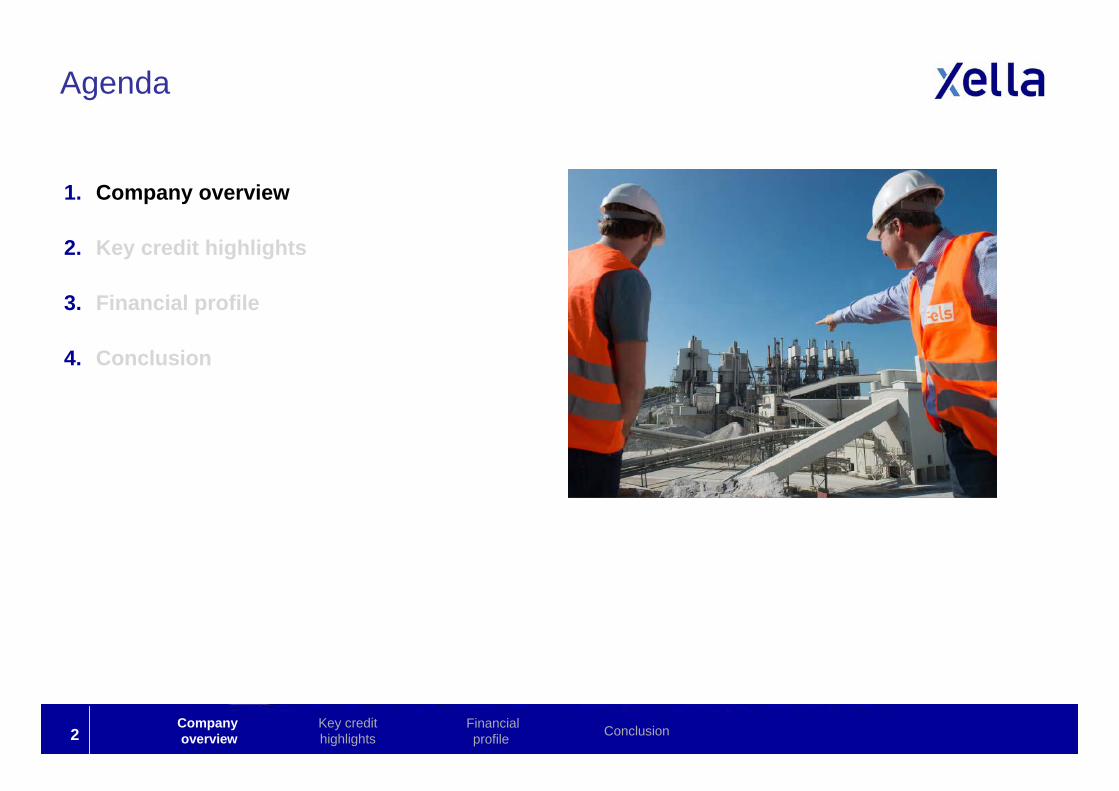
Agenda
1. Company overview
2. Key credit highlights
3. Financial profile
4. Conclusion
Company overview
Financial profile ConclusionKey credit
highlights
3
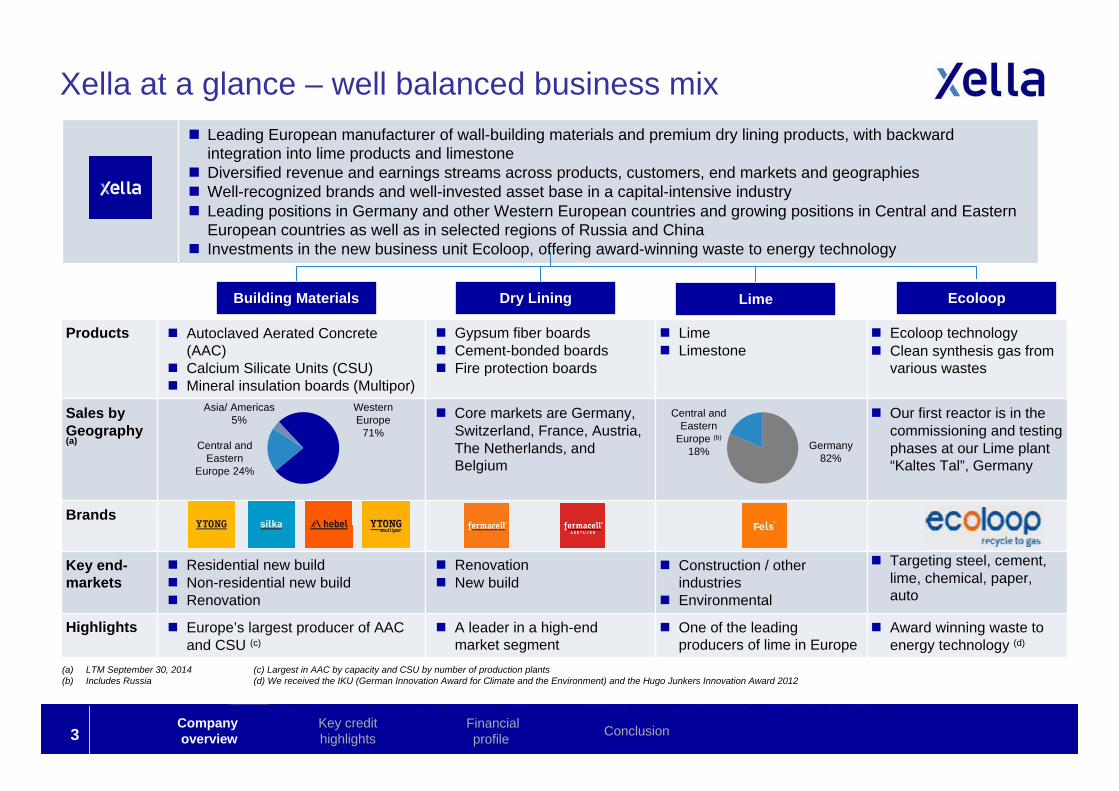
Products Autoclaved Aerated Concrete (AAC)
Calcium Silicate Units (CSU) Mineral insulation boards (Multipor)
Gypsum fiber boards Cement-bonded boards Fire protection boards
Lime Limestone
Ecoloop technology Clean synthesis gas from
various wastes
Sales by Geography (a)
Core markets are Germany, Switzerland, France, Austria, The Netherlands, and Belgium
Our first reactor is in the commissioning and testing phases at our Lime plant “Kaltes Tal”, Germany
Brands
Key end-markets
Residential new build Non-residential new build Renovation
Renovation New build
Construction / other industries
Environmental
Targeting steel, cement, lime, chemical, paper, auto
Highlights Europe’s largest producer of AAC and CSU (c)
A leader in a high-end market segment
One of the leading producers of lime in Europe
Award winning waste to energy technology (d)
(c) Largest in AAC by capacity and CSU by number of production plants (d) We received the IKU (German Innovation Award for Climate and the Environment) and the Hugo Junkers Innovation Award 2012
Xella at a glance – well balanced business mix
Dry LiningBuilding Materials Lime
Leading European manufacturer of wall-building materials and premium dry lining products, with backward integration into lime products and limestone
Diversified revenue and earnings streams across products, customers, end markets and geographies Well-recognized brands and well-invested asset base in a capital-intensive industry Leading positions in Germany and other Western European countries and growing positions in Central and Eastern
European countries as well as in selected regions of Russia and China Investments in the new business unit Ecoloop, offering award-winning waste to energy technology
Ecoloop
(a) LTM September 30, 2014 (b) Includes Russia
Germany82%
Central and Eastern
Europe (b)
18%
Asia/ Americas 5%
Western Europe
71%Central and
EasternEurope 24%
Company overview
Financial profile ConclusionKey credit
highlights
4
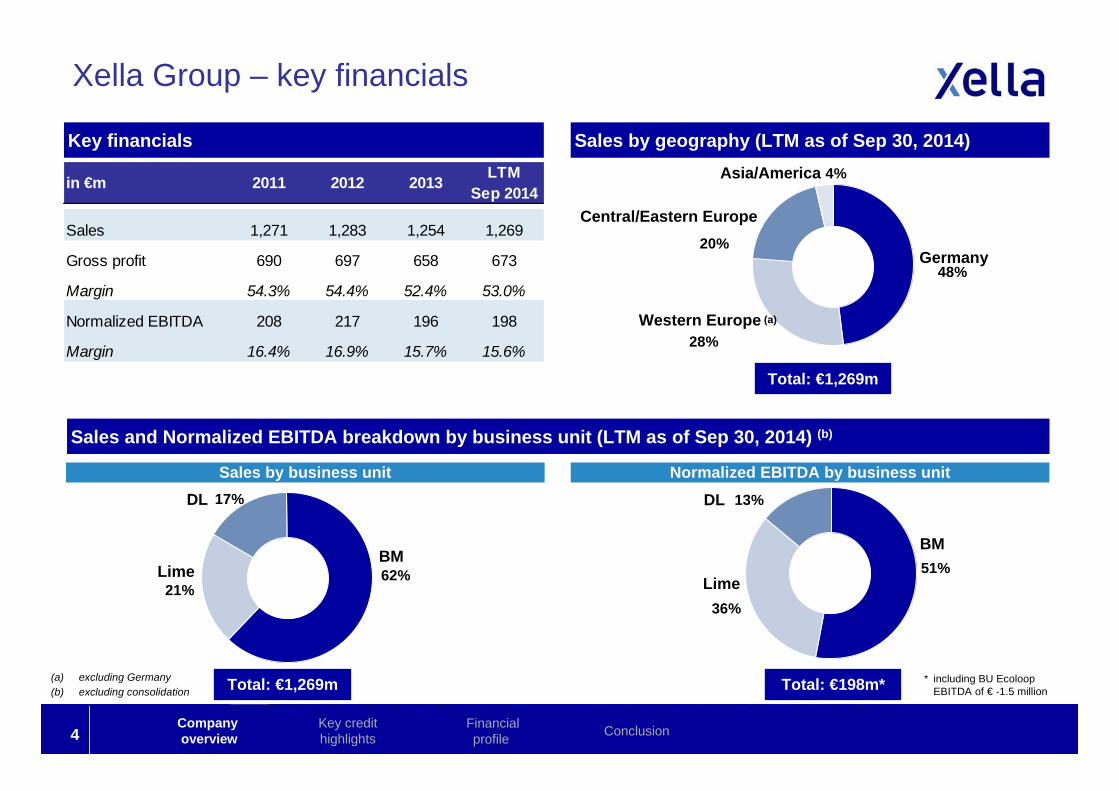
Xella Group – key financials
Key financials Sales by geography (LTM as of Sep 30, 2014)
Sales and Normalized EBITDA breakdown by business unit (LTM as of Sep 30, 2014) (b)
(a) excluding Germany(b) excluding consolidation
4%
Sales by business unit Normalized EBITDA by business unit
Total: €198m*Total: €1,269m
DL
LimeBM
21%
17%
62% 51%
13%
36%Lime
BM
DL
Total: €1,269m
Asia/America
Central/Eastern Europe
Western Europe
Germany
28%
48%
20%
(a)
* including BU EcoloopEBITDA of € -1.5 million
in €m 2011 2012 2013 LTM Sep 2014
Sales 1,271 1,283 1,254 1,269
Gross profit 690 697 658 673
Margin 54.3% 54.4% 52.4% 53.0%
Normalized EBITDA 208 217 196 198
Margin 16.4% 16.9% 15.7% 15.6%
Company overview
Financial profile ConclusionKey credit
highlights
5
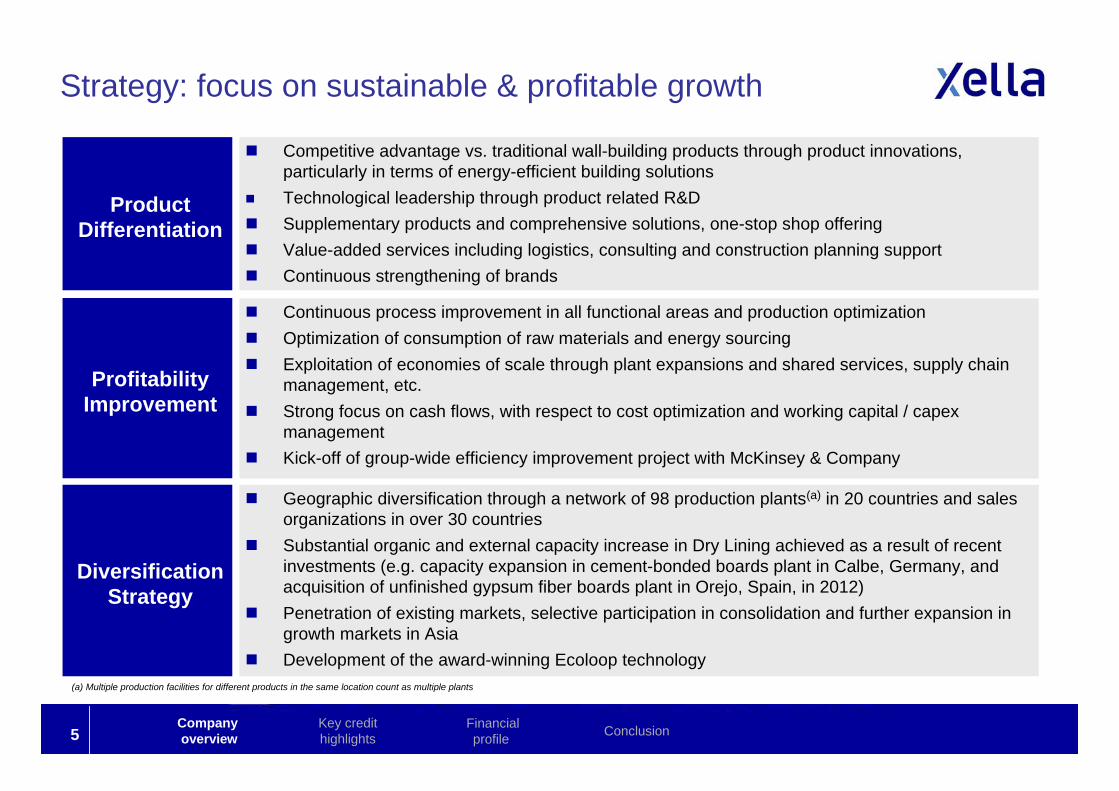
Strategy: focus on sustainable & profitable growth
Product Differentiation
Profitability Improvement
Competitive advantage vs. traditional wall-building products through product innovations, particularly in terms of energy-efficient building solutions
Technological leadership through product related R&D Supplementary products and comprehensive solutions, one-stop shop offering Value-added services including logistics, consulting and construction planning support Continuous strengthening of brands
Continuous process improvement in all functional areas and production optimization Optimization of consumption of raw materials and energy sourcing Exploitation of economies of scale through plant expansions and shared services, supply chain
management, etc. Strong focus on cash flows, with respect to cost optimization and working capital / capex
management Kick-off of group-wide efficiency improvement project with McKinsey & Company
Diversification Strategy
Geographic diversification through a network of 98 production plants(a) in 20 countries and sales organizations in over 30 countries
Substantial organic and external capacity increase in Dry Lining achieved as a result of recent investments (e.g. capacity expansion in cement-bonded boards plant in Calbe, Germany, and acquisition of unfinished gypsum fiber boards plant in Orejo, Spain, in 2012)
Penetration of existing markets, selective participation in consolidation and further expansion in growth markets in Asia
Development of the award-winning Ecoloop technology(a) Multiple production facilities for different products in the same location count as multiple plants
Company overview
Financial profile ConclusionKey credit
highlights
6
Agenda
1. Company overview
2. Key credit highlights
3. Financial profile
4. Conclusion
Company overview
Financial profile ConclusionKey credit
highlights
7
Key credit highlights
Favorable industry dynamics
2
Portfolio of innovative and high-quality premium products
supported by well regarded brands
1
Diversified revenue streams from a wide range of products
with multiple applications
3
Dense and flexible plant network in key markets
4
Strategic investments for future growth
6
Strong and resilient business through the cycle
5
Company overview
Financial profile ConclusionKey credit
highlights
8
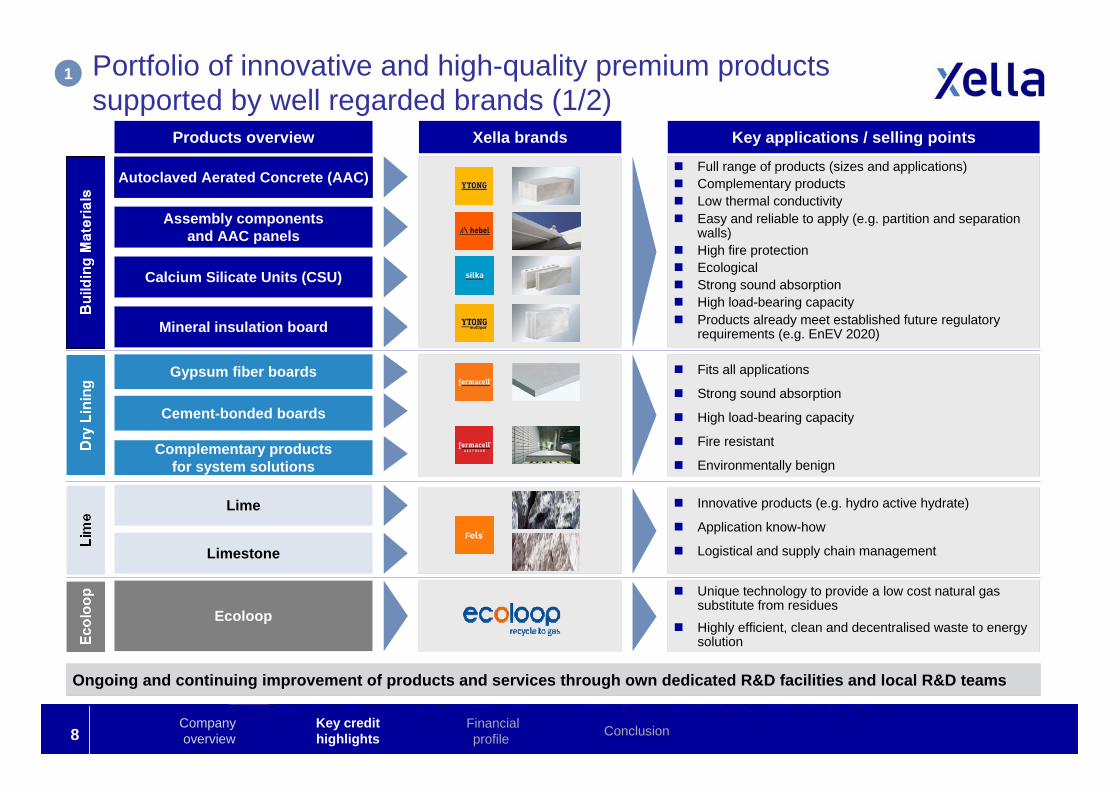
Portfolio of innovative and high-quality premium products supported by well regarded brands (1/2)
Ongoing and continuing improvement of products and services through own dedicated R&D facilities and local R&D teams
Products overview Key applications / selling pointsXella brands
Autoclaved Aerated Concrete (AAC)
Assembly components and AAC panels
Mineral insulation board
Calcium Silicate Units (CSU)
Full range of products (sizes and applications) Complementary products Low thermal conductivity Easy and reliable to apply (e.g. partition and separation
walls) High fire protection Ecological Strong sound absorption High load-bearing capacity Products already meet established future regulatory
requirements (e.g. EnEV 2020)
Gypsum fiber boards
Cement-bonded boards
Complementary productsfor system solutions
Fits all applications
Strong sound absorption
High load-bearing capacity
Fire resistant
Environmentally benign
Lime
Limestone
Innovative products (e.g. hydro active hydrate)
Application know-how
Logistical and supply chain management
Ecoloop
Unique technology to provide a low cost natural gas substitute from residues
Highly efficient, clean and decentralised waste to energy solution
1
Company overview
Financial profile ConclusionKey credit
highlights
9
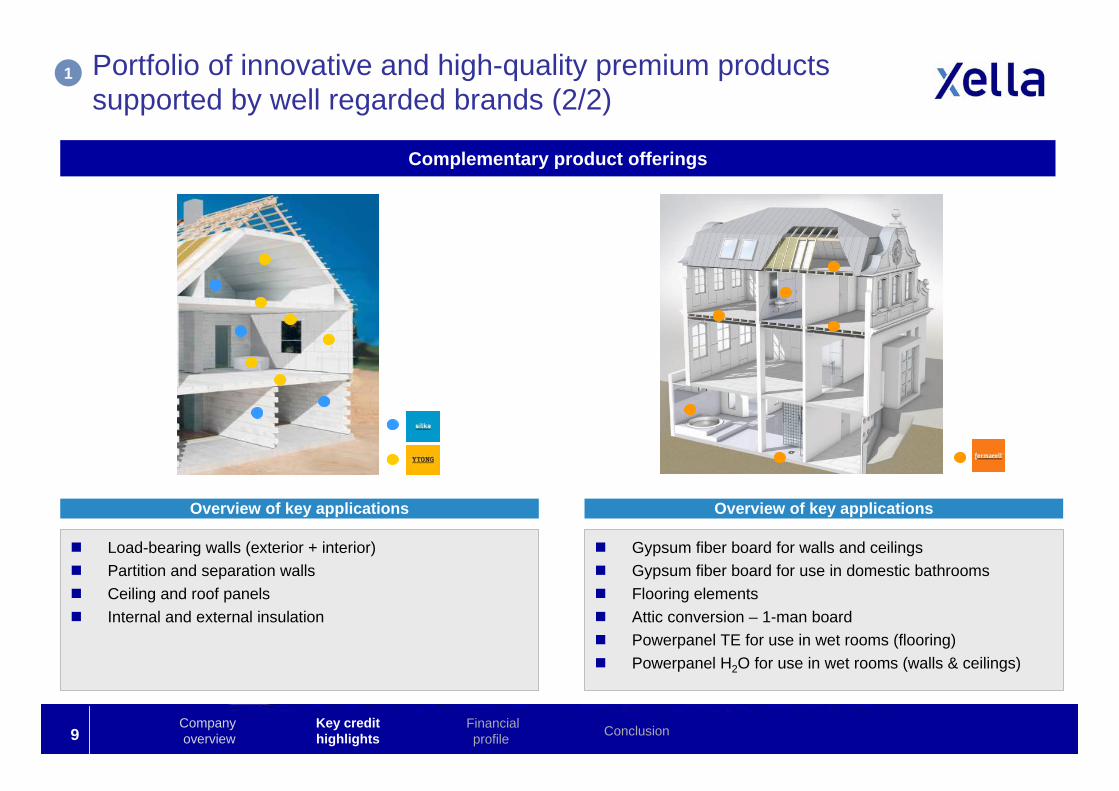
Gypsum fiber board for walls and ceilings Gypsum fiber board for use in domestic bathrooms Flooring elements Attic conversion – 1-man board Powerpanel TE for use in wet rooms (flooring) Powerpanel H2O for use in wet rooms (walls & ceilings)
Complementary product offerings
Load-bearing walls (exterior + interior) Partition and separation walls Ceiling and roof panels Internal and external insulation
Overview of key applications Overview of key applications
Portfolio of innovative and high-quality premium products supported by well regarded brands (2/2)
1
Company overview
Financial profile ConclusionKey credit
highlights
10
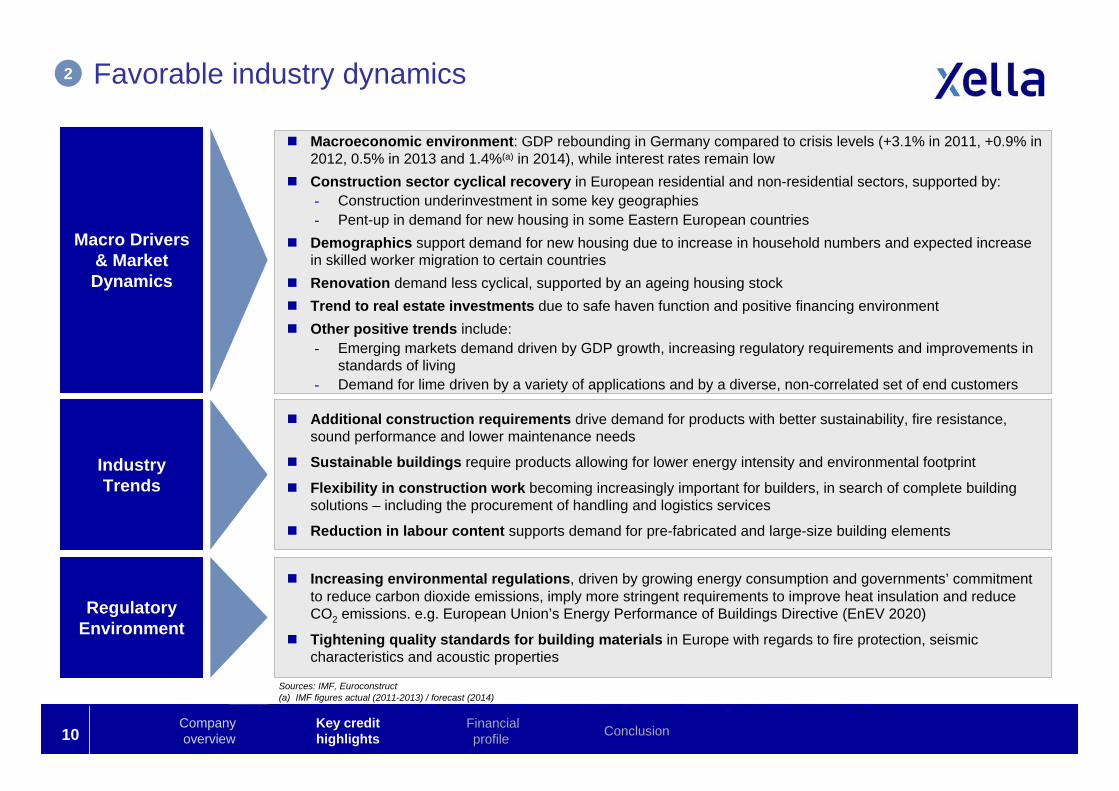
Favorable industry dynamics
Macroeconomic environment: GDP rebounding in Germany compared to crisis levels (+3.1% in 2011, +0.9% in 2012, 0.5% in 2013 and 1.4%(a) in 2014), while interest rates remain low
Construction sector cyclical recovery in European residential and non-residential sectors, supported by:- Construction underinvestment in some key geographies- Pent-up in demand for new housing in some Eastern European countries
Demographics support demand for new housing due to increase in household numbers and expected increase in skilled worker migration to certain countries
Renovation demand less cyclical, supported by an ageing housing stock Trend to real estate investments due to safe haven function and positive financing environment Other positive trends include:
- Emerging markets demand driven by GDP growth, increasing regulatory requirements and improvements in standards of living
- Demand for lime driven by a variety of applications and by a diverse, non-correlated set of end customers
Industry Trends
Macro Drivers & Market Dynamics
Regulatory Environment
Additional construction requirements drive demand for products with better sustainability, fire resistance, sound performance and lower maintenance needs
Sustainable buildings require products allowing for lower energy intensity and environmental footprint
Flexibility in construction work becoming increasingly important for builders, in search of complete building solutions – including the procurement of handling and logistics services
Reduction in labour content supports demand for pre-fabricated and large-size building elements
Increasing environmental regulations, driven by growing energy consumption and governments’ commitment to reduce carbon dioxide emissions, imply more stringent requirements to improve heat insulation and reduce CO2 emissions. e.g. European Union’s Energy Performance of Buildings Directive (EnEV 2020)
Tightening quality standards for building materials in Europe with regards to fire protection, seismic characteristics and acoustic properties
Sources: IMF, Euroconstruct(a) IMF figures actual (2011-2013) / forecast (2014)
2
Company overview
Financial profile ConclusionKey credit
highlights
11
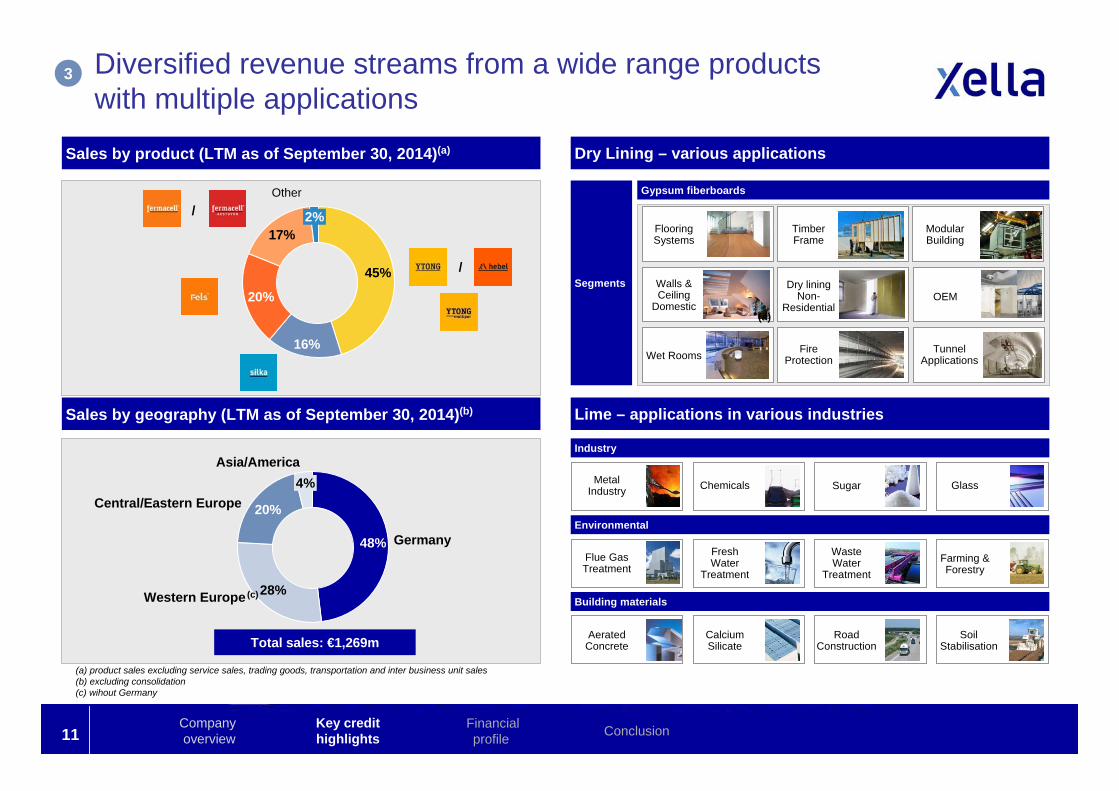
Sales by product (LTM as of September 30, 2014)(a)
Sales by geography (LTM as of September 30, 2014)(b)
/
Total sales: €1,269m
(a) product sales excluding service sales, trading goods, transportation and inter business unit sales(b) excluding consolidation(c) wihout Germany
Diversified revenue streams from a wide range products with multiple applications
3
Dry Lining – various applications
Lime – applications in various industries
Segments
Gypsum fiberboards
Industry
Environmental
Building materials
Walls & Ceiling
Domestic
Dry liningNon-
ResidentialOEM
Modular Building
Timber Frame
Flooring Systems
Wet Rooms Fire Protection
Tunnel Applications
Fresh Water
Treatment
Waste Water
TreatmentFlue Gas Treatment
Farming & Forestry
MetalIndustry Chemicals Sugar Glass
Road Construction
Soil Stabilisation
Aerated Concrete
CalciumSilicate
/
Other
Company overview
Financial profile ConclusionKey credit
highlights
Asia/America4%
Central/Eastern Europe 20%
Western Europe 28%
Germany48%
(a)
20%
17%
16%
2%
45%
(c)
12
AT
RU
SK
SL
CZDEBE
BA
HR
FRFR
BA
DE
ROHR
CS
BG
CZ
AT
HU
PLPL
SK
SL
RU
CN
USA
MX
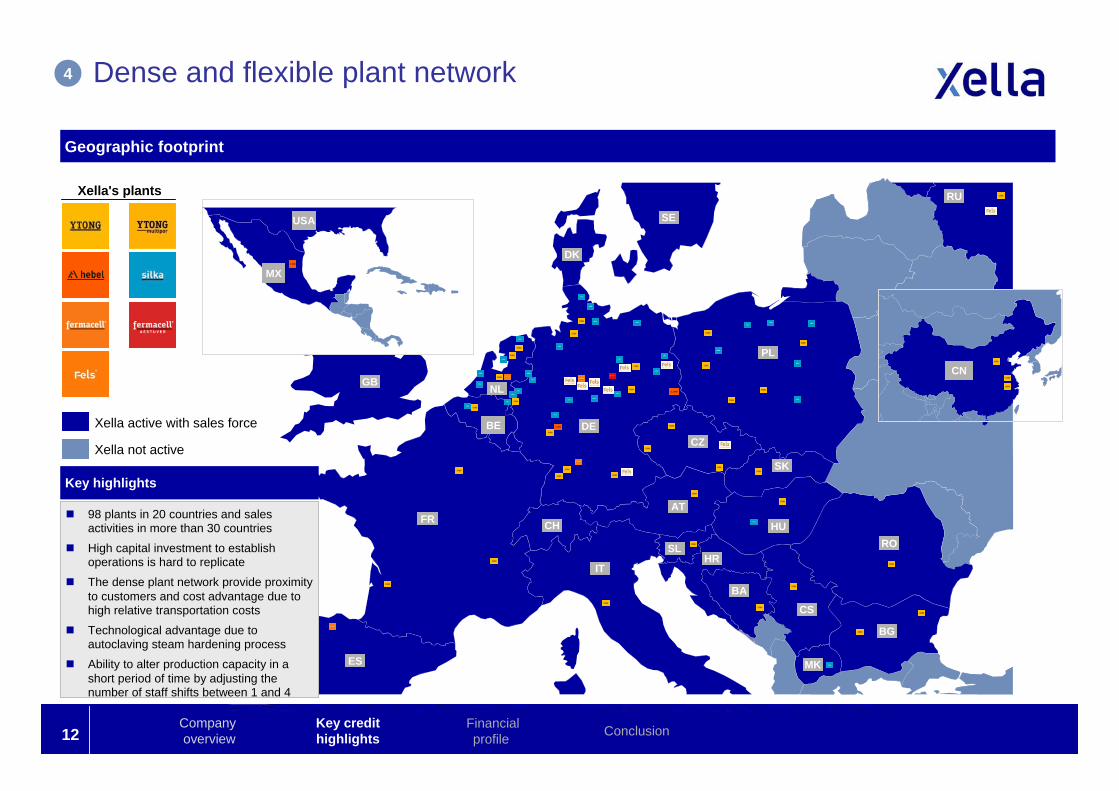
Geographic footprint
Xella's plants
4 Dense and flexible plant network
Xella active with sales force
Xella not active
ES
CH
IT
GB
SE
DK
NL
MK
Key highlights
98 plants in 20 countries and sales activities in more than 30 countries
High capital investment to establish operations is hard to replicate
The dense plant network provide proximity to customers and cost advantage due to high relative transportation costs
Technological advantage due to autoclaving steam hardening process
Ability to alter production capacity in a short period of time by adjusting the number of staff shifts between 1 and 4
Company overview
Financial profile ConclusionKey credit
highlights
13
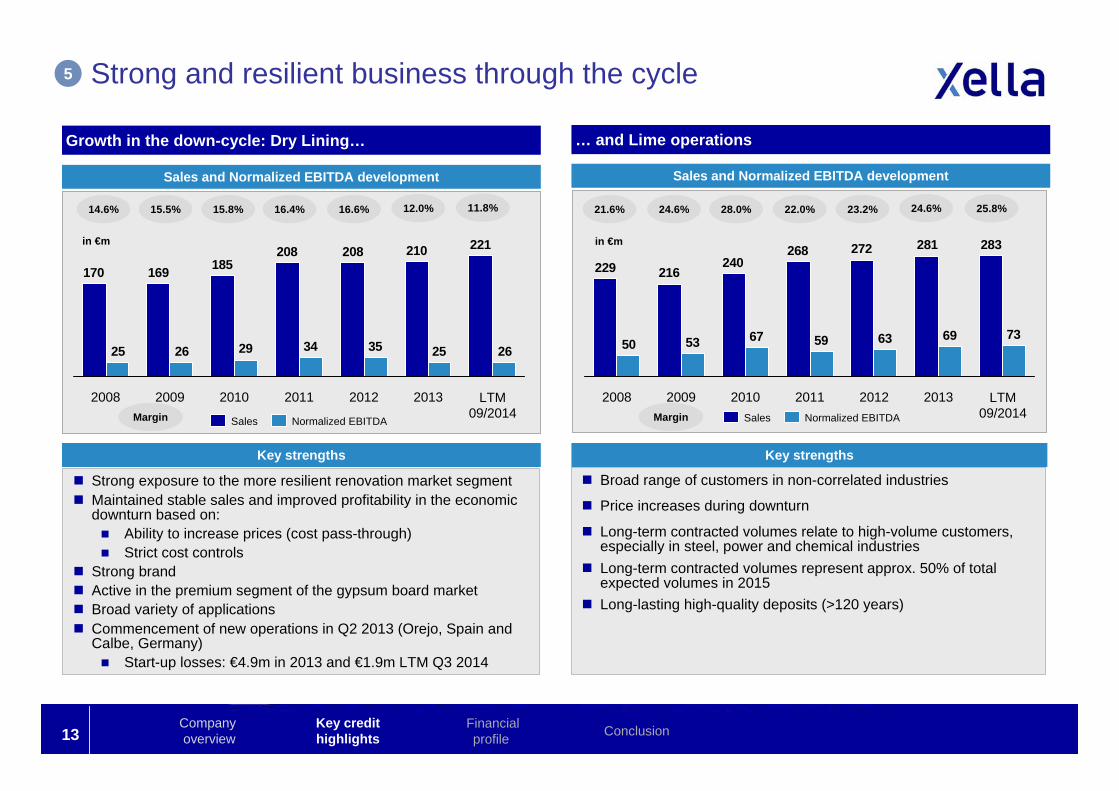
Strong exposure to the more resilient renovation market segment Maintained stable sales and improved profitability in the economic
downturn based on: Ability to increase prices (cost pass-through) Strict cost controls
Strong brand Active in the premium segment of the gypsum board market Broad variety of applications Commencement of new operations in Q2 2013 (Orejo, Spain and
Calbe, Germany) Start-up losses: €4.9m in 2013 and €1.9m LTM Q3 2014
Growth in the down-cycle: Dry Lining…
Sales and Normalized EBITDA development
Key strengths
Broad range of customers in non-correlated industries
Price increases during downturn
Long-term contracted volumes relate to high-volume customers, especially in steel, power and chemical industries
Long-term contracted volumes represent approx. 50% of total expected volumes in 2015
Long-lasting high-quality deposits (>120 years)
… and Lime operations
Sales and Normalized EBITDA development
Key strengths
Strong and resilient business through the cycle
in €m
5
16.4% 16.6% 12.0%14.6%
Margin
15.8%15.5% 22.0% 23.2% 24.6%21.6%
Margin
28.0%24.6%
Company overview
Financial profile ConclusionKey credit
highlights
in €m 221210208208185169170
26253534292625
20112010 LTM 09/2014
20092008 20132012
Normalized EBITDASales
283281272268240
216229
73696359675350
20122011201020092008 LTM 09/2014
2013Sales Normalized EBITDA
11.8% 25.8%
14
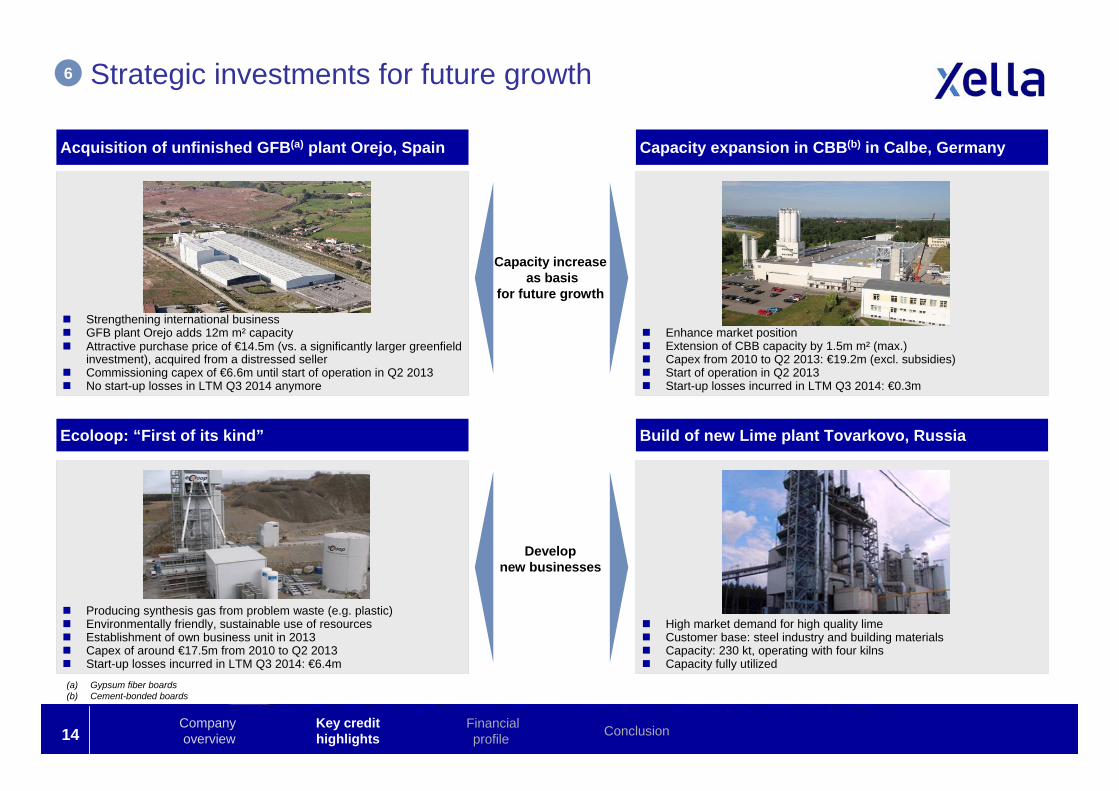
Acquisition of unfinished GFB(a) plant Orejo, Spain
Strengthening international business GFB plant Orejo adds 12m m² capacity Attractive purchase price of €14.5m (vs. a significantly larger greenfield
investment), acquired from a distressed seller Commissioning capex of €6.6m until start of operation in Q2 2013 No start-up losses in LTM Q3 2014 anymore
Strategic investments for future growth
Capacity expansion in CBB(b) in Calbe, Germany
Ecoloop: “First of its kind” Build of new Lime plant Tovarkovo, Russia
Enhance market position Extension of CBB capacity by 1.5m m² (max.) Capex from 2010 to Q2 2013: €19.2m (excl. subsidies) Start of operation in Q2 2013 Start-up losses incurred in LTM Q3 2014: €0.3m
Producing synthesis gas from problem waste (e.g. plastic) Environmentally friendly, sustainable use of resources Establishment of own business unit in 2013 Capex of around €17.5m from 2010 to Q2 2013 Start-up losses incurred in LTM Q3 2014: €6.4m
High market demand for high quality lime Customer base: steel industry and building materials Capacity: 230 kt, operating with four kilns Capacity fully utilized
Capacity increaseas basis
for future growth
Develop new businesses
6
(a) Gypsum fiber boards (b) Cement-bonded boards
Company overview
Financial profile ConclusionKey credit
highlights
15
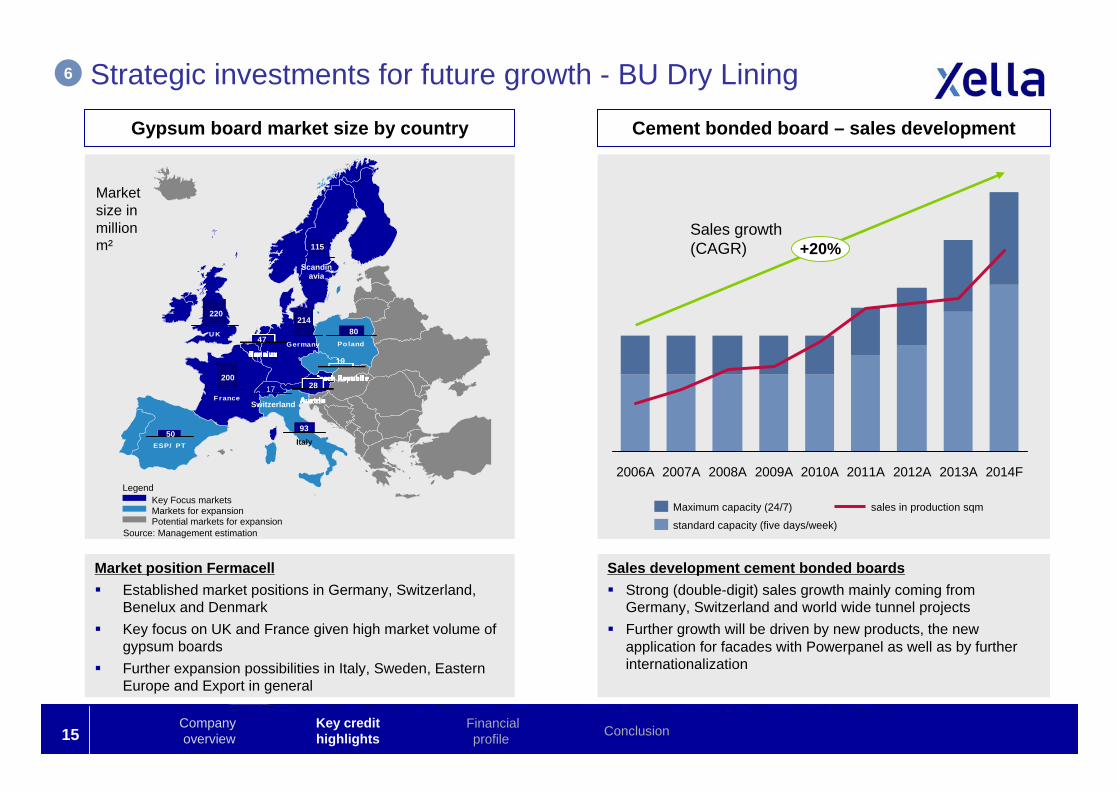
Market position Fermacell Established market positions in Germany, Switzerland,
Benelux and Denmark Key focus on UK and France given high market volume of
gypsum boards Further expansion possibilities in Italy, Sweden, Eastern
Europe and Export in general
Gypsum board market size by country
LegendKey Focus marketsMarkets for expansionPotential markets for expansion
Source: Management estimation
Po landGermany
21480
19
28
47U K
220
F rance
200
ESP/ PT50
17
115
Scandinavia
93Italy
Switzerland
Market size in million m²
Cement bonded board – sales development
Company overview
Financial profile ConclusionKey credit
highlights
Strategic investments for future growth - BU Dry Lining6
Sales development cement bonded boards Strong (double-digit) sales growth mainly coming from
Germany, Switzerland and world wide tunnel projects Further growth will be driven by new products, the new
application for facades with Powerpanel as well as by further internationalization
standard capacity (five days/week)
Maximum capacity (24/7) sales in production sqm
2014F2007A 2011A 2012A 2013A
+20%
2006A 2009A 2010A2008A
Sales growth(CAGR)
16
Agenda
1. Company overview
2. Key credit highlights
3. Financial profile
4. Conclusion
Company overview
Financial profile ConclusionKey credit
highlights
17
in €m 2008 2009 2010 2011 2012 2013LTM
Q3 2014
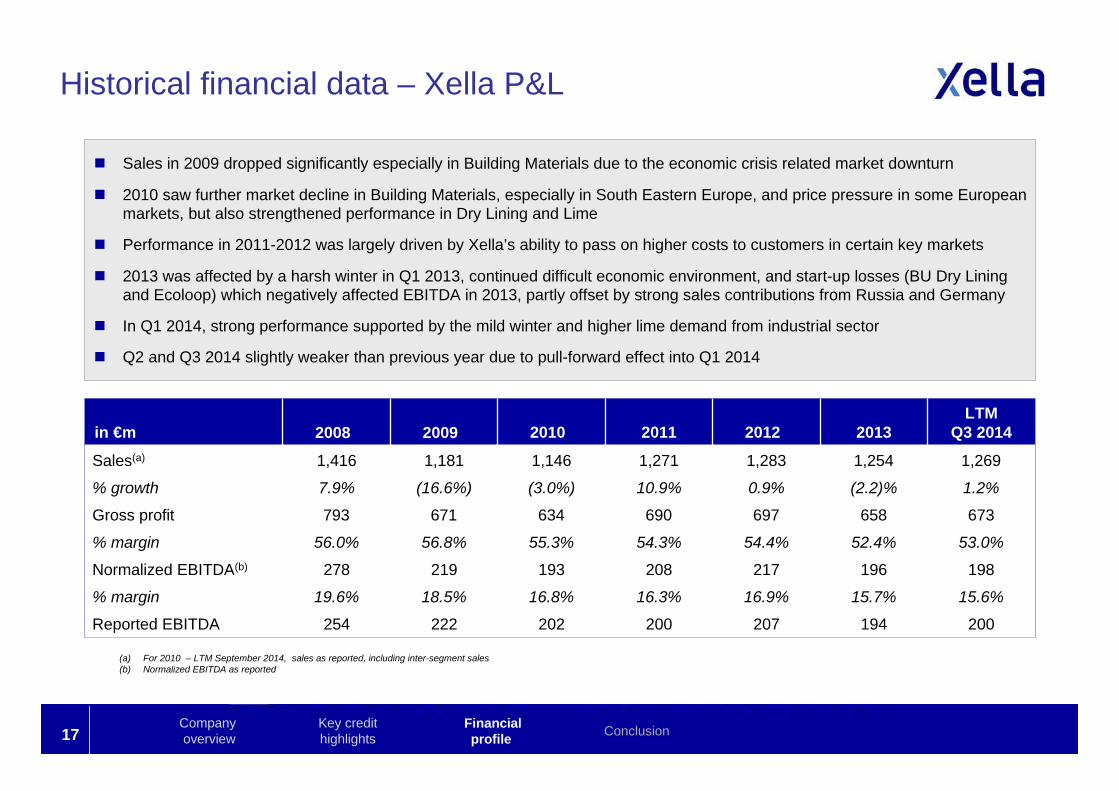
Sales(a) 1,416 1,181 1,146 1,271 1,283 1,254 1,269
% growth 7.9% (16.6%) (3.0%) 10.9% 0.9% (2.2)% 1.2%
Gross profit 793 671 634 690 697 658 673
% margin 56.0% 56.8% 55.3% 54.3% 54.4% 52.4% 53.0%
Normalized EBITDA(b) 278 219 193 208 217 196 198
% margin 19.6% 18.5% 16.8% 16.3% 16.9% 15.7% 15.6%
Reported EBITDA 254 222 202 200 207 194 200
Historical financial data – Xella P&L
Sales in 2009 dropped significantly especially in Building Materials due to the economic crisis related market downturn
2010 saw further market decline in Building Materials, especially in South Eastern Europe, and price pressure in some European markets, but also strengthened performance in Dry Lining and Lime
Performance in 2011-2012 was largely driven by Xella’s ability to pass on higher costs to customers in certain key markets
2013 was affected by a harsh winter in Q1 2013, continued difficult economic environment, and start-up losses (BU Dry Lining and Ecoloop) which negatively affected EBITDA in 2013, partly offset by strong sales contributions from Russia and Germany
In Q1 2014, strong performance supported by the mild winter and higher lime demand from industrial sector
Q2 and Q3 2014 slightly weaker than previous year due to pull-forward effect into Q1 2014
(a) For 2010 – LTM September 2014, sales as reported, including inter-segment sales (b) Normalized EBITDA as reported
Company overview
Financial profile ConclusionKey credit
highlights
18
Financial data – divisional overview
Highlights
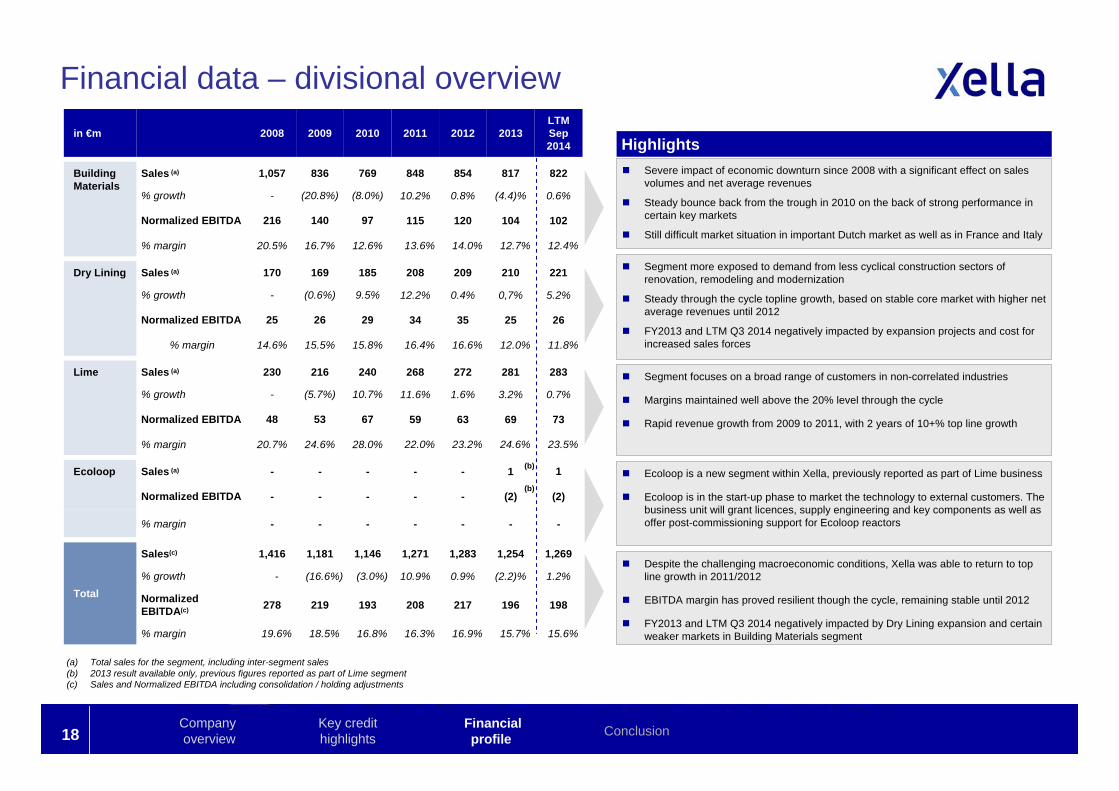
Segment focuses on a broad range of customers in non-correlated industries
Margins maintained well above the 20% level through the cycle
Rapid revenue growth from 2009 to 2011, with 2 years of 10+% top line growth
in €m 2008 2009 2010 2011 2012 2013LTM Sep2014
Building Materials
Sales (a) 1,057 836 769 848 854 817 822
% growth - (20.8%) (8.0%) 10.2% 0.8% (4.4)% 0.6%
Normalized EBITDA 216 140 97 115 120 104 102
% margin 20.5% 16.7% 12.6% 13.6% 14.0% 12.7% 12.4%
Dry Lining Sales (a) 170 169 185 208 209 210 221
% growth - (0.6%) 9.5% 12.2% 0.4% 0,7% 5.2%
Normalized EBITDA 25 26 29 34 35 25 26
% margin 14.6% 15.5% 15.8% 16.4% 16.6% 12.0% 11.8%
Lime Sales (a) 230 216 240 268 272 281 283
% growth - (5.7%) 10.7% 11.6% 1.6% 3.2% 0.7%
Normalized EBITDA 48 53 67 59 63 69 73
% margin 20.7% 24.6% 28.0% 22.0% 23.2% 24.6% 23.5%
Ecoloop Sales (a) - - - - - 1 1
Normalized EBITDA - - - - - (2) (2)
% margin - - - - - - -
Total
Sales(c) 1,416 1,181 1,146 1,271 1,283 1,254 1,269
% growth - (16.6%) (3.0%) 10.9% 0.9% (2.2)% 1.2%
Normalized EBITDA(c) 278 219 193 208 217 196 198
% margin 19.6% 18.5% 16.8% 16.3% 16.9% 15.7% 15.6%
Severe impact of economic downturn since 2008 with a significant effect on sales volumes and net average revenues
Steady bounce back from the trough in 2010 on the back of strong performance in certain key markets
Still difficult market situation in important Dutch market as well as in France and Italy
Segment more exposed to demand from less cyclical construction sectors of renovation, remodeling and modernization
Steady through the cycle topline growth, based on stable core market with higher net average revenues until 2012
FY2013 and LTM Q3 2014 negatively impacted by expansion projects and cost for increased sales forces
(a) Total sales for the segment, including inter-segment sales(b) 2013 result available only, previous figures reported as part of Lime segment(c) Sales and Normalized EBITDA including consolidation / holding adjustments
Ecoloop is a new segment within Xella, previously reported as part of Lime business
Ecoloop is in the start-up phase to market the technology to external customers. The business unit will grant licences, supply engineering and key components as well as offer post-commissioning support for Ecoloop reactors
Despite the challenging macroeconomic conditions, Xella was able to return to top line growth in 2011/2012
EBITDA margin has proved resilient though the cycle, remaining stable until 2012
FY2013 and LTM Q3 2014 negatively impacted by Dry Lining expansion and certain weaker markets in Building Materials segment
(b)
(b)
Company overview
Financial profile ConclusionKey credit
highlights
19
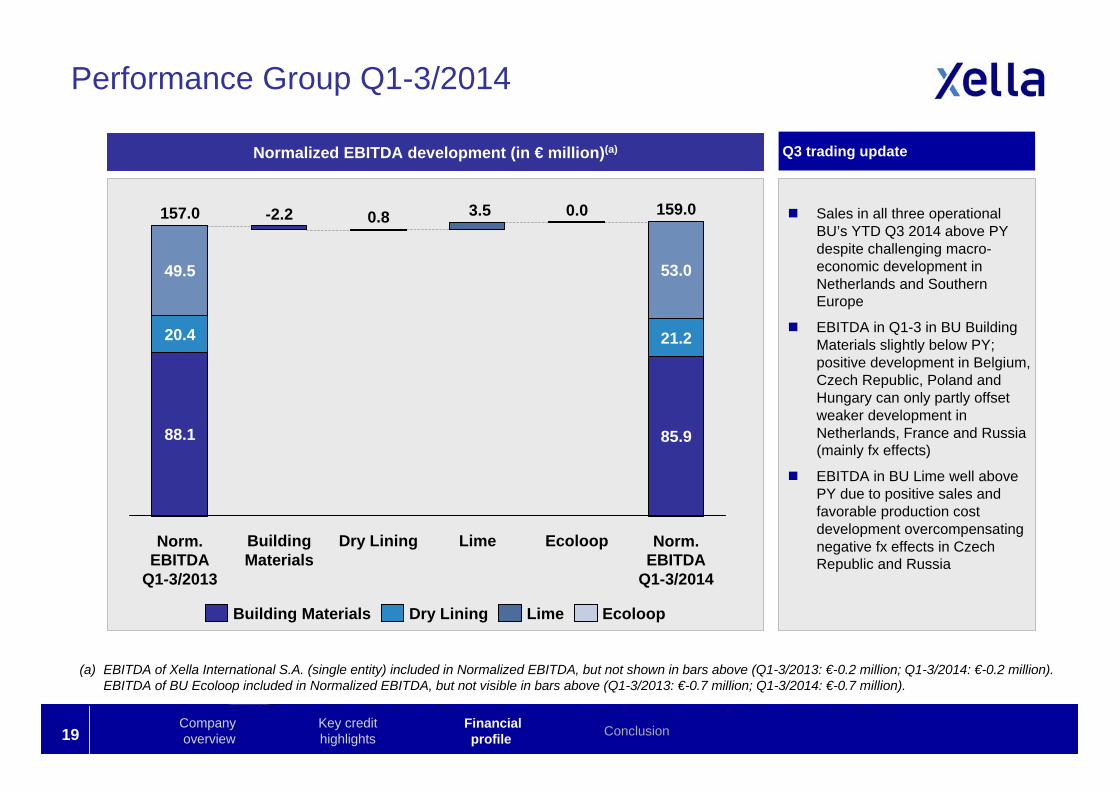
Performance Group Q1-3/2014
Normalized EBITDA development (in € million)(a)
Dry Lining EcoloopBuilding Materials Lime
Company overview
Financial profile ConclusionKey credit
highlights
Sales in all three operational BU’s YTD Q3 2014 above PY despite challenging macro-economic development in Netherlands and Southern Europe
EBITDA in Q1-3 in BU Building Materials slightly below PY; positive development in Belgium, Czech Republic, Poland and Hungary can only partly offset weaker development in Netherlands, France and Russia (mainly fx effects)
EBITDA in BU Lime well above PY due to positive sales and favorable production cost development overcompensating negative fx effects in Czech Republic and Russia
Q3 trading update
(a) EBITDA of Xella International S.A. (single entity) included in Normalized EBITDA, but not shown in bars above (Q1-3/2013: €-0.2 million; Q1-3/2014: €-0.2 million).EBITDA of BU Ecoloop included in Normalized EBITDA, but not visible in bars above (Q1-3/2013: €-0.7 million; Q1-3/2014: €-0.7 million).
0.8
Building Materials
-2.2
Norm. EBITDA
Q1-3/2013
157.0
88.1 85.9
Norm. EBITDA
Q1-3/2014
159.0
Dry Lining
3.5
20.4
49.5
Ecoloop
0.0
Lime
21.2
53.0
20
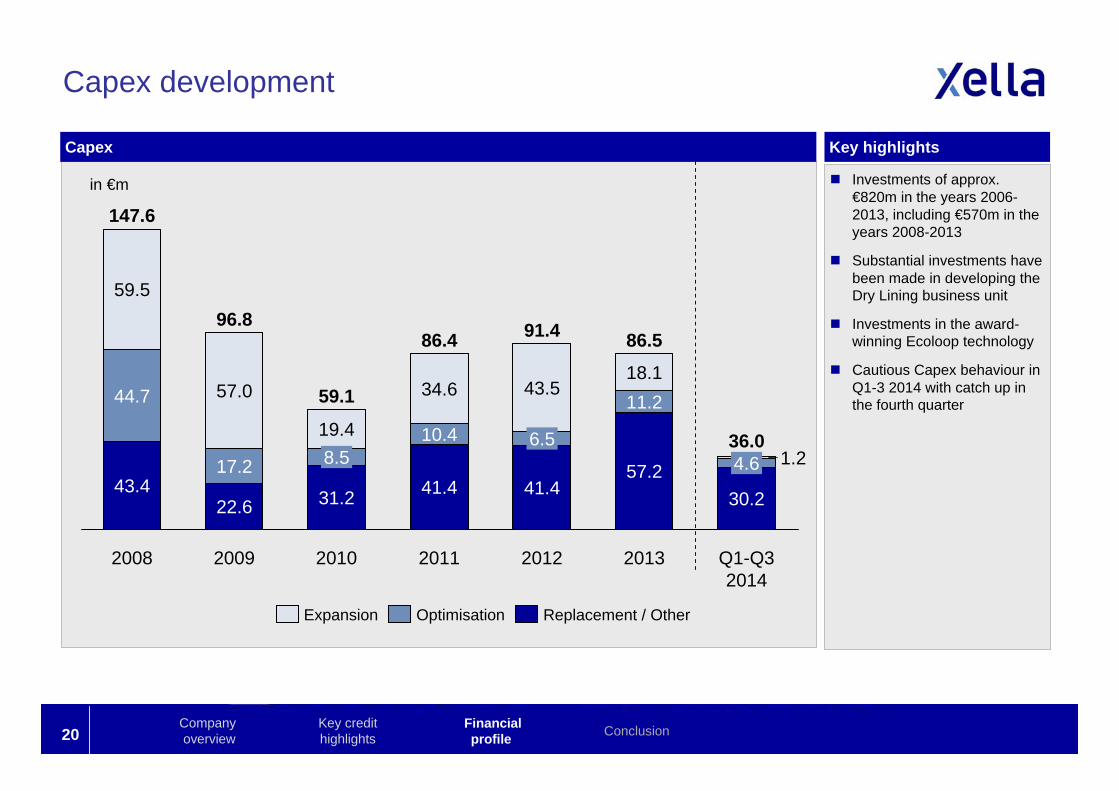
Capex development
Capex
in €m Investments of approx. €820m in the years 2006-2013, including €570m in the years 2008-2013
Substantial investments have been made in developing the Dry Lining business unit
Investments in the award-winning Ecoloop technology
Cautious Capex behaviour in Q1-3 2014 with catch up in the fourth quarter
Key highlights
Company overview
Financial profile ConclusionKey credit
highlights
36.0
86.5
2013
57.2
11.218.1
2012
91.4
41.4
6.5
43.5
2011
86.4
41.4
10.4
34.6
Q1-Q3 2014
59.1
31.2
8.519.4
2009
96.8
22.6
17.2
57.0
2008
147.6
43.4
44.7
59.5
30.2
1.24.6
2010
Expansion Replacement / OtherOptimisation
21
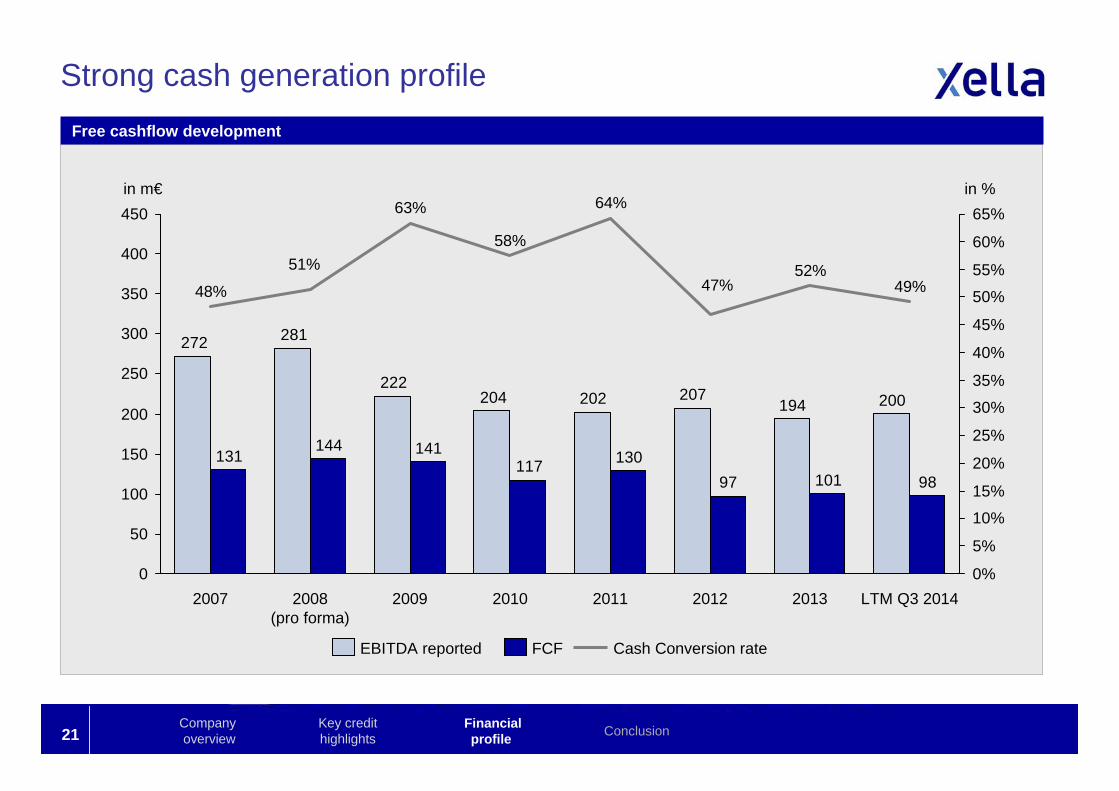
Strong cash generation profileFree cashflow development
Company overview
Financial profile ConclusionKey credit
highlights
in m€ in %
200194207202204
222
281272
9810197130117
141144131
0
50
100
150
200
250
300
350
400
450
0%
5%
10%
15%
20%
25%
30%
35%
40%
45%
50%
55%
60%
65%
LTM Q3 2014
49%
2012
47%
2011
64%
2010
58%
2009
63%
2008(pro forma)
51%
2007
48%
2013
52%
Cash Conversion rateEBITDA reported FCF
22
Group: Financial Structure
(a) Financial debt does not include subordinated shareholder loans(b) Thereof €21.1m utilized in form of guaranty facilities
.
Financial Structure
Maturity profile as of September 30, 2014 (in €m) (a)Financial structure as of September 30, 2014
Facility Amount (€m) x EBITDAMaturity
Cash and cash equivalents (62) (0.6)x
Facility A 176 0.8x Aug 15
Facility B 124 0.6x Aug 16
Facility C 89 0.4x Aug 17
Facility D 300 1.4x Jun 18
Finance lease liabilities 11 0.1x
Total net financial debt (a) 605 2.9x
Revolving Credit Facility (b) 75 Aug 15
Capex / Acquisition Facility 35 Aug 15
Normalized EBITDA 208
0.2x
Moderate Leverage Ratio of 2.8x (SFA Leverage Ratio: 2.50x)
Extension of maturity profile with latest SFA amendment and new bond issuance
Sound capital structure, no refinancing action required prior to Q3 2015
325
89
194
37
90
0 0
2018 20192017201620152014Cash
Credit Facility Amount (€m) x EBITDA Maturity
Cash and cash equivalents (90) (0.5)x
Facility A term loans 31 0.2x Aug 15
Facility B term loans 124 0.6x Aug 16
Facility C term loans 89 0.4x Aug 17
Combined Facility loans 70 0.4x Aug 16
Facility D2 loan 325 1.6x Jun 19
Capex/Acquisition Facility loan 6 0.0x Aug 15
Finance lease liabilities 7 0.0x
Net financial debt (a) 562 2.8x
Revolving Credit Facility (b) 75 Jun 17
Normalized LTM EBITDA 198
Company overview
Financial profile ConclusionKey credit
highlights
23
Agenda
1. Company overview
2. Key credit highlights
3. Financial profile
4. Conclusion
Company overview
Financial profile ConclusionKey credit
highlights
24
Key credit highlights
Portfolio of innovative and
high-quality premium products supported by well regarded brands
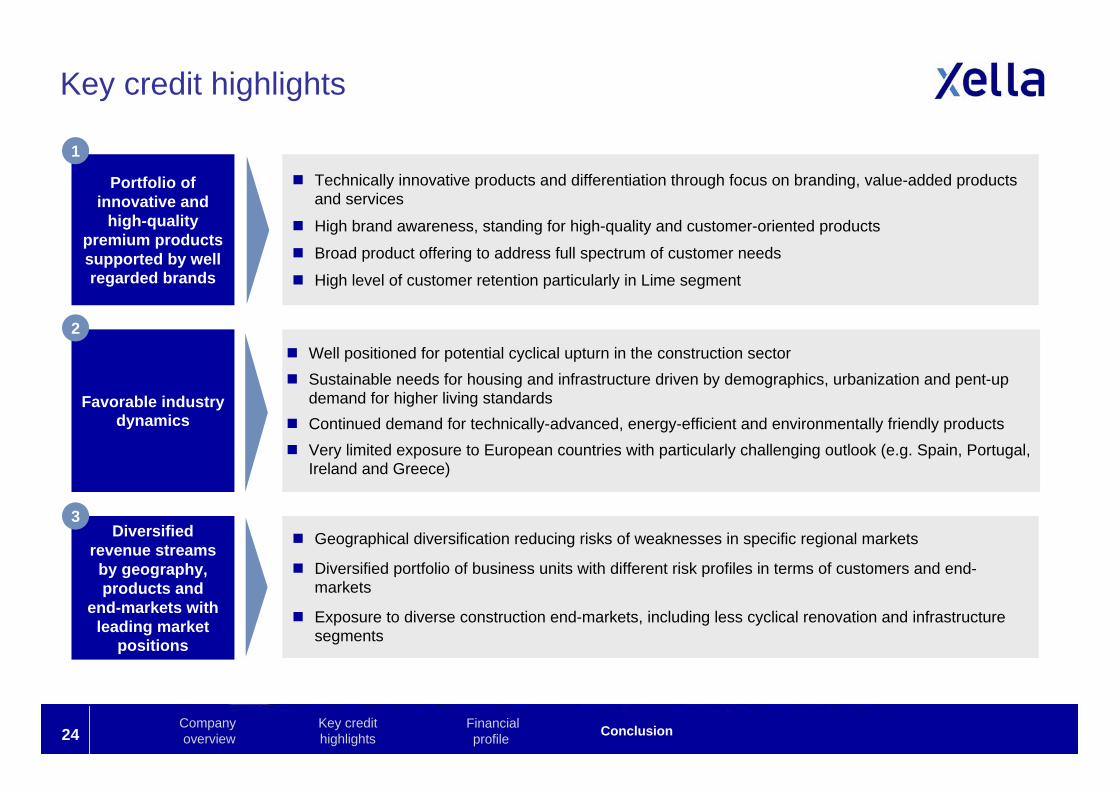
Technically innovative products and differentiation through focus on branding, value-added products and services
High brand awareness, standing for high-quality and customer-oriented products
Broad product offering to address full spectrum of customer needs
High level of customer retention particularly in Lime segment
Well positioned for potential cyclical upturn in the construction sector Sustainable needs for housing and infrastructure driven by demographics, urbanization and pent-up
demand for higher living standards Continued demand for technically-advanced, energy-efficient and environmentally friendly products Very limited exposure to European countries with particularly challenging outlook (e.g. Spain, Portugal,
Ireland and Greece)
Favorable industry dynamics
Geographical diversification reducing risks of weaknesses in specific regional markets
Diversified portfolio of business units with different risk profiles in terms of customers and end-markets
Exposure to diverse construction end-markets, including less cyclical renovation and infrastructure segments
Diversified revenue streams by geography, products and
end-markets with leading market
positions
1
2
3
Company overview
Financial profile ConclusionKey credit
highlights
25
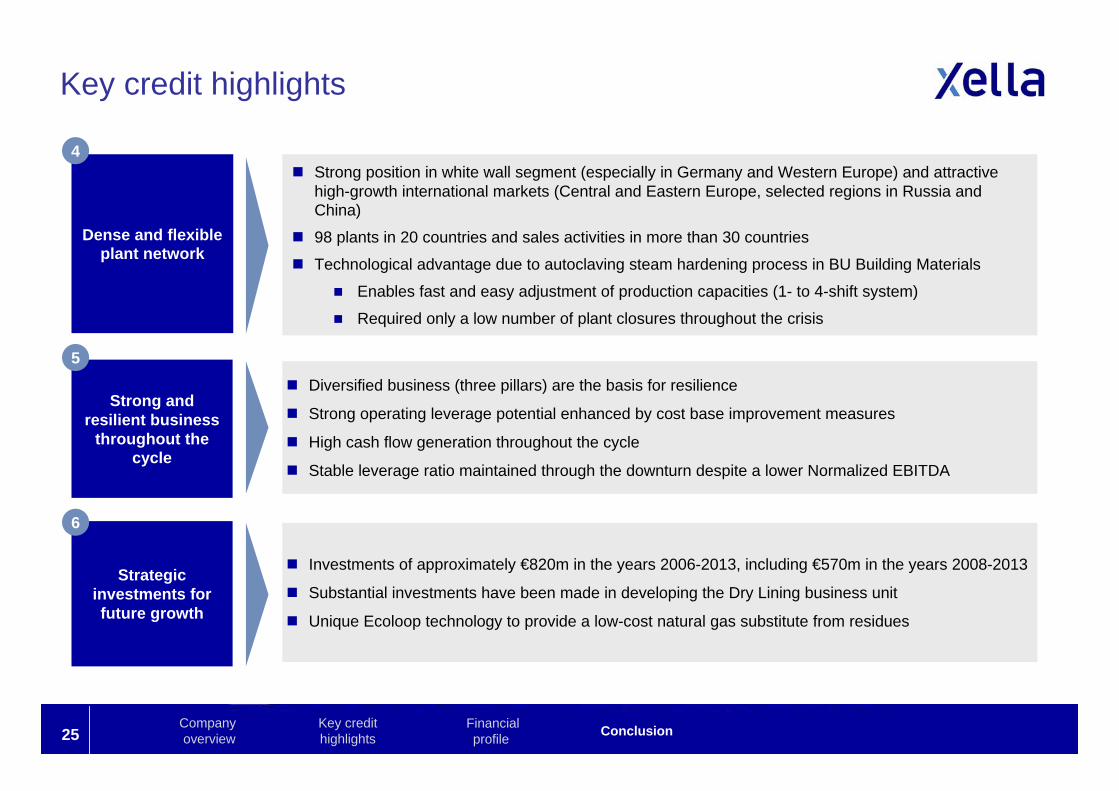
Diversified business (three pillars) are the basis for resilience
Strong operating leverage potential enhanced by cost base improvement measures
High cash flow generation throughout the cycle
Stable leverage ratio maintained through the downturn despite a lower Normalized EBITDA
Strong and resilient business
throughout the cycle
Strong position in white wall segment (especially in Germany and Western Europe) and attractive high-growth international markets (Central and Eastern Europe, selected regions in Russia and China)
98 plants in 20 countries and sales activities in more than 30 countries
Technological advantage due to autoclaving steam hardening process in BU Building Materials
Enables fast and easy adjustment of production capacities (1- to 4-shift system)
Required only a low number of plant closures throughout the crisis
Dense and flexible plant network
Investments of approximately €820m in the years 2006-2013, including €570m in the years 2008-2013
Substantial investments have been made in developing the Dry Lining business unit
Unique Ecoloop technology to provide a low-cost natural gas substitute from residues
Strategicinvestments forfuture growth
4
5
6
Company overview
Financial profile ConclusionKey credit
highlights
Key credit highlights


![Älykkäitä ratkaisuja Xella-rakennusjärjestelmillä - Ytong...Ytong-raudoitusverkko: Erikoisraudoitus kaikille Multipor järjestelmille Ytong-pintalaasti, mineraalipohjainen [valkoinen]](https://img.pdfslide.net/doc/110x75/60c557619644c20ae468fc00/lykkit-ratkaisuja-xella-rakennusjrjestelmill-ytong-ytong-raudoitusverkko.jpg)