Embed Size (px)
Citation preview
City of HollywoodFirefighters' Retirement System
Investment Performance Review3rd Quarter 2015
3rd Quarter 2015 Market Environment
1
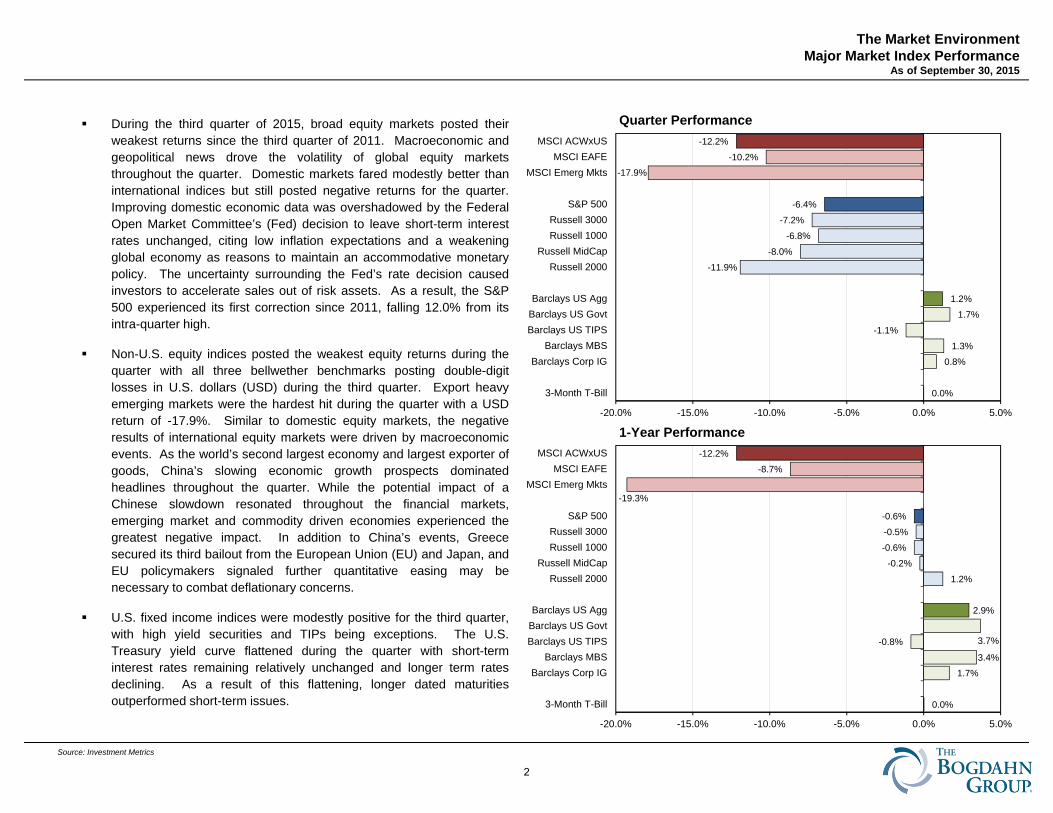
During the third quarter of 2015, broad equity markets posted theirweakest returns since the third quarter of 2011. Macroeconomic andgeopolitical news drove the volatility of global equity marketsthroughout the quarter. Domestic markets fared modestly better thaninternational indices but still posted negative returns for the quarter.Improving domestic economic data was overshadowed by the FederalOpen Market Committee’s (Fed) decision to leave short-term interestrates unchanged, citing low inflation expectations and a weakeningglobal economy as reasons to maintain an accommodative monetarypolicy. The uncertainty surrounding the Fed’s rate decision causedinvestors to accelerate sales out of risk assets. As a result, the S&P500 experienced its first correction since 2011, falling 12.0% from itsintra-quarter high.
Non-U.S. equity indices posted the weakest equity returns during thequarter with all three bellwether benchmarks posting double-digitlosses in U.S. dollars (USD) during the third quarter. Export heavyemerging markets were the hardest hit during the quarter with a USDreturn of -17.9%. Similar to domestic equity markets, the negativeresults of international equity markets were driven by macroeconomicevents. As the world’s second largest economy and largest exporter ofgoods, China’s slowing economic growth prospects dominatedheadlines throughout the quarter. While the potential impact of aChinese slowdown resonated throughout the financial markets,emerging market and commodity driven economies experienced thegreatest negative impact. In addition to China’s events, Greecesecured its third bailout from the European Union (EU) and Japan, andEU policymakers signaled further quantitative easing may benecessary to combat deflationary concerns.
U.S. fixed income indices were modestly positive for the third quarter,with high yield securities and TIPs being exceptions. The U.S.Treasury yield curve flattened during the quarter with short-terminterest rates remaining relatively unchanged and longer term ratesdeclining. As a result of this flattening, longer dated maturitiesoutperformed short-term issues.
Source: Investment Metrics
The Market EnvironmentMajor Market Index Performance
As of September 30, 2015
0.0%
0.8%
1.3%
-1.1%
1.7%
1.2%
-11.9%
-8.0%
-6.8%
-7.2%
-6.4%
-17.9%-10.2%
-12.2%
-20.0% -15.0% -10.0% -5.0% 0.0% 5.0%
3-Month T-Bill
Barclays Corp IGBarclays MBS
Barclays US TIPSBarclays US GovtBarclays US Agg
Russell 2000Russell MidCap
Russell 1000Russell 3000
S&P 500
MSCI Emerg MktsMSCI EAFE
MSCI ACWxUS
Quarter Performance
0.0%
1.7%
3.4%
-0.8% 3.7%
2.9%
1.2%
-0.2%
-0.6%
-0.5%
-0.6%
-19.3%
-8.7%
-12.2%
-20.0% -15.0% -10.0% -5.0% 0.0% 5.0%
3-Month T-Bill
Barclays Corp IGBarclays MBS
Barclays US TIPSBarclays US GovtBarclays US Agg
Russell 2000Russell MidCap
Russell 1000Russell 3000
S&P 500
MSCI Emerg MktsMSCI EAFE
MSCI ACWxUS
1-Year Performance
2
Source: Investment Metrics
The Market EnvironmentDomestic Equity Style Index Performance
As of September 30, 2015
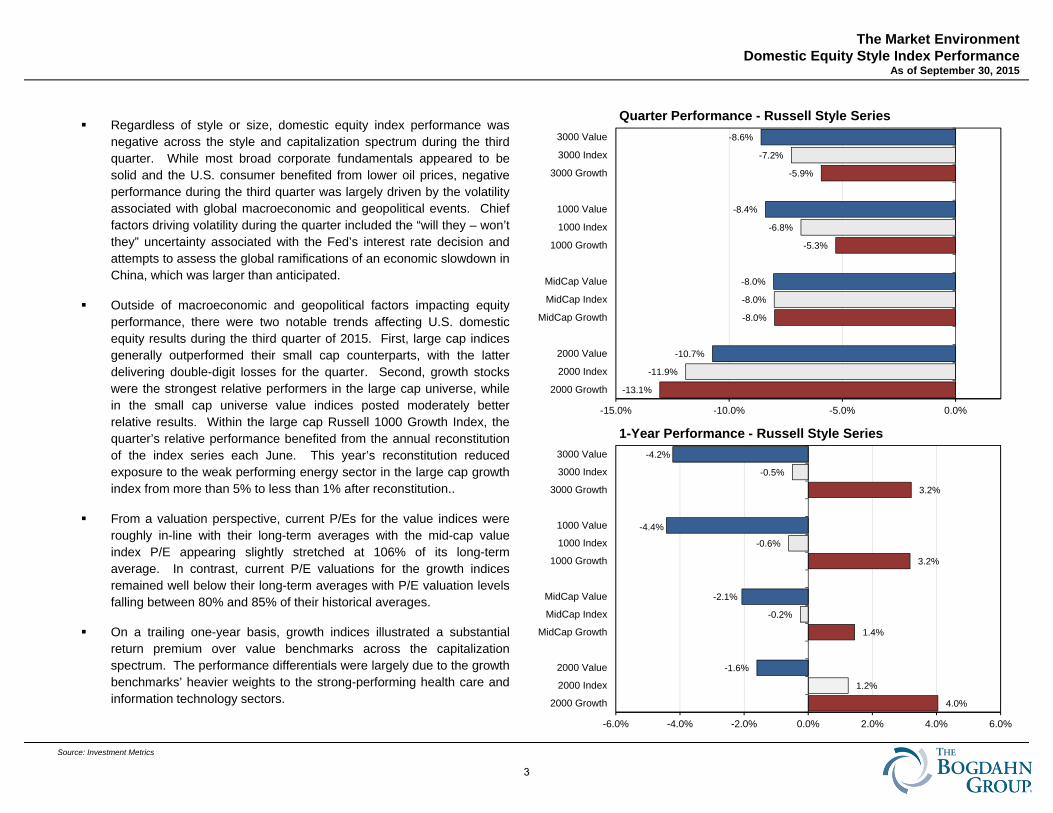
Regardless of style or size, domestic equity index performance wasnegative across the style and capitalization spectrum during the thirdquarter. While most broad corporate fundamentals appeared to besolid and the U.S. consumer benefited from lower oil prices, negativeperformance during the third quarter was largely driven by the volatilityassociated with global macroeconomic and geopolitical events. Chieffactors driving volatility during the quarter included the “will they – won’tthey” uncertainty associated with the Fed’s interest rate decision andattempts to assess the global ramifications of an economic slowdown inChina, which was larger than anticipated.
Outside of macroeconomic and geopolitical factors impacting equityperformance, there were two notable trends affecting U.S. domesticequity results during the third quarter of 2015. First, large cap indicesgenerally outperformed their small cap counterparts, with the latterdelivering double-digit losses for the quarter. Second, growth stockswere the strongest relative performers in the large cap universe, whilein the small cap universe value indices posted moderately betterrelative results. Within the large cap Russell 1000 Growth Index, thequarter’s relative performance benefited from the annual reconstitutionof the index series each June. This year’s reconstitution reducedexposure to the weak performing energy sector in the large cap growthindex from more than 5% to less than 1% after reconstitution..
From a valuation perspective, current P/Es for the value indices wereroughly in-line with their long-term averages with the mid-cap valueindex P/E appearing slightly stretched at 106% of its long-termaverage. In contrast, current P/E valuations for the growth indicesremained well below their long-term averages with P/E valuation levelsfalling between 80% and 85% of their historical averages.
On a trailing one-year basis, growth indices illustrated a substantialreturn premium over value benchmarks across the capitalizationspectrum. The performance differentials were largely due to the growthbenchmarks’ heavier weights to the strong-performing health care andinformation technology sectors.
-13.1%
-11.9%
-10.7%
-8.0%
-8.0%
-8.0%
-5.3%
-6.8%
-8.4%
-5.9%
-7.2%
-8.6%
-15.0% -10.0% -5.0% 0.0%
2000 Growth
2000 Index
2000 Value
MidCap Growth
MidCap Index
MidCap Value
1000 Growth
1000 Index
1000 Value
3000 Growth
3000 Index
3000 Value
Quarter Performance - Russell Style Series
4.0%
1.2%
-1.6%
1.4%
-0.2%
-2.1%
3.2%
-0.6%
-4.4%
3.2%
-0.5%
-4.2%
-6.0% -4.0% -2.0% 0.0% 2.0% 4.0% 6.0%
2000 Growth
2000 Index
2000 Value
MidCap Growth
MidCap Index
MidCap Value
1000 Growth
1000 Index
1000 Value
3000 Growth
3000 Index
3000 Value
1-Year Performance - Russell Style Series
3
The Market EnvironmentGICS Sector Performance & (Sector Weight)
As of September 30, 2015
Source: Morningstar Direct
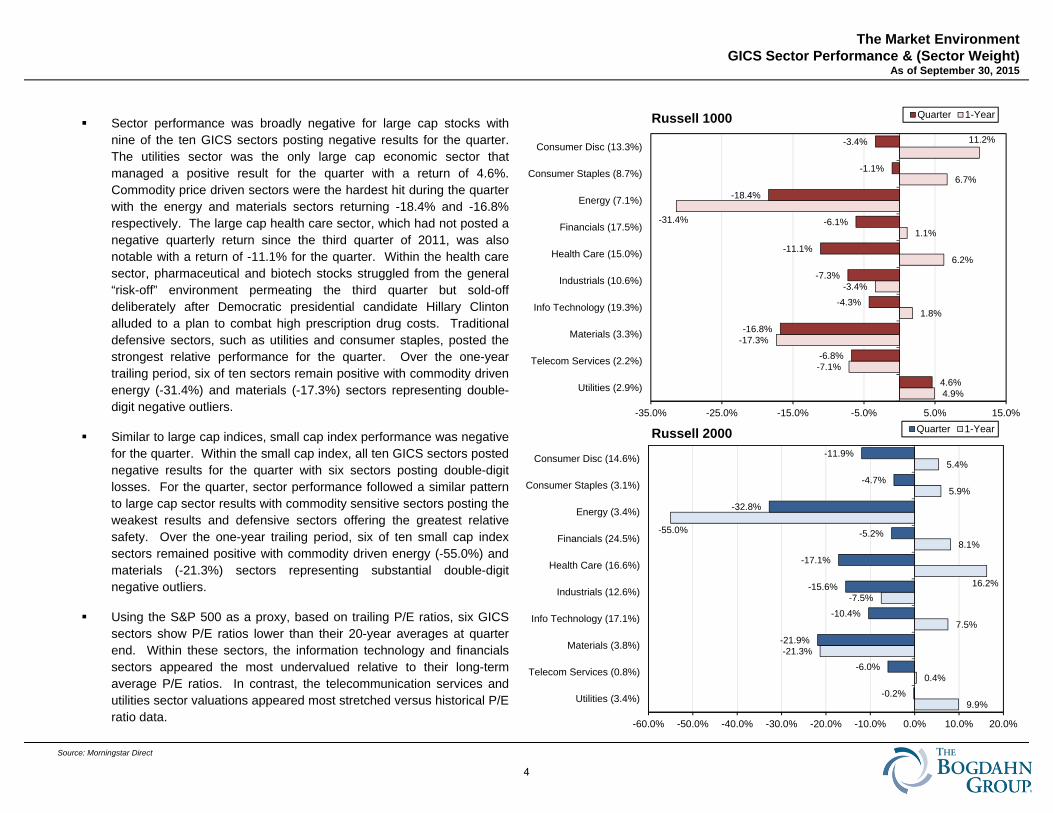
Sector performance was broadly negative for large cap stocks withnine of the ten GICS sectors posting negative results for the quarter.The utilities sector was the only large cap economic sector thatmanaged a positive result for the quarter with a return of 4.6%.Commodity price driven sectors were the hardest hit during the quarterwith the energy and materials sectors returning -18.4% and -16.8%respectively. The large cap health care sector, which had not posted anegative quarterly return since the third quarter of 2011, was alsonotable with a return of -11.1% for the quarter. Within the health caresector, pharmaceutical and biotech stocks struggled from the general“risk-off” environment permeating the third quarter but sold-offdeliberately after Democratic presidential candidate Hillary Clintonalluded to a plan to combat high prescription drug costs. Traditionaldefensive sectors, such as utilities and consumer staples, posted thestrongest relative performance for the quarter. Over the one-yeartrailing period, six of ten sectors remain positive with commodity drivenenergy (-31.4%) and materials (-17.3%) sectors representing double-digit negative outliers.
Similar to large cap indices, small cap index performance was negativefor the quarter. Within the small cap index, all ten GICS sectors postednegative results for the quarter with six sectors posting double-digitlosses. For the quarter, sector performance followed a similar patternto large cap sector results with commodity sensitive sectors posting theweakest results and defensive sectors offering the greatest relativesafety. Over the one-year trailing period, six of ten small cap indexsectors remained positive with commodity driven energy (-55.0%) andmaterials (-21.3%) sectors representing substantial double-digitnegative outliers.
Using the S&P 500 as a proxy, based on trailing P/E ratios, six GICSsectors show P/E ratios lower than their 20-year averages at quarterend. Within these sectors, the information technology and financialssectors appeared the most undervalued relative to their long-termaverage P/E ratios. In contrast, the telecommunication services andutilities sector valuations appeared most stretched versus historical P/Eratio data.
4.9%
-7.1%
-17.3%
1.8%
-3.4%
6.2%
1.1%-31.4%
6.7%
11.2%
4.6%
-6.8%
-16.8%
-4.3%
-7.3%
-11.1%
-6.1%
-18.4%
-1.1%
-3.4%
-35.0% -25.0% -15.0% -5.0% 5.0% 15.0%
Utilities (2.9%)
Telecom Services (2.2%)
Materials (3.3%)
Info Technology (19.3%)
Industrials (10.6%)
Health Care (15.0%)
Financials (17.5%)
Energy (7.1%)
Consumer Staples (8.7%)
Consumer Disc (13.3%)
Russell 1000 Quarter 1-Year
9.9%
0.4%
-21.3%
7.5%
-7.5%16.2%
8.1%-55.0%
5.9%
5.4%
-0.2%
-6.0%
-21.9%
-10.4%
-15.6%
-17.1%
-5.2%
-32.8%
-4.7%
-11.9%
-60.0% -50.0% -40.0% -30.0% -20.0% -10.0% 0.0% 10.0% 20.0%
Utilities (3.4%)
Telecom Services (0.8%)
Materials (3.8%)
Info Technology (17.1%)
Industrials (12.6%)
Health Care (16.6%)
Financials (24.5%)
Energy (3.4%)
Consumer Staples (3.1%)
Consumer Disc (14.6%)
Russell 2000 Quarter 1-Year
4
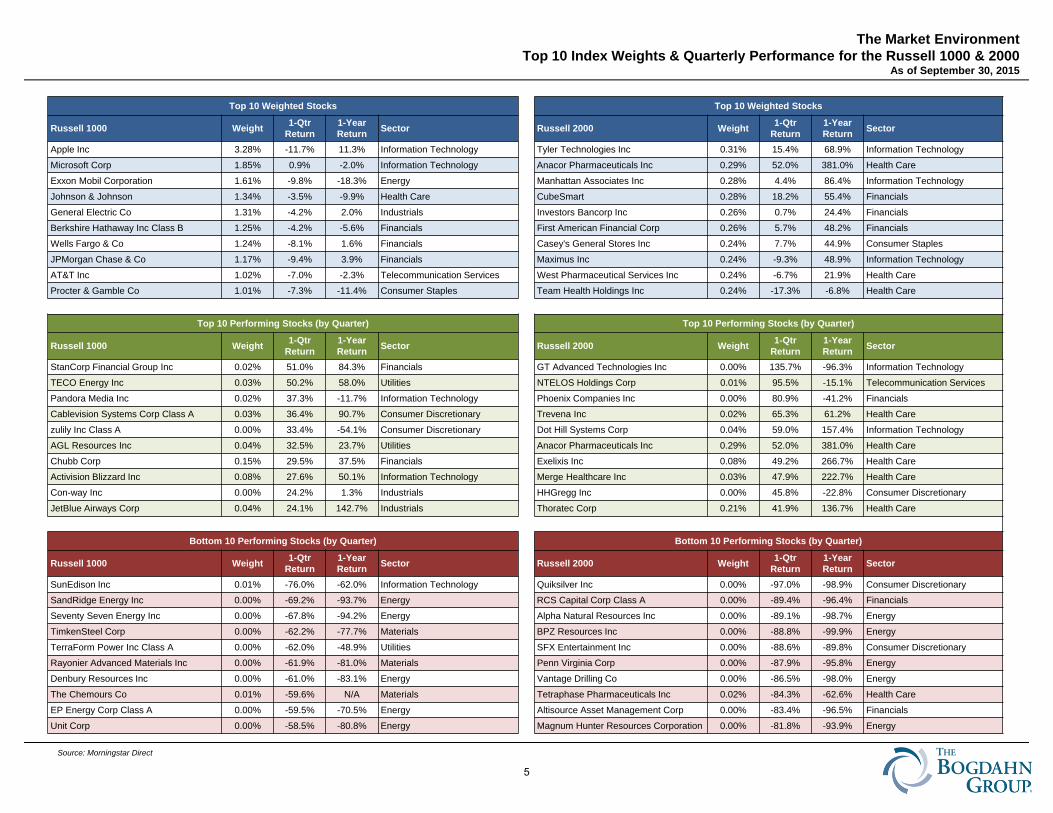
The Market EnvironmentTop 10 Index Weights & Quarterly Performance for the Russell 1000 & 2000
As of September 30, 2015
Source: Morningstar Direct
Top 10 Weighted Stocks Top 10 Weighted Stocks
Russell 1000 Weight 1-Qtr Return
1-Year Return Sector Russell 2000 Weight 1-Qtr
Return1-Year Return Sector
Apple Inc 3.28% -11.7% 11.3% Information Technology Tyler Technologies Inc 0.31% 15.4% 68.9% Information Technology
Microsoft Corp 1.85% 0.9% -2.0% Information Technology Anacor Pharmaceuticals Inc 0.29% 52.0% 381.0% Health Care
Exxon Mobil Corporation 1.61% -9.8% -18.3% Energy Manhattan Associates Inc 0.28% 4.4% 86.4% Information Technology
Johnson & Johnson 1.34% -3.5% -9.9% Health Care CubeSmart 0.28% 18.2% 55.4% Financials
General Electric Co 1.31% -4.2% 2.0% Industrials Investors Bancorp Inc 0.26% 0.7% 24.4% Financials
Berkshire Hathaway Inc Class B 1.25% -4.2% -5.6% Financials First American Financial Corp 0.26% 5.7% 48.2% Financials
Wells Fargo & Co 1.24% -8.1% 1.6% Financials Casey's General Stores Inc 0.24% 7.7% 44.9% Consumer Staples
JPMorgan Chase & Co 1.17% -9.4% 3.9% Financials Maximus Inc 0.24% -9.3% 48.9% Information Technology
AT&T Inc 1.02% -7.0% -2.3% Telecommunication Services West Pharmaceutical Services Inc 0.24% -6.7% 21.9% Health Care
Procter & Gamble Co 1.01% -7.3% -11.4% Consumer Staples Team Health Holdings Inc 0.24% -17.3% -6.8% Health Care
Top 10 Performing Stocks (by Quarter) Top 10 Performing Stocks (by Quarter)
Russell 1000 Weight 1-Qtr Return
1-Year Return Sector Russell 2000 Weight 1-Qtr
Return1-Year Return Sector
StanCorp Financial Group Inc 0.02% 51.0% 84.3% Financials GT Advanced Technologies Inc 0.00% 135.7% -96.3% Information Technology
TECO Energy Inc 0.03% 50.2% 58.0% Utilities NTELOS Holdings Corp 0.01% 95.5% -15.1% Telecommunication Services
Pandora Media Inc 0.02% 37.3% -11.7% Information Technology Phoenix Companies Inc 0.00% 80.9% -41.2% Financials
Cablevision Systems Corp Class A 0.03% 36.4% 90.7% Consumer Discretionary Trevena Inc 0.02% 65.3% 61.2% Health Care
zulily Inc Class A 0.00% 33.4% -54.1% Consumer Discretionary Dot Hill Systems Corp 0.04% 59.0% 157.4% Information Technology
AGL Resources Inc 0.04% 32.5% 23.7% Utilities Anacor Pharmaceuticals Inc 0.29% 52.0% 381.0% Health Care
Chubb Corp 0.15% 29.5% 37.5% Financials Exelixis Inc 0.08% 49.2% 266.7% Health Care
Activision Blizzard Inc 0.08% 27.6% 50.1% Information Technology Merge Healthcare Inc 0.03% 47.9% 222.7% Health Care
Con-way Inc 0.00% 24.2% 1.3% Industrials HHGregg Inc 0.00% 45.8% -22.8% Consumer Discretionary
JetBlue Airways Corp 0.04% 24.1% 142.7% Industrials Thoratec Corp 0.21% 41.9% 136.7% Health Care
Bottom 10 Performing Stocks (by Quarter) Bottom 10 Performing Stocks (by Quarter)
Russell 1000 Weight 1-Qtr Return
1-Year Return Sector Russell 2000 Weight 1-Qtr
Return1-Year Return Sector
SunEdison Inc 0.01% -76.0% -62.0% Information Technology Quiksilver Inc 0.00% -97.0% -98.9% Consumer Discretionary
SandRidge Energy Inc 0.00% -69.2% -93.7% Energy RCS Capital Corp Class A 0.00% -89.4% -96.4% Financials
Seventy Seven Energy Inc 0.00% -67.8% -94.2% Energy Alpha Natural Resources Inc 0.00% -89.1% -98.7% Energy
TimkenSteel Corp 0.00% -62.2% -77.7% Materials BPZ Resources Inc 0.00% -88.8% -99.9% Energy
TerraForm Power Inc Class A 0.00% -62.0% -48.9% Utilities SFX Entertainment Inc 0.00% -88.6% -89.8% Consumer Discretionary
Rayonier Advanced Materials Inc 0.00% -61.9% -81.0% Materials Penn Virginia Corp 0.00% -87.9% -95.8% Energy
Denbury Resources Inc 0.00% -61.0% -83.1% Energy Vantage Drilling Co 0.00% -86.5% -98.0% Energy
The Chemours Co 0.01% -59.6% N/A Materials Tetraphase Pharmaceuticals Inc 0.02% -84.3% -62.6% Health Care
EP Energy Corp Class A 0.00% -59.5% -70.5% Energy Altisource Asset Management Corp 0.00% -83.4% -96.5% Financials
Unit Corp 0.00% -58.5% -80.8% Energy Magnum Hunter Resources Corporation 0.00% -81.8% -93.9% Energy
5
Source: MSCI Global Index Monitor (Returns are Net)
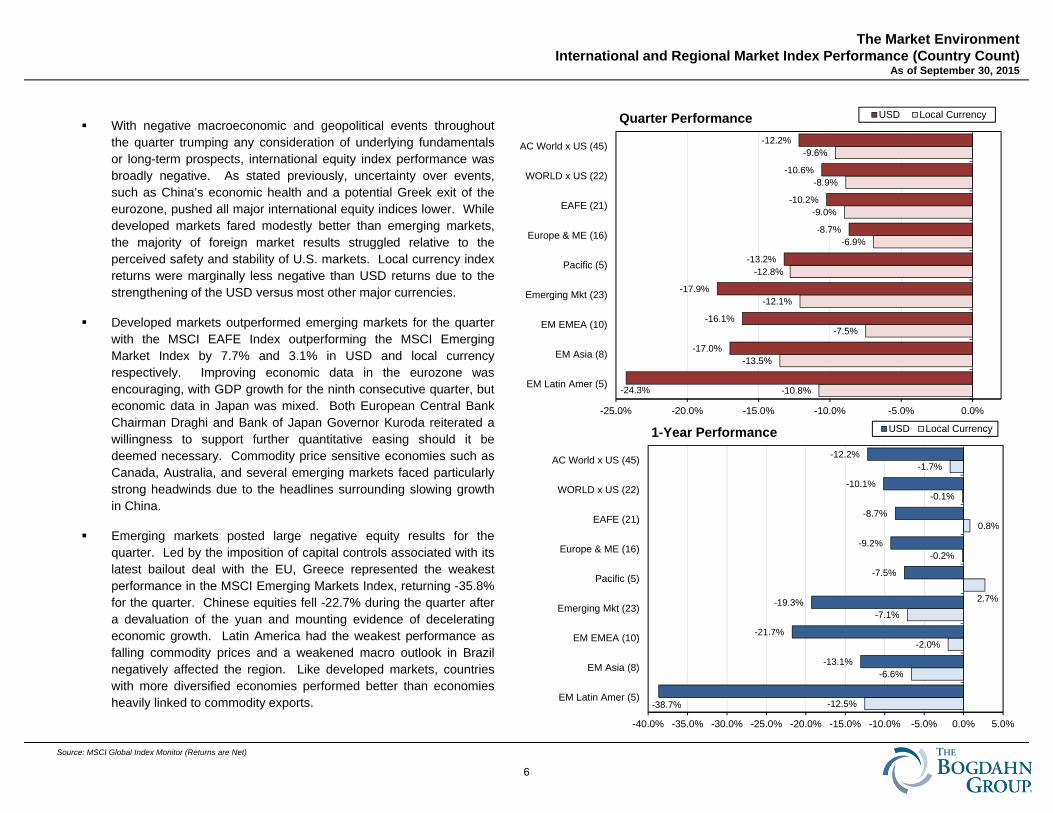
With negative macroeconomic and geopolitical events throughoutthe quarter trumping any consideration of underlying fundamentalsor long-term prospects, international equity index performance wasbroadly negative. As stated previously, uncertainty over events,such as China’s economic health and a potential Greek exit of theeurozone, pushed all major international equity indices lower. Whiledeveloped markets fared modestly better than emerging markets,the majority of foreign market results struggled relative to theperceived safety and stability of U.S. markets. Local currency indexreturns were marginally less negative than USD returns due to thestrengthening of the USD versus most other major currencies.
Developed markets outperformed emerging markets for the quarterwith the MSCI EAFE Index outperforming the MSCI EmergingMarket Index by 7.7% and 3.1% in USD and local currencyrespectively. Improving economic data in the eurozone wasencouraging, with GDP growth for the ninth consecutive quarter, buteconomic data in Japan was mixed. Both European Central BankChairman Draghi and Bank of Japan Governor Kuroda reiterated awillingness to support further quantitative easing should it bedeemed necessary. Commodity price sensitive economies such asCanada, Australia, and several emerging markets faced particularlystrong headwinds due to the headlines surrounding slowing growthin China.
Emerging markets posted large negative equity results for thequarter. Led by the imposition of capital controls associated with itslatest bailout deal with the EU, Greece represented the weakestperformance in the MSCI Emerging Markets Index, returning -35.8%for the quarter. Chinese equities fell -22.7% during the quarter aftera devaluation of the yuan and mounting evidence of deceleratingeconomic growth. Latin America had the weakest performance asfalling commodity prices and a weakened macro outlook in Brazilnegatively affected the region. Like developed markets, countrieswith more diversified economies performed better than economiesheavily linked to commodity exports.
The Market EnvironmentInternational and Regional Market Index Performance (Country Count)
As of September 30, 2015
-10.8%
-13.5%
-7.5%
-12.1%
-12.8%
-6.9%
-9.0%
-8.9%
-9.6%
-24.3%
-17.0%
-16.1%
-17.9%
-13.2%
-8.7%
-10.2%
-10.6%
-12.2%
-25.0% -20.0% -15.0% -10.0% -5.0% 0.0%
EM Latin Amer (5)
EM Asia (8)
EM EMEA (10)
Emerging Mkt (23)
Pacific (5)
Europe & ME (16)
EAFE (21)
WORLD x US (22)
AC World x US (45)
Quarter Performance USD Local Currency
-12.5%
-6.6%
-2.0%
-7.1%
2.7%
-0.2%
0.8%
-0.1%
-1.7%
-38.7%
-13.1%
-21.7%
-19.3%
-7.5%
-9.2%
-8.7%
-10.1%
-12.2%
-40.0% -35.0% -30.0% -25.0% -20.0% -15.0% -10.0% -5.0% 0.0% 5.0%
EM Latin Amer (5)
EM Asia (8)
EM EMEA (10)
Emerging Mkt (23)
Pacific (5)
Europe & ME (16)
EAFE (21)
WORLD x US (22)
AC World x US (45)
1-Year Performance USD Local Currency
6
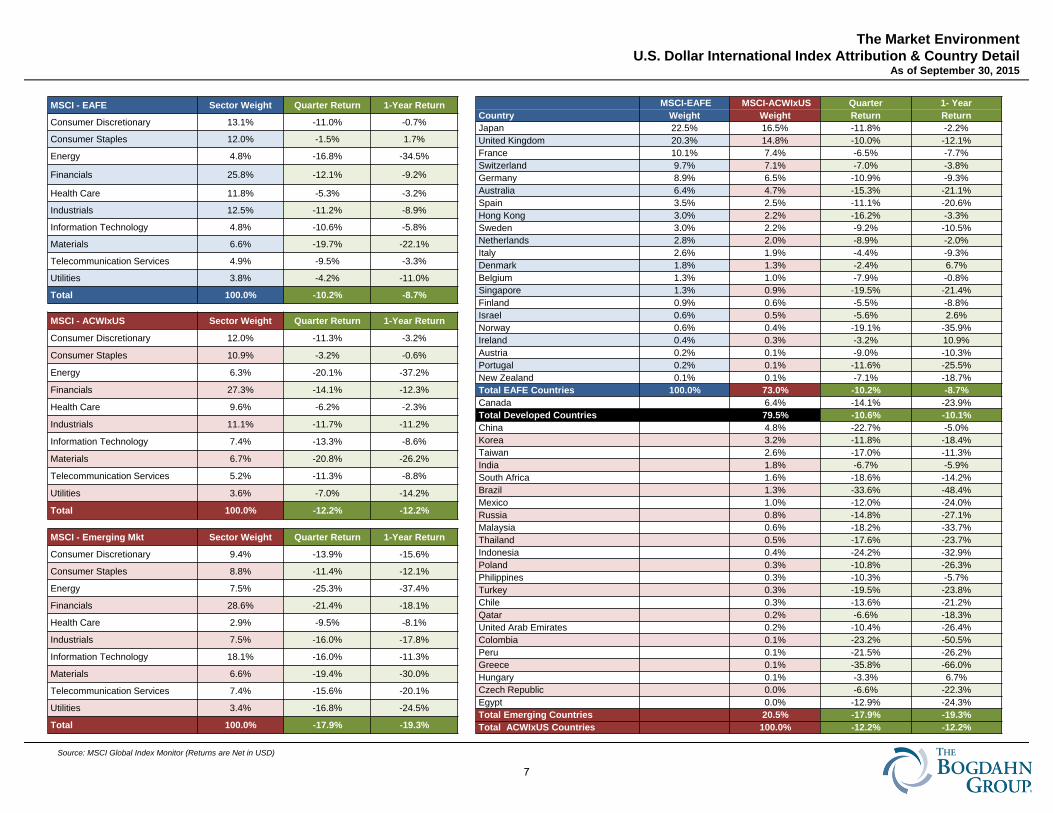
The Market EnvironmentU.S. Dollar International Index Attribution & Country Detail
As of September 30, 2015
Source: MSCI Global Index Monitor (Returns are Net in USD)
MSCI - EAFE Sector Weight Quarter Return 1-Year Return
Consumer Discretionary 13.1% -11.0% -0.7%
Consumer Staples 12.0% -1.5% 1.7%
Energy 4.8% -16.8% -34.5%
Financials 25.8% -12.1% -9.2%
Health Care 11.8% -5.3% -3.2%
Industrials 12.5% -11.2% -8.9%
Information Technology 4.8% -10.6% -5.8%
Materials 6.6% -19.7% -22.1%
Telecommunication Services 4.9% -9.5% -3.3%
Utilities 3.8% -4.2% -11.0%
Total 100.0% -10.2% -8.7%
MSCI - ACWIxUS Sector Weight Quarter Return 1-Year Return
Consumer Discretionary 12.0% -11.3% -3.2%
Consumer Staples 10.9% -3.2% -0.6%
Energy 6.3% -20.1% -37.2%
Financials 27.3% -14.1% -12.3%
Health Care 9.6% -6.2% -2.3%
Industrials 11.1% -11.7% -11.2%
Information Technology 7.4% -13.3% -8.6%
Materials 6.7% -20.8% -26.2%
Telecommunication Services 5.2% -11.3% -8.8%
Utilities 3.6% -7.0% -14.2%
Total 100.0% -12.2% -12.2%
MSCI - Emerging Mkt Sector Weight Quarter Return 1-Year Return
Consumer Discretionary 9.4% -13.9% -15.6%
Consumer Staples 8.8% -11.4% -12.1%
Energy 7.5% -25.3% -37.4%
Financials 28.6% -21.4% -18.1%
Health Care 2.9% -9.5% -8.1%
Industrials 7.5% -16.0% -17.8%
Information Technology 18.1% -16.0% -11.3%
Materials 6.6% -19.4% -30.0%
Telecommunication Services 7.4% -15.6% -20.1%
Utilities 3.4% -16.8% -24.5%
Total 100.0% -17.9% -19.3%
MSCI-EAFE MSCI-ACWIxUS Quarter 1- YearCountry Weight Weight Return ReturnJapan 22.5% 16.5% -11.8% -2.2%United Kingdom 20.3% 14.8% -10.0% -12.1%France 10.1% 7.4% -6.5% -7.7%Switzerland 9.7% 7.1% -7.0% -3.8%Germany 8.9% 6.5% -10.9% -9.3%Australia 6.4% 4.7% -15.3% -21.1%Spain 3.5% 2.5% -11.1% -20.6%Hong Kong 3.0% 2.2% -16.2% -3.3%Sweden 3.0% 2.2% -9.2% -10.5%Netherlands 2.8% 2.0% -8.9% -2.0%Italy 2.6% 1.9% -4.4% -9.3%Denmark 1.8% 1.3% -2.4% 6.7%Belgium 1.3% 1.0% -7.9% -0.8%Singapore 1.3% 0.9% -19.5% -21.4%Finland 0.9% 0.6% -5.5% -8.8%Israel 0.6% 0.5% -5.6% 2.6%Norway 0.6% 0.4% -19.1% -35.9%Ireland 0.4% 0.3% -3.2% 10.9%Austria 0.2% 0.1% -9.0% -10.3%Portugal 0.2% 0.1% -11.6% -25.5%New Zealand 0.1% 0.1% -7.1% -18.7%Total EAFE Countries 100.0% 73.0% -10.2% -8.7%Canada 6.4% -14.1% -23.9%Total Developed Countries 79.5% -10.6% -10.1%China 4.8% -22.7% -5.0%Korea 3.2% -11.8% -18.4%Taiwan 2.6% -17.0% -11.3%India 1.8% -6.7% -5.9%South Africa 1.6% -18.6% -14.2%Brazil 1.3% -33.6% -48.4%Mexico 1.0% -12.0% -24.0%Russia 0.8% -14.8% -27.1%Malaysia 0.6% -18.2% -33.7%Thailand 0.5% -17.6% -23.7%Indonesia 0.4% -24.2% -32.9%Poland 0.3% -10.8% -26.3%Philippines 0.3% -10.3% -5.7%Turkey 0.3% -19.5% -23.8%Chile 0.3% -13.6% -21.2%Qatar 0.2% -6.6% -18.3%United Arab Emirates 0.2% -10.4% -26.4%Colombia 0.1% -23.2% -50.5%Peru 0.1% -21.5% -26.2%Greece 0.1% -35.8% -66.0%Hungary 0.1% -3.3% 6.7%Czech Republic 0.0% -6.6% -22.3%Egypt 0.0% -12.9% -24.3%Total Emerging Countries 20.5% -17.9% -19.3%Total ACWIxUS Countries 100.0% -12.2% -12.2%
7
Source: Barclays Capital Live
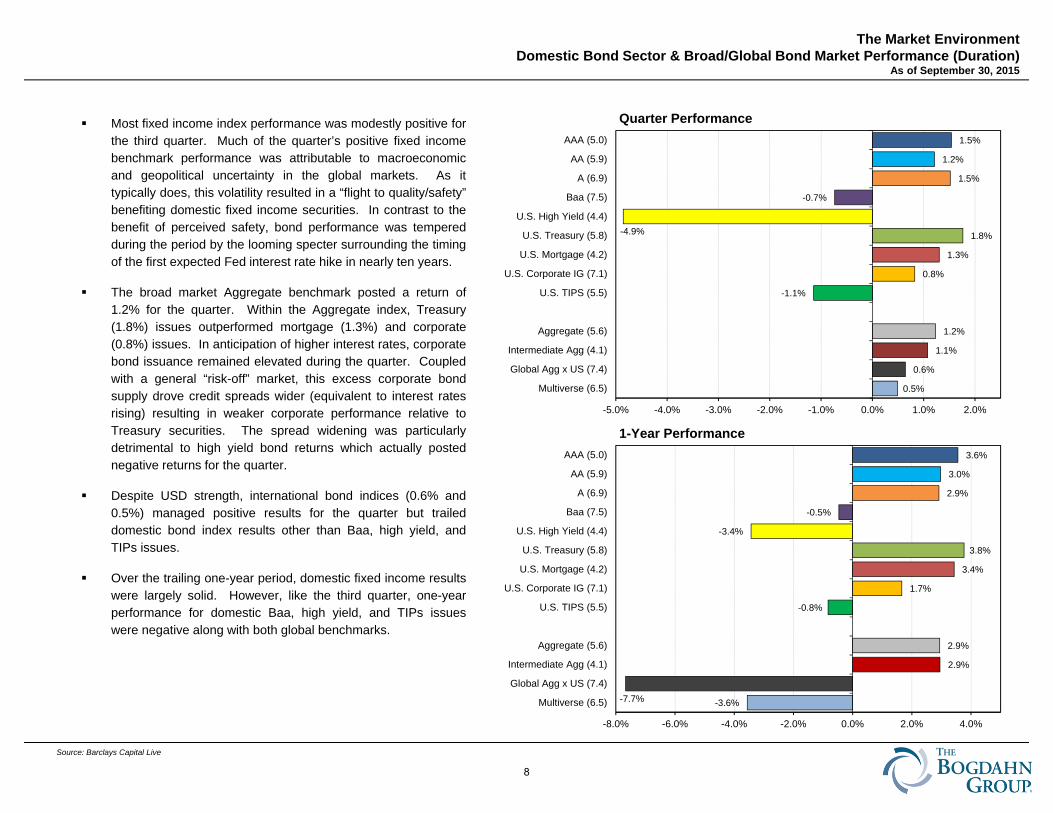
The Market EnvironmentDomestic Bond Sector & Broad/Global Bond Market Performance (Duration)
As of September 30, 2015
Most fixed income index performance was modestly positive forthe third quarter. Much of the quarter’s positive fixed incomebenchmark performance was attributable to macroeconomicand geopolitical uncertainty in the global markets. As ittypically does, this volatility resulted in a “flight to quality/safety”benefiting domestic fixed income securities. In contrast to thebenefit of perceived safety, bond performance was temperedduring the period by the looming specter surrounding the timingof the first expected Fed interest rate hike in nearly ten years.
The broad market Aggregate benchmark posted a return of1.2% for the quarter. Within the Aggregate index, Treasury(1.8%) issues outperformed mortgage (1.3%) and corporate(0.8%) issues. In anticipation of higher interest rates, corporatebond issuance remained elevated during the quarter. Coupledwith a general “risk-off” market, this excess corporate bondsupply drove credit spreads wider (equivalent to interest ratesrising) resulting in weaker corporate performance relative toTreasury securities. The spread widening was particularlydetrimental to high yield bond returns which actually postednegative returns for the quarter.
Despite USD strength, international bond indices (0.6% and0.5%) managed positive results for the quarter but traileddomestic bond index results other than Baa, high yield, andTIPs issues.
Over the trailing one-year period, domestic fixed income resultswere largely solid. However, like the third quarter, one-yearperformance for domestic Baa, high yield, and TIPs issueswere negative along with both global benchmarks.
0.5%
0.6%
1.1%
1.2%
-1.1%
0.8%
1.3%
1.8%-4.9%
-0.7%
1.5%
1.2%
1.5%
-5.0% -4.0% -3.0% -2.0% -1.0% 0.0% 1.0% 2.0%
Multiverse (6.5)
Global Agg x US (7.4)
Intermediate Agg (4.1)
Aggregate (5.6)
U.S. TIPS (5.5)
U.S. Corporate IG (7.1)
U.S. Mortgage (4.2)
U.S. Treasury (5.8)
U.S. High Yield (4.4)
Baa (7.5)
A (6.9)
AA (5.9)
AAA (5.0)
Quarter Performance
-3.6%-7.7%
2.9%
2.9%
-0.8%
1.7%
3.4%
3.8%
-3.4%
-0.5%
2.9%
3.0%
3.6%
-8.0% -6.0% -4.0% -2.0% 0.0% 2.0% 4.0%
Multiverse (6.5)
Global Agg x US (7.4)
Intermediate Agg (4.1)
Aggregate (5.6)
U.S. TIPS (5.5)
U.S. Corporate IG (7.1)
U.S. Mortgage (4.2)
U.S. Treasury (5.8)
U.S. High Yield (4.4)
Baa (7.5)
A (6.9)
AA (5.9)
AAA (5.0)
1-Year Performance
8
Source: US Department of Treasury, FRED (Federal Reserve of St. Louis)
The Market EnvironmentMarket Rate & Yield Curve Comparison
As of September 30, 2015
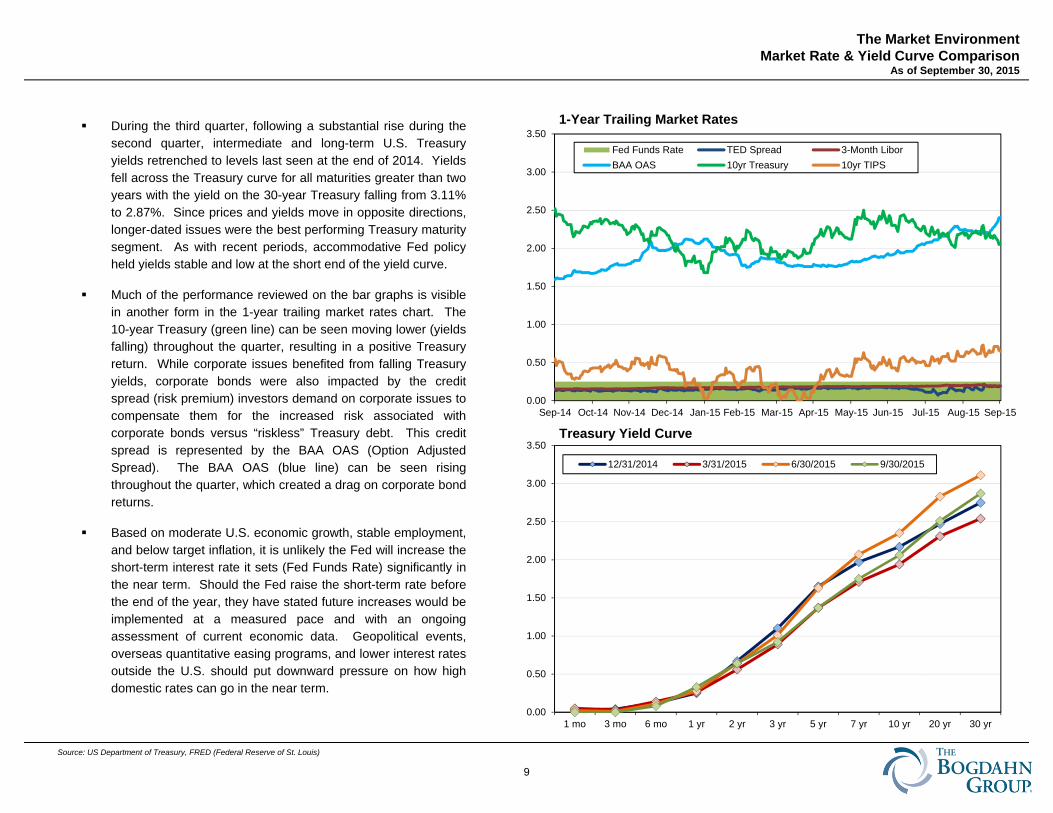
During the third quarter, following a substantial rise during thesecond quarter, intermediate and long-term U.S. Treasuryyields retrenched to levels last seen at the end of 2014. Yieldsfell across the Treasury curve for all maturities greater than twoyears with the yield on the 30-year Treasury falling from 3.11%to 2.87%. Since prices and yields move in opposite directions,longer-dated issues were the best performing Treasury maturitysegment. As with recent periods, accommodative Fed policyheld yields stable and low at the short end of the yield curve.
Much of the performance reviewed on the bar graphs is visiblein another form in the 1-year trailing market rates chart. The10-year Treasury (green line) can be seen moving lower (yieldsfalling) throughout the quarter, resulting in a positive Treasuryreturn. While corporate issues benefited from falling Treasuryyields, corporate bonds were also impacted by the creditspread (risk premium) investors demand on corporate issues tocompensate them for the increased risk associated withcorporate bonds versus “riskless” Treasury debt. This creditspread is represented by the BAA OAS (Option AdjustedSpread). The BAA OAS (blue line) can be seen risingthroughout the quarter, which created a drag on corporate bondreturns.
Based on moderate U.S. economic growth, stable employment,and below target inflation, it is unlikely the Fed will increase theshort-term interest rate it sets (Fed Funds Rate) significantly inthe near term. Should the Fed raise the short-term rate beforethe end of the year, they have stated future increases would beimplemented at a measured pace and with an ongoingassessment of current economic data. Geopolitical events,overseas quantitative easing programs, and lower interest ratesoutside the U.S. should put downward pressure on how highdomestic rates can go in the near term.
0.00
0.50
1.00
1.50
2.00
2.50
3.00
3.50
1 mo 3 mo 6 mo 1 yr 2 yr 3 yr 5 yr 7 yr 10 yr 20 yr 30 yr
Treasury Yield Curve
12/31/2014 3/31/2015 6/30/2015 9/30/2015
0.00
0.50
1.00
1.50
2.00
2.50
3.00
3.50
Sep-14 Oct-14 Nov-14 Dec-14 Jan-15 Feb-15 Mar-15 Apr-15 May-15 Jun-15 Jul-15 Aug-15 Sep-15
1-Year Trailing Market Rates
Fed Funds Rate TED Spread 3-Month LiborBAA OAS 10yr Treasury 10yr TIPS
9
Total Fund Compliance: Yes No N/A
Equity Compliance: Yes No N/A
Fixed Income Compliance: Yes No N/A
Yes No N/A Yes No N/A Yes No N/A Yes No N/A Yes No N/AManager Compliance:
Hollywood Firefighters' Retirement System
Compliance Checklist as of September 30, 2015
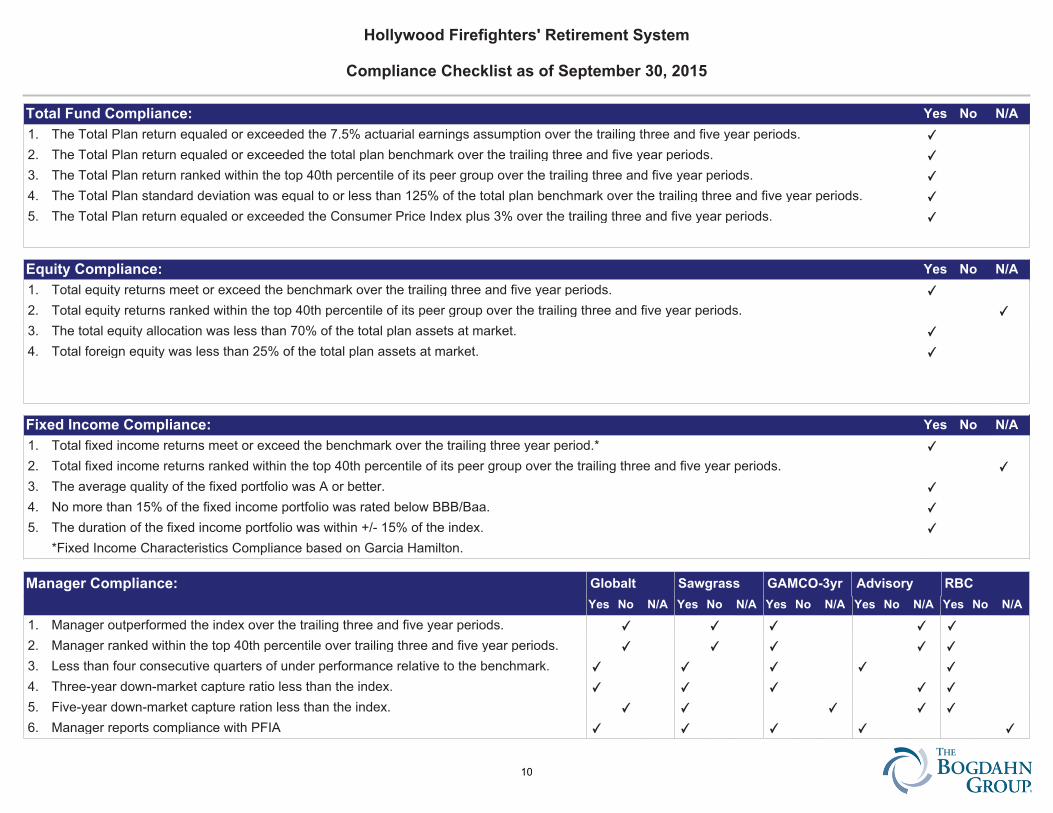
The Total Plan return equaled or exceeded the 7.5% actuarial earnings assumption over the trailing three and five year periods. ✔1.The Total Plan return equaled or exceeded the total plan benchmark over the trailing three and five year periods. ✔2.The Total Plan return ranked within the top 40th percentile of its peer group over the trailing three and five year periods. ✔3.The Total Plan standard deviation was equal to or less than 125% of the total plan benchmark over the trailing three and five year periods. ✔4.The Total Plan return equaled or exceeded the Consumer Price Index plus 3% over the trailing three and five year periods. ✔5.
Total equity returns meet or exceed the benchmark over the trailing three and five year periods. ✔1.Total equity returns ranked within the top 40th percentile of its peer group over the trailing three and five year periods.2. ✔
The total equity allocation was less than 70% of the total plan assets at market. ✔3.Total foreign equity was less than 25% of the total plan assets at market. ✔4.
Total fixed income returns meet or exceed the benchmark over the trailing three year period.* ✔1.Total fixed income returns ranked within the top 40th percentile of its peer group over the trailing three and five year periods.2. ✔
The average quality of the fixed portfolio was A or better. ✔3.No more than 15% of the fixed income portfolio was rated below BBB/Baa. ✔4.The duration of the fixed income portfolio was within +/- 15% of the index. ✔5.*Fixed Income Characteristics Compliance based on Garcia Hamilton.
Manager outperformed the index over the trailing three and five year periods. ✔
Manager ranked within the top 40th percentile over trailing three and five year periods. ✔
Less than four consecutive quarters of under performance relative to the benchmark. ✔
Three-year down-market capture ratio less than the index. ✔
Five-year down-market capture ration less than the index. ✔
Manager reports compliance with PFIA ✔
✔
✔
✔
✔
✔
✔
✔
✔
✔
✔
✔
✔
✔
✔
✔
✔
✔
✔
✔
✔
✔
✔
✔
✔
Globalt Sawgrass
1.2.3.4.5.6.
GAMCO-3yr Advisory RBC
10
Yes No N/A Yes No N/A Yes No N/A Yes No N/A Yes No N/AManager Compliance:
Hollywood Firefighters' Retirement System
Compliance Checklist as of September 30, 2015
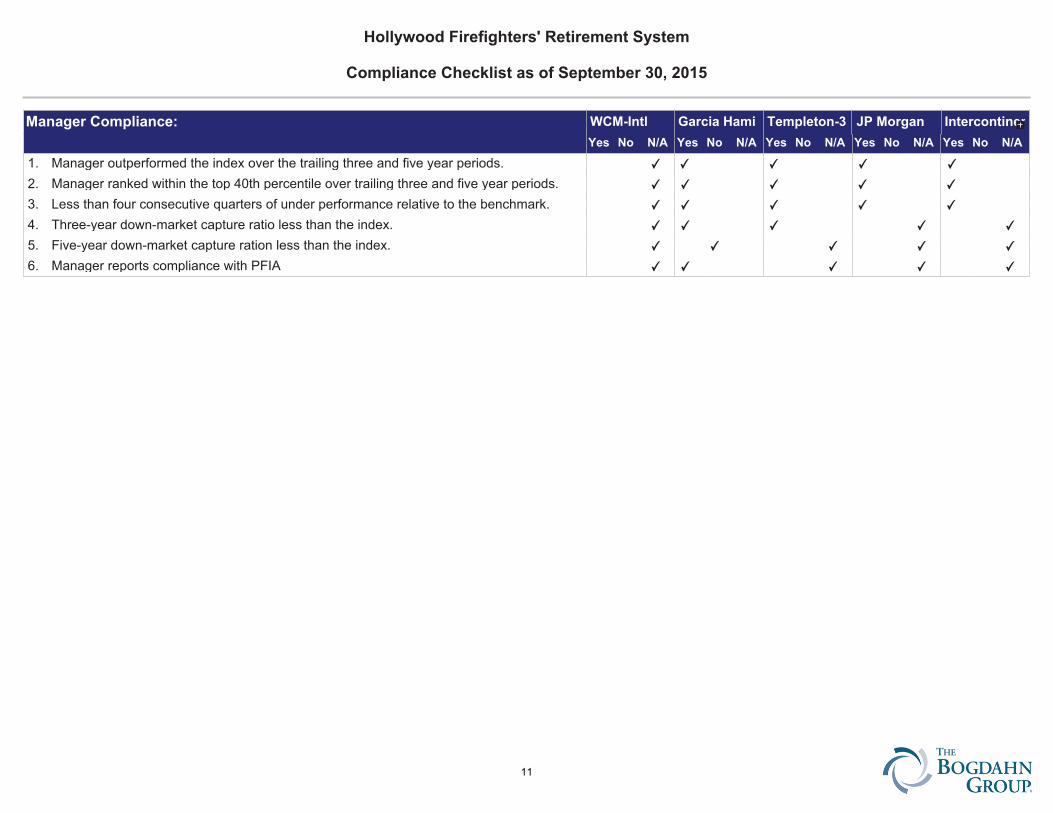
Manager outperformed the index over the trailing three and five year periods. ✔
Manager ranked within the top 40th percentile over trailing three and five year periods. ✔
Less than four consecutive quarters of under performance relative to the benchmark. ✔
Three-year down-market capture ratio less than the index. ✔
Five-year down-market capture ration less than the index. ✔
Manager reports compliance with PFIA ✔
✔
✔
✔
✔
✔
✔
✔
✔
✔
✔
✔
✔
✔
✔
✔
✔
✔
✔
✔
✔
✔
✔
✔
✔
WCM-Intl Garcia Hami
1.2.3.4.5.6.
Templeton-3 JP Morgan Intercontinen
11
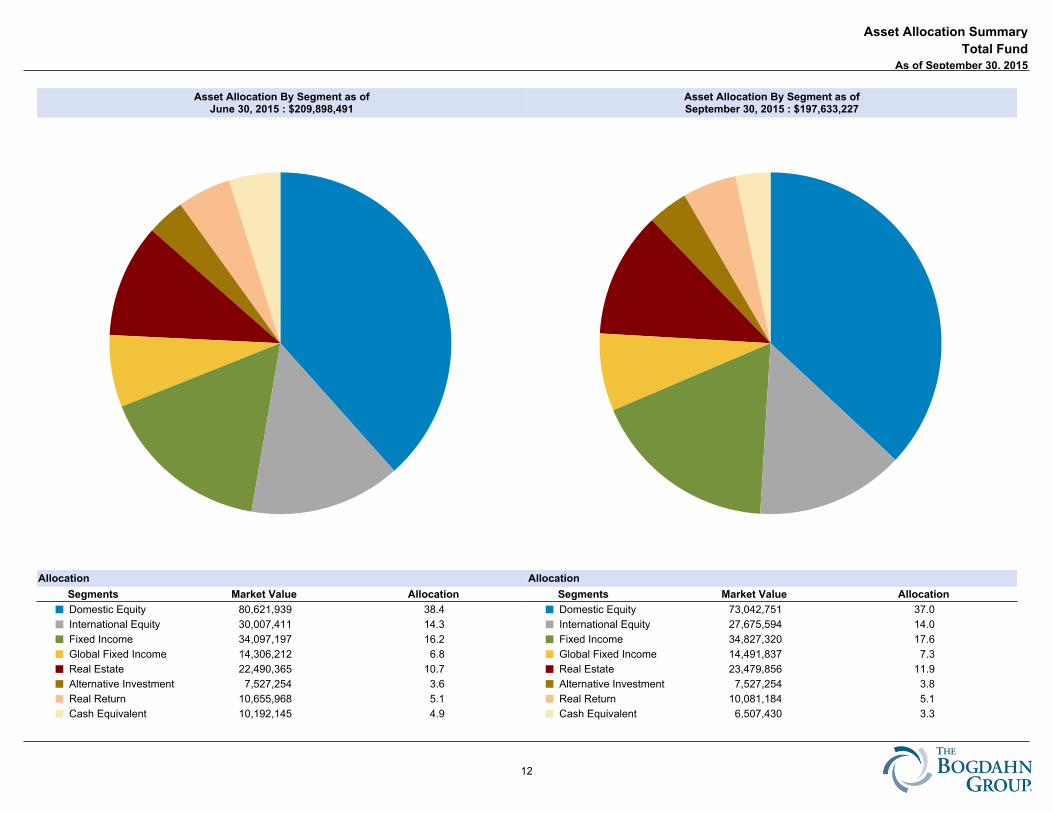
Asset Allocation By Segment as ofJune 30, 2015 : $209,898,491
Asset Allocation By Segment as ofSeptember 30, 2015 : $197,633,227
Allocation
Segments Market Value Allocation
Domestic Equity 80,621,939 38.4¢
International Equity 30,007,411 14.3¢
Fixed Income 34,097,197 16.2¢
Global Fixed Income 14,306,212 6.8¢
Real Estate 22,490,365 10.7¢
Alternative Investment 7,527,254 3.6¢
Real Return 10,655,968 5.1¢
Cash Equivalent 10,192,145 4.9¢
Allocation
Segments Market Value Allocation
Domestic Equity 73,042,751 37.0¢
International Equity 27,675,594 14.0¢
Fixed Income 34,827,320 17.6¢
Global Fixed Income 14,491,837 7.3¢
Real Estate 23,479,856 11.9¢
Alternative Investment 7,527,254 3.8¢
Real Return 10,081,184 5.1¢
Cash Equivalent 6,507,430 3.3¢
Asset Allocation Summary
Total FundAs of September 30, 2015
NONE
12
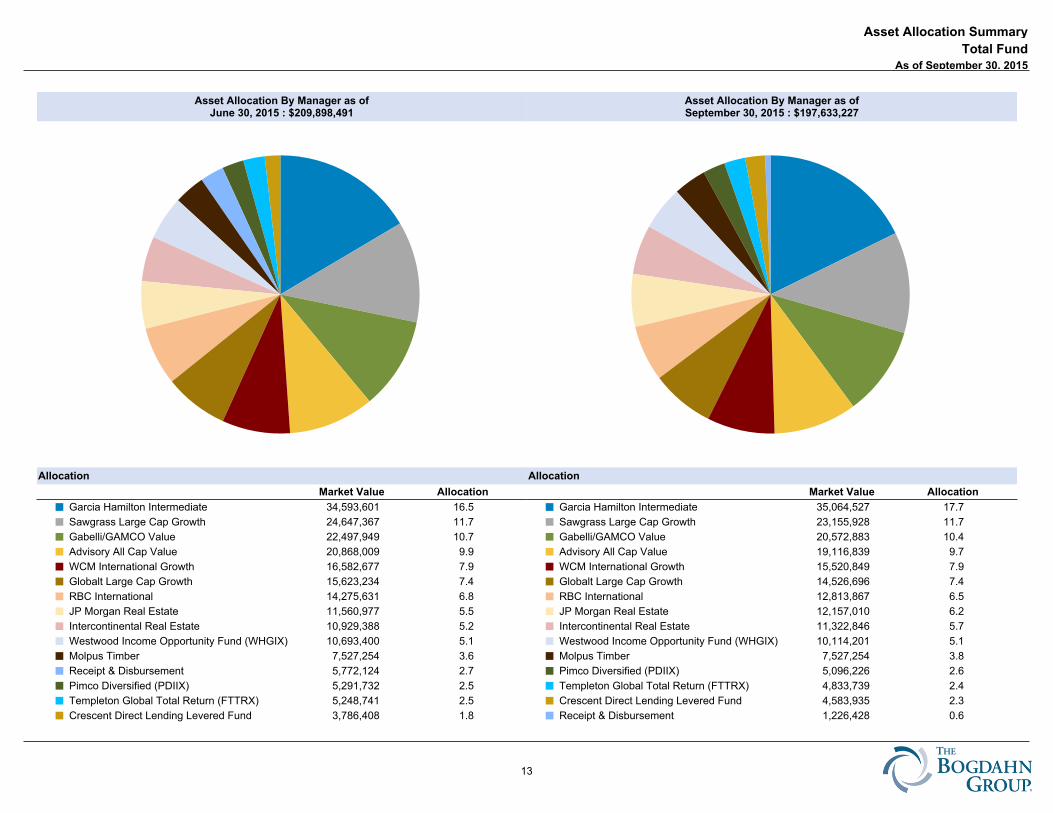
Asset Allocation By Manager as ofJune 30, 2015 : $209,898,491
Asset Allocation By Manager as ofSeptember 30, 2015 : $197,633,227
Allocation
Market Value Allocation
Garcia Hamilton Intermediate 34,593,601 16.5¢
Sawgrass Large Cap Growth 24,647,367 11.7¢
Gabelli/GAMCO Value 22,497,949 10.7¢
Advisory All Cap Value 20,868,009 9.9¢
WCM International Growth 16,582,677 7.9¢
Globalt Large Cap Growth 15,623,234 7.4¢
RBC International 14,275,631 6.8¢
JP Morgan Real Estate 11,560,977 5.5¢
Intercontinental Real Estate 10,929,388 5.2¢
Westwood Income Opportunity Fund (WHGIX) 10,693,400 5.1¢
Molpus Timber 7,527,254 3.6¢
Receipt & Disbursement 5,772,124 2.7¢
Pimco Diversified (PDIIX) 5,291,732 2.5¢
Templeton Global Total Return (FTTRX) 5,248,741 2.5¢
Crescent Direct Lending Levered Fund 3,786,408 1.8¢
Allocation
Market Value Allocation
Garcia Hamilton Intermediate 35,064,527 17.7¢
Sawgrass Large Cap Growth 23,155,928 11.7¢
Gabelli/GAMCO Value 20,572,883 10.4¢
Advisory All Cap Value 19,116,839 9.7¢
WCM International Growth 15,520,849 7.9¢
Globalt Large Cap Growth 14,526,696 7.4¢
RBC International 12,813,867 6.5¢
JP Morgan Real Estate 12,157,010 6.2¢
Intercontinental Real Estate 11,322,846 5.7¢
Westwood Income Opportunity Fund (WHGIX) 10,114,201 5.1¢
Molpus Timber 7,527,254 3.8¢
Pimco Diversified (PDIIX) 5,096,226 2.6¢
Templeton Global Total Return (FTTRX) 4,833,739 2.4¢
Crescent Direct Lending Levered Fund 4,583,935 2.3¢
Receipt & Disbursement 1,226,428 0.6¢
Asset Allocation Summary
Total FundAs of September 30, 2015
NONE
13
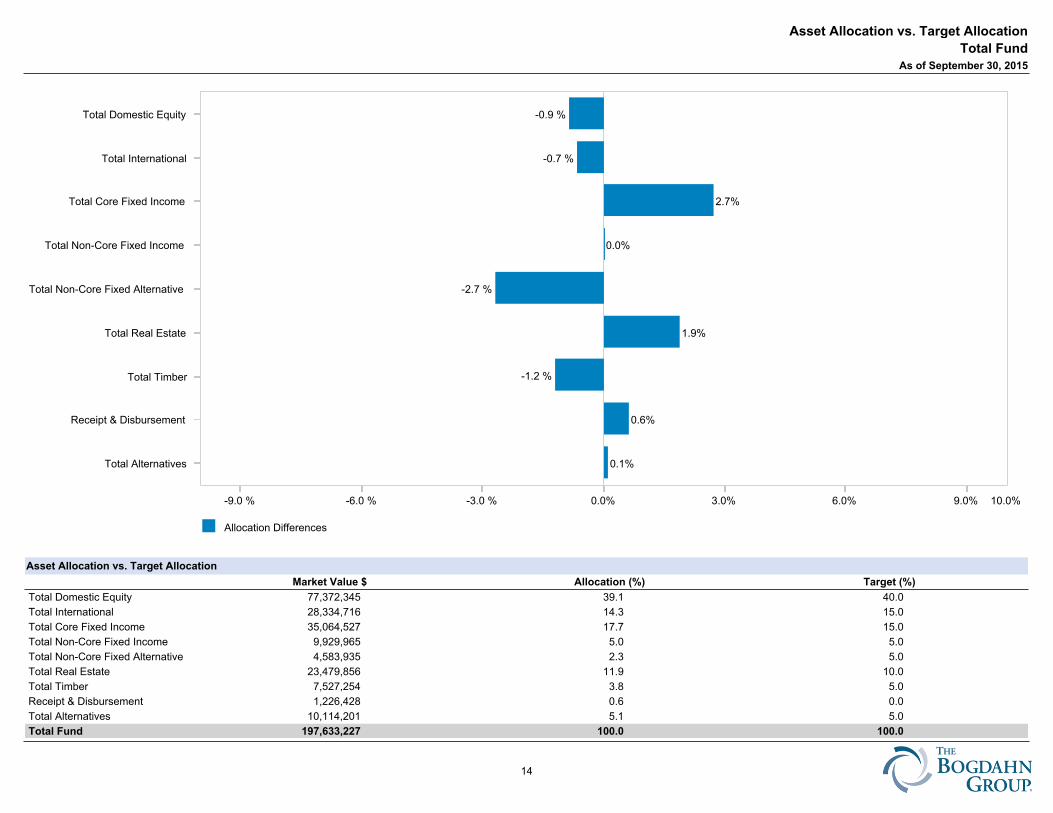
Allocation Differences
0.0% 3.0% 6.0% 9.0% 10.0%-3.0 %-6.0 %-9.0 %
Total Alternatives
Receipt & Disbursement
Total Timber
Total Real Estate
Total Non-Core Fixed Alternative
Total Non-Core Fixed Income
Total Core Fixed Income
Total International
Total Domestic Equity
0.1%
0.6%
-1.2 %
1.9%
-2.7 %
0.0%
2.7%
-0.7 %
-0.9 %
Asset Allocation vs. Target Allocation
Market Value $ Allocation (%) Target (%)
Total Domestic Equity 77,372,345 39.1 40.0
Total International 28,334,716 14.3 15.0
Total Core Fixed Income 35,064,527 17.7 15.0
Total Non-Core Fixed Income 9,929,965 5.0 5.0
Total Non-Core Fixed Alternative 4,583,935 2.3 5.0
Total Real Estate 23,479,856 11.9 10.0
Total Timber 7,527,254 3.8 5.0
Receipt & Disbursement 1,226,428 0.6 0.0
Total Alternatives 10,114,201 5.1 5.0
Total Fund 197,633,227 100.0 100.0
Asset Allocation vs. Target Allocation
Total FundAs of September 30, 2015
14
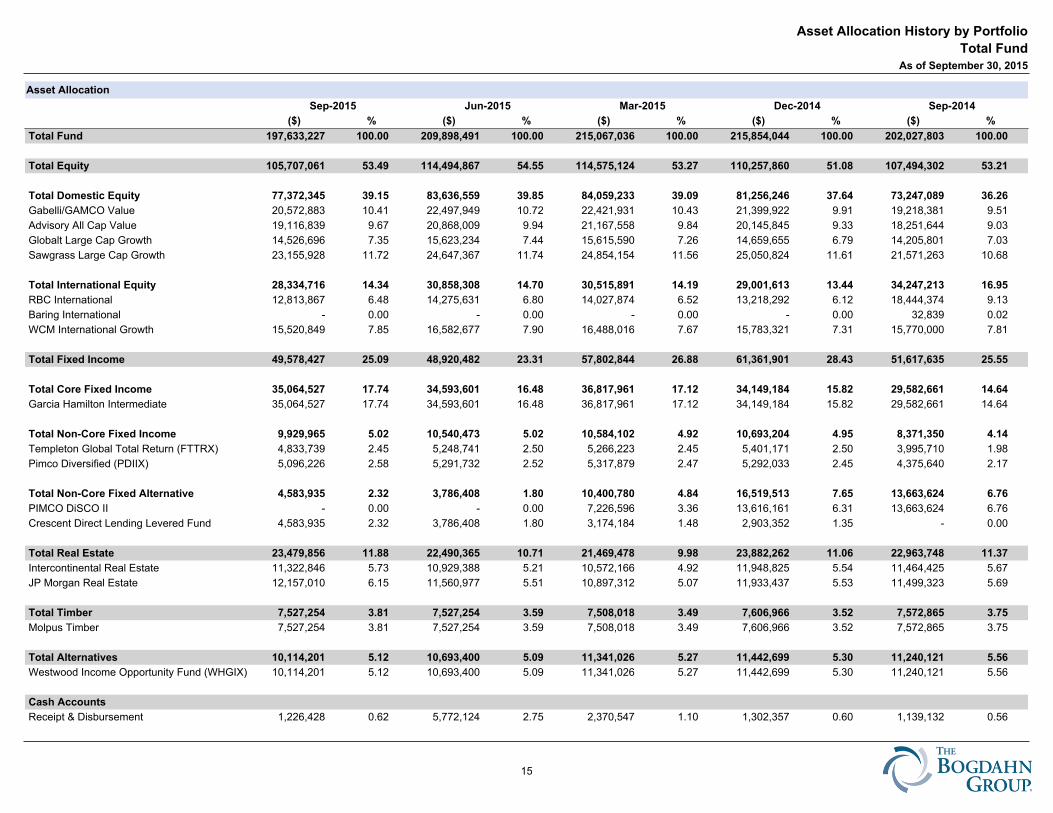
Asset Allocation
Sep-2015 Jun-2015 Mar-2015 Dec-2014 Sep-2014
($) % ($) % ($) % ($) % ($) %
Total Fund 197,633,227 100.00 209,898,491 100.00 215,067,036 100.00 215,854,044 100.00 202,027,803 100.00
Total Equity 105,707,061 53.49 114,494,867 54.55 114,575,124 53.27 110,257,860 51.08 107,494,302 53.21
Total Domestic Equity 77,372,345 39.15 83,636,559 39.85 84,059,233 39.09 81,256,246 37.64 73,247,089 36.26
Gabelli/GAMCO Value 20,572,883 10.41 22,497,949 10.72 22,421,931 10.43 21,399,922 9.91 19,218,381 9.51
Advisory All Cap Value 19,116,839 9.67 20,868,009 9.94 21,167,558 9.84 20,145,845 9.33 18,251,644 9.03
Globalt Large Cap Growth 14,526,696 7.35 15,623,234 7.44 15,615,590 7.26 14,659,655 6.79 14,205,801 7.03
Sawgrass Large Cap Growth 23,155,928 11.72 24,647,367 11.74 24,854,154 11.56 25,050,824 11.61 21,571,263 10.68
Total International Equity 28,334,716 14.34 30,858,308 14.70 30,515,891 14.19 29,001,613 13.44 34,247,213 16.95
RBC International 12,813,867 6.48 14,275,631 6.80 14,027,874 6.52 13,218,292 6.12 18,444,374 9.13
Baring International - 0.00 - 0.00 - 0.00 - 0.00 32,839 0.02
WCM International Growth 15,520,849 7.85 16,582,677 7.90 16,488,016 7.67 15,783,321 7.31 15,770,000 7.81
Total Fixed Income 49,578,427 25.09 48,920,482 23.31 57,802,844 26.88 61,361,901 28.43 51,617,635 25.55
Total Core Fixed Income 35,064,527 17.74 34,593,601 16.48 36,817,961 17.12 34,149,184 15.82 29,582,661 14.64
Garcia Hamilton Intermediate 35,064,527 17.74 34,593,601 16.48 36,817,961 17.12 34,149,184 15.82 29,582,661 14.64
Total Non-Core Fixed Income 9,929,965 5.02 10,540,473 5.02 10,584,102 4.92 10,693,204 4.95 8,371,350 4.14
Templeton Global Total Return (FTTRX) 4,833,739 2.45 5,248,741 2.50 5,266,223 2.45 5,401,171 2.50 3,995,710 1.98
Pimco Diversified (PDIIX) 5,096,226 2.58 5,291,732 2.52 5,317,879 2.47 5,292,033 2.45 4,375,640 2.17
Total Non-Core Fixed Alternative 4,583,935 2.32 3,786,408 1.80 10,400,780 4.84 16,519,513 7.65 13,663,624 6.76
PIMCO DiSCO II - 0.00 - 0.00 7,226,596 3.36 13,616,161 6.31 13,663,624 6.76
Crescent Direct Lending Levered Fund 4,583,935 2.32 3,786,408 1.80 3,174,184 1.48 2,903,352 1.35 - 0.00
Total Real Estate 23,479,856 11.88 22,490,365 10.71 21,469,478 9.98 23,882,262 11.06 22,963,748 11.37
Intercontinental Real Estate 11,322,846 5.73 10,929,388 5.21 10,572,166 4.92 11,948,825 5.54 11,464,425 5.67
JP Morgan Real Estate 12,157,010 6.15 11,560,977 5.51 10,897,312 5.07 11,933,437 5.53 11,499,323 5.69
Total Timber 7,527,254 3.81 7,527,254 3.59 7,508,018 3.49 7,606,966 3.52 7,572,865 3.75
Molpus Timber 7,527,254 3.81 7,527,254 3.59 7,508,018 3.49 7,606,966 3.52 7,572,865 3.75
Total Alternatives 10,114,201 5.12 10,693,400 5.09 11,341,026 5.27 11,442,699 5.30 11,240,121 5.56
Westwood Income Opportunity Fund (WHGIX) 10,114,201 5.12 10,693,400 5.09 11,341,026 5.27 11,442,699 5.30 11,240,121 5.56
Cash Accounts
Receipt & Disbursement 1,226,428 0.62 5,772,124 2.75 2,370,547 1.10 1,302,357 0.60 1,139,132 0.56
Asset Allocation History by Portfolio
Total FundAs of September 30, 2015
15
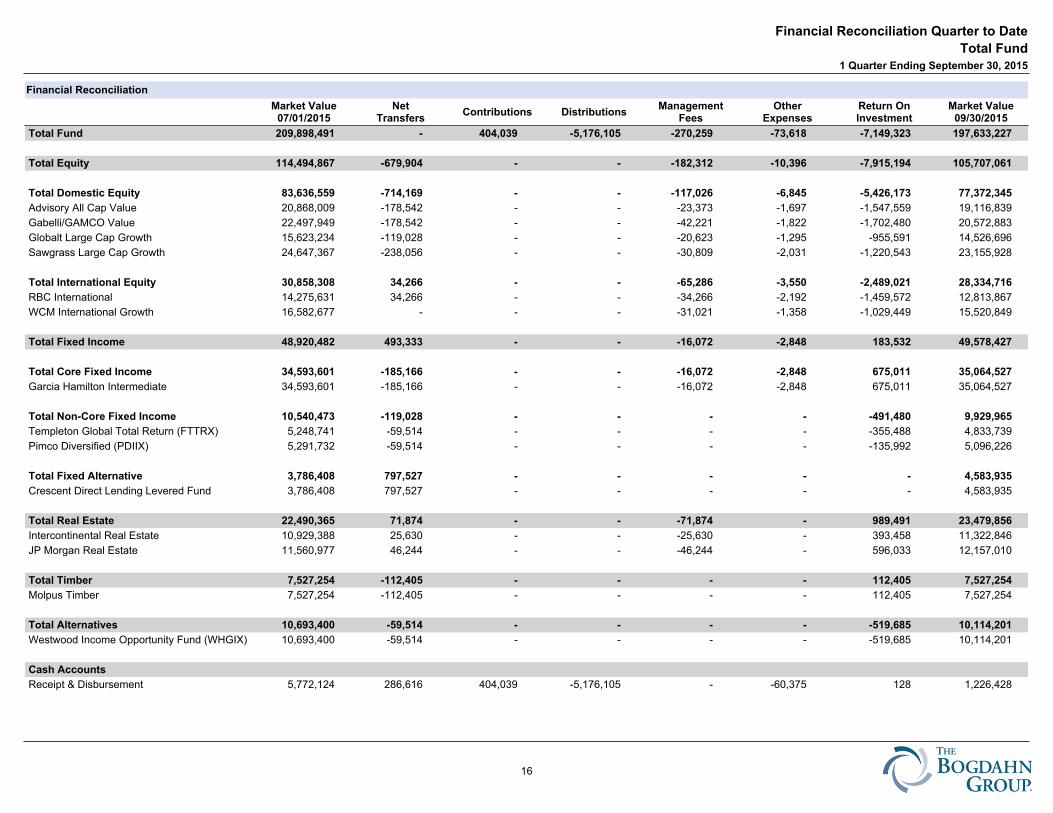
Financial Reconciliation
Market Value07/01/2015
NetTransfers
Contributions DistributionsManagement
FeesOther
ExpensesReturn OnInvestment
Market Value09/30/2015
Total Fund 209,898,491 - 404,039 -5,176,105 -270,259 -73,618 -7,149,323 197,633,227
Total Equity 114,494,867 -679,904 - - -182,312 -10,396 -7,915,194 105,707,061
Total Domestic Equity 83,636,559 -714,169 - - -117,026 -6,845 -5,426,173 77,372,345
Advisory All Cap Value 20,868,009 -178,542 - - -23,373 -1,697 -1,547,559 19,116,839
Gabelli/GAMCO Value 22,497,949 -178,542 - - -42,221 -1,822 -1,702,480 20,572,883
Globalt Large Cap Growth 15,623,234 -119,028 - - -20,623 -1,295 -955,591 14,526,696
Sawgrass Large Cap Growth 24,647,367 -238,056 - - -30,809 -2,031 -1,220,543 23,155,928
Total International Equity 30,858,308 34,266 - - -65,286 -3,550 -2,489,021 28,334,716
RBC International 14,275,631 34,266 - - -34,266 -2,192 -1,459,572 12,813,867
WCM International Growth 16,582,677 - - - -31,021 -1,358 -1,029,449 15,520,849
Total Fixed Income 48,920,482 493,333 - - -16,072 -2,848 183,532 49,578,427
Total Core Fixed Income 34,593,601 -185,166 - - -16,072 -2,848 675,011 35,064,527
Garcia Hamilton Intermediate 34,593,601 -185,166 - - -16,072 -2,848 675,011 35,064,527
Total Non-Core Fixed Income 10,540,473 -119,028 - - - - -491,480 9,929,965
Templeton Global Total Return (FTTRX) 5,248,741 -59,514 - - - - -355,488 4,833,739
Pimco Diversified (PDIIX) 5,291,732 -59,514 - - - - -135,992 5,096,226
Total Fixed Alternative 3,786,408 797,527 - - - - - 4,583,935
Crescent Direct Lending Levered Fund 3,786,408 797,527 - - - - - 4,583,935
Total Real Estate 22,490,365 71,874 - - -71,874 - 989,491 23,479,856
Intercontinental Real Estate 10,929,388 25,630 - - -25,630 - 393,458 11,322,846
JP Morgan Real Estate 11,560,977 46,244 - - -46,244 - 596,033 12,157,010
Total Timber 7,527,254 -112,405 - - - - 112,405 7,527,254
Molpus Timber 7,527,254 -112,405 - - - - 112,405 7,527,254
Total Alternatives 10,693,400 -59,514 - - - - -519,685 10,114,201
Westwood Income Opportunity Fund (WHGIX) 10,693,400 -59,514 - - - - -519,685 10,114,201
Cash Accounts
Receipt & Disbursement 5,772,124 286,616 404,039 -5,176,105 - -60,375 128 1,226,428
Financial Reconciliation Quarter to Date
Total Fund1 Quarter Ending September 30, 2015
16
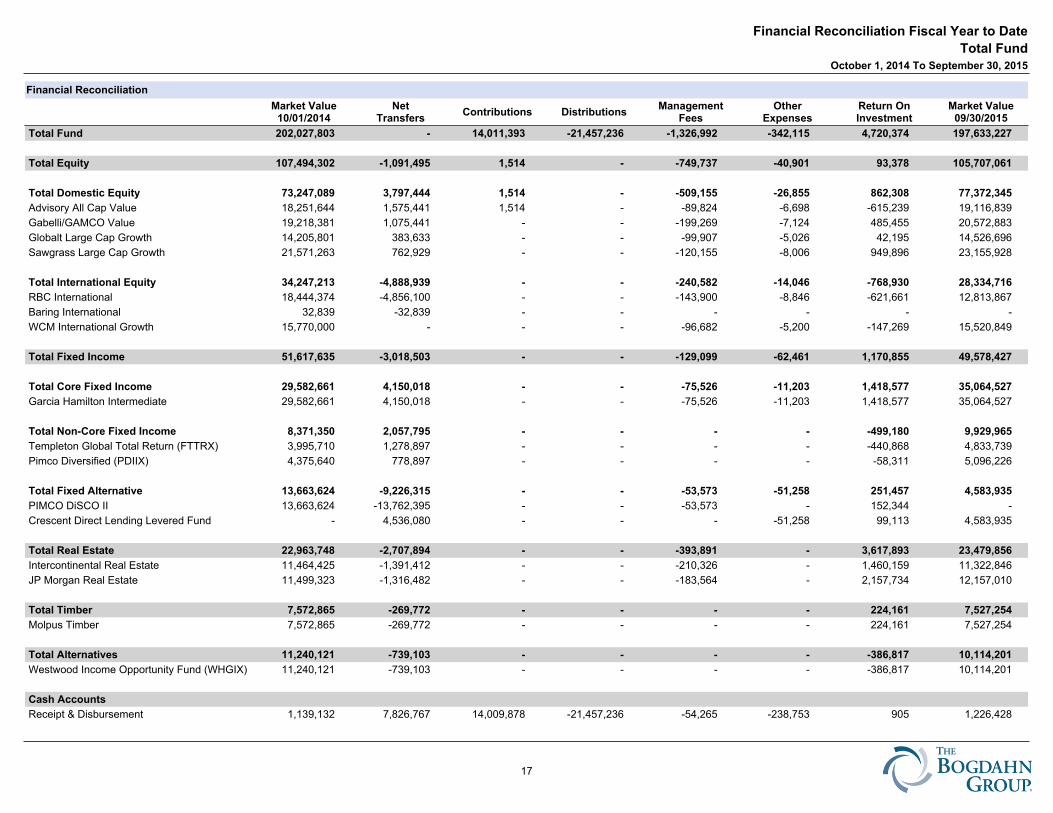
Financial Reconciliation
Market Value10/01/2014
NetTransfers
Contributions DistributionsManagement
FeesOther
ExpensesReturn OnInvestment
Market Value09/30/2015
Total Fund 202,027,803 - 14,011,393 -21,457,236 -1,326,992 -342,115 4,720,374 197,633,227
Total Equity 107,494,302 -1,091,495 1,514 - -749,737 -40,901 93,378 105,707,061
Total Domestic Equity 73,247,089 3,797,444 1,514 - -509,155 -26,855 862,308 77,372,345
Advisory All Cap Value 18,251,644 1,575,441 1,514 - -89,824 -6,698 -615,239 19,116,839
Gabelli/GAMCO Value 19,218,381 1,075,441 - - -199,269 -7,124 485,455 20,572,883
Globalt Large Cap Growth 14,205,801 383,633 - - -99,907 -5,026 42,195 14,526,696
Sawgrass Large Cap Growth 21,571,263 762,929 - - -120,155 -8,006 949,896 23,155,928
Total International Equity 34,247,213 -4,888,939 - - -240,582 -14,046 -768,930 28,334,716
RBC International 18,444,374 -4,856,100 - - -143,900 -8,846 -621,661 12,813,867
Baring International 32,839 -32,839 - - - - - -
WCM International Growth 15,770,000 - - - -96,682 -5,200 -147,269 15,520,849
Total Fixed Income 51,617,635 -3,018,503 - - -129,099 -62,461 1,170,855 49,578,427
Total Core Fixed Income 29,582,661 4,150,018 - - -75,526 -11,203 1,418,577 35,064,527
Garcia Hamilton Intermediate 29,582,661 4,150,018 - - -75,526 -11,203 1,418,577 35,064,527
Total Non-Core Fixed Income 8,371,350 2,057,795 - - - - -499,180 9,929,965
Templeton Global Total Return (FTTRX) 3,995,710 1,278,897 - - - - -440,868 4,833,739
Pimco Diversified (PDIIX) 4,375,640 778,897 - - - - -58,311 5,096,226
Total Fixed Alternative 13,663,624 -9,226,315 - - -53,573 -51,258 251,457 4,583,935
PIMCO DiSCO II 13,663,624 -13,762,395 - - -53,573 - 152,344 -
Crescent Direct Lending Levered Fund - 4,536,080 - - - -51,258 99,113 4,583,935
Total Real Estate 22,963,748 -2,707,894 - - -393,891 - 3,617,893 23,479,856
Intercontinental Real Estate 11,464,425 -1,391,412 - - -210,326 - 1,460,159 11,322,846
JP Morgan Real Estate 11,499,323 -1,316,482 - - -183,564 - 2,157,734 12,157,010
Total Timber 7,572,865 -269,772 - - - - 224,161 7,527,254
Molpus Timber 7,572,865 -269,772 - - - - 224,161 7,527,254
Total Alternatives 11,240,121 -739,103 - - - - -386,817 10,114,201
Westwood Income Opportunity Fund (WHGIX) 11,240,121 -739,103 - - - - -386,817 10,114,201
Cash Accounts
Receipt & Disbursement 1,139,132 7,826,767 14,009,878 -21,457,236 -54,265 -238,753 905 1,226,428
Financial Reconciliation Fiscal Year to Date
Total FundOctober 1, 2014 To September 30, 2015
17
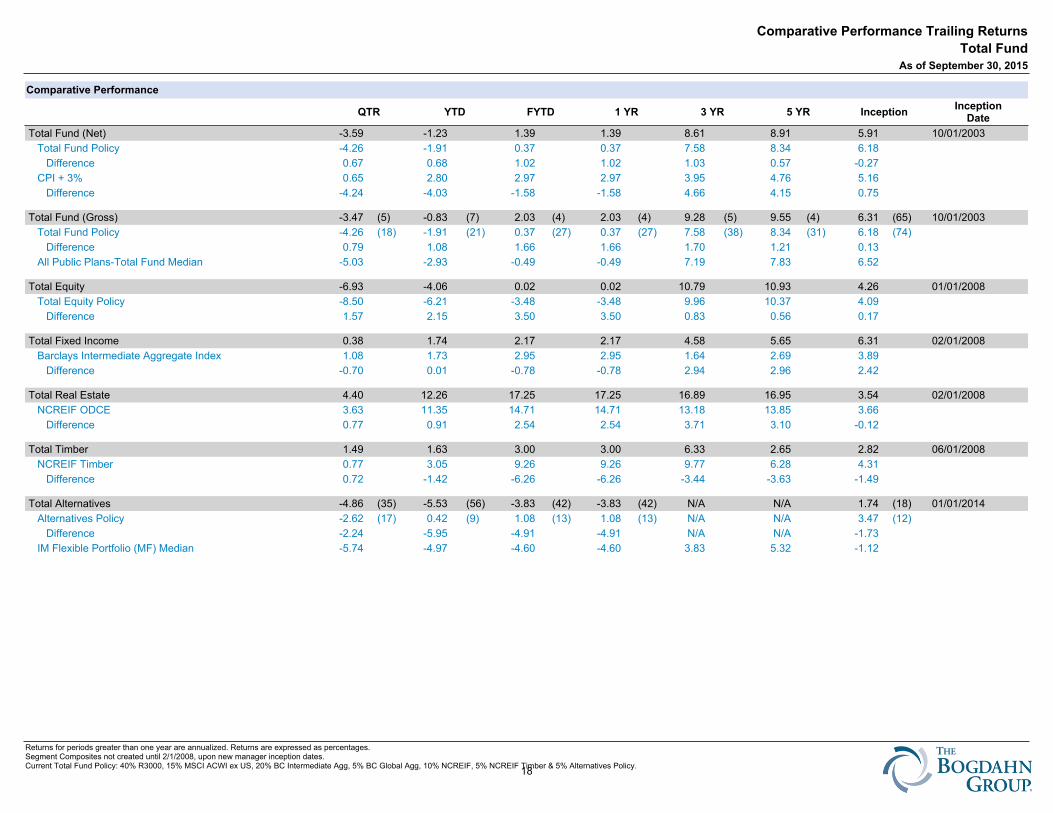
Comparative Performance
QTR YTD FYTD 1 YR 3 YR 5 YR InceptionInception
Date
Total Fund (Net) -3.59 -1.23 1.39 1.39 8.61 8.91 5.91 10/01/2003
Total Fund Policy -4.26 -1.91 0.37 0.37 7.58 8.34 6.18
Difference 0.67 0.68 1.02 1.02 1.03 0.57 -0.27
CPI + 3% 0.65 2.80 2.97 2.97 3.95 4.76 5.16
Difference -4.24 -4.03 -1.58 -1.58 4.66 4.15 0.75
Total Fund (Gross) -3.47 (5) -0.83 (7) 2.03 (4) 2.03 (4) 9.28 (5) 9.55 (4) 6.31 (65) 10/01/2003
Total Fund Policy -4.26 (18) -1.91 (21) 0.37 (27) 0.37 (27) 7.58 (38) 8.34 (31) 6.18 (74)
Difference 0.79 1.08 1.66 1.66 1.70 1.21 0.13
All Public Plans-Total Fund Median -5.03 -2.93 -0.49 -0.49 7.19 7.83 6.52
Total Equity -6.93 -4.06 0.02 0.02 10.79 10.93 4.26 01/01/2008
Total Equity Policy -8.50 -6.21 -3.48 -3.48 9.96 10.37 4.09
Difference 1.57 2.15 3.50 3.50 0.83 0.56 0.17
Total Fixed Income 0.38 1.74 2.17 2.17 4.58 5.65 6.31 02/01/2008
Barclays Intermediate Aggregate Index 1.08 1.73 2.95 2.95 1.64 2.69 3.89
Difference -0.70 0.01 -0.78 -0.78 2.94 2.96 2.42
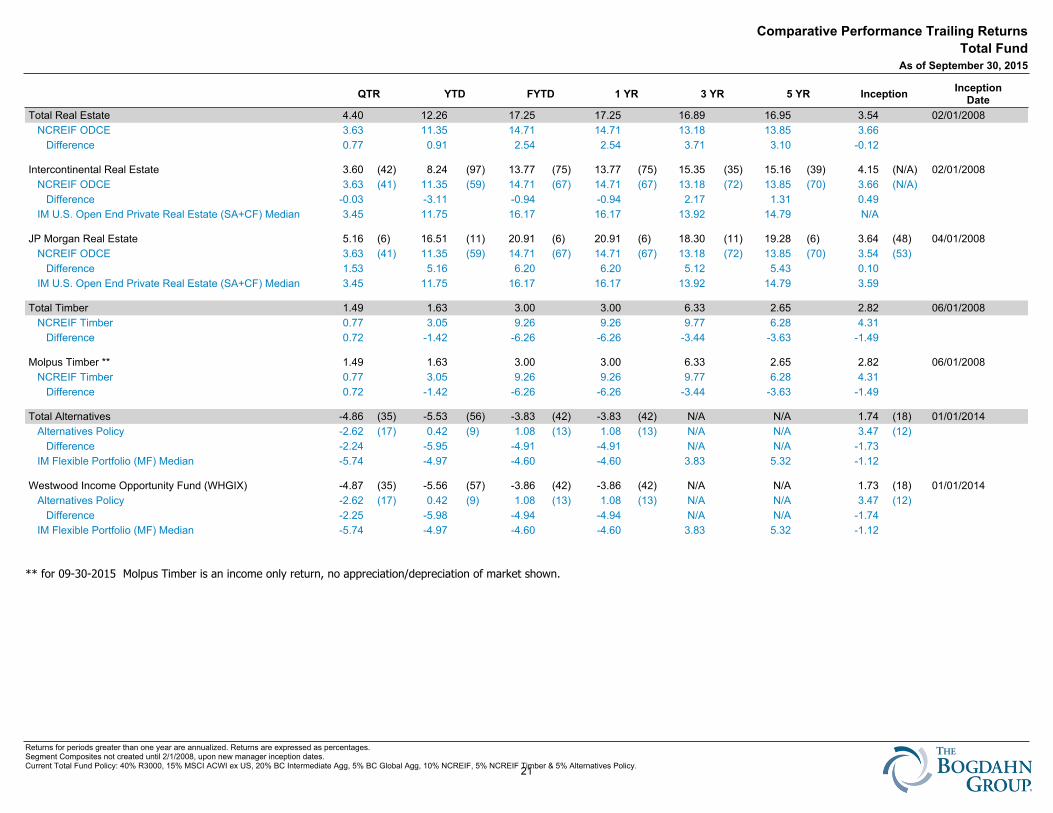
Total Real Estate 4.40 12.26 17.25 17.25 16.89 16.95 3.54 02/01/2008
NCREIF ODCE 3.63 11.35 14.71 14.71 13.18 13.85 3.66
Difference 0.77 0.91 2.54 2.54 3.71 3.10 -0.12
Total Timber 1.49 1.63 3.00 3.00 6.33 2.65 2.82 06/01/2008
NCREIF Timber 0.77 3.05 9.26 9.26 9.77 6.28 4.31
Difference 0.72 -1.42 -6.26 -6.26 -3.44 -3.63 -1.49
Total Alternatives -4.86 (35) -5.53 (56) -3.83 (42) -3.83 (42) N/A N/A 1.74 (18) 01/01/2014
Alternatives Policy -2.62 (17) 0.42 (9) 1.08 (13) 1.08 (13) N/A N/A 3.47 (12)
Difference -2.24 -5.95 -4.91 -4.91 N/A N/A -1.73
IM Flexible Portfolio (MF) Median -5.74 -4.97 -4.60 -4.60 3.83 5.32 -1.12
Comparative Performance Trailing Returns
Total FundAs of September 30, 2015
Returns for periods greater than one year are annualized. Returns are expressed as percentages.Segment Composites not created until 2/1/2008, upon new manager inception dates.Current Total Fund Policy: 40% R3000, 15% MSCI ACWI ex US, 20% BC Intermediate Agg, 5% BC Global Agg, 10% NCREIF, 5% NCREIF Timber & 5% Alternatives Policy.18
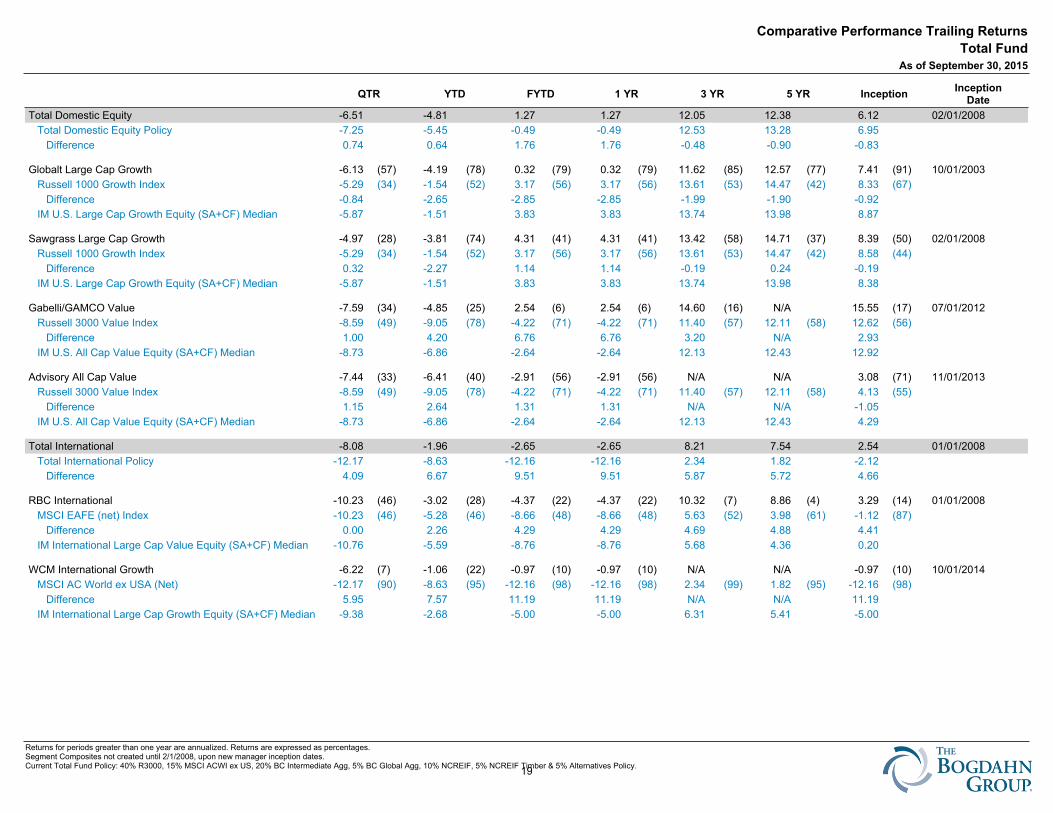
Comparative Performance Trailing Returns
Total FundAs of September 30, 2015
QTR YTD FYTD 1 YR 3 YR 5 YR InceptionInception
Date
Total Domestic Equity -6.51 -4.81 1.27 1.27 12.05 12.38 6.12 02/01/2008
Total Domestic Equity Policy -7.25 -5.45 -0.49 -0.49 12.53 13.28 6.95
Difference 0.74 0.64 1.76 1.76 -0.48 -0.90 -0.83
Globalt Large Cap Growth -6.13 (57) -4.19 (78) 0.32 (79) 0.32 (79) 11.62 (85) 12.57 (77) 7.41 (91) 10/01/2003
Russell 1000 Growth Index -5.29 (34) -1.54 (52) 3.17 (56) 3.17 (56) 13.61 (53) 14.47 (42) 8.33 (67)
Difference -0.84 -2.65 -2.85 -2.85 -1.99 -1.90 -0.92
IM U.S. Large Cap Growth Equity (SA+CF) Median -5.87 -1.51 3.83 3.83 13.74 13.98 8.87
Sawgrass Large Cap Growth -4.97 (28) -3.81 (74) 4.31 (41) 4.31 (41) 13.42 (58) 14.71 (37) 8.39 (50) 02/01/2008
Russell 1000 Growth Index -5.29 (34) -1.54 (52) 3.17 (56) 3.17 (56) 13.61 (53) 14.47 (42) 8.58 (44)
Difference 0.32 -2.27 1.14 1.14 -0.19 0.24 -0.19
IM U.S. Large Cap Growth Equity (SA+CF) Median -5.87 -1.51 3.83 3.83 13.74 13.98 8.38
Gabelli/GAMCO Value -7.59 (34) -4.85 (25) 2.54 (6) 2.54 (6) 14.60 (16) N/A 15.55 (17) 07/01/2012
Russell 3000 Value Index -8.59 (49) -9.05 (78) -4.22 (71) -4.22 (71) 11.40 (57) 12.11 (58) 12.62 (56)
Difference 1.00 4.20 6.76 6.76 3.20 N/A 2.93
IM U.S. All Cap Value Equity (SA+CF) Median -8.73 -6.86 -2.64 -2.64 12.13 12.43 12.92
Advisory All Cap Value -7.44 (33) -6.41 (40) -2.91 (56) -2.91 (56) N/A N/A 3.08 (71) 11/01/2013
Russell 3000 Value Index -8.59 (49) -9.05 (78) -4.22 (71) -4.22 (71) 11.40 (57) 12.11 (58) 4.13 (55)
Difference 1.15 2.64 1.31 1.31 N/A N/A -1.05
IM U.S. All Cap Value Equity (SA+CF) Median -8.73 -6.86 -2.64 -2.64 12.13 12.43 4.29
Total International -8.08 -1.96 -2.65 -2.65 8.21 7.54 2.54 01/01/2008
Total International Policy -12.17 -8.63 -12.16 -12.16 2.34 1.82 -2.12
Difference 4.09 6.67 9.51 9.51 5.87 5.72 4.66
RBC International -10.23 (46) -3.02 (28) -4.37 (22) -4.37 (22) 10.32 (7) 8.86 (4) 3.29 (14) 01/01/2008
MSCI EAFE (net) Index -10.23 (46) -5.28 (46) -8.66 (48) -8.66 (48) 5.63 (52) 3.98 (61) -1.12 (87)
Difference 0.00 2.26 4.29 4.29 4.69 4.88 4.41
IM International Large Cap Value Equity (SA+CF) Median -10.76 -5.59 -8.76 -8.76 5.68 4.36 0.20
WCM International Growth -6.22 (7) -1.06 (22) -0.97 (10) -0.97 (10) N/A N/A -0.97 (10) 10/01/2014
MSCI AC World ex USA (Net) -12.17 (90) -8.63 (95) -12.16 (98) -12.16 (98) 2.34 (99) 1.82 (95) -12.16 (98)
Difference 5.95 7.57 11.19 11.19 N/A N/A 11.19
IM International Large Cap Growth Equity (SA+CF) Median -9.38 -2.68 -5.00 -5.00 6.31 5.41 -5.00
Returns for periods greater than one year are annualized. Returns are expressed as percentages.Segment Composites not created until 2/1/2008, upon new manager inception dates.Current Total Fund Policy: 40% R3000, 15% MSCI ACWI ex US, 20% BC Intermediate Agg, 5% BC Global Agg, 10% NCREIF, 5% NCREIF Timber & 5% Alternatives Policy.19
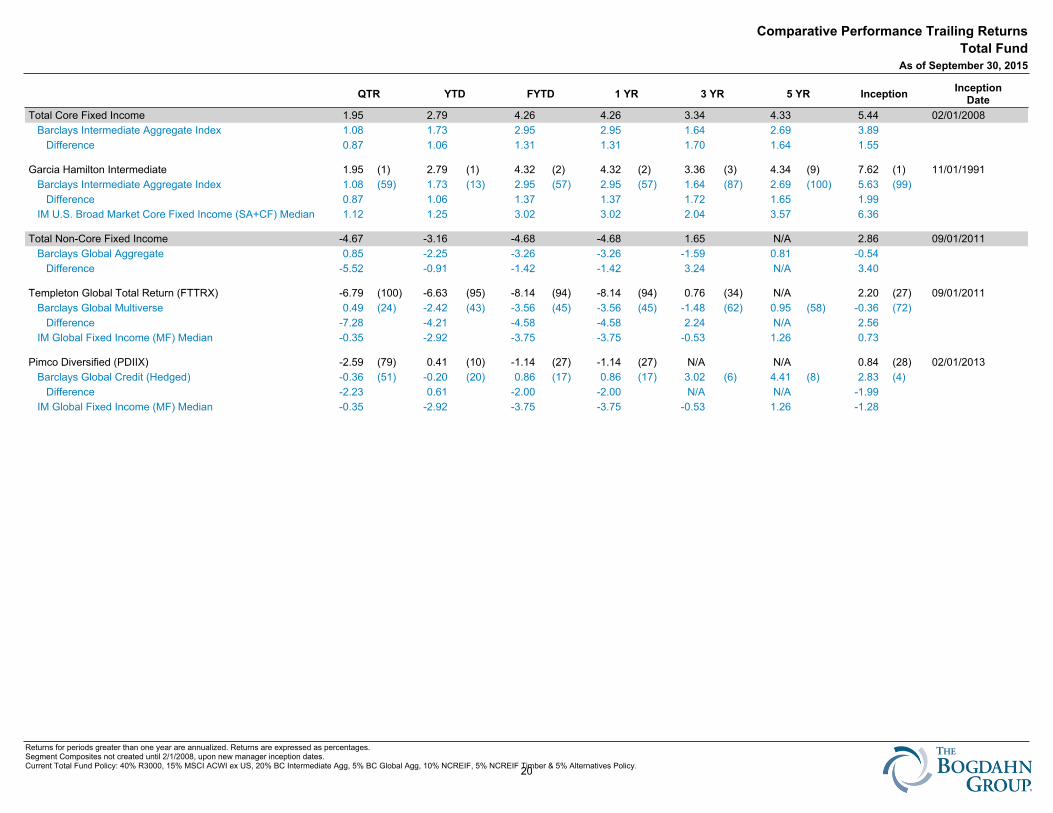
Comparative Performance Trailing Returns
Total FundAs of September 30, 2015
QTR YTD FYTD 1 YR 3 YR 5 YR InceptionInception
Date
Total Core Fixed Income 1.95 2.79 4.26 4.26 3.34 4.33 5.44 02/01/2008
Barclays Intermediate Aggregate Index 1.08 1.73 2.95 2.95 1.64 2.69 3.89
Difference 0.87 1.06 1.31 1.31 1.70 1.64 1.55
Garcia Hamilton Intermediate 1.95 (1) 2.79 (1) 4.32 (2) 4.32 (2) 3.36 (3) 4.34 (9) 7.62 (1) 11/01/1991
Barclays Intermediate Aggregate Index 1.08 (59) 1.73 (13) 2.95 (57) 2.95 (57) 1.64 (87) 2.69 (100) 5.63 (99)
Difference 0.87 1.06 1.37 1.37 1.72 1.65 1.99
IM U.S. Broad Market Core Fixed Income (SA+CF) Median 1.12 1.25 3.02 3.02 2.04 3.57 6.36
Total Non-Core Fixed Income -4.67 -3.16 -4.68 -4.68 1.65 N/A 2.86 09/01/2011
Barclays Global Aggregate 0.85 -2.25 -3.26 -3.26 -1.59 0.81 -0.54
Difference -5.52 -0.91 -1.42 -1.42 3.24 N/A 3.40
Templeton Global Total Return (FTTRX) -6.79 (100) -6.63 (95) -8.14 (94) -8.14 (94) 0.76 (34) N/A 2.20 (27) 09/01/2011
Barclays Global Multiverse 0.49 (24) -2.42 (43) -3.56 (45) -3.56 (45) -1.48 (62) 0.95 (58) -0.36 (72)
Difference -7.28 -4.21 -4.58 -4.58 2.24 N/A 2.56
IM Global Fixed Income (MF) Median -0.35 -2.92 -3.75 -3.75 -0.53 1.26 0.73
Pimco Diversified (PDIIX) -2.59 (79) 0.41 (10) -1.14 (27) -1.14 (27) N/A N/A 0.84 (28) 02/01/2013
Barclays Global Credit (Hedged) -0.36 (51) -0.20 (20) 0.86 (17) 0.86 (17) 3.02 (6) 4.41 (8) 2.83 (4)
Difference -2.23 0.61 -2.00 -2.00 N/A N/A -1.99
IM Global Fixed Income (MF) Median -0.35 -2.92 -3.75 -3.75 -0.53 1.26 -1.28
Returns for periods greater than one year are annualized. Returns are expressed as percentages.Segment Composites not created until 2/1/2008, upon new manager inception dates.Current Total Fund Policy: 40% R3000, 15% MSCI ACWI ex US, 20% BC Intermediate Agg, 5% BC Global Agg, 10% NCREIF, 5% NCREIF Timber & 5% Alternatives Policy.20
Comparative Performance Trailing Returns
Total FundAs of September 30, 2015
QTR YTD FYTD 1 YR 3 YR 5 YR InceptionInception
Date
Total Real Estate 4.40 12.26 17.25 17.25 16.89 16.95 3.54 02/01/2008
NCREIF ODCE 3.63 11.35 14.71 14.71 13.18 13.85 3.66
Difference 0.77 0.91 2.54 2.54 3.71 3.10 -0.12
Intercontinental Real Estate 3.60 (42) 8.24 (97) 13.77 (75) 13.77 (75) 15.35 (35) 15.16 (39) 4.15 (N/A) 02/01/2008
NCREIF ODCE 3.63 (41) 11.35 (59) 14.71 (67) 14.71 (67) 13.18 (72) 13.85 (70) 3.66 (N/A)
Difference -0.03 -3.11 -0.94 -0.94 2.17 1.31 0.49
IM U.S. Open End Private Real Estate (SA+CF) Median 3.45 11.75 16.17 16.17 13.92 14.79 N/A
JP Morgan Real Estate 5.16 (6) 16.51 (11) 20.91 (6) 20.91 (6) 18.30 (11) 19.28 (6) 3.64 (48) 04/01/2008
NCREIF ODCE 3.63 (41) 11.35 (59) 14.71 (67) 14.71 (67) 13.18 (72) 13.85 (70) 3.54 (53)
Difference 1.53 5.16 6.20 6.20 5.12 5.43 0.10
IM U.S. Open End Private Real Estate (SA+CF) Median 3.45 11.75 16.17 16.17 13.92 14.79 3.59
Total Timber 1.49 1.63 3.00 3.00 6.33 2.65 2.82 06/01/2008
NCREIF Timber 0.77 3.05 9.26 9.26 9.77 6.28 4.31
Difference 0.72 -1.42 -6.26 -6.26 -3.44 -3.63 -1.49
Molpus Timber ** 1.49 1.63 3.00 3.00 6.33 2.65 2.82 06/01/2008
NCREIF Timber 0.77 3.05 9.26 9.26 9.77 6.28 4.31
Difference 0.72 -1.42 -6.26 -6.26 -3.44 -3.63 -1.49
Total Alternatives -4.86 (35) -5.53 (56) -3.83 (42) -3.83 (42) N/A N/A 1.74 (18) 01/01/2014
Alternatives Policy -2.62 (17) 0.42 (9) 1.08 (13) 1.08 (13) N/A N/A 3.47 (12)
Difference -2.24 -5.95 -4.91 -4.91 N/A N/A -1.73
IM Flexible Portfolio (MF) Median -5.74 -4.97 -4.60 -4.60 3.83 5.32 -1.12
Westwood Income Opportunity Fund (WHGIX) -4.87 (35) -5.56 (57) -3.86 (42) -3.86 (42) N/A N/A 1.73 (18) 01/01/2014
Alternatives Policy -2.62 (17) 0.42 (9) 1.08 (13) 1.08 (13) N/A N/A 3.47 (12)
Difference -2.25 -5.98 -4.94 -4.94 N/A N/A -1.74
IM Flexible Portfolio (MF) Median -5.74 -4.97 -4.60 -4.60 3.83 5.32 -1.12
** for 09-30-2015 Molpus Timber is an income only return, no appreciation/depreciation of market shown.
Returns for periods greater than one year are annualized. Returns are expressed as percentages.Segment Composites not created until 2/1/2008, upon new manager inception dates.Current Total Fund Policy: 40% R3000, 15% MSCI ACWI ex US, 20% BC Intermediate Agg, 5% BC Global Agg, 10% NCREIF, 5% NCREIF Timber & 5% Alternatives Policy.21
Comparative Performance
FYTDOct-2013
ToSep-2014
Oct-2012To
Sep-2013
Oct-2011To
Sep-2012
Oct-2010To
Sep-2011
Oct-2009To
Sep-2010
Oct-2008To
Sep-2009
Oct-2007To
Sep-2008
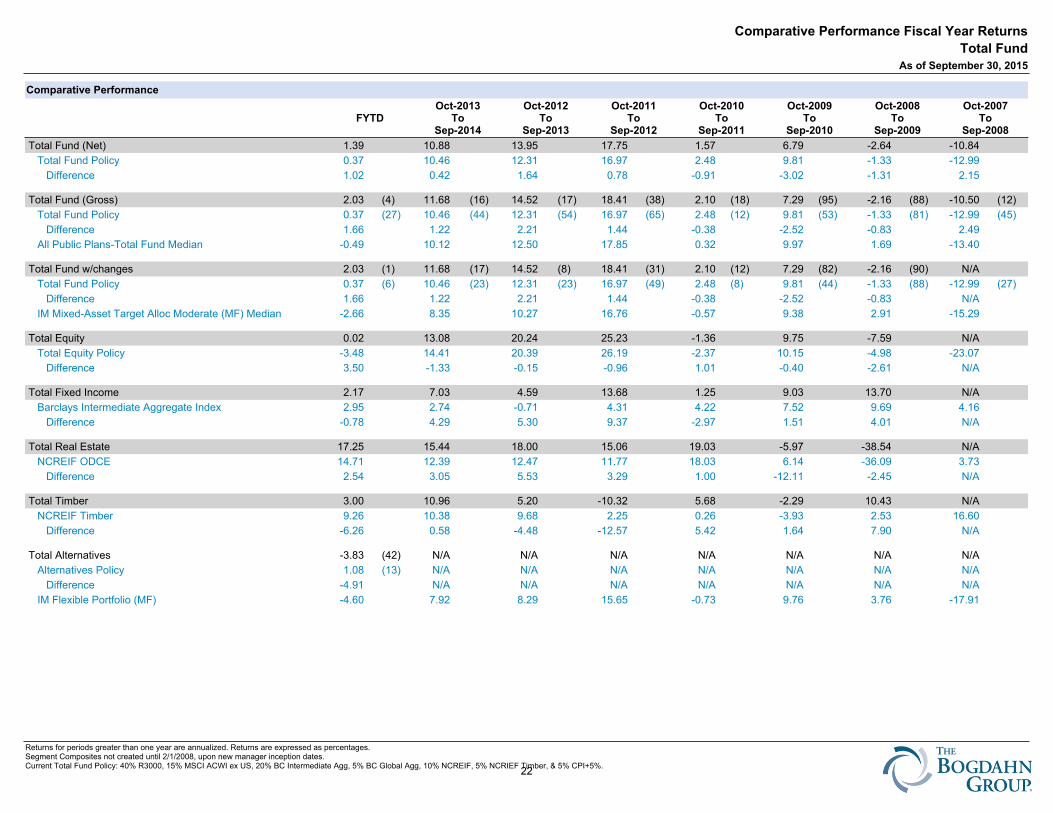
Total Fund (Net) 1.39 10.88 13.95 17.75 1.57 6.79 -2.64 -10.84
Total Fund Policy 0.37 10.46 12.31 16.97 2.48 9.81 -1.33 -12.99
Difference 1.02 0.42 1.64 0.78 -0.91 -3.02 -1.31 2.15
Total Fund (Gross) 2.03 (4) 11.68 (16) 14.52 (17) 18.41 (38) 2.10 (18) 7.29 (95) -2.16 (88) -10.50 (12)
Total Fund Policy 0.37 (27) 10.46 (44) 12.31 (54) 16.97 (65) 2.48 (12) 9.81 (53) -1.33 (81) -12.99 (45)
Difference 1.66 1.22 2.21 1.44 -0.38 -2.52 -0.83 2.49
All Public Plans-Total Fund Median -0.49 10.12 12.50 17.85 0.32 9.97 1.69 -13.40
Total Fund w/changes 2.03 (1) 11.68 (17) 14.52 (8) 18.41 (31) 2.10 (12) 7.29 (82) -2.16 (90) N/A
Total Fund Policy 0.37 (6) 10.46 (23) 12.31 (23) 16.97 (49) 2.48 (8) 9.81 (44) -1.33 (88) -12.99 (27)
Difference 1.66 1.22 2.21 1.44 -0.38 -2.52 -0.83 N/A
IM Mixed-Asset Target Alloc Moderate (MF) Median -2.66 8.35 10.27 16.76 -0.57 9.38 2.91 -15.29
Total Equity 0.02 13.08 20.24 25.23 -1.36 9.75 -7.59 N/A
Total Equity Policy -3.48 14.41 20.39 26.19 -2.37 10.15 -4.98 -23.07
Difference 3.50 -1.33 -0.15 -0.96 1.01 -0.40 -2.61 N/A
Total Fixed Income 2.17 7.03 4.59 13.68 1.25 9.03 13.70 N/A
Barclays Intermediate Aggregate Index 2.95 2.74 -0.71 4.31 4.22 7.52 9.69 4.16
Difference -0.78 4.29 5.30 9.37 -2.97 1.51 4.01 N/A
Total Real Estate 17.25 15.44 18.00 15.06 19.03 -5.97 -38.54 N/A
NCREIF ODCE 14.71 12.39 12.47 11.77 18.03 6.14 -36.09 3.73
Difference 2.54 3.05 5.53 3.29 1.00 -12.11 -2.45 N/A
Total Timber 3.00 10.96 5.20 -10.32 5.68 -2.29 10.43 N/A
NCREIF Timber 9.26 10.38 9.68 2.25 0.26 -3.93 2.53 16.60
Difference -6.26 0.58 -4.48 -12.57 5.42 1.64 7.90 N/A
Total Alternatives -3.83 (42) N/A N/A N/A N/A N/A N/A N/A
Alternatives Policy 1.08 (13) N/A N/A N/A N/A N/A N/A N/A
Difference -4.91 N/A N/A N/A N/A N/A N/A N/A
IM Flexible Portfolio (MF) -4.60 7.92 8.29 15.65 -0.73 9.76 3.76 -17.91
Comparative Performance Fiscal Year Returns
Total FundAs of September 30, 2015
Returns for periods greater than one year are annualized. Returns are expressed as percentages.Segment Composites not created until 2/1/2008, upon new manager inception dates.Current Total Fund Policy: 40% R3000, 15% MSCI ACWI ex US, 20% BC Intermediate Agg, 5% BC Global Agg, 10% NCREIF, 5% NCRIEF Timber, & 5% CPI+5%.22
Comparative Performance Fiscal Year Returns
Total FundAs of September 30, 2015
FYTDOct-2013
ToSep-2014
Oct-2012To
Sep-2013
Oct-2011To
Sep-2012
Oct-2010To
Sep-2011
Oct-2009To
Sep-2010
Oct-2008To
Sep-2009
Oct-2007To
Sep-2008
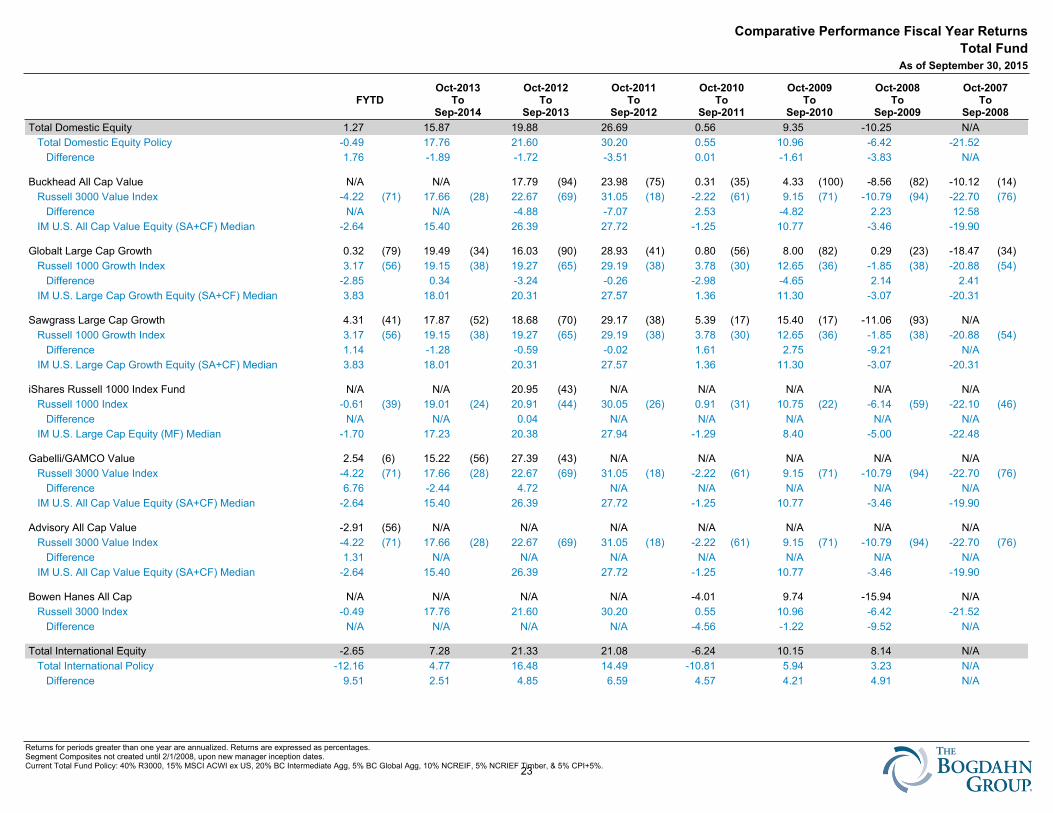
Total Domestic Equity 1.27 15.87 19.88 26.69 0.56 9.35 -10.25 N/A
Total Domestic Equity Policy -0.49 17.76 21.60 30.20 0.55 10.96 -6.42 -21.52
Difference 1.76 -1.89 -1.72 -3.51 0.01 -1.61 -3.83 N/A
Buckhead All Cap Value N/A N/A 17.79 (94) 23.98 (75) 0.31 (35) 4.33 (100) -8.56 (82) -10.12 (14)
Russell 3000 Value Index -4.22 (71) 17.66 (28) 22.67 (69) 31.05 (18) -2.22 (61) 9.15 (71) -10.79 (94) -22.70 (76)
Difference N/A N/A -4.88 -7.07 2.53 -4.82 2.23 12.58
IM U.S. All Cap Value Equity (SA+CF) Median -2.64 15.40 26.39 27.72 -1.25 10.77 -3.46 -19.90
Globalt Large Cap Growth 0.32 (79) 19.49 (34) 16.03 (90) 28.93 (41) 0.80 (56) 8.00 (82) 0.29 (23) -18.47 (34)
Russell 1000 Growth Index 3.17 (56) 19.15 (38) 19.27 (65) 29.19 (38) 3.78 (30) 12.65 (36) -1.85 (38) -20.88 (54)
Difference -2.85 0.34 -3.24 -0.26 -2.98 -4.65 2.14 2.41
IM U.S. Large Cap Growth Equity (SA+CF) Median 3.83 18.01 20.31 27.57 1.36 11.30 -3.07 -20.31
Sawgrass Large Cap Growth 4.31 (41) 17.87 (52) 18.68 (70) 29.17 (38) 5.39 (17) 15.40 (17) -11.06 (93) N/A
Russell 1000 Growth Index 3.17 (56) 19.15 (38) 19.27 (65) 29.19 (38) 3.78 (30) 12.65 (36) -1.85 (38) -20.88 (54)
Difference 1.14 -1.28 -0.59 -0.02 1.61 2.75 -9.21 N/A
IM U.S. Large Cap Growth Equity (SA+CF) Median 3.83 18.01 20.31 27.57 1.36 11.30 -3.07 -20.31
iShares Russell 1000 Index Fund N/A N/A 20.95 (43) N/A N/A N/A N/A N/A
Russell 1000 Index -0.61 (39) 19.01 (24) 20.91 (44) 30.05 (26) 0.91 (31) 10.75 (22) -6.14 (59) -22.10 (46)
Difference N/A N/A 0.04 N/A N/A N/A N/A N/A
IM U.S. Large Cap Equity (MF) Median -1.70 17.23 20.38 27.94 -1.29 8.40 -5.00 -22.48
Gabelli/GAMCO Value 2.54 (6) 15.22 (56) 27.39 (43) N/A N/A N/A N/A N/A
Russell 3000 Value Index -4.22 (71) 17.66 (28) 22.67 (69) 31.05 (18) -2.22 (61) 9.15 (71) -10.79 (94) -22.70 (76)
Difference 6.76 -2.44 4.72 N/A N/A N/A N/A N/A
IM U.S. All Cap Value Equity (SA+CF) Median -2.64 15.40 26.39 27.72 -1.25 10.77 -3.46 -19.90
Advisory All Cap Value -2.91 (56) N/A N/A N/A N/A N/A N/A N/A
Russell 3000 Value Index -4.22 (71) 17.66 (28) 22.67 (69) 31.05 (18) -2.22 (61) 9.15 (71) -10.79 (94) -22.70 (76)
Difference 1.31 N/A N/A N/A N/A N/A N/A N/A
IM U.S. All Cap Value Equity (SA+CF) Median -2.64 15.40 26.39 27.72 -1.25 10.77 -3.46 -19.90
Bowen Hanes All Cap N/A N/A N/A N/A -4.01 9.74 -15.94 N/A
Russell 3000 Index -0.49 17.76 21.60 30.20 0.55 10.96 -6.42 -21.52
Difference N/A N/A N/A N/A -4.56 -1.22 -9.52 N/A
Total International Equity -2.65 7.28 21.33 21.08 -6.24 10.15 8.14 N/A
Total International Policy -12.16 4.77 16.48 14.49 -10.81 5.94 3.23 N/A
Difference 9.51 2.51 4.85 6.59 4.57 4.21 4.91 N/A
Returns for periods greater than one year are annualized. Returns are expressed as percentages.Segment Composites not created until 2/1/2008, upon new manager inception dates.Current Total Fund Policy: 40% R3000, 15% MSCI ACWI ex US, 20% BC Intermediate Agg, 5% BC Global Agg, 10% NCREIF, 5% NCRIEF Timber, & 5% CPI+5%.23
Comparative Performance Fiscal Year Returns
Total FundAs of September 30, 2015
FYTDOct-2013
ToSep-2014
Oct-2012To
Sep-2013
Oct-2011To
Sep-2012
Oct-2010To
Sep-2011
Oct-2009To
Sep-2010
Oct-2008To
Sep-2009
Oct-2007To
Sep-2008
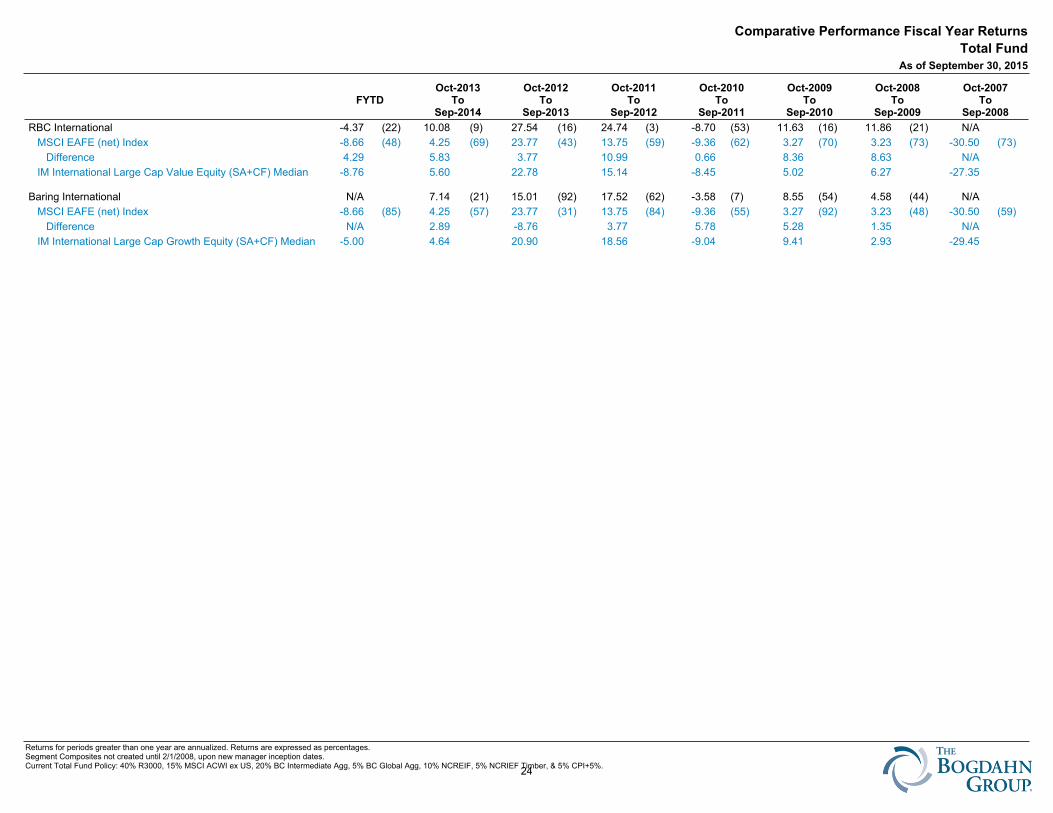
RBC International -4.37 (22) 10.08 (9) 27.54 (16) 24.74 (3) -8.70 (53) 11.63 (16) 11.86 (21) N/A
MSCI EAFE (net) Index -8.66 (48) 4.25 (69) 23.77 (43) 13.75 (59) -9.36 (62) 3.27 (70) 3.23 (73) -30.50 (73)
Difference 4.29 5.83 3.77 10.99 0.66 8.36 8.63 N/A
IM International Large Cap Value Equity (SA+CF) Median -8.76 5.60 22.78 15.14 -8.45 5.02 6.27 -27.35
Baring International N/A 7.14 (21) 15.01 (92) 17.52 (62) -3.58 (7) 8.55 (54) 4.58 (44) N/A
MSCI EAFE (net) Index -8.66 (85) 4.25 (57) 23.77 (31) 13.75 (84) -9.36 (55) 3.27 (92) 3.23 (48) -30.50 (59)
Difference N/A 2.89 -8.76 3.77 5.78 5.28 1.35 N/A
IM International Large Cap Growth Equity (SA+CF) Median -5.00 4.64 20.90 18.56 -9.04 9.41 2.93 -29.45
Returns for periods greater than one year are annualized. Returns are expressed as percentages.Segment Composites not created until 2/1/2008, upon new manager inception dates.Current Total Fund Policy: 40% R3000, 15% MSCI ACWI ex US, 20% BC Intermediate Agg, 5% BC Global Agg, 10% NCREIF, 5% NCRIEF Timber, & 5% CPI+5%.24
Comparative Performance Fiscal Year Returns
Total FundAs of September 30, 2015
FYTDOct-2013
ToSep-2014
Oct-2012To
Sep-2013
Oct-2011To
Sep-2012
Oct-2010To
Sep-2011
Oct-2009To
Sep-2010
Oct-2008To
Sep-2009
Oct-2007To
Sep-2008
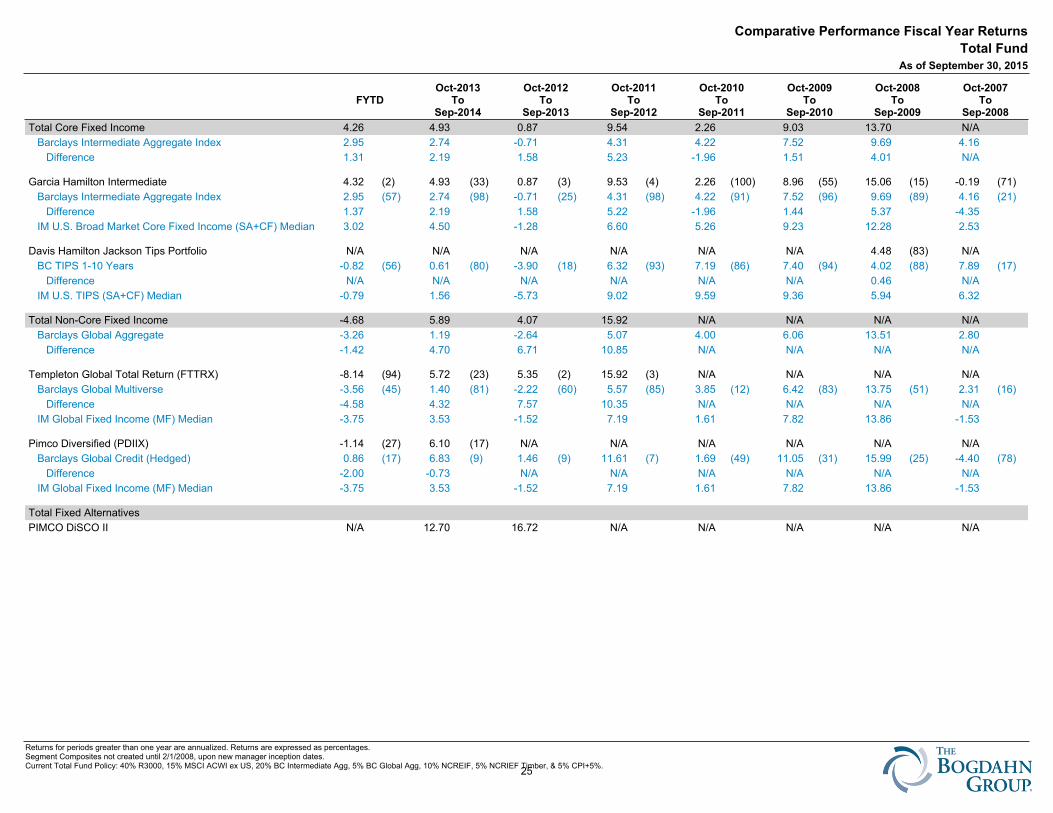
Total Core Fixed Income 4.26 4.93 0.87 9.54 2.26 9.03 13.70 N/A
Barclays Intermediate Aggregate Index 2.95 2.74 -0.71 4.31 4.22 7.52 9.69 4.16
Difference 1.31 2.19 1.58 5.23 -1.96 1.51 4.01 N/A
Garcia Hamilton Intermediate 4.32 (2) 4.93 (33) 0.87 (3) 9.53 (4) 2.26 (100) 8.96 (55) 15.06 (15) -0.19 (71)
Barclays Intermediate Aggregate Index 2.95 (57) 2.74 (98) -0.71 (25) 4.31 (98) 4.22 (91) 7.52 (96) 9.69 (89) 4.16 (21)
Difference 1.37 2.19 1.58 5.22 -1.96 1.44 5.37 -4.35
IM U.S. Broad Market Core Fixed Income (SA+CF) Median 3.02 4.50 -1.28 6.60 5.26 9.23 12.28 2.53
Davis Hamilton Jackson Tips Portfolio N/A N/A N/A N/A N/A N/A 4.48 (83) N/A
BC TIPS 1-10 Years -0.82 (56) 0.61 (80) -3.90 (18) 6.32 (93) 7.19 (86) 7.40 (94) 4.02 (88) 7.89 (17)
Difference N/A N/A N/A N/A N/A N/A 0.46 N/A
IM U.S. TIPS (SA+CF) Median -0.79 1.56 -5.73 9.02 9.59 9.36 5.94 6.32
Total Non-Core Fixed Income -4.68 5.89 4.07 15.92 N/A N/A N/A N/A
Barclays Global Aggregate -3.26 1.19 -2.64 5.07 4.00 6.06 13.51 2.80
Difference -1.42 4.70 6.71 10.85 N/A N/A N/A N/A
Templeton Global Total Return (FTTRX) -8.14 (94) 5.72 (23) 5.35 (2) 15.92 (3) N/A N/A N/A N/A
Barclays Global Multiverse -3.56 (45) 1.40 (81) -2.22 (60) 5.57 (85) 3.85 (12) 6.42 (83) 13.75 (51) 2.31 (16)
Difference -4.58 4.32 7.57 10.35 N/A N/A N/A N/A
IM Global Fixed Income (MF) Median -3.75 3.53 -1.52 7.19 1.61 7.82 13.86 -1.53
Pimco Diversified (PDIIX) -1.14 (27) 6.10 (17) N/A N/A N/A N/A N/A N/A
Barclays Global Credit (Hedged) 0.86 (17) 6.83 (9) 1.46 (9) 11.61 (7) 1.69 (49) 11.05 (31) 15.99 (25) -4.40 (78)
Difference -2.00 -0.73 N/A N/A N/A N/A N/A N/A
IM Global Fixed Income (MF) Median -3.75 3.53 -1.52 7.19 1.61 7.82 13.86 -1.53
Total Fixed Alternatives
PIMCO DiSCO II N/A 12.70 16.72 N/A N/A N/A N/A N/A
Returns for periods greater than one year are annualized. Returns are expressed as percentages.Segment Composites not created until 2/1/2008, upon new manager inception dates.Current Total Fund Policy: 40% R3000, 15% MSCI ACWI ex US, 20% BC Intermediate Agg, 5% BC Global Agg, 10% NCREIF, 5% NCRIEF Timber, & 5% CPI+5%.25
Comparative Performance Fiscal Year Returns
Total FundAs of September 30, 2015
FYTDOct-2013
ToSep-2014
Oct-2012To
Sep-2013
Oct-2011To
Sep-2012
Oct-2010To
Sep-2011
Oct-2009To
Sep-2010
Oct-2008To
Sep-2009
Oct-2007To
Sep-2008
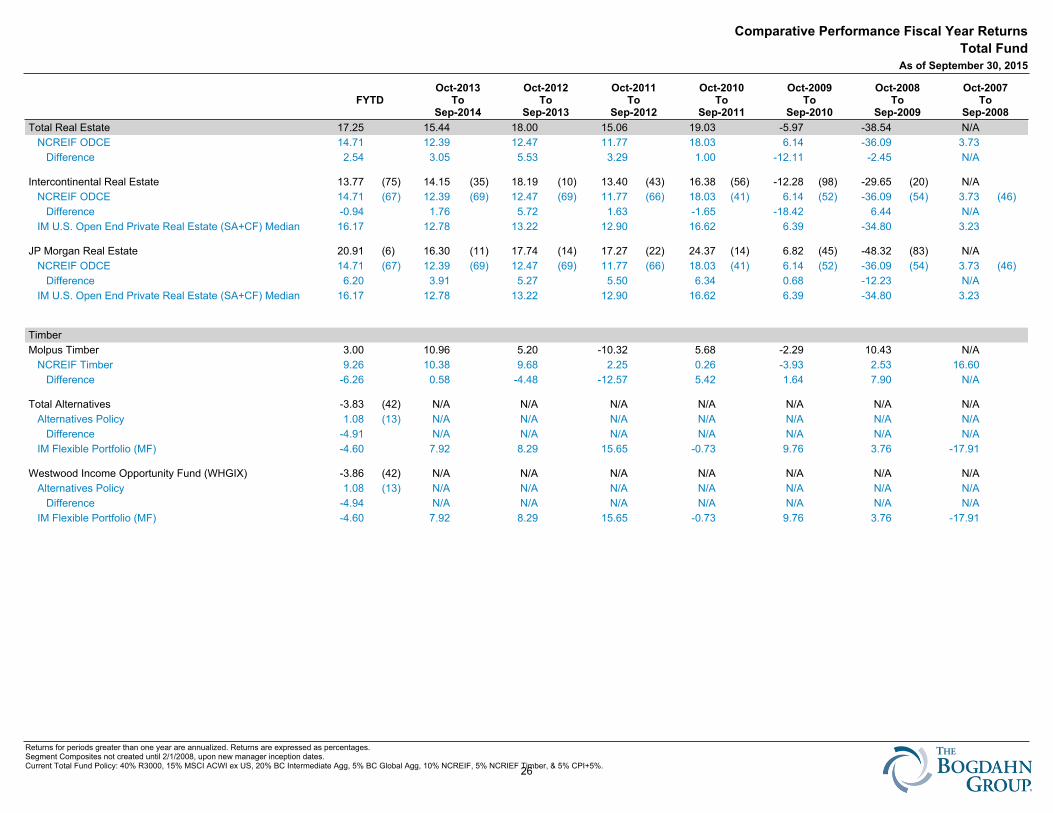
Total Real Estate 17.25 15.44 18.00 15.06 19.03 -5.97 -38.54 N/A
NCREIF ODCE 14.71 12.39 12.47 11.77 18.03 6.14 -36.09 3.73
Difference 2.54 3.05 5.53 3.29 1.00 -12.11 -2.45 N/A
Intercontinental Real Estate 13.77 (75) 14.15 (35) 18.19 (10) 13.40 (43) 16.38 (56) -12.28 (98) -29.65 (20) N/A
NCREIF ODCE 14.71 (67) 12.39 (69) 12.47 (69) 11.77 (66) 18.03 (41) 6.14 (52) -36.09 (54) 3.73 (46)
Difference -0.94 1.76 5.72 1.63 -1.65 -18.42 6.44 N/A
IM U.S. Open End Private Real Estate (SA+CF) Median 16.17 12.78 13.22 12.90 16.62 6.39 -34.80 3.23
JP Morgan Real Estate 20.91 (6) 16.30 (11) 17.74 (14) 17.27 (22) 24.37 (14) 6.82 (45) -48.32 (83) N/A
NCREIF ODCE 14.71 (67) 12.39 (69) 12.47 (69) 11.77 (66) 18.03 (41) 6.14 (52) -36.09 (54) 3.73 (46)
Difference 6.20 3.91 5.27 5.50 6.34 0.68 -12.23 N/A
IM U.S. Open End Private Real Estate (SA+CF) Median 16.17 12.78 13.22 12.90 16.62 6.39 -34.80 3.23
Timber
Molpus Timber 3.00 10.96 5.20 -10.32 5.68 -2.29 10.43 N/A
NCREIF Timber 9.26 10.38 9.68 2.25 0.26 -3.93 2.53 16.60
Difference -6.26 0.58 -4.48 -12.57 5.42 1.64 7.90 N/A
Total Alternatives -3.83 (42) N/A N/A N/A N/A N/A N/A N/A
Alternatives Policy 1.08 (13) N/A N/A N/A N/A N/A N/A N/A
Difference -4.91 N/A N/A N/A N/A N/A N/A N/A
IM Flexible Portfolio (MF) -4.60 7.92 8.29 15.65 -0.73 9.76 3.76 -17.91
Westwood Income Opportunity Fund (WHGIX) -3.86 (42) N/A N/A N/A N/A N/A N/A N/A
Alternatives Policy 1.08 (13) N/A N/A N/A N/A N/A N/A N/A
Difference -4.94 N/A N/A N/A N/A N/A N/A N/A
IM Flexible Portfolio (MF) -4.60 7.92 8.29 15.65 -0.73 9.76 3.76 -17.91
Returns for periods greater than one year are annualized. Returns are expressed as percentages.Segment Composites not created until 2/1/2008, upon new manager inception dates.Current Total Fund Policy: 40% R3000, 15% MSCI ACWI ex US, 20% BC Intermediate Agg, 5% BC Global Agg, 10% NCREIF, 5% NCRIEF Timber, & 5% CPI+5%.26
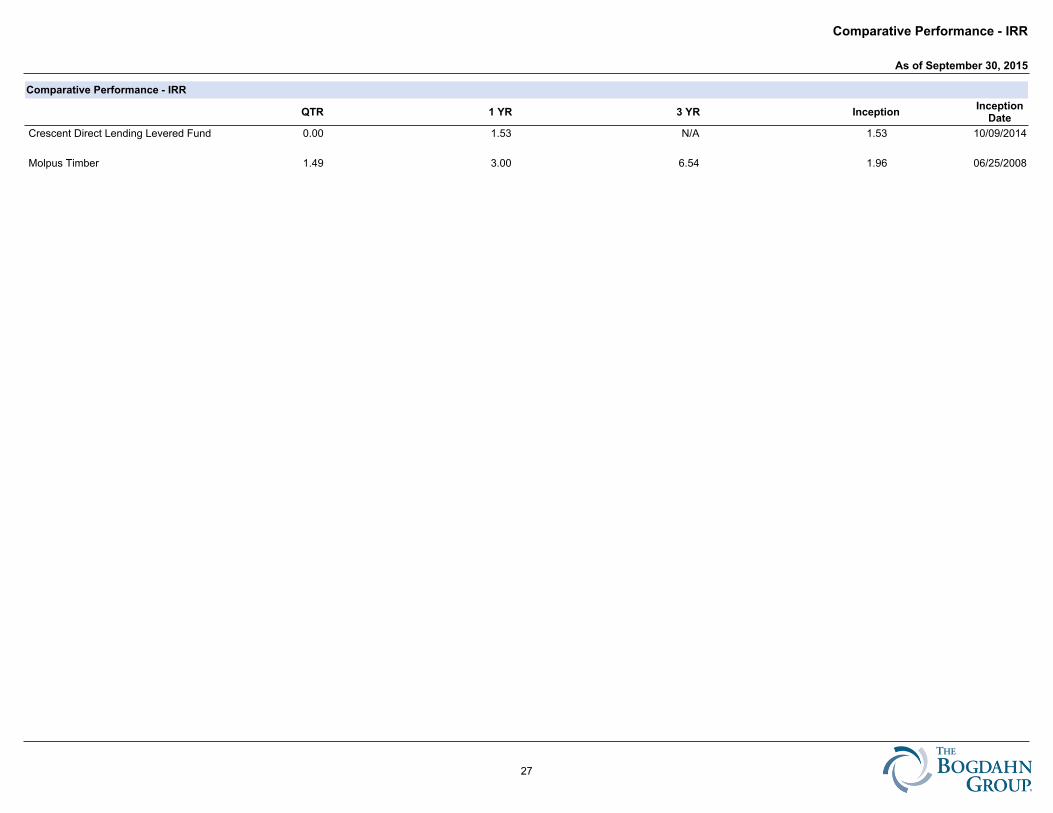
Comparative Performance - IRR
QTR 1 YR 3 YR InceptionInception
Date
Crescent Direct Lending Levered Fund 0.00 1.53 N/A 1.53 10/09/2014
Molpus Timber 1.49 3.00 6.54 1.96 06/25/2008
Comparative Performance - IRR
As of September 30, 2015
27
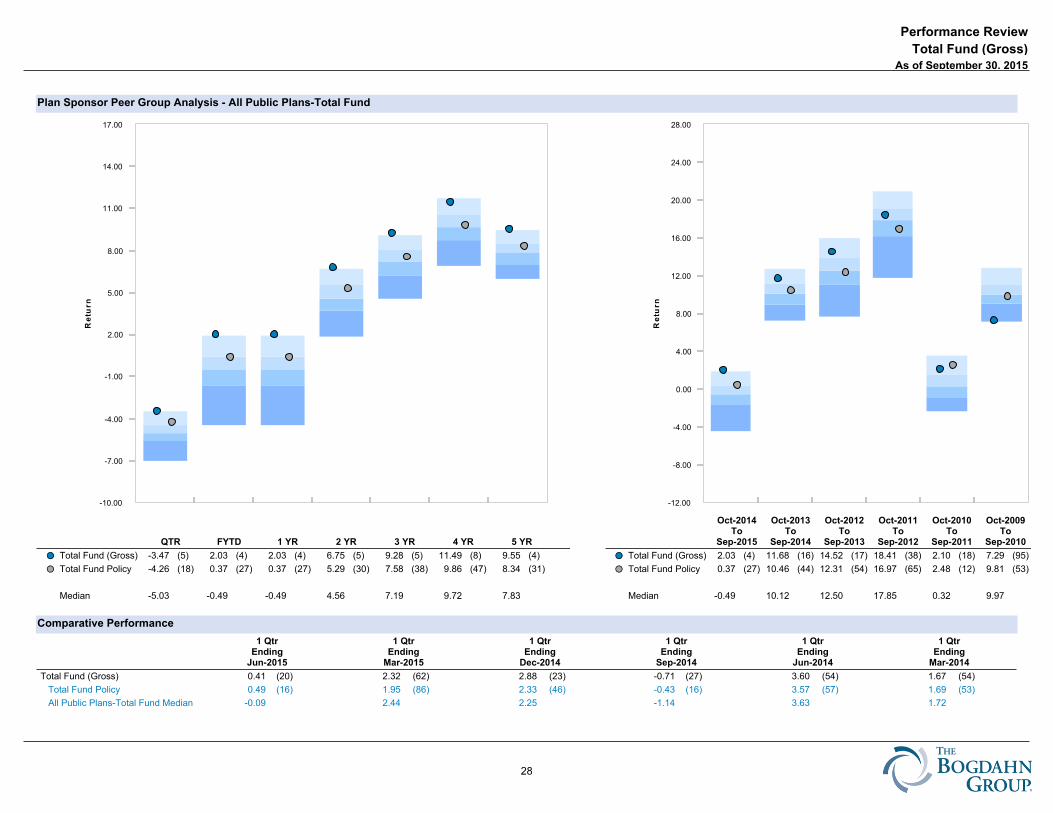
Plan Sponsor Peer Group Analysis - All Public Plans-Total Fund
Comparative Performance
-10.00
-7.00
-4.00
-1.00
2.00
5.00
8.00
11.00
14.00
17.00
Re
turn
QTR FYTD 1 YR 2 YR 3 YR 4 YR 5 YR
Total Fund (Gross) -3.47 (5) 2.03 (4) 2.03 (4) 6.75 (5) 9.28 (5) 11.49 (8) 9.55 (4)��
Total Fund Policy -4.26 (18) 0.37 (27) 0.37 (27) 5.29 (30) 7.58 (38) 9.86 (47) 8.34 (31)��
Median -5.03 -0.49 -0.49 4.56 7.19 9.72 7.83
-12.00
-8.00
-4.00
0.00
4.00
8.00
12.00
16.00
20.00
24.00
28.00
Re
turn
Oct-2014To
Sep-2015
Oct-2013To
Sep-2014
Oct-2012To
Sep-2013
Oct-2011To
Sep-2012
Oct-2010To
Sep-2011
Oct-2009To
Sep-2010
Total Fund (Gross) 2.03 (4) 11.68 (16) 14.52 (17) 18.41 (38) 2.10 (18) 7.29 (95)��
Total Fund Policy 0.37 (27) 10.46 (44) 12.31 (54) 16.97 (65) 2.48 (12) 9.81 (53)��
Median -0.49 10.12 12.50 17.85 0.32 9.97
1 QtrEnding
Jun-2015
1 QtrEnding
Mar-2015
1 QtrEnding
Dec-2014
1 QtrEnding
Sep-2014
1 QtrEnding
Jun-2014
1 QtrEnding
Mar-2014
Total Fund (Gross) 0.41 (20) 2.32 (62) 2.88 (23) -0.71 (27) 3.60 (54) 1.67 (54)
Total Fund Policy 0.49 (16) 1.95 (86) 2.33 (46) -0.43 (16) 3.57 (57) 1.69 (53)
All Public Plans-Total Fund Median -0.09 2.44 2.25 -1.14 3.63 1.72
As of September 30, 2015
Performance Review
Total Fund (Gross)
NONE
28
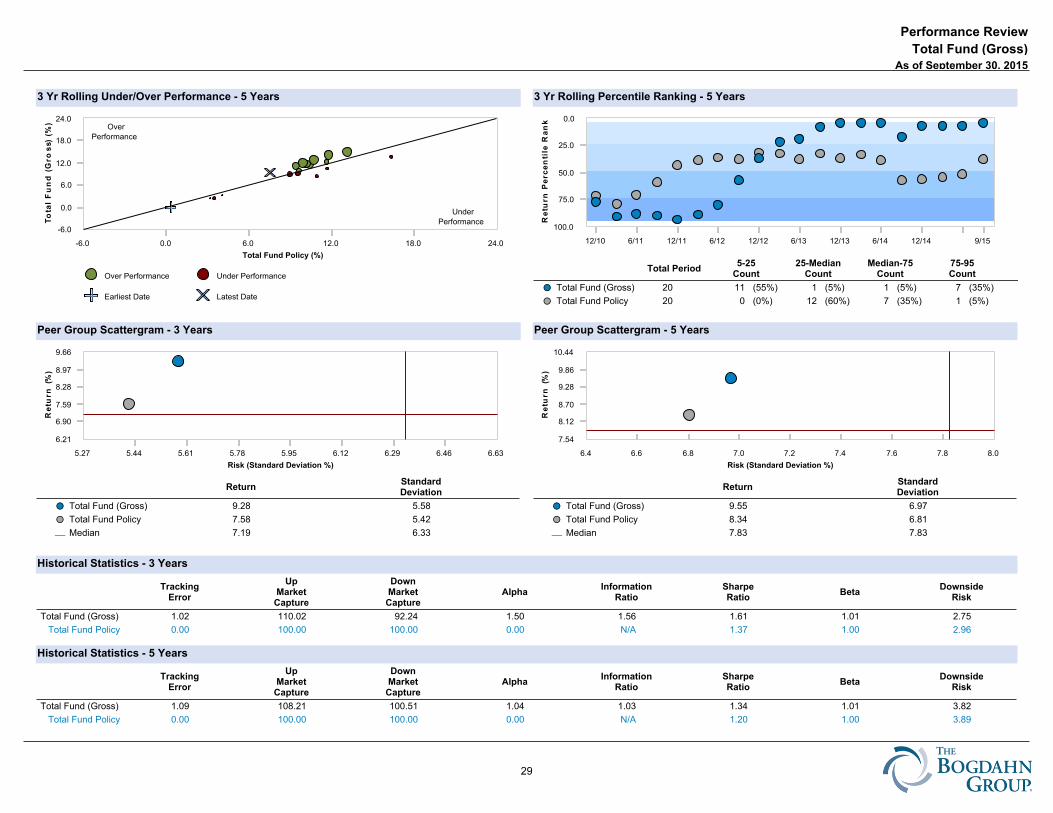
Peer Group Scattergram - 3 Years
3 Yr Rolling Under/Over Performance - 5 Years
Peer Group Scattergram - 5 Years
3 Yr Rolling Percentile Ranking - 5 Years
Historical Statistics - 3 Years
Historical Statistics - 5 Years
Over Performance Under Performance
Earliest Date Latest Date
-6.0
0.0
6.0
12.0
18.0
24.0
To
tal
F
un
d (G
ros
s) (%
)
-6.0 0.0 6.0 12.0 18.0 24.0
Total Fund Policy (%)
Over
Performance
Under
Performance
0.0
25.0
50.0
75.0
100.0
Re
turn
Pe
rce
nti
le R
an
k
12/10 6/11 12/11 6/12 12/12 6/13 12/13 6/14 12/14 9/15
Total Period5-25
Count25-Median
CountMedian-75
Count75-95Count
Total Fund (Gross) 20 11 (55%) 1 (5%) 1 (5%) 7 (35%)��
Total Fund Policy 20 0 (0%) 12 (60%) 7 (35%) 1 (5%)��
6.21
6.90
7.59
8.28
8.97
9.66
Re
turn
(%)
5.27 5.44 5.61 5.78 5.95 6.12 6.29 6.46 6.63
Risk (Standard Deviation %)
ReturnStandardDeviation
Total Fund (Gross) 9.28 5.58��
Total Fund Policy 7.58 5.42��
Median 7.19 6.33¾
7.54
8.12
8.70
9.28
9.86
10.44
Re
turn
(%)
6.4 6.6 6.8 7.0 7.2 7.4 7.6 7.8 8.0
Risk (Standard Deviation %)
ReturnStandardDeviation
Total Fund (Gross) 9.55 6.97��
Total Fund Policy 8.34 6.81��
Median 7.83 7.83¾
TrackingError
UpMarketCapture
DownMarketCapture
AlphaInformation
RatioSharpeRatio
BetaDownside
Risk
Total Fund (Gross) 1.02 110.02 92.24 1.50 1.56 1.61 1.01 2.75
Total Fund Policy 0.00 100.00 100.00 0.00 N/A 1.37 1.00 2.96 90 Day U.S. Treasury Bill 5.43 0.23 -0.52 0.06 -1.37 N/A 0.00 0.01
TrackingError
UpMarketCapture
DownMarketCapture
AlphaInformation
RatioSharpeRatio
BetaDownside
Risk
Total Fund (Gross) 1.09 108.21 100.51 1.04 1.03 1.34 1.01 3.82
Total Fund Policy 0.00 100.00 100.00 0.00 N/A 1.20 1.00 3.89 90 Day U.S. Treasury Bill 6.81 0.31 -0.39 0.07 -1.20 N/A 0.00 0.01
As of September 30, 2015
Performance Review
Total Fund (Gross)
NONE
29
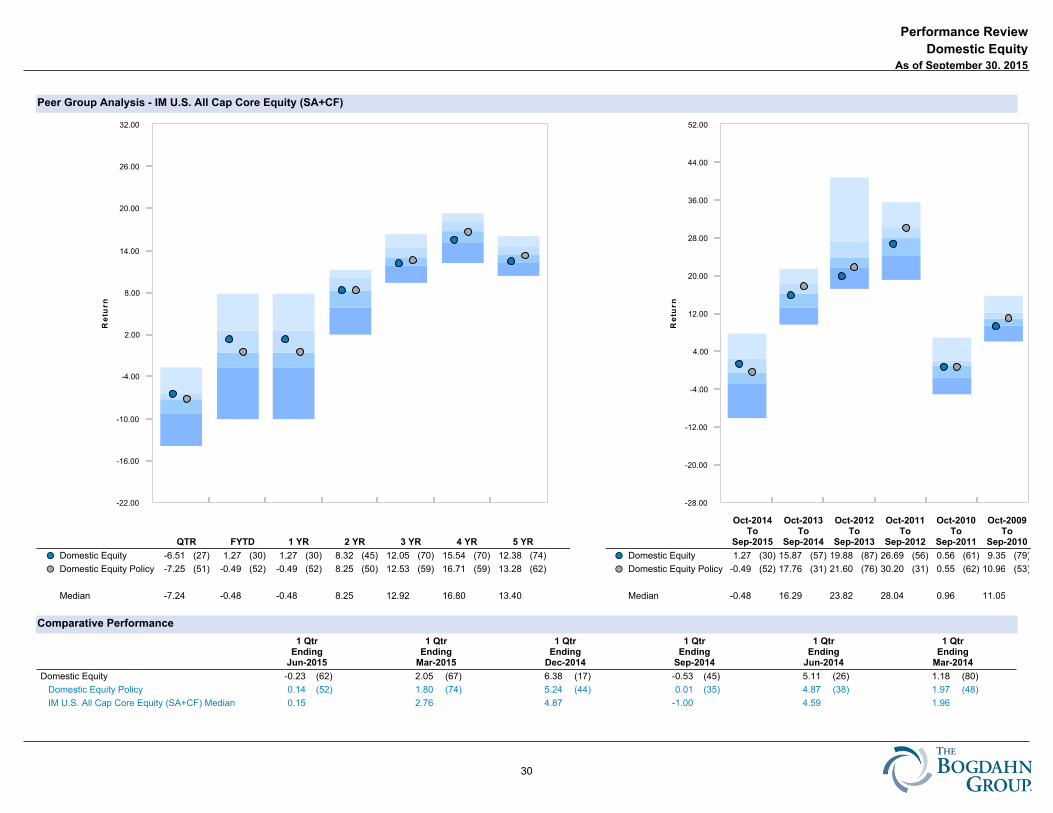
Peer Group Analysis - IM U.S. All Cap Core Equity (SA+CF)
Comparative Performance
-22.00
-16.00
-10.00
-4.00
2.00
8.00
14.00
20.00
26.00
32.00
Re
turn
QTR FYTD 1 YR 2 YR 3 YR 4 YR 5 YR
Domestic Equity -6.51 (27) 1.27 (30) 1.27 (30) 8.32 (45) 12.05 (70) 15.54 (70) 12.38 (74)��
Domestic Equity Policy -7.25 (51) -0.49 (52) -0.49 (52) 8.25 (50) 12.53 (59) 16.71 (59) 13.28 (62)��
Median -7.24 -0.48 -0.48 8.25 12.92 16.80 13.40
-28.00
-20.00
-12.00
-4.00
4.00
12.00
20.00
28.00
36.00
44.00
52.00
Re
turn
Oct-2014To
Sep-2015
Oct-2013To
Sep-2014
Oct-2012To
Sep-2013
Oct-2011To
Sep-2012
Oct-2010To
Sep-2011
Oct-2009To
Sep-2010
Domestic Equity 1.27 (30) 15.87 (57) 19.88 (87) 26.69 (56) 0.56 (61) 9.35 (79)��
Domestic Equity Policy -0.49 (52) 17.76 (31) 21.60 (76) 30.20 (31) 0.55 (62) 10.96 (53)��
Median -0.48 16.29 23.82 28.04 0.96 11.05
1 QtrEnding
Jun-2015
1 QtrEnding
Mar-2015
1 QtrEnding
Dec-2014
1 QtrEnding
Sep-2014
1 QtrEnding
Jun-2014
1 QtrEnding
Mar-2014
Domestic Equity -0.23 (62) 2.05 (67) 6.38 (17) -0.53 (45) 5.11 (26) 1.18 (80)
Domestic Equity Policy 0.14 (52) 1.80 (74) 5.24 (44) 0.01 (35) 4.87 (38) 1.97 (48)
IM U.S. All Cap Core Equity (SA+CF) Median 0.15 2.76 4.87 -1.00 4.59 1.96
Performance Review
As of September 30, 2015
Domestic Equity
NONE
30
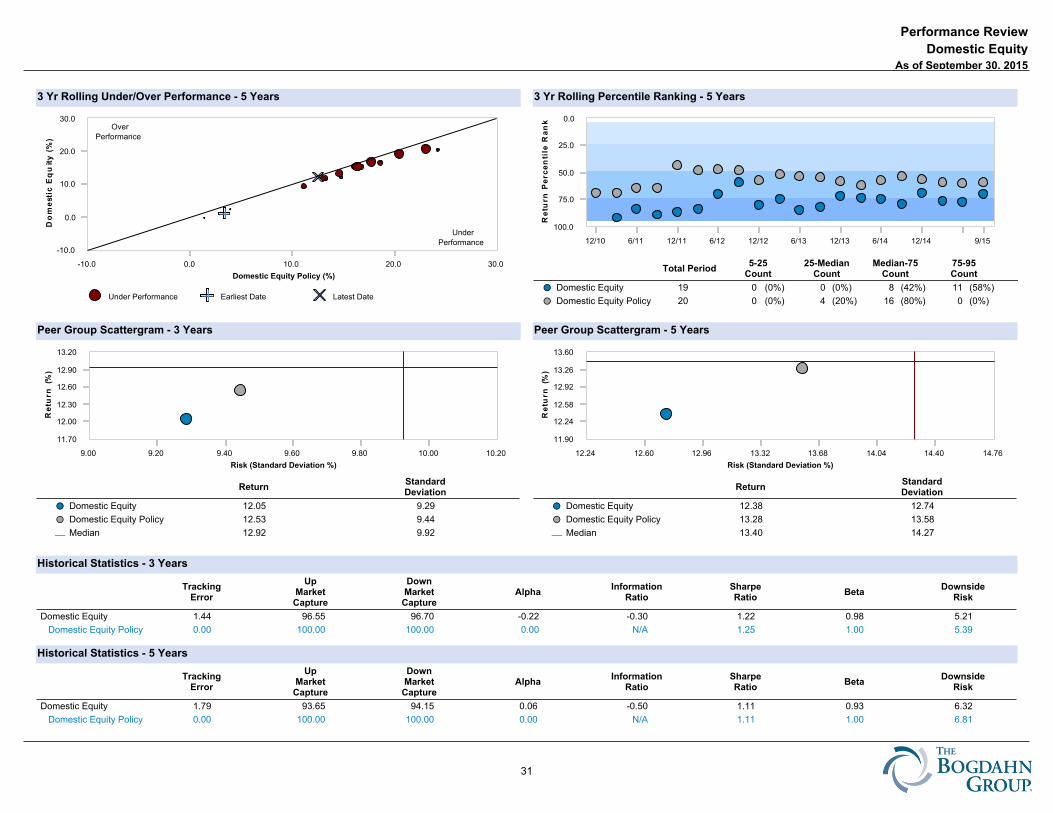
Peer Group Scattergram - 3 Years
3 Yr Rolling Under/Over Performance - 5 Years
Peer Group Scattergram - 5 Years
3 Yr Rolling Percentile Ranking - 5 Years
Historical Statistics - 3 Years
Historical Statistics - 5 Years
Under Performance Earliest Date Latest Date
-10.0
0.0
10.0
20.0
30.0
Do
me
stic
Eq
uit
y (%
)
-10.0 0.0 10.0 20.0 30.0
Domestic Equity Policy (%)
Over
Performance
Under
Performance
0.0
25.0
50.0
75.0
100.0
Re
turn
Pe
rce
nti
le R
an
k
12/10 6/11 12/11 6/12 12/12 6/13 12/13 6/14 12/14 9/15
Total Period5-25
Count25-Median
CountMedian-75
Count75-95Count
Domestic Equity 19 0 (0%) 0 (0%) 8 (42%) 11 (58%)��
Domestic Equity Policy 20 0 (0%) 4 (20%) 16 (80%) 0 (0%)��
11.70
12.00
12.30
12.60
12.90
13.20
Re
turn
(%)
9.00 9.20 9.40 9.60 9.80 10.00 10.20
Risk (Standard Deviation %)
ReturnStandardDeviation
Domestic Equity 12.05 9.29��
Domestic Equity Policy 12.53 9.44��
Median 12.92 9.92¾
11.90
12.24
12.58
12.92
13.26
13.60
Re
turn
(%)
12.24 12.60 12.96 13.32 13.68 14.04 14.40 14.76
Risk (Standard Deviation %)
ReturnStandardDeviation
Domestic Equity 12.38 12.74��
Domestic Equity Policy 13.28 13.58��
Median 13.40 14.27¾
TrackingError
UpMarketCapture
DownMarketCapture
AlphaInformation
RatioSharpeRatio
BetaDownside
Risk
Domestic Equity 1.44 96.55 96.70 -0.22 -0.30 1.22 0.98 5.21
Domestic Equity Policy 0.00 100.00 100.00 0.00 N/A 1.25 1.00 5.39 90 Day U.S. Treasury Bill 9.79 0.13 -0.26 0.06 -1.25 N/A 0.00 0.01
TrackingError
UpMarketCapture
DownMarketCapture
AlphaInformation
RatioSharpeRatio
BetaDownside
Risk
Domestic Equity 1.79 93.65 94.15 0.06 -0.50 1.11 0.93 6.32
Domestic Equity Policy 0.00 100.00 100.00 0.00 N/A 1.11 1.00 6.81 90 Day U.S. Treasury Bill 11.84 0.18 -0.21 0.07 -1.11 N/A 0.00 0.01
Performance Review
As of September 30, 2015
Domestic Equity
NONE
31
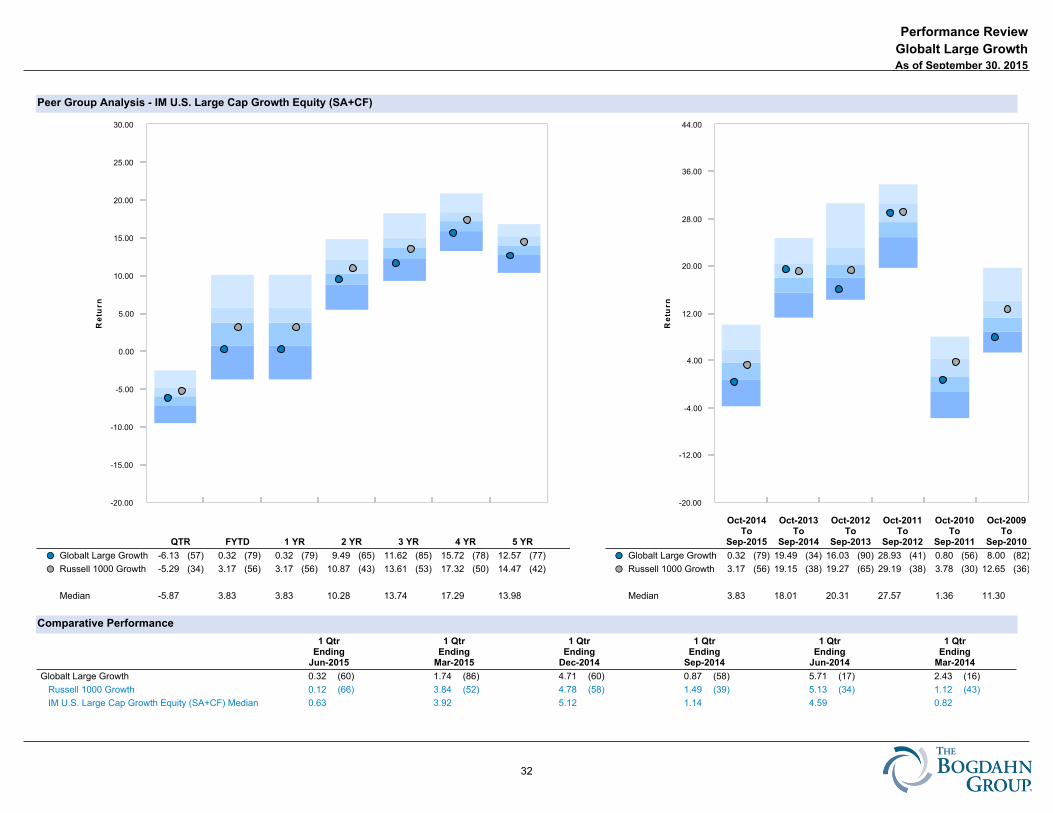
Peer Group Analysis - IM U.S. Large Cap Growth Equity (SA+CF)
Comparative Performance
-20.00
-15.00
-10.00
-5.00
0.00
5.00
10.00
15.00
20.00
25.00
30.00
Re
turn
QTR FYTD 1 YR 2 YR 3 YR 4 YR 5 YR
Globalt Large Growth -6.13 (57) 0.32 (79) 0.32 (79) 9.49 (65) 11.62 (85) 15.72 (78) 12.57 (77)��
Russell 1000 Growth -5.29 (34) 3.17 (56) 3.17 (56) 10.87 (43) 13.61 (53) 17.32 (50) 14.47 (42)��
Median -5.87 3.83 3.83 10.28 13.74 17.29 13.98
-20.00
-12.00
-4.00
4.00
12.00
20.00
28.00
36.00
44.00
Re
turn
Oct-2014To
Sep-2015
Oct-2013To
Sep-2014
Oct-2012To
Sep-2013
Oct-2011To
Sep-2012
Oct-2010To
Sep-2011
Oct-2009To
Sep-2010
Globalt Large Growth 0.32 (79) 19.49 (34) 16.03 (90) 28.93 (41) 0.80 (56) 8.00 (82)��
Russell 1000 Growth 3.17 (56) 19.15 (38) 19.27 (65) 29.19 (38) 3.78 (30) 12.65 (36)��
Median 3.83 18.01 20.31 27.57 1.36 11.30
1 QtrEnding
Jun-2015
1 QtrEnding
Mar-2015
1 QtrEnding
Dec-2014
1 QtrEnding
Sep-2014
1 QtrEnding
Jun-2014
1 QtrEnding
Mar-2014
Globalt Large Growth 0.32 (60) 1.74 (86) 4.71 (60) 0.87 (58) 5.71 (17) 2.43 (16)
Russell 1000 Growth 0.12 (66) 3.84 (52) 4.78 (58) 1.49 (39) 5.13 (34) 1.12 (43)
IM U.S. Large Cap Growth Equity (SA+CF) Median 0.63 3.92 5.12 1.14 4.59 0.82
Performance Review
As of September 30, 2015
Globalt Large Growth
NONE
32
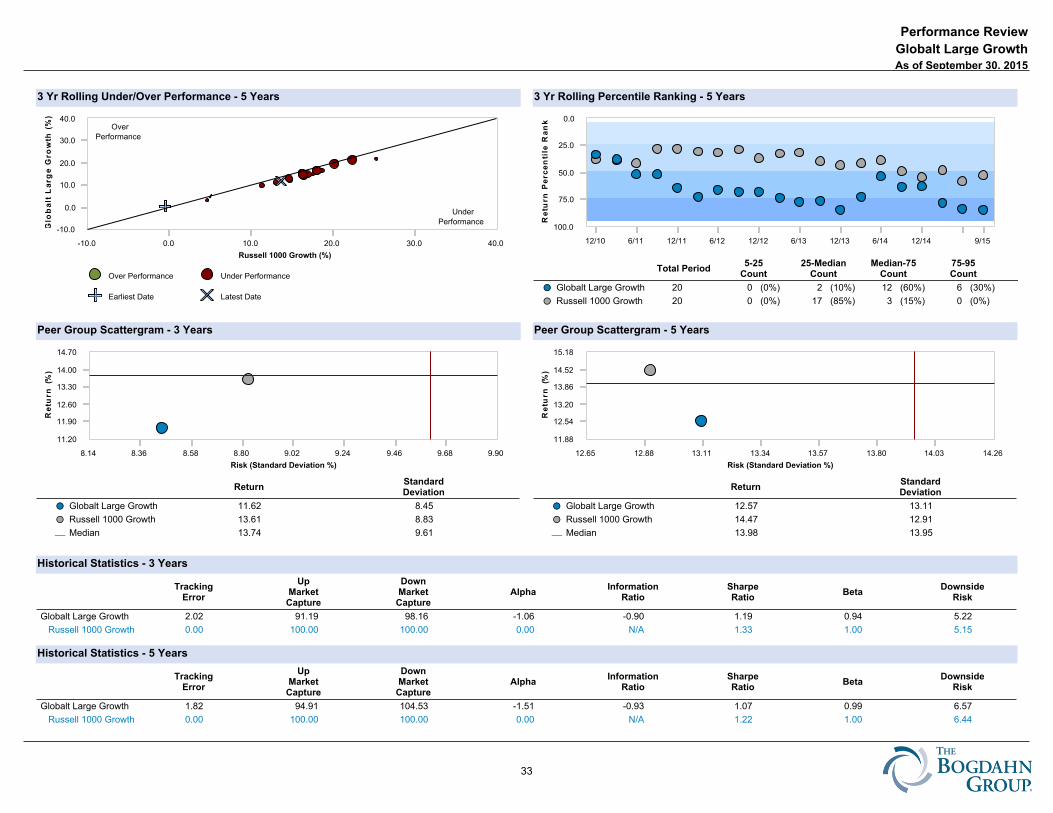
Peer Group Scattergram - 3 Years
3 Yr Rolling Under/Over Performance - 5 Years
Peer Group Scattergram - 5 Years
3 Yr Rolling Percentile Ranking - 5 Years
Historical Statistics - 3 Years
Historical Statistics - 5 Years
Over Performance Under Performance
Earliest Date Latest Date
-10.0
0.0
10.0
20.0
30.0
40.0
Glo
ba
lt L
arg
e G
row
th (%
)
-10.0 0.0 10.0 20.0 30.0 40.0
Russell 1000 Growth (%)
Over
Performance
Under
Performance
0.0
25.0
50.0
75.0
100.0
Re
turn
Pe
rce
nti
le R
an
k
12/10 6/11 12/11 6/12 12/12 6/13 12/13 6/14 12/14 9/15
Total Period5-25
Count25-Median
CountMedian-75
Count75-95Count
Globalt Large Growth 20 0 (0%) 2 (10%) 12 (60%) 6 (30%)��
Russell 1000 Growth 20 0 (0%) 17 (85%) 3 (15%) 0 (0%)��
11.20
11.90
12.60
13.30
14.00
14.70
Re
turn
(%)
8.14 8.36 8.58 8.80 9.02 9.24 9.46 9.68 9.90
Risk (Standard Deviation %)
ReturnStandardDeviation
Globalt Large Growth 11.62 8.45��
Russell 1000 Growth 13.61 8.83��
Median 13.74 9.61¾
11.88
12.54
13.20
13.86
14.52
15.18
Re
turn
(%)
12.65 12.88 13.11 13.34 13.57 13.80 14.03 14.26
Risk (Standard Deviation %)
ReturnStandardDeviation
Globalt Large Growth 12.57 13.11��
Russell 1000 Growth 14.47 12.91��
Median 13.98 13.95¾
TrackingError
UpMarketCapture
DownMarketCapture
AlphaInformation
RatioSharpeRatio
BetaDownside
Risk
Globalt Large Growth 2.02 91.19 98.16 -1.06 -0.90 1.19 0.94 5.22
Russell 1000 Growth 0.00 100.00 100.00 0.00 N/A 1.33 1.00 5.15 90 Day U.S. Treasury Bill 10.00 0.10 -0.32 0.06 -1.33 N/A 0.00 0.01
TrackingError
UpMarketCapture
DownMarketCapture
AlphaInformation
RatioSharpeRatio
BetaDownside
Risk
Globalt Large Growth 1.82 94.91 104.53 -1.51 -0.93 1.07 0.99 6.57
Russell 1000 Growth 0.00 100.00 100.00 0.00 N/A 1.22 1.00 6.44 90 Day U.S. Treasury Bill 11.66 0.17 -0.25 0.07 -1.22 N/A 0.00 0.01
Performance Review
As of September 30, 2015
Globalt Large Growth
NONE
33
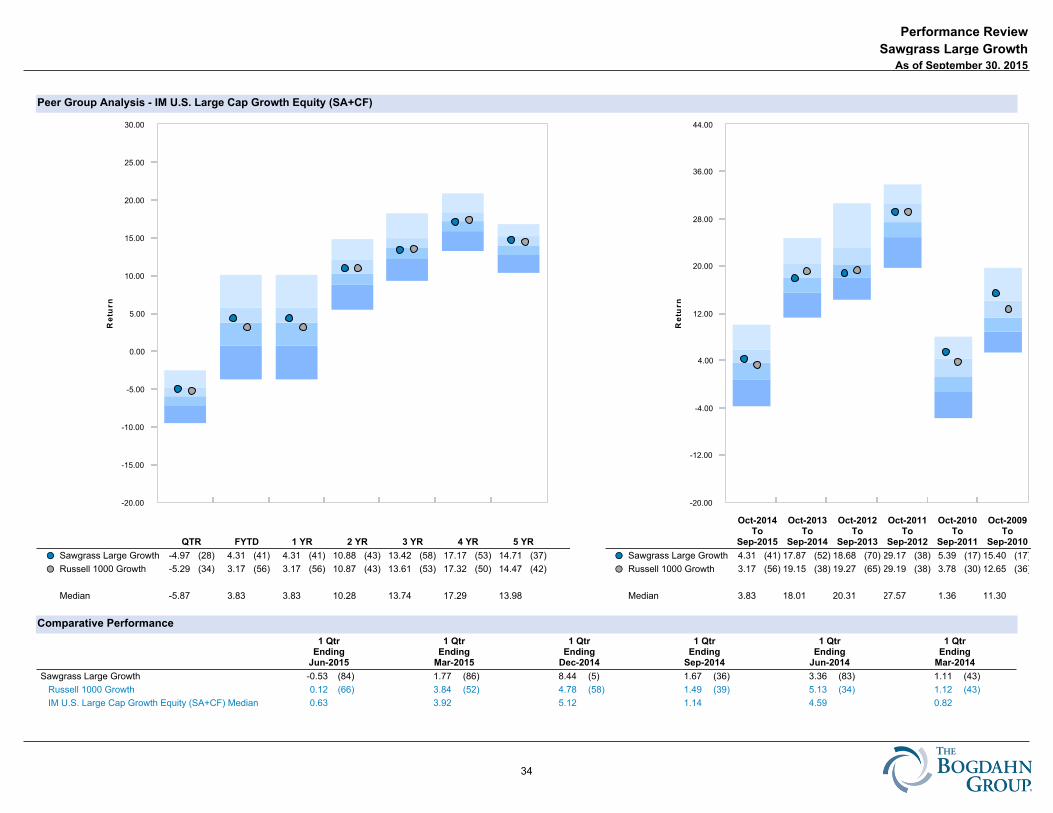
Peer Group Analysis - IM U.S. Large Cap Growth Equity (SA+CF)
Comparative Performance
-20.00
-15.00
-10.00
-5.00
0.00
5.00
10.00
15.00
20.00
25.00
30.00
Re
turn
QTR FYTD 1 YR 2 YR 3 YR 4 YR 5 YR
Sawgrass Large Growth -4.97 (28) 4.31 (41) 4.31 (41) 10.88 (43) 13.42 (58) 17.17 (53) 14.71 (37)��
Russell 1000 Growth -5.29 (34) 3.17 (56) 3.17 (56) 10.87 (43) 13.61 (53) 17.32 (50) 14.47 (42)��
Median -5.87 3.83 3.83 10.28 13.74 17.29 13.98
-20.00
-12.00
-4.00
4.00
12.00
20.00
28.00
36.00
44.00
Re
turn
Oct-2014To
Sep-2015
Oct-2013To
Sep-2014
Oct-2012To
Sep-2013
Oct-2011To
Sep-2012
Oct-2010To
Sep-2011
Oct-2009To
Sep-2010
Sawgrass Large Growth 4.31 (41) 17.87 (52) 18.68 (70) 29.17 (38) 5.39 (17) 15.40 (17)��
Russell 1000 Growth 3.17 (56) 19.15 (38) 19.27 (65) 29.19 (38) 3.78 (30) 12.65 (36)��
Median 3.83 18.01 20.31 27.57 1.36 11.30
1 QtrEnding
Jun-2015
1 QtrEnding
Mar-2015
1 QtrEnding
Dec-2014
1 QtrEnding
Sep-2014
1 QtrEnding
Jun-2014
1 QtrEnding
Mar-2014
Sawgrass Large Growth -0.53 (84) 1.77 (86) 8.44 (5) 1.67 (36) 3.36 (83) 1.11 (43)
Russell 1000 Growth 0.12 (66) 3.84 (52) 4.78 (58) 1.49 (39) 5.13 (34) 1.12 (43)
IM U.S. Large Cap Growth Equity (SA+CF) Median 0.63 3.92 5.12 1.14 4.59 0.82
Performance Review
As of September 30, 2015
Sawgrass Large Growth
NONE
34
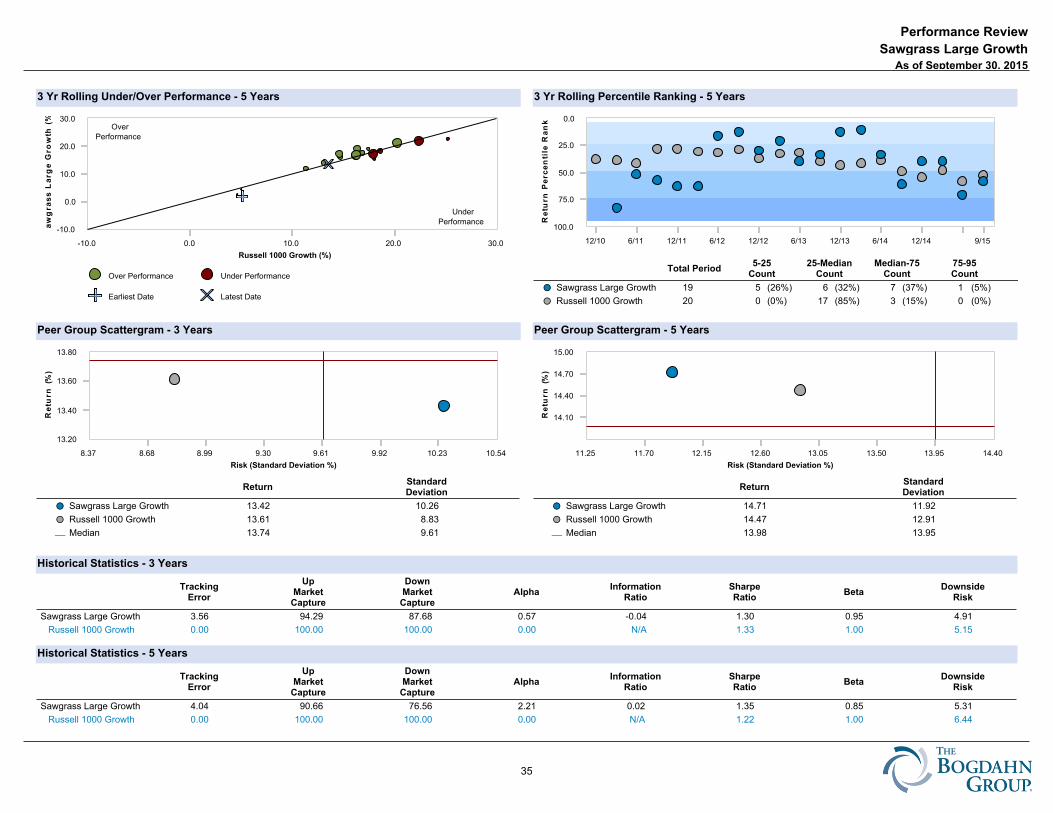
Peer Group Scattergram - 3 Years
3 Yr Rolling Under/Over Performance - 5 Years
Peer Group Scattergram - 5 Years
3 Yr Rolling Percentile Ranking - 5 Years
Historical Statistics - 3 Years
Historical Statistics - 5 Years
Over Performance Under Performance
Earliest Date Latest Date
-10.0
0.0
10.0
20.0
30.0
Sa
wg
ras
s L
arg
e G
row
th (%
)
-10.0 0.0 10.0 20.0 30.0
Russell 1000 Growth (%)
Over
Performance
Under
Performance
0.0
25.0
50.0
75.0
100.0
Re
turn
Pe
rce
nti
le R
an
k
12/10 6/11 12/11 6/12 12/12 6/13 12/13 6/14 12/14 9/15
Total Period5-25
Count25-Median
CountMedian-75
Count75-95Count
Sawgrass Large Growth 19 5 (26%) 6 (32%) 7 (37%) 1 (5%)��
Russell 1000 Growth 20 0 (0%) 17 (85%) 3 (15%) 0 (0%)��
13.20
13.40
13.60
13.80
Re
turn
(%)
8.37 8.68 8.99 9.30 9.61 9.92 10.23 10.54
Risk (Standard Deviation %)
ReturnStandardDeviation
Sawgrass Large Growth 13.42 10.26��
Russell 1000 Growth 13.61 8.83��
Median 13.74 9.61¾
14.10
14.40
14.70
15.00
Re
turn
(%)
11.25 11.70 12.15 12.60 13.05 13.50 13.95 14.40
Risk (Standard Deviation %)
ReturnStandardDeviation
Sawgrass Large Growth 14.71 11.92��
Russell 1000 Growth 14.47 12.91��
Median 13.98 13.95¾
TrackingError
UpMarketCapture
DownMarketCapture
AlphaInformation
RatioSharpeRatio
BetaDownside
Risk
Sawgrass Large Growth 3.56 94.29 87.68 0.57 -0.04 1.30 0.95 4.91
Russell 1000 Growth 0.00 100.00 100.00 0.00 N/A 1.33 1.00 5.15 90 Day U.S. Treasury Bill 10.00 0.10 -0.32 0.06 -1.33 N/A 0.00 0.01
TrackingError
UpMarketCapture
DownMarketCapture
AlphaInformation
RatioSharpeRatio
BetaDownside
Risk
Sawgrass Large Growth 4.04 90.66 76.56 2.21 0.02 1.35 0.85 5.31
Russell 1000 Growth 0.00 100.00 100.00 0.00 N/A 1.22 1.00 6.44 90 Day U.S. Treasury Bill 11.66 0.17 -0.25 0.07 -1.22 N/A 0.00 0.01
Performance Review
As of September 30, 2015
Sawgrass Large Growth
NONE
35
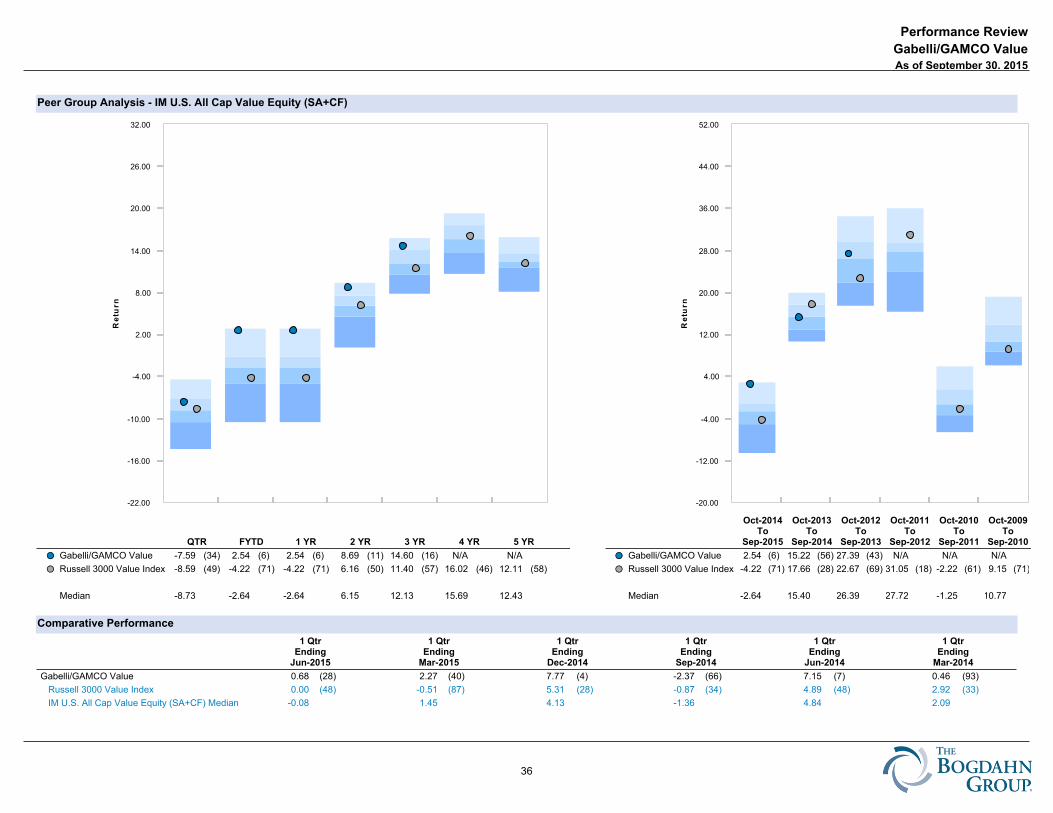
Peer Group Analysis - IM U.S. All Cap Value Equity (SA+CF)
Comparative Performance
-22.00
-16.00
-10.00
-4.00
2.00
8.00
14.00
20.00
26.00
32.00
Re
turn
QTR FYTD 1 YR 2 YR 3 YR 4 YR 5 YR
Gabelli/GAMCO Value -7.59 (34) 2.54 (6) 2.54 (6) 8.69 (11) 14.60 (16) N/A N/A��
Russell 3000 Value Index -8.59 (49) -4.22 (71) -4.22 (71) 6.16 (50) 11.40 (57) 16.02 (46) 12.11 (58)��
Median -8.73 -2.64 -2.64 6.15 12.13 15.69 12.43
-20.00
-12.00
-4.00
4.00
12.00
20.00
28.00
36.00
44.00
52.00
Re
turn
Oct-2014To
Sep-2015
Oct-2013To
Sep-2014
Oct-2012To
Sep-2013
Oct-2011To
Sep-2012
Oct-2010To
Sep-2011
Oct-2009To
Sep-2010
Gabelli/GAMCO Value 2.54 (6) 15.22 (56) 27.39 (43) N/A N/A N/A��
Russell 3000 Value Index -4.22 (71) 17.66 (28) 22.67 (69) 31.05 (18) -2.22 (61) 9.15 (71)��
Median -2.64 15.40 26.39 27.72 -1.25 10.77
1 QtrEnding
Jun-2015
1 QtrEnding
Mar-2015
1 QtrEnding
Dec-2014
1 QtrEnding
Sep-2014
1 QtrEnding
Jun-2014
1 QtrEnding
Mar-2014
Gabelli/GAMCO Value 0.68 (28) 2.27 (40) 7.77 (4) -2.37 (66) 7.15 (7) 0.46 (93)
Russell 3000 Value Index 0.00 (48) -0.51 (87) 5.31 (28) -0.87 (34) 4.89 (48) 2.92 (33)
IM U.S. All Cap Value Equity (SA+CF) Median -0.08 1.45 4.13 -1.36 4.84 2.09
Performance Review
As of September 30, 2015
Gabelli/GAMCO Value
NONE
36
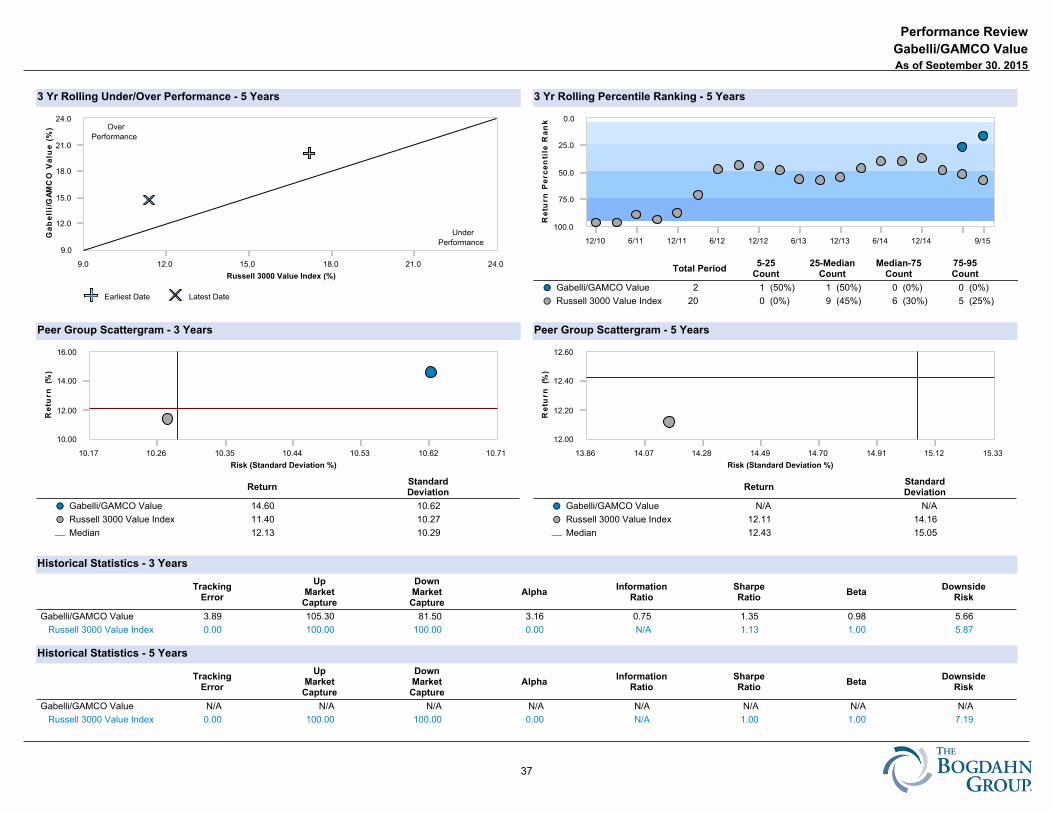
Peer Group Scattergram - 3 Years
3 Yr Rolling Under/Over Performance - 5 Years
Peer Group Scattergram - 5 Years
3 Yr Rolling Percentile Ranking - 5 Years
Historical Statistics - 3 Years
Historical Statistics - 5 Years
Earliest Date Latest Date
9.0
12.0
15.0
18.0
21.0
24.0
Ga
be
lli/
GA
MC
O V
alu
e (%
)
9.0 12.0 15.0 18.0 21.0 24.0
Russell 3000 Value Index (%)
Over
Performance
Under
Performance
0.0
25.0
50.0
75.0
100.0
Re
turn
Pe
rce
nti
le R
an
k
12/10 6/11 12/11 6/12 12/12 6/13 12/13 6/14 12/14 9/15
Total Period5-25
Count25-Median
CountMedian-75
Count75-95Count
Gabelli/GAMCO Value 2 1 (50%) 1 (50%) 0 (0%) 0 (0%)��
Russell 3000 Value Index 20 0 (0%) 9 (45%) 6 (30%) 5 (25%)��
10.00
12.00
14.00
16.00
Re
turn
(%)
10.17 10.26 10.35 10.44 10.53 10.62 10.71
Risk (Standard Deviation %)
ReturnStandardDeviation
Gabelli/GAMCO Value 14.60 10.62��
Russell 3000 Value Index 11.40 10.27��
Median 12.13 10.29¾
12.00
12.20
12.40
12.60
Re
turn
(%)
13.86 14.07 14.28 14.49 14.70 14.91 15.12 15.33
Risk (Standard Deviation %)
ReturnStandardDeviation
Gabelli/GAMCO Value N/A N/A��
Russell 3000 Value Index 12.11 14.16��
Median 12.43 15.05¾
TrackingError
UpMarketCapture
DownMarketCapture
AlphaInformation
RatioSharpeRatio
BetaDownside
Risk
Gabelli/GAMCO Value 3.89 105.30 81.50 3.16 0.75 1.35 0.98 5.66
Russell 3000 Value Index 0.00 100.00 100.00 0.00 N/A 1.13 1.00 5.87 90 Day U.S. Treasury Bill 9.98 0.11 -0.30 0.06 -1.13 N/A 0.00 0.01
TrackingError
UpMarketCapture
DownMarketCapture
AlphaInformation
RatioSharpeRatio
BetaDownside
Risk
Gabelli/GAMCO Value N/A N/A N/A N/A N/A N/A N/A N/A
Russell 3000 Value Index 0.00 100.00 100.00 0.00 N/A 1.00 1.00 7.19 90 Day U.S. Treasury Bill 12.18 0.17 -0.22 0.07 -1.00 N/A 0.00 0.01
Performance Review
As of September 30, 2015
Gabelli/GAMCO Value
NONE
37

Peer Group Analysis - IM U.S. All Cap Value Equity (SA+CF)
Comparative Performance
-22.00
-16.00
-10.00
-4.00
2.00
8.00
14.00
20.00
26.00
32.00
Re
turn
QTR FYTD 1 YR 2 YR 3 YR 4 YR 5 YR
Advisory All Cap Value -7.44 (33) -2.91 (56) -2.91 (56) N/A N/A N/A N/A��
Russell 3000 Value Index -8.59 (49) -4.22 (71) -4.22 (71) 6.16 (50) 11.40 (57) 16.02 (46) 12.11 (58)��
Median -8.73 -2.64 -2.64 6.15 12.13 15.69 12.43
-20.00
-12.00
-4.00
4.00
12.00
20.00
28.00
36.00
44.00
52.00
Re
turn
Oct-2014To
Sep-2015
Oct-2013To
Sep-2014
Oct-2012To
Sep-2013
Oct-2011To
Sep-2012
Oct-2010To
Sep-2011
Oct-2009To
Sep-2010
Advisory All Cap Value -2.91 (56) N/A N/A N/A N/A N/A��
Russell 3000 Value Index -4.22 (71) 17.66 (28) 22.67 (69) 31.05 (18) -2.22 (61) 9.15 (71)��
Median -2.64 15.40 26.39 27.72 -1.25 10.77
1 QtrEnding
Jun-2015
1 QtrEnding
Mar-2015
1 QtrEnding
Dec-2014
1 QtrEnding
Sep-2014
1 QtrEnding
Jun-2014
1 QtrEnding
Mar-2014
Advisory All Cap Value -1.25 (82) 2.39 (37) 3.74 (61) -2.17 (65) 4.60 (60) 1.07 (85)
Russell 3000 Value Index 0.00 (48) -0.51 (87) 5.31 (28) -0.87 (34) 4.89 (48) 2.92 (33)
IM U.S. All Cap Value Equity (SA+CF) Median -0.08 1.45 4.13 -1.36 4.84 2.09
Performance Review
As of September 30, 2015
Advisory All Cap Value
NONE
38

Page Intentionally Left Blank
39
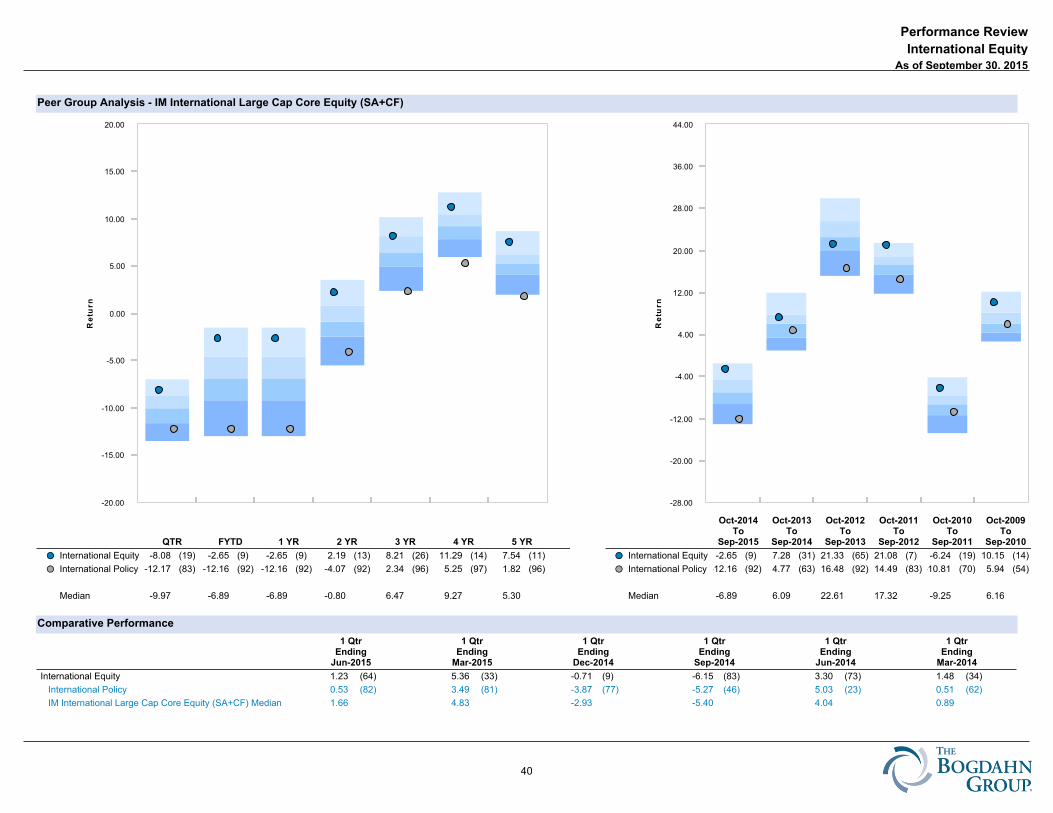
Peer Group Analysis - IM International Large Cap Core Equity (SA+CF)
Comparative Performance
-20.00
-15.00
-10.00
-5.00
0.00
5.00
10.00
15.00
20.00
Re
turn
QTR FYTD 1 YR 2 YR 3 YR 4 YR 5 YR
International Equity -8.08 (19) -2.65 (9) -2.65 (9) 2.19 (13) 8.21 (26) 11.29 (14) 7.54 (11)��
International Policy -12.17 (83) -12.16 (92) -12.16 (92) -4.07 (92) 2.34 (96) 5.25 (97) 1.82 (96)��
Median -9.97 -6.89 -6.89 -0.80 6.47 9.27 5.30
-28.00
-20.00
-12.00
-4.00
4.00
12.00
20.00
28.00
36.00
44.00
Re
turn
Oct-2014To
Sep-2015
Oct-2013To
Sep-2014
Oct-2012To
Sep-2013
Oct-2011To
Sep-2012
Oct-2010To
Sep-2011
Oct-2009To
Sep-2010
International Equity -2.65 (9) 7.28 (31) 21.33 (65) 21.08 (7) -6.24 (19) 10.15 (14)��
International Policy -12.16 (92) 4.77 (63) 16.48 (92) 14.49 (83) -10.81 (70) 5.94 (54)��
Median -6.89 6.09 22.61 17.32 -9.25 6.16
1 QtrEnding
Jun-2015
1 QtrEnding
Mar-2015
1 QtrEnding
Dec-2014
1 QtrEnding
Sep-2014
1 QtrEnding
Jun-2014
1 QtrEnding
Mar-2014
International Equity 1.23 (64) 5.36 (33) -0.71 (9) -6.15 (83) 3.30 (73) 1.48 (34)
International Policy 0.53 (82) 3.49 (81) -3.87 (77) -5.27 (46) 5.03 (23) 0.51 (62)
IM International Large Cap Core Equity (SA+CF) Median 1.66 4.83 -2.93 -5.40 4.04 0.89
Performance Review
As of September 30, 2015
International Equity
NONE
40
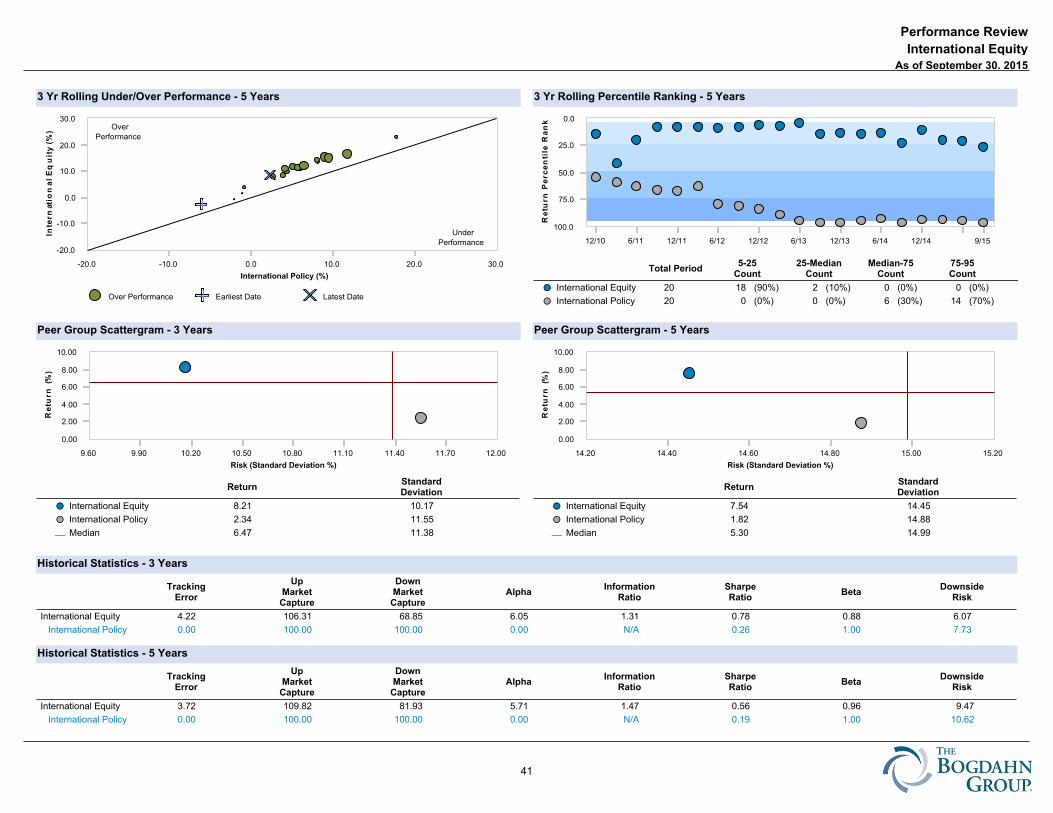
Peer Group Scattergram - 3 Years
3 Yr Rolling Under/Over Performance - 5 Years
Peer Group Scattergram - 5 Years
3 Yr Rolling Percentile Ranking - 5 Years
Historical Statistics - 3 Years
Historical Statistics - 5 Years
Over Performance Earliest Date Latest Date
-20.0
-10.0
0.0
10.0
20.0
30.0
Inte
rnat
ion
al
E
qu
ity
(%)
-20.0 -10.0 0.0 10.0 20.0 30.0
International Policy (%)
Over
Performance
Under
Performance
0.0
25.0
50.0
75.0
100.0
Re
turn
Pe
rce
nti
le R
an
k
12/10 6/11 12/11 6/12 12/12 6/13 12/13 6/14 12/14 9/15
Total Period5-25
Count25-Median
CountMedian-75
Count75-95Count
International Equity 20 18 (90%) 2 (10%) 0 (0%) 0 (0%)��
International Policy 20 0 (0%) 0 (0%) 6 (30%) 14 (70%)��
0.00
2.00
4.00
6.00
8.00
10.00
Re
turn
(%)
9.60 9.90 10.20 10.50 10.80 11.10 11.40 11.70 12.00
Risk (Standard Deviation %)
ReturnStandardDeviation
International Equity 8.21 10.17��
International Policy 2.34 11.55��
Median 6.47 11.38¾
0.00
2.00
4.00
6.00
8.00
10.00
Re
turn
(%)
14.20 14.40 14.60 14.80 15.00 15.20
Risk (Standard Deviation %)
ReturnStandardDeviation
International Equity 7.54 14.45��
International Policy 1.82 14.88��
Median 5.30 14.99¾
TrackingError
UpMarketCapture
DownMarketCapture
AlphaInformation
RatioSharpeRatio
BetaDownside
Risk
International Equity 4.22 106.31 68.85 6.05 1.31 0.78 0.88 6.07
International Policy 0.00 100.00 100.00 0.00 N/A 0.26 1.00 7.73 90 Day U.S. Treasury Bill 11.45 0.18 -0.15 0.05 -0.26 N/A 0.00 0.01
TrackingError
UpMarketCapture
DownMarketCapture
AlphaInformation
RatioSharpeRatio
BetaDownside
Risk
International Equity 3.72 109.82 81.93 5.71 1.47 0.56 0.96 9.47
International Policy 0.00 100.00 100.00 0.00 N/A 0.19 1.00 10.62 90 Day U.S. Treasury Bill 15.00 0.18 -0.14 0.07 -0.19 N/A 0.00 0.01
Performance Review
As of September 30, 2015
International Equity
NONE
41
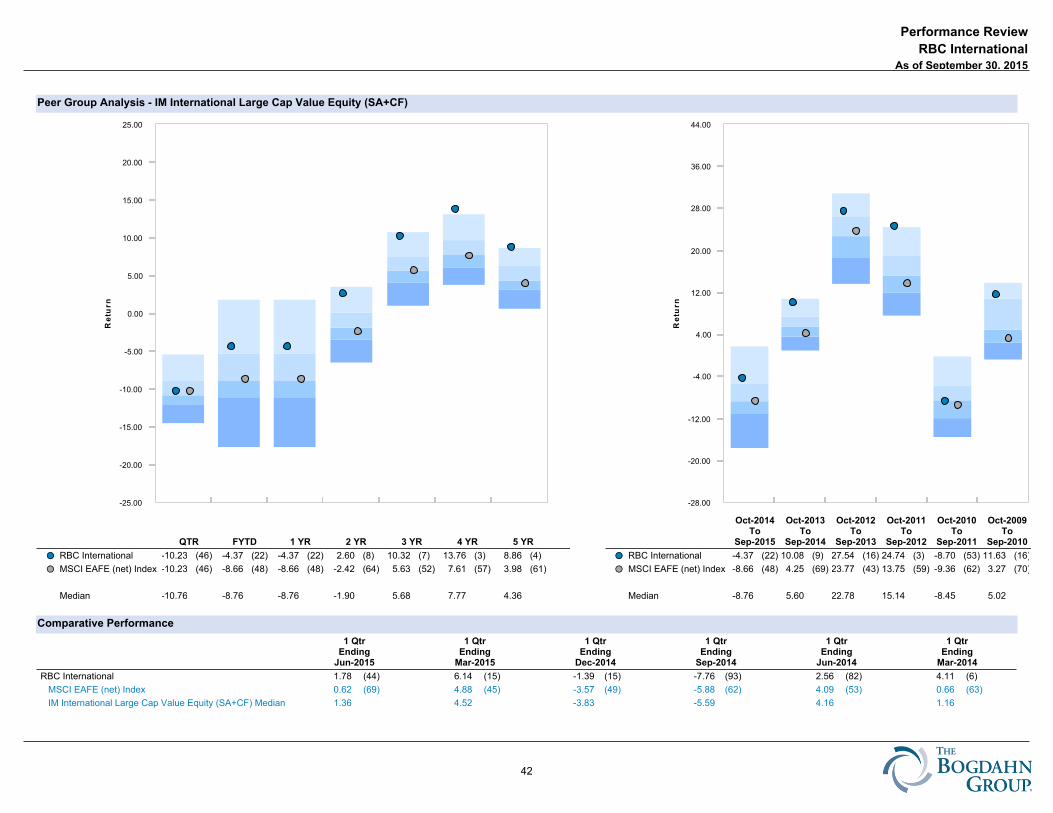
Peer Group Analysis - IM International Large Cap Value Equity (SA+CF)
Comparative Performance
-25.00
-20.00
-15.00
-10.00
-5.00
0.00
5.00
10.00
15.00
20.00
25.00
Re
turn
QTR FYTD 1 YR 2 YR 3 YR 4 YR 5 YR
RBC International -10.23 (46) -4.37 (22) -4.37 (22) 2.60 (8) 10.32 (7) 13.76 (3) 8.86 (4)��
MSCI EAFE (net) Index -10.23 (46) -8.66 (48) -8.66 (48) -2.42 (64) 5.63 (52) 7.61 (57) 3.98 (61)��
Median -10.76 -8.76 -8.76 -1.90 5.68 7.77 4.36
-28.00
-20.00
-12.00
-4.00
4.00
12.00
20.00
28.00
36.00
44.00
Re
turn
Oct-2014To
Sep-2015
Oct-2013To
Sep-2014
Oct-2012To
Sep-2013
Oct-2011To
Sep-2012
Oct-2010To
Sep-2011
Oct-2009To
Sep-2010
RBC International -4.37 (22) 10.08 (9) 27.54 (16) 24.74 (3) -8.70 (53) 11.63 (16)��
MSCI EAFE (net) Index -8.66 (48) 4.25 (69) 23.77 (43) 13.75 (59) -9.36 (62) 3.27 (70)��
Median -8.76 5.60 22.78 15.14 -8.45 5.02
1 QtrEnding
Jun-2015
1 QtrEnding
Mar-2015
1 QtrEnding
Dec-2014
1 QtrEnding
Sep-2014
1 QtrEnding
Jun-2014
1 QtrEnding
Mar-2014
RBC International 1.78 (44) 6.14 (15) -1.39 (15) -7.76 (93) 2.56 (82) 4.11 (6)
MSCI EAFE (net) Index 0.62 (69) 4.88 (45) -3.57 (49) -5.88 (62) 4.09 (53) 0.66 (63)
IM International Large Cap Value Equity (SA+CF) Median 1.36 4.52 -3.83 -5.59 4.16 1.16
Performance Review
As of September 30, 2015
RBC International
NONE
42

Peer Group Scattergram - 3 Years
3 Yr Rolling Under/Over Performance - 5 Years
Peer Group Scattergram - 5 Years
3 Yr Rolling Percentile Ranking - 5 Years
Historical Statistics - 3 Years
Historical Statistics - 5 Years
Over Performance Earliest Date Latest Date
-15.0
0.0
15.0
30.0
45.0
RB
C In
tern
ati
on
al
(%
)
-15.0 0.0 15.0 30.0 45.0
MSCI EAFE (net) Index (%)
Over
Performance
Under
Performance
0.0
25.0
50.0
75.0
100.0
Re
turn
Pe
rce
nti
le R
an
k
12/10 6/11 12/11 6/12 12/12 6/13 12/13 6/14 12/14 9/15
Total Period5-25
Count25-Median
CountMedian-75
Count75-95Count
RBC International 20 17 (85%) 2 (10%) 1 (5%) 0 (0%)��
MSCI EAFE (net) Index 20 0 (0%) 2 (10%) 14 (70%) 4 (20%)��
4.00
6.00
8.00
10.00
12.00
Re
turn
(%)
11.07 11.34 11.61 11.88 12.15 12.42 12.69 12.96
Risk (Standard Deviation %)
ReturnStandardDeviation
RBC International 10.32 12.75��
MSCI EAFE (net) Index 5.63 11.57��
Median 5.68 11.52¾
2.00
4.00
6.00
8.00
10.00
Re
turn
(%)
13.65 14.30 14.95 15.60 16.25 16.90 17.55 18.20
Risk (Standard Deviation %)
ReturnStandardDeviation
RBC International 8.86 17.27��
MSCI EAFE (net) Index 3.98 14.46��
Median 4.36 14.73¾
TrackingError
UpMarketCapture
DownMarketCapture
AlphaInformation
RatioSharpeRatio
BetaDownside
Risk
RBC International 4.88 109.86 82.24 4.91 0.90 0.88 0.93 6.64
MSCI EAFE (net) Index 0.00 100.00 100.00 0.00 N/A 0.52 1.00 7.32 90 Day U.S. Treasury Bill 11.78 0.14 -0.18 0.05 -0.52 N/A 0.00 0.01
TrackingError
UpMarketCapture
DownMarketCapture
AlphaInformation
RatioSharpeRatio
BetaDownside
Risk
RBC International 5.43 112.05 89.55 4.85 0.88 0.61 1.00 10.07
MSCI EAFE (net) Index 0.00 100.00 100.00 0.00 N/A 0.33 1.00 10.34 90 Day U.S. Treasury Bill 15.10 0.16 -0.16 0.07 -0.33 N/A 0.00 0.01
Performance Review
As of September 30, 2015
RBC International
NONE
43
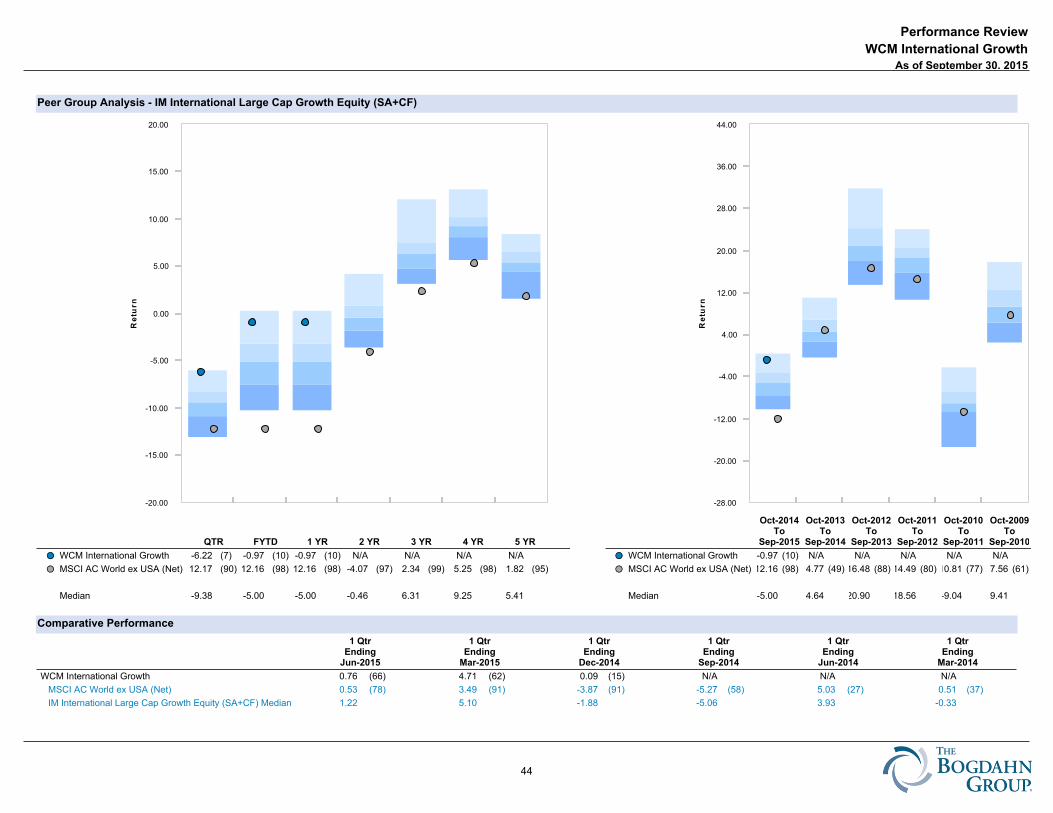
Peer Group Analysis - IM International Large Cap Growth Equity (SA+CF)
Comparative Performance
-20.00
-15.00
-10.00
-5.00
0.00
5.00
10.00
15.00
20.00R
etu
rn
QTR FYTD 1 YR 2 YR 3 YR 4 YR 5 YR
WCM International Growth -6.22 (7) -0.97 (10) -0.97 (10) N/A N/A N/A N/A��
MSCI AC World ex USA (Net) -12.17 (90)-12.16 (98)-12.16 (98) -4.07 (97) 2.34 (99) 5.25 (98) 1.82 (95)��
Median -9.38 -5.00 -5.00 -0.46 6.31 9.25 5.41
-28.00
-20.00
-12.00
-4.00
4.00
12.00
20.00
28.00
36.00
44.00
Re
turn
Oct-2014To
Sep-2015
Oct-2013To
Sep-2014
Oct-2012To
Sep-2013
Oct-2011To
Sep-2012
Oct-2010To
Sep-2011
Oct-2009To
Sep-2010
WCM International Growth -0.97 (10) N/A N/A N/A N/A N/A��
MSCI AC World ex USA (Net)-12.16 (98) 4.77 (49) 16.48 (88) 14.49 (80)-10.81 (77) 7.56 (61)��
Median -5.00 4.64 20.90 18.56 -9.04 9.41
1 QtrEnding
Jun-2015
1 QtrEnding
Mar-2015
1 QtrEnding
Dec-2014
1 QtrEnding
Sep-2014
1 QtrEnding
Jun-2014
1 QtrEnding
Mar-2014
WCM International Growth 0.76 (66) 4.71 (62) 0.09 (15) N/A N/A N/A
MSCI AC World ex USA (Net) 0.53 (78) 3.49 (91) -3.87 (91) -5.27 (58) 5.03 (27) 0.51 (37)
IM International Large Cap Growth Equity (SA+CF) Median 1.22 5.10 -1.88 -5.06 3.93 -0.33
Performance Review
As of September 30, 2015
WCM International Growth
NONE
44

Page Intentionally Left Blank
45
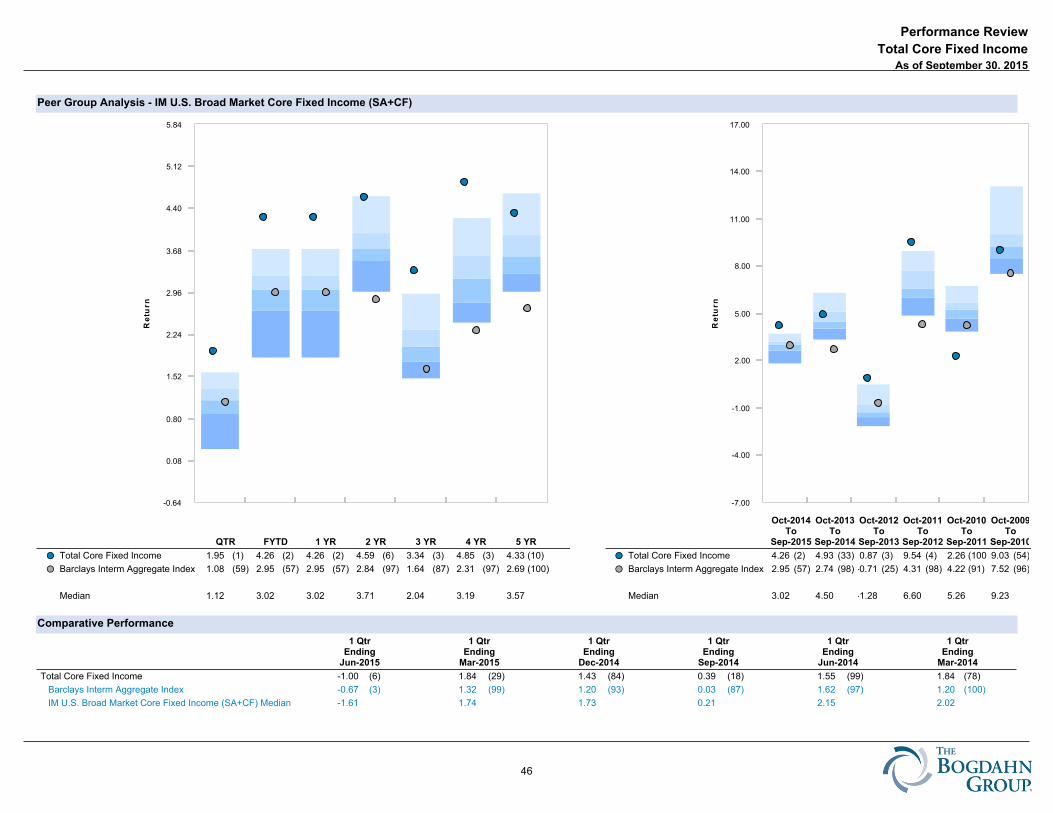
Peer Group Analysis - IM U.S. Broad Market Core Fixed Income (SA+CF)
Comparative Performance
-0.64
0.08
0.80
1.52
2.24
2.96
3.68
4.40
5.12
5.84
Re
turn
QTR FYTD 1 YR 2 YR 3 YR 4 YR 5 YR
Total Core Fixed Income 1.95 (1) 4.26 (2) 4.26 (2) 4.59 (6) 3.34 (3) 4.85 (3) 4.33 (10)��
Barclays Interm Aggregate Index 1.08 (59) 2.95 (57) 2.95 (57) 2.84 (97) 1.64 (87) 2.31 (97) 2.69 (100)��
Median 1.12 3.02 3.02 3.71 2.04 3.19 3.57
-7.00
-4.00
-1.00
2.00
5.00
8.00
11.00
14.00
17.00
Re
turn
Oct-2014To
Sep-2015
Oct-2013To
Sep-2014
Oct-2012To
Sep-2013
Oct-2011To
Sep-2012
Oct-2010To
Sep-2011
Oct-2009To
Sep-2010
Total Core Fixed Income 4.26 (2) 4.93 (33) 0.87 (3) 9.54 (4) 2.26 (100) 9.03 (54)��
Barclays Interm Aggregate Index 2.95 (57) 2.74 (98) -0.71 (25) 4.31 (98) 4.22 (91) 7.52 (96)��
Median 3.02 4.50 -1.28 6.60 5.26 9.23
1 QtrEnding
Jun-2015
1 QtrEnding
Mar-2015
1 QtrEnding
Dec-2014
1 QtrEnding
Sep-2014
1 QtrEnding
Jun-2014
1 QtrEnding
Mar-2014
Total Core Fixed Income -1.00 (6) 1.84 (29) 1.43 (84) 0.39 (18) 1.55 (99) 1.84 (78)
Barclays Interm Aggregate Index -0.67 (3) 1.32 (99) 1.20 (93) 0.03 (87) 1.62 (97) 1.20 (100)
IM U.S. Broad Market Core Fixed Income (SA+CF) Median -1.61 1.74 1.73 0.21 2.15 2.02
Performance Review
As of September 30, 2015
Total Core Fixed Income
NONE
46
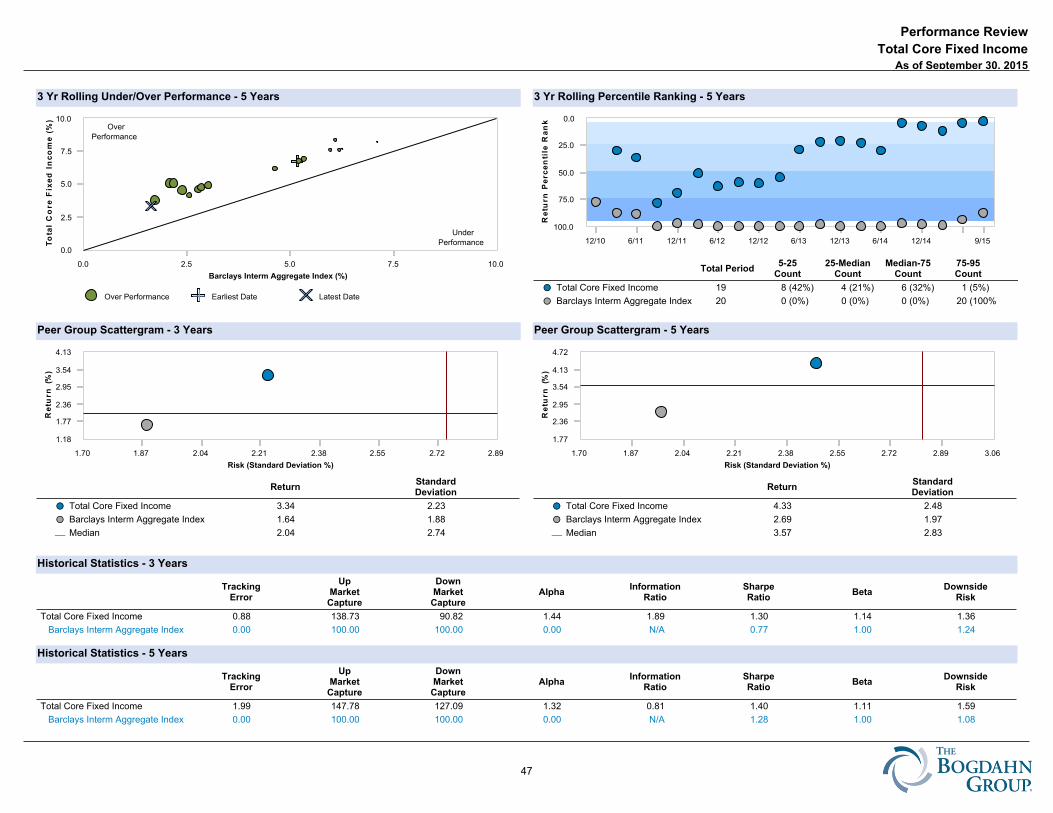
Peer Group Scattergram - 3 Years
3 Yr Rolling Under/Over Performance - 5 Years
Peer Group Scattergram - 5 Years
3 Yr Rolling Percentile Ranking - 5 Years
Historical Statistics - 3 Years
Historical Statistics - 5 Years
Over Performance Earliest Date Latest Date
0.0
2.5
5.0
7.5
10.0
To
tal
C
ore
Fix
ed
Inc
om
e (%
)
0.0 2.5 5.0 7.5 10.0
Barclays Interm Aggregate Index (%)
Over
Performance
Under
Performance
0.0
25.0
50.0
75.0
100.0
Re
turn
Pe
rce
nti
le R
an
k
12/10 6/11 12/11 6/12 12/12 6/13 12/13 6/14 12/14 9/15
Total Period5-25
Count25-Median
CountMedian-75
Count75-95Count
Total Core Fixed Income 19 8 (42%) 4 (21%) 6 (32%) 1 (5%)��
Barclays Interm Aggregate Index 20 0 (0%) 0 (0%) 0 (0%) 20 (100%)��
1.18
1.77
2.36
2.95
3.54
4.13
Re
turn
(%)
1.70 1.87 2.04 2.21 2.38 2.55 2.72 2.89
Risk (Standard Deviation %)
ReturnStandardDeviation
Total Core Fixed Income 3.34 2.23��
Barclays Interm Aggregate Index 1.64 1.88��
Median 2.04 2.74¾
1.77
2.36
2.95
3.54
4.13
4.72
Re
turn
(%)
1.70 1.87 2.04 2.21 2.38 2.55 2.72 2.89 3.06
Risk (Standard Deviation %)
ReturnStandardDeviation
Total Core Fixed Income 4.33 2.48��
Barclays Interm Aggregate Index 2.69 1.97��
Median 3.57 2.83¾
TrackingError
UpMarketCapture
DownMarketCapture
AlphaInformation
RatioSharpeRatio
BetaDownside
Risk
Total Core Fixed Income 0.88 138.73 90.82 1.44 1.89 1.30 1.14 1.36
Barclays Interm Aggregate Index 0.00 100.00 100.00 0.00 N/A 0.77 1.00 1.24 90 Day U.S. Treasury Bill 2.08 0.88 -0.88 0.05 -0.77 N/A 0.00 0.01
TrackingError
UpMarketCapture
DownMarketCapture
AlphaInformation
RatioSharpeRatio
BetaDownside
Risk
Total Core Fixed Income 1.99 147.78 127.09 1.32 0.81 1.40 1.11 1.59
Barclays Interm Aggregate Index 0.00 100.00 100.00 0.00 N/A 1.28 1.00 1.08 90 Day U.S. Treasury Bill 2.03 1.05 -1.24 0.07 -1.28 N/A 0.00 0.01
Performance Review
As of September 30, 2015
Total Core Fixed Income
NONE
47
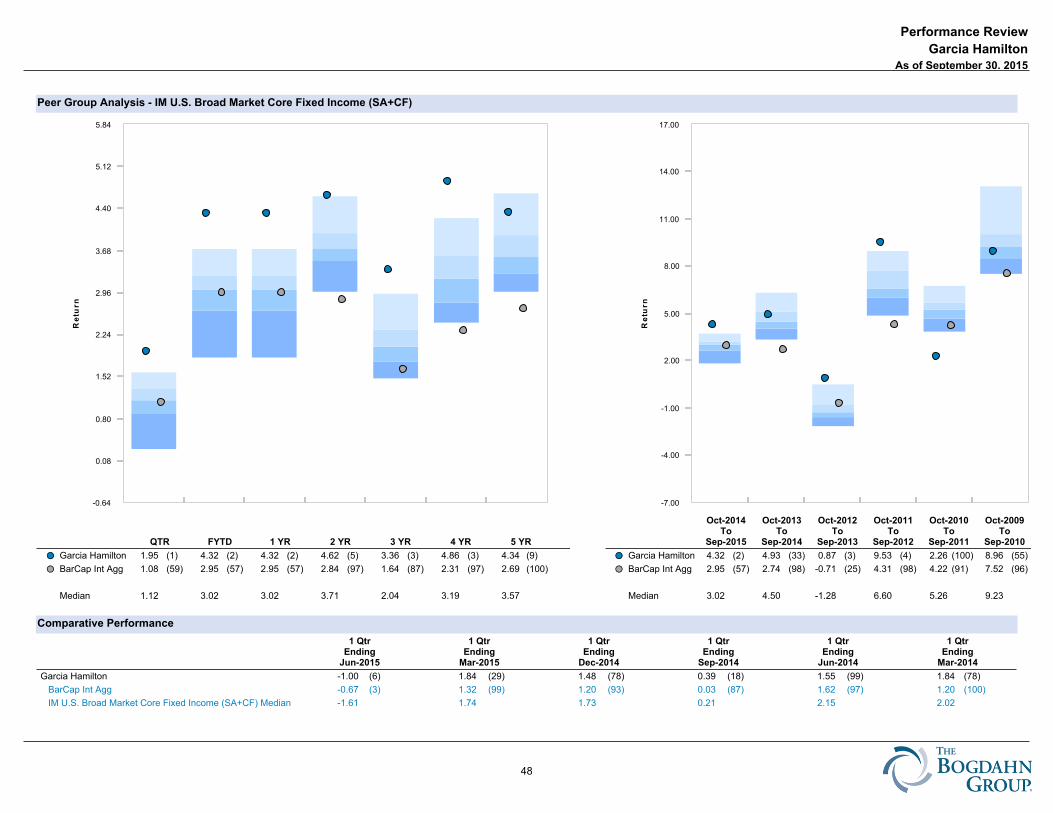
Peer Group Analysis - IM U.S. Broad Market Core Fixed Income (SA+CF)
Comparative Performance
-0.64
0.08
0.80
1.52
2.24
2.96
3.68
4.40
5.12
5.84
Re
turn
QTR FYTD 1 YR 2 YR 3 YR 4 YR 5 YR
Garcia Hamilton 1.95 (1) 4.32 (2) 4.32 (2) 4.62 (5) 3.36 (3) 4.86 (3) 4.34 (9)��
BarCap Int Agg 1.08 (59) 2.95 (57) 2.95 (57) 2.84 (97) 1.64 (87) 2.31 (97) 2.69 (100)��
Median 1.12 3.02 3.02 3.71 2.04 3.19 3.57
-7.00
-4.00
-1.00
2.00
5.00
8.00
11.00
14.00
17.00
Re
turn
Oct-2014To
Sep-2015
Oct-2013To
Sep-2014
Oct-2012To
Sep-2013
Oct-2011To
Sep-2012
Oct-2010To
Sep-2011
Oct-2009To
Sep-2010
Garcia Hamilton 4.32 (2) 4.93 (33) 0.87 (3) 9.53 (4) 2.26 (100) 8.96 (55)��
BarCap Int Agg 2.95 (57) 2.74 (98) -0.71 (25) 4.31 (98) 4.22 (91) 7.52 (96)��
Median 3.02 4.50 -1.28 6.60 5.26 9.23
1 QtrEnding
Jun-2015
1 QtrEnding
Mar-2015
1 QtrEnding
Dec-2014
1 QtrEnding
Sep-2014
1 QtrEnding
Jun-2014
1 QtrEnding
Mar-2014
Garcia Hamilton -1.00 (6) 1.84 (29) 1.48 (78) 0.39 (18) 1.55 (99) 1.84 (78)
BarCap Int Agg -0.67 (3) 1.32 (99) 1.20 (93) 0.03 (87) 1.62 (97) 1.20 (100)
IM U.S. Broad Market Core Fixed Income (SA+CF) Median -1.61 1.74 1.73 0.21 2.15 2.02
Performance Review
As of September 30, 2015
Garcia Hamilton
NONE
48
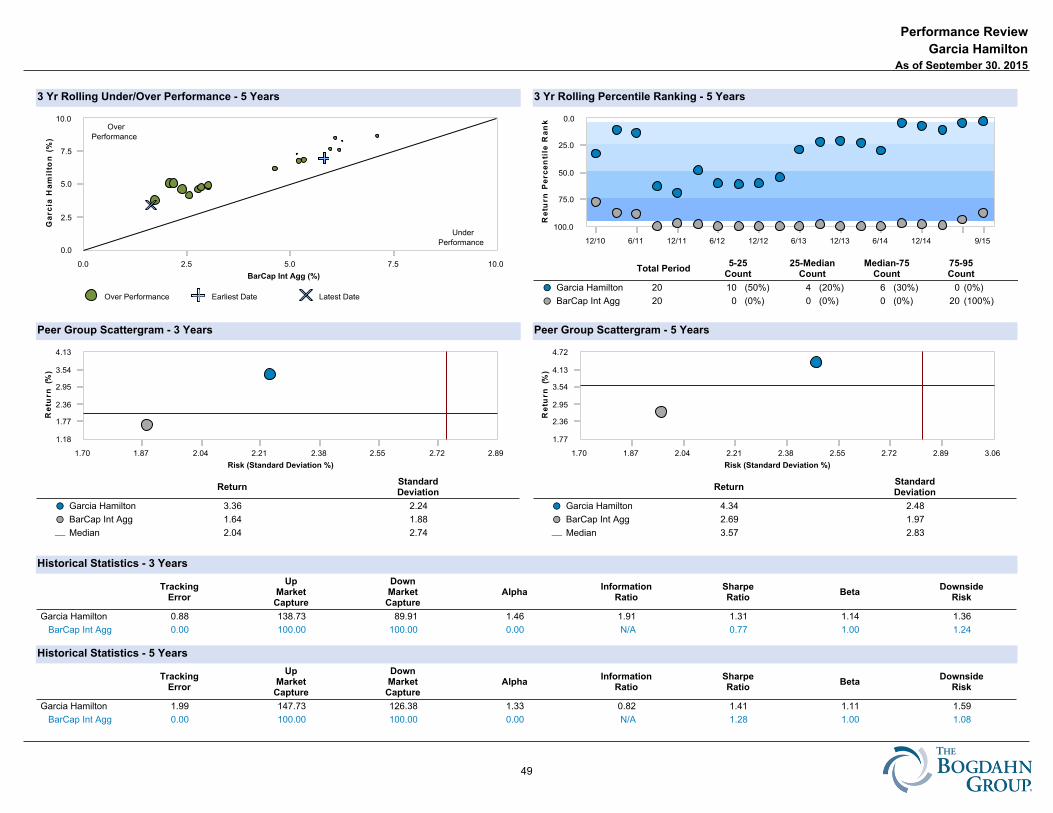
Peer Group Scattergram - 3 Years
3 Yr Rolling Under/Over Performance - 5 Years
Peer Group Scattergram - 5 Years
3 Yr Rolling Percentile Ranking - 5 Years
Historical Statistics - 3 Years
Historical Statistics - 5 Years
Over Performance Earliest Date Latest Date
0.0
2.5
5.0
7.5
10.0
Ga
rcia
Ha
mil
ton
(%)
0.0 2.5 5.0 7.5 10.0
BarCap Int Agg (%)
Over
Performance
Under
Performance
0.0
25.0
50.0
75.0
100.0
Re
turn
Pe
rce
nti
le R
an
k
12/10 6/11 12/11 6/12 12/12 6/13 12/13 6/14 12/14 9/15
Total Period5-25
Count25-Median
CountMedian-75
Count75-95Count
Garcia Hamilton 20 10 (50%) 4 (20%) 6 (30%) 0 (0%)��
BarCap Int Agg 20 0 (0%) 0 (0%) 0 (0%) 20 (100%)��
1.18
1.77
2.36
2.95
3.54
4.13
Re
turn
(%)
1.70 1.87 2.04 2.21 2.38 2.55 2.72 2.89
Risk (Standard Deviation %)
ReturnStandardDeviation
Garcia Hamilton 3.36 2.24��
BarCap Int Agg 1.64 1.88��
Median 2.04 2.74¾
1.77
2.36
2.95
3.54
4.13
4.72
Re
turn
(%)
1.70 1.87 2.04 2.21 2.38 2.55 2.72 2.89 3.06
Risk (Standard Deviation %)
ReturnStandardDeviation
Garcia Hamilton 4.34 2.48��
BarCap Int Agg 2.69 1.97��
Median 3.57 2.83¾
TrackingError
UpMarketCapture
DownMarketCapture
AlphaInformation
RatioSharpeRatio
BetaDownside
Risk
Garcia Hamilton 0.88 138.73 89.91 1.46 1.91 1.31 1.14 1.36
BarCap Int Agg 0.00 100.00 100.00 0.00 N/A 0.77 1.00 1.24 90 Day U.S. Treasury Bill 2.08 0.88 -0.88 0.05 -0.77 N/A 0.00 0.01
TrackingError
UpMarketCapture
DownMarketCapture
AlphaInformation
RatioSharpeRatio
BetaDownside
Risk
Garcia Hamilton 1.99 147.73 126.38 1.33 0.82 1.41 1.11 1.59
BarCap Int Agg 0.00 100.00 100.00 0.00 N/A 1.28 1.00 1.08 90 Day U.S. Treasury Bill 2.03 1.05 -1.24 0.07 -1.28 N/A 0.00 0.01
Performance Review
As of September 30, 2015
Garcia Hamilton
NONE
49
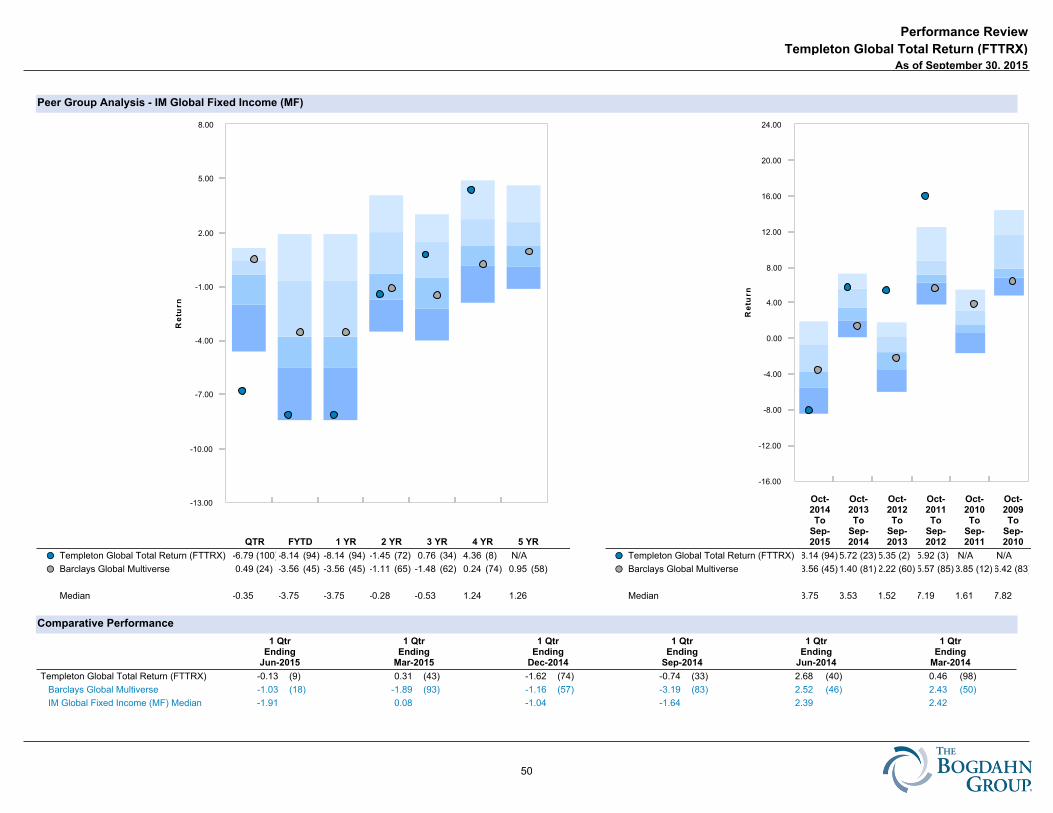
Peer Group Analysis - IM Global Fixed Income (MF)
Comparative Performance
-13.00
-10.00
-7.00
-4.00
-1.00
2.00
5.00
8.00
Re
turn
QTR FYTD 1 YR 2 YR 3 YR 4 YR 5 YR
Templeton Global Total Return (FTTRX) -6.79 (100)-8.14 (94) -8.14 (94) -1.45 (72) 0.76 (34) 4.36 (8) N/A��
Barclays Global Multiverse 0.49 (24) -3.56 (45) -3.56 (45) -1.11 (65) -1.48 (62) 0.24 (74) 0.95 (58)��
Median -0.35 -3.75 -3.75 -0.28 -0.53 1.24 1.26
-16.00
-12.00
-8.00
-4.00
0.00
4.00
8.00
12.00
16.00
20.00
24.00
Re
turn
Oct-2014To
Sep-2015
Oct-2013To
Sep-2014
Oct-2012To
Sep-2013
Oct-2011To
Sep-2012
Oct-2010To
Sep-2011
Oct-2009To
Sep-2010
Templeton Global Total Return (FTTRX) -8.14 (94) 5.72 (23) 5.35 (2) 15.92 (3) N/A N/A��
Barclays Global Multiverse -3.56 (45) 1.40 (81)-2.22 (60) 5.57 (85) 3.85 (12) 6.42 (83)��
Median -3.75 3.53 -1.52 7.19 1.61 7.82
1 QtrEnding
Jun-2015
1 QtrEnding
Mar-2015
1 QtrEnding
Dec-2014
1 QtrEnding
Sep-2014
1 QtrEnding
Jun-2014
1 QtrEnding
Mar-2014
Templeton Global Total Return (FTTRX) -0.13 (9) 0.31 (43) -1.62 (74) -0.74 (33) 2.68 (40) 0.46 (98)
Barclays Global Multiverse -1.03 (18) -1.89 (93) -1.16 (57) -3.19 (83) 2.52 (46) 2.43 (50)
IM Global Fixed Income (MF) Median -1.91 0.08 -1.04 -1.64 2.39 2.42
Performance Review
As of September 30, 2015
Templeton Global Total Return (FTTRX)
NONE
50
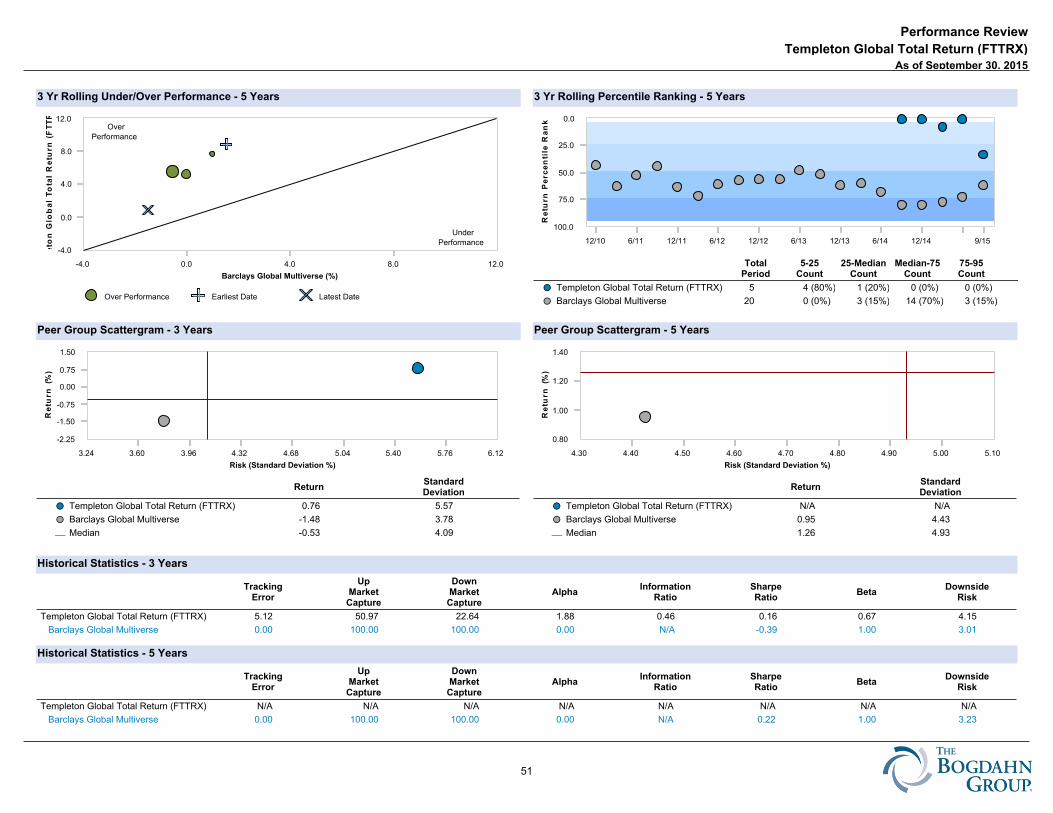
Peer Group Scattergram - 3 Years
3 Yr Rolling Under/Over Performance - 5 Years
Peer Group Scattergram - 5 Years
3 Yr Rolling Percentile Ranking - 5 Years
Historical Statistics - 3 Years
Historical Statistics - 5 Years
Over Performance Earliest Date Latest Date
-4.0
0.0
4.0
8.0
12.0
Te
mp
leto
n G
lob
al
T
ota
l
Re
turn
(FT
TR
X)
(%
)
-4.0 0.0 4.0 8.0 12.0
Barclays Global Multiverse (%)
Over
Performance
Under
Performance
0.0
25.0
50.0
75.0
100.0
Re
turn
Pe
rce
nti
le R
an
k
12/10 6/11 12/11 6/12 12/12 6/13 12/13 6/14 12/14 9/15
TotalPeriod
5-25Count
25-MedianCount
Median-75Count
75-95Count
Templeton Global Total Return (FTTRX) 5 4 (80%) 1 (20%) 0 (0%) 0 (0%)��
Barclays Global Multiverse 20 0 (0%) 3 (15%) 14 (70%) 3 (15%)��
-2.25
-1.50
-0.75
0.00
0.75
1.50
Re
turn
(%)
3.24 3.60 3.96 4.32 4.68 5.04 5.40 5.76 6.12
Risk (Standard Deviation %)
ReturnStandardDeviation
Templeton Global Total Return (FTTRX) 0.76 5.57��
Barclays Global Multiverse -1.48 3.78��
Median -0.53 4.09¾
0.80
1.00
1.20
1.40
Re
turn
(%)
4.30 4.40 4.50 4.60 4.70 4.80 4.90 5.00 5.10
Risk (Standard Deviation %)
ReturnStandardDeviation
Templeton Global Total Return (FTTRX) N/A N/A��
Barclays Global Multiverse 0.95 4.43��
Median 1.26 4.93¾
TrackingError
UpMarketCapture
DownMarketCapture
AlphaInformation
RatioSharpeRatio
BetaDownside
Risk
Templeton Global Total Return (FTTRX) 5.12 50.97 22.64 1.88 0.46 0.16 0.67 4.15
Barclays Global Multiverse 0.00 100.00 100.00 0.00 N/A -0.39 1.00 3.01 90 Day U.S. Treasury Bill 3.78 0.64 -0.41 0.05 0.39 N/A 0.00 0.01
TrackingError
UpMarketCapture
DownMarketCapture
AlphaInformation
RatioSharpeRatio
BetaDownside
Risk
Templeton Global Total Return (FTTRX) N/A N/A N/A N/A N/A N/A N/A N/A
Barclays Global Multiverse 0.00 100.00 100.00 0.00 N/A 0.22 1.00 3.23 90 Day U.S. Treasury Bill 4.42 0.72 -0.35 0.06 -0.22 N/A 0.00 0.01
Performance Review
As of September 30, 2015
Templeton Global Total Return (FTTRX)
NONE
51
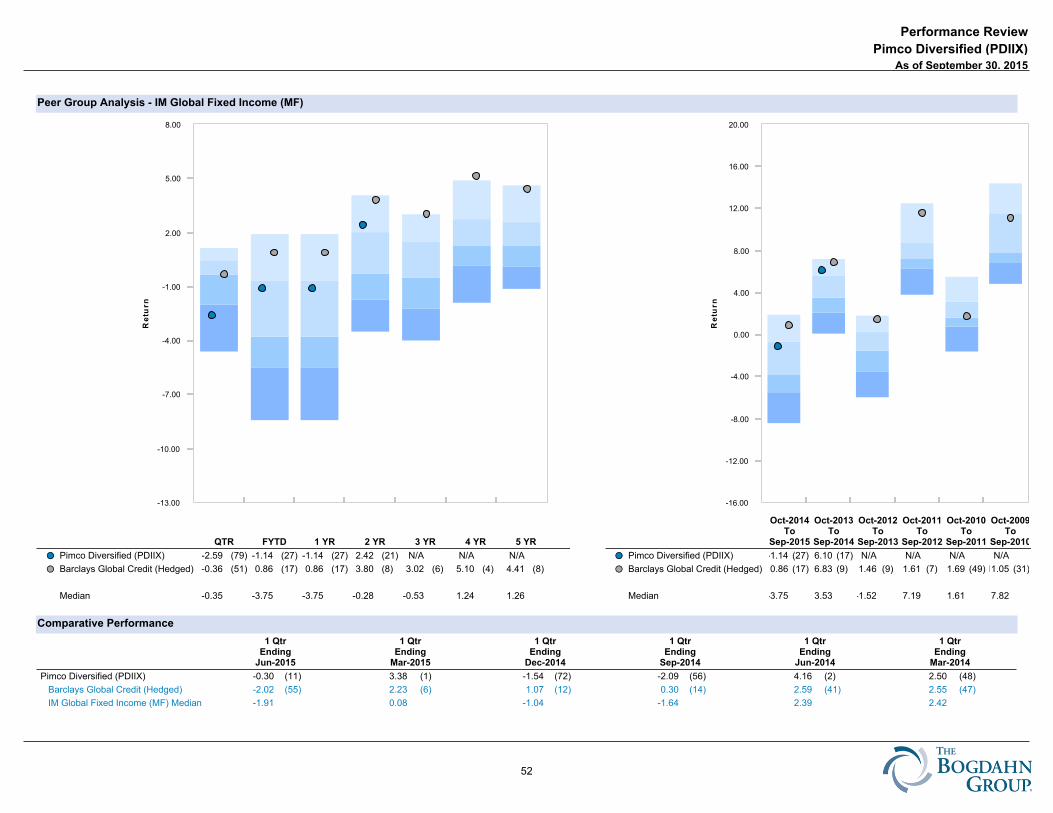
Peer Group Analysis - IM Global Fixed Income (MF)
Comparative Performance
-13.00
-10.00
-7.00
-4.00
-1.00
2.00
5.00
8.00
Re
turn
QTR FYTD 1 YR 2 YR 3 YR 4 YR 5 YR
Pimco Diversified (PDIIX) -2.59 (79) -1.14 (27) -1.14 (27) 2.42 (21) N/A N/A N/A��
Barclays Global Credit (Hedged) -0.36 (51) 0.86 (17) 0.86 (17) 3.80 (8) 3.02 (6) 5.10 (4) 4.41 (8)��
Median -0.35 -3.75 -3.75 -0.28 -0.53 1.24 1.26
-16.00
-12.00
-8.00
-4.00
0.00
4.00
8.00
12.00
16.00
20.00
Re
turn
Oct-2014To
Sep-2015
Oct-2013To
Sep-2014
Oct-2012To
Sep-2013
Oct-2011To
Sep-2012
Oct-2010To
Sep-2011
Oct-2009To
Sep-2010
Pimco Diversified (PDIIX) -1.14 (27) 6.10 (17) N/A N/A N/A N/A��
Barclays Global Credit (Hedged) 0.86 (17) 6.83 (9) 1.46 (9) 11.61 (7) 1.69 (49)11.05 (31)��
Median -3.75 3.53 -1.52 7.19 1.61 7.82
1 QtrEnding
Jun-2015
1 QtrEnding
Mar-2015
1 QtrEnding
Dec-2014
1 QtrEnding
Sep-2014
1 QtrEnding
Jun-2014
1 QtrEnding
Mar-2014
Pimco Diversified (PDIIX) -0.30 (11) 3.38 (1) -1.54 (72) -2.09 (56) 4.16 (2) 2.50 (48)
Barclays Global Credit (Hedged) -2.02 (55) 2.23 (6) 1.07 (12) 0.30 (14) 2.59 (41) 2.55 (47)
IM Global Fixed Income (MF) Median -1.91 0.08 -1.04 -1.64 2.39 2.42
Performance Review
As of September 30, 2015
Pimco Diversified (PDIIX)
NONE
52
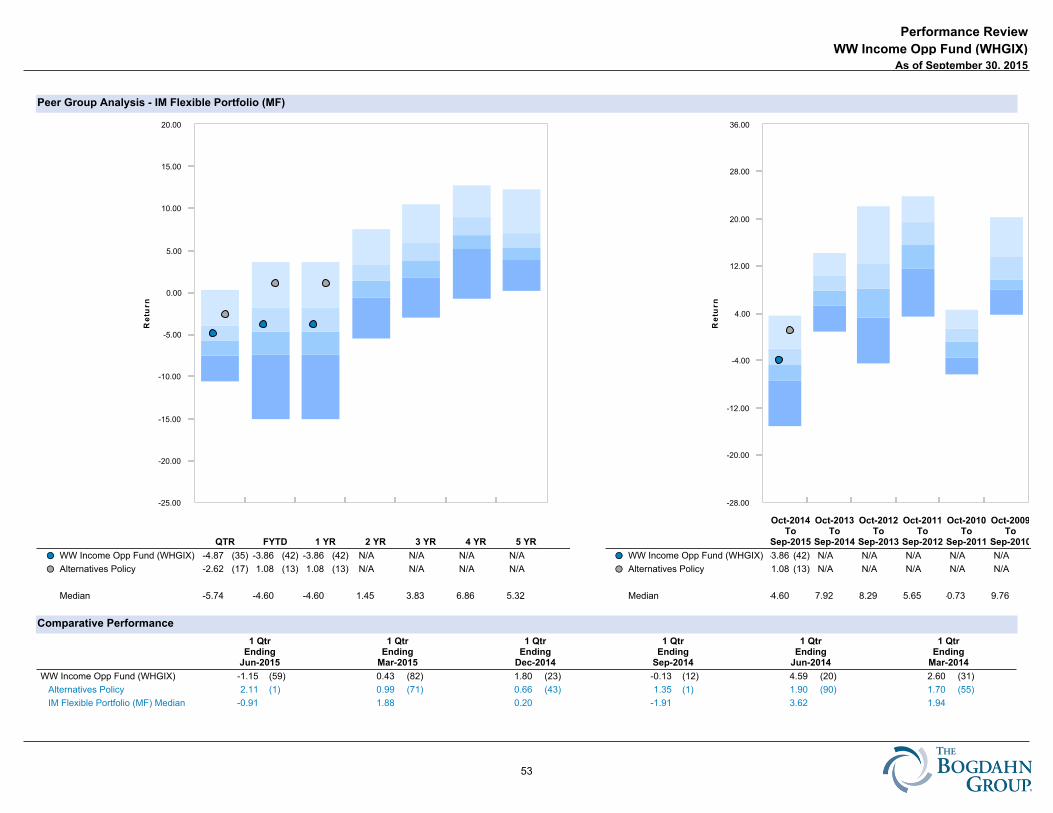
Peer Group Analysis - IM Flexible Portfolio (MF)
Comparative Performance
-25.00
-20.00
-15.00
-10.00
-5.00
0.00
5.00
10.00
15.00
20.00
Re
turn
QTR FYTD 1 YR 2 YR 3 YR 4 YR 5 YR
WW Income Opp Fund (WHGIX) -4.87 (35) -3.86 (42) -3.86 (42) N/A N/A N/A N/A��
Alternatives Policy -2.62 (17) 1.08 (13) 1.08 (13) N/A N/A N/A N/A��
Median -5.74 -4.60 -4.60 1.45 3.83 6.86 5.32
-28.00
-20.00
-12.00
-4.00
4.00
12.00
20.00
28.00
36.00
Re
turn
Oct-2014To
Sep-2015
Oct-2013To
Sep-2014
Oct-2012To
Sep-2013
Oct-2011To
Sep-2012
Oct-2010To
Sep-2011
Oct-2009To
Sep-2010
WW Income Opp Fund (WHGIX) -3.86 (42) N/A N/A N/A N/A N/A��
Alternatives Policy 1.08 (13) N/A N/A N/A N/A N/A��
Median -4.60 7.92 8.29 15.65 -0.73 9.76
1 QtrEnding
Jun-2015
1 QtrEnding
Mar-2015
1 QtrEnding
Dec-2014
1 QtrEnding
Sep-2014
1 QtrEnding
Jun-2014
1 QtrEnding
Mar-2014
WW Income Opp Fund (WHGIX) -1.15 (59) 0.43 (82) 1.80 (23) -0.13 (12) 4.59 (20) 2.60 (31)
Alternatives Policy 2.11 (1) 0.99 (71) 0.66 (43) 1.35 (1) 1.90 (90) 1.70 (55)
IM Flexible Portfolio (MF) Median -0.91 1.88 0.20 -1.91 3.62 1.94
Performance Review
As of September 30, 2015
WW Income Opp Fund (WHGIX)
NONE
53
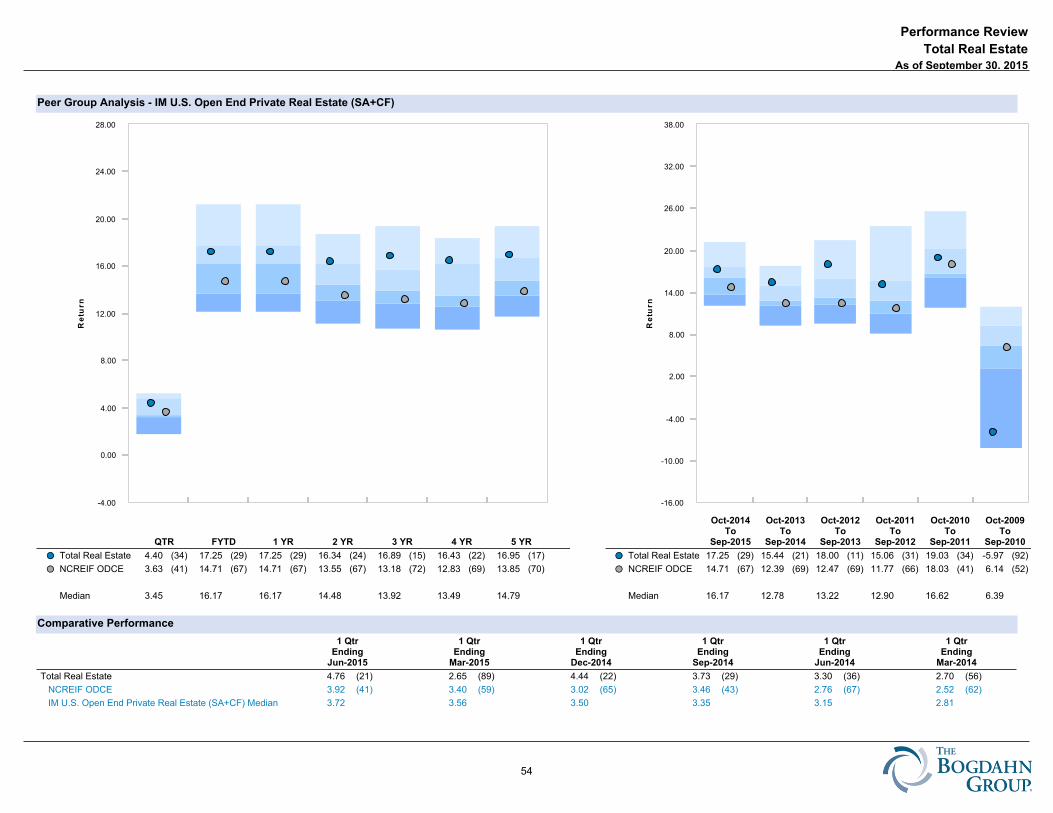
Peer Group Analysis - IM U.S. Open End Private Real Estate (SA+CF)
Comparative Performance
-4.00
0.00
4.00
8.00
12.00
16.00
20.00
24.00
28.00
Re
turn
QTR FYTD 1 YR 2 YR 3 YR 4 YR 5 YR
Total Real Estate 4.40 (34) 17.25 (29) 17.25 (29) 16.34 (24) 16.89 (15) 16.43 (22) 16.95 (17)��
NCREIF ODCE 3.63 (41) 14.71 (67) 14.71 (67) 13.55 (67) 13.18 (72) 12.83 (69) 13.85 (70)��
Median 3.45 16.17 16.17 14.48 13.92 13.49 14.79
-16.00
-10.00
-4.00
2.00
8.00
14.00
20.00
26.00
32.00
38.00
Re
turn
Oct-2014To
Sep-2015
Oct-2013To
Sep-2014
Oct-2012To
Sep-2013
Oct-2011To
Sep-2012
Oct-2010To
Sep-2011
Oct-2009To
Sep-2010
Total Real Estate 17.25 (29) 15.44 (21) 18.00 (11) 15.06 (31) 19.03 (34) -5.97 (92)��
NCREIF ODCE 14.71 (67) 12.39 (69) 12.47 (69) 11.77 (66) 18.03 (41) 6.14 (52)��
Median 16.17 12.78 13.22 12.90 16.62 6.39
1 QtrEnding
Jun-2015
1 QtrEnding
Mar-2015
1 QtrEnding
Dec-2014
1 QtrEnding
Sep-2014
1 QtrEnding
Jun-2014
1 QtrEnding
Mar-2014
Total Real Estate 4.76 (21) 2.65 (89) 4.44 (22) 3.73 (29) 3.30 (36) 2.70 (56)
NCREIF ODCE 3.92 (41) 3.40 (59) 3.02 (65) 3.46 (43) 2.76 (67) 2.52 (62)
IM U.S. Open End Private Real Estate (SA+CF) Median 3.72 3.56 3.50 3.35 3.15 2.81
Performance Review
As of September 30, 2015
Total Real Estate
NONE
54
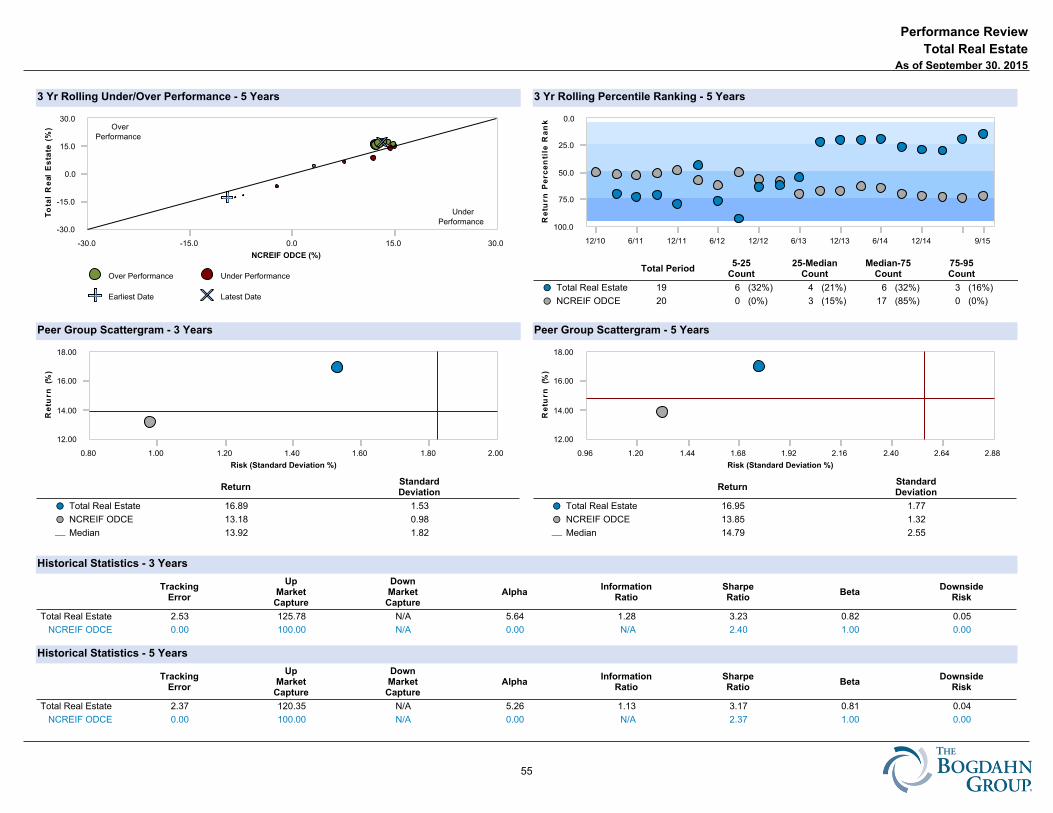
Peer Group Scattergram - 3 Years
3 Yr Rolling Under/Over Performance - 5 Years
Peer Group Scattergram - 5 Years
3 Yr Rolling Percentile Ranking - 5 Years
Historical Statistics - 3 Years
Historical Statistics - 5 Years
Over Performance Under Performance
Earliest Date Latest Date
-30.0
-15.0
0.0
15.0
30.0
To
tal
R
eal
Es
tate
(%)
-30.0 -15.0 0.0 15.0 30.0
NCREIF ODCE (%)
Over
Performance
Under
Performance
0.0
25.0
50.0
75.0
100.0
Re
turn
Pe
rce
nti
le R
an
k
12/10 6/11 12/11 6/12 12/12 6/13 12/13 6/14 12/14 9/15
Total Period5-25
Count25-Median
CountMedian-75
Count75-95Count
Total Real Estate 19 6 (32%) 4 (21%) 6 (32%) 3 (16%)��
NCREIF ODCE 20 0 (0%) 3 (15%) 17 (85%) 0 (0%)��
12.00
14.00
16.00
18.00
Re
turn
(%)
0.80 1.00 1.20 1.40 1.60 1.80 2.00
Risk (Standard Deviation %)
ReturnStandardDeviation
Total Real Estate 16.89 1.53��
NCREIF ODCE 13.18 0.98��
Median 13.92 1.82¾
12.00
14.00
16.00
18.00
Re
turn
(%)
0.96 1.20 1.44 1.68 1.92 2.16 2.40 2.64 2.88
Risk (Standard Deviation %)
ReturnStandardDeviation
Total Real Estate 16.95 1.77��
NCREIF ODCE 13.85 1.32��
Median 14.79 2.55¾
TrackingError
UpMarketCapture
DownMarketCapture
AlphaInformation
RatioSharpeRatio
BetaDownside
Risk
Total Real Estate 2.53 125.78 N/A 5.64 1.28 3.23 0.82 0.05
NCREIF ODCE 0.00 100.00 N/A 0.00 N/A 2.40 1.00 0.00 90 Day U.S. Treasury Bill 5.23 0.41 N/A 0.04 -2.40 N/A 0.00 0.01
TrackingError
UpMarketCapture
DownMarketCapture
AlphaInformation
RatioSharpeRatio
BetaDownside
Risk
Total Real Estate 2.37 120.35 N/A 5.26 1.13 3.17 0.81 0.04
NCREIF ODCE 0.00 100.00 N/A 0.00 N/A 2.37 1.00 0.00 90 Day U.S. Treasury Bill 5.54 0.50 N/A 0.05 -2.37 N/A 0.00 0.01
Performance Review
As of September 30, 2015
Total Real Estate
NONE
55
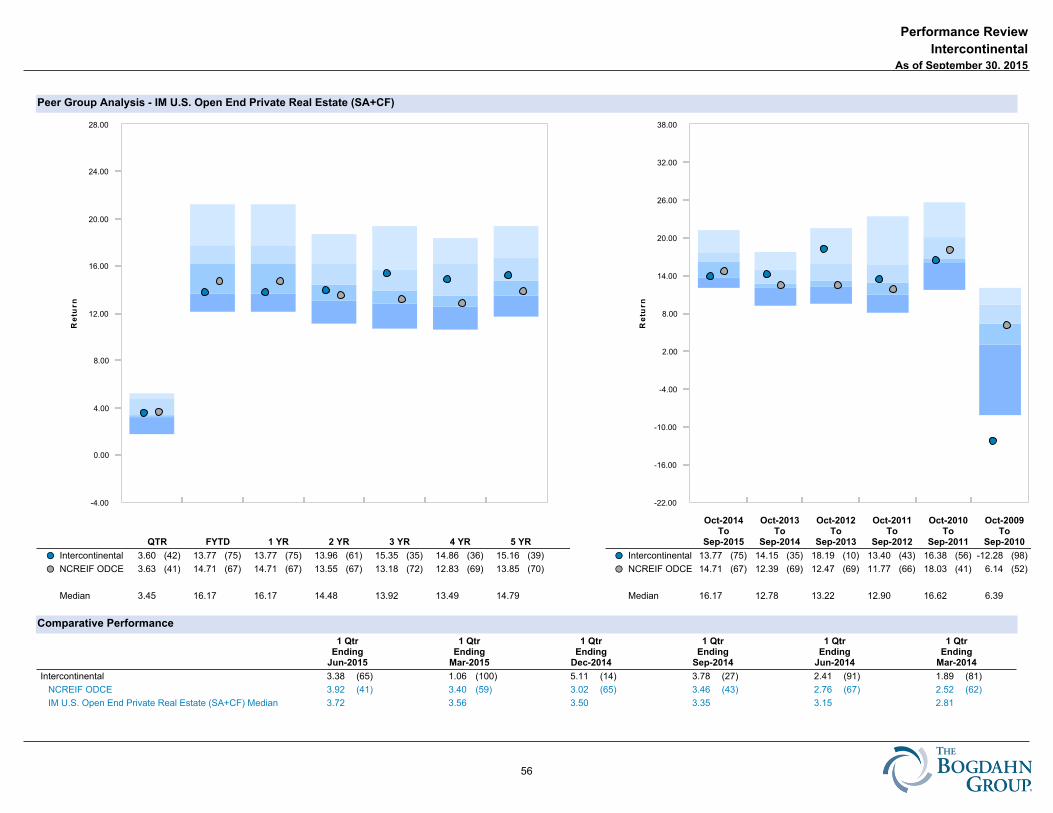
Peer Group Analysis - IM U.S. Open End Private Real Estate (SA+CF)
Comparative Performance
-4.00
0.00
4.00
8.00
12.00
16.00
20.00
24.00
28.00
Re
turn
QTR FYTD 1 YR 2 YR 3 YR 4 YR 5 YR
Intercontinental 3.60 (42) 13.77 (75) 13.77 (75) 13.96 (61) 15.35 (35) 14.86 (36) 15.16 (39)��
NCREIF ODCE 3.63 (41) 14.71 (67) 14.71 (67) 13.55 (67) 13.18 (72) 12.83 (69) 13.85 (70)��
Median 3.45 16.17 16.17 14.48 13.92 13.49 14.79
-22.00
-16.00
-10.00
-4.00
2.00
8.00
14.00
20.00
26.00
32.00
38.00
Re
turn
Oct-2014To
Sep-2015
Oct-2013To
Sep-2014
Oct-2012To
Sep-2013
Oct-2011To
Sep-2012
Oct-2010To
Sep-2011
Oct-2009To
Sep-2010
Intercontinental 13.77 (75) 14.15 (35) 18.19 (10) 13.40 (43) 16.38 (56) -12.28 (98)��
NCREIF ODCE 14.71 (67) 12.39 (69) 12.47 (69) 11.77 (66) 18.03 (41) 6.14 (52)��
Median 16.17 12.78 13.22 12.90 16.62 6.39
1 QtrEnding
Jun-2015
1 QtrEnding
Mar-2015
1 QtrEnding
Dec-2014
1 QtrEnding
Sep-2014
1 QtrEnding
Jun-2014
1 QtrEnding
Mar-2014
Intercontinental 3.38 (65) 1.06 (100) 5.11 (14) 3.78 (27) 2.41 (91) 1.89 (81)
NCREIF ODCE 3.92 (41) 3.40 (59) 3.02 (65) 3.46 (43) 2.76 (67) 2.52 (62)
IM U.S. Open End Private Real Estate (SA+CF) Median 3.72 3.56 3.50 3.35 3.15 2.81
Performance Review
As of September 30, 2015
Intercontinental
NONE
56

Peer Group Scattergram - 3 Years
3 Yr Rolling Under/Over Performance - 5 Years
Peer Group Scattergram - 5 Years
3 Yr Rolling Percentile Ranking - 5 Years
Historical Statistics - 3 Years
Historical Statistics - 5 Years
Over Performance Under Performance
Earliest Date Latest Date
-20.0
-10.0
0.0
10.0
20.0
30.0
Inte
rco
nti
ne
nta
l
(%)
-20.0 -10.0 0.0 10.0 20.0 30.0
NCREIF ODCE (%)
Over
Performance
Under
Performance
0.0
25.0
50.0
75.0
100.0
Re
turn
Pe
rce
nti
le R
an
k
12/10 6/11 12/11 6/12 12/12 6/13 12/13 6/14 12/14 9/15
Total Period5-25
Count25-Median
CountMedian-75
Count75-95Count
Intercontinental 19 1 (5%) 9 (47%) 4 (21%) 5 (26%)��
NCREIF ODCE 20 0 (0%) 3 (15%) 17 (85%) 0 (0%)��
12.75
13.50
14.25
15.00
15.75
Re
turn
(%)
0.40 0.80 1.20 1.60 2.00 2.40 2.80 3.20
Risk (Standard Deviation %)
ReturnStandardDeviation
Intercontinental 15.35 2.88��
NCREIF ODCE 13.18 0.98��
Median 13.92 1.82¾
13.34
13.80
14.26
14.72
15.18
15.64
Re
turn
(%)
0.92 1.15 1.38 1.61 1.84 2.07 2.30 2.53 2.76
Risk (Standard Deviation %)
ReturnStandardDeviation
Intercontinental 15.16 2.42��
NCREIF ODCE 13.85 1.32��
Median 14.79 2.55¾
TrackingError
UpMarketCapture
DownMarketCapture
AlphaInformation
RatioSharpeRatio
BetaDownside
Risk
Intercontinental 3.24 115.87 N/A 0.64 0.62 2.20 1.11 0.00
NCREIF ODCE 0.00 100.00 N/A 0.00 N/A 2.40 1.00 0.00 90 Day U.S. Treasury Bill 5.23 0.41 N/A 0.04 -2.40 N/A 0.00 0.01
TrackingError
UpMarketCapture
DownMarketCapture
AlphaInformation
RatioSharpeRatio
BetaDownside
Risk
Intercontinental 2.67 109.13 N/A 0.66 0.45 2.26 1.04 0.00
NCREIF ODCE 0.00 100.00 N/A 0.00 N/A 2.37 1.00 0.00 90 Day U.S. Treasury Bill 5.54 0.50 N/A 0.05 -2.37 N/A 0.00 0.01
Performance Review
As of September 30, 2015
Intercontinental
NONE
57
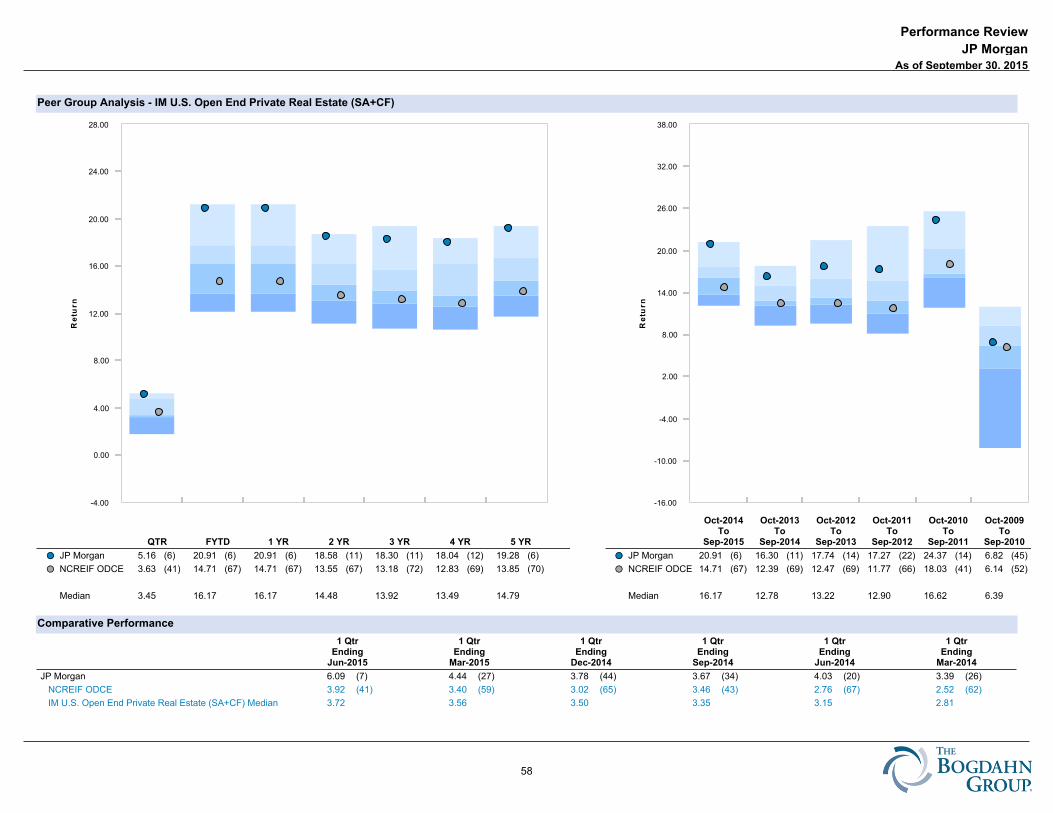
Peer Group Analysis - IM U.S. Open End Private Real Estate (SA+CF)
Comparative Performance
-4.00
0.00
4.00
8.00
12.00
16.00
20.00
24.00
28.00
Re
turn
QTR FYTD 1 YR 2 YR 3 YR 4 YR 5 YR
JP Morgan 5.16 (6) 20.91 (6) 20.91 (6) 18.58 (11) 18.30 (11) 18.04 (12) 19.28 (6)��
NCREIF ODCE 3.63 (41) 14.71 (67) 14.71 (67) 13.55 (67) 13.18 (72) 12.83 (69) 13.85 (70)��
Median 3.45 16.17 16.17 14.48 13.92 13.49 14.79
-16.00
-10.00
-4.00
2.00
8.00
14.00
20.00
26.00
32.00
38.00
Re
turn
Oct-2014To
Sep-2015
Oct-2013To
Sep-2014
Oct-2012To
Sep-2013
Oct-2011To
Sep-2012
Oct-2010To
Sep-2011
Oct-2009To
Sep-2010
JP Morgan 20.91 (6) 16.30 (11) 17.74 (14) 17.27 (22) 24.37 (14) 6.82 (45)��
NCREIF ODCE 14.71 (67) 12.39 (69) 12.47 (69) 11.77 (66) 18.03 (41) 6.14 (52)��
Median 16.17 12.78 13.22 12.90 16.62 6.39
1 QtrEnding
Jun-2015
1 QtrEnding
Mar-2015
1 QtrEnding
Dec-2014
1 QtrEnding
Sep-2014
1 QtrEnding
Jun-2014
1 QtrEnding
Mar-2014
JP Morgan 6.09 (7) 4.44 (27) 3.78 (44) 3.67 (34) 4.03 (20) 3.39 (26)
NCREIF ODCE 3.92 (41) 3.40 (59) 3.02 (65) 3.46 (43) 2.76 (67) 2.52 (62)
IM U.S. Open End Private Real Estate (SA+CF) Median 3.72 3.56 3.50 3.35 3.15 2.81
Performance Review
As of September 30, 2015
JP Morgan
NONE
58

Peer Group Scattergram - 3 Years
3 Yr Rolling Under/Over Performance - 5 Years
Peer Group Scattergram - 5 Years
3 Yr Rolling Percentile Ranking - 5 Years
Historical Statistics - 3 Years
Historical Statistics - 5 Years
Over Performance Under Performance
Earliest Date Latest Date
-30.0
-15.0
0.0
15.0
30.0
JP
Mo
rga
n (%
)
-30.0 -15.0 0.0 15.0 30.0
NCREIF ODCE (%)
Over
Performance
Under
Performance
0.0
25.0
50.0
75.0
100.0
Re
turn
Pe
rce
nti
le R
an
k
12/10 6/11 12/11 6/12 12/12 6/13 12/13 6/14 12/14 9/15
Total Period5-25
Count25-Median
CountMedian-75
Count75-95Count
JP Morgan 19 11 (58%) 4 (21%) 1 (5%) 3 (16%)��
NCREIF ODCE 20 0 (0%) 3 (15%) 17 (85%) 0 (0%)��
12.00
14.00
16.00
18.00
20.00
Re
turn
(%)
0.80 1.00 1.20 1.40 1.60 1.80 2.00 2.20
Risk (Standard Deviation %)
ReturnStandardDeviation
JP Morgan 18.30 1.89��
NCREIF ODCE 13.18 0.98��
Median 13.92 1.82¾
12.00
14.00
16.00
18.00
20.00
22.00
Re
turn
(%)
0.87 1.16 1.45 1.74 2.03 2.32 2.61 2.90 3.19
Risk (Standard Deviation %)
ReturnStandardDeviation
JP Morgan 19.28 2.76��
NCREIF ODCE 13.85 1.32��
Median 14.79 2.55¾
TrackingError
UpMarketCapture
DownMarketCapture
AlphaInformation
RatioSharpeRatio
BetaDownside
Risk
JP Morgan 3.49 135.02 N/A 11.01 1.26 4.68 0.52 0.12
NCREIF ODCE 0.00 100.00 N/A 0.00 N/A 2.40 1.00 0.00 90 Day U.S. Treasury Bill 5.23 0.41 N/A 0.04 -2.40 N/A 0.00 0.01
TrackingError
UpMarketCapture
DownMarketCapture
AlphaInformation
RatioSharpeRatio
BetaDownside
Risk
JP Morgan 3.76 135.24 N/A 11.26 1.24 4.37 0.54 0.09
NCREIF ODCE 0.00 100.00 N/A 0.00 N/A 2.37 1.00 0.00 90 Day U.S. Treasury Bill 5.54 0.50 N/A 0.05 -2.37 N/A 0.00 0.01
Performance Review
As of September 30, 2015
JP Morgan
NONE
59
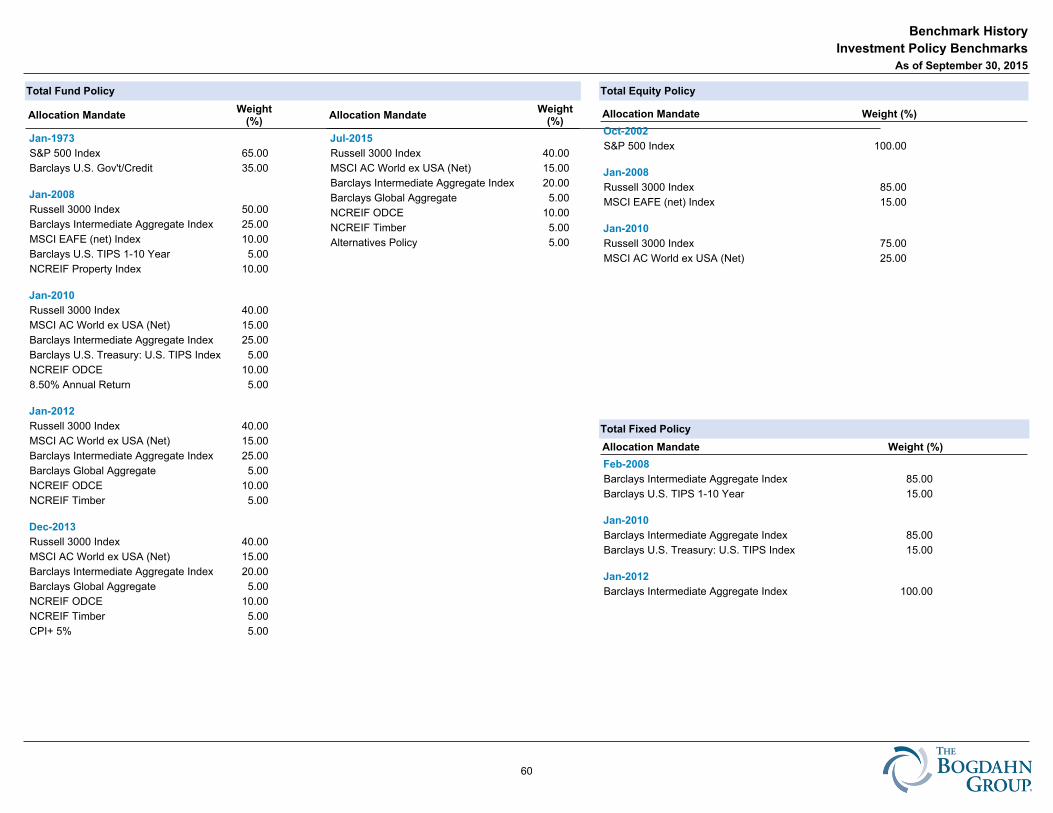
Total Fund Policy Total Equity Policy
Total Fixed Policy
Allocation MandateWeight
(%)
Jan-1973
S&P 500 Index 65.00
Barclays U.S. Gov't/Credit 35.00
Jan-2008
Russell 3000 Index 50.00
Barclays Intermediate Aggregate Index 25.00
MSCI EAFE (net) Index 10.00
Barclays U.S. TIPS 1-10 Year 5.00
NCREIF Property Index 10.00
Jan-2010
Russell 3000 Index 40.00
MSCI AC World ex USA (Net) 15.00
Barclays Intermediate Aggregate Index 25.00
Barclays U.S. Treasury: U.S. TIPS Index 5.00
NCREIF ODCE 10.00
8.50% Annual Return 5.00
Jan-2012
Russell 3000 Index 40.00
MSCI AC World ex USA (Net) 15.00
Barclays Intermediate Aggregate Index 25.00
Barclays Global Aggregate 5.00
NCREIF ODCE 10.00
NCREIF Timber 5.00
Dec-2013
Russell 3000 Index 40.00
MSCI AC World ex USA (Net) 15.00
Barclays Intermediate Aggregate Index 20.00
Barclays Global Aggregate 5.00
NCREIF ODCE 10.00
NCREIF Timber 5.00
CPI+ 5% 5.00
Allocation MandateWeight
(%)
Jul-2015
Russell 3000 Index 40.00
MSCI AC World ex USA (Net) 15.00
Barclays Intermediate Aggregate Index 20.00
Barclays Global Aggregate 5.00
NCREIF ODCE 10.00
NCREIF Timber 5.00
Alternatives Policy 5.00
Allocation Mandate Weight (%)
Oct-2002
S&P 500 Index 100.00
Jan-2008
Russell 3000 Index 85.00
MSCI EAFE (net) Index 15.00
Jan-2010
Russell 3000 Index 75.00
MSCI AC World ex USA (Net) 25.00
Allocation Mandate Weight (%)
Feb-2008
Barclays Intermediate Aggregate Index 85.00
Barclays U.S. TIPS 1-10 Year 15.00
Jan-2010
Barclays Intermediate Aggregate Index 85.00
Barclays U.S. Treasury: U.S. TIPS Index 15.00
Jan-2012
Barclays Intermediate Aggregate Index 100.00
Benchmark History
Investment Policy Benchmarks
As of September 30, 2015
60
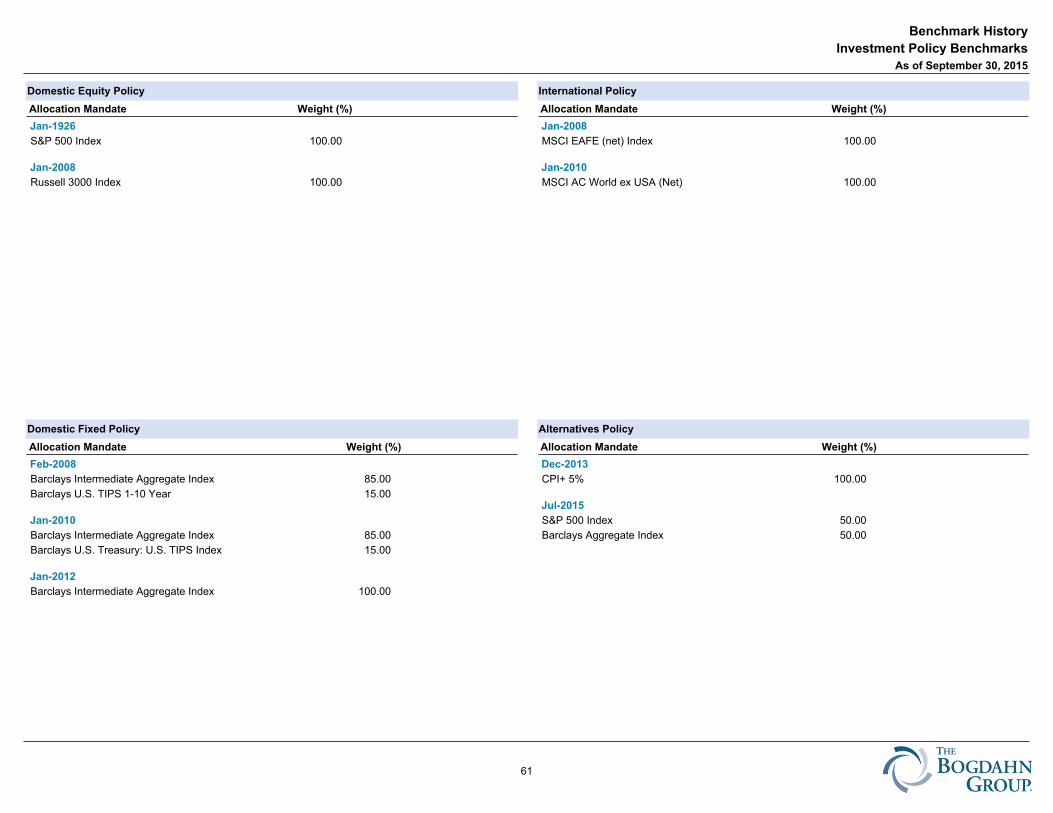
Domestic Equity Policy International Policy
Domestic Fixed Policy Alternatives Policy
Allocation Mandate Weight (%)
Jan-1926
S&P 500 Index 100.00
Jan-2008
Russell 3000 Index 100.00
Allocation Mandate Weight (%)
Jan-2008
MSCI EAFE (net) Index 100.00
Jan-2010
MSCI AC World ex USA (Net) 100.00
Allocation Mandate Weight (%)
Feb-2008
Barclays Intermediate Aggregate Index 85.00
Barclays U.S. TIPS 1-10 Year 15.00
Jan-2010
Barclays Intermediate Aggregate Index 85.00
Barclays U.S. Treasury: U.S. TIPS Index 15.00
Jan-2012
Barclays Intermediate Aggregate Index 100.00
Allocation Mandate Weight (%)
Dec-2013
CPI+ 5% 100.00
Jul-2015
S&P 500 Index 50.00
Barclays Aggregate Index 50.00
Benchmark History
Investment Policy Benchmarks
As of September 30, 2015
61
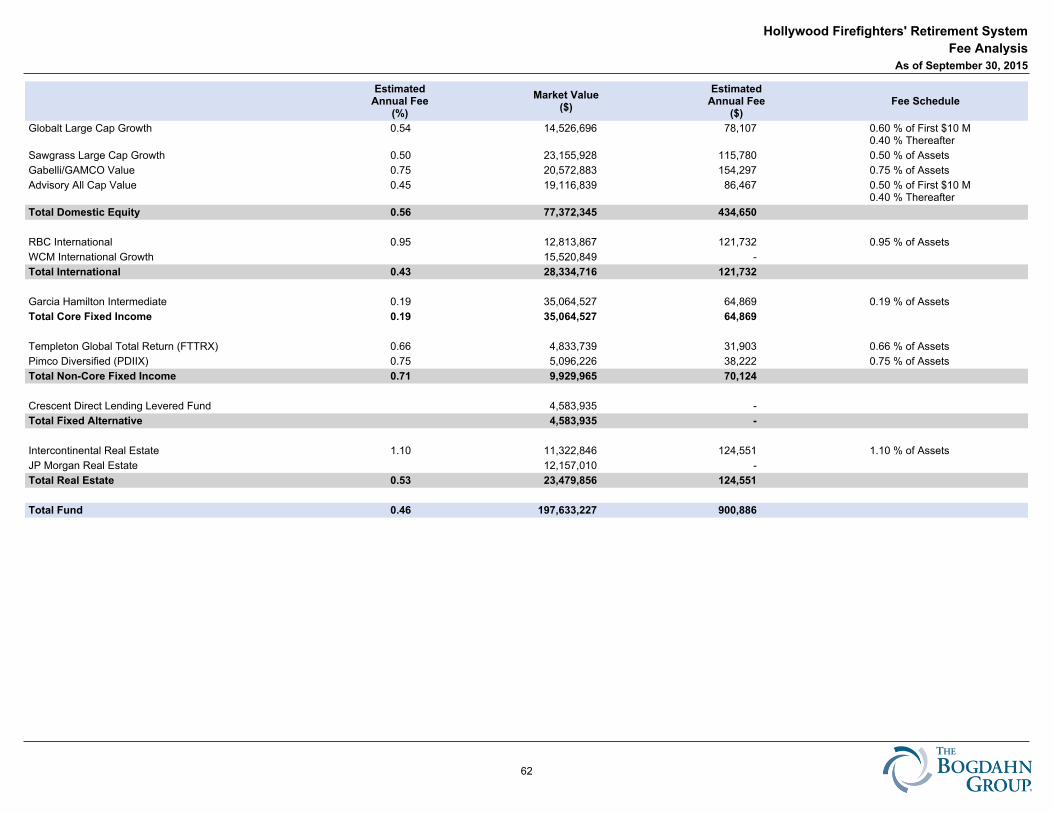
EstimatedAnnual Fee
(%)
Market Value($)
EstimatedAnnual Fee
($)Fee Schedule
Globalt Large Cap Growth 0.54 14,526,696 78,107 0.60 % of First $10 M0.40 % Thereafter
Sawgrass Large Cap Growth 0.50 23,155,928 115,780 0.50 % of Assets
Gabelli/GAMCO Value 0.75 20,572,883 154,297 0.75 % of Assets
Advisory All Cap Value 0.45 19,116,839 86,467 0.50 % of First $10 M0.40 % Thereafter
Total Domestic Equity 0.56 77,372,345 434,650
RBC International 0.95 12,813,867 121,732 0.95 % of Assets
WCM International Growth 15,520,849 -
Total International 0.43 28,334,716 121,732
Garcia Hamilton Intermediate 0.19 35,064,527 64,869 0.19 % of Assets
Total Core Fixed Income 0.19 35,064,527 64,869
Templeton Global Total Return (FTTRX) 0.66 4,833,739 31,903 0.66 % of Assets
Pimco Diversified (PDIIX) 0.75 5,096,226 38,222 0.75 % of Assets
Total Non-Core Fixed Income 0.71 9,929,965 70,124
Crescent Direct Lending Levered Fund 4,583,935 -
Total Fixed Alternative 4,583,935 -
Intercontinental Real Estate 1.10 11,322,846 124,551 1.10 % of Assets
JP Morgan Real Estate 12,157,010 -
Total Real Estate 0.53 23,479,856 124,551
Total Fund 0.46 197,633,227 900,886
Hollywood Firefighters' Retirement System
Fee Analysis
As of September 30, 2015
62
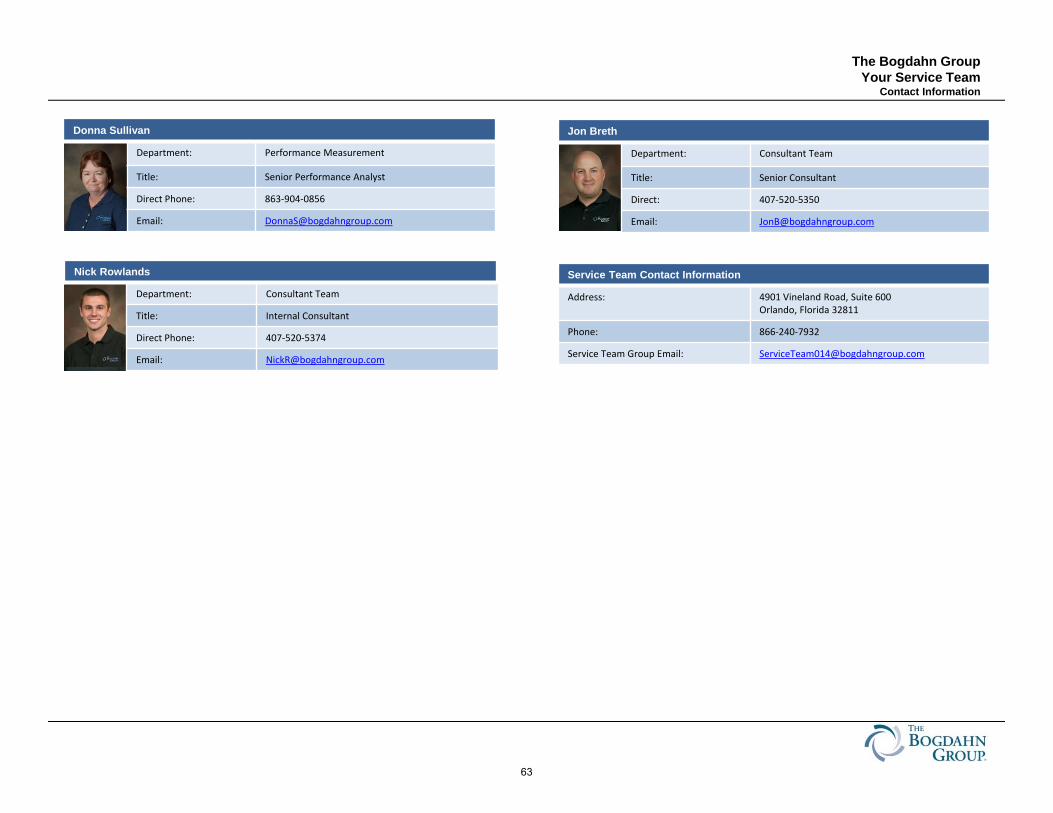
The Bogdahn GroupYour Service Team
Contact Information
Address: 4901 Vineland Road, Suite 600Orlando, Florida 32811
Phone: 866‐240‐7932
Service Team Group Email: [email protected]
Service Team Contact Information
Department: Performance Measurement
Title: Senior Performance Analyst
Direct Phone: 863‐904‐0856
Email: [email protected]
Donna Sullivan
Department: Consultant Team
Title: Senior Consultant
Direct: 407‐520‐5350
Email: [email protected]
Jon Breth
Department: Consultant Team
Title: Internal Consultant
Direct Phone: 407‐520‐5374
Email: [email protected]
Nick Rowlands
63
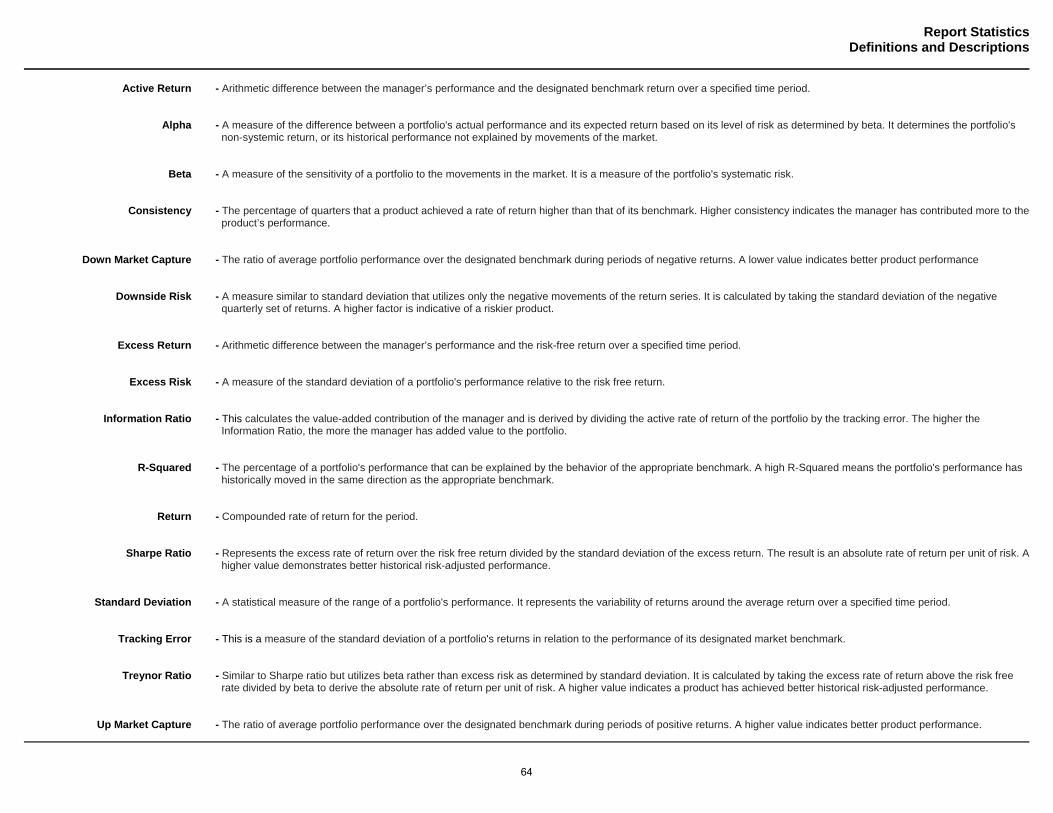
Report Statistics Definitions and Descriptions
Active Return - Arithmetic difference between the manager’s performance and the designated benchmark return over a specified time period. Alpha - A measure of the difference between a portfolio's actual performance and its expected return based on its level of risk as determined by beta. It determines the portfolio's
non-systemic return, or its historical performance not explained by movements of the market. Beta - A measure of the sensitivity of a portfolio to the movements in the market. It is a measure of the portfolio's systematic risk. Consistency - The percentage of quarters that a product achieved a rate of return higher than that of its benchmark. Higher consistency indicates the manager has contributed more to the
product’s performance. Down Market Capture - The ratio of average portfolio performance over the designated benchmark during periods of negative returns. A lower value indicates better product performance Downside Risk - A measure similar to standard deviation that utilizes only the negative movements of the return series. It is calculated by taking the standard deviation of the negative
quarterly set of returns. A higher factor is indicative of a riskier product. Excess Return - Arithmetic difference between the manager’s performance and the risk-free return over a specified time period. Excess Risk - A measure of the standard deviation of a portfolio's performance relative to the risk free return. Information Ratio - This calculates the value-added contribution of the manager and is derived by dividing the active rate of return of the portfolio by the tracking error. The higher the
Information Ratio, the more the manager has added value to the portfolio. R-Squared - The percentage of a portfolio's performance that can be explained by the behavior of the appropriate benchmark. A high R-Squared means the portfolio's performance has
historically moved in the same direction as the appropriate benchmark. Return - Compounded rate of return for the period. Sharpe Ratio - Represents the excess rate of return over the risk free return divided by the standard deviation of the excess return. The result is an absolute rate of return per unit of risk. A
higher value demonstrates better historical risk-adjusted performance. Standard Deviation - A statistical measure of the range of a portfolio's performance. It represents the variability of returns around the average return over a specified time period. Tracking Error - This is a measure of the standard deviation of a portfolio's returns in relation to the performance of its designated market benchmark. Treynor Ratio - Similar to Sharpe ratio but utilizes beta rather than excess risk as determined by standard deviation. It is calculated by taking the excess rate of return above the risk free
rate divided by beta to derive the absolute rate of return per unit of risk. A higher value indicates a product has achieved better historical risk-adjusted performance. Up Market Capture - The ratio of average portfolio performance over the designated benchmark during periods of positive returns. A higher value indicates better product performance.
64
Disclosures
The Bogdahn Group compiled this report for the sole use of the client for which it was prepared. The Bogdahn Group is responsible for evaluating the performance results of the Total Fund along with the investment advisors by comparing their performance with indices and other related peer universe data that is deemed appropriate. The Bogdahn group uses the results from this evaluation to make observations and recommendations to the client. The Bogdahn Group uses time-weighted calculations which are founded on standards recommended by the CFA Institute. The calculations and values shown are based on information that is received from custodians. The Bogdahn Group analyzes transactions as indicated on the custodian statements and reviews the custodial market values of the portfolio. As a result, this provides The Bogdahn Group with a reasonable basis that the investment information presented is free from material misstatement. This methodology of evaluating and measuring performance provides The Bogdahn Group with a practical foundation for our observations and recommendations. Nothing came to our attention that would cause The Bogdahn Group to believe that the information presented is significantly misstated. This performance report is based on data obtained by the client’s custodian(s), investment fund administrator, or other sources believed to be reliable. While these sources are believed to be reliable, the data providers are responsible for the accuracy and completeness of their statements. Clients are encouraged to compare the records of their custodian(s) to ensure this report fairly and accurately reflects their various asset positions. The strategies listed may not be suitable for all investors. We believe the information provided here is reliable, but do not warrant its accuracy or completeness. Past performance is not an indication of future performance. Any information contained in this report is for informational purposes only and should not be construed to be an offer to buy or sell any securities, investment consulting, or investment management services. Additional information included in this document may contain data provided by from index databases, public economic sources and the managers themselves. This document may contain data provided by Barclays. Barclays Index data provided by way of Barclays Live. This document may contain data provided by Standard and Poor’s. Nothing contained within any document, advertisement or presentation from S&P Indices constitutes an offer of services in jurisdictions where S&P Indices does not have the necessary licenses. All information provided by S&P Indices is impersonal and is not tailored to the needs of any person, entity or group of persons. Any returns or performance provided within any document is provided for illustrative purposes only and does not demonstrate actual performance. Past performance is not a guarantee of future investment results. This document may contain data provided by MSCI, Inc. Copyright MSCI, 2012. Unpublished. All Rights Reserved. This information may only be used for your internal use, may not be reproduced or redisseminated in any form and may not be used to create any financial instruments or products or any indices. This information is provided on an “as is” basis and the user of this information assumes the entire risk of any use it may make or permit to be made of this information. Neither MSCI, any of its affiliates or any other person involved in or related to compiling, computing or creating this information makes any express or implied warranties or representations with respect to such information or the results to be obtained by the use thereof, and MSCI, its affiliates and each such other person hereby expressly disclaim all warranties (including, without limitation, all warranties of originality, accuracy, completeness, timeliness, non-infringement, merchantability and fitness for a particular purpose) with respect to this information. Without limiting any of the foregoing, in no event shall MSCI, any of its affiliates or any other person involved in or related to compiling, computing or creating this information have any liability for any direct, indirect, special, incidental, punitive, consequential or any other damages (including, without limitation, lost profits) even if notified of, or if it might otherwise have anticipated, the possibility of such damages. This document may contain data provided by Russell Investment Group. Russell Investment Group is the source owner of the data contained or reflected in this material and all trademarks and copyrights related thereto. The material may contain confidential information and unauthorized use, disclosure, copying, dissemination or redistribution is strictly prohibited. This is a user presentation of the data. Russell Investment Group is not responsible for the formatting or configuration of this material or for any inaccuracy in presentation thereof. This document may contain data provided by Morningstar. All rights reserved. Use of this content requires expert knowledge. It is to be used by specialist institutions only. The information contained herein: (1) is proprietary to Morningstar and/or its content providers; (2) may not be copied, adapted or distributed; and (3) is not warranted to be accurate, complete or timely. Neither Morningstar nor its content providers are responsible for any damages or losses arising from any use of this information, except where such damages or losses cannot be limited or excluded by law in your jurisdiction. Past financial performance is not guarantee of future results.
65
· Molpus Timber return is based on estimated value. The property is valued annually; interim months are adjusted for revenue, expenses, etc.· Net and gross returns for the total fund prior to 10/1/2006 are the same.
Writeup
Disclosures
As of September 30, 2015
66