Embed Size (px)
Citation preview
NCDPI/ODSS/AS/LM/August 30, 2016 1
2015–16 Performance and Growth of North Carolina Public Schools
Executive Summary
(September 1, 2016)
Statistical Summary of Results
This report provides growth and performance data for the 2015–16 school year based on analysis
of all end-of-grade (EOG) tests and end-of-course (EOC) tests, which are aligned to the North
Carolina Standard Course of Study in English Language Arts/Reading and Mathematics and the
Essential Standards in Science, for all public schools and public charter schools. The following
data are presented:
1. Growth: Reporting if schools exceeded, met, or did not meet growth expectations as
defined and calculated in EVAAS.
2. Performance: Reporting how schools performed on assessments, high school indicators,
and School Performance Grades.
3. Participation: Reporting if schools met or did not meet assessment participation
requirements.
Schools not included in the report may not have any tested grades or may have a transient or very
small student population. Typically, these schools are K–2 schools, special education schools,
vocational/career schools, and hospital schools.
Accountability performance results for the 2,601 public schools included in this report are
available in a variety of spreadsheets and reports. Please go to http://www.ncpublicschools.org/
accountability/reporting/ to view more detailed information on the schools, districts and the state. The
data will also be presented in the North Carolina School Report Cards later this fall.
Section I. Growth Results
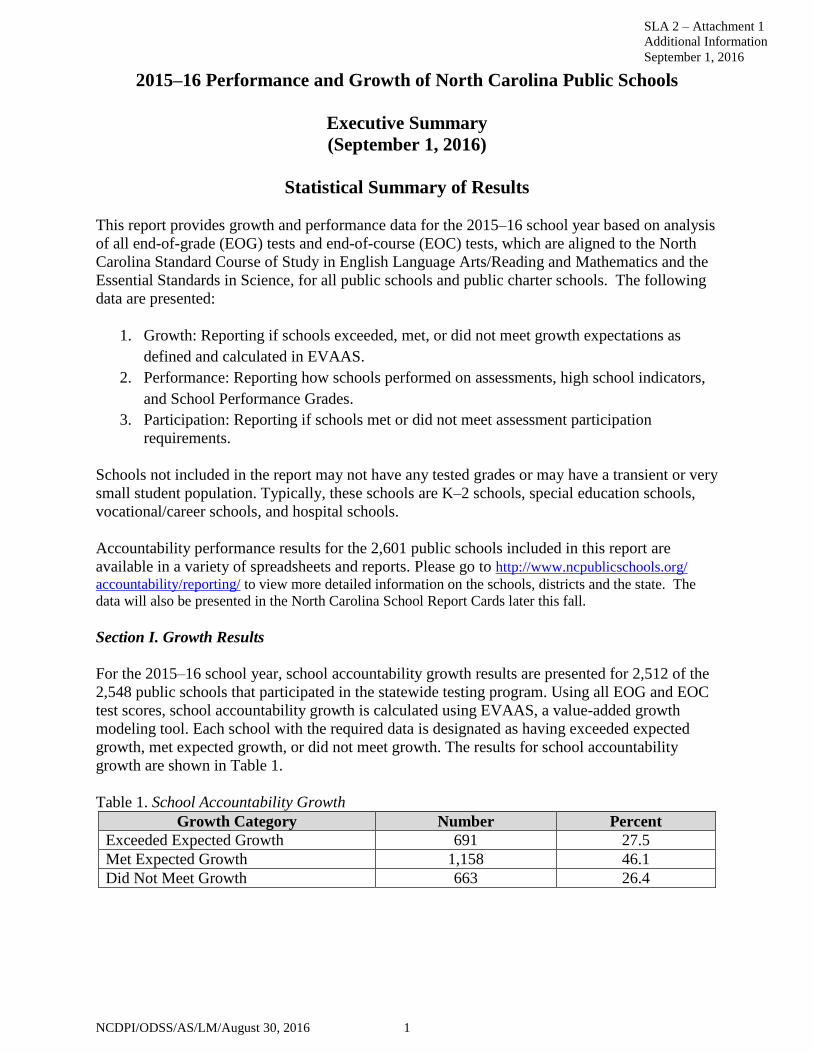
For the 2015–16 school year, school accountability growth results are presented for 2,512 of the
2,548 public schools that participated in the statewide testing program. Using all EOG and EOC
test scores, school accountability growth is calculated using EVAAS, a value-added growth
modeling tool. Each school with the required data is designated as having exceeded expected
growth, met expected growth, or did not meet growth. The results for school accountability
growth are shown in Table 1.
Table 1. School Accountability Growth
Growth Category Number Percent
Exceeded Expected Growth 691 27.5
Met Expected Growth 1,158 46.1
Did Not Meet Growth 663 26.4
SLA 2 – Attachment 1
Additional Information
September 1, 2016
NCDPI/ODSS/AS/LM/August 30, 2016 2
Section II. Performance Results
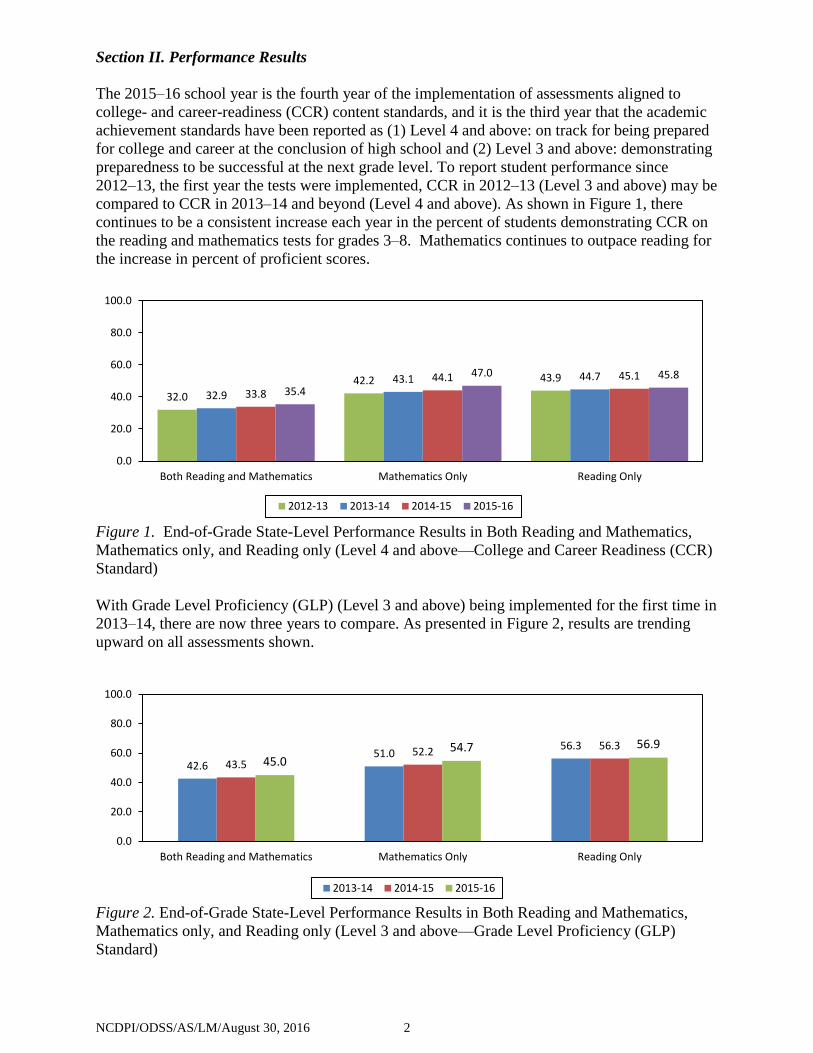
The 2015–16 school year is the fourth year of the implementation of assessments aligned to
college- and career-readiness (CCR) content standards, and it is the third year that the academic
achievement standards have been reported as (1) Level 4 and above: on track for being prepared
for college and career at the conclusion of high school and (2) Level 3 and above: demonstrating
preparedness to be successful at the next grade level. To report student performance since
2012–13, the first year the tests were implemented, CCR in 2012–13 (Level 3 and above) may be
compared to CCR in 2013–14 and beyond (Level 4 and above). As shown in Figure 1, there
continues to be a consistent increase each year in the percent of students demonstrating CCR on
the reading and mathematics tests for grades 3–8. Mathematics continues to outpace reading for
the increase in percent of proficient scores.
Figure 1. End-of-Grade State-Level Performance Results in Both Reading and Mathematics,
Mathematics only, and Reading only (Level 4 and above—College and Career Readiness (CCR)
Standard)
With Grade Level Proficiency (GLP) (Level 3 and above) being implemented for the first time in
2013–14, there are now three years to compare. As presented in Figure 2, results are trending
upward on all assessments shown.
Figure 2. End-of-Grade State-Level Performance Results in Both Reading and Mathematics,
Mathematics only, and Reading only (Level 3 and above—Grade Level Proficiency (GLP)
Standard)
32.0
42.2 43.9
32.9
43.1 44.7
33.8
44.1 45.1
35.4
47.0 45.8
0.0
20.0
40.0
60.0
80.0
100.0
Both Reading and Mathematics Mathematics Only Reading Only
2012-13 2013-14 2014-15 2015-16
42.651.0
56.3
43.552.2
56.3
45.054.7 56.9
0.0
20.0
40.0
60.0
80.0
100.0
Both Reading and Mathematics Mathematics Only Reading Only
2013-14 2014-15 2015-16
NCDPI/ODSS/AS/LM/August 30, 2016 3
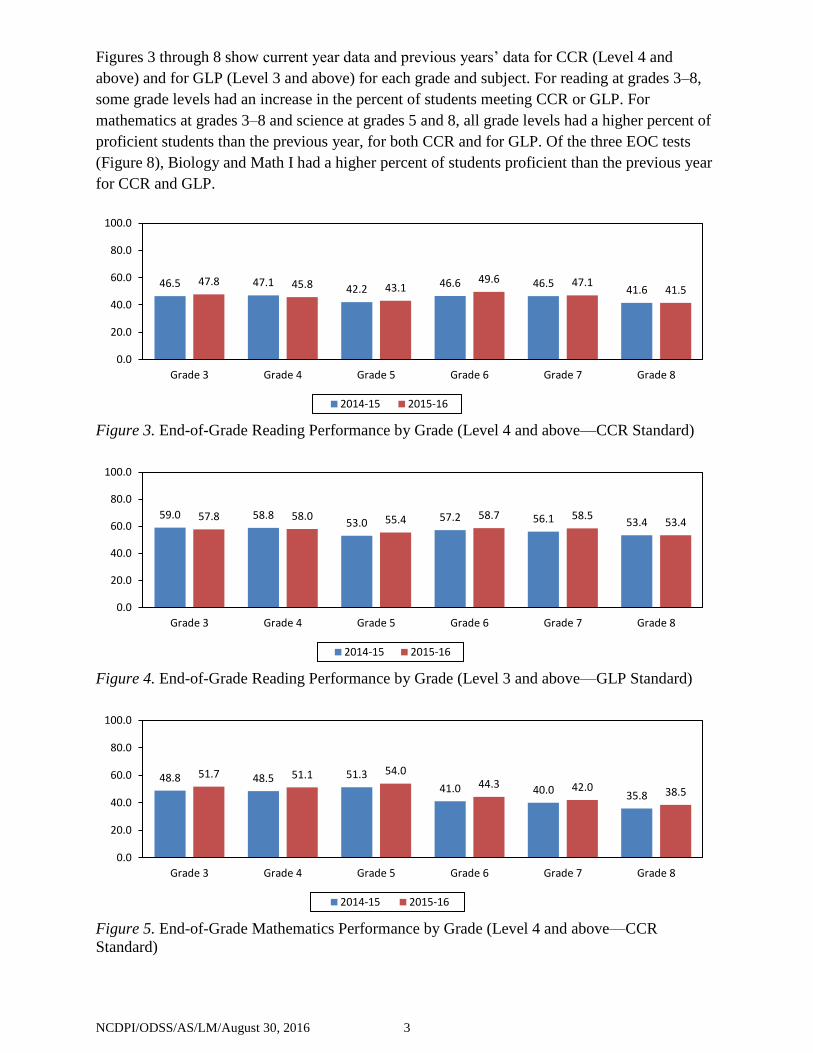
Figures 3 through 8 show current year data and previous years’ data for CCR (Level 4 and
above) and for GLP (Level 3 and above) for each grade and subject. For reading at grades 3–8,
some grade levels had an increase in the percent of students meeting CCR or GLP. For
mathematics at grades 3–8 and science at grades 5 and 8, all grade levels had a higher percent of
proficient students than the previous year, for both CCR and for GLP. Of the three EOC tests
(Figure 8), Biology and Math I had a higher percent of students proficient than the previous year
for CCR and GLP.
Figure 3. End-of-Grade Reading Performance by Grade (Level 4 and above—CCR Standard)
Figure 4. End-of-Grade Reading Performance by Grade (Level 3 and above—GLP Standard)
Figure 5. End-of-Grade Mathematics Performance by Grade (Level 4 and above—CCR
Standard)
46.5 47.142.2
46.6 46.541.6
47.8 45.8 43.149.6 47.1
41.5
0.0
20.0
40.0
60.0
80.0
100.0
Grade 3 Grade 4 Grade 5 Grade 6 Grade 7 Grade 8
2014-15 2015-16
59.0 58.853.0 57.2 56.1 53.457.8 58.0 55.4 58.7 58.5
53.4
0.0
20.0
40.0
60.0
80.0
100.0
Grade 3 Grade 4 Grade 5 Grade 6 Grade 7 Grade 8
2014-15 2015-16
48.8 48.5 51.341.0 40.0 35.8
51.7 51.1 54.044.3 42.0 38.5
0.0
20.0
40.0
60.0
80.0
100.0
Grade 3 Grade 4 Grade 5 Grade 6 Grade 7 Grade 8
2014-15 2015-16
NCDPI/ODSS/AS/LM/August 30, 2016 4
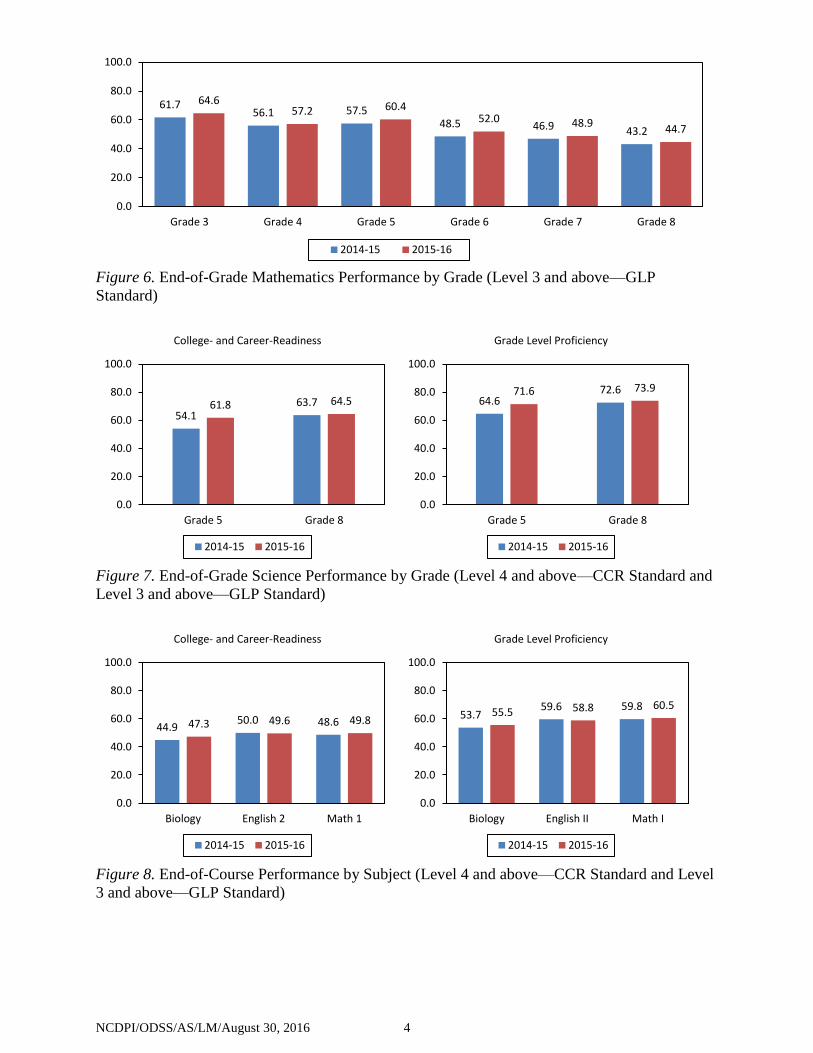
Figure 6. End-of-Grade Mathematics Performance by Grade (Level 3 and above—GLP
Standard)
Figure 7. End-of-Grade Science Performance by Grade (Level 4 and above—CCR Standard and
Level 3 and above—GLP Standard)
Figure 8. End-of-Course Performance by Subject (Level 4 and above—CCR Standard and Level
3 and above—GLP Standard)
61.756.1 57.5
48.5 46.9 43.2
64.657.2 60.4
52.0 48.944.7
0.0
20.0
40.0
60.0
80.0
100.0
Grade 3 Grade 4 Grade 5 Grade 6 Grade 7 Grade 8
2014-15 2015-16
54.163.761.8 64.5
0.0
20.0
40.0
60.0
80.0
100.0
Grade 5 Grade 8
College- and Career-Readiness
2014-15 2015-16
64.672.671.6 73.9
0.0
20.0
40.0
60.0
80.0
100.0
Grade 5 Grade 8
Grade Level Proficiency
2014-15 2015-16
44.950.0 48.647.3 49.6 49.8
0.0
20.0
40.0
60.0
80.0
100.0
Biology English 2 Math 1
College- and Career-Readiness
2014-15 2015-16
53.759.6 59.8
55.5 58.8 60.5
0.0
20.0
40.0
60.0
80.0
100.0
Biology English II Math I
Grade Level Proficiency
2014-15 2015-16
NCDPI/ODSS/AS/LM/August 30, 2016 5
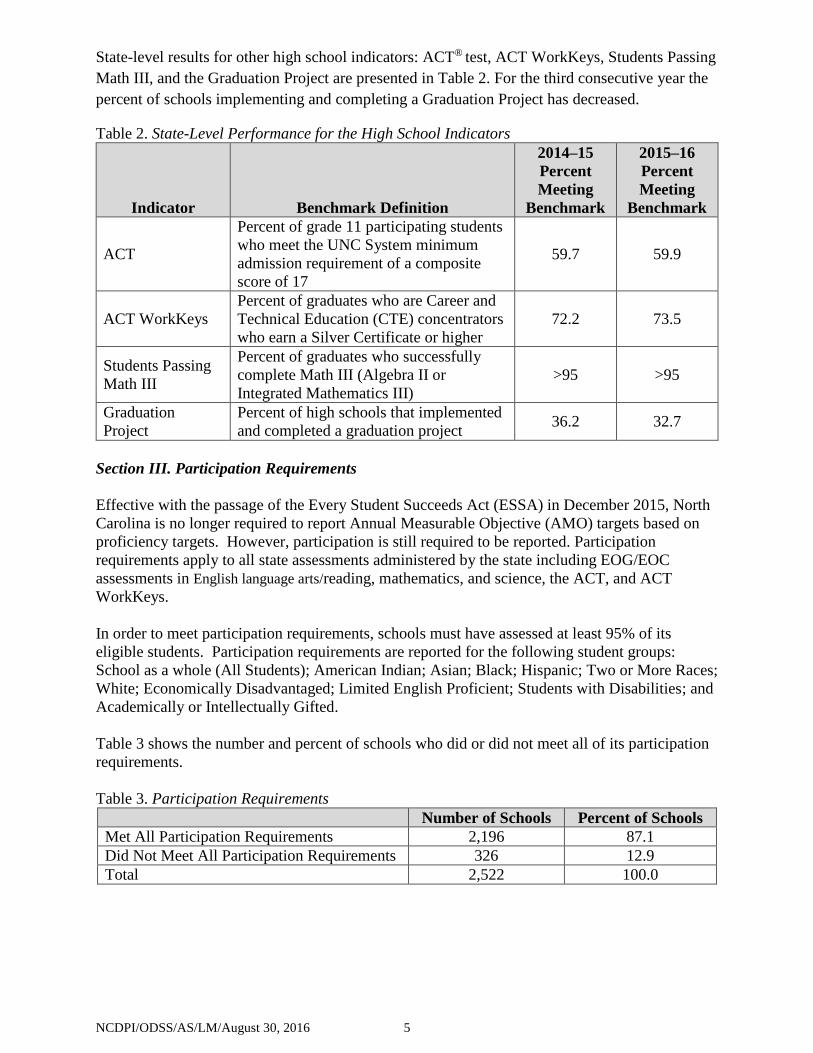
State-level results for other high school indicators: ACT® test, ACT WorkKeys, Students Passing
Math III, and the Graduation Project are presented in Table 2. For the third consecutive year the
percent of schools implementing and completing a Graduation Project has decreased.
Table 2. State-Level Performance for the High School Indicators
Indicator Benchmark Definition
2014–15
Percent
Meeting
Benchmark
2015–16
Percent
Meeting
Benchmark
ACT
Percent of grade 11 participating students
who meet the UNC System minimum
admission requirement of a composite
score of 17
59.7 59.9
ACT WorkKeys
Percent of graduates who are Career and
Technical Education (CTE) concentrators
who earn a Silver Certificate or higher
72.2 73.5
Students Passing
Math III
Percent of graduates who successfully
complete Math III (Algebra II or
Integrated Mathematics III)
>95 >95
Graduation
Project
Percent of high schools that implemented
and completed a graduation project 36.2 32.7
Section III. Participation Requirements
Effective with the passage of the Every Student Succeeds Act (ESSA) in December 2015, North
Carolina is no longer required to report Annual Measurable Objective (AMO) targets based on
proficiency targets. However, participation is still required to be reported. Participation
requirements apply to all state assessments administered by the state including EOG/EOC
assessments in English language arts/reading, mathematics, and science, the ACT, and ACT
WorkKeys.
In order to meet participation requirements, schools must have assessed at least 95% of its
eligible students. Participation requirements are reported for the following student groups:
School as a whole (All Students); American Indian; Asian; Black; Hispanic; Two or More Races;
White; Economically Disadvantaged; Limited English Proficient; Students with Disabilities; and
Academically or Intellectually Gifted.
Table 3 shows the number and percent of schools who did or did not meet all of its participation
requirements.
Table 3. Participation Requirements
Number of Schools Percent of Schools
Met All Participation Requirements 2,196 87.1
Did Not Meet All Participation Requirements 326 12.9
Total 2,522 100.0
NCDPI/ODSS/AS/LM/August 30, 2016 6
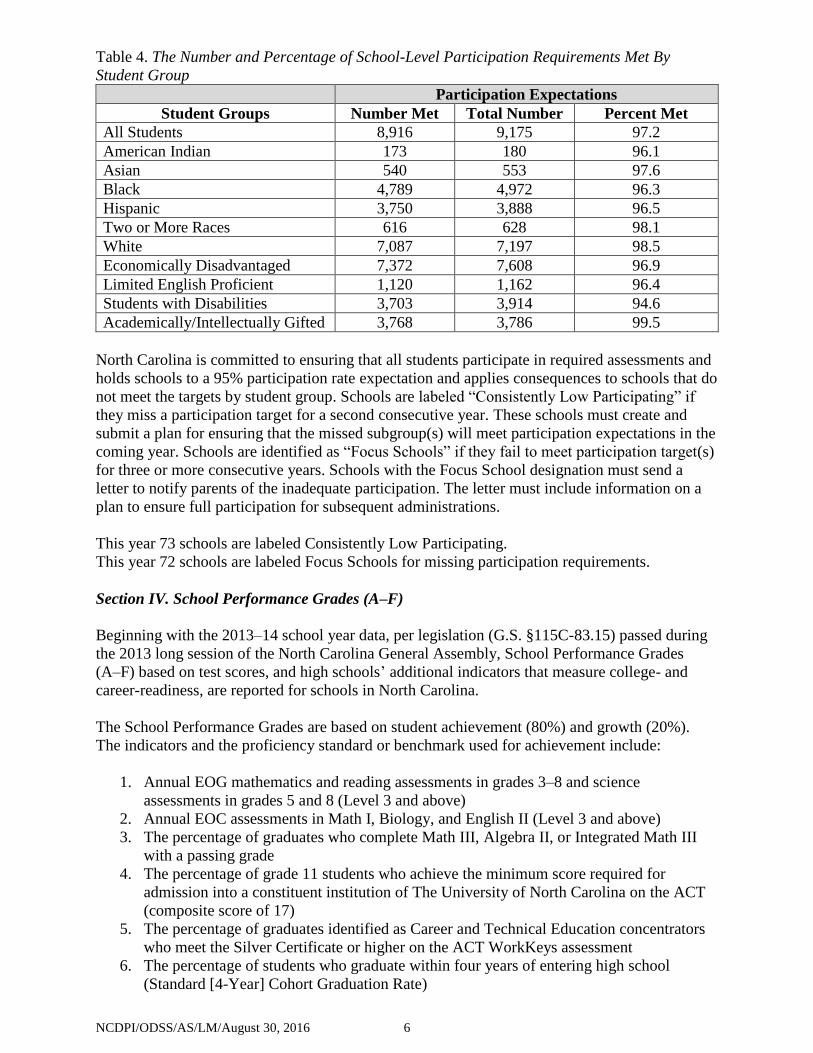
Table 4. The Number and Percentage of School-Level Participation Requirements Met By
Student Group
Participation Expectations
Student Groups Number Met Total Number Percent Met
All Students 8,916 9,175 97.2
American Indian 173 180 96.1
Asian 540 553 97.6
Black 4,789 4,972 96.3
Hispanic 3,750 3,888 96.5
Two or More Races 616 628 98.1
White 7,087 7,197 98.5
Economically Disadvantaged 7,372 7,608 96.9
Limited English Proficient 1,120 1,162 96.4
Students with Disabilities 3,703 3,914 94.6
Academically/Intellectually Gifted 3,768 3,786 99.5
North Carolina is committed to ensuring that all students participate in required assessments and
holds schools to a 95% participation rate expectation and applies consequences to schools that do
not meet the targets by student group. Schools are labeled “Consistently Low Participating” if
they miss a participation target for a second consecutive year. These schools must create and
submit a plan for ensuring that the missed subgroup(s) will meet participation expectations in the
coming year. Schools are identified as “Focus Schools” if they fail to meet participation target(s)
for three or more consecutive years. Schools with the Focus School designation must send a
letter to notify parents of the inadequate participation. The letter must include information on a
plan to ensure full participation for subsequent administrations.
This year 73 schools are labeled Consistently Low Participating.
This year 72 schools are labeled Focus Schools for missing participation requirements.
Section IV. School Performance Grades (A–F)
Beginning with the 2013–14 school year data, per legislation (G.S. §115C-83.15) passed during
the 2013 long session of the North Carolina General Assembly, School Performance Grades
(A–F) based on test scores, and high schools’ additional indicators that measure college- and
career-readiness, are reported for schools in North Carolina.
The School Performance Grades are based on student achievement (80%) and growth (20%).
The indicators and the proficiency standard or benchmark used for achievement include:
1. Annual EOG mathematics and reading assessments in grades 3–8 and science
assessments in grades 5 and 8 (Level 3 and above)
2. Annual EOC assessments in Math I, Biology, and English II (Level 3 and above)
3. The percentage of graduates who complete Math III, Algebra II, or Integrated Math III
with a passing grade
4. The percentage of grade 11 students who achieve the minimum score required for
admission into a constituent institution of The University of North Carolina on the ACT
(composite score of 17)
5. The percentage of graduates identified as Career and Technical Education concentrators
who meet the Silver Certificate or higher on the ACT WorkKeys assessment
6. The percentage of students who graduate within four years of entering high school
(Standard [4-Year] Cohort Graduation Rate)
NCDPI/ODSS/AS/LM/August 30, 2016 7
The EVAAS model, which provides the growth measure, uses current and previous student test
data to determine whether schools are maintaining or increasing student achievement from one
year to the next. In the event that a school does not have a Growth Score, only the School
Achievement Score is used to calculate the Performance Score. For the final Performance Score
and Grade, if a school’s growth designation is Meets or Exceeds Expected Growth, but the
inclusion of the school’s Growth Score reduces the school’s Performance Score and Grade, only
the School Achievement Score may be used for the Performance Score and Grade. For 2015–16,
there were eight (8) schools that met this exception, and growth was not included in their final
grade calculation.
For 2015–16, the grade designations are set on a 15-point scale as follows:
A = 85–100 B = 70–84 C = 55–69 D = 40–54 F = 39 or Less
Schools that earn an A designation and do not have significant achievement and/or graduation
gaps are designated as an A+NG school. Significant achievement and graduation gaps are defined
as in-school gaps that are above the three-year state average when averaging gaps in the previous
year and at least one of the two prior years between the highest-achieving subgroup and lowest-
achieving subgroup.
Following is the state-level distribution of School Performance Grades, including the reading and
mathematics grades for the K–8 schools and secondary analyses on growth, school type, poverty,
and State Board of Education districts.
Section V. Overall School Performance Grades
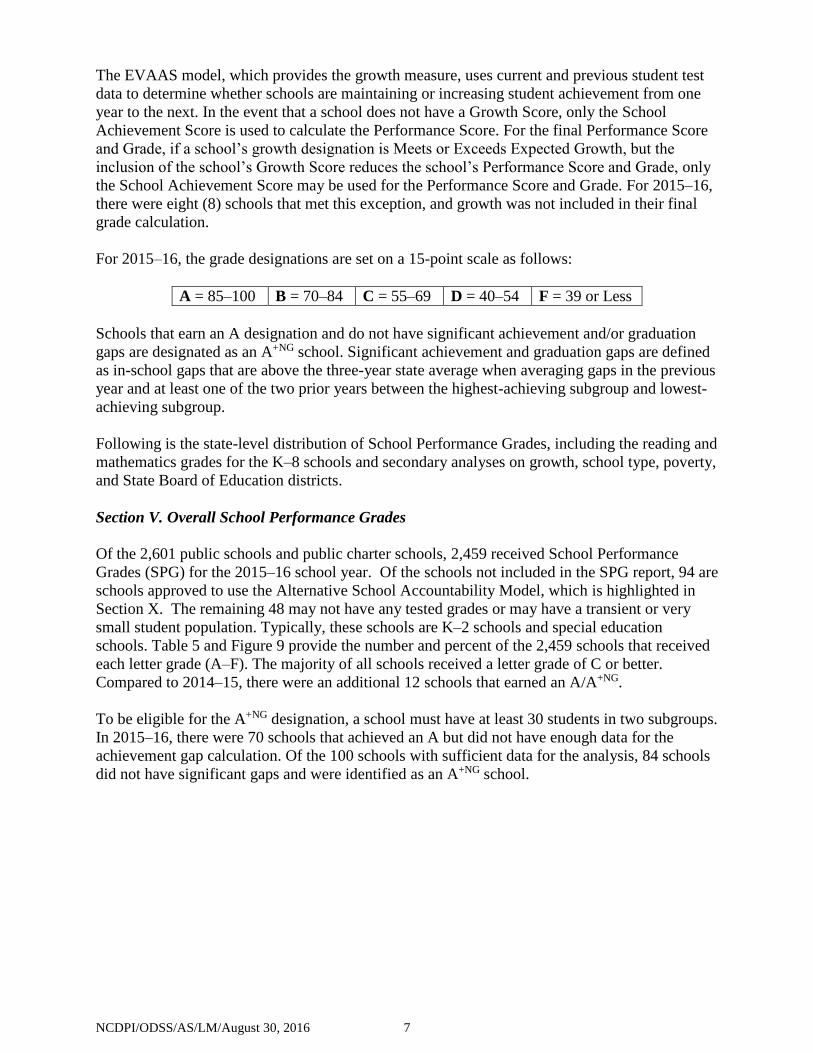
Of the 2,601 public schools and public charter schools, 2,459 received School Performance
Grades (SPG) for the 2015–16 school year. Of the schools not included in the SPG report, 94 are
schools approved to use the Alternative School Accountability Model, which is highlighted in
Section X. The remaining 48 may not have any tested grades or may have a transient or very
small student population. Typically, these schools are K–2 schools and special education
schools. Table 5 and Figure 9 provide the number and percent of the 2,459 schools that received
each letter grade (A–F). The majority of all schools received a letter grade of C or better.
Compared to 2014–15, there were an additional 12 schools that earned an A/A+NG.
To be eligible for the A+NG designation, a school must have at least 30 students in two subgroups.
In 2015–16, there were 70 schools that achieved an A but did not have enough data for the
achievement gap calculation. Of the 100 schools with sufficient data for the analysis, 84 schools
did not have significant gaps and were identified as an A+NG school.
NCDPI/ODSS/AS/LM/August 30, 2016 8
Table 5. Performance Grade by School (Public Schools and Public Charter Schools)*
Overall
Grade
Number
of Schools
2013–14
Percent
of Schools
2013–14
Number
of Schools
2014–15
Percent
of Schools
2014–15
Number
of Schools
2015–16
Percent
of Schools
2015–16
A+NG NA NA 69 2.8 84 3.4
A 132 5.4 89 3.6 86 3.5
B 582 24.0 584 23.9 634 25.8
C 1,003 41.4 1,022 41.8 1,084 44.1
D 561 23.1 536 21.9 469 19.1
F 146 6.0 146 6.0 102 4.1
Total 2,424 2,446 2,459
*Due to rounding, the percent of schools may not total 100%.
Figure 9. Performance grades by all schools
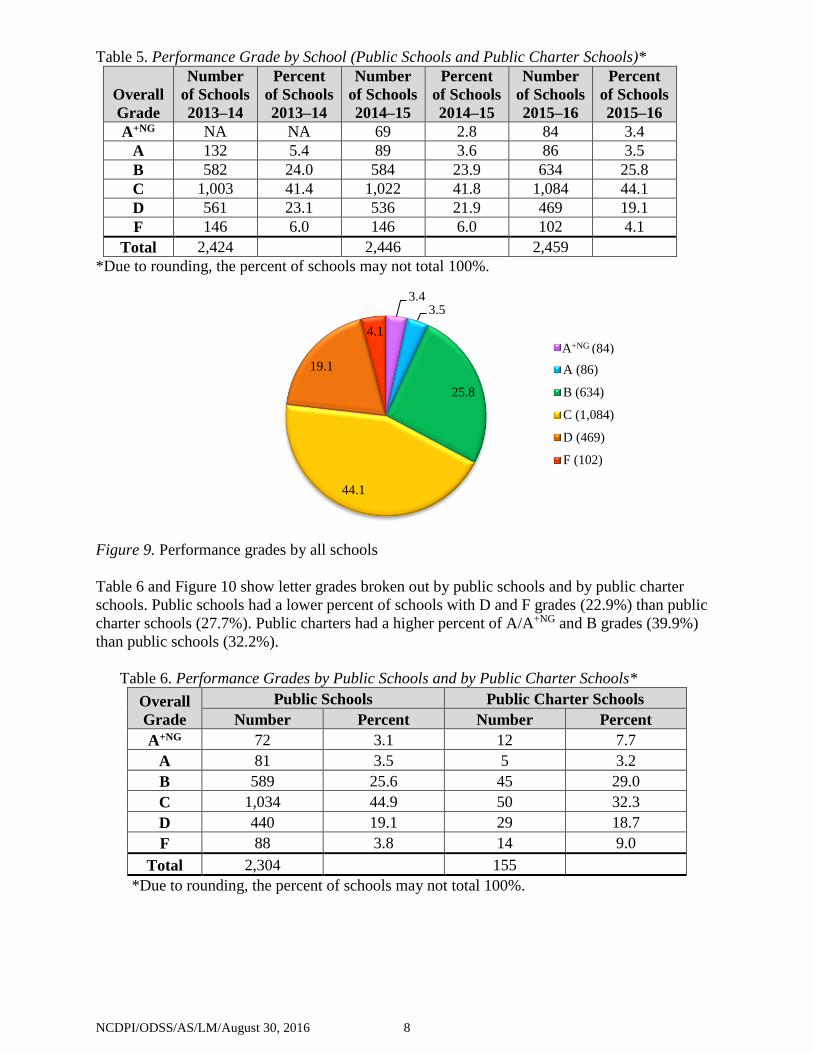
Table 6 and Figure 10 show letter grades broken out by public schools and by public charter
schools. Public schools had a lower percent of schools with D and F grades (22.9%) than public
charter schools (27.7%). Public charters had a higher percent of A/A+NG and B grades (39.9%)
than public schools (32.2%).
Table 6. Performance Grades by Public Schools and by Public Charter Schools*
Overall
Grade
Public Schools Public Charter Schools
Number Percent Number Percent
A+NG 72 3.1 12 7.7
A 81 3.5 5 3.2
B 589 25.6 45 29.0
C 1,034 44.9 50 32.3
D 440 19.1 29 18.7
F 88 3.8 14 9.0
Total 2,304 155
*Due to rounding, the percent of schools may not total 100%.
3.43.5
25.8
44.1
19.1
4.1
A (86)
B (634)
C (1,084)
D (469)
F (102)
A+NG (84)
NCDPI/ODSS/AS/LM/August 30, 2016 9
Figure 10. Performance grades for public schools and public charter schools
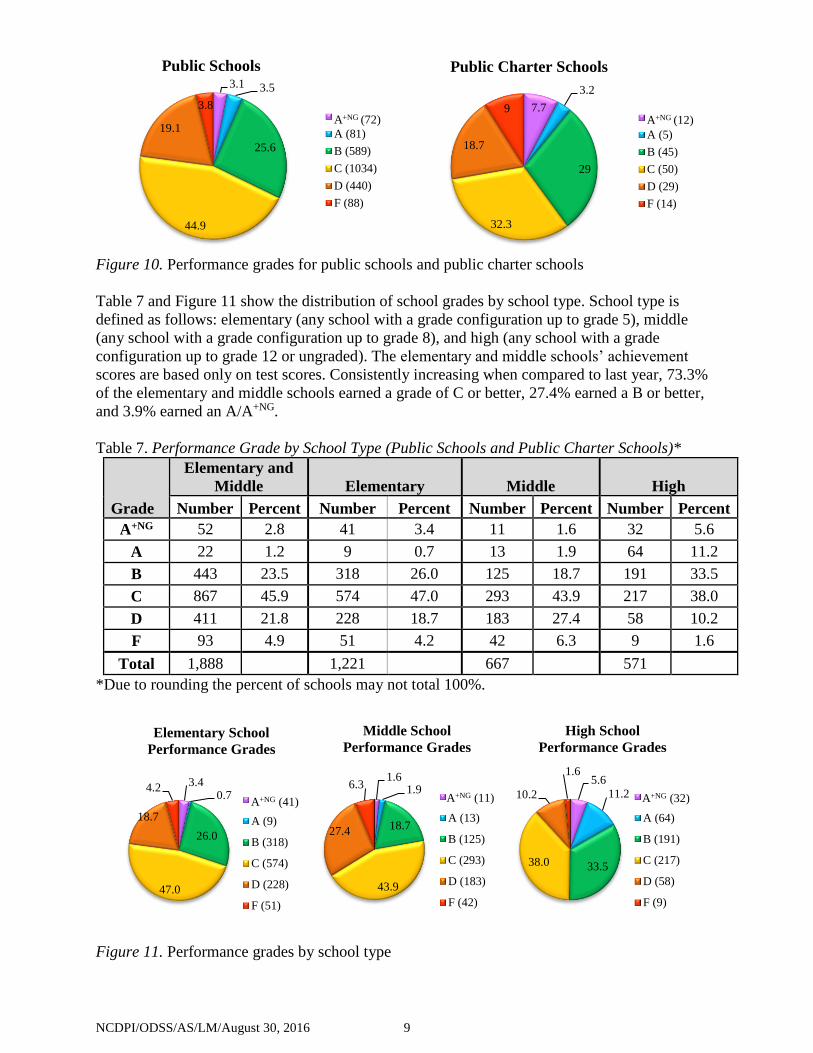
Table 7 and Figure 11 show the distribution of school grades by school type. School type is
defined as follows: elementary (any school with a grade configuration up to grade 5), middle
(any school with a grade configuration up to grade 8), and high (any school with a grade
configuration up to grade 12 or ungraded). The elementary and middle schools’ achievement
scores are based only on test scores. Consistently increasing when compared to last year, 73.3%
of the elementary and middle schools earned a grade of C or better, 27.4% earned a B or better,
and 3.9% earned an A/A+NG.
Table 7. Performance Grade by School Type (Public Schools and Public Charter Schools)*
Grade
Elementary and
Middle Elementary Middle High
Number Percent Number Percent Number Percent Number Percent
A+NG 52 2.8 41 3.4 11 1.6 32 5.6
A 22 1.2 9 0.7 13 1.9 64 11.2
B 443 23.5 318 26.0 125 18.7 191 33.5
C 867 45.9 574 47.0 293 43.9 217 38.0
D 411 21.8 228 18.7 183 27.4 58 10.2
F 93 4.9 51 4.2 42 6.3 9 1.6
Total 1,888 1,221 667 571
*Due to rounding the percent of schools may not total 100%.
Figure 11. Performance grades by school type
3.1 3.5
25.6
44.9
19.1
3.8
Public Schools
A (81)
B (589)
C (1034)
D (440)
F (88)
A+NG (72)7.7
3.2
29
32.3
18.7
9
Public Charter Schools
A (5)
B (45)
C (50)
D (29)
F (14)
A+NG (12)
3.40.7
26.0
47.0
18.7
4.2
Elementary School
Performance Grades
A (9)
B (318)
C (574)
D (228)
F (51)
A+NG (41)
1.61.9
18.7
43.9
27.4
6.3
Middle School
Performance Grades
A (13)
B (125)
C (293)
D (183)
F (42)
A+NG (11)
5.6
11.2
33.538.0
10.2
1.6
High School
Performance Grades
A (64)
B (191)
C (217)
D (58)
F (9)
A+NG (32)
NCDPI/ODSS/AS/LM/August 30, 2016 10
Section VI. Growth and School Performance Grades (Public Schools and Public Charter
Schools)
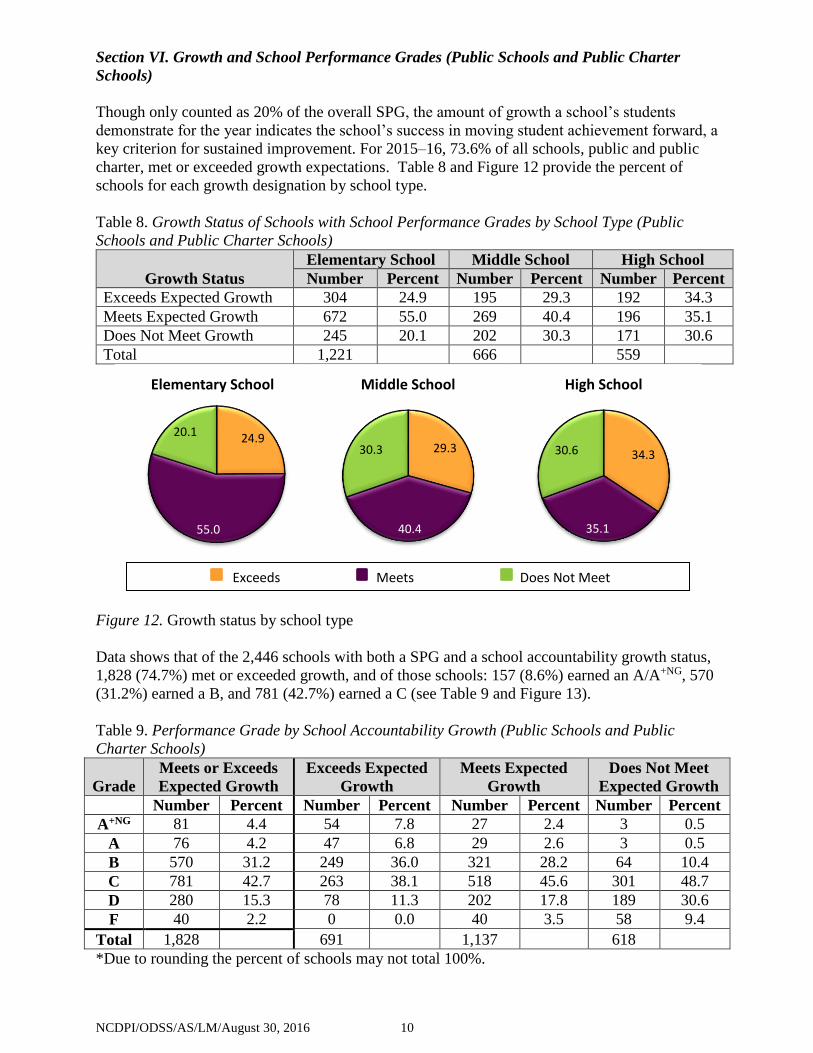
Though only counted as 20% of the overall SPG, the amount of growth a school’s students
demonstrate for the year indicates the school’s success in moving student achievement forward, a
key criterion for sustained improvement. For 2015–16, 73.6% of all schools, public and public
charter, met or exceeded growth expectations. Table 8 and Figure 12 provide the percent of
schools for each growth designation by school type.
Table 8. Growth Status of Schools with School Performance Grades by School Type (Public
Schools and Public Charter Schools)
Growth Status
Elementary School Middle School High School
Number Percent Number Percent Number Percent
Exceeds Expected Growth 304 24.9 195 29.3 192 34.3
Meets Expected Growth 672 55.0 269 40.4 196 35.1
Does Not Meet Growth 245 20.1 202 30.3 171 30.6
Total 1,221 666 559
Figure 12. Growth status by school type
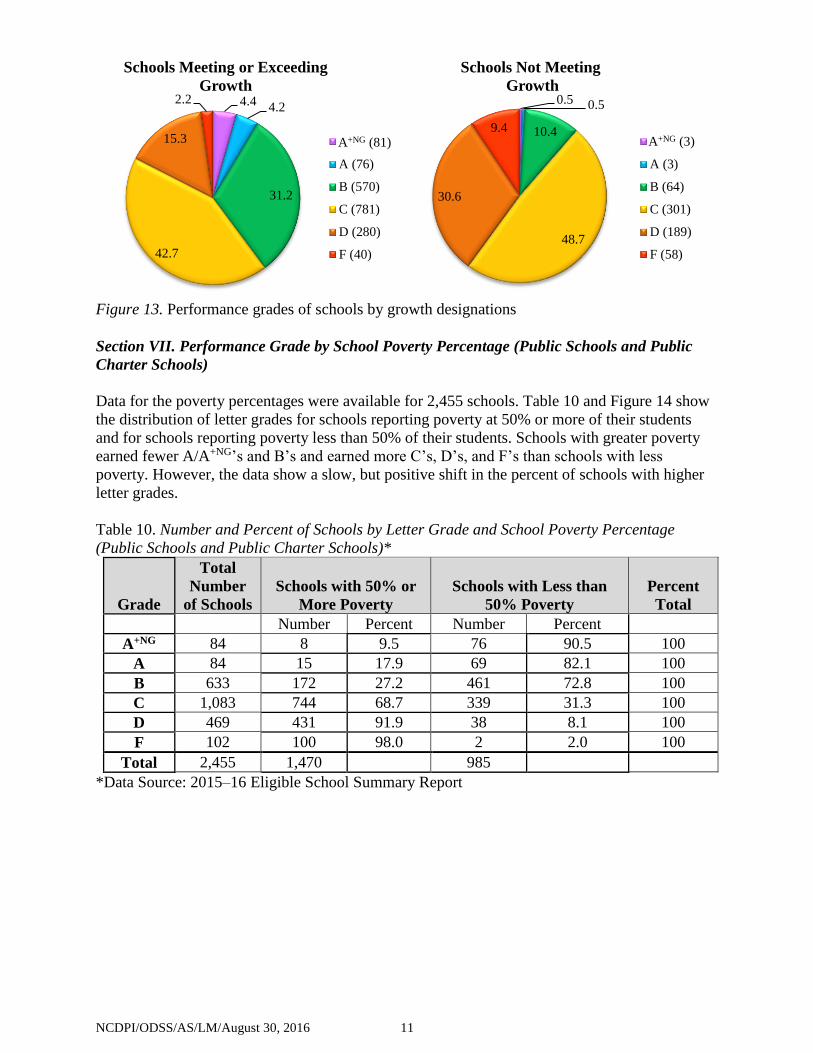
Data shows that of the 2,446 schools with both a SPG and a school accountability growth status,
1,828 (74.7%) met or exceeded growth, and of those schools: 157 (8.6%) earned an A/A+NG, 570
(31.2%) earned a B, and 781 (42.7%) earned a C (see Table 9 and Figure 13).
Table 9. Performance Grade by School Accountability Growth (Public Schools and Public
Charter Schools)
Grade
Meets or Exceeds
Expected Growth
Exceeds Expected
Growth
Meets Expected
Growth
Does Not Meet
Expected Growth
Number Percent Number Percent Number Percent Number Percent
A+NG 81 4.4 54 7.8 27 2.4 3 0.5
A 76 4.2 47 6.8 29 2.6 3 0.5
B 570 31.2 249 36.0 321 28.2 64 10.4
C 781 42.7 263 38.1 518 45.6 301 48.7
D 280 15.3 78 11.3 202 17.8 189 30.6
F 40 2.2 0 0.0 40 3.5 58 9.4
Total 1,828 691 1,137 618
*Due to rounding the percent of schools may not total 100%.
24.9
55.0
20.1
Elementary School
29.3
40.4
30.3
Middle School
34.3
35.1
30.6
High School
Exceeds Meets Does Not Meet
NCDPI/ODSS/AS/LM/August 30, 2016 11
Figure 13. Performance grades of schools by growth designations
Section VII. Performance Grade by School Poverty Percentage (Public Schools and Public
Charter Schools)
Data for the poverty percentages were available for 2,455 schools. Table 10 and Figure 14 show
the distribution of letter grades for schools reporting poverty at 50% or more of their students
and for schools reporting poverty less than 50% of their students. Schools with greater poverty
earned fewer A/A+NG’s and B’s and earned more C’s, D’s, and F’s than schools with less
poverty. However, the data show a slow, but positive shift in the percent of schools with higher
letter grades.
Table 10. Number and Percent of Schools by Letter Grade and School Poverty Percentage
(Public Schools and Public Charter Schools)*
Grade
Total
Number
of Schools
Schools with 50% or
More Poverty
Schools with Less than
50% Poverty
Percent
Total
Number Percent Number Percent
A+NG 84 8 9.5 76 90.5 100
A 84 15 17.9 69 82.1 100
B 633 172 27.2 461 72.8 100
C 1,083 744 68.7 339 31.3 100
D 469 431 91.9 38 8.1 100
F 102 100 98.0 2 2.0 100
Total 2,455 1,470 985
*Data Source: 2015–16 Eligible School Summary Report
4.4 4.2
31.2
42.7
15.3
2.2
Schools Meeting or Exceeding
Growth
A (76)
B (570)
C (781)
D (280)
F (40)
A+NG (81)
0.5 0.5
10.4
48.7
30.6
9.4
Schools Not Meeting
Growth
A (3)
B (64)
C (301)
D (189)
F (58)
A+NG (3)
NCDPI/ODSS/AS/LM/August 30, 2016 12
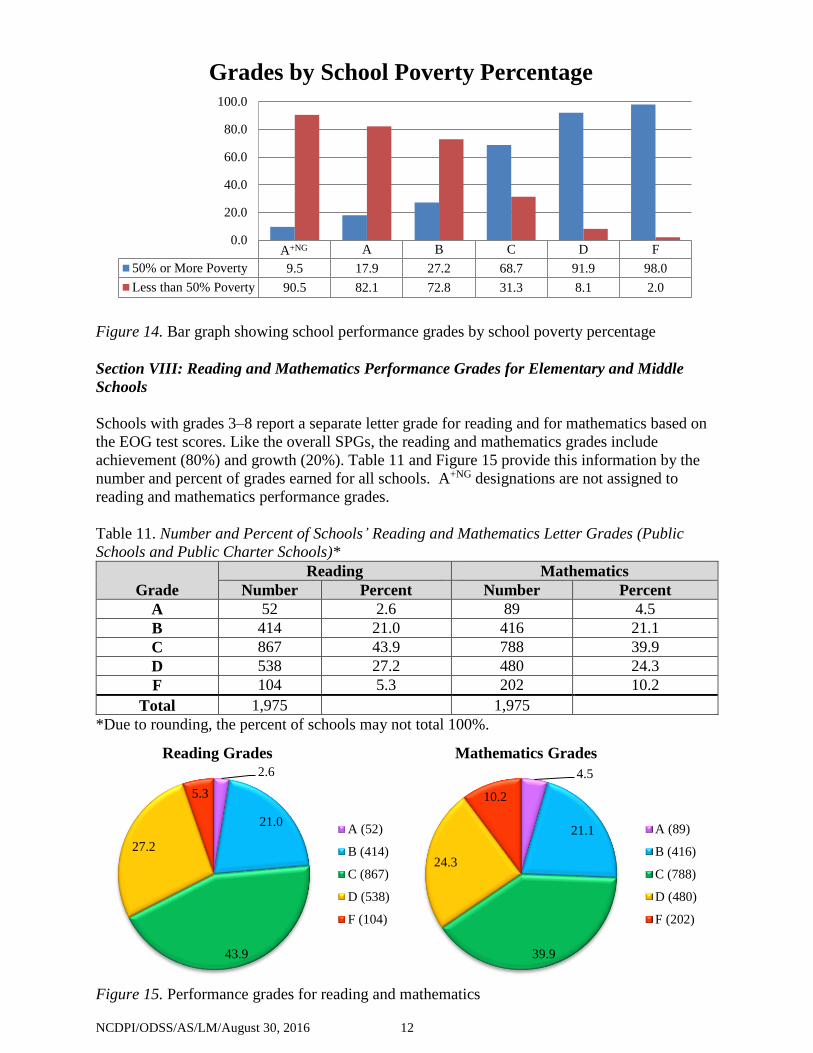
Figure 14. Bar graph showing school performance grades by school poverty percentage
Section VIII: Reading and Mathematics Performance Grades for Elementary and Middle
Schools
Schools with grades 3–8 report a separate letter grade for reading and for mathematics based on
the EOG test scores. Like the overall SPGs, the reading and mathematics grades include
achievement (80%) and growth (20%). Table 11 and Figure 15 provide this information by the
number and percent of grades earned for all schools. A+NG designations are not assigned to
reading and mathematics performance grades.
Table 11. Number and Percent of Schools’ Reading and Mathematics Letter Grades (Public
Schools and Public Charter Schools)*
Grade
Reading Mathematics
Number Percent Number Percent
A 52 2.6 89 4.5
B 414 21.0 416 21.1
C 867 43.9 788 39.9
D 538 27.2 480 24.3
F 104 5.3 202 10.2
Total 1,975 1,975
*Due to rounding, the percent of schools may not total 100%.
Figure 15. Performance grades for reading and mathematics
A B C D F
50% or More Poverty 9.5 17.9 27.2 68.7 91.9 98.0
Less than 50% Poverty 90.5 82.1 72.8 31.3 8.1 2.0
0.0
20.0
40.0
60.0
80.0
100.0
Grades by School Poverty Percentage
A+NG
2.6
21.0
43.9
27.2
5.3
Reading Grades
A (52)
B (414)
C (867)
D (538)
F (104)
4.5
21.1
39.9
24.3
10.2
Mathematics Grades
A (89)
B (416)
C (788)
D (480)
F (202)
NCDPI/ODSS/AS/LM/August 30, 2016 13
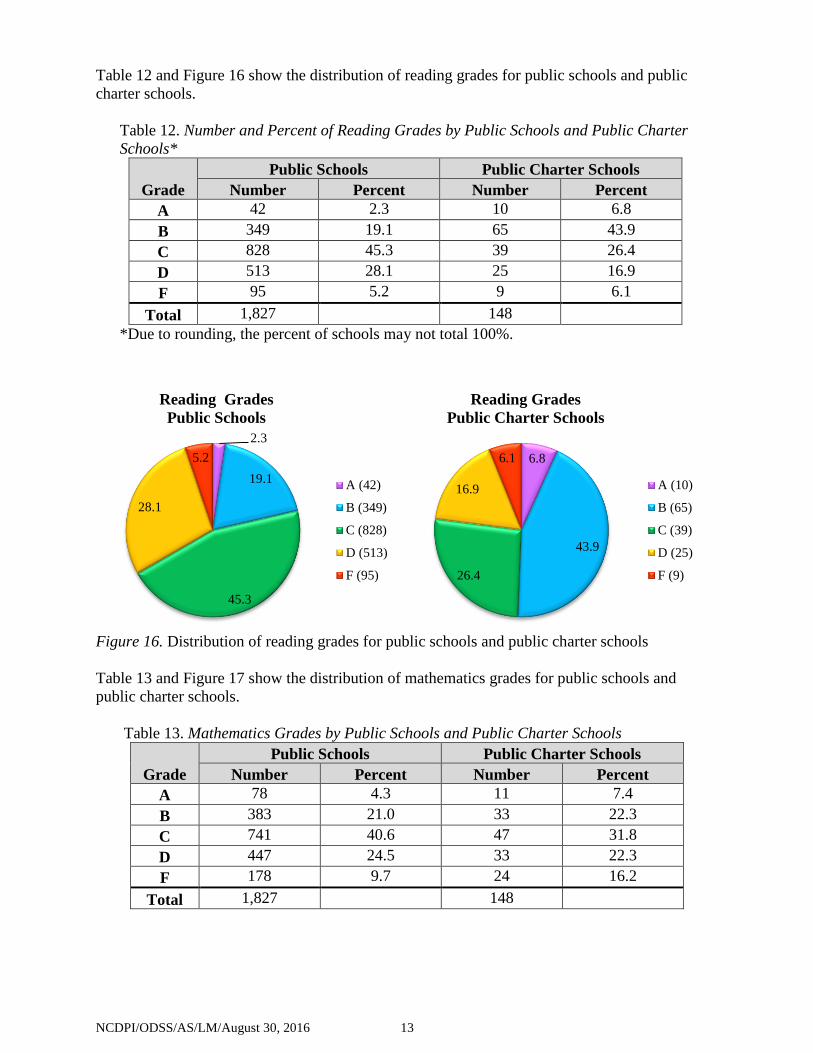
Table 12 and Figure 16 show the distribution of reading grades for public schools and public
charter schools.
Table 12. Number and Percent of Reading Grades by Public Schools and Public Charter
Schools*
Grade
Public Schools Public Charter Schools
Number Percent Number Percent
A 42 2.3 10 6.8
B 349 19.1 65 43.9
C 828 45.3 39 26.4
D 513 28.1 25 16.9
F 95 5.2 9 6.1
Total 1,827 148
*Due to rounding, the percent of schools may not total 100%.
Figure 16. Distribution of reading grades for public schools and public charter schools
Table 13 and Figure 17 show the distribution of mathematics grades for public schools and
public charter schools.
Table 13. Mathematics Grades by Public Schools and Public Charter Schools
Grade
Public Schools Public Charter Schools
Number Percent Number Percent
A 78 4.3 11 7.4
B 383 21.0 33 22.3
C 741 40.6 47 31.8
D 447 24.5 33 22.3
F 178 9.7 24 16.2
Total 1,827 148
2.3
19.1
45.3
28.1
5.2
Reading Grades
Public Schools
A (42)
B (349)
C (828)
D (513)
F (95)
6.8
43.9
26.4
16.9
6.1
Reading Grades
Public Charter Schools
A (10)
B (65)
C (39)
D (25)
F (9)
NCDPI/ODSS/AS/LM/August 30, 2016 14
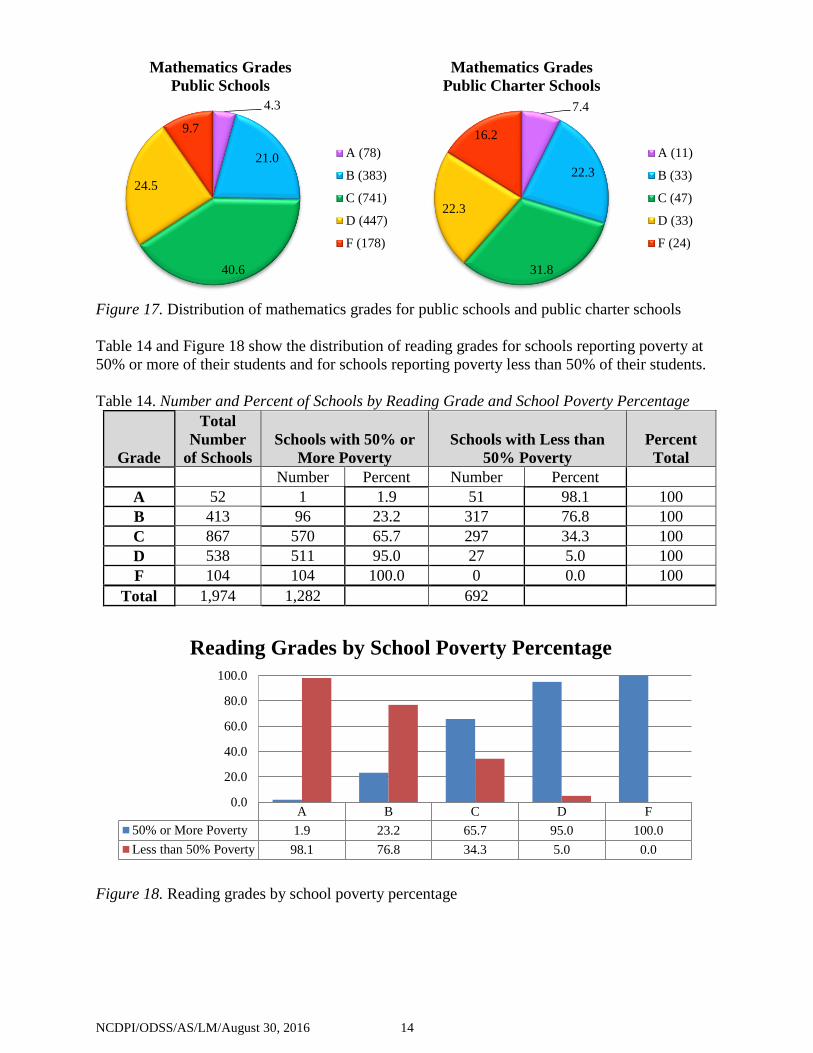
Figure 17. Distribution of mathematics grades for public schools and public charter schools
Table 14 and Figure 18 show the distribution of reading grades for schools reporting poverty at
50% or more of their students and for schools reporting poverty less than 50% of their students.
Table 14. Number and Percent of Schools by Reading Grade and School Poverty Percentage
Grade
Total
Number
of Schools
Schools with 50% or
More Poverty
Schools with Less than
50% Poverty
Percent
Total
Number Percent Number Percent
A 52 1 1.9 51 98.1 100
B 413 96 23.2 317 76.8 100
C 867 570 65.7 297 34.3 100
D 538 511 95.0 27 5.0 100
F 104 104 100.0 0 0.0 100
Total 1,974 1,282 692
Figure 18. Reading grades by school poverty percentage
4.3
21.0
40.6
24.5
9.7
Mathematics Grades
Public Schools
A (78)
B (383)
C (741)
D (447)
F (178)
7.4
22.3
31.8
22.3
16.2
Mathematics Grades
Public Charter Schools
A (11)
B (33)
C (47)
D (33)
F (24)
A B C D F
50% or More Poverty 1.9 23.2 65.7 95.0 100.0
Less than 50% Poverty 98.1 76.8 34.3 5.0 0.0
0.0
20.0
40.0
60.0
80.0
100.0
Reading Grades by School Poverty Percentage
NCDPI/ODSS/AS/LM/August 30, 2016 15
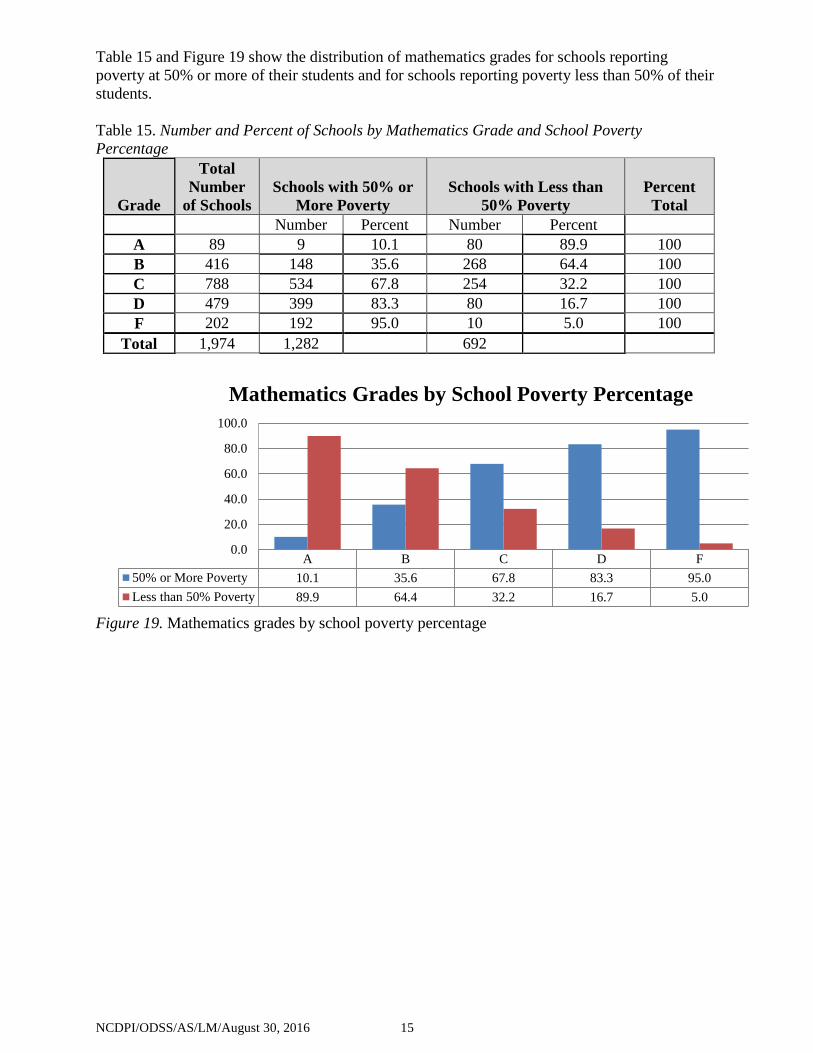
Table 15 and Figure 19 show the distribution of mathematics grades for schools reporting
poverty at 50% or more of their students and for schools reporting poverty less than 50% of their
students.
Table 15. Number and Percent of Schools by Mathematics Grade and School Poverty
Percentage
Grade
Total
Number
of Schools
Schools with 50% or
More Poverty
Schools with Less than
50% Poverty
Percent
Total
Number Percent Number Percent
A 89 9 10.1 80 89.9 100
B 416 148 35.6 268 64.4 100
C 788 534 67.8 254 32.2 100
D 479 399 83.3 80 16.7 100
F 202 192 95.0 10 5.0 100
Total 1,974 1,282 692
Figure 19. Mathematics grades by school poverty percentage
A B C D F
50% or More Poverty 10.1 35.6 67.8 83.3 95.0
Less than 50% Poverty 89.9 64.4 32.2 16.7 5.0
0.0
20.0
40.0
60.0
80.0
100.0
Mathematics Grades by School Poverty Percentage
NCDPI/ODSS/AS/LM/August 30, 2016 16
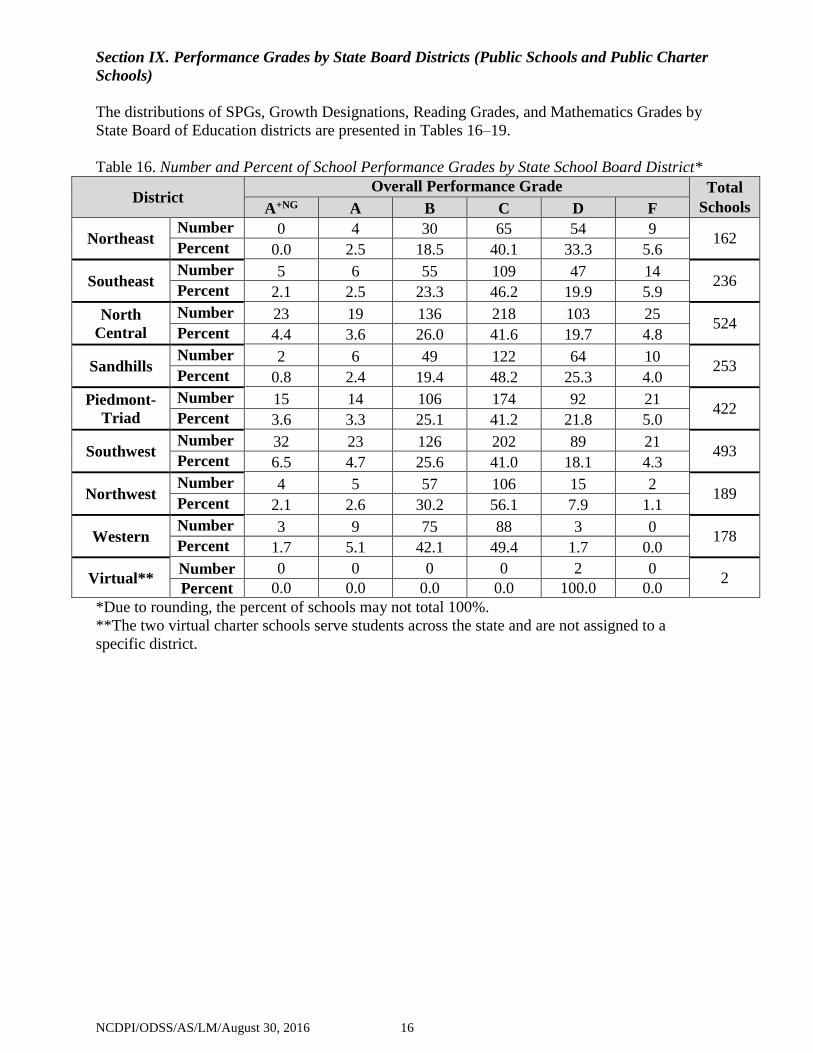
Section IX. Performance Grades by State Board Districts (Public Schools and Public Charter
Schools)
The distributions of SPGs, Growth Designations, Reading Grades, and Mathematics Grades by
State Board of Education districts are presented in Tables 16–19.
Table 16. Number and Percent of School Performance Grades by State School Board District*
District Overall Performance Grade Total
Schools A+NG A B C D F
Northeast Number 0 4 30 65 54 9
162 Percent 0.0 2.5 18.5 40.1 33.3 5.6
Southeast Number 5 6 55 109 47 14
236 Percent 2.1 2.5 23.3 46.2 19.9 5.9
North
Central
Number 23 19 136 218 103 25 524
Percent 4.4 3.6 26.0 41.6 19.7 4.8
Sandhills Number 2 6 49 122 64 10
253 Percent 0.8 2.4 19.4 48.2 25.3 4.0
Piedmont-
Triad
Number 15 14 106 174 92 21 422
Percent 3.6 3.3 25.1 41.2 21.8 5.0
Southwest Number 32 23 126 202 89 21
493 Percent 6.5 4.7 25.6 41.0 18.1 4.3
Northwest Number 4 5 57 106 15 2
189 Percent 2.1 2.6 30.2 56.1 7.9 1.1
Western Number 3 9 75 88 3 0
178 Percent 1.7 5.1 42.1 49.4 1.7 0.0
Virtual** Number 0 0 0 0 2 0
2 Percent 0.0 0.0 0.0 0.0 100.0 0.0
*Due to rounding, the percent of schools may not total 100%.
**The two virtual charter schools serve students across the state and are not assigned to a
specific district.
NCDPI/ODSS/AS/LM/August 30, 2016 17
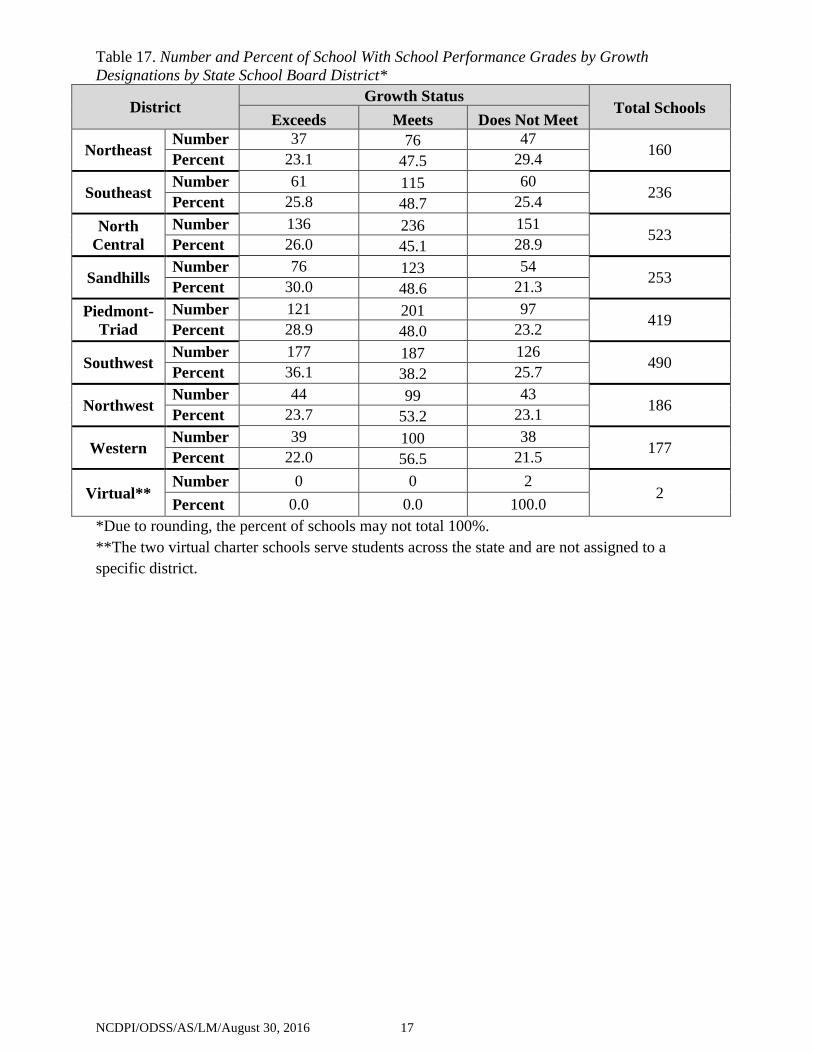
Table 17. Number and Percent of School With School Performance Grades by Growth
Designations by State School Board District*
District Growth Status
Total Schools Exceeds Meets Does Not Meet
Northeast Number 37 76 47
160 Percent 23.1 47.5 29.4
Southeast Number 61 115 60
236 Percent 25.8 48.7 25.4
North
Central
Number 136 236 151 523
Percent 26.0 45.1 28.9
Sandhills Number 76 123 54
253 Percent 30.0 48.6 21.3
Piedmont-
Triad
Number 121 201 97 419
Percent 28.9 48.0 23.2
Southwest Number 177 187 126
490 Percent 36.1 38.2 25.7
Northwest Number 44 99 43
186 Percent 23.7 53.2 23.1
Western Number 39 100 38
177 Percent 22.0 56.5 21.5
Virtual** Number 0 0 2
2 Percent 0.0 0.0 100.0
*Due to rounding, the percent of schools may not total 100%.
**The two virtual charter schools serve students across the state and are not assigned to a
specific district.
NCDPI/ODSS/AS/LM/August 30, 2016 18
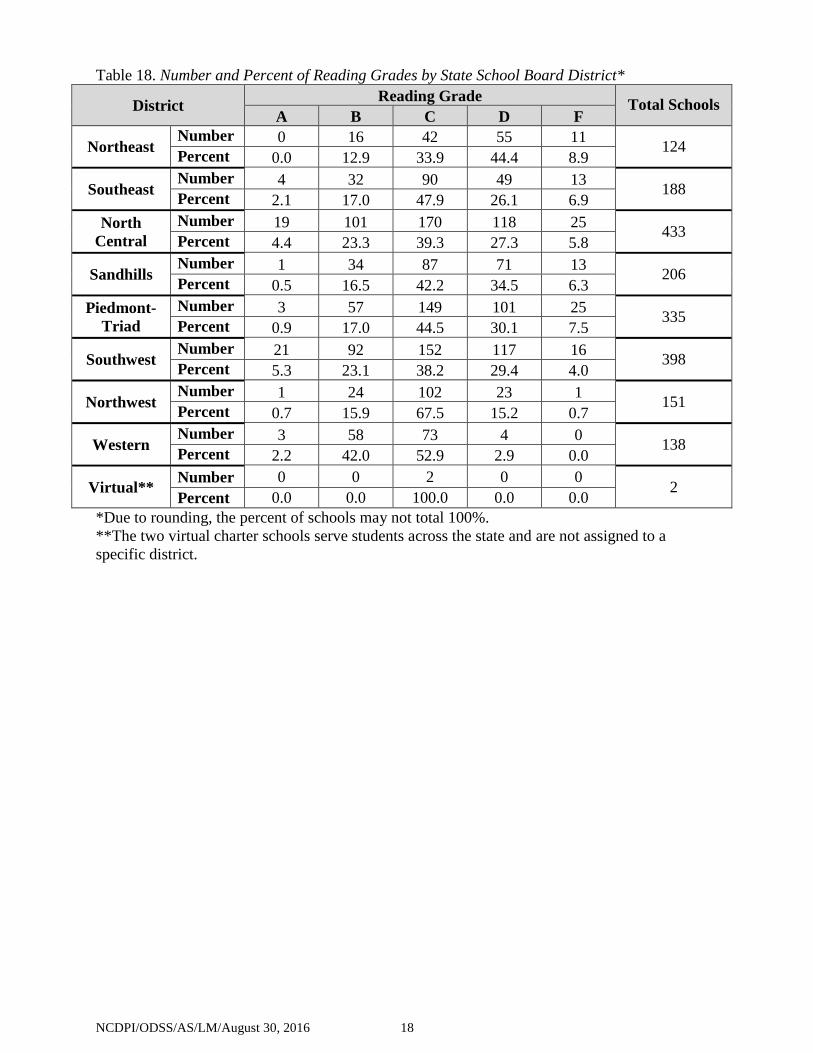
Table 18. Number and Percent of Reading Grades by State School Board District*
District Reading Grade
Total Schools A B C D F
Northeast Number 0 16 42 55 11
124 Percent 0.0 12.9 33.9 44.4 8.9
Southeast Number 4 32 90 49 13
188 Percent 2.1 17.0 47.9 26.1 6.9
North
Central
Number 19 101 170 118 25 433
Percent 4.4 23.3 39.3 27.3 5.8
Sandhills Number 1 34 87 71 13
206 Percent 0.5 16.5 42.2 34.5 6.3
Piedmont-
Triad
Number 3 57 149 101 25 335
Percent 0.9 17.0 44.5 30.1 7.5
Southwest Number 21 92 152 117 16
398 Percent 5.3 23.1 38.2 29.4 4.0
Northwest Number 1 24 102 23 1
151 Percent 0.7 15.9 67.5 15.2 0.7
Western Number 3 58 73 4 0
138 Percent 2.2 42.0 52.9 2.9 0.0
Virtual** Number 0 0 2 0 0
2 Percent 0.0 0.0 100.0 0.0 0.0
*Due to rounding, the percent of schools may not total 100%.
**The two virtual charter schools serve students across the state and are not assigned to a
specific district.
NCDPI/ODSS/AS/LM/August 30, 2016 19
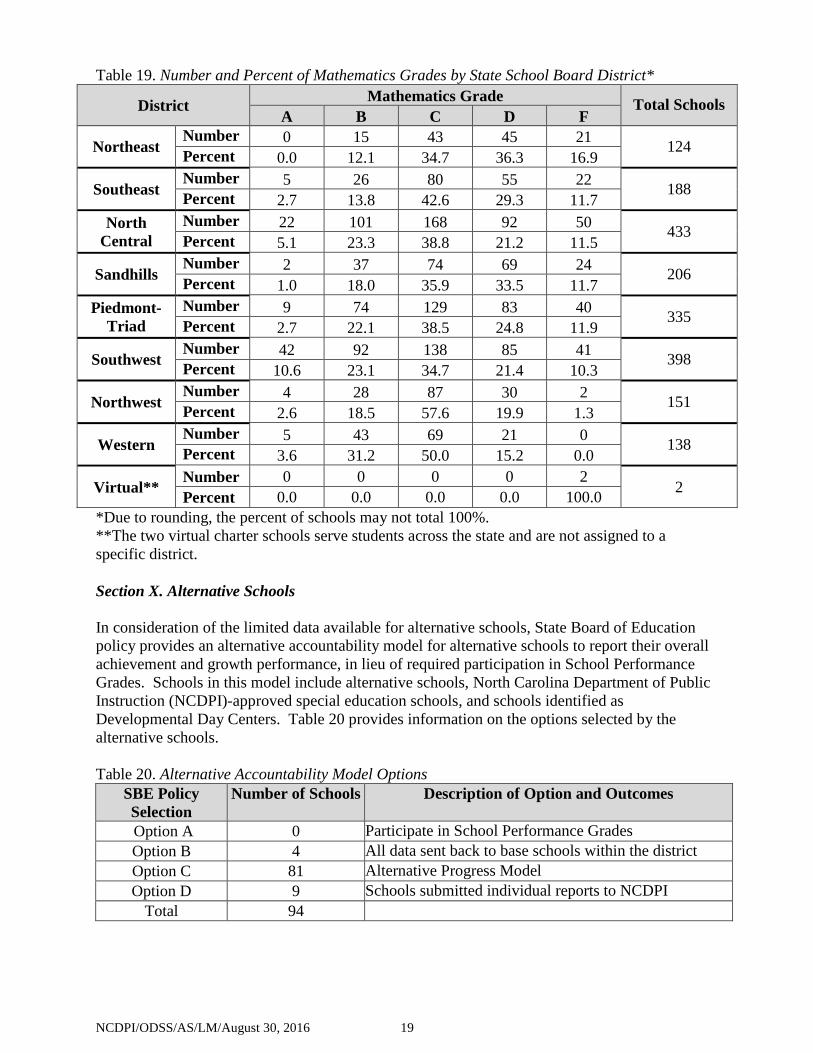
Table 19. Number and Percent of Mathematics Grades by State School Board District*
District Mathematics Grade
Total Schools A B C D F
Northeast Number 0 15 43 45 21
124 Percent 0.0 12.1 34.7 36.3 16.9
Southeast Number 5 26 80 55 22
188 Percent 2.7 13.8 42.6 29.3 11.7
North
Central
Number 22 101 168 92 50 433
Percent 5.1 23.3 38.8 21.2 11.5
Sandhills Number 2 37 74 69 24
206 Percent 1.0 18.0 35.9 33.5 11.7
Piedmont-
Triad
Number 9 74 129 83 40 335
Percent 2.7 22.1 38.5 24.8 11.9
Southwest Number 42 92 138 85 41
398 Percent 10.6 23.1 34.7 21.4 10.3
Northwest Number 4 28 87 30 2
151 Percent 2.6 18.5 57.6 19.9 1.3
Western Number 5 43 69 21 0
138 Percent 3.6 31.2 50.0 15.2 0.0
Virtual** Number 0 0 0 0 2
2 Percent 0.0 0.0 0.0 0.0 100.0
*Due to rounding, the percent of schools may not total 100%.
**The two virtual charter schools serve students across the state and are not assigned to a
specific district.
Section X. Alternative Schools
In consideration of the limited data available for alternative schools, State Board of Education
policy provides an alternative accountability model for alternative schools to report their overall
achievement and growth performance, in lieu of required participation in School Performance
Grades. Schools in this model include alternative schools, North Carolina Department of Public
Instruction (NCDPI)-approved special education schools, and schools identified as
Developmental Day Centers. Table 20 provides information on the options selected by the
alternative schools.
Table 20. Alternative Accountability Model Options
SBE Policy
Selection
Number of Schools Description of Option and Outcomes
Option A 0 Participate in School Performance Grades
Option B 4 All data sent back to base schools within the district
Option C 81 Alternative Progress Model
Option D 9 Schools submitted individual reports to NCDPI
Total 94
NCDPI/ODSS/AS/LM/August 30, 2016 20
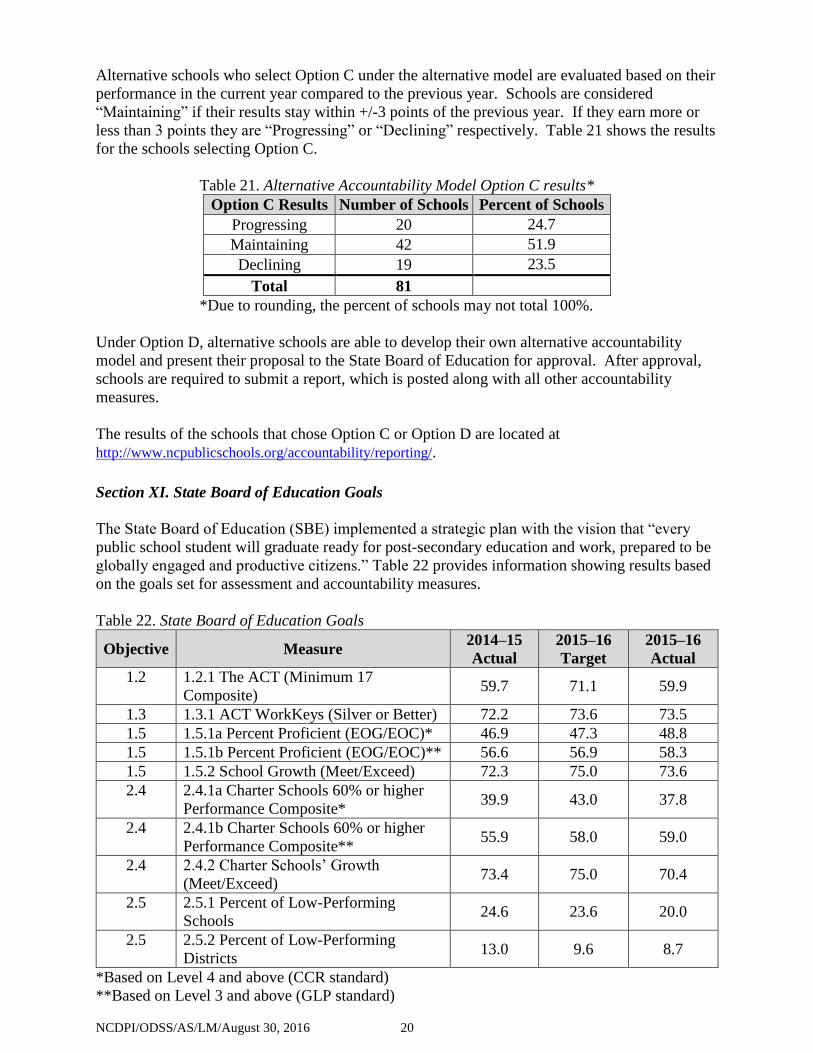
Alternative schools who select Option C under the alternative model are evaluated based on their
performance in the current year compared to the previous year. Schools are considered
“Maintaining” if their results stay within +/-3 points of the previous year. If they earn more or
less than 3 points they are “Progressing” or “Declining” respectively. Table 21 shows the results
for the schools selecting Option C.
Table 21. Alternative Accountability Model Option C results*
Option C Results Number of Schools Percent of Schools
Progressing 20 24.7
Maintaining 42 51.9
Declining 19 23.5
Total 81
*Due to rounding, the percent of schools may not total 100%.
Under Option D, alternative schools are able to develop their own alternative accountability
model and present their proposal to the State Board of Education for approval. After approval,
schools are required to submit a report, which is posted along with all other accountability
measures.
The results of the schools that chose Option C or Option D are located at
http://www.ncpublicschools.org/accountability/reporting/.
Section XI. State Board of Education Goals
The State Board of Education (SBE) implemented a strategic plan with the vision that “every
public school student will graduate ready for post-secondary education and work, prepared to be
globally engaged and productive citizens.” Table 22 provides information showing results based
on the goals set for assessment and accountability measures.
Table 22. State Board of Education Goals
Objective Measure 2014–15
Actual
2015–16
Target
2015–16
Actual
1.2 1.2.1 The ACT (Minimum 17
Composite) 59.7 71.1 59.9
1.3 1.3.1 ACT WorkKeys (Silver or Better) 72.2 73.6 73.5
1.5 1.5.1a Percent Proficient (EOG/EOC)* 46.9 47.3 48.8
1.5 1.5.1b Percent Proficient (EOG/EOC)** 56.6 56.9 58.3
1.5 1.5.2 School Growth (Meet/Exceed) 72.3 75.0 73.6
2.4 2.4.1a Charter Schools 60% or higher
Performance Composite* 39.9 43.0 37.8
2.4 2.4.1b Charter Schools 60% or higher
Performance Composite** 55.9 58.0 59.0
2.4 2.4.2 Charter Schools’ Growth
(Meet/Exceed) 73.4 75.0 70.4
2.5 2.5.1 Percent of Low-Performing
Schools 24.6 23.6 20.0
2.5 2.5.2 Percent of Low-Performing
Districts 13.0 9.6 8.7
*Based on Level 4 and above (CCR standard)
**Based on Level 3 and above (GLP standard)
NCDPI/ODSS/AS/LM/August 30, 2016 21
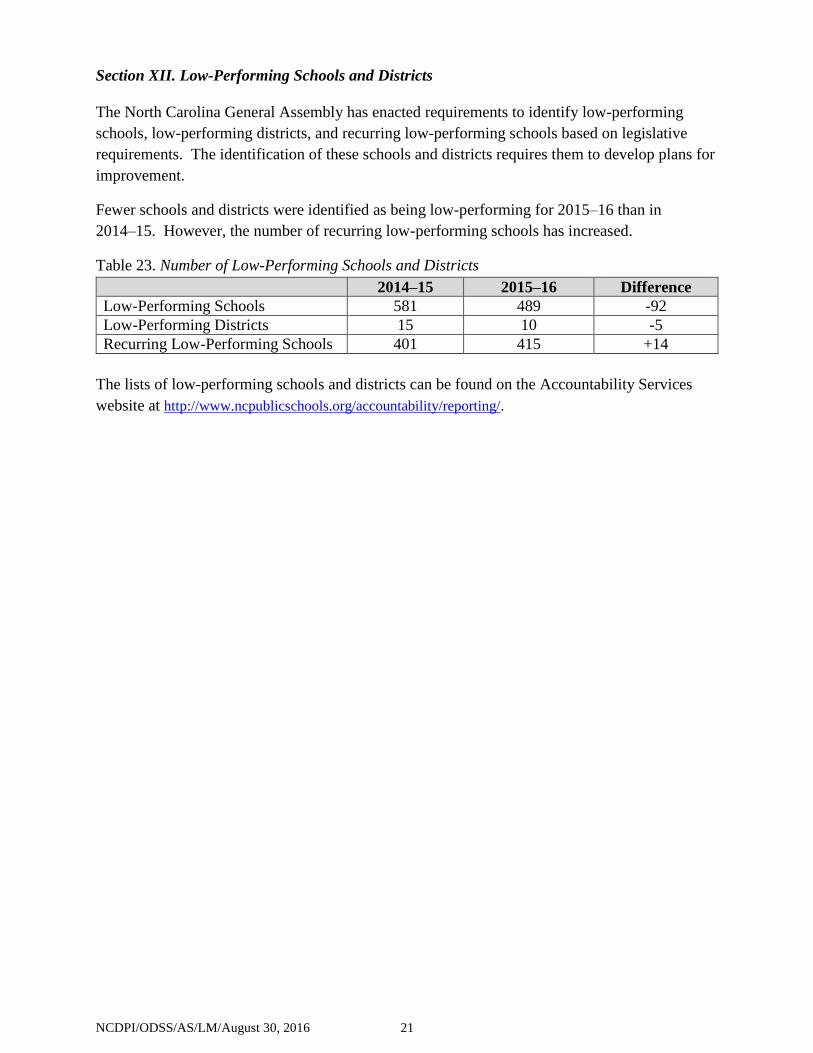
Section XII. Low-Performing Schools and Districts
The North Carolina General Assembly has enacted requirements to identify low-performing
schools, low-performing districts, and recurring low-performing schools based on legislative
requirements. The identification of these schools and districts requires them to develop plans for
improvement.
Fewer schools and districts were identified as being low-performing for 2015–16 than in
2014–15. However, the number of recurring low-performing schools has increased.
Table 23. Number of Low-Performing Schools and Districts
2014–15 2015–16 Difference
Low-Performing Schools 581 489 -92
Low-Performing Districts 15 10 -5
Recurring Low-Performing Schools 401 415 +14
The lists of low-performing schools and districts can be found on the Accountability Services
website at http://www.ncpublicschools.org/accountability/reporting/.