Embed Size (px)
Citation preview

2015- 2016
Performance Report
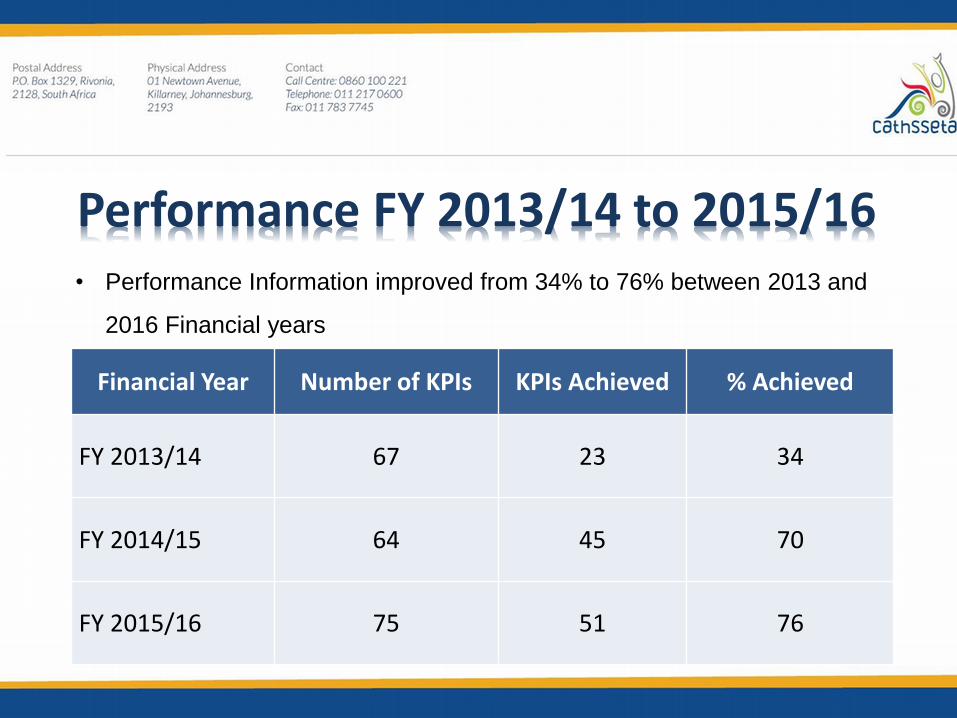
Financial Year Number of KPIs KPIs Achieved % Achieved
FY 2013/14 67 23 34
FY 2014/15 64 45 70
FY 2015/16 75 51 76
Performance FY 2013/14 to 2015/16• Performance Information improved from 34% to 76% between 2013 and
2016 Financial years

Summary Performance in FY 2015/16
Percentile Number of KPIs
KPIs Achieved
+100% 13
100% 38
75% - 99% 6
50% - 74% 7
0% - 49% 11

2015/16 Achievement per programme
Programme # KPIs# KPIs
achieved%
Achievement
Programme 1: Administration 25 15 60%
Programme 2: Governance 8 6 75%
Programme 3: Planning 8 8 100%
Programme 4: Learning Programmes 34 22 65%

LearnershipsNo Performance Indicator
Planned Target 2015/2016
Actual Achievement
2015/2016
%Achievement
1Employed learners entering
LEARNERSHIP programmes200 198 99%
2Employed learners completing
LEARNERSHIP programmes100 399 399%
3Unemployed Learners entering
LEARNERSHIP programmes400 690 173%
4Unemployed Learners completing
LEARNERSHIP programmes200 300 150%

Artisans & InternshipsNo Performance Indicator
Planned Target 2015/2016
Actual Achievement
2015/2016
%Achievement
1Number of ARTISANS entering training
programmes100 100 100%
2Number of ARTISANS completing
training programmes50 89 178%
3
Number of unemployed Learners
entering WORK EXPERIENCE /
INTERNSHIP programmes
320 320 100%
4
Number of unemployed Learners
completing WORK EXPERIENCE /
INTERNSHIP programmes
260 126 48%

Bursaries
No Performance IndicatorPlanned Target
2015/2016
Actual Achievement
2015/2016
%Achievement
1Number of Learners entering
BURSARY programmes350 498 142%
2Number of Learners completing
BURSARY programmes (employed and unemployed)
175 133 76%
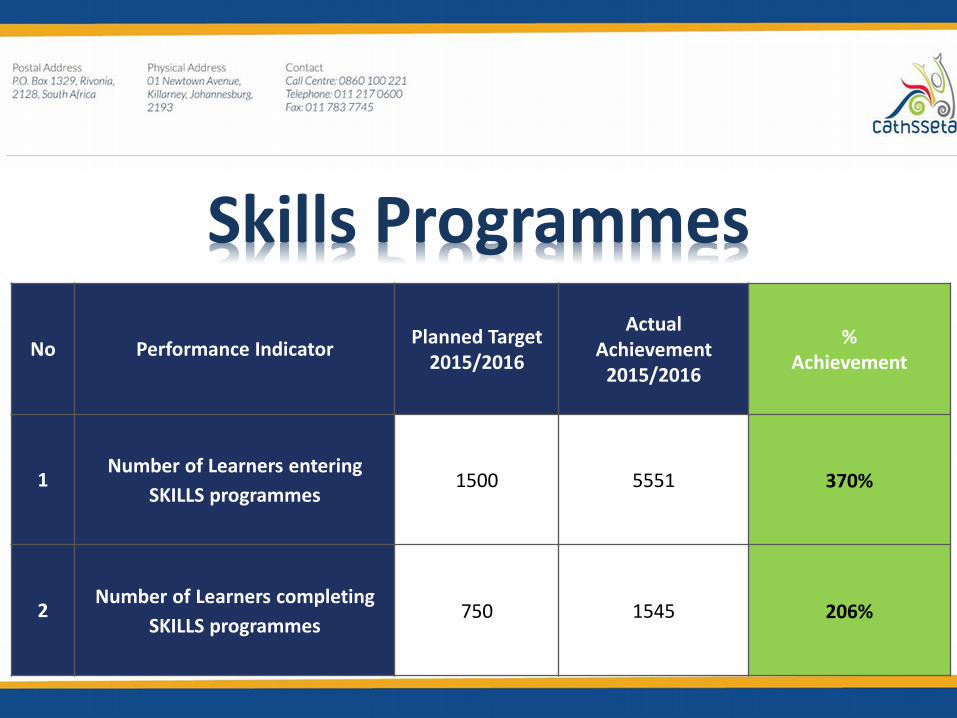
Skills Programmes
No Performance IndicatorPlanned Target
2015/2016
Actual Achievement
2015/2016
%Achievement
1Number of Learners entering
SKILLS programmes1500 5551 370%
2Number of Learners completing
SKILLS programmes750 1545 206%

TVET Graduates
No Performance IndicatorPlanned Target
2014/2015
Actual Achievement
2014/2015
Planned Target
2015/2016
Actual Achievement
2015/2016
%Achievement
1
Number of Learners entering TVET
COLLEGE programmes
1000 1082 1200 804 67%

Reasons for Variance• Strategic/Special Project contribution to
increased delivery
• Projects reported in the year completed

Provincial Distribution for 15/16Province/Programme Bursary Learnership Internships
Skills Programme
Work Integrated Learning
Total
Gauteng 95 183 221 136 271 906
Western Cape 53 89 73 90 165 470
KwaZulu Natal 69 121 5 0 133 328
Limpopo 38 124 0 40 93 295
Free State 11 10 0 20 71 112
North West 27 3 18 40 43 131
Eastern Cape 36 108 6 70 127 347
Mpumalanga 24 45 0 26 19 114
Northern Cape 0 20 0 0 0 20
Total 353 703 323 422 922 3 023

• Uneven distribution of service providers and training providers
• Migration to “rural” to “urban” provinces
• Learner dropouts
• Learner throughput from TVET Colleges
• Low intake on TVET Colleges’ programmes
• Participation by employers in smaller regions
Reasons for Variance

Provincial Targets for 2016/17Province/Programme Bursary Learnership Internships
Skills Programme
Work Integrated Learning
Total
Gauteng 30 126 45 56 150 407
Western Cape 30 125 45 70 150 420
KwaZulu Natal 30 125 45 42 150 392
Limpopo 60 124 90 252 150 676
Free State 90 175 75 196 225 761
North West 90 124 90 280 150 734
Eastern Cape 120 200 135 168 300 923
Mpumalanga 90 124 120 196 150 680
Northern Cape 60 124 105 140 75 504
Total 600 1247 750 1400 1500 5497
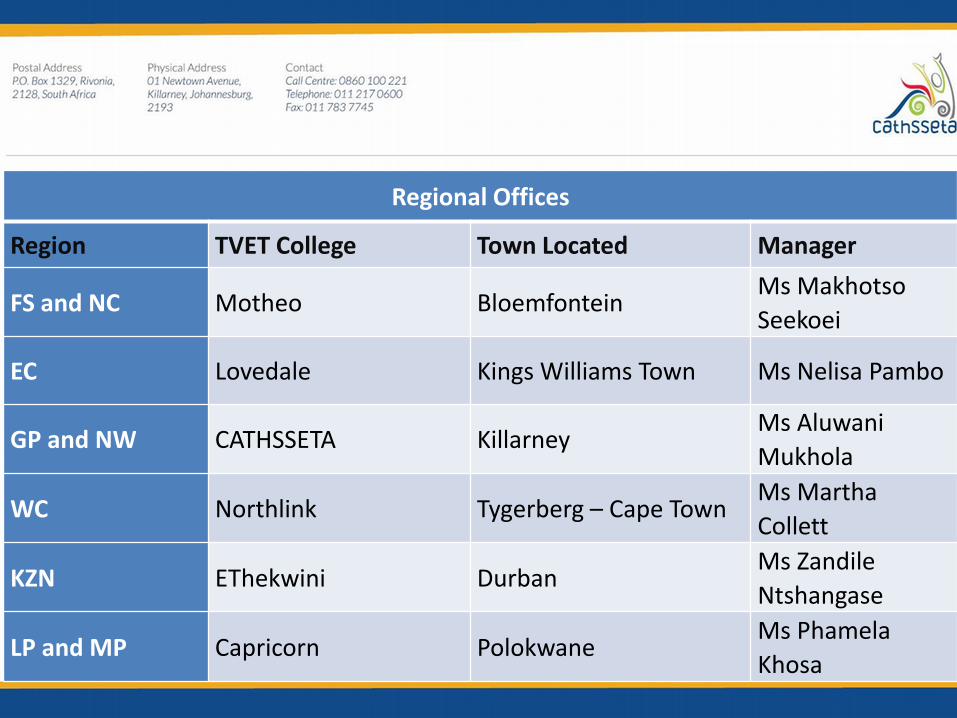
Regional Offices
Region TVET College Town Located Manager
FS and NC Motheo BloemfonteinMs Makhotso
Seekoei
EC Lovedale Kings Williams Town Ms Nelisa Pambo
GP and NW CATHSSETA KillarneyMs Aluwani
Mukhola
WC Northlink Tygerberg – Cape TownMs Martha
Collett
KZN EThekwini DurbanMs Zandile
Ntshangase
LP and MP Capricorn PolokwaneMs Phamela
Khosa

Servicing Training Providers
Requirement New / Received/
Additional Evidence
submitted
Approved /
Registered
Reasons for deviation
Accreditation
(Training Provider)
• 52 applications
were received
• 17 providers
were accredited
• A number of providers did
not proceed to Phase B
Programme • 167• 74 full approval
awarded
• The programmes that are
submitted have insufficient
evidence or do not meet
the SAQA requirements.

Contd..Servicing Training Providers
Requirement New / Received/
Additional Evidence
submitted
Approved /
Registered
Reasons for deviation
Programme • 167• 74 full approval
awarded
• Some providers only
submit a sample of the
programme and not the
full pack i.e.
Programme strategy Assessment tools Learner guide Facilitator guide Programme strategy Alignment matrix

Requirement New / Received/
Additional Evidence
submitted
Approved /
Registered
Reasons for deviation
Assessor
• 323 new
applications
received
• 233 new
assessors
registered
• 455 re
registrations
• Assessors submit
inadequate evidence. In
some instances the
applicant is not a subject
matter expert on the
programme they are
applying to assess. In some
instances the applicant does
not have the ETDP SETA
statement of results.
Contd..Servicing Training Providers
Requirement New / Received/
Additional Evidence
submitted
Approved /
Registered
Reasons for
deviation
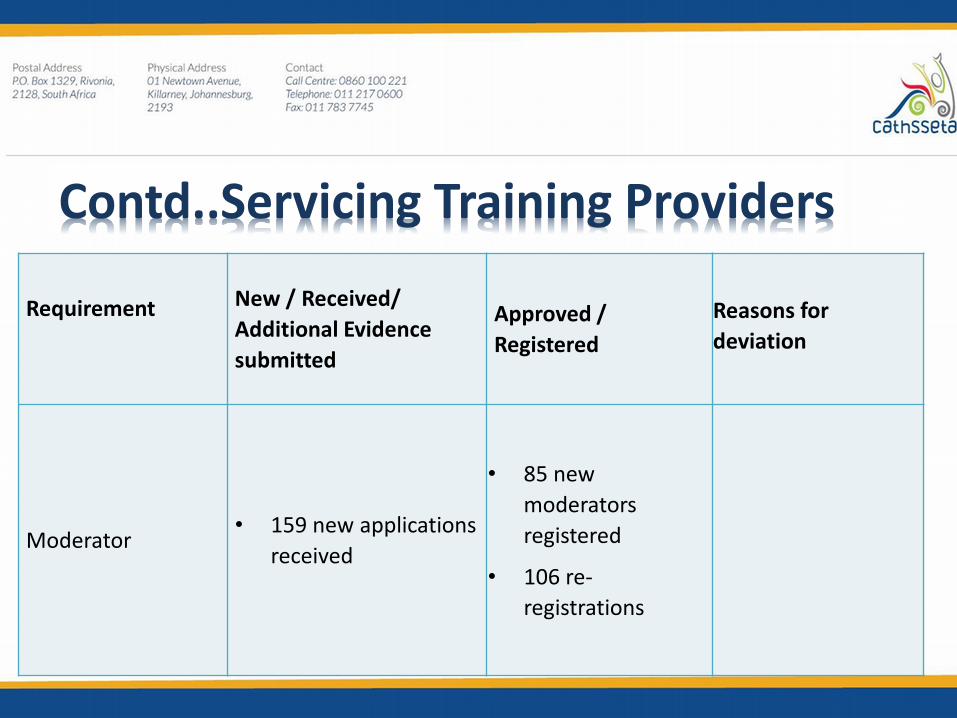
Moderator• 159 new applications
received
• 85 new
moderators
registered
• 106 re-
registrations
Contd..Servicing Training Providers

Strategy 2017-2018

• Qualification review
• Training provision
• Analysis of skills needs
• Work experience and experiential learning
• TVET capacity building
• Increased need for partnerships
• Transformation in the sector
• Addressing scarce and critical skills
SSP Priorities
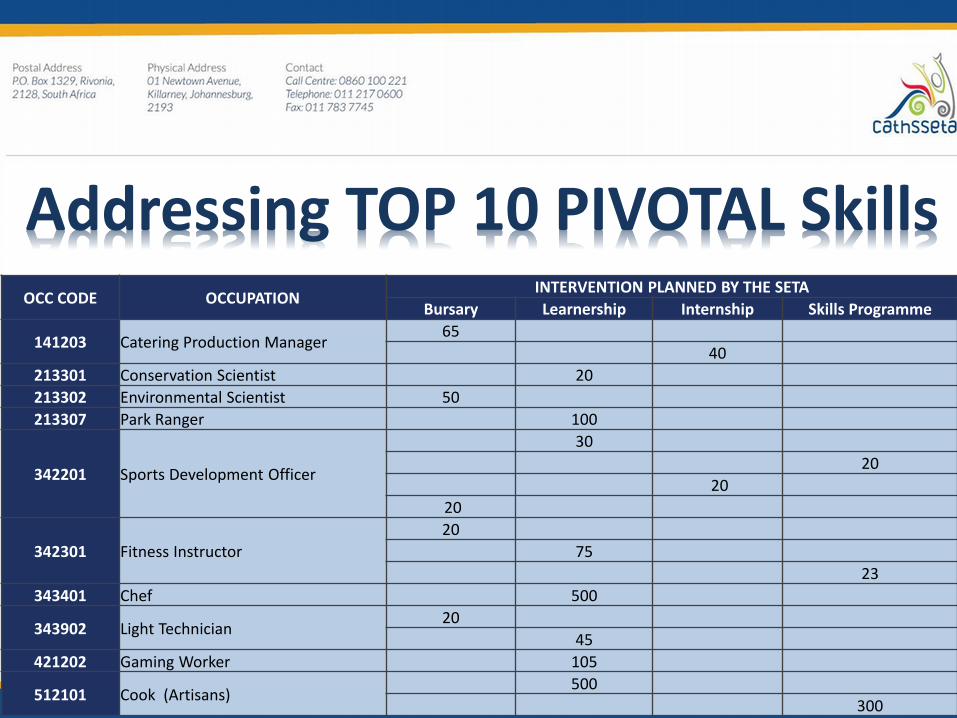
Addressing TOP 10 PIVOTAL SkillsOCC CODE OCCUPATION
INTERVENTION PLANNED BY THE SETA
Bursary Learnership Internship Skills Programme
141203 Catering Production Manager65
40
213301 Conservation Scientist 20
213302 Environmental Scientist 50
213307 Park Ranger 100
342201 Sports Development Officer
30
20
20
20
342301 Fitness Instructor
20
75
23
343401 Chef 500
343902 Light Technician 20
45
421202 Gaming Worker 105
512101 Cook (Artisans)500
300

Performance IndicatorsCATHSSETA
APP Target
Sector
Targets
CATHS+SECTOR
Final SLA Targets
Total Budget
17/18
Employed Learners entering LEARNERSHIP programmes
500 1250 1 750 R 10 000 000
Employed Learners entering BURSARY programmes
550 0 550 R 19 250 000
Employed Learners entering SKILLS programmes
1 500 0 1 500 R 15 000 000
Unemployed Learners entering LEARNERSHIP programmes
400 1300 1 700 R 20 000 000
Unemployed Learners entering BURSARY programmes
450 0 450 R 30 150 000
Unemployed Learners entering SKILLS programmes
1 100 0 1 100 R 11 000 000
Artisans Entered 358 0 358 R 17 900 000
TVET Graduate Placement NCV Learners 1 200 0 1 200 R 21 600 000TVET Graduate Placement N6 Learners 300 0 300 R 10 800 000
Unemployed Entering Internships 600 0 600 R 25 200 000TOTALS 6 958 2 550 9 508 R 180 900 000
Targets: Learning Interventions

Finance Presentation

Finance PresentationAFS - 2015/16
and BUDGETS –2016/17 &
2017/18

• Revenue from skills development levies by employers @ 1% of monthly wages & salariesif total salary bill if payroll >R500 000 p.a.
• Income is allocated as follows:– National Skills Fund 20%– Administration 10.5% (0.5% = QCTO)– Mandatory Grants 20%– Discretionary Grants/Projects 49.5%
• DG/ project expenditure regulated to a minimum of 80% for PIVOTAL and a maximum of20% for NON-PIVOTAL training.
• DG related admin costs capped at 7.5% of DG/Project expenditure
• * 10.5% and 7.5% (project administration costs) still a challenge due to structuralsectorial design of CATHSSETA, as it is one of the smallest SETAs
Key Regulatory Requirements- Expenditures of the SETA
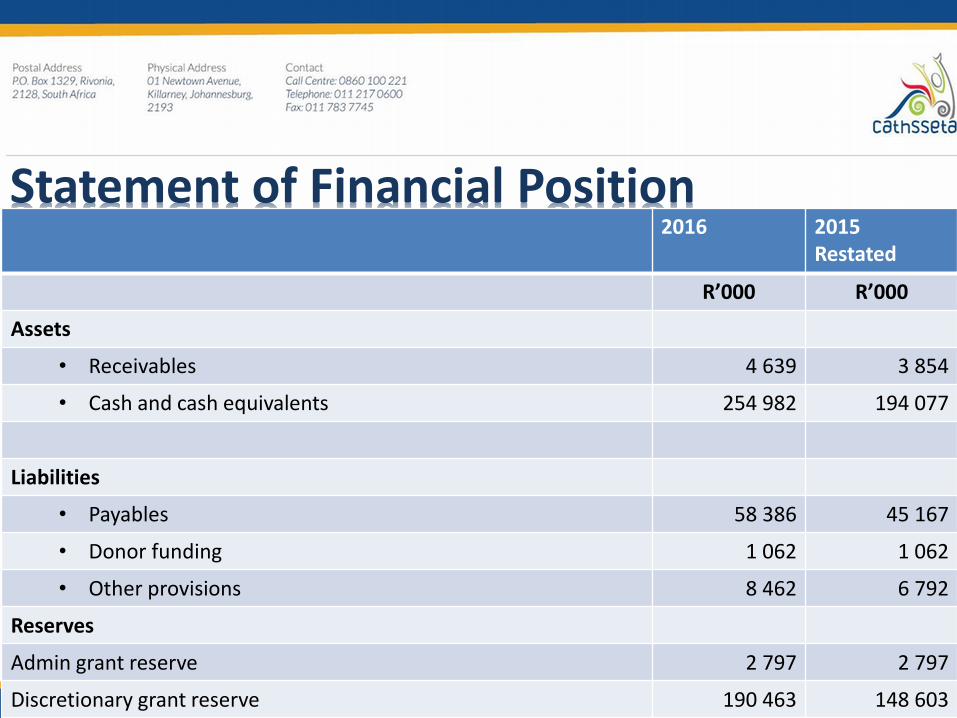
Statement of Financial Position2016 2015
Restated
R’000 R’000
Assets
• Receivables 4 639 3 854
• Cash and cash equivalents 254 982 194 077
Liabilities
• Payables 58 386 45 167
• Donor funding 1 062 1 062
• Other provisions 8 462 6 792
Reserves
Admin grant reserve 2 797 2 797
Discretionary grant reserve 190 463 148 603

2016 2015Restated
R’000 R’000
Revenue 316 426 284 474
• Non-exchange revenues 305 033 276 175
• Exchange revenue (Investment income) 11 393 8 299
Expenses 274 566 246 700
• Employer grant and project expenses 205 976 179 660
• Administrative expenses 68 516 66 900
• Other expenses (Losses on disposal of assets) 74 140
Net Surplus 41 860 37 774
Statement of Financial Performance

2016 R’000 2015 R’000
183 386 73 413
39 964
8 270
Discretionary Mandatory Administration Interest and penalties
164 827 66 462
38 640
8 299
Discretionary Mandatory Administration Interest and penalties
Revenue Split

-
20 000
40 000
60 000
80 000
100 000
120 000
140 000
160 000
180 000
200 000
Discretionary Mandatory Administration
Revenue Expenditure
Revenue vs expenditure split (R’m – 2016)

2016 2015Restated
R’000 R’000
Revaluation Reserve 531 531
Employer Grant Reserve 41 41
Administration Reserve 2 797 2 797
Discretionary Grant Reserve 190 463 148 603
Total 193 833 151 972
Statement of Changes in Net Assets
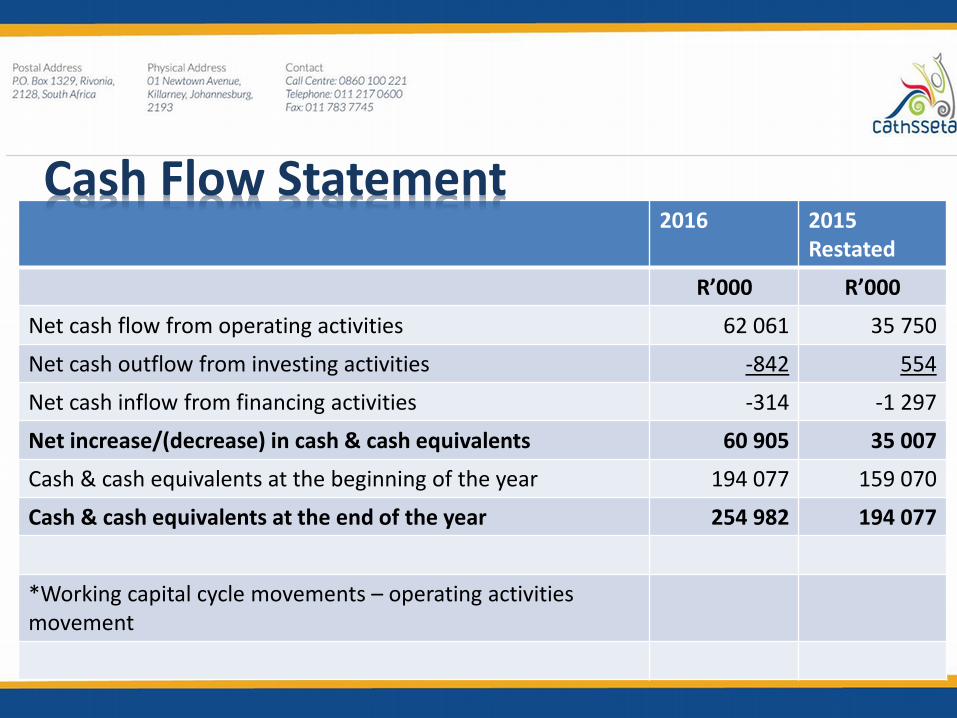
2016 2015Restated
R’000 R’000
Net cash flow from operating activities 62 061 35 750
Net cash outflow from investing activities -842 554
Net cash inflow from financing activities -314 -1 297
Net increase/(decrease) in cash & cash equivalents 60 905 35 007
Cash & cash equivalents at the beginning of the year 194 077 159 070
Cash & cash equivalents at the end of the year 254 982 194 077
*Working capital cycle movements – operating activities movement
Cash Flow Statement

2016 2015Restated
R’000 R’000
Commitment Funds 145 741 162 342
Discretionary Grants Reserves 190 463 148 603
Net Balance – (Over) / under commitments 44 722 (13 739)
Cash reserves 254 982 194 077
Commitments - Over / (Under)

2016R’000
2015R’000
Opening balance 79 301 54 324
Current Year
- Non-compliance to SCM prescripts 1 321 26 238
- Non-compliance to legislation, i.e. deviations 4 468 14 813
- Contracts extensions –by CEO with no AA approval 1 391* -
- Administration Expenditure in excess of thresholds 27 965 28 567
Total Amounts 114 446 123 942
Duly condoned (113 055) (44 641)
Balance 1 391 79 301
NB: Balance @YE: awaiting National Treasury condonation process to be finalised
Irregular Expenditure
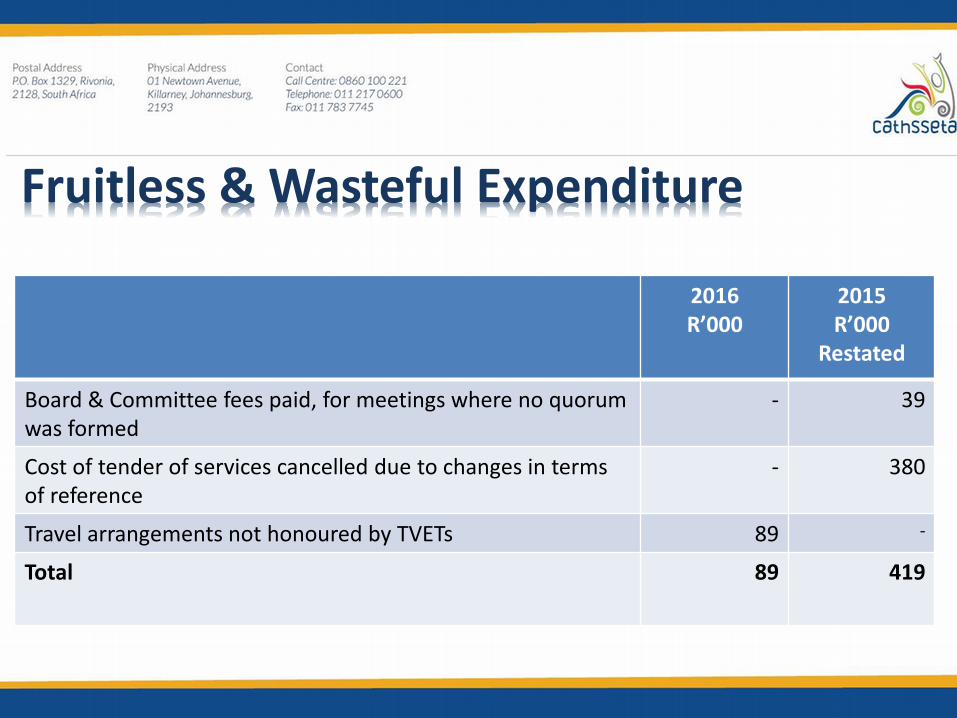
2016R’000
2015R’000
Restated
Board & Committee fees paid, for meetings where no quorum was formed
- 39
Cost of tender of services cancelled due to changes in terms of reference
- 380
Travel arrangements not honoured by TVETs 89 -
Total 89 419
Fruitless & Wasteful Expenditure
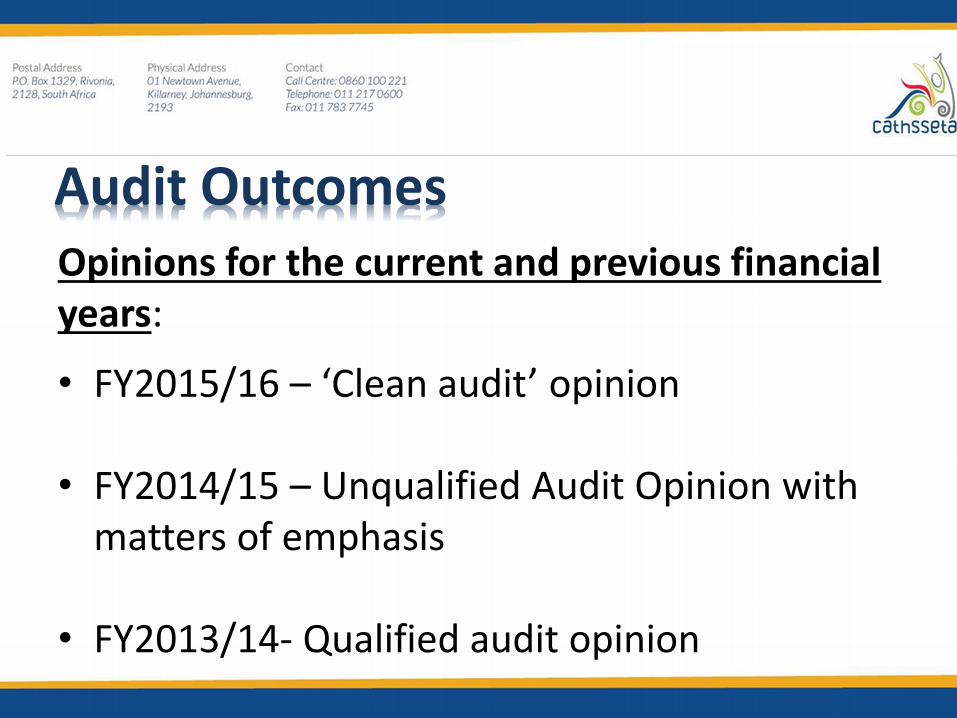
Audit OutcomesOpinions for the current and previous financial years:
• FY2015/16 – ‘Clean audit’ opinion
• FY2014/15 – Unqualified Audit Opinion with matters of emphasis
• FY2013/14- Qualified audit opinion
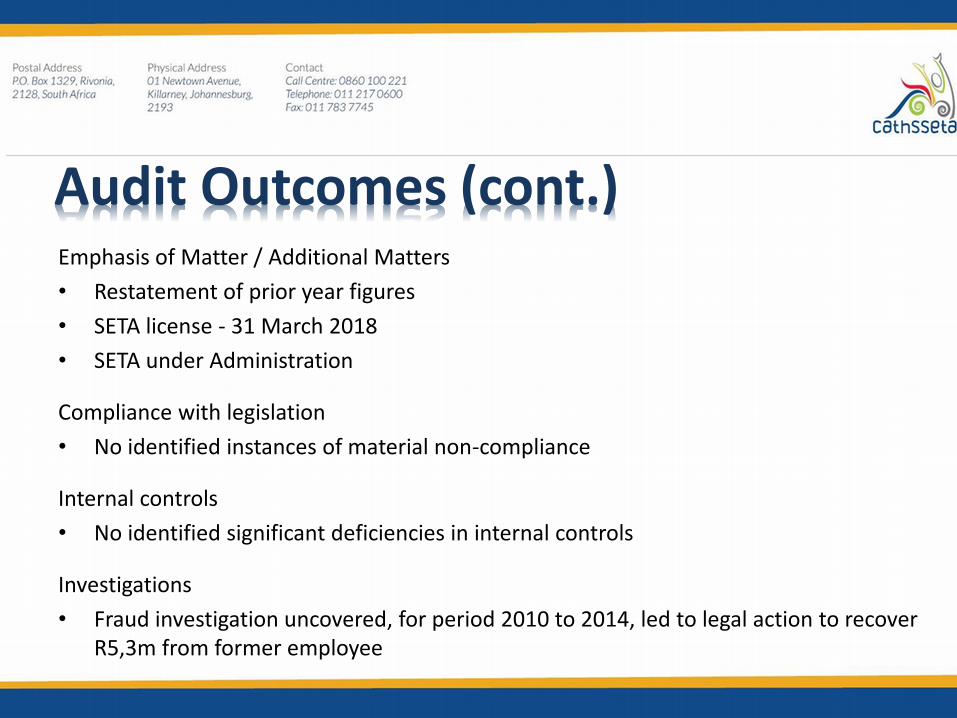
Emphasis of Matter / Additional Matters
• Restatement of prior year figures
• SETA license - 31 March 2018
• SETA under Administration
Compliance with legislation
• No identified instances of material non-compliance
Internal controls
• No identified significant deficiencies in internal controls
Investigations
• Fraud investigation uncovered, for period 2010 to 2014, led to legal action to recover R5,3m from former employee
Audit Outcomes (cont.)

2016/17 2017/18
R’000 R’000
Revenue 310 590 319 908
* Non Exchange Revenue 303 175 312 271
* Exchange Revenue 7 415 7 637
Expenditure by programmes 310 590 319 908
* Administration 39 792 40 986
* Planning (Incl. mandatory grants related expenditure) 65 259 65 105
* Learning Programmes (Incl. discretionary grants related expenditure) 205 539 213 817
Net Surplus - -
Budgets – FY2016/17 & 2017/18
Thank You