Embed Size (px)
Citation preview

2015.09
2014 Toys
.

2014 Toys Industry Analysis Report
Catalog1. 2014 China Toys Export Analysis ..............................................................................................3
1.1. China Toys Main Exported Products from Jan. to Dec. 2014 .............................................................4
1.2. China Toys Export Analysis from Jan. to Dec. 2014 ..........................................................................5
1.2.1. China Toys Export Volume and Value from Jan. to Dec. 2014 .....................................................................5
1.2.2. China Toys Major Export Countries/Regions from Jan. to Dec. 2014 ...........................................................6
1.2.3. Regions of Origin for Exported Chinese Toys, from Jan. to Dec. 2014 .........................................................8
2. 2014 Global Toys Import and Export Analysis........................................................................10
2.1. Global Toys Main Import Markets from Jan. to Dec.2014 ................................................................10
2.2. Global Toys Main Export Markets from Jan. to Dec.2014 ................................................................11
3. 2014 United States Toys Import Analysis................................................................................12
4. 2014 Japan Toys Import Analysis ............................................................................................13
5. 2014 Republic of Korea Toys Imports Analysis ......................................................................14
6. 2014 Toys Industry Data Analysis of Made-in-China.com ....................................................15
6.1. Analysis of Buyers’ Interest on Toys at Made-in-China.com, from Jan. to Dec. 2014 ......................15
6.2. Hot Keywords Used by Toy Buyers at Made-in-China.com, from Feb. to Apr. 2015 .......................16
6.3. Buyers Distribution of Toys at Made-in-China.com, from Jan. to Dec. 2014 ...................................17

32015_09
2014 Toys Industry Analysis Report
1. 2014 China Toys Export AnalysisHS Code Product Name Short Name
9503Tricycles, scooters, pedal cars and similar wheeled toys; dais carriages5 dolls;
Other toys; reduced size (“scale”) models and similar recreational models working or not
Toys

42015_09
2014 Toys Industry Analysis Report
1.1. China Toys Main Exported Products from Jan. to Dec. 2014
Product Name Unit Volume Value
Compared with the Same Period of Last Year
Volume Value
95030089Other Toys
Piece 24,606,187,162 5,007,950,720 8% 9.2%
95030021Toy Representing Animals
Piece 1,730,787,798 2,018,431,587 9.9% 16.1%
95030081Put up in sets or outfits
Piece 1,668,792,486 1,715,440,336 9.7% 32.1%
95030082Other Toys and Models,Incorporating a Motor
Piece 386,240,846 1,580,004,341 26.6% 17.6%
95030010Tricycles, Scooters, Pedal Cars and Similar Wheeled
Toys; Doll’s Carriage
Kg 290,040,337 1,218,254,596 10% 14.5%
95030060Puzzles
Piece 619,040,572 1,180,742,695 23% 15.3%
95030029Dolls
Piece 705,399,503 762,037,476 -5.4% 13%
95030090Toys Parts and Accessories
Kg 26,272,111 315,451,845 6.5% 5.1%
95030039Other toy cars, reduced-size
model assembly kits Piece 54,560,146 188,383,827 -10.7% -9.6%
95030050Toy Musical Instruments
and ApparatusKg 15,624,714 90,792,714 -2.1% -5.7%
95030031Electric Trains, Reduced-Size Model Assembly Kits
Kg 2,710,328 40,723,149 16.1% 25%
95030040Other construction sets/toys, reduced-size model
assembly kits
Piece 1,287,687 17,435,114 -44.6% 19.9%

52015_09
2014 Toys Industry Analysis Report
1.2. China Toys Export Analysis from Jan. to Dec. 2014 1.2.1. China Toys Export Volume and Value from Jan. to Dec. 2014
Month Volume ( - ) Value (USD)Compared with the Same Period of Last
YearVolume Value
Jan. 5,056,474,590 1,010,457,620 69.4% 19.9%Feb. 1,210,817,647 510,740,813 -35.5% -10.8%Mar. 2,021,011,165 762,875,050 44.8% 19.2%Apr. 2,187,149,574 967,998,987 18.8% 24%May 1,979,738,589 973,253,827 3% 12.7%Jun. 2,062,477,354 1,073,282,869 9.3% 12.8%Jul. 2,355,218,142 1,523,391,355 12.9% 17.5%Aug. 1,888,459,575 1,719,865,817 -21.6% 13.1%Sept. 2,282,450,483 1,696,161,974 5.6% 14.1%Oct. 2,683,273,291 1,661,230,779 40% 6.5%Nov. 2,906,625,662 1,176,312,510 -6.8% 20.1%Dec. 3,473,247,618 1,060,076,799 -17.4% 19.6%
Jan. to Dec. Total 30,106,943,690 14,135,648,400 8.3% 14.2%
China Toy export value has reached 14.14 billion USD, increased by 14.2% compared to the same period of last year.

62015_09
2014 Toys Industry Analysis Report
1.2.2. China Toys Major Export Countries/Regions from Jan. to Dec. 2014
No. Country/Region Volume (-) Value (USD)
Compared with the Same Period of Last Year
Volume Value
1 United States 5,778,049,954 4,816,756,669 -3.6% 11.7%2 Hong Kong 1,261,140,627 871,696,628 3.4% -2.1%3 United Kingdom 725,110,770 850,766,978 6.2% 17.1%4 Philippines 1,312,226,250 629,025,229 33.9% 38.9%5 Japan 641,174,399 586,663,237 -7.4% 5.1%6 Germany 561,303,463 539,941,923 -5.1% 13.2%7 Singapore 873,000,034 511,116,334 78.2% 55.9%
8Russian
Federation576,208,199 342,540,306 50.9% 9%
9 Netherlands 657,844,211 334,202,457 38.2% 36.7%10 Republic of Korea 365,677,528 321,417,966 64.8% 58.4%11 Canada 339,965,715 311,283,100 16.8% 8.8%12 Mexico 660,902,342 302,723,496 6.3% 6.5%13 Australia 544,011,158 295,347,872 25.7% 4%14 France 249,879,925 274,364,555 -13.1% -3.5%15 Spain 324,870,402 223,740,099 26.7% 26.8%16 Belgium 302,507,181 215,569,769 17% 12.5% 17 Italy 421,257,179 206,925,865 17.3% 12.7%
18United Arab
Emirates398,454,885 205,725,474 31.1% 40.5%
19 Brazil 238,852,874 186,028,878 0 9.6%20 Chile 913,731,516 181,410,601 40.2% 22.2%

72015_09
2014 Toys Industry Analysis Report
United States, 34.08%
Hong Kong, 6.17%
United Kingdom, 6.02%
Philippines, 4.45%Japan, 4.15%
Germany, 3.82%
Singapore, 3.62%
Russian Federation,
2.42%
Netherlands, 2.36%
Republic of Korea, 2.27%
Others, 30.64%
The export data from Jan. to Dec.2014 shows that China Toys main export markets are the United States, Hong Kong, United Kingdom, Philippines, Japan, Germany, Singapore, Russian Federation, Netherlands and South Korea.
The United States, Hong Kong and United Kingdom are the top three export markets of China Toy industry, separately accounting for 34.08%, 6.17% and 6.02% of the total export value.
Among the top 20 export markets from Jan. to Dec. 2014, the import value of South Korea enjoyed the highest growth rate, increasing 58.4% compared to the same period of 2013.
82015_09
2014 Toys Industry Analysis Report
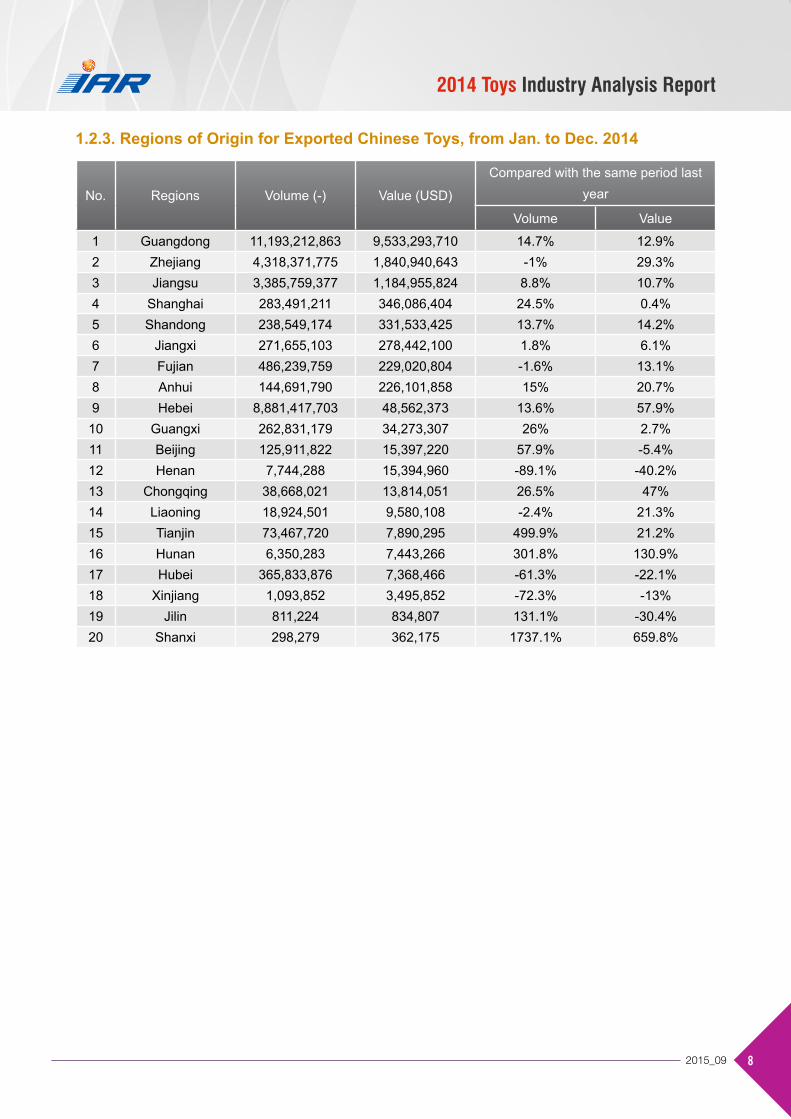
1.2.3. Regions of Origin for Exported Chinese Toys, from Jan. to Dec. 2014
No. Regions Volume (-) Value (USD)
Compared with the same period last year
Volume Value
1 Guangdong 11,193,212,863 9,533,293,710 14.7% 12.9%2 Zhejiang 4,318,371,775 1,840,940,643 -1% 29.3%3 Jiangsu 3,385,759,377 1,184,955,824 8.8% 10.7%4 Shanghai 283,491,211 346,086,404 24.5% 0.4%5 Shandong 238,549,174 331,533,425 13.7% 14.2%6 Jiangxi 271,655,103 278,442,100 1.8% 6.1%7 Fujian 486,239,759 229,020,804 -1.6% 13.1%8 Anhui 144,691,790 226,101,858 15% 20.7%9 Hebei 8,881,417,703 48,562,373 13.6% 57.9%10 Guangxi 262,831,179 34,273,307 26% 2.7%11 Beijing 125,911,822 15,397,220 57.9% -5.4%12 Henan 7,744,288 15,394,960 -89.1% -40.2%13 Chongqing 38,668,021 13,814,051 26.5% 47%14 Liaoning 18,924,501 9,580,108 -2.4% 21.3%15 Tianjin 73,467,720 7,890,295 499.9% 21.2%16 Hunan 6,350,283 7,443,266 301.8% 130.9%17 Hubei 365,833,876 7,368,466 -61.3% -22.1%18 Xinjiang 1,093,852 3,495,852 -72.3% -13%19 Jilin 811,224 834,807 131.1% -30.4%20 Shanxi 298,279 362,175 1737.1% 659.8%

92015_09
2014 Toys Industry Analysis Report
Guangdong, 67.44%
Zhejiang, 13.02%
Jiangsu, 8.38%
Shanghai, 2.45%
Shandong, 2.35%
Jiangxi, 1.97%
Fujian, 1.62%Anhui, 1.60% Hebei, 0.34%
Guangxi, 0.24%
Others, 0.58%
China Toys Original Places of Exported Goods are Guangdong, Zhejiang and Jiangsu. The total export volume of the above three provinces from Jan. to Dec. 2014 accounted for 62.77% of the total export Volume of China Toys industry, with the export value accounting for 88.85%.
Among the top 20 export markets from Jan. to Dec. 2014, the export value of Shanxi enjoyed the highest growth rate, increasing 659.8% compared to the same period of last year.
Source: China Customs

102015_09
2014 Toys Industry Analysis Report
2. 2014 Global Toys (HS: 9503) Import and Export Analysis
2.1. Global Toys Main Import Markets from Jan. to Dec.2014
No.Import
Country/RegionImport Value (Thousand USD)
Compared with the same period last year
1 United States 28,882,731 3.43%2 Germany 6,494,742 5.46%3 United Kingdom 6,456,031 15.94%4 Japan 6,207,191 -2.75%5 Netherlands 5,360,259 31.83%6 France 5,033,281 6.51%7 Canada 4,278,020 1.20%8 Australia 2,497,665 10.27%9 Italy 2,474,120 5.63%10 Russian Federation 2,346,284 -3.75%11 Spain 2,191,894 11.54%12 Belgium 2,096,735 6.19%13 China 2,077,343 54.34%14 Mexico 2,043,253 5.45%15 Republic of Korea 1,600,317 14.17%16 Austria 1,569,458 10.05%17 Poland 1,502,412 40.66%18 Czech Republic 1,441,445 6.95%19 Sweden 1,204,461 19.21%20 Switzerland 1,091,785 13.48%
From Jan. to Dec. 2014, among the above 20 import markets of Toys, the United States, Germany and United Kingdom are top three, with the import value separately 28.88 billion USD (increasing 3.43% year on year), 6.49 billion USD (increasing 5.46% year on year), and 6.46 billion million USD(increasing 15.94% year on year).
112015_09
2014 Toys Industry Analysis Report
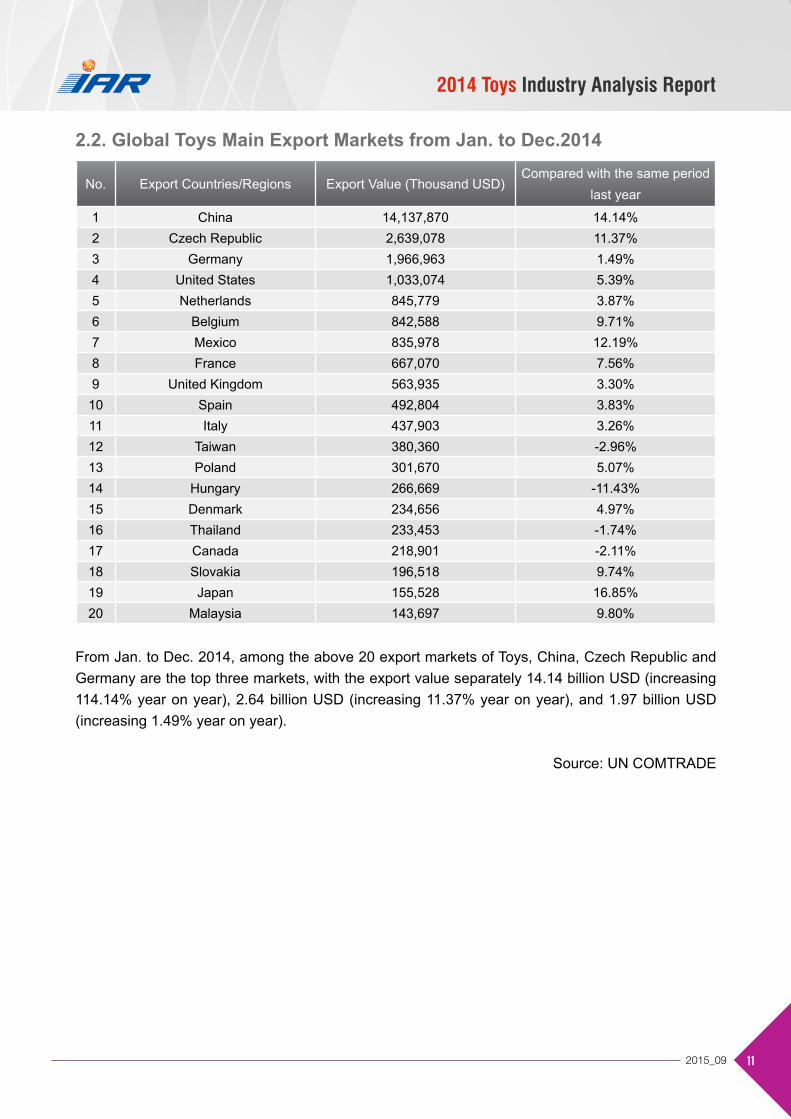
2.2. Global Toys Main Export Markets from Jan. to Dec.2014
No. Export Countries/Regions Export Value (Thousand USD) Compared with the same period
last year
1 China 14,137,870 14.14%2 Czech Republic 2,639,078 11.37%3 Germany 1,966,963 1.49%4 United States 1,033,074 5.39%5 Netherlands 845,779 3.87%6 Belgium 842,588 9.71%7 Mexico 835,978 12.19%8 France 667,070 7.56%9 United Kingdom 563,935 3.30%10 Spain 492,804 3.83%11 Italy 437,903 3.26%12 Taiwan 380,360 -2.96%13 Poland 301,670 5.07%14 Hungary 266,669 -11.43%15 Denmark 234,656 4.97%16 Thailand 233,453 -1.74%17 Canada 218,901 -2.11%18 Slovakia 196,518 9.74%19 Japan 155,528 16.85%20 Malaysia 143,697 9.80%
From Jan. to Dec. 2014, among the above 20 export markets of Toys, China, Czech Republic and Germany are the top three markets, with the export value separately 14.14 billion USD (increasing 114.14% year on year), 2.64 billion USD (increasing 11.37% year on year), and 1.97 billion USD (increasing 1.49% year on year).
Source: UN COMTRADE

122015_09
2014 Toys Industry Analysis Report
3. 2014 United States Toys (HS: 9503) Import Analysis ● United States Toys Main Import Markets from Jan. to Dec. 2014
Country/RegionTotal Import Value for
2014 Jan.-Dec. (Thousand USD)
Year-on-Year Percentage
Total 12,785,903 8.88% 100.00%China 10,888,921 8.52% 85.16%Mexico 661,836 8.38% 5.18%
Indonesia 251,807 4.86% 1.97%Vietnam 200,228 52.95% 1.57%Taiwan 150,167 11.66% 1.17%
Thailand 89,612 -2.78% 0.70%Canada 85,025 13.28% 0.66%
Hong Kong 82,683 25.20% 0.65%Malaysia 56,034 -3.77% 0.44%Germany 52,553 2.10% 0.41%
Among the main import markets of the Untied Stated Toys from Jan. to Dec. 2014, its largest original place of imported goods is China, accounting for 85.16% of the total import value of that particular item. Mexico accounted for 5.18%, ranking the second. China has an obvious advantage.

132015_09
2014 Toys Industry Analysis Report
4. 2014 Japan Toys (HS: 9503) Import Analysis ● Japan Toys Main Import Markets from Jan. to Dec. 2014
Country/RegionTotal Import Value for
2014 Jan.-Dec. (Thousand USD)
Year-on-Year Percentage
Total 2,017,067 2.08% 100.00%China 1,714,110 1.83% 84.98%
Vietnam 83,162 10.62% 4.12%Thailand 44,152 -10.04% 2.19%Denmark 29,136 19.54% 1.44%Taiwan 29,118 -1.05% 1.44%
Philippines 24,566 42.79% 1.22%Germany 13,457 -3.75% 0.67%Mexico 9,639 -34.53% 0.48%
United States 9,395 6.75% 0.47%Republic of Korea 8,877 -15.81% 0.44%
Among the main import markets of Japan Toys from Jan. to Dec. 2014, Japan Toys’ largest original place of imported goods is China, accounting for 84.98% of the total import value of that particular item. Vietnam accounted for 4.12%, ranking the second. China has an obvious advantage.

142015_09
2014 Toys Industry Analysis Report
5. 2014 Republic of Korea Toys (HS: 9503) Imports Analysis ● Republic of Korea Toys Main Import Markets from Jan. to Dec. 2014
Country/RegionTotal Import Value for
2014 Jan.-Dec. (Thousand USD)
Year-on-Year Percentage
Total 658,067 17.13% 100.00%China 438,452 25.85% 66.63%
Denmark 61,043 4.72% 9.28%Japan 26,761 31.65% 4.07%Mexico 26,152 -52.23% 3.97%
United States 22,802 -7.65% 3.46%Thailand 13,848 30.17% 2.10%Vietnam 11,527 43.62% 1.75%
Czech Republic 10,796 410.93% 1.64%Indonesia 10,144 147.17% 1.54%
Taiwan 7,199 26.65% 1.09%
Among the main import markets of Republic of Korea Toys from Jan. to Dec. 2014, Republic of Korea Toys’ largest original place of imported goods is China, accounting for 66.63% of the total import value of that particular item. Denmark accounted for 9.28%, ranking the second.

152015_09
2014 Toys Industry Analysis Report
6. 2014 Toys Industry Data Analysis of Made-in-China.com
6.1. Analysis of Buyers’ Interest on Toys at Made-in-China.com, from Jan. to Dec. 2014
Remote Control Toys
Inf latable Toys
Intellectual & Educational Toys
Plastic Toys
Plush & Stuf fed Toy
Vehicle Toys
Kids Bike
Model & Miniature Toys
Adult Toys
Wooden Toys
Electrical Toys
Baby Toys
Toy Accessories
Pet Toys
Doll & Puppet
Ball
Novelty Toys
Cartoon Character
Musical Toys
Sports & Fitness
From Jan. to Dec. 2014, according to the data collected by Made-in-China.com, buyers paid the most attention to Remote Control Toys Among the sub-sectors of Toys, followed by Inflatable Toys.

162015_09
2014 Toys Industry Analysis Report
6.2. Hot Keywords Used by Toy Buyers at Made-in-China.com, from Feb. to Apr. 2015
Top 20 Hot Keywords Used by Toy Buyers at Made-in-China.com from Feb. to Apr. 2015
Toy(s)
RC Model
RC Car
Ride on Car
Teddy Bear
Children Bicycle
Drone
Rc Helicopter
Helicopter
Rc Airplane
Doll
Plush Toy
Wooden Toy
Electric Toy Car
Kids Bike
Kids Car
Airsof t
RC Toy
Jigsaw Puzzle
Airplane
From Feb. to Apr. 2015, according to the data collected by Made-in-China.com, the most popular search keyword in China Toys industry is Toy/Toys, followed by RC Model.

172015_09
2014 Toys Industry Analysis Report
6.3. Buyers Distribution of Toys at Made-in-China.com, from Jan. to Dec. 2014 (By Continent )
Europe, 27.53%
North America, 20.50%Middle East,
10.22%
South Asia, 9.86%
South America, 9.47%
Others, 22.42%
(By Country)
United States, 13.83%
India, 7.06%
United Kingdom,
5.97%
Australia, 4.92%
Brazil, 3.83%
Nigeria, 2.47%
Canada, 2.38%
Spain, 2.20%Mexico, 2.03%
Malaysia, 1.99%
Others, 53.34%
China Toys Professional Buyers Distribution of Made-in-China.com, from Jan. to Dec. 2014, lied in Europe, North America, Middle East, South Asia and Africa by continent and lied in United Stated, India, United Kingdom and Australia by country.
Source: Made-in-China.Com

182015_09
2014 Toys Industry Analysis Report
The IAR Team of Made-in-China.com dedicates to surveying,excavating
and collating industry information for supplying the service of timely and
exact information analysis, providing necessary information and dates for
clients’decision.
Thanks for reading the report, if you have any questions,opinions or advices,
please contact us.
E-mail: [email protected]
Web: http://www.made-in-china.com/communication/market-analysis.html

192015_09
2014 Toys Industry Analysis Report
● This report is made by Focus Technology Co., Ltd, all the brands and logos are owed by the person of trade mark right,without the paper promise, any organization or individual shouldn’t encroach the legal interest of the right.
● All the written languages, pictures and charts are protected by Chinese intellectual property law. Also there are some written languages and data collected from public information, without the person of the original copyright, any organization or individual can’t use them for other business intention.
● The data of the report is acquired by researcher with the method of market collecting. As the confine of source and area,maybe the report can’t absolutely reflect the market situations. We wouldn’t take on the legal liability of the report’s accuracy.
● This report is only available to be a reference for clients, not use for business purposes; we wouldn’t take on the legal liability of the contents relating to legal questions.