Embed Size (px)
Citation preview

2015 Air Quality
Updating and Screening
Assessment:
Nuneaton and Bedworth
Borough Council
June 2015

Nuneaton and Bedworth Borough Council Updating and Screening Assessment
Air Quality Consultants Ltd 23 Coldharbour Road, Bristol BS6 7JT Tel: 0117 974 1086 12 Airedale Road, London SW12 8SF Tel: 0208 673 4313 [email protected]
Registered Office: 12 St Oswalds Road, Bristol, BS6 7HT Companies House Registration No: 2814570
Document Control
Client Nuneaton and Bedworth Borough Council
Principal Contact Alison Cannon
Report Prepared By: Ricky Gellatly & Dr Clare Beattie
Document Status and Review Schedule
Report No. Date Status Reviewed by
J2266/1/F1 12 June 2015 Final Report Stephen Moorcroft (Director)
This report has been prepared by Air Quality Consultants Ltd on behalf of the Client, taking into account
the agreed scope of works. Unless otherwise agreed, this document and all other Intellectual Property
Rights remain the property of Air Quality Consultants Ltd.
In preparing this report, Air Quality Consultants Ltd has exercised all reasonable skill and care, taking
into account the objectives and the agreed scope of works. Air Quality Consultants Ltd does not accept
any liability in negligence for any matters arising outside of the agreed scope of works. The Company
operates a formal Quality Management System, which is certified to ISO 9001:2008, and a formal
Environmental Management System, certified to ISO 14001:2004. QMF 08.
When issued in electronic format, Air Quality Consultants Ltd does not accept any responsibility for any
unauthorised changes made by others.
When printed by Air Quality Consultants Ltd, this report will be on Evolve Office, 100% Recycled paper.
Job Number J2266
Nuneaton and Bedworth Borough Council Updating and Screening Assessment
J2266 1 of 47 June 2015
Executive Summary
This report fulfils the requirements of the Local Air Quality Management process as set out in Part
IV of the Environment Act (1995), the Air Quality Strategy for England, Scotland, Wales and
Northern Ireland 2007 and the relevant Policy and Technical Guidance documents.
This document is Nuneaton and Bedworth Borough Council’s sixth Updating and Screening
Assessment (USA). Results from monitoring undertaken by the Council are presented and sources
of air pollution are identified. The USA determines those changes since the last assessment which
could lead to the risk of an air quality objective being exceeded.
This Updating and Screening Assessment confirms that, outside of the existing AQMAs, air quality
within Nuneaton and Bedworth continues to meet the relevant air quality objectives. There is no
requirement to proceed to a Detailed Assessment for any pollutant.
The Updating and Screening Assessment has not identified any significant changes in emissions
sources. There have been no new relevant industrial installations and no new significant road,
commercial, domestic or fugitive sources of emissions.

Nuneaton and Bedworth Borough Council Updating and Screening Assessment
J2266 2 of 47 June 2015
Contents
1 Introduction ..................................................................................................................... 4
1.1. Description of Local Authority Area .................................................................................. 4
1.2. Purpose of Report ............................................................................................................ 4
1.3. Air Quality Objectives ....................................................................................................... 4
1.4. Summary of Previous Review and Assessments ............................................................. 6
2 New Monitoring Data ...................................................................................................... 9
2.1. Summary of Monitoring Undertaken................................................................................. 9
2.2. Comparison of Monitoring Results with AQ Objectives.................................................. 16
3 Road Traffic Sources ................................................................................................... 27
4 Other Transport Sources ............................................................................................. 28
5 Industrial Sources ........................................................................................................ 29
6 Commercial and Domestic Sources ........................................................................... 30
7 Fugitive or Uncontrolled Sources............................................................................... 31
8 Conclusions and Proposed Actions .......................................................................... 32
8.1. Conclusions from New Monitoring Data ......................................................................... 32
8.2. Conclusions from Assessment of Sources ..................................................................... 32
8.3. Proposed Actions ........................................................................................................... 32
9 Appendices ................................................................................................................... 33
A1 Appendix A: QA:QC Data ............................................................................................ 34
A2 Appendix 2: Monthly Diffusion Tube Measurements ............................................... 37
A3 Appendix 3: Air Quality Action Plan Review/Progress ............................................ 39
Tables
Table 1.1: Air Quality Objectives included in Regulations for the purpose of LAQM in England ...... 5
Table 2.1: Details of Automatic Monitoring Site .............................................................................. 10
Table 2.2: Details of Non-Automatic Monitoring Sites ..................................................................... 13
Table 2.3: Results of Automatic Monitoring of Nitrogen Dioxide: Comparison with Annual Mean Objective (2012 – 2014) ................................................................................................. 17
Table 2.4: Results of Automatic Monitoring for Nitrogen Dioxide: Comparison with 1-hour mean Objective (2010 – 2014) ................................................................................................. 17
Table 2.5: Results of Nitrogen Dioxide Diffusion Tubes in 2014 ..................................................... 20
Table 2.6: Results of Nitrogen Dioxide Diffusion Tubes (2010 to 2014) ......................................... 22
Table 2.7: Fall-off with Distance Correction of Relevant Sites Exceeding the Nitrogen Dioxide Annual Mean Objective in 2014 ..................................................................................... 24
Nuneaton and Bedworth Borough Council Updating and Screening Assessment
J2266 3 of 47 June 2015
Table A1.1: Bias Adjustment Factor from Local Co-location Study ................................................. 34
Table A2.1: Monthly non-automatic nitrogen dioxide monitoring results - unadjusted raw data (time-weighted average) .......................................................................................................... 37
Figures
Figure 1.1: Map of AQMA Boundaries ................................................................................................ 8
Figure 2.1: Map of Automatic Monitoring Site .................................................................................... 9
Figure 2.2: Map of Non-Automatic Monitoring Sites inside Nuneaton’s AQMAs ............................. 11
Figure 2.3: Map of Non-Automatic Monitoring Sites in Nuneaton, Outside of AQMAs .................... 12
Figure 2.4: Map of Non-Automatic Monitoring Sites in Bedworth..................................................... 12
Figure 2.5: Trend in Annual Mean Nitrogen Dioxide Concentrations at the Leicester Road Automatic Monitoring Site .............................................................................................. 18
Figure 2.6: Trends in Annual Mean Nitrogen Dioxide Concentrations Measured at Diffusion Tube Monitoring Sites .............................................................................................................. 25
Figure A1.1: National Diffusion Tube Bias Adjustment Factor Spreadsheet ................................... 35

Nuneaton and Bedworth Borough Council Updating and Screening Assessment
J2266 4 of 47 June 2015
1 Introduction
1.1. Description of Local Authority Area
Nuneaton and Bedworth is the smallest in geographical area (7,898 hectares) of the five
districts in Warwickshire, but has the second highest population. The Borough is urban in
character containing 3 main settlements: Nuneaton, Bedworth and Bulkington which are
separated by narrow areas of countryside. The Borough has a high density of residential
properties. This has both advantages and disadvantages; access to services and public
transport is very good, but there are social and environmental problems associated with the
high population density. The population of the Borough is predicted to grow by 18.8% between
2010 and 2035.
The main source of air pollution in the Borough is traffic emissions from major roads, notably
the A444, A47, A5 and M6. An Air Quality Management Area (AQMA) was declared in March
2007 along the A47 Leicester Road in Nuneaton town centre where exceedences of the
annual mean objective for nitrogen dioxide (NO2) were predicted. A second AQMA was
declared for nitrogen dioxide in October 2009, encompassing an area of Nuneaton from
Midland Road to Corporation Street. Other pollution sources, including commercial, industrial
and domestic sources, also make a contribution to background pollution concentrations.
1.2. Purpose of Report
This report fulfils the requirements of the Local Air Quality Management process as set out in
Part IV of the Environment Act (1995), the Air Quality Strategy for England, Scotland, Wales
and Northern Ireland 2007 and the relevant Policy and Technical Guidance documents. The
LAQM process places an obligation on all local authorities to regularly review and assess air
quality in their areas, and to determine whether or not the air quality objectives are likely to be
achieved. Where exceedences are considered likely, the local authority must then declare an
Air Quality Management Area (AQMA) and prepare an Air Quality Action Plan (AQAP) setting
out the measures it intends to put in place in pursuit of the objectives.
The objective of this Updating and Screening Assessment is to identify any matters that have
changed which may lead to risk of an air quality objective being exceeded. A checklist
approach and screening tools are used to identify significant new sources or changes and
whether there is a need for a Detailed Assessment. The USA report should provide an update
of any outstanding information requested previously in Review and Assessment reports.
1.3. Air Quality Objectives
The air quality objectives applicable to LAQM in England are set out in the Air Quality
(England) Regulations 2000 (SI 928), The Air Quality (England) (Amendment) Regulations
2002 (SI 3043), and are shown in Table 1.1. This table shows the objectives in units of

Nuneaton and Bedworth Borough Council Updating and Screening Assessment
J2266 5 of 47 June 2015
micrograms per cubic metre g/m3 (milligrams per cubic metre, mg/m
3 for carbon monoxide)
with the number of exceedences in each year that are permitted (where applicable).
Table 1.1: Air Quality Objectives included in Regulations for the purpose of LAQM in England
Pollutant
Air Quality Objective Date to be achieved
by Concentration Measured as
Benzene 16.25 µg/m
3 Running annual mean 31.12.2003
5.00 µg/m3 Running annual mean 31.12.2010
1,3-Butadiene 2.25 µg/m3 Running annual mean 31.12.2003
Carbon
monoxide 10.0 mg/m
3 Running 8-hour mean 31.12.2003
Lead 0.5 µg/m
3 Annual mean 31.12.2004
0.25 µg/m3 Annual mean 31.12.2008
Nitrogen
dioxide
200 µg/m3 not to be
exceeded more than 18
times a year
1-hour mean 31.12.2005
40 µg/m3 Annual mean 31.12.2005
Particles
(PM10)
(gravimetric)
50 µg/m3, not to be
exceeded more than 35
times a year
24-hour mean 31.12.2004
40 µg/m3 Annual mean 31.12.2004
Sulphur
dioxide
350 µg/m3, not to be
exceeded more than 24
times a year
1-hour mean 31.12.2004
125 µg/m3, not to be
exceeded more than 3
times a year
24-hour mean 31.12.2004
266 µg/m3, not to be
exceeded more than 35
times a year
15-minute mean 31.12.2005

Nuneaton and Bedworth Borough Council Updating and Screening Assessment
J2266 6 of 47 June 2015
1.4. Summary of Previous Review and Assessments
The conclusions of the First Round of LAQM Review and Assessment, commencing in 1998,
were that all AQS objectives were expected to be met and that no AQMAs were required.
Following the outcome of the Second Round Updating and Screening Assessment (USA) in
2003, the Council undertook a Detailed Assessment in 2004, which concluded that there was
a potential risk of exceedence of the annual mean nitrogen dioxide objective at receptors
adjacent to the Leicester Road Gyratory, based on the limited monitoring data available at that
time. Further monitoring and modelling was undertaken to confirm the findings of the Detailed
Assessment and the results indicated that there remained a risk of exceedences of the annual
mean NO2 objective at sensitive receptors adjacent to the Leicester Road Gyratory. The area
was declared as an AQMA in March 2007 and a continuous monitoring station was installed. A
Further Assessment was completed in January 2008.
Nuneaton & Bedworth Borough Council completed the Third Round USA in June 2006, and
concluded that a Detailed Assessment was not required for any pollutant. However,
subsequent annual Progress Reports indicated, through local monitoring data, that
exceedences of the annual mean nitrogen dioxide objective had occurred along Central
Avenue in Nuneaton, and a Detailed Assessment was undertaken in 2008. This concluded
that there was a potential risk of exceedences of the annual mean objective for nitrogen
dioxide and recommended the declaration of a second AQMA. An AQMA covering the
Corporation Street to Midland Road area was declared in October 2009. A Further
Assessment was completed in 2010.
The 2008 Progress Report indicated that a number of roadside/kerbside monitoring sites may
be at risk of exceeding the annual mean objective outside the areas previously assessed. It
was therefore recommended that façade-based monitoring be installed at these locations to
demonstrate compliance with the objective.
The findings of the Fourth Round USA in 2009 indicated that the objectives were likely to be
achieved for all pollutants outside of the existing AQMAs. A Detailed Assessment of PM10 was
recommended to assess the impact of the following waste transfer facilities: ABS Skips,
Midland Road, Nuneaton; Crown Waste, Pool Road, Nuneaton; and Budget Skips and
Hammonds Skips on adjoining premises, Colliery Lane, Exhall. A further recommendation
made was to commence additional diffusion tube monitoring at Black Bank (at the junction of
Colliery Lane and Coventry Road, and the West Coast Main Line).
A further review of the fugitive emissions from waste transfer sites in the Borough was
undertaken by the Council following the recommendation that a Detailed Assessment be
undertaken. The proposal to undertake a Detailed Assessment was due to the proximity of
receptors to the sites and a history of complaints. An investigation into the complaints received
regarding air quality issues from the installations was undertaken by the council. This found
that complaints received were in relation to ABS Skips only and these were relating to odour

Nuneaton and Bedworth Borough Council Updating and Screening Assessment
J2266 7 of 47 June 2015
issues and the storage of household waste. Following the 2009 USA ABS Skips relocated part
of its operation to an industrial location. There have been no further complaints from any of the
noted sites. A Detailed Assessment was thus deemed unnecessary for the waste transfer
sites.
In the 2010 Progress Report, no exceedences of the objectives were recorded at relevant
receptors outside of the AQMAs. As the recorded nitrogen dioxide level at the 78 Bayton Road
diffusion tube monitoring site was close to the annual mean objective, it was recommended
that triplicate monitoring be undertaken to increase robustness of results.
The 2011 Progress Report identified one location outside of the existing AQMAs where the
annual mean air quality objective for nitrogen dioxide was being exceeded, that being NB13
Watling Street. This site is situated at kerbside so it is not representative of relevant exposure.
Other tubes in the area confirmed that objectives were being met at relevant receptors within
the area. The potential for a further nitrogen dioxide exceedence was identified at NB36 78
Bayton Road but data capture was limited at this site. It was thus recommended to continue
monitoring in 2011 and to review the data to determine if a Detailed Assessment was required.
The report also identified possible issues with the data at the continuous monitoring location
due to a large increase from previous years’ concentrations.
2011 also saw the publication of Nuneaton and Bedworth’s current Air Quality Action Plan,
which sets out the measures by which the Council aims to achieve compliance with the air
quality objectives.
The 2012 Updating and Screening Assessment found there to be no exceedences of the
annual mean nitrogen dioxide air quality objective outside of the existing AQMAs, with many
sites showing a reduction in concentrations.
Although the annual mean nitrogen dioxide concentrations increased at the majority of
diffusion tube monitoring sites in 2012, concentrations outside of the AQMAs were all below
the objectives at relevant locations, as confirmed by the 2013 Progress Report.
The 2014 Progress Report showed generally lower concentrations in 2013 than were
measured in 2012, with only two locations seeing an exceedence of the annual mean nitrogen
dioxide air quality objective, both of which are within the existing AQMAs.

Nuneaton and Bedworth Borough Council Updating and Screening Assessment
J2266 8 of 47 June 2015
Figure 1.1: Map of AQMA Boundaries

Nuneaton and Bedworth Borough Council Updating and Screening Assessment
J2266 9 of 47 June 2015
2 New Monitoring Data
2.1. Summary of Monitoring Undertaken
2.1.1. Automatic Monitoring Sites
Nuneaton & Bedworth Borough Council operated one continuous air quality monitoring station
within the Borough in 2014. This site was installed in 2007 at the Leicester Road Gyratory, to
more accurately assess nitrogen dioxide concentrations in the AQMA. Nitrogen dioxide
concentrations are measured using a chemiluminescent analyser. The monitoring station
location is shown in Figure 2.1 and details of the station location are provided in Table 2.1.
Details of the QA/QC procedure for the site are provided in Appendix A1.
Figure 2.1: Map of Automatic Monitoring Site

Nuneaton and Bedworth Borough Council Updating and Screening Assessment
J2266 10 of 47
Table 2.1: Details of Automatic Monitoring Site
Site Name Site Type X OS
Grid Ref Y OS
Grid Ref
Inlet Height
(m) Pollutants Monitored
In AQMA?
Monitoring Technique
Relevant
Exposure? (distance
(m) to relevant
exposure)
Distance to kerb of nearest
road
Does this location represent worst-case exposure?
AQM2 Leicester
Road (AQMA)
Roadside 436850 292260 1.88 NO2 Yes Chemiluminescent
Analyser Y (5 m) 4 m No

Nuneaton and Bedworth Borough Council Updating and Screening Assessment
J2266 11 of 47 June 2015
2.1.2. Non-Automatic Monitoring Sites
In 2014, the Council measured nitrogen dioxide concentrations at 37 non-automatic
monitoring sites, using passive diffusion tubes. This includes a set of triplicate tubes co-
located with the continuous monitoring analyser at the Leicester Road Gyratory. The locations
of the monitoring sites are shown in Figures 2.2 to 2.4, with the results of the monitoring
shown in Table 2.2.
Figure 2.2: Map of Non-Automatic Monitoring Sites inside Nuneaton’s AQMAs

Nuneaton and Bedworth Borough Council Updating and Screening Assessment
J2266 12 of 47 June 2015
Figure 2.3: Map of Non-Automatic Monitoring Sites in Nuneaton, Outside of AQMAs
Figure 2.4: Map of Non-Automatic Monitoring Sites in Bedworth

Nuneaton and Bedworth Borough Council Updating and Screening Assessment
J2266 13 of 47
Table 2.2: Details of Non-Automatic Monitoring Sites
Site ID Site Name Site Type
X OS Grid Ref
Y OS Grid Ref
Monitoring Height (m)
Pollutants Monitored
In AQMA?
Co-located with a
Continuous Analyser?
(Y/N)
Relevant
Exposure? (distance (m)
to relevant exposure)
Distance to kerb of nearest
road
Does this location
represent Worst-case
exposure?
NB1 Norman Avenue,
Nuneaton Urban
Background 435969 291303 2.08 NO2 No No Yes (3 m) N/A No
NB2 Conifer Close,
Bedworth Urban
Background 436438 287627 2.30 NO2 No No Yes (7.8 m) N/A No
NB4 Coventry Road Roadside 435792 286540 3.12 NO2 No No Yes (0 m) 4.1 m No
NB5 Mc Donnell Drive Kerbside 434857 284737 2.28 NO2 No No Yes (0 m) 100 m No
NB6 Tudor Court Kerbside 434326 285323 2.88 NO2 No No Yes (0 m) 63.5 m No
NB7 Newdegate Road Kerbside 435338 286991 2.53 NO2 No No Yes (8.1 m) <1 m Yes
NB9 Manor Court Road Kerbside 435634 292279 2.6 NO2 Yes No Yes (4.9 m) <1 m Yes
NB10 17 Old Hinckley
Road Kerbside 436600 292206 1.85 NO2 Yes No Yes (6.5 m) <1 m Yes
NB11 34 Old Hinckley
Road Roadside 436680 292259 2.45 NO2 Yes No Yes (6 m) 4 m No
NB12 64 Old Hinckley
Road Roadside 436830 292308 2.55 NO2 Yes No Yes (4.1 m) 4.5 m No
NB13 64 Watling Street Kerbside 439256 293482 2.11 NO2 No No Yes (14.3 m) <1 m Yes
NB14 46 Leicester Road Roadside 436842 292274 1.58 NO2 Yes No Yes (3.1 m) 1.5 m No
NB15 Bridge Grove-Leicester Road
Kerbside 436878 292300 2.58 NO2 Yes No No <1 m Yes
NB17 Bond Gate Roadside 436393 291989 2.20 NO2 No No No 1.3 m Yes
NB18 Wheat Street Kerbside 436525 291862 2.30 NO2 No No No <1 m Yes

Nuneaton and Bedworth Borough Council Updating and Screening Assessment
J2266 14 of 47
Site ID Site Name Site Type
X OS Grid Ref
Y OS Grid Ref
Monitoring Height (m)
Pollutants Monitored
In AQMA?
Co-located with a
Continuous Analyser?
(Y/N)
Relevant
Exposure? (distance (m)
to relevant exposure)
Distance to kerb of nearest
road
Does this location
represent Worst-case
exposure?
AQM2 AQM2 Leicester Road (Triplicate)
Roadside 436844 292251 1.88 NO2 Yes Yes Yes (5 m) 4 m No
NB20 17 Old Hinckley Rd Roadside 436604 292201 2.55 NO2 Yes No Yes (0 m) 7.1 m No
NB21 36 Old Hinckley Rd Roadside 436690 292271 1.73 NO2 Yes No Yes (0 m) 9.6 m No
NB22 62 Old Hinckley
Road Roadside 436813 292308 2.55 NO2 Yes No Yes (0 m) 8.7 m No
NB23 46 Leicester Road Roadside 436837 292274 2.65 NO2 Yes No Yes (0 m) 4.6 m No
NB24 31 Leicester Road Roadside 436814 292194 1.77 NO2 Yes No Yes (0 m) 9 m No
NB25 25 Central Avenue Roadside 435817 292273 1.75 NO2 Yes No Yes (0 m) 6.8 m No
NB26 26 Central Avenue Roadside 435758 292312 1.75 NO2 Yes No Yes (0 m) 3.8 m No
NB27 90 Corporation
Street Roadside 435949 292113 2.3 NO2 Yes No Yes (0 m) 4.7 m No
NB28 138 Corporation
Street Roadside 435894 292202 1.55 NO2 Yes No Yes (0 m) 4.7 m No
NB29 16 Midland Road Roadside 435626 292343 1.75 NO2 Yes No Yes (0 m) 4.4 m No
NB30 50 Midland Road Roadside 435559 292375 2.01 NO2 Yes No Yes (0 m) 4.1 m No
NB31 376 Longford Road Roadside 435149 284563 2.08 NO2 No No Yes (0 m) 12.7 m No
NB34 9 Bull Ring, 4
College St Roadside 435851 290826 1.68 NO2 No No Yes (0 m) 11.5 m No
NB35 62 Watling Street Roadside 439262 293461 1.83 NO2 No No Yes (0 m) 13 m No
NB36 78 Bayton Road Roadside 435216 285245 2.56 NO2 No No Yes (0 m) 2.5 m No
NB37 Jewsons (19 Croft
Road) Roadside 435050 291594 1.75 NO2 No No Yes (0 m) 4.2 m No

Nuneaton and Bedworth Borough Council Updating and Screening Assessment
J2266 15 of 47
Site ID Site Name Site Type
X OS Grid Ref
Y OS Grid Ref
Monitoring Height (m)
Pollutants Monitored
In AQMA?
Co-located with a
Continuous Analyser?
(Y/N)
Relevant
Exposure? (distance (m)
to relevant exposure)
Distance to kerb of nearest
road
Does this location
represent Worst-case
exposure?
NB38 115 Lutterworth
Road Roadside 437198 290731 1.66 NO2 No No Yes (0 m) 21 m No
NB39 171 Lutterworth
Road Roadside 438352 289910 1.53 NO2 No No Yes (0 m) 19.5 m No
NB40 25 Black Bank Roadside 435563 286248 1.73 NO2 No No Yes (0 m) 6 m No
NB41 61 Mill Street Roadside 435655 287050 2.00 NO2 No No Yes (0 m) 9.6 m Yes
NB42 18 George Street Roadside 435657 287135 1.80 NO2 No No Yes (0 m) 8.3 m Yes

Nuneaton and Bedworth Borough Council Updating and Screening Assessment
J2266 16 of 47 June 2015
2.2. Comparison of Monitoring Results with AQ Objectives
2.2.1. Nitrogen Dioxide
There are two AQS Objectives for nitrogen dioxide, namely:
• the annual mean of 40µg/m3; and
• the 1-hour mean of 200µg/m3, not to be exceeded more than 18 times a year.
Automatic Monitoring Data
The Council monitored nitrogen dioxide at one automatic monitoring location during 2014. The
site is managed, and the data collected and ratified by We Care 4 Air (or Supporting U, prior to
November 2014). The monitoring data are shown in Tables 2.3 and 2.4. Data are not available
for 2010 and 2011 due to an instrument fault.
Results for 2014 indicate that both the annual mean objective and the 1-hour objective for
nitrogen dioxide were met at the continuous monitoring location.
Figure 2.5 shows the trend in annual mean nitrogen dioxide concentrations between 2012 and
2014. There is no obvious, consistent trend, either upwards or downwards.

Nuneaton and Bedworth Borough Council Updating and Screening Assessment
J2266 17 of 47
Table 2.3: Results of Automatic Monitoring of Nitrogen Dioxide: Comparison with Annual Mean Objective (2012 – 2014)
Site ID Site Type Within AQMA? Valid Data Capture
2014 %
Annual Mean Concentration g/m3
2012 2013 2014
AQM2 Roadside Yes 98.9 39.6 33.5 37.7
Objective 40
Table 2.4: Results of Automatic Monitoring for Nitrogen Dioxide: Comparison with 1-hour mean Objective (2010 – 2014)
Site ID Site Type Within AQMA? Valid Data Capture
2014 (%)
Number of Exceedences of Hourly Mean (200 g/m3)
2012 a 2013 2014
AQM2 Roadside Yes 98.9 0 (121.7) 0 0
Objective 18 a If the period of valid data was less than 90%, the 99.8
th percentile of hourly means is shown in brackets

Nuneaton and Bedworth Borough Council Updating and Screening Assessment
J2266 18 of 47
Figure 2.5: Trend in Annual Mean Nitrogen Dioxide Concentrations at the Leicester Road Automatic Monitoring Site
20
25
30
35
40
45
50
2012 2013 2014
An
nu
al M
ean
Nit
roge
n D
ioxi
de
Co
nce
ntr
atio
n (
µg/
m³)
Year
Trend in Annual Mean Nitrogen Dioxide Concentrations (µg/m³)

Nuneaton and Bedworth Borough Council Updating and Screening Assessment
J2266 19 of 47
Diffusion Tube Monitoring Data
The nitrogen dioxide diffusion tube data from 2014 are summarised in Table 2.5. The full
dataset (including monthly mean values) is included in Appendix A2. Results over the past
five years are presented in Table 2.6, while trends over the past five years are presented in
Figure 2.6.
Data capture for 2014 was good, with none of the sites requiring annualisation.
For the 2014 dataset, using the National Bias Adjustment Factor, there were three sites where
the annual mean Air Quality Objective was exceeded, all of which are located within the
existing AQMA. The national factor is used in preference to the local factor as it is derived
from a larger dataset, thus providing a more robust calculation with less uncertainty.
NB29 and NB30 are located at the façade of relevant receptors. NB11 (34 Old Hinckley
Road), however, is not. The annual mean concentration has therefore been “distance
corrected” to estimate concentrations at the façade, with the result presented in Table 2.7.
When the distance correction is applied the annual mean concentration is slightly below the
objective, indicating no exceedence at the relevant receptor. The background concentration
from site NB1 was used in the calculation.
All three of the sites have measured exceedences in previous years. The measured
concentration at NB11 was slightly lower in 2014 than in 2013, but the measured
concentrations at NB29 and NB30 were both higher in 2014 than they were in 2013.
There are no sites where the annual mean is greater than 60 µg/m3, thus it is unlikely that the
hourly mean objective will be exceeded at any of the monitoring sites.
Sites NB41 and NB42 were installed in 2012 to monitor the impacts of the new Tesco
development (through increased traffic flows in the area). Results over the past three years
have shown annual mean nitrogen dioxide concentrations to be consistently below the
objective.
If the Local Bias Adjustment Factor was used, the number of sites showing an exceedence of
the annual mean objective would have increased to twelve, with four of these being located
outside of the existing AQMAs.

Nuneaton and Bedworth Borough Council Updating and Screening Assessment
J2266 20 of 47
Table 2.5: Results of Nitrogen Dioxide Diffusion Tubes in 2014
Site ID Site Type Within
AQMA? Triplicate or Co-located
Tube?
Data capture
2014 (months)
Confirm if data has been distance
corrected (Y/N)
2014 Annual mean
concentration (g/m3)
(Local Bias Adjustment factor =
1.11)
2014 Annual mean
concentration (g/m3)
(National Bias Adjustment factor =
0.91)
NB1 Urban Background No No 12 months No 24.3 19.9
NB2 Urban Background No No 11 months No 24.1 19.7
NB4 Roadside No No 11 months No 39.7 32.4
NB5 Kerbside No No 11 months No 38.1 31.2
NB6 Kerbside No No 12 months No 41.3 33.7
NB7 Kerbside No No 12 months No 42.1 34.4
NB9 Kerbside Yes No 12 months No 37.9 31.0
NB10 Kerbside Yes No 12 months No 36.7 30.0
NB11 Roadside Yes No 12 months No 51.8 42.4
NB12 Roadside Yes No 12 months No 43.1 35.3
NB13 Kerbside No No 12 months No 45.7 37.4
NB14 Roadside Yes No 12 months No 45.8 37.5
NB15 Kerbside Yes No 12 months No 34.9 28.6
NB17 Roadside No No 12 months No 40.1 32.8
NB18 Kerbside No No 12 months No 37.8 30.9
AQM2 Roadside Yes Triplicate and Co-located 12 months No 38.2 a 31.2
a
NB20 Roadside Yes No 12 months No 33.8 27.6
NB21 Roadside Yes No 11 months No 37.4 30.6
NB22 Roadside Yes No 12 months No 30.9 25.2
NB23 Roadside Yes No 11 months No 40.6 33.2
NB24 Roadside Yes No 11 months No 27.8 22.8

Nuneaton and Bedworth Borough Council Updating and Screening Assessment
J2266 21 of 47
Site ID Site Type Within
AQMA? Triplicate or Co-located
Tube?
Data capture
2014 (months)
Confirm if data has been distance
corrected (Y/N)
2014 Annual mean
concentration (g/m3)
(Local Bias Adjustment factor =
1.11)
2014 Annual mean
concentration (g/m3)
(National Bias Adjustment factor =
0.91)
NB25 Roadside Yes No 12 months No 38.0 31.1
NB26 Roadside Yes No 11 months No 35.1 28.7
NB27 Roadside Yes No 12 months No 45.5 37.2
NB28 Roadside Yes No 12 months No 44.6 36.5
NB29 Roadside Yes No 11 months No 50.8 41.6
NB30 Roadside Yes No 12 months No 50.0 40.9
NB31 Roadside No No 12 months No 41.8 34.2
NB34 Roadside No No 12 months No 35.2 28.8
NB35 Roadside No No 12 months No 30.3 24.8
NB36 Roadside No No 12 months No 42.8 35.0
NB37 Roadside No No 12 months No 38.6 31.6
NB38 Roadside No No 12 months No 34.9 28.6
NB39 Roadside No No 12 months No 23.0 18.8
NB40 Roadside No No 10 months No 34.0 27.8
NB41 Roadside No No 12 months No 38.4 31.4
NB42 Roadside No No 11 months No 37.2 30.4
Objective 40 a This is the average of the three diffusion tubes installed at this location.

Nuneaton and Bedworth Borough Council Updating and Screening Assessment
J2266 22 of 47
Table 2.6: Results of Nitrogen Dioxide Diffusion Tubes (2010 to 2014)
Site ID Site Type Within
AQMA?
Annual Mean Concentration (adjusted for bias) g/m3
2010
(Bias Adjustment
Factor = 0.92)
2011
(Bias Adjustment
Factor = 0.89)
2012
(Bias Adjustment
Factor = 0.97)
2013
(Bias Adjustment
Factor = 0.92)
2014
(Bias Adjustment
Factor = 0.91)
NB1 Urban Background No 21.0 21.0 22.7 21 19.9
NB2 Urban Background No 22.9 21.8 24.3 20.5 19.7
NB4 Roadside No 36.1 35.1 34.7 35.5 32.4
NB5 Kerbside No 33.8 31.0 34.0 33.2 31.2
NB6 Kerbside No 34.6 34.7 36.2 34.0 33.7
NB7 Kerbside No 35.7 33.0 36.2 33.5 34.4
NB9 Kerbside Yes 33.7 31.1 31.5 30.6 31.0
NB10 Kerbside Yes 36.3 31.5 33.3 33.8 30.0
NB11 Roadside Yes 41.0 43.4 46.6 43.1 42.4
NB12 Roadside Yes 39.4 35.4 36.0 35.8 35.3
NB13 Kerbside No 42.8 36.3 38.4 37.0 37.4
NB14 Roadside Yes 40.3 41.1 39.8 35.0 37.5
NB15 Kerbside Yes 31.5 30.7 33.2 31.5 28.6
NB17 Roadside No 38.0 36.1 39.1 35.9 32.8
NB18 Kerbside No 38.9 37.9 38.9 34.3 30.9
AQM2 Roadside Yes 37.0 a 35.1
a 36.2
a 33.6
a 31.2
a
NB20 Roadside Yes 30.6 29.8 29.8 29.6 27.6
NB21 Roadside Yes 33.1 32.9 32.3 29.6 30.6
NB22 Roadside Yes 28.3 28.4 28.9 24.8 25.2
NB23 Roadside Yes 36.8 35.2 35.7 31.4 33.2
NB24 Roadside Yes 30.4 26.7 28.9 31.4 22.8

Nuneaton and Bedworth Borough Council Updating and Screening Assessment
J2266 23 of 47
Site ID Site Type Within
AQMA?
Annual Mean Concentration (adjusted for bias) g/m3
2010
(Bias Adjustment
Factor = 0.92)
2011
(Bias Adjustment
Factor = 0.89)
2012
(Bias Adjustment
Factor = 0.97)
2013
(Bias Adjustment
Factor = 0.92)
2014
(Bias Adjustment
Factor = 0.91)
NB25 Roadside Yes 34.3 34.5 36.9 25.0 31.1
NB26 Roadside Yes 33.7 30.3 33.4 31.1 28.7
NB27 Roadside Yes 42.7 39.5 44.3 37.4 37.2
NB28 Roadside Yes 38.9 39.3 41.8 37.1 36.5
NB29 Roadside Yes 44.0 41.8 45.8 40.7 41.6
NB30 Roadside Yes 43.1 42.5 46.0 37.8 40.9
NB31 Roadside No 37.2 32.8 36.2 37.1 34.2
NB34 Roadside No 30.1 28.1 31.7 29.8 28.8
NB35 Roadside No 28.0 26.1 28.2 26.2 24.8
NB36 Roadside No 41.0 35.1 39.1 38.1 35.0
NB37 Roadside No 36.0 31.6 33.2 32.0 31.6
NB38 Roadside No 31.8 28.6 33.9 29.6 28.6
NB39 Roadside No 23.0 22.5 21.8 20.7 18.8
NB40 Roadside No 30.7 27.9 30.3 27.6 27.8
NB41 Roadside No - - 35.2 34.8 31.4
NB42 Roadside No - - 29.2 28.7 30.4
Objective 40 a This is the average of the three diffusion tubes installed at this location.

Nuneaton and Bedworth Borough Council Updating and Screening Assessment
J2266 24 of 47
Table 2.7: Fall-off with Distance Correction of Relevant Sites Exceeding the Nitrogen Dioxide Annual Mean Objective in 2014
Site ID Site Type Within
AQMA?
Distance to Relevant
Exposure (m)
Distance to kerb of nearest
road (m)
2014 Annual Mean
Concentration (g/m3)
(National Bias Adjustment factor = 0.91)
Distance Corrected 2014 Annual Mean Concentration
(g/m3)
NB11 Roadside Yes 6 4 42.4 36.6

Nuneaton and Bedworth Borough Council Updating and Screening Assessment
J2266 25 of 47
Figure 2.6: Trends in Annual Mean Nitrogen Dioxide Concentrations Measured at Diffusion Tube Monitoring Sites
0
5
10
15
20
25
30
35
40
45
50
NB
1
NB
2
NB
4
NB
5
NB
6
NB
7
NB
9
NB
10
NB
11
NB
12
NB
13
NB
14
NB
15
NB
17
NB
18
AQ
M
NB
20
NB
21
NB
22
NB
23
NB
24
NB
25
NB
26
NB
27
NB
28
NB
29
NB
30
NB
31
NB
34
NB
35
NB
36
NB
37
NB
38
NB
39
NB
40
NB
41
NB
42
An
nu
al m
ean
co
nce
ntr
atio
n (
adju
ste
d f
or
bia
s) µ
g/m
³
Monitoring Site
2010
2011
2012
2013
2014

Nuneaton and Bedworth Borough Council Updating and Screening Assessment
J2266 26 of 47 June 2015
2.2.2. PM10
No monitoring of PM10 was undertaken in Nuneaton and Bedworth in 2014.
2.2.3. Sulphur Dioxide
No monitoring of sulphur dioxide was undertaken in Nuneaton and Bedworth in 2014.
2.2.4. Benzene
No monitoring of benzene was undertaken in Nuneaton and Bedworth in 2014.
2.2.5. Other pollutants monitored
No monitoring for other pollutants was undertaken in Nuneaton and Bedworth in 2014.
2.2.6. Summary of Compliance with AQS Objectives
Nuneaton and Bedworth Borough Council has examined the results from monitoring in the borough in 2014. Concentrations outside of the existing AQMAs are all below the objectives at relevant locations, therefore there is no need to proceed to a Detailed Assessment.

Nuneaton and Bedworth Borough Council Updating and Screening Assessment
J2266 27 of 47 June 2015
3 Road Traffic Sources
LAQM requires local authorities to consider the following:
• Narrow congested streets with residential properties close to the kerb;
• Busy streets where people may spend one hour or more close to traffic;
• Roads with a high flow of buses and/or HGVs;
• Junctions;
• New roads constructed since the last Updating and Screening Assessment;
• Roads with significantly changed traffic flows; and
• Bus or coach stations.
Planning consents have been granted for a number of housing developments off The Long Shoot
in Nuneaton, which could potentially impact upon road traffic flows in the Leicester Road Gyratory
AQMA. Applications for sites with more than 100 dwellings were supported by air quality
assessments. All assessments predicted a ‘Negligible’ impact on nitrogen dioxide concentrations
within the AQMA, and confirmed that the developments would not create any new AQMAs, thus no
further assessment is required.
A proposal for up to 260 dwellings off Plough Hill Road in Nuneaton was not subject to an air
quality assessment; background concentrations of nitrogen dioxide in the area are low, and the
development is not near to, or expected to impact upon, any AQMAs.
The impacts of the developments under construction on the existing AQMAs will be considered
further in the next round of review and assessment through monitored concentrations.
Nuneaton and Bedworth Borough Council confirms that, from the above categories, there have been no new or newly identified road traffic sources which have not been considered in previous rounds of review and assessment.

Nuneaton and Bedworth Borough Council Updating and Screening Assessment
J2266 28 of 47 June 2015
4 Other Transport Sources
LAQM requires local authorities to consider the following:
• Airports;
• Locations where diesel or stream trains are regularly stationary for periods of 15 minutes
or more, with relevant exposure within 15m;
• Locations with a large number of movements of diesel locomotives and long term relevant
exposure within 30m; and
• Shipping ports.
Nuneaton and Bedworth Borough Council confirms that, from the above categories, there have been no new or newly identified ‘other transport’ sources which have not been considered in previous rounds of review and assessment.

Nuneaton and Bedworth Borough Council Updating and Screening Assessment
J2266 29 of 47 June 2015
5 Industrial Sources
LAQM requires local authorities to consider the following:
• Industrial Installations: new or proposed;
• Industrial installations: existing where emissions have increased substantially or relevant
exposure introduced;
• Major fuel storage depots;
• Petrol stations; and
• Poultry farms.
Nuneaton and Bedworth Borough Council confirms that, from the above categories, there have been no new or newly identified industrial sources which have not been considered in previous rounds of review and assessment.

Nuneaton and Bedworth Borough Council Updating and Screening Assessment
J2266 30 of 47 June 2015
6 Commercial and Domestic Sources
LAQM requires local authorities to consider the following:
• Biomass combustion plant – individual installations;
• Areas where the combined impact of several biomass combustion sources may be
relevant; and
• Areas where domestic solid fuel burning may be relevant.
Nuneaton and Bedworth Borough Council confirms that, from the above categories, there have been no new or newly identified commercial or domestic sources which have not been considered in previous rounds of review and assessment.

Nuneaton and Bedworth Borough Council Updating and Screening Assessment
J2266 31 of 47 June 2015
7 Fugitive or Uncontrolled Sources
LAQM requires local authorities to consider the following:
• Landfill sites;
• Quarries;
• Unmade haulage roads on industrial sites;
• Waste transfer stations; and
• Any other potential sources of fugitive particulate emissions.
Nuneaton and Bedworth Borough Council confirms that, from the above categories, there have been no new or newly identified fugitive or uncontrolled sources which have not been considered in previous rounds of review and assessment.

Nuneaton and Bedworth Borough Council Updating and Screening Assessment
J2266 32 of 47 June 2015
8 Conclusions and Proposed Actions
8.1. Conclusions from New Monitoring Data
Nuneaton and Bedworth Borough Council has examined the results from monitoring in the borough
in 2014. The results indicate that exceedences of the nitrogen dioxide annual mean objective
continue to be measured within the two existing AQMAs. There are no measured exceedences
outside of the existing AQMAs, thus there is no need to undertake a Detailed Assessment.
8.2. Conclusions from Assessment of Sources
The USA has not identified any significant changes in emissions sources within Nuneaton and
Bedworth other than those covered in previous review and assessment reports.
8.3. Proposed Actions
There is no need for further work at this stage.
Changes to the LAQM process are currently being considered by Defra. It is anticipated that, by
2016, the LAQM process will have been revised, with further guidance produced for local
authorities to follow. Nuneaton and Bedworth Borough Council will keep up-to-date with any
changes to the LAQM process and produce a report in 2016 which complies with the guidance at
that time.

Nuneaton and Bedworth Borough Council Updating and Screening Assessment
J2266 33 of 47 June 2015
9 Appendices
A1 Appendix A: QA:QC Data ............................................................................................ 34
A2 Appendix 2: Monthly Diffusion Tube Measurements ............................................... 37
A3 Appendix 3: Air Quality Action Plan Review/Progress ............................................ 39

Nuneaton and Bedworth Borough Council Updating and Screening Assessment
J2266 34 of 47 June 2015
A1 Appendix A: QA:QC Data
Bias Adjustment Factor from Local Co-location Study
A bias adjustment factor has been calculated from the local 2014 co-location study at the Leicester
Road automatic monitor, as shown below. Nuneaton & Bedworth Borough Council’s network of
diffusion tubes are supplied and analysed by Gradko International. They are prepared using 20%
triethanolamine (TEA) in water. The diffusion tube monitoring period below is for all three of the
triplicate tubes and the annual mean is the average of the three. The annual mean presented
below does not relate to a calendar year, instead to the year of diffusion tube monitoring
undertaken (8th January 2014 to 7
th January 2015).
Table A1.1: Bias Adjustment Factor from Local Co-location Study
Site Name Site Type Within
AQMA?
Auto Data Capture
(%)
DT a
Periods (months)
Annual Mean (µg/m
3) DT Mean
CV b (%)
Bias
DT Auto
AQM2 Leicester Road
Roadside Y 98.9 12 34.1 37.9 4.4 1.11
a DT = Diffusion Tube
b CV = Coefficient of Variation, i.e. precision of diffusion tube replicates. If the average CV is >10%,
the survey is considered poor overall.
Diffusion Tube Bias Adjustment Factors
A database of bias adjustment factors determined from Local Authority co-location studies
throughout the UK has been collated by the LAQM Helpdesk. The National Diffusion Tube Bias
Adjustment Factor Spreadsheet (Version 03/15) was used to obtain an overall adjustment factor of
0.91 from the input data shown in the following screen shot. This overall factor is based on 16 co-
location studies where the tube preparation method and analysis laboratory used (Gradko
International, 20% TEA in water) were the same as those used by Nuneaton & Bedworth Borough
Council.

Nuneaton and Bedworth Borough Council Updating and Screening Assessment
J2266 35 of 47
Figure A1.1: National Diffusion Tube Bias Adjustment Factor Spreadsheet

Nuneaton and Bedworth Borough Council Updating and Screening Assessment
J2266 36 of 47 June 2015
Discussion of Choice of Factor to Use
The bias adjustment factor applied to all 2014 data was 0.91. The applied bias adjustment factor
has been calculated using the national diffusion tube bias adjustment factor spreadsheet version
03/15. The national factor is used in preference to the local factor as it is derived from a larger
dataset, thus providing a more robust calculation with less uncertainty.
QA/QC of automatic monitoring
The Leicester Road automatic monitoring site is maintained by We Care 4 Air (Supporting U prior
to November 2014), who service the site and undertake monthly LSO visits. They also download
and ratify the data monthly.
QA/QC of diffusion tube monitoring
The diffusion tubes are supplied and analysed by Gradko International using the 20%
triethanolamine (TEA) in water method. Gradko International participates in the Annual Field Inter-
Comparison Exercise and, until March 2014, participated in the Workplace Analysis Scheme for
Proficiency (WASP) inter-comparison scheme for nitrogen dioxide diffusion tube analysis. From
April 2014, the WASP scheme was combined with the STACKS scheme to form the new AIR
scheme, which Gradko International participates in. The AIR scheme is an independent analytical
proficiency-testing scheme operated by LGC Standards and supported by the Health and Safety
Laboratory (HSL). The Gradko International laboratory follows the procedures set out in the
Harmonisation Practical Guidance and is UKAS accredited.
From January to March 2014 the laboratory scored 100% in the WASP scheme and from April
2014 to February 2015 scored 100% in the AIR scheme. This implies that 100% of results
submitted by Gradko International for all recent rounds were determined as satisfactory. In 2014,
the tube precision for nitrogen dioxide Annual Field Inter-Comparison for Gradko International
using the 20% TEA in water method was ‘good’ for the results from all 16 participating local
authorities.

Nuneaton and Bedworth Borough Council Updating and Screening Assessment
J2266 37 of 47
A2 Appendix 2: Monthly Diffusion Tube Measurements
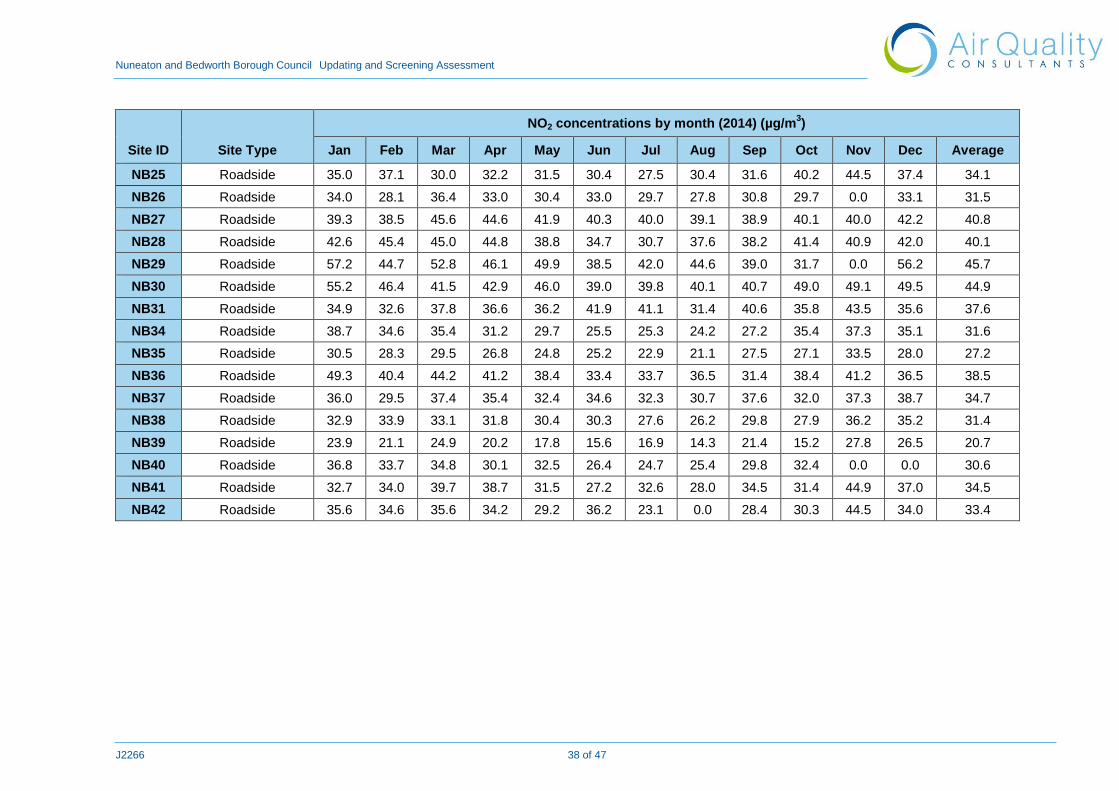
Table A2.1: Monthly non-automatic nitrogen dioxide monitoring results - unadjusted raw data (time-weighted average)
Site ID Site Type
NO2 concentrations by month (2014) (µg/m3)
Jan Feb Mar Apr May Jun Jul Aug Sep Oct Nov Dec Average
NB1 Urban Background 28.7 23.5 23.5 21.5 19.0 17.0 16.8 14.9 21.3 23.2 25.9 26.2 21.9
NB2 Urban Background 28.2 27.6 24.0 20.1 18.2 15.6 14.5 15.8 20.1 21.3 31.8 0.0 21.6
NB4 Roadside 39.1 34.8 38.1 36.1 31.0 32.2 30.2 0.0 29.6 34.4 39.5 46.1 35.7
NB5 Kerbside 33.2 36.4 43.2 35.4 31.3 28.4 29.8 0.0 36.3 31.6 34.8 36.0 34.2
NB6 Kerbside 41.0 40.4 42.3 36.3 33.9 29.3 27.3 35.5 31.3 40.1 43.7 43.5 37.1
NB7 Kerbside 44.6 40.5 44.0 37.7 33.5 33.7 30.1 31.6 35.0 31.7 49.0 40.8 37.8
NB9 Kerbside 38.8 37.2 34.6 30.5 31.7 30.5 26.5 22.6 29.0 28.1 54.2 40.3 34.0
NB10 Kerbside 36.2 32.2 35.7 37.1 30.7 32.5 29.5 24.4 30.1 33.6 42.8 30.3 33.0
NB11 Roadside 48.3 53.0 45.3 47.5 44.4 44.2 35.6 36.3 41.0 39.1 68.4 50.9 46.5
NB12 Roadside 50.9 44.8 44.8 36.1 30.7 34.8 30.6 26.1 33.0 39.4 39.7 52.9 38.8
NB13 Kerbside 44.4 34.8 46.2 41.1 36.0 41.5 40.1 32.5 41.8 34.7 57.3 38.9 41.1
NB14 Roadside 40.0 44.7 38.7 39.8 41.0 32.3 32.0 33.5 34.5 43.9 58.6 51.7 41.2
NB15 Kerbside 34.6 38.0 37.3 28.7 25.6 28.9 24.3 25.2 32.0 29.9 39.1 31.5 31.4
NB17 Roadside 36.3 37.1 42.5 36.2 31.4 40.7 31.4 27.3 36.0 31.5 42.5 37.2 36.1
NB18 Kerbside 44.3 39.1 37.4 34.3 30.2 34.9 25.4 31.5 16.3 40.2 33.6 42.6 34.0
AQM2 Roadside 40.2 42.0 40.6 33.5 32.1 31.4 26.6 28.6 30.4 32.6 39.4 34.3 34.3
NB20 Roadside 34.7 29.3 34.7 31.7 25.0 30.4 25.9 23.2 27.3 28.8 38.7 32.7 30.3
NB21 Roadside 36.8 35.9 35.9 33.9 29.2 28.7 0.0 26.3 29.0 36.7 38.6 38.9 33.6
NB22 Roadside 32.0 29.7 31.3 23.6 24.8 22.9 20.2 20.7 24.7 29.2 41.0 30.3 27.7
NB23 Roadside 41.5 42.1 38.7 32.4 30.3 30.5 24.7 30.6 31.5 37.5 58.6 0.0 36.5
NB24 Roadside 27.6 28.1 27.0 24.9 25.4 21.6 19.7 21.2 24.8 23.2 31.1 0.0 25.0
Nuneaton and Bedworth Borough Council Updating and Screening Assessment
J2266 38 of 47
Site ID Site Type
NO2 concentrations by month (2014) (µg/m3)
Jan Feb Mar Apr May Jun Jul Aug Sep Oct Nov Dec Average
NB25 Roadside 35.0 37.1 30.0 32.2 31.5 30.4 27.5 30.4 31.6 40.2 44.5 37.4 34.1
NB26 Roadside 34.0 28.1 36.4 33.0 30.4 33.0 29.7 27.8 30.8 29.7 0.0 33.1 31.5
NB27 Roadside 39.3 38.5 45.6 44.6 41.9 40.3 40.0 39.1 38.9 40.1 40.0 42.2 40.8
NB28 Roadside 42.6 45.4 45.0 44.8 38.8 34.7 30.7 37.6 38.2 41.4 40.9 42.0 40.1
NB29 Roadside 57.2 44.7 52.8 46.1 49.9 38.5 42.0 44.6 39.0 31.7 0.0 56.2 45.7
NB30 Roadside 55.2 46.4 41.5 42.9 46.0 39.0 39.8 40.1 40.7 49.0 49.1 49.5 44.9
NB31 Roadside 34.9 32.6 37.8 36.6 36.2 41.9 41.1 31.4 40.6 35.8 43.5 35.6 37.6
NB34 Roadside 38.7 34.6 35.4 31.2 29.7 25.5 25.3 24.2 27.2 35.4 37.3 35.1 31.6
NB35 Roadside 30.5 28.3 29.5 26.8 24.8 25.2 22.9 21.1 27.5 27.1 33.5 28.0 27.2
NB36 Roadside 49.3 40.4 44.2 41.2 38.4 33.4 33.7 36.5 31.4 38.4 41.2 36.5 38.5
NB37 Roadside 36.0 29.5 37.4 35.4 32.4 34.6 32.3 30.7 37.6 32.0 37.3 38.7 34.7
NB38 Roadside 32.9 33.9 33.1 31.8 30.4 30.3 27.6 26.2 29.8 27.9 36.2 35.2 31.4
NB39 Roadside 23.9 21.1 24.9 20.2 17.8 15.6 16.9 14.3 21.4 15.2 27.8 26.5 20.7
NB40 Roadside 36.8 33.7 34.8 30.1 32.5 26.4 24.7 25.4 29.8 32.4 0.0 0.0 30.6
NB41 Roadside 32.7 34.0 39.7 38.7 31.5 27.2 32.6 28.0 34.5 31.4 44.9 37.0 34.5
NB42 Roadside 35.6 34.6 35.6 34.2 29.2 36.2 23.1 0.0 28.4 30.3 44.5 34.0 33.4

Nuneaton and Bedworth Borough Council Updating and Screening Assessment
J2266 39 of 47
A3 Appendix 3: Air Quality Action Plan Review/Progress
Table A3.1: Air Quality Action Plan Progress
Measure No. Measure
Lead Authority
Indicator
Target Annual
Emission Reduction
in the AQMA
Progress to Date Progress in Last 12
Months
Estimated Completion
Date
AQAP1
N&BBC will work in
partnership with WCC to identify
and bring forward traffic
management
improvements in Nuneaton town
centre, particularly where they will benefit the two
AQMAs.
WCC /
N&BBC
Preparation /
implementation of
strategy. Number of meetings between N&BBC and WCC
about traffic improvement
measures
in AQMAs.
Number of measures
implemented or started
1-2 µg/m3
Traffic modelling has been undertaken in 2014 to identify the nature and
scale of highway improvements within the
town centre.
Option testing will be based on the spatial proposals set
out in the Borough Plan.
A strategic highway assessment has
been carried out in relation to the
Borough Plan. This work has identified a
number of key highway
improvements that will be required to mitigate the traffic impact of future
developments in the area.
2012 - 2016
AQAP2
N&BBC will work in
partnership with WCC to identify
measures to reduce the impact
of HGV movements
within the area.
WCC /
N&BBC
Draft document by
N&BBC of identified
measures to reduce HGV movements
Number of measures
approved by WCC
Number of measures
implemented/started
0.2 – 0.5 µg/ m
3
The county-wide Lorry Map is kept under regular review by the County Council. The presence of important ‘A’ and ‘B’ roads such as the
A444 and B4114 within the AQMAs mean that it is
difficult to direct HGV and HDV traffic away from
them.
The Lorry Map continues to be
widely available to help HGV drivers
plan routes as effectively as
possible.
ongoing

Nuneaton and Bedworth Borough Council Updating and Screening Assessment
J2266 40 of 47
Measure No. Measure
Lead Authority
Indicator
Target Annual
Emission Reduction
in the AQMA
Progress to Date Progress in Last 12
Months
Estimated Completion
Date
AQAP3
N&BBC will work in
partnership with WCC and
Sustrans to deliver further
improvements for pedestrians and
cyclists within the area.
WCC /
N&BBC /
Sustrans
Identification of areas,
routes for pedestrians
and cyclists paths
Meters of paths improved /
developed for pedestrians and
cyclists in Nuneaton particularly in
AQMAs.
0.2 – 0.5 µg/ m
3
Ongoing improvements through the LTP and as key
development sites come forward.
Weddington Walk cycle improvements are now complete.
The cycle improvements provide a high
quality route from Weddington to the MIRA site. Besides
this, WCC and Sustrans are
working together on an electronic cycle mapping program that will be used to identify new cycle
routes in relation to land developments.
ongoing

Nuneaton and Bedworth Borough Council Updating and Screening Assessment
J2266 41 of 47
Measure No. Measure
Lead Authority
Indicator
Target Annual
Emission Reduction
in the AQMA
Progress to Date Progress in Last 12
Months
Estimated Completion
Date
AQAP4
N&BBC will work in
partnership with WCC, public
transport operators, DfT Rail
and Network Rail to implement
better integration of public
transport in Nuneaton,
including improvements for
bus, rail and community transport
infrastructure and services.
WCC /
N&BBC /
public
transport
operators /
DfT Rail /
Network
Rail
Produce strategy for
integrating public
transport modes
No. of improvement
Schemes implemented/started
Improvement in
passenger numbers using public transport.
0.2 – 0.5 µg/ m
3
A number of Quality Bus Corridors (QBCs) are
planned during the LTP3 period (i.e. 2011-2026), including an Inter-Urban QBC between Nuneaton-
Hinckley-
Leicester (service 48) and a QBC between Nuneaton
and the Tamworth boundary (service 765).
Rail improvements are being delivered between
Bedworth and Coventry as part of the NUCKLE rail scheme. Phase 1.1 of NUCKLE includes the
delivery of new stations at Bermuda and Ricoh Arena with delivery expected in
summer 2015.
NUCKLE 1.2 is intended to be completed by May 2017.
This phase will see the increase in train
frequencies to two trains per hour between
Coventry-Bedworth-Nuneaton.
Reductions in LTP funding have meant that the introduction
of further QBC schemes has been
delayed for the foreseeable future.
To date, progress includes platforms
on both sides of the railway lines at Ricoh Arena
complete with platform shelters and
ticket machines. Station platforms are
currently being constructed at
Bermuda.
2017

Nuneaton and Bedworth Borough Council Updating and Screening Assessment
J2266 42 of 47
Measure No. Measure
Lead Authority
Indicator
Target Annual
Emission Reduction
in the AQMA
Progress to Date Progress in Last 12
Months
Estimated Completion
Date
AQAP5
N&BBC will work in
partnership with WCC to increase
uptake and
implementation of School and
Workplace Travel Plans (STP and
WTP), particularly where they are
likely to impact on AQMAs.
WCC /
N&BBC
Number of new travel
plans in place. WTP: Increase proportion
of working population covered STP:
Decrease proportion of car school
journeys increase car sharing
0.2 – 0.5 µg/ m
3
Ongoing as opportunities arise, and through the development process.
New employment sites have a duty to
develop and implement
workplace travel plans through the planning process.
ongoing
AQAP6
N&BBC will continue to develop,
implement and monitor its Travel Plan policy. As
part of the implementation of this plan, N&BBC will explore the
potential for operation of a Car Club in Nuneaton
N&BBC Reduction on the
number of car journeys.
0 - 0.2 µg/ m
3
Travel Plan Policy in place.
Implementation and ongoing monitoring
arrangements to be agreed via the N&BBC Environmental
Sustainability Strategy Group
On-going monitoring of the travel plan
policy ongoing

Nuneaton and Bedworth Borough Council Updating and Screening Assessment
J2266 43 of 47
Measure No. Measure
Lead Authority
Indicator
Target Annual
Emission Reduction in
the AQMA
Progress to Date
Progress in Last 12 Months
Estimated Completion
Date
AQAP7
i) N&BBC will include planning policies in its Borough Plan that seek to improve air quality, to improve sustainable transport links and to
secure travel plan agreements.
ii) N&BBC will identify, as a part of the Borough Plan Infrastructure Delivery Plan
specific pieces of infrastructure required within the AMQA or that could relieve the AQMA. These can then be prioritised alongside the Borough’s other infrastructure demands for
external funding and developer contributions/CIL
iii) N&BBC will encourage developers to take part in pre-application discussions to ensure air quality is considered when formulating a
planning application. Developers should ensure good design as a part of their
proposals and actively endorse travel planning to minimise and mitigate the impacts of new
development upon the AQMA. Where appropriate development proposals should be
accompanied by Air Quality Assessments
N&BBC
i) and ii) Adoption of
Borough Plan and
Infrastructure Delivery
Plan
iii) Increased number of pre-
application
discussions and planning applications
taking account of air quality
and sustainable
transport issues.
0 - 0.2 µg/ m3
i) and ii) Draft Borough Plan and
Infrastructure Delivery Plan
underway.
iii)
Development
control
officers
aware of air
quality issues
in order to
advise
developers.
Air Quality
Officer
involved in
pre-apps and
consultations
.
i) currently being
prepared
ii) currently awaiting
the Borough
Plan decision
iii) this is now an adopted practice
ongoing

Nuneaton and Bedworth Borough Council Updating and Screening Assessment
J2266 44 of 47
Measure No. Measure
Lead Authority
Indicator
Target Annual
Emission Reduction
in the AQMA
Progress to Date Progress in Last 12
Months
Estimated Completion
Date
AQAP8
N&BBC will continue to work with WCC and
other partners to deliver
improvements in emissions
standards, where practicable.
N&BBC / WCC / Public
transport operators
Number of new / improved vehicles
within fleets 1-2 µg/ m
3
Deployment of newer, cleaner vehicles as part of the QBC and QBI initiatives
WCC continue to support bus
operators to provide new, cleaner, lower emission vehicles
where feasible. Due to a reduction in LTP
funding, WCC are unable to progress the introduction of
newer vehicle via the QBC initiatives. Bus
company Stagecoach are
continuing to invest and renew their fleet
of vehicles, which should have a
positive impact on emission levels.
ongoing
AQAP9
N&BBC will make details of the air quality measures
and annual progress reports available on its
Website to ensure accessibility to the consultation and implementation
process.
N&BBC
Availability of
recently
published reports on
the website
0 µg/ m3
To be uploaded to website at the appropriate time
Reports are available on the council website
ongoing

Nuneaton and Bedworth Borough Council Updating and Screening Assessment
J2266 45 of 47
Measure No. Measure
Lead Authority
Indicator
Target Annual
Emission Reduction
in the AQMA
Progress to Date Progress in Last 12
Months
Estimated Completion
Date
AQAP10
N&BBC will continue to work in
partnership with WCC and the Warwickshire
District Authorities on air quality and travel awareness
campaigns to raise the profile of air
quality in the Borough and County-wide.
N&BBC / WCC /
Warwick-shire local authoritie
s
Number of campaigns
implemented
0 - 0.2 µg/ m
3
WCC actively promotes sustainable travel modes
via the following:
WCC car share databasehttps://carsharewarwickshire.liftshare.com/default.asp
Nuneaton Cycle Guide available in hard-copy and online
public transport maps and timetables available in hard-copy and online
Choose How You Move Facebook page https://www.facebook.com/ChooseMoveWarks - providing up-to-date information on WCC transport schemes and events
Warwickshire Direct website www.warwickshire.gov.uk/travel - providing all bus, travel and transport information
Pedal and Ride events – offering free bike registration to encourage cycling
WCC also liaises with British Cycling to promote Breeze Rides and Ride Social events to promote cycling
ongoing

Nuneaton and Bedworth Borough Council Updating and Screening Assessment
J2266 46 of 47
Measure No. Measure
Lead Authority
Indicator
Target Annual
Emission Reduction
in the AQMA
Progress to Date Progress in Last 12
Months
Estimated Completion
Date
AQAP11
N&BBC will continue the
commitment to undertake local air quality monitoring within the Borough to ensure a high
standard of data is achieved to assess against air quality
objectives.
N&BBC Number monitoring
sites - % data capture
0 µg/ m3
Monitoring continues across the Borough – data capture for 2014 was good at all passive locations
and at the continuous site above 90% ongoing
AQAP12
N&BBC will continue to
proactively enforce industrial control
and nuisance legislation to
minimise pollutant emissions from these sources in
the Borough.
N&BBC compliance levels of permitted industrial
processes
0 - 0.2 µg/ m
3
The Borough Council continue a high rate of inspections of industrial installations
ongoing

Nuneaton and Bedworth Borough Council Updating and Screening Assessment
J2266 47 of 47
Measure No. Measure
Lead Authority
Indicator
Target Annual
Emission Reduction
in the AQMA
Progress to Date Progress in Last 12
Months
Estimated Completion
Date
AQAP13
N&BBC will continue to work
together with partners to
promote and implement energy
efficiency measures in the
Borough
N&BBC
Council’s energy efficiency figures
Number of consultations
provided for energy
0 - 0.2 μg/ m
3
The Community Energy
Saving Programme started in
2012 and saw the
completion in 2013 of
external wall
insulations (EWI), boiler
replacements to 410
council owned properties.139
private properties also
benefited from the EWI work
in 2012, and a further 46
properties in 2013.
In 2013 Rockwarm did EWI
works to 108 properties
in Bede ward in Bedworth.
They have also insulated a
further 100 properties around
the Borough where people
are eligible for funding
towards EWI work or where
the property has electric or
coal heating. They have
also continued to insulate
cavity walls and lofts around
the Borough.
In 2014, via the
programme, 60
properties had
increased loft
insulation, 30 had
cavity wall insulation,
270 received A rated
gas boilers and
central healing
insulation, and a
further 43 properties
received new high
performance double
glazed windows and
external wall
insulation
ongoing