Embed Size (px)
Citation preview
MARCH 15, 2017
2015 ANNUAL REPORT TRACKING SILICOSIS &
OTHER WORK-RELATED LUNG DISEASES IN MICHIGAN
2015 ANNUAL REPORT TRACKING SILICOSIS &
OTHER WORK-RELATED LUNG DISEASES IN MICHIGAN
Michigan State University Department of Medicine
West Fee Hall 909 Fee Road, Room 117 East Lansing, MI 48824 517.353.1846 Kenneth D. Rosenman, MD Mary Jo Reilly, MS
Michigan Department of Licensing & Regulatory Affairs (LARA)
PO Box 30649 Lansing, MI 48909 517.284.7777 Barton G. Pickelman Director MIOSHA
There are many resources available to help employers, employees , hea l th care professionals and others understand more about work-related lung disease. Links to these resources can be found at: www.oem.msu.edu.
Acronyms
AB Asbestosis COPD Chronic Obstructive Pulmonary Disease ED Emergency Department LARA MI Department of Licensing & Regulatory Affairs MIOSHA Michigan Occupational Safety & Health Administration NAICS North American Industrial Classification System NIOSH National Institute for Occupational Safety & Health OLDS Other Work-Related Lung Diseases PEL Permissible Exposure Limit
Silicosis & Other Work-Related Lung Disease Surveillance Program
This is the 24th annual report on silicosis in Michigan. This is the 4th year of the ex-pansion of the annual report to include surveillance data on the magnitude and nature of all work-related lung diseases in Michigan. In 2011, we expanded surveillance of silicosis in Michigan to include other lung disease, including asbestosis, work-related hypersensitivity pneumonitis, hard metal lung disease, minor pneumoconiosis, and emerging work-related lung diseases. Work-related asthma has always been covered under a separate annual report.
Summary
2015 Annual Report
SUMMARY 1-2
BACKGROUND 2
PROCEDURES 2-3
RESULTS 4-20
DISCUSSION 20-22
REFERENCES 23
TABLE OF CONTENTS
We sincerely appreciate the commitment of
those health care providers who understand the public health
significance of diagnosing a patient with an occupational
illness, as well as the Michigan
employees who took the time to share their experiences
about their work and subsequent
development of work-related lung
disease.
This report was funded by the National
Institute for Occupational Safety &
Health, under cooperative agreement
U60-OH008466.
Tracking Silicosis & Other Work-Related Lung Diseases in Michigan March 15, 2017
From 1985-2015, 1,179 silicosis cases have been identified through the Michigan tracking system.
On average since 2000, 23 new cases of silicosis were report-ed to LARA each year.
We estimate there were 67-139 adults in Michigan with silicosis who were not report-ed in 2015.
Asbestos-related lung changes are the most common work-related lung disease in Michi-gan, identified through hospital discharge data, B-Readers, the courts and other sources.
167 cases of Other Work-Related Lung Disease (OLDS) were identified in 2015; chemical irritation, chemical pneumonitis and smoke inhalation were among the condi-
tions reported.
Four MIOSHA en-forcement inspections conducted in 2015 at workplaces where an OLDS case other than silicosis was reported. The inspections found violations of other MI-OSHA standards de-spite breathing zone exposures being below OSHA permissible lim-its. There were no silicosis-related inspec-tions in 2015.
There are four main activities related to occupational lung disease surveillance in Michigan: identifying patients, interviewing patients and collecting relevant medical records, conducting workplace inspections, and sharing the overall results and lessons learned with industry, employees and other stakeholders.
IDENTIFY PATIENTS
Patients are identified through mandatory reporting of any known or suspected occupational illnesses, including silicosis and other work-related lung diseases.
SOURCES TO IDENTIFY PATIENTS IN MICHIGAN
Health Care Providers Private practice, working for industry, NIOSH-certified “B” readers Hospitals International Classification of Disease 10th Revision (ICD-10) Silicosis (J62, J65),
Hypersensitivity Pneumonitis (J67), Other Pneumoconioses (J63, J64), Other Respiratory Conditions (J66, J68, Z57.2, Z57.3, Z57.5)
Workers’ Compensation Agency
Summary, continued
Work-Related Lung Disease Tracking Procedures
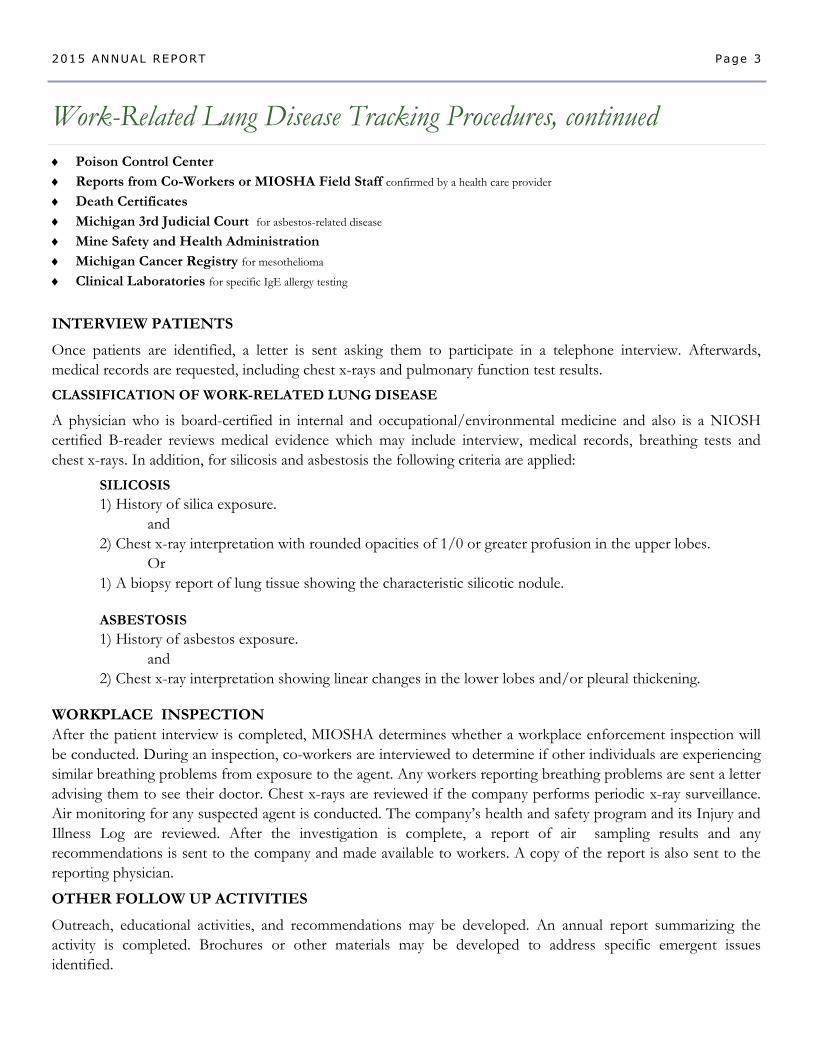
The annual average incidence rate of silicosis among African American males is 7.1 cases per 100,000 workers. Among white males the rate is 1.4 cases per 100,000 workers. Within specific counties in Michigan, the annual average incidence rates of silicosis range between two to 356 times higher for African American males than the rates for white males.
Background In 1988, the State of Michigan instituted a tracking program for silicosis with financial assistance from NIOSH. In 2011, surveillance was expanded to include Other Work-Related Lung Diseases (OLDS). This is a joint project of MIOSHA and Michigan State University, Department of Medicine, Division of Occupational and Environmental Medicine.
The reporting of an index patient is a sentinel health event that may lead to the identification of employees from the same facilities who are also at risk of developing silicosis or OLDS. The goal is to prevent work-related lung disease through the identification and workplace follow-up of these index patients.
Part 56 of the Michigan Public Health Code requires reporting of all known or suspected occupational illnesses or work-aggravated health conditions to the Michigan Department of Licensing & Regulatory Affairs within 10 days of discovery.
Page 2 2015 ANNUAL REPORT
Work-Related Lung Disease Tracking Procedures, continued Poison Control Center Reports from Co-Workers or MIOSHA Field Staff confirmed by a health care provider
Death Certificates
Michigan 3rd Judicial Court for asbestos-related disease
Mine Safety and Health Administration
Michigan Cancer Registry for mesothelioma
Clinical Laboratories for specific IgE allergy testing
INTERVIEW PATIENTS
Once patients are identified, a letter is sent asking them to participate in a telephone interview. Afterwards, medical records are requested, including chest x-rays and pulmonary function test results.
CLASSIFICATION OF WORK-RELATED LUNG DISEASE
A physician who is board-certified in internal and occupational/environmental medicine and also is a NIOSH certified B-reader reviews medical evidence which may include interview, medical records, breathing tests and chest x-rays. In addition, for silicosis and asbestosis the following criteria are applied:
SILICOSIS 1) History of silica exposure. and 2) Chest x-ray interpretation with rounded opacities of 1/0 or greater profusion in the upper lobes. Or 1) A biopsy report of lung tissue showing the characteristic silicotic nodule. ASBESTOSIS 1) History of asbestos exposure. and 2) Chest x-ray interpretation showing linear changes in the lower lobes and/or pleural thickening. WORKPLACE INSPECTION After the patient interview is completed, MIOSHA determines whether a workplace enforcement inspection will be conducted. During an inspection, co-workers are interviewed to determine if other individuals are experiencing similar breathing problems from exposure to the agent. Any workers reporting breathing problems are sent a letter advising them to see their doctor. Chest x-rays are reviewed if the company performs periodic x-ray surveillance. Air monitoring for any suspected agent is conducted. The company’s health and safety program and its Injury and Illness Log are reviewed. After the investigation is complete, a report of air sampling results and any recommendations is sent to the company and made available to workers. A copy of the report is also sent to the reporting physician.
OTHER FOLLOW UP ACTIVITIES
Outreach, educational activities, and recommendations may be developed. An annual report summarizing the activity is completed. Brochures or other materials may be developed to address specific emergent issues identified.
Page 3 2015 ANNUAL REPORT
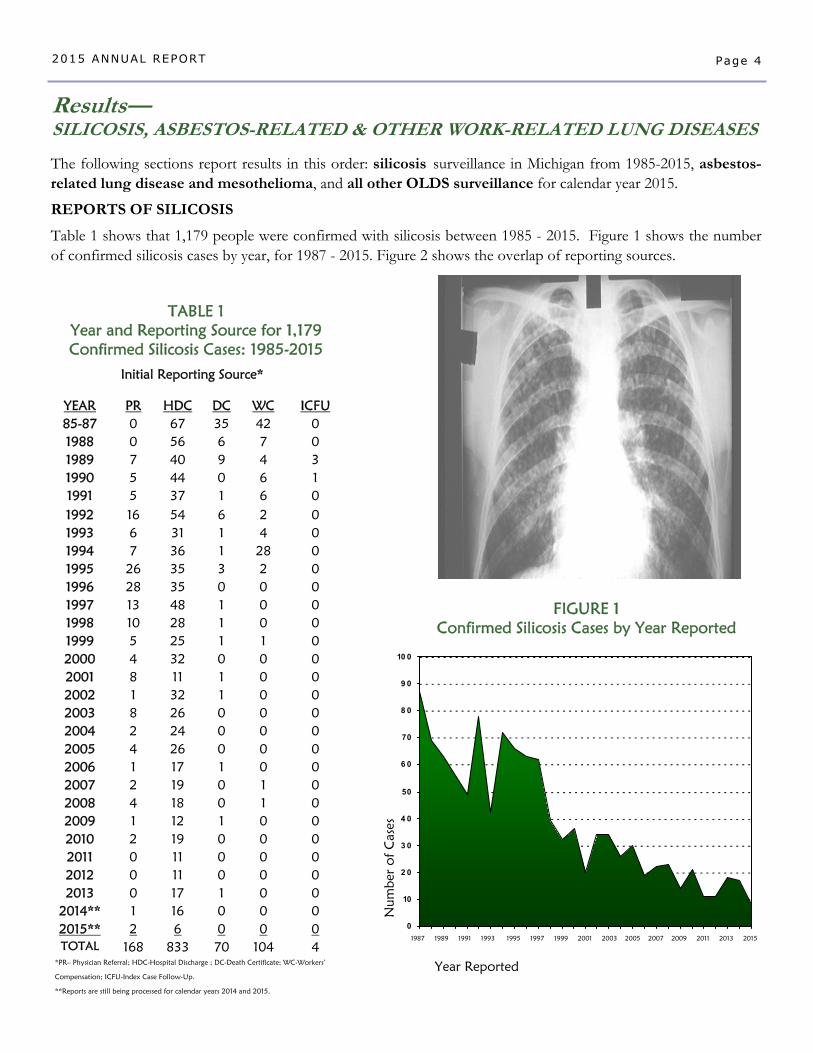
TABLE 1 Year and Reporting Source for 1,179 Confirmed Silicosis Cases: 1985-2015
Initial Reporting Source*
YEAR PR HDC DC WC ICFU 85-87 0 67 35 42 0
1989 7 40 9 4 3
1991 5 37 1 6 0
1993 6 31 1 4 0
1995 26 35 3 2 0
1997 13 48 1 0 0
1999 5 25 1 1 0
2001 8 11 1 0 0
2003 8 26 0 0 0
2005 4 26 0 0 0
2007 2 19 0 1 0
2009 1 12 1 0 0
2011 0 11 0 0 0
2013 0 17 1 0 0
TOTAL 168 833 70 104 4 *PR– Physician Referral; HDC-Hospital Discharge ; DC-Death Certificate; WC-Workers’
Compensation; ICFU-Index Case Follow-Up.
**Reports are still being processed for calendar years 2014 and 2015.
2014** 1 16 0 0 0
1988 0 56 6 7 0
1990 5 44 0 6 1
1992 16 54 6 2 0
1994 7 36 1 28 0
1996 28 35 0 0 0
1998 10 28 1 0 0
2000 4 32 0 0 0
2002 1 32 1 0 0
2004 2 24 0 0 0
2006 1 17 1 0 0
2008 4 18 0 1 0
2010 2 19 0 0 0
2012 0 11 0 0 0
2015** 2 6 0 0 0
The following sections report results in this order: silicosis surveillance in Michigan from 1985-2015, asbestos-related lung disease and mesothelioma, and all other OLDS surveillance for calendar year 2015.
REPORTS OF SILICOSIS
Table 1 shows that 1,179 people were confirmed with silicosis between 1985 - 2015. Figure 1 shows the number of confirmed silicosis cases by year, for 1987 - 2015. Figure 2 shows the overlap of reporting sources.
Results— SILICOSIS, ASBESTOS-RELATED & OTHER WORK-RELATED LUNG DISEASES
Page 4 2015 ANNUAL REPORT
FIGURE 1 Confirmed Silicosis Cases by Year Reported
Num
ber
of
Cas
es
0
10
2 0
3 0
4 0
50
6 0
70
8 0
9 0
10 0
Year Reported
1987 1989 1991 1993 1995 1997 1999 2001 2003 2005 2007 2009 2011 2013 2015
HDC (N=920)*
PR (N=184)*
WC (N=133)* ICFU (N=4)*
DC (N=157)*
73
1
41
3
1 48
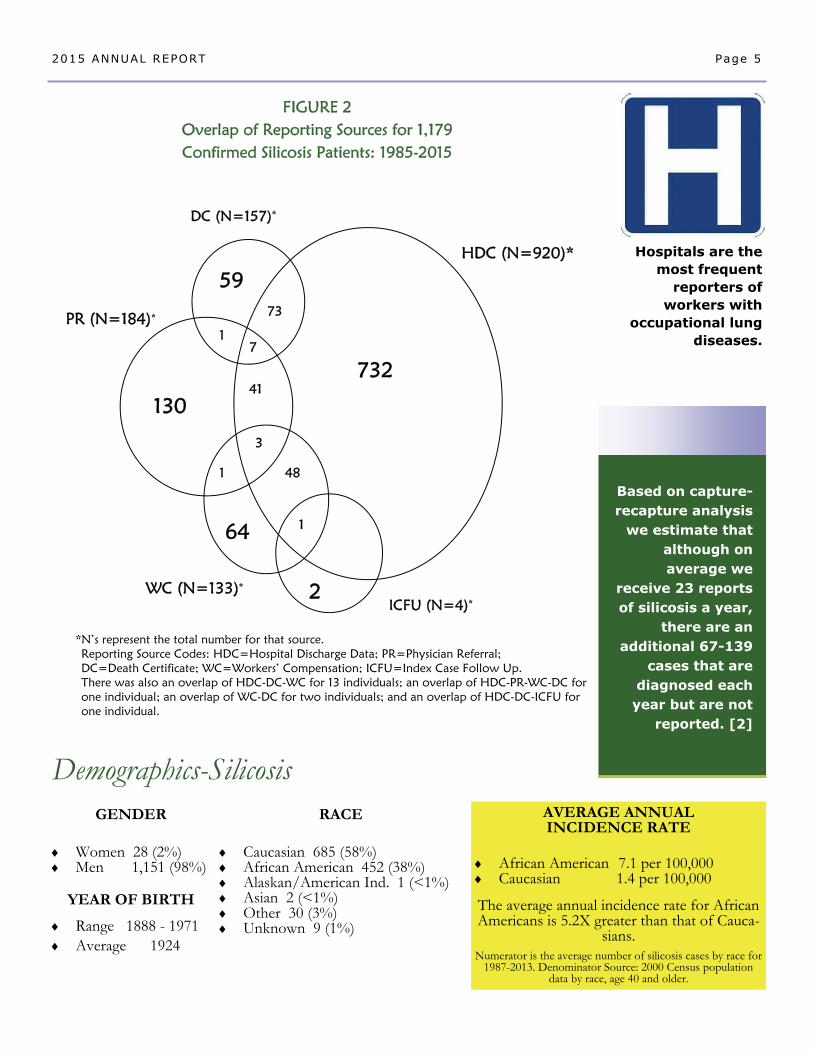
Demographics-Silicosis
Hospitals are the most frequent
reporters of workers with
occupational lung diseases.
RACE Caucasian 685 (58%) African American 452 (38%) Alaskan/American Ind. 1 (<1%) Asian 2 (<1%) Other 30 (3%) Unknown 9 (1%)
GENDER Women 28 (2%) Men 1,151 (98%)
YEAR OF BIRTH
Range 1888 - 1971 Average 1924
AVERAGE ANNUAL INCIDENCE RATE
African American 7.1 per 100,000 Caucasian 1.4 per 100,000
The average annual incidence rate for African Americans is 5.2X greater than that of Cauca-
sians. Numerator is the average number of silicosis cases by race for
1987-2013. Denominator Source: 2000 Census population data by race, age 40 and older.
Based on capture-recapture analysis
we estimate that although on average we
receive 23 reports of silicosis a year,
there are an additional 67-139
cases that are diagnosed each year but are not
reported. [2]
Page 5 2015 ANNUAL REPORT
FIGURE 2 Overlap of Reporting Sources for 1,179 Confirmed Silicosis Patients: 1985-2015
*N’s represent the total number for that source. Reporting Source Codes: HDC=Hospital Discharge Data; PR=Physician Referral; DC=Death Certificate; WC=Workers’ Compensation; ICFU=Index Case Follow Up. There was also an overlap of HDC-DC-WC for 13 individuals; an overlap of HDC-PR-WC-DC for one individual; an overlap of WC-DC for two individuals; and an overlap of HDC-DC-ICFU for one individual.
732
59
130
64
2
7
1
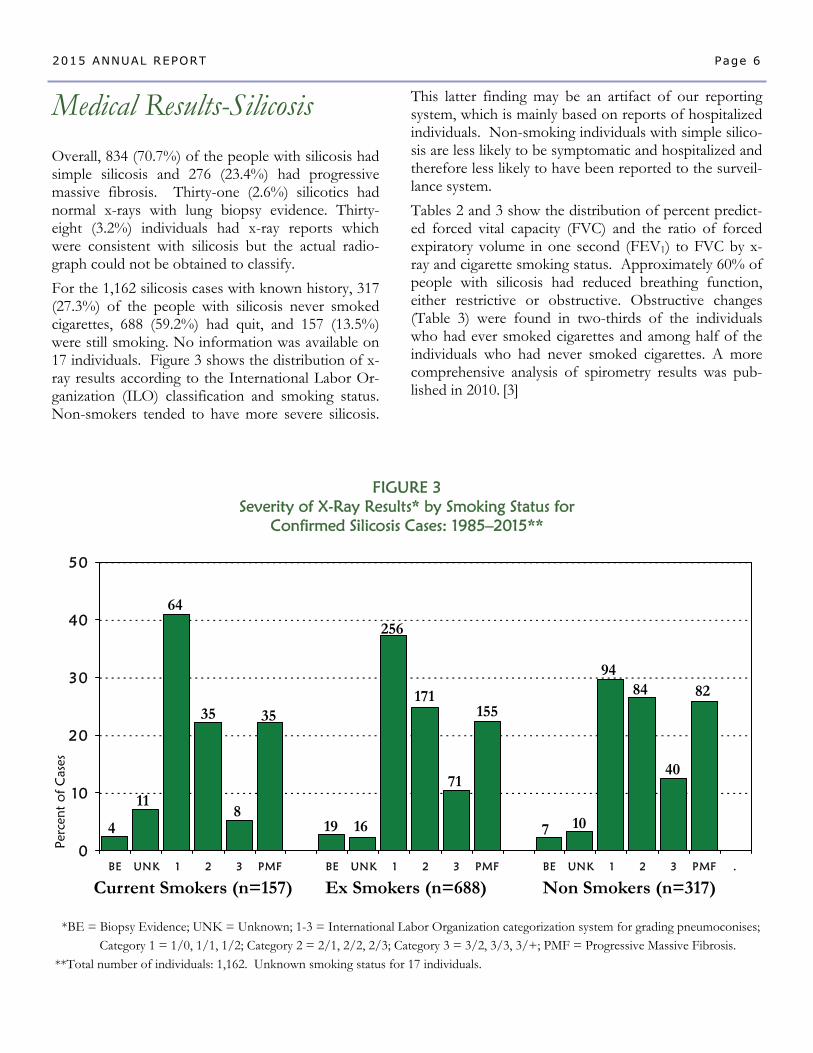
This latter finding may be an artifact of our reporting system, which is mainly based on reports of hospitalized individuals. Non-smoking individuals with simple silico-sis are less likely to be symptomatic and hospitalized and therefore less likely to have been reported to the surveil-lance system.
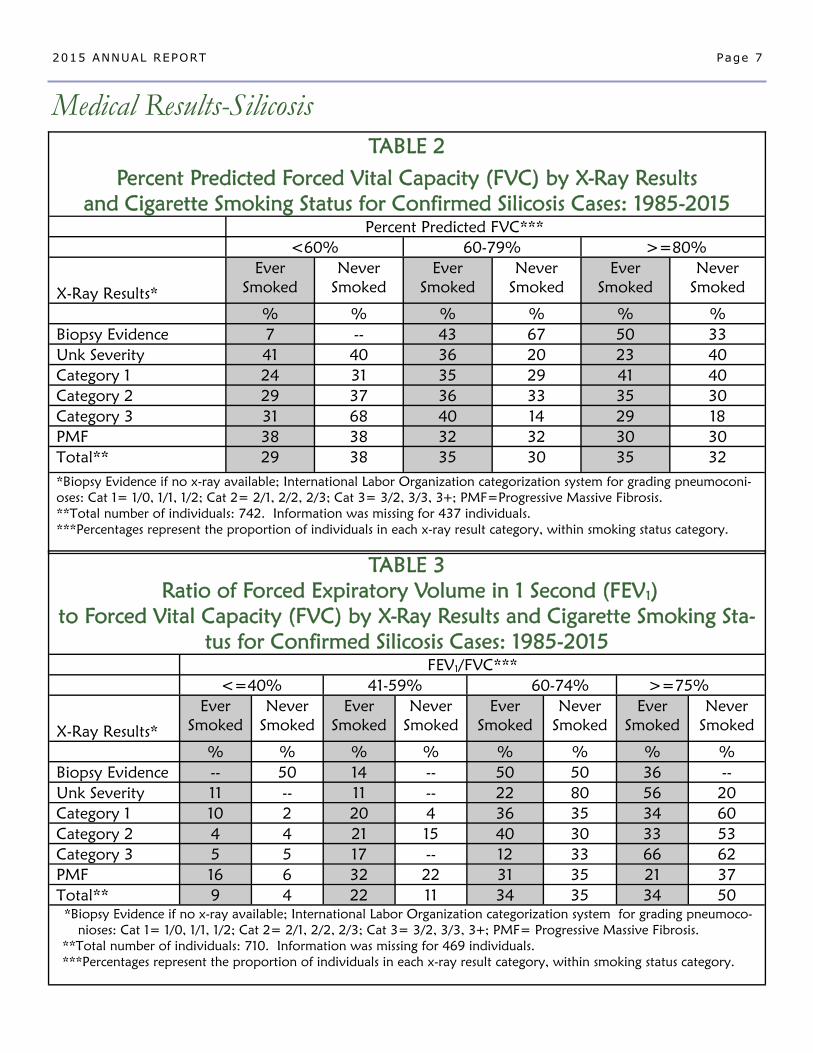
Tables 2 and 3 show the distribution of percent predict-ed forced vital capacity (FVC) and the ratio of forced expiratory volume in one second (FEV1) to FVC by x-ray and cigarette smoking status. Approximately 60% of people with silicosis had reduced breathing function, either restrictive or obstructive. Obstructive changes (Table 3) were found in two-thirds of the individuals who had ever smoked cigarettes and among half of the individuals who had never smoked cigarettes. A more comprehensive analysis of spirometry results was pub-lished in 2010. [3]
Overall, 834 (70.7%) of the people with silicosis had simple silicosis and 276 (23.4%) had progressive massive fibrosis. Thirty-one (2.6%) silicotics had normal x-rays with lung biopsy evidence. Thirty-eight (3.2%) individuals had x-ray reports which were consistent with silicosis but the actual radio-graph could not be obtained to classify.
For the 1,162 silicosis cases with known history, 317(27.3%) of the people with silicosis never smoked cigarettes, 688 (59.2%) had quit, and 157 (13.5%) were still smoking. No information was available on 17 individuals. Figure 3 shows the distribution of x-ray results according to the International Labor Or-ganization (ILO) classification and smoking status. Non-smokers tended to have more severe silicosis.
Medical Results-Silicosis
Page 6 2015 ANNUAL REPORT
0
10
20
30
40
50
BE UNK 1 2 3 PMF BE UNK 1 2 3 PMF BE UNK 1 2 3 PMF .
FIGURE 3 Severity of X-Ray Results* by Smoking Status for
Confirmed Silicosis Cases: 1985–2015**
Perc
ent
of
Cas
es
*BE = Biopsy Evidence; UNK = Unknown; 1-3 = International Labor Organization categorization system for grading pneumoconises; Category 1 = 1/0, 1/1, 1/2; Category 2 = 2/1, 2/2, 2/3; Category 3 = 3/2, 3/3, 3/+; PMF = Progressive Massive Fibrosis.
**Total number of individuals: 1,162. Unknown smoking status for 17 individuals.
Current Smokers (n=157) Ex Smokers (n=688) Non Smokers (n=317)
4
11
64
35
8
35
19 16
256
171
71
155
7 10
94 84
40
82
Medical Results-Silicosis
Page 7 2015 ANNUAL REPORT
TABLE 2
Percent Predicted Forced Vital Capacity (FVC) by X-Ray Results and Cigarette Smoking Status for Confirmed Silicosis Cases: 1985-2015
Percent Predicted FVC***
<60% 60-79% >=80%
X-Ray Results*
Ever Smoked
Never Smoked
Ever Smoked
Never Smoked
Ever Smoked
Never Smoked
% % % % % %
Biopsy Evidence 7 -- 43 67 50 33
Unk Severity 41 40 36 20 23 40
Category 1 24 31 35 29 41 40
Category 2 29 37 36 33 35 30
Category 3 31 68 40 14 29 18
PMF 38 38 32 32 30 30
Total** 29 38 35 30 35 32
*Biopsy Evidence if no x-ray available; International Labor Organization categorization system for grading pneumoconi-oses: Cat 1= 1/0, 1/1, 1/2; Cat 2= 2/1, 2/2, 2/3; Cat 3= 3/2, 3/3, 3+; PMF=Progressive Massive Fibrosis. **Total number of individuals: 742. Information was missing for 437 individuals. ***Percentages represent the proportion of individuals in each x-ray result category, within smoking status category.
TABLE 3
Ratio of Forced Expiratory Volume in 1 Second (FEV1)
to Forced Vital Capacity (FVC) by X-Ray Results and Cigarette Smoking Sta-tus for Confirmed Silicosis Cases: 1985-2015
FEV1/FVC***
<=40% 41-59% 60-74% >=75%
X-Ray Results*
Ever
Smoked
Never Smoked
Ever Smoked
Never Smoked
Ever Smoked
Never
Smoked
Ever
Smoked
Never
Smoked
% % % % % % % %
Biopsy Evidence -- 50 14 -- 50 50 36 -- Unk Severity 11 -- 11 -- 22 80 56 20
Category 1 10 2 20 4 36 35 34 60
Category 2 4 4 21 15 40 30 33 53
Category 3 5 5 17 -- 12 33 66 62
PMF 16 6 32 22 31 35 21 37
Total** 9 4 22 11 34 35 34 50 *Biopsy Evidence if no x-ray available; International Labor Organization categorization system for grading pneumoco- nioses: Cat 1= 1/0, 1/1, 1/2; Cat 2= 2/1, 2/2, 2/3; Cat 3= 3/2, 3/3, 3+; PMF= Progressive Massive Fibrosis. **Total number of individuals: 710. Information was missing for 469 individuals. ***Percentages represent the proportion of individuals in each x-ray result category, within smoking status category.
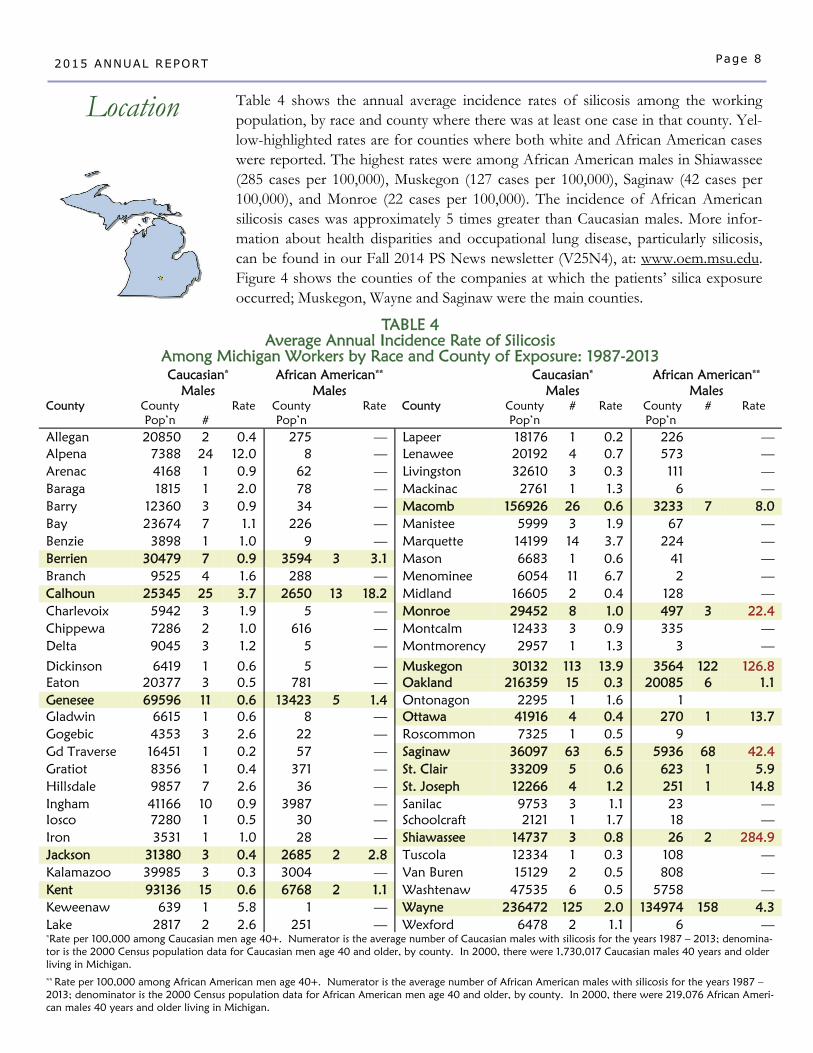
TABLE 4 Average Annual Incidence Rate of Silicosis
Among Michigan Workers by Race and County of Exposure: 1987-2013 Caucasian*
Males African American**
Males Caucasian*
Males African American**
Males County County
Pop’n #
Rate County Pop’n
Rate County County Pop’n
# Rate County Pop’n
# Rate
Allegan 20850 2 0.4 275 — Lapeer 18176 1 0.2 226 — Alpena 7388 24 12.0 8 — Lenawee 20192 4 0.7 573 — Arenac 4168 1 0.9 62 — Livingston 32610 3 0.3 111 — Baraga 1815 1 2.0 78 — Mackinac 2761 1 1.3 6 — Barry 12360 3 0.9 34 — Macomb 156926 26 0.6 3233 7 8.0 Bay 23674 7 1.1 226 — Manistee 5999 3 1.9 67 — Benzie 3898 1 1.0 9 — Marquette 14199 14 3.7 224 — Berrien 30479 7 0.9 3594 3 3.1 Mason 6683 1 0.6 41 — Branch 9525 4 1.6 288 — Menominee 6054 11 6.7 2 — Calhoun 25345 25 3.7 2650 13 18.2 Midland 16605 2 0.4 128 — Charlevoix 5942 3 1.9 5 — Monroe 29452 8 1.0 497 3 22.4 Chippewa 7286 2 1.0 616 — Montcalm 12433 3 0.9 335 — Delta 9045 3 1.2 5 — Montmorency 2957 1 1.3 3 —
Dickinson 6419 1 0.6 5 — Muskegon 30132 113 13.9 3564 122 126.8 Eaton 20377 3 0.5 781 — Oakland 216359 15 0.3 20085 6 1.1 Genesee 69596 11 0.6 13423 5 1.4 Ontonagon 2295 1 1.6 1 Gladwin 6615 1 0.6 8 — Ottawa 41916 4 0.4 270 1 13.7 Gogebic 4353 3 2.6 22 — Roscommon 7325 1 0.5 9 Gd Traverse 16451 1 0.2 57 — Saginaw 36097 63 6.5 5936 68 42.4 Gratiot 8356 1 0.4 371 — St. Clair 33209 5 0.6 623 1 5.9 Hillsdale 9857 7 2.6 36 — St. Joseph 12266 4 1.2 251 1 14.8 Ingham 41166 10 0.9 3987 — Sanilac 9753 3 1.1 23 — Iosco 7280 1 0.5 30 — Schoolcraft 2121 1 1.7 18 — Iron 3531 1 1.0 28 — Shiawassee 14737 3 0.8 26 2 284.9 Jackson 31380 3 0.4 2685 2 2.8 Tuscola 12334 1 0.3 108 — Kalamazoo 39985 3 0.3 3004 — Van Buren 15129 2 0.5 808 — Kent 93136 15 0.6 6768 2 1.1 Washtenaw 47535 6 0.5 5758 — Keweenaw 639 1 5.8 1 — Wayne 236472 125 2.0 134974 158 4.3 Lake 2817 2 2.6 251 — Wexford 6478 2 1.1 6 — *Rate per 100,000 among Caucasian men age 40+. Numerator is the average number of Caucasian males with silicosis for the years 1987 – 2013; denomina-tor is the 2000 Census population data for Caucasian men age 40 and older, by county. In 2000, there were 1,730,017 Caucasian males 40 years and older living in Michigan. ** Rate per 100,000 among African American men age 40+. Numerator is the average number of African American males with silicosis for the years 1987 – 2013; denominator is the 2000 Census population data for African American men age 40 and older, by county. In 2000, there were 219,076 African Ameri-can males 40 years and older living in Michigan.
Page 8 2015 ANNUAL REPORT
Location Table 4 shows the annual average incidence rates of silicosis among the working population, by race and county where there was at least one case in that county. Yel-low-highlighted rates are for counties where both white and African American cases were reported. The highest rates were among African American males in Shiawassee (285 cases per 100,000), Muskegon (127 cases per 100,000), Saginaw (42 cases per 100,000), and Monroe (22 cases per 100,000). The incidence of African American silicosis cases was approximately 5 times greater than Caucasian males. More infor-mation about health disparities and occupational lung disease, particularly silicosis, can be found in our Fall 2014 PS News newsletter (V25N4), at: www.oem.msu.edu. Figure 4 shows the counties of the companies at which the patients’ silica exposure occurred; Muskegon, Wayne and Saginaw were the main counties.
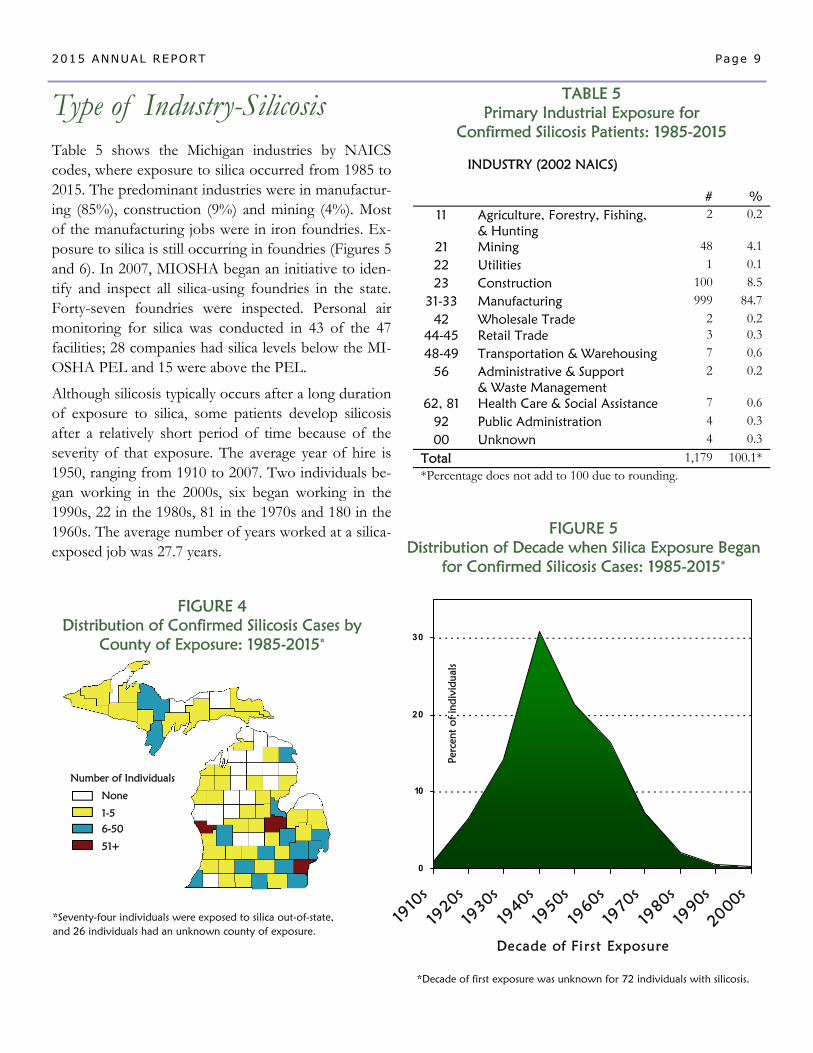
TABLE 5 Primary Industrial Exposure for
Confirmed Silicosis Patients: 1985-2015
INDUSTRY (2002 NAICS)
# % 11 Agriculture, Forestry, Fishing,
& Hunting 2 0.2
21 Mining 48 4.1
22 Utilities 1 0.1
23 Construction 100 8.5
31-33 Manufacturing 999 84.7
42 Wholesale Trade 2 0.2 44-45 Retail Trade 3 0.3
48-49 Transportation & Warehousing 7 0.6
56 Administrative & Support & Waste Management
2 0.2
62, 81 Health Care & Social Assistance 7 0.6
92 Public Administration 4 0.3
00 Unknown 4 0.3
Total 1,179 100.1* *Percentage does not add to 100 due to rounding.
FIGURE 4 Distribution of Confirmed Silicosis Cases by
County of Exposure: 1985-2015*
Type of Industry-Silicosis Table 5 shows the Michigan industries by NAICS codes, where exposure to silica occurred from 1985 to 2015. The predominant industries were in manufactur-ing (85%), construction (9%) and mining (4%). Most of the manufacturing jobs were in iron foundries. Ex-posure to silica is still occurring in foundries (Figures 5 and 6). In 2007, MIOSHA began an initiative to iden-tify and inspect all silica-using foundries in the state. Forty-seven foundries were inspected. Personal air monitoring for silica was conducted in 43 of the 47 facilities; 28 companies had silica levels below the MI-OSHA PEL and 15 were above the PEL.
Although silicosis typically occurs after a long duration of exposure to silica, some patients develop silicosis after a relatively short period of time because of the severity of that exposure. The average year of hire is 1950, ranging from 1910 to 2007. Two individuals be-gan working in the 2000s, six began working in the 1990s, 22 in the 1980s, 81 in the 1970s and 180 in the 1960s. The average number of years worked at a silica-exposed job was 27.7 years.
Page 9 2015 ANNUAL REPORT
*Seventy-four individuals were exposed to silica out-of-state, and 26 individuals had an unknown county of exposure.
Number of Individuals
None
1-5
6-50
51+
0
10
20
30
1910
s
1920s
1930s
1940s
1950s
1960s
1970s
1980s
1990s
2000s
Decade of First Exposure
FIGURE 5 Distribution of Decade when Silica Exposure Began
for Confirmed Silicosis Cases: 1985-2015*
*Decade of first exposure was unknown for 72 individuals with silicosis.
Perc
ent
of
indi
vidu
als
Page 10 2015 ANNUAL REPORT
The 1,179 individuals with silicosis were exposed to silica in 482 facilities (Table 6). There were no silica-related inspec-tions conducted in 2015. Since 1988, in-spections were performed by MIOSHA at 89 (18.5%) of the 482 facilities associ-ated with silicosis cases. One hundred fifty-three (31.7%) facilities were no long-er in operation, 68 (14.1%) were located out of state, 27 (5.6%) facilities no longer used silica, 72 (14.9%) workplaces were in the construction industry, eight (1.7%) were covered by the Mine Safety and Health Administration jurisdiction, and for 64 (13.3%), the specific location where the silica exposure occurred was unknown. There is one facility scheduled for inspection.
Air sampling for silica was conducted in 63 of the 89 facilities inspected (Table 7). Thirty-seven of 63 (58.7%) facilities were above the National Institute for Occupa-tional Safety and Health (NIOSH) rec-ommended exposure limit for silica. Twenty-three of the 63 (36.5%) were above the enforceable MIOSHA permis-sible exposure limit (PEL) for silica. An-other two (3.2%) companies were above the MIOSHA standard for beryllium and one company was above the MIOSHA standard for silica and silver.
Only eight of the 71 (11.3%) facilities where the medical surveillance program was evaluated provided medical screening for silicosis for its workers that included a periodic chest x-ray interpreted by a "B" certified reader. Three (4.2%) companies provided periodic chest x-rays that were not interpreted by a "B" certified reader. Twenty-one (29.6%) only performed pre-employment testing, 27 (38.0%) provided no medical surveillance, and 18 (25.4%) performed annual or biennial pulmonary function testing without chest x-rays.
Industrial Hygiene Results-Silicosis
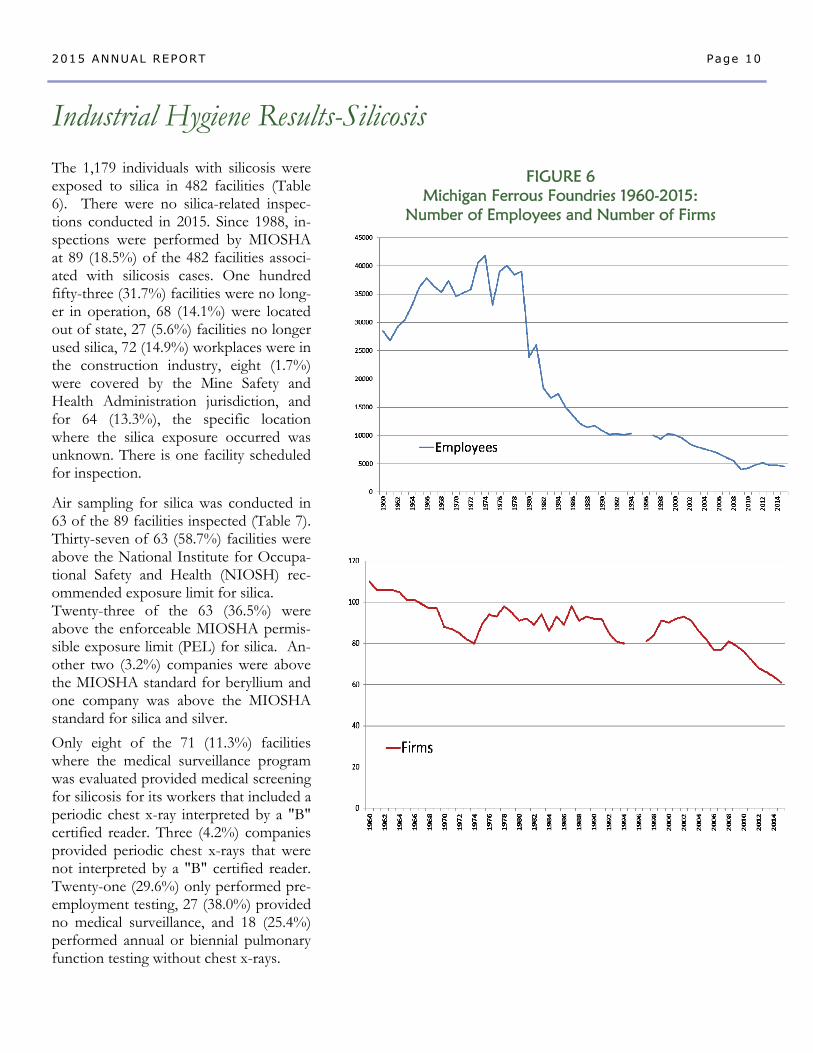
FIGURE 6 Michigan Ferrous Foundries 1960-2015:
Number of Employees and Number of Firms
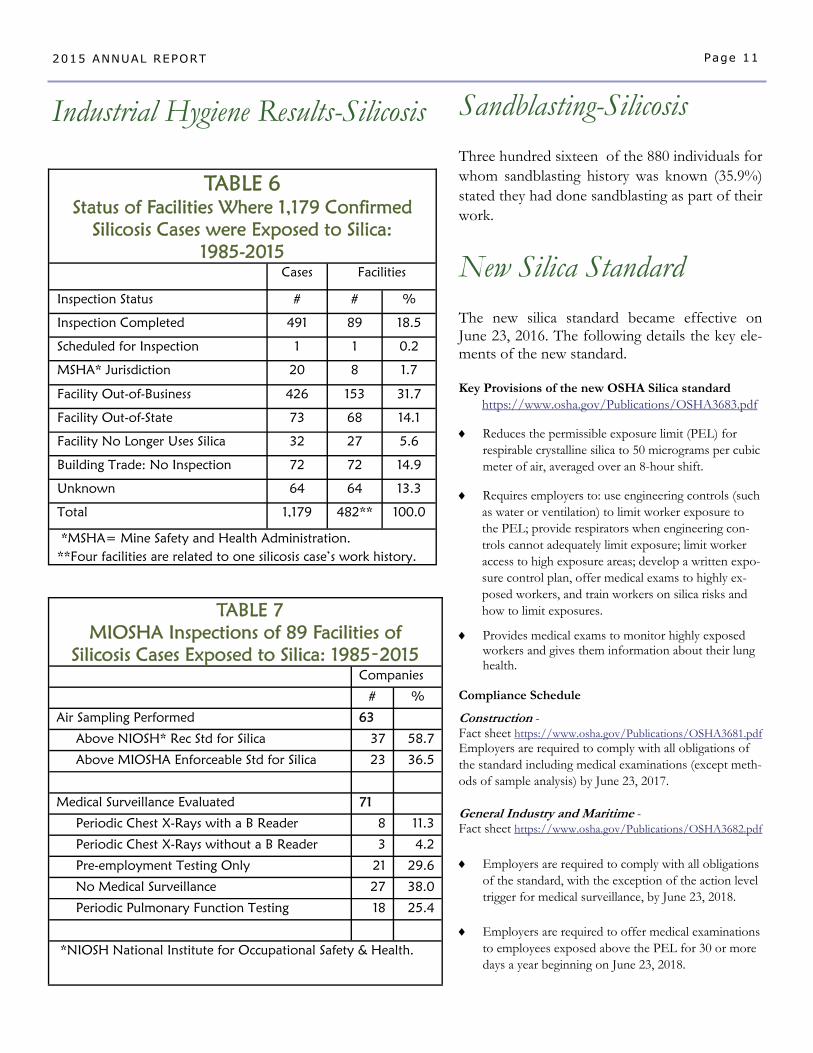
Three hundred sixteen of the 880 individuals for whom sandblasting history was known (35.9%) stated they had done sandblasting as part of their work.
Sandblasting-Silicosis
Page 11 2015 ANNUAL REPORT
Industrial Hygiene Results-Silicosis
TABLE 6
Status of Facilities Where 1,179 Confirmed Silicosis Cases were Exposed to Silica:
1985-2015 Cases Facilities
Inspection Status # # %
Inspection Completed 491 89 18.5
Scheduled for Inspection 1 1 0.2
MSHA* Jurisdiction 20 8 1.7
Facility Out-of-Business 426 153 31.7
Facility Out-of-State 73 68 14.1
Facility No Longer Uses Silica 32 27 5.6
Building Trade: No Inspection 72 72 14.9
Unknown 64 64 13.3
Total 1,179 482** 100.0
*MSHA= Mine Safety and Health Administration. **Four facilities are related to one silicosis case’s work history.
TABLE 7 MIOSHA Inspections of 89 Facilities of
Silicosis Cases Exposed to Silica: 1985‑2015 Companies
# %
Air Sampling Performed 63
Above NIOSH* Rec Std for Silica 37 58.7
Above MIOSHA Enforceable Std for Silica 23 36.5
Medical Surveillance Evaluated 71
Periodic Chest X-Rays with a B Reader 8 11.3
Periodic Chest X-Rays without a B Reader 3 4.2
Pre-employment Testing Only 21 29.6
No Medical Surveillance 27 38.0
Periodic Pulmonary Function Testing 18 25.4
*NIOSH National Institute for Occupational Safety & Health.
New Silica Standard
The new silica standard became effective on June 23, 2016. The following details the key ele-ments of the new standard. Key Provisions of the new OSHA Silica standard
https://www.osha.gov/Publications/OSHA3683.pdf
Reduces the permissible exposure limit (PEL) for respirable crystalline silica to 50 micrograms per cubic meter of air, averaged over an 8-hour shift.
Requires employers to: use engineering controls (such as water or ventilation) to limit worker exposure to the PEL; provide respirators when engineering con-trols cannot adequately limit exposure; limit worker access to high exposure areas; develop a written expo-sure control plan, offer medical exams to highly ex-posed workers, and train workers on silica risks and how to limit exposures.
Provides medical exams to monitor highly exposed workers and gives them information about their lung health.
Compliance Schedule
Construction - Fact sheet https://www.osha.gov/Publications/OSHA3681.pdf Employers are required to comply with all obligations of the standard including medical examinations (except meth-ods of sample analysis) by June 23, 2017. General Industry and Maritime - Fact sheet https://www.osha.gov/Publications/OSHA3682.pdf
Employers are required to comply with all obligations of the standard, with the exception of the action level trigger for medical surveillance, by June 23, 2018.
Employers are required to offer medical examinations
to employees exposed above the PEL for 30 or more days a year beginning on June 23, 2018.
Page 12 2015 ANNUAL REPORT
New Silica Standard , continued
General Industry and Maritime, continued -
Employers are required to offer medical examinations to employees exposed at or above the action level for 30 or more days a year beginning on June 23, 2020.
Hydraulic Fracturing Employers are required to comply with all obligations of the standard, except for engineering controls and the action level trigger for
medical surveillance, by June 23, 2018, except Engineering Controls, which have a compliance date of June 23, 2021. Employers are required to comply with requirements for engineering controls to limit exposures to the new PEL by June 23, 2021.
From June 23, 2018 through June 23, 2021, employers can continue to have employees wear respirators if their exposures exceed the PEL.
Employers are required to offer medical examinations to employees exposed above the PEL for 30 or more days beginning on June 23, 2018.
Employers are required to offer medical examinations to employees exposed at or above the action level for 30 or more days a year beginning on June 23, 2020.
Content of Medical Examination - Appendix B to § 1910.1053 – Medical Surveillance Guidelines https://www.osha.gov/silica/AppendixBtosect1910.1053.pdf
Medical and work history, with emphasis on: past, present, and anticipated exposure to respirable crystalline silica, dust, and other agents affecting the respiratory system; any history of respiratory system dysfunction, including signs and symptoms of respiratory disease (e.g., shortness of breath, cough, wheezing); history of TB; and smoking status and history.
Physical examination, with special emphasis on the respiratory system - Initial examination and every three years. TB testing - Initial examination. Spirometry - Initial examination and every three years. Must be administered by a spirometry technician with a current certificate
from a NIOSH approved course. PA radiograph of the chest at full inspiration - Initial examination and every three years. Must be interpreted and classified according
to the ILO International Classification of Radiographs by a NIOSH-certified B Reader. Additional testing the provider deems appropriate.
Requirements on Reporting Results of Medical Examination
Written medical report to employee within 30 days must include:
The results of the medical examination, including any medical condition(s) that would place the employee at increased risk of materi-al impairment to health from exposure to respirable crystalline silica and any medical conditions that require further evaluation or treatment;
Any recommended limitations upon the use of a respirator; Any recommended limitations on exposure to respirable crystalline silica; A statement that the employee should be examined by a Board Certified Specialist in Pulmonary Disease or Occupational Medicine,
where the B reading is 1/0 or higher for rounded opacities or where the PLHCP has determined such a referral is necessary.
Written medical report to employer within 30 days must include:
Date of the examination; A statement that the examination has met the requirements of this section; and Any recommended limitations on the employee’s use of a respirator.
Page 13 2015 ANNUAL REPORT
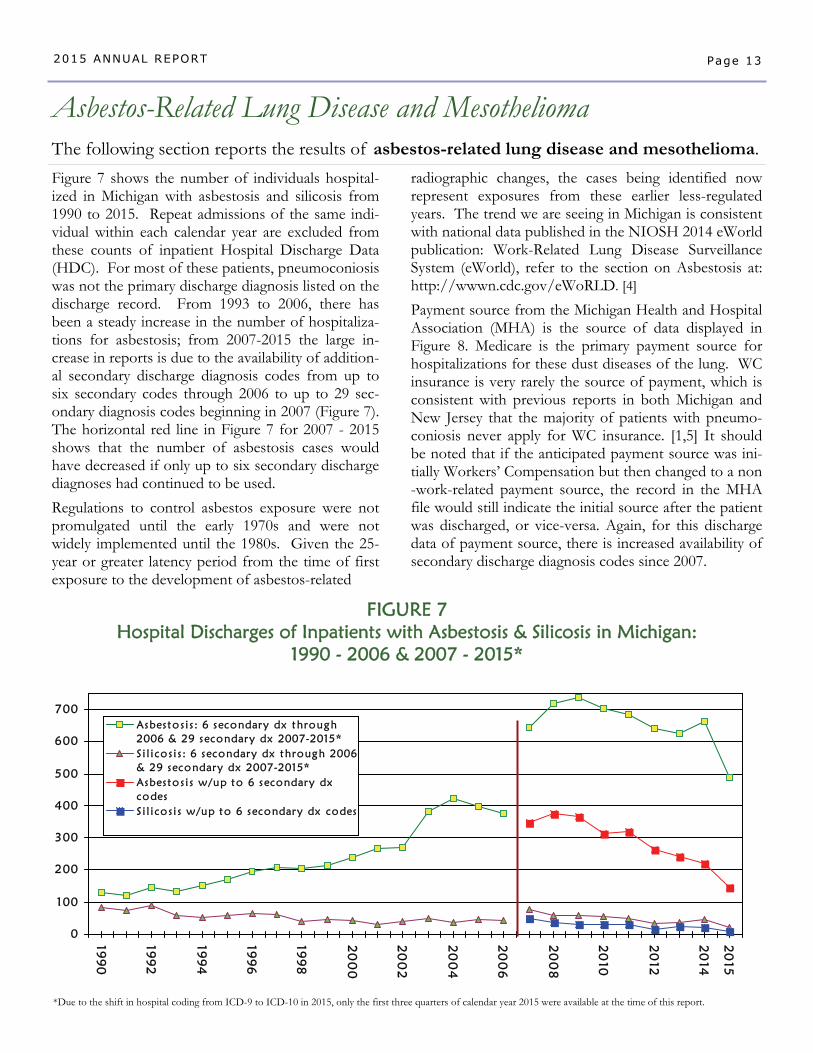
Figure 7 shows the number of individuals hospital-ized in Michigan with asbestosis and silicosis from 1990 to 2015. Repeat admissions of the same indi-vidual within each calendar year are excluded from these counts of inpatient Hospital Discharge Data (HDC). For most of these patients, pneumoconiosis was not the primary discharge diagnosis listed on the discharge record. From 1993 to 2006, there has been a steady increase in the number of hospitaliza-tions for asbestosis; from 2007-2015 the large in-crease in reports is due to the availability of addition-al secondary discharge diagnosis codes from up to six secondary codes through 2006 to up to 29 sec-ondary diagnosis codes beginning in 2007 (Figure 7). The horizontal red line in Figure 7 for 2007 - 2015 shows that the number of asbestosis cases would have decreased if only up to six secondary discharge diagnoses had continued to be used.
Regulations to control asbestos exposure were not promulgated until the early 1970s and were not widely implemented until the 1980s. Given the 25-year or greater latency period from the time of first exposure to the development of asbestos-related
Asbestos-Related Lung Disease and Mesothelioma
The following section reports the results of asbestos-related lung disease and mesothelioma.
radiographic changes, the cases being identified now represent exposures from these earlier less-regulated years. The trend we are seeing in Michigan is consistent with national data published in the NIOSH 2014 eWorld publication: Work-Related Lung Disease Surveillance System (eWorld), refer to the section on Asbestosis at: http://wwwn.cdc.gov/eWoRLD. [4]
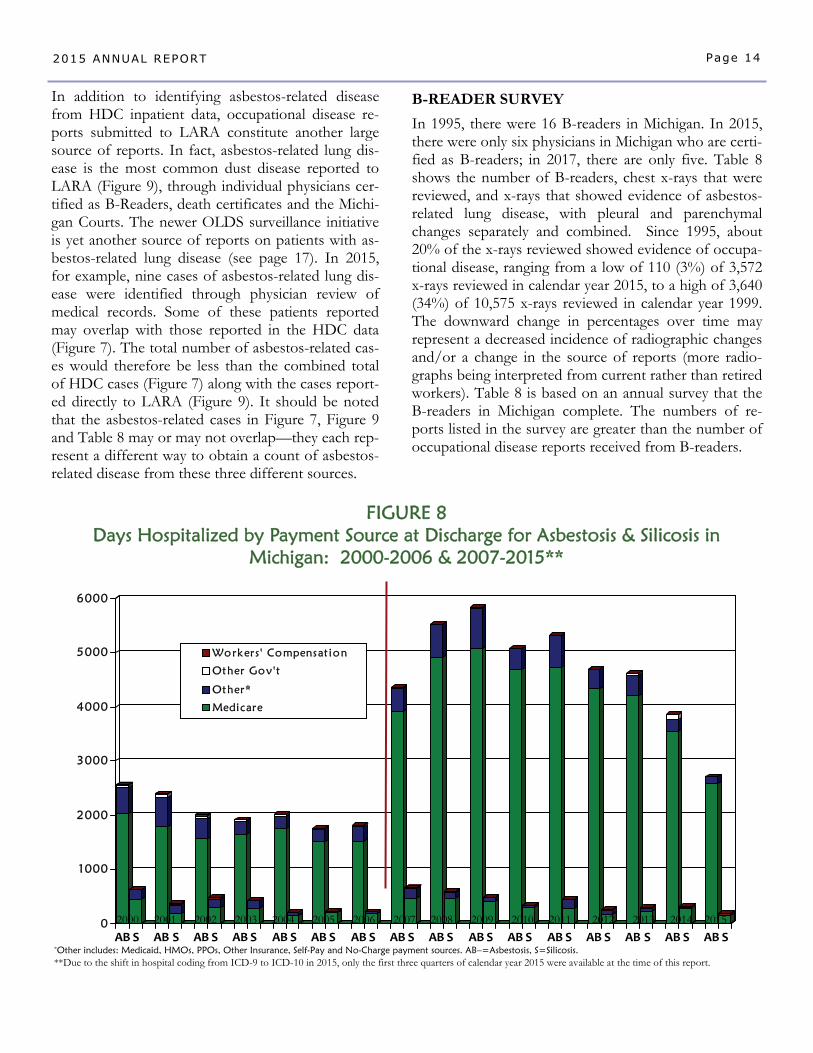
Payment source from the Michigan Health and Hospital Association (MHA) is the source of data displayed in Figure 8. Medicare is the primary payment source for hospitalizations for these dust diseases of the lung. WC insurance is very rarely the source of payment, which is consistent with previous reports in both Michigan and New Jersey that the majority of patients with pneumo-coniosis never apply for WC insurance. [1,5] It should be noted that if the anticipated payment source was ini-tially Workers’ Compensation but then changed to a non-work-related payment source, the record in the MHA file would still indicate the initial source after the patient was discharged, or vice-versa. Again, for this discharge data of payment source, there is increased availability of secondary discharge diagnosis codes since 2007.
0
100
200
300
400
500
600
70019
90
199
2
199
4
199
6
199
8
20
00
20
02
20
04
20
06
20
08
20
10
20
12
20
14
20
15
Asbesto s i s : 6 secondary dx through2006 & 29 secondary dx 2007-2015*S i l i cos i s : 6 secondary dx through 2006& 29 secondary dx 2007-2015*Asbesto s i s w/up to 6 secondary dxcodesS i l i cos i s w/up to 6 secondary dx codes
FIGURE 7 Hospital Discharges of Inpatients with Asbestosis & Silicosis in Michigan:
1990 - 2006 & 2007 - 2015*
*Due to the shift in hospital coding from ICD-9 to ICD-10 in 2015, only the first three quarters of calendar year 2015 were available at the time of this report.
Page 14 2015 ANNUAL REPORT
0
1000
2000
3000
4000
5000
6000
AB S AB S AB S ABS AB S AB S AB S AB S AB S ABS AB S AB S AB S AB S AB S AB S
Workers ' Compensat ion
Other Gov't
Other*
Medicare
2000 2001 2002 2003 2004 2005 2006 2007 2008 2009 2010 2011 2012 2013 2014 2015
*Other includes: Medicaid, HMOs, PPOs, Other Insurance, Self-Pay and No-Charge payment sources. AB–=Asbestosis, S=Silicosis. **Due to the shift in hospital coding from ICD-9 to ICD-10 in 2015, only the first three quarters of calendar year 2015 were available at the time of this report.
In addition to identifying asbestos-related disease from HDC inpatient data, occupational disease re-ports submitted to LARA constitute another large source of reports. In fact, asbestos-related lung dis-ease is the most common dust disease reported to LARA (Figure 9), through individual physicians cer-tified as B-Readers, death certificates and the Michi-gan Courts. The newer OLDS surveillance initiative is yet another source of reports on patients with as-bestos-related lung disease (see page 17). In 2015, for example, nine cases of asbestos-related lung dis-ease were identified through physician review of medical records. Some of these patients reported may overlap with those reported in the HDC data (Figure 7). The total number of asbestos-related cas-es would therefore be less than the combined total of HDC cases (Figure 7) along with the cases report-ed directly to LARA (Figure 9). It should be noted that the asbestos-related cases in Figure 7, Figure 9 and Table 8 may or may not overlap—they each rep-resent a different way to obtain a count of asbestos-related disease from these three different sources.
FIGURE 8 Days Hospitalized by Payment Source at Discharge for Asbestosis & Silicosis in
Michigan: 2000-2006 & 2007-2015**
B-READER SURVEY
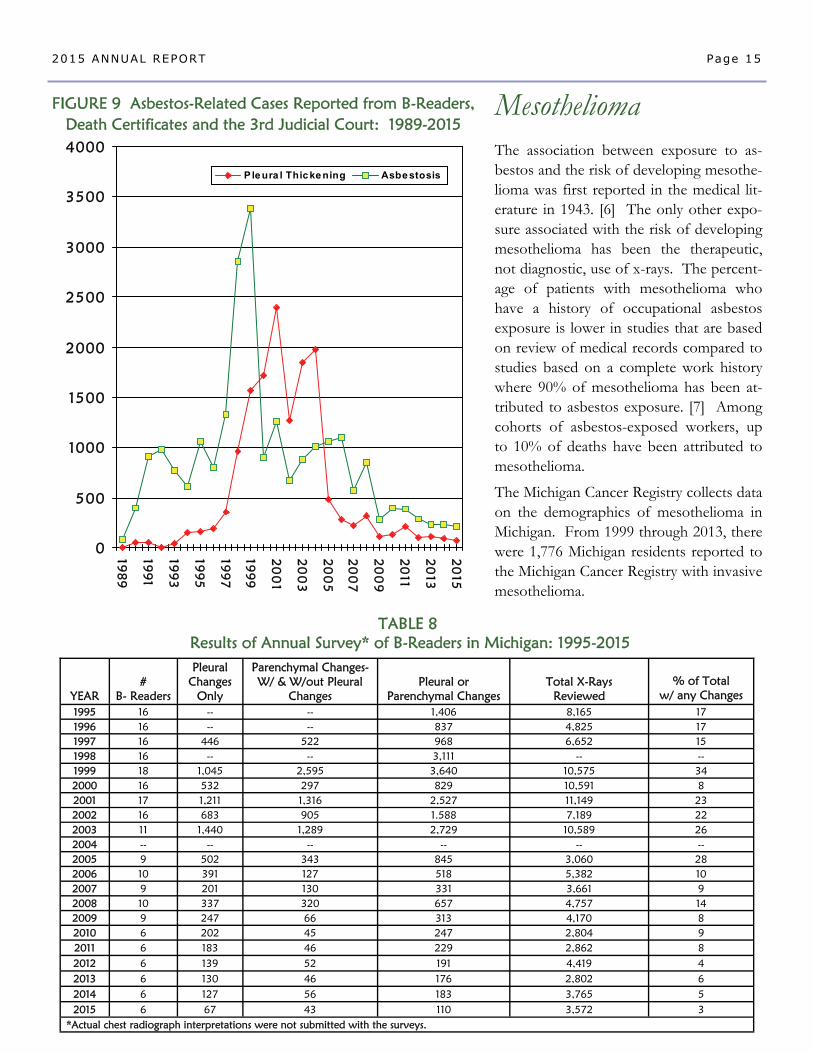
In 1995, there were 16 B-readers in Michigan. In 2015, there were only six physicians in Michigan who are certi-fied as B-readers; in 2017, there are only five. Table 8 shows the number of B-readers, chest x-rays that were reviewed, and x-rays that showed evidence of asbestos-related lung disease, with pleural and parenchymal changes separately and combined. Since 1995, about 20% of the x-rays reviewed showed evidence of occupa-tional disease, ranging from a low of 110 (3%) of 3,572 x-rays reviewed in calendar year 2015, to a high of 3,640 (34%) of 10,575 x-rays reviewed in calendar year 1999. The downward change in percentages over time may represent a decreased incidence of radiographic changes and/or a change in the source of reports (more radio-graphs being interpreted from current rather than retired workers). Table 8 is based on an annual survey that the B-readers in Michigan complete. The numbers of re-ports listed in the survey are greater than the number of occupational disease reports received from B-readers.
Page 15 2015 ANNUAL REPORT
The association between exposure to as-bestos and the risk of developing mesothe-lioma was first reported in the medical lit-erature in 1943. [6] The only other expo-sure associated with the risk of developing mesothelioma has been the therapeutic, not diagnostic, use of x-rays. The percent-age of patients with mesothelioma who have a history of occupational asbestos exposure is lower in studies that are based on review of medical records compared to studies based on a complete work history where 90% of mesothelioma has been at-tributed to asbestos exposure. [7] Among cohorts of asbestos-exposed workers, up to 10% of deaths have been attributed to mesothelioma.
The Michigan Cancer Registry collects data on the demographics of mesothelioma in Michigan. From 1999 through 2013, there were 1,776 Michigan residents reported to the Michigan Cancer Registry with invasive mesothelioma.
0
500
1000
1500
2000
2500
3000
3500
4000
198
9
199
1
199
3
199
5
199
7
199
9
20
01
20
03
20
05
20
07
20
09
20
11
20
13
20
15
Ple ura l Thic ke ning Asbe stosis
FIGURE 9 Asbestos-Related Cases Reported from B-Readers, Death Certificates and the 3rd Judicial Court: 1989-2015
YEAR
#
B- Readers
Pleural Changes
Only
Parenchymal Changes- W/ & W/out Pleural
Changes
Pleural or
Parenchymal Changes
Total X-Rays
Reviewed
% of Total
w/ any Changes 1995 16 -- -- 1,406 8,165 17 1996 16 -- -- 837 4,825 17 1997 16 446 522 968 6,652 15 1998 16 -- -- 3,111 -- -- 1999 18 1,045 2,595 3,640 10,575 34 2000 16 532 297 829 10,591 8 2001 17 1,211 1,316 2,527 11,149 23 2002 16 683 905 1.588 7,189 22 2003 11 1,440 1,289 2,729 10,589 26 2004 -- -- -- -- -- -- 2005 9 502 343 845 3,060 28 2006 10 391 127 518 5,382 10 2007 9 201 130 331 3,661 9 2008 10 337 320 657 4,757 14 2009 9 247 66 313 4,170 8 2010 6 202 45 247 2,804 9 2011 6 183 46 229 2,862 8 2012 6 139 52 191 4,419 4
*Actual chest radiograph interpretations were not submitted with the surveys.
2013 6 130 46 176 2,802 6 2014 6 127 56 183 3,765 5 2015 6 67 43 110 3,572 3
TABLE 8 Results of Annual Survey* of B-Readers in Michigan: 1995-2015
Mesothelioma
0
20
40
60
80
100
19851987
19891991
19931995
19971999
20012003
20052007
20092011
2013
Men
Women
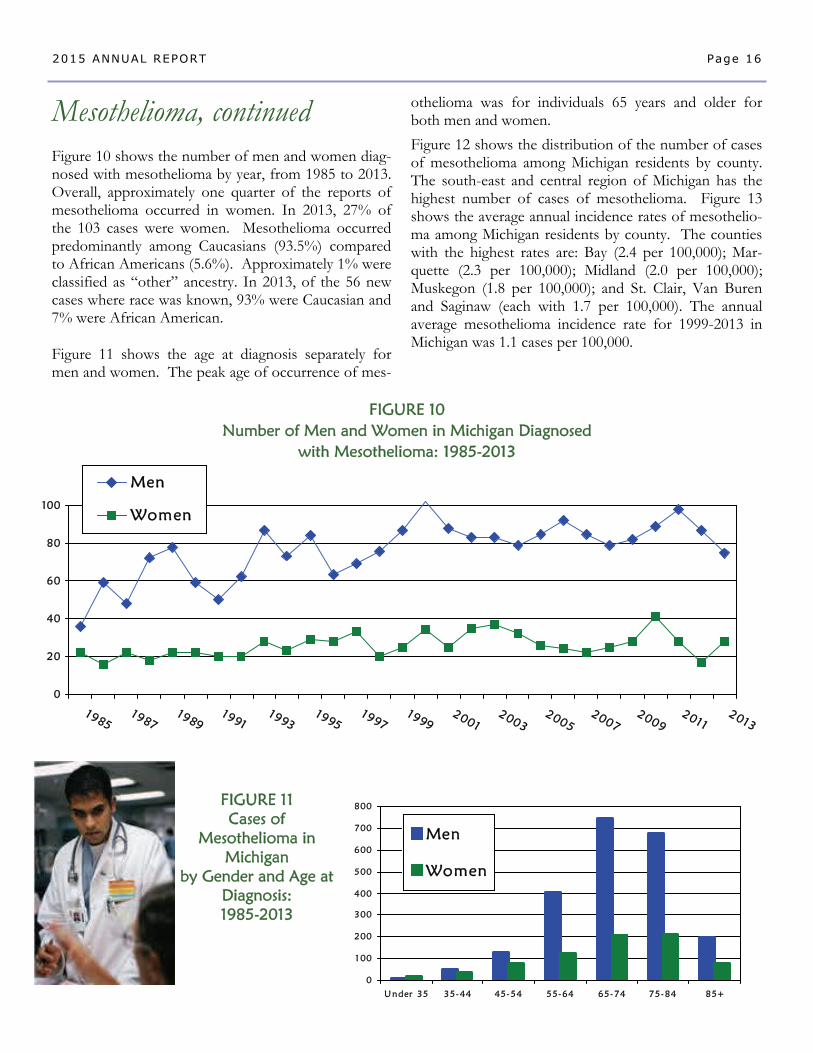
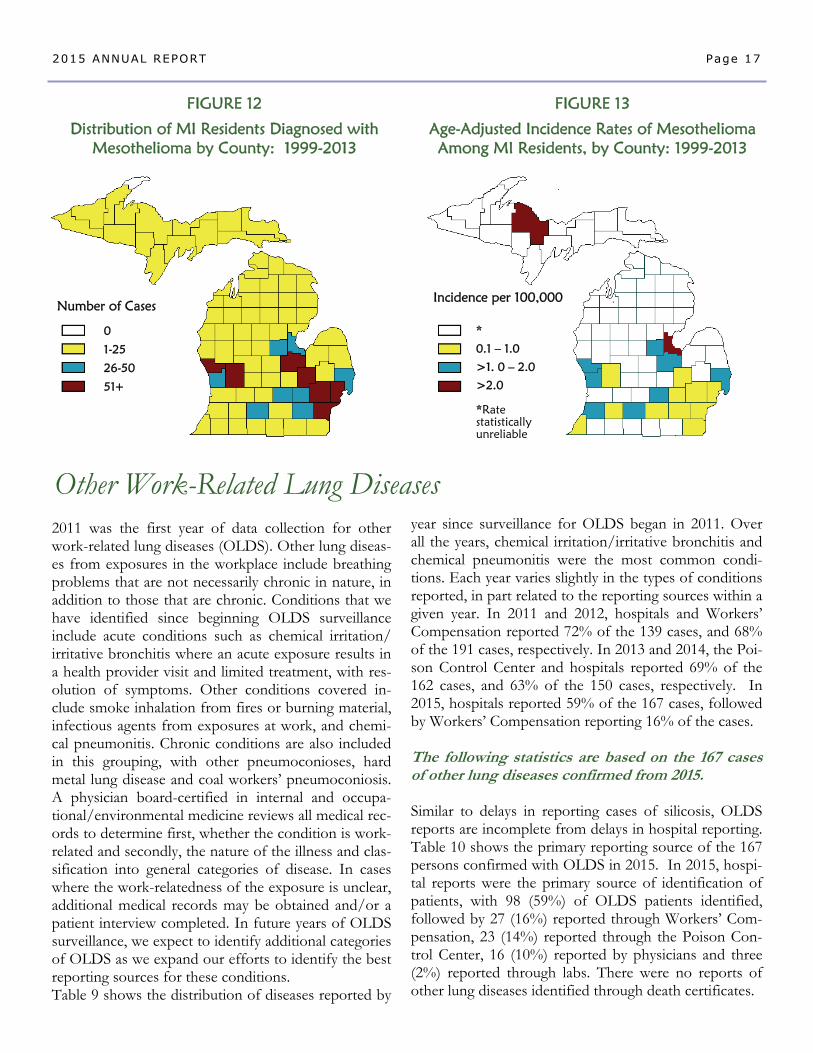
Mesothelioma, continued Figure 10 shows the number of men and women diag-nosed with mesothelioma by year, from 1985 to 2013. Overall, approximately one quarter of the reports of mesothelioma occurred in women. In 2013, 27% of the 103 cases were women. Mesothelioma occurred predominantly among Caucasians (93.5%) compared to African Americans (5.6%). Approximately 1% were classified as “other” ancestry. In 2013, of the 56 new cases where race was known, 93% were Caucasian and 7% were African American. Figure 11 shows the age at diagnosis separately for men and women. The peak age of occurrence of mes-
Page 16 2015 ANNUAL REPORT
othelioma was for individuals 65 years and older for both men and women.
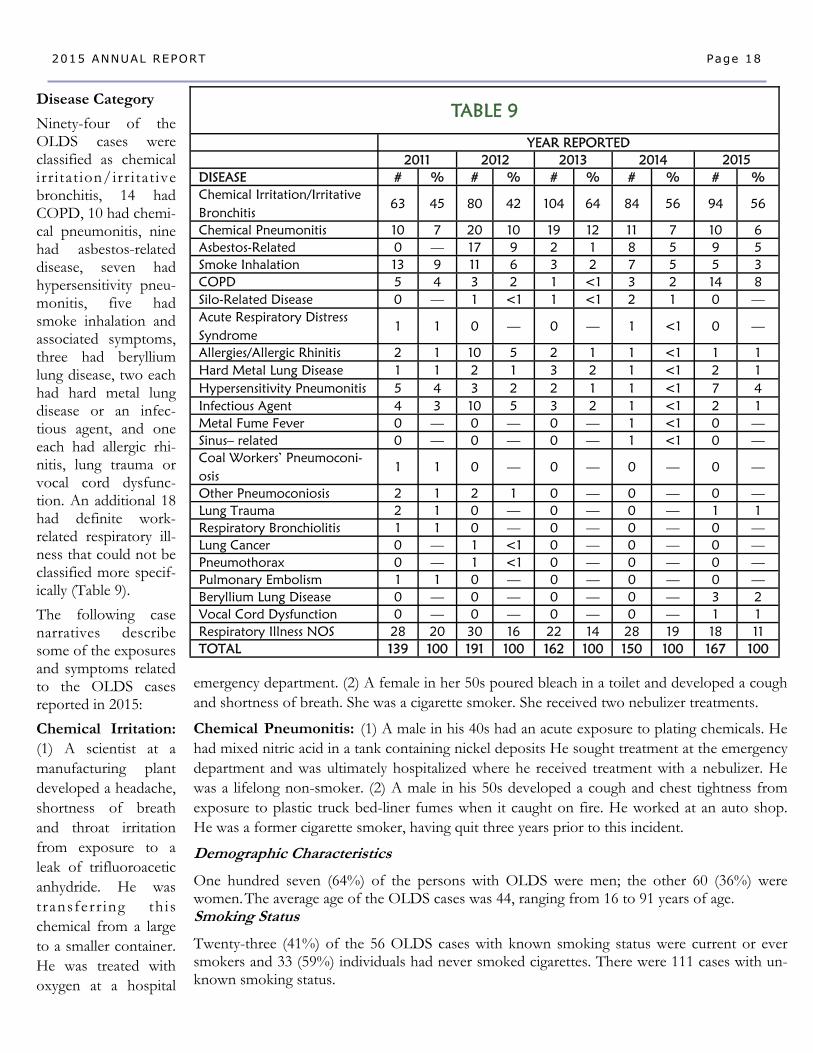
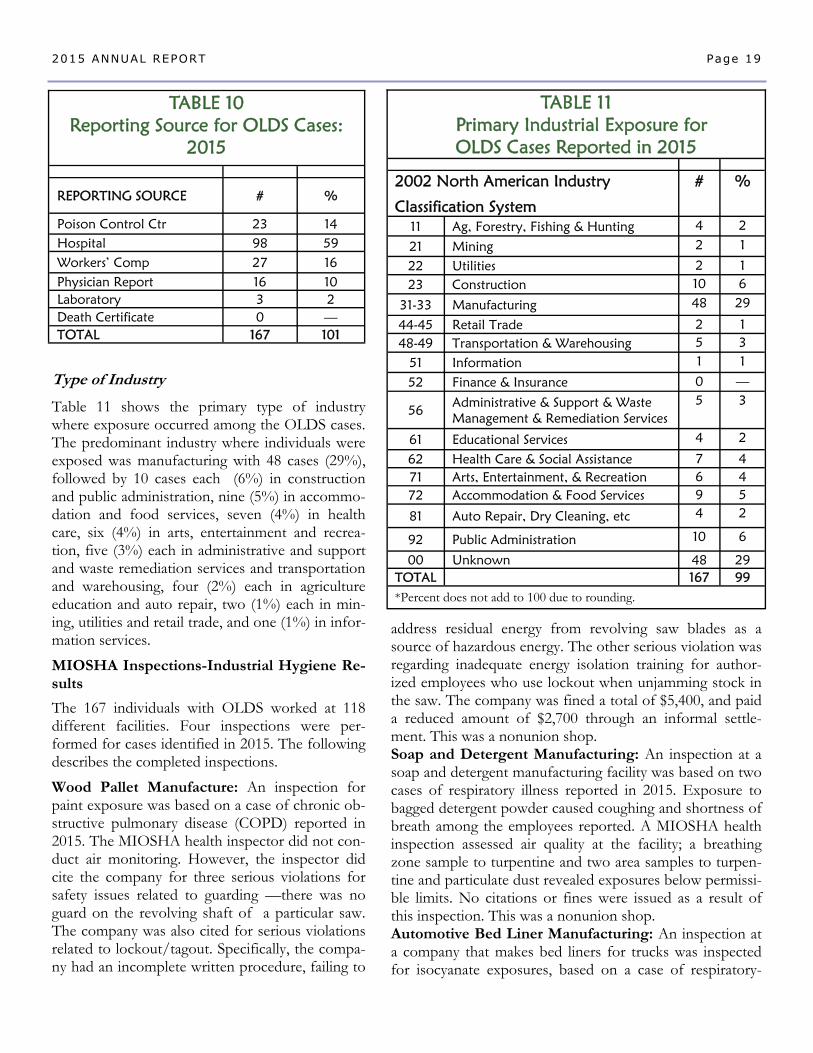
Figure 12 shows the distribution of the number of cases of mesothelioma among Michigan residents by county. The south-east and central region of Michigan has the highest number of cases of mesothelioma. Figure 13 shows the average annual incidence rates of mesothelio-ma among Michigan residents by county. The counties with the highest rates are: Bay (2.4 per 100,000); Mar-quette (2.3 per 100,000); Midland (2.0 per 100,000); Muskegon (1.8 per 100,000); and St. Clair, Van Buren and Saginaw (each with 1.7 per 100,000). The annual average mesothelioma incidence rate for 1999-2013 in Michigan was 1.1 cases per 100,000.
FIGURE 10 Number of Men and Women in Michigan Diagnosed
with Mesothelioma: 1985-2013
FIGURE 11 Cases of
Mesothelioma in Michigan
by Gender and Age at Diagnosis: 1985-2013
0
1 00
200
300
400
500
600
700
800
Under 35 35-44 45-54 55-64 65-74 75-84 85+
Men
Women
2011 was the first year of data collection for other work-related lung diseases (OLDS). Other lung diseas-es from exposures in the workplace include breathing problems that are not necessarily chronic in nature, in addition to those that are chronic. Conditions that we have identified since beginning OLDS surveillance include acute conditions such as chemical irritation/irritative bronchitis where an acute exposure results in a health provider visit and limited treatment, with res-olution of symptoms. Other conditions covered in-clude smoke inhalation from fires or burning material, infectious agents from exposures at work, and chemi-cal pneumonitis. Chronic conditions are also included in this grouping, with other pneumoconioses, hard metal lung disease and coal workers’ pneumoconiosis. A physician board-certified in internal and occupa-tional/environmental medicine reviews all medical rec-ords to determine first, whether the condition is work-related and secondly, the nature of the illness and clas-sification into general categories of disease. In cases where the work-relatedness of the exposure is unclear, additional medical records may be obtained and/or a patient interview completed. In future years of OLDS surveillance, we expect to identify additional categories of OLDS as we expand our efforts to identify the best reporting sources for these conditions. Table 9 shows the distribution of diseases reported by
year since surveillance for OLDS began in 2011. Over all the years, chemical irritation/irritative bronchitis and chemical pneumonitis were the most common condi-tions. Each year varies slightly in the types of conditions reported, in part related to the reporting sources within a given year. In 2011 and 2012, hospitals and Workers’ Compensation reported 72% of the 139 cases, and 68% of the 191 cases, respectively. In 2013 and 2014, the Poi-son Control Center and hospitals reported 69% of the 162 cases, and 63% of the 150 cases, respectively. In 2015, hospitals reported 59% of the 167 cases, followed by Workers’ Compensation reporting 16% of the cases. The following statistics are based on the 167 cases of other lung diseases confirmed from 2015. Similar to delays in reporting cases of silicosis, OLDS reports are incomplete from delays in hospital reporting. Table 10 shows the primary reporting source of the 167 persons confirmed with OLDS in 2015. In 2015, hospi-tal reports were the primary source of identification of patients, with 98 (59%) of OLDS patients identified, followed by 27 (16%) reported through Workers’ Com-pensation, 23 (14%) reported through the Poison Con-trol Center, 16 (10%) reported by physicians and three (2%) reported through labs. There were no reports of other lung diseases identified through death certificates.
Other Work-Related Lung Diseases
Page 17 2015 ANNUAL REPORT
FIGURE 12
Distribution of MI Residents Diagnosed with Mesothelioma by County: 1999-2013
FIGURE 13
Age-Adjusted Incidence Rates of Mesothelioma Among MI Residents, by County: 1999-2013
0
1-25
26-50
51+
Number of Cases Incidence per 100,000
*
0.1 – 1.0
>1. 0 – 2.0
>2.0 *Rate statistically unreliable
emergency department. (2) A female in her 50s poured bleach in a toilet and developed a cough and shortness of breath. She was a cigarette smoker. She received two nebulizer treatments.
Chemical Pneumonitis: (1) A male in his 40s had an acute exposure to plating chemicals. He had mixed nitric acid in a tank containing nickel deposits He sought treatment at the emergency department and was ultimately hospitalized where he received treatment with a nebulizer. He was a lifelong non-smoker. (2) A male in his 50s developed a cough and chest tightness from exposure to plastic truck bed-liner fumes when it caught on fire. He worked at an auto shop. He was a former cigarette smoker, having quit three years prior to this incident.
Demographic Characteristics
One hundred seven (64%) of the persons with OLDS were men; the other 60 (36%) were women. The average age of the OLDS cases was 44, ranging from 16 to 91 years of age. Smoking Status
Twenty-three (41%) of the 56 OLDS cases with known smoking status were current or ever smokers and 33 (59%) individuals had never smoked cigarettes. There were 111 cases with un-known smoking status.
Disease Category
Ninety-four of the OLDS cases were classified as chemical irr itat ion/irritative bronchitis, 14 had COPD, 10 had chemi-cal pneumonitis, nine had asbestos-related disease, seven had hypersensitivity pneu-monitis, five had smoke inhalation and associated symptoms, three had beryllium lung disease, two each had hard metal lung disease or an infec-tious agent, and one each had allergic rhi-nitis, lung trauma or vocal cord dysfunc-tion. An additional 18 had definite work-related respiratory ill-ness that could not be classified more specif-ically (Table 9).
The following case narratives describe some of the exposures and symptoms related to the OLDS cases reported in 2015:
Chemical Irritation: (1) A scientist at a manufacturing plant developed a headache, shortness of breath and throat irritation from exposure to a leak of trifluoroacetic anhydride. He was transferr ing this chemical from a large to a smaller container. He was treated with oxygen at a hospital
Page 18 2015 ANNUAL REPORT
TABLE 9
YEAR REPORTED 2011 2012 2013 2014 DISEASE # % # % # % # % # % Chemical Irritation/Irritative Bronchitis
63 45 80 42 104 64 84 56 94 56
Chemical Pneumonitis 10 7 20 10 19 12 11 7 10 6 Asbestos-Related 0 — 17 9 2 1 8 5 9 5 Smoke Inhalation 13 9 11 6 3 2 7 5 5 3 COPD 5 4 3 2 1 <1 3 2 14 8 Silo-Related Disease 0 — 1 <1 1 <1 2 1 0 — Acute Respiratory Distress Syndrome
1 1 0 — 0 — 1 <1 0 —
Allergies/Allergic Rhinitis 2 1 10 5 2 1 1 <1 1 1 Hard Metal Lung Disease 1 1 2 1 3 2 1 <1 2 1 Hypersensitivity Pneumonitis 5 4 3 2 2 1 1 <1 7 4 Infectious Agent 4 3 10 5 3 2 1 <1 2 1 Metal Fume Fever 0 — 0 — 0 — 1 <1 0 — Sinus– related 0 — 0 — 0 — 1 <1 0 — Coal Workers’ Pneumoconi-osis
1 1 0 — 0 — 0 — 0 —
Other Pneumoconiosis 2 1 2 1 0 — 0 — 0 — Lung Trauma 2 1 0 — 0 — 0 — 1 1 Respiratory Bronchiolitis 1 1 0 — 0 — 0 — 0 — Lung Cancer 0 — 1 <1 0 — 0 — 0 — Pneumothorax 0 — 1 <1 0 — 0 — 0 — Pulmonary Embolism 1 1 0 — 0 — 0 — 0 —
Respiratory Illness NOS 28 20 30 16 22 14 28 19 18 11 TOTAL 139 100 191 100 162 100 150 100 167 100
2015
Vocal Cord Dysfunction 0 — 0 — 0 — 0 — 1 1 Beryllium Lung Disease 0 — 0 — 0 — 0 — 3 2
Type of Industry
Table 11 shows the primary type of industry where exposure occurred among the OLDS cases. The predominant industry where individuals were exposed was manufacturing with 48 cases (29%), followed by 10 cases each (6%) in construction and public administration, nine (5%) in accommo-dation and food services, seven (4%) in health care, six (4%) in arts, entertainment and recrea-tion, five (3%) each in administrative and support and waste remediation services and transportation and warehousing, four (2%) each in agriculture education and auto repair, two (1%) each in min-ing, utilities and retail trade, and one (1%) in infor-mation services.
MIOSHA Inspections-Industrial Hygiene Re-sults
The 167 individuals with OLDS worked at 118 different facilities. Four inspections were per-formed for cases identified in 2015. The following describes the completed inspections.
Wood Pallet Manufacture: An inspection for paint exposure was based on a case of chronic ob-structive pulmonary disease (COPD) reported in 2015. The MIOSHA health inspector did not con-duct air monitoring. However, the inspector did cite the company for three serious violations for safety issues related to guarding —there was no guard on the revolving shaft of a particular saw. The company was also cited for serious violations related to lockout/tagout. Specifically, the compa-ny had an incomplete written procedure, failing to
Page 19 2015 ANNUAL REPORT
TABLE 10 Reporting Source for OLDS Cases:
2015
REPORTING SOURCE # %
Poison Control Ctr 23 14 Hospital 98 59 Workers’ Comp 27 16 Physician Report 16 10 Laboratory 3 2 Death Certificate 0 — TOTAL 167 101
TABLE 11 Primary Industrial Exposure for OLDS Cases Reported in 2015
2002 North American Industry
Classification System
# %
11 Ag, Forestry, Fishing & Hunting 4 2
21 Mining 2 1
22 Utilities 2 1 23 Construction 10 6
31-33 Manufacturing 48 29
44-45 Retail Trade 2 1 48-49 Transportation & Warehousing 5 3
51 Information 1 1
52 Finance & Insurance 0 —
56 Administrative & Support & Waste Management & Remediation Services
5 3
61 Educational Services 4 2
62 Health Care & Social Assistance 7 4 71 Arts, Entertainment, & Recreation 6 4 72 Accommodation & Food Services 9 5
92 Public Administration 10 6
00 Unknown 48 29 TOTAL 167 99 *Percent does not add to 100 due to rounding.
81 Auto Repair, Dry Cleaning, etc 4 2
address residual energy from revolving saw blades as a source of hazardous energy. The other serious violation was regarding inadequate energy isolation training for author-ized employees who use lockout when unjamming stock in the saw. The company was fined a total of $5,400, and paid a reduced amount of $2,700 through an informal settle-ment. This was a nonunion shop. Soap and Detergent Manufacturing: An inspection at a soap and detergent manufacturing facility was based on two cases of respiratory illness reported in 2015. Exposure to bagged detergent powder caused coughing and shortness of breath among the employees reported. A MIOSHA health inspection assessed air quality at the facility; a breathing zone sample to turpentine and two area samples to turpen-tine and particulate dust revealed exposures below permissi-ble limits. No citations or fines were issued as a result of this inspection. This was a nonunion shop. Automotive Bed Liner Manufacturing: An inspection at a company that makes bed liners for trucks was inspected for isocyanate exposures, based on a case of respiratory-
Page 20 2015 ANNUAL REPORT
related allergies. During the inspection 16 co-workers were interviewed about their respiratory health; six re-ported daily or weekly wheezing, cough, shortness of breath or chest tightness. These individuals were sent letters recommending they follow-up with a physician. The company was recommended it adopt a medical screening protocol for workers exposed to asthma caus-ing agents. This was a nonunion shop. Cutting Tool Machining: An inspection was conduct-ed at a company that made cutting tools, based on a case reported with hard metal lung disease. Air monitoring for exposure to cobalt was conducted; all four samples were below MIOSHA permissible limits. The MIOSHA inspector noted that the company used wet methods for all machining operations. In addition, local exhaust ven-tilation was present at the surface grinders. Of co-workers interviewed, none reported any respiratory symptoms. This was a nonunion shop.
The main characteristics of the individuals reported dur-ing Michigan’s 25+ years of silicosis surveillance are that they are elderly men who mainly worked in foundries in three counties. The age distribution is similar to that reported in the 1950s.[8] The older age of the patient (average year of birth, 1924) is secondary to the chronic nature of the disease and the typical long exposure to silica required to develop the disease (average 27 years of exposure to silica). However, we continue to receive re-ports of individuals with short-term exposure, who be-gan work in the 1970s, 1980s, 1990s and two in the 2000s. Overall, 97 (8.8%) of 1,105 silicosis cases with known duration worked for less than 10 years (data not shown). One hundred eleven (10.0%) of the 1,107 indi-viduals with known decade of hire began work in the 1970s, 1980s, 1990s or 2000s; 29 of them had worked for less than ten years. Individuals with silicosis who began working since the 1970s were more likely to have done sandblasting than those who began working with silica before 1970 (50% vs. 34%). Of the 30 people who first were exposed to silica since the 1980s, five worked in foundries, four worked in auto manufacturing, three did cement/masonry work, two were buffing and pol-ishing metal, two worked in auto repair, two worked at a tool and die shop, one worked in mineral processing, one worked in a dental laboratory, one was a heavy equipment operator who did excavating, one was a painter, one was a painter/sandblaster, one worked as a
miner in gold fields in the Southwest, one welded, one was in construction, one worked in a boiler fab-rication shop, one worked for a small sandpaper manufacturing operation, one was an oiler in an iron ore mine, and one worked at a bronze foundry. African American men are over-represented (39%), reflecting previous hiring practices in foundries.[9] African American workers consistently had higher incidence rates of silicosis than their white counter-parts in the counties where rates were compared be-tween these groups (Table 4). Overall for the state, the average annual incidence of silicosis among Afri-can American workers was 7.1 per 100,000 versus 1.4 per 100,000 for white workers (a 5.2-fold greater incidence rate). The individuals reported generally have advanced disease: 276 (23.4%) with progressive massive fibro-sis and another 411 (34.9%) with advanced simple silicosis (category 2 or 3). Approximately two-thirds of the reported patients have reduced breathing tests, including both restrictive and obstructive changes. Obstructive changes, although more prev-alent among individuals who had smoked cigarettes, were found in half of the individuals who never smoked cigarettes (Table 3). Twenty-one percent have had tuberculosis (TB) or a positive skin test indicating infection with the mycobacterium that causes TB. Despite the severity of their disease, 62% had not applied for Workers' Compensation.
The reports of Michigan silicotics having obstructive lung changes is consistent with published reports of increased chronic obstructive pulmonary disease (COPD) among silicotics, as well as among individu-als without silicosis who have had silica exposure.[10] Individuals with silicosis are at risk of develop-ing pulmonary hypertension, clinically significant bronchitis and chronic obstructive pulmonary dis-ease.[11]
Hospitals are the primary reporting source of the patients identified through Michigan’s surveillance system. Hospital discharge reporting is a more cost-effective method for identifying silica problem worksites than physician reporting, death certificates or Workers’ Compensation data.[12] A comprehen-sive surveillance system for silicosis that combines all four reporting sources is as good, if not better, return for public health dollars invested as most oth-er existing public health programs.[12]
Discussion
Page 21 2015 ANNUAL REPORT
Silicotics have an increased morbidity and mortality for malignant and non-malignant respiratory disease.[1,13] The increased risk for death is found both in patients who ever or never smoked cigarettes.[1] Individuals with silicosis also have an increased risk of developing con-nective tissue disease, particularly rheumatoid arthritis
[14,15] as well as an increased risk of developing chronic renal disease, especially anti-neutrophilic cytoplasmic antibodies (ANCA) positive disease.[16,17,18]
The national employer-based surveillance system was not designed to count chronic diseases such as silicosis. We have previously estimated that there were 3,600 to 7,300 newly diagnosed cases of silicosis each year in the United States from 1987–1996.[2] Using the same meth-odology for the time period 1997–2003 we estimate there were 5,586–11,674 newly diagnosed cases of silico-sis per year in the United States. Using an alternative approach with hospital discharge data we estimate there were 1,372–2,867 newly diagnosed cases of silicosis per year in the United States. Although the estimate based on death certificates is approximately four-fold greater than the one based on hospital discharge data, we be-lieve that the true number of new cases of silicosis is closer to these larger estimates than using the actual number of death certificates that mention silicosis (~150 per year) or the Bureau of Labor Statistics estimate based on employer reporting, which in 1999 reported only 2,200 cases for all dust diseases of the lung, includ-ing asbestosis and coal worker’s pneumoconiosis in ad-dition to silicosis.
Industrial hygiene inspections reveal violations of the exposure standard for silica in 37% of the facilities where sampling was done. However, follow-up inspec-tions of these same companies have shown a significant decrease in silica exposures. Companies not in compli-ance with the silica standard are requiring their workers to use powered air-purifying respirators or air-line respi-rators. However, because of an inadequate or absent medical surveillance program in 89% of the facilities, there is no way to monitor the adequacy of these con-trols in terms of health outcomes.
Silicosis remains an ongoing problem in Michigan with former foundry workers continuing to develop severe disease. Michigan workers continue to be at risk of de-veloping silicosis because of continued use of silica
among abrasive blasters and inadequate controls in the construction industry, at foundries currently in operation, as well as in emerging industries with silica exposure including hydraulic fracturing [19] and engi-neered stone countertop fabrication. [20] Even with-out the development of silicosis, silica exposure is a risk factor for the development of lung cancer, con-nective tissue disease, tuberculosis and chronic ob-structive pulmonary disease (COPD).[10,13,21] These risks justify tighter workplace controls for silica even if the number of new cases of silicosis continues to decline.
OSHA has promulgated a new comprehensive stand-ard for silica that includes a lower allowable level of silica in the air, worker education and medical surveil-lance. The standard is needed despite a decreasing trend of silicosis cases identified in Michigan, since this trend is more likely a product of more automated work practices with a smaller number of workers at risk than safer workplaces. The major decrease in cas-es of silicosis in Michigan can be attributed to the decrease in the number of foundry workers. There was a 75% decrease of foundry workers from 1973 to 1991 (Figure 6) and an 83% decrease in reported cas-es of silicosis from 1993 to 2011, factoring in a 20-year latency period for the development of silicosis. Additionally, the number of abrasive blasting compa-nies using silica decreased 71% from 1995 to 2011 (2011 Annual Report—Tracking Silicosis and Other Work-Related Diseases in Michigan).
We are optimistic about the downward trend in re-ported silicosis cases but remain concerned about ongoing silica exposure and the increased risk of lung cancer, COPD, connective tissue disease, and kidney disease associated with silica exposure. The promul-gated comprehensive silica standard will be helpful in the foundry industry as well as for newer exposures in highway reconstruction, engineered stone countertop fabrication and hydraulic fracturing; it is too soon to see any ill health effects of these newer silica expo-sure sources. The new silica regulations require medi-cal examinations beginning June 23, 2017 in Con-struction regardless of measured air levels and in 2018 in General Industry if the silica air level is above the permissible exposure limit (PEL) and in 2020 if the silica level is at or above the PEL.
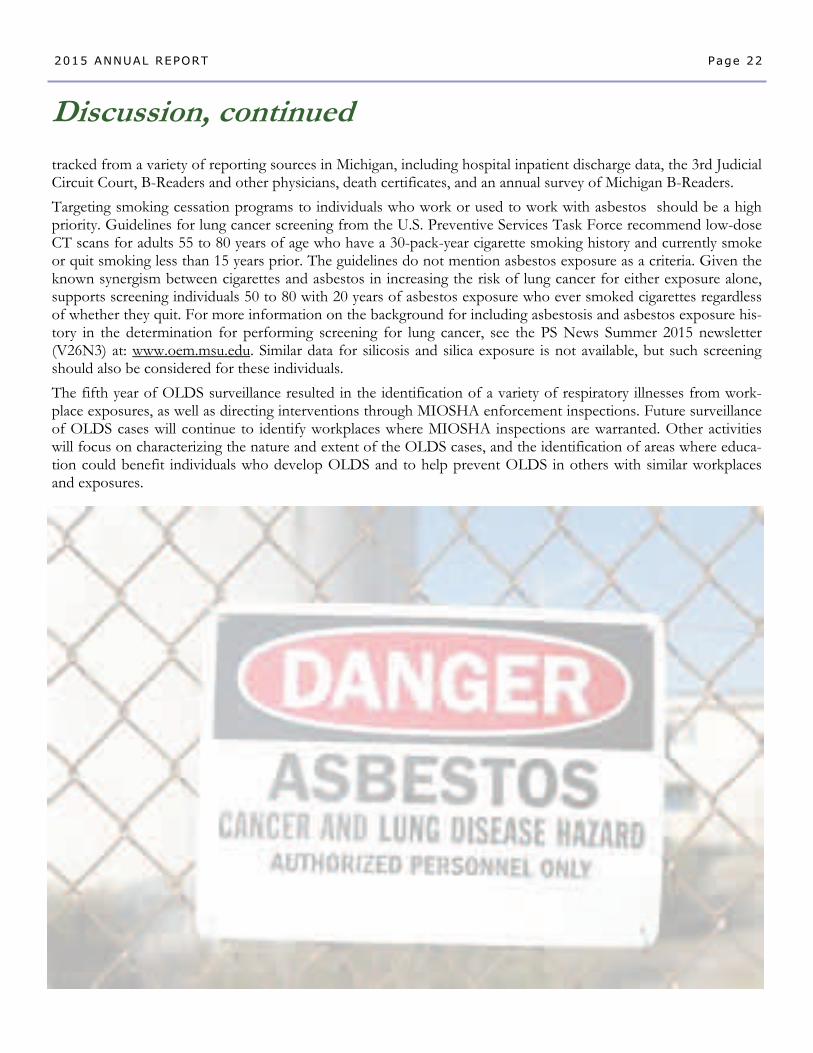
Asbestos-related disease, both malignant and non-malignant, is the single most commonly diagnosed occupational lung disease. Asbestos-related disease is
Discussion, continued
Page 22 2015 ANNUAL REPORT
tracked from a variety of reporting sources in Michigan, including hospital inpatient discharge data, the 3rd Judicial Circuit Court, B-Readers and other physicians, death certificates, and an annual survey of Michigan B-Readers.
Targeting smoking cessation programs to individuals who work or used to work with asbestos should be a high priority. Guidelines for lung cancer screening from the U.S. Preventive Services Task Force recommend low-dose CT scans for adults 55 to 80 years of age who have a 30-pack-year cigarette smoking history and currently smoke or quit smoking less than 15 years prior. The guidelines do not mention asbestos exposure as a criteria. Given the known synergism between cigarettes and asbestos in increasing the risk of lung cancer for either exposure alone, supports screening individuals 50 to 80 with 20 years of asbestos exposure who ever smoked cigarettes regardless of whether they quit. For more information on the background for including asbestosis and asbestos exposure his-tory in the determination for performing screening for lung cancer, see the PS News Summer 2015 newsletter (V26N3) at: www.oem.msu.edu. Similar data for silicosis and silica exposure is not available, but such screening should also be considered for these individuals.
The fifth year of OLDS surveillance resulted in the identification of a variety of respiratory illnesses from work-place exposures, as well as directing interventions through MIOSHA enforcement inspections. Future surveillance of OLDS cases will continue to identify workplaces where MIOSHA inspections are warranted. Other activities will focus on characterizing the nature and extent of the OLDS cases, and the identification of areas where educa-tion could benefit individuals who develop OLDS and to help prevent OLDS in others with similar workplaces and exposures.
Discussion, continued
Page 23 2015 ANNUAL REPORT
References [1] Rosenman KD, Stanbury MJ, Reilly MJ. Mortality Among Persons with Silicosis Reported to Two State‑Based Surveillance Systems. Scand J Work Environ Health 1995; 21 Supplement 2:73-76. [2] Rosenman KD, Reilly MJ, Henneberger PK. Estimating the Total Number of Newly Diagnosed Silicotics in the United States. Am J Ind Med 2003; 44:141-147. [3] Rosenman KD, Reilly MJ, Gardiner J. Results of Spirometry among Individuals in a Silicosis Registry. J Occup Environ Med 2010; 52:1173-1178. [4] NIOSH. Work-Related Lung Disease Surveillance System (eWoRLD). http://wwwn.cdc.gov/eWoRLD. Accessed February 13, 2015. [5] Rosenman KD, Trimbath L, Stanbury M. Surveillance of Occupational Lung Disease: Comparison of Hospital Discharge Data to Physician Reporting. Am J Public Health 1990; 80:1257-1258. [6] Greenberg M. History of Mesothelioma. European Respiratory Journal 1997; 10:2690-2691. [7] Spirtas R, Heineman E, Bernstein L, Beebe GW, Keehn RJ, Stark A, Harlow BL and Benichou J. Malignant Mesothelioma: Atributable Risk of Asbestos Exposure. Occup Environ Med 1994; 51:804-811. [8] Trasko VM. Some Facts on the Prevalence of Silicosis in the United States. AMA Archives of Industrial Health 1956; 14:379‑386. [9] Foote CL, Whatley WC, Wright G. Arbitraging a Discriminatory Labor Market: Black Workers at the Ford Motor Company, 1918-1947. J Labor Economics 2003; 21:493-532. [10] Hnizdo E, Vallyathan V. Chronic Obstructive Pulmonary Disease Due to Occupational Exposure to Silica Dust: A Review of Epide-miological and Pathological Evidence. Occup Environ Med 2003; 60:237-243. [11] Rosenman KD, Zhu Z. Pneumoconiosis and Associated Medical Conditions. Am J Ind Med 1995; 27:107-113. [12] Rosenman KD, Hogan A, Reilly MJ. What is the Most Cost-Effective Way to Identify Silica Problem Worksites? Am J Ind Med 2001; 39:629-635. [13] Davis GS. Silica In Occupational and Environmental Respiratory Disease. eds Harber P, Schenker MD, Balmes JR. St. Louis, Missouri: Mosby, 1996; 373-399. [14] Makol A, Reilly MJ, Rosenman KD. Prevalence of Connective Tissue Disease in Silicosis (1985-2006). Am J Ind Med 2011;54:255-262. [15] Rosenman KD, Moore-Fuller M, Reilly MJ. Connective Tissue Disease and Silicosis. Am J Ind Med 1999; 35:375-381. [16] Rosenman KD, Moore-Fuller M, Reilly MJ. Kidney Disease and Silicosis. Nephron 2000; 85:14-19. [17] Gregorini G, Tira P, Frizza J, D’Haese PC, Elseviers MM, Nuyts GD, Maiorcar, DeBroe ME. ANCA-Associated Diseases and Silica Exposure. Clin Rev Allergy Immunol 1997;15:21-40. [18] Steenland K, Rosenman KD, Socie E, Valiante D. Silicosis and End-Stage Renal Disease. Scand J Work Environ Health 2002; 28:439-442. [19] Rosenman KD. Hydraulic Fracturing and the Risk of Silicosis. Clinical Pulmonary Medicine. 2014; 21:167-172. [20] Friedman GK, Harrison R, Bojes H, Worthington K, Filios M. Notes from the Field—Silicosis in a Countertop Fabricator—Texas, 2014. MMWR. February 15, 2015, Volume 64, Number 5:129-130. [21] NIOSH Hazard Review. Health Effects of Occupational Exposure to Respirable Crystalline Silica. Cincinnati, Ohio: DHHS(NIOSH)2002-129.