Embed Size (px)
Citation preview

2015 Annual Report
Our power management solutions help solve the world’s toughest challenges.
Smarter use of energy. More strength and greater control. Reduced fuel use and emissions.
We help customers do more with less.
Power Forward
Eaton is a power management company with 2015 sales of $20.9 billion. Eaton provides energy-efficient solutions that help our customers effectively manage electrical, hydraulic and mechanical power more efficiently, safely and sustainably.
Eaton has approximately 97,000 employees and sells products to customers in more than 175 countries. For more information, visit www.eaton.com.
1 Financial Highlights2 Letter to Shareholders4 Power Forward10 Sustainability Report16 Financial Information56 Directors and Leadership Team57 Shareholder Information
Power Forward Online: www.eaton.com/AR15
2015 2014
(In millions except for per share data)
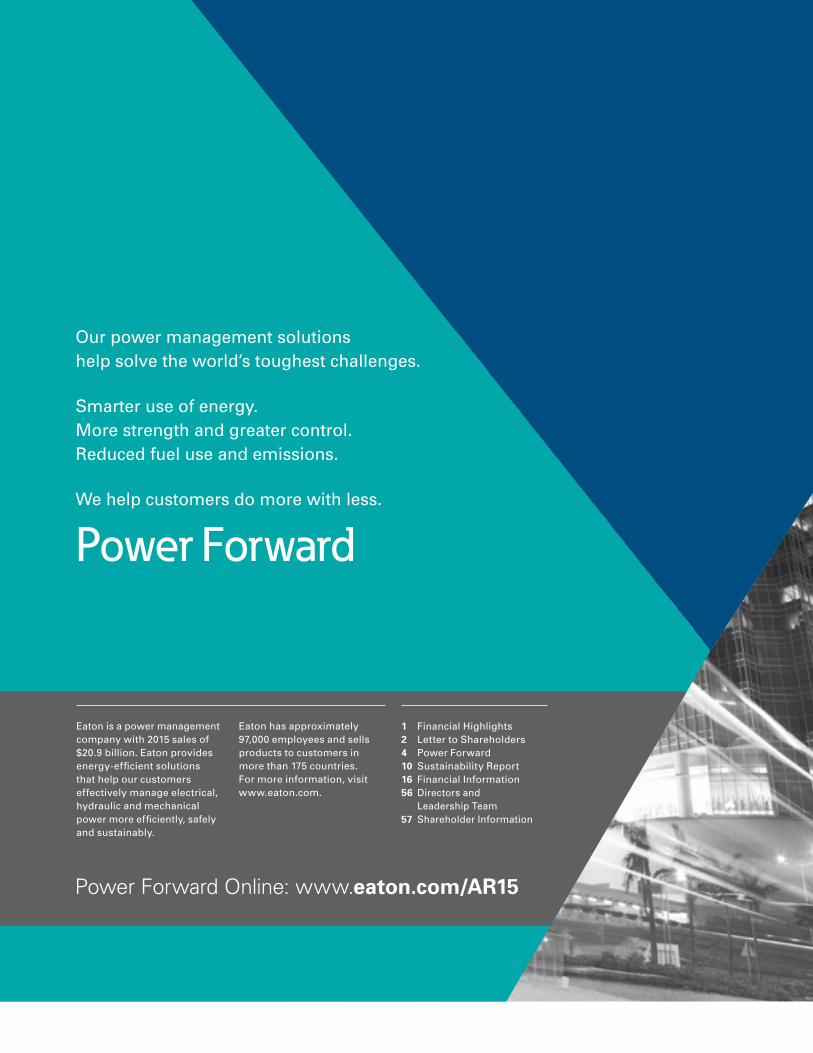
Net sales $ 20,855 $ 22,552Net income attributable to Eaton ordinary shareholders 1,979 1,793 Excluding acquisition integration charges and transaction costs (after-tax) 31 102Operating earnings $ 2,010 $ 1,895
Operating earnings excluding litigation settlements and divestiture gain* $ 2,010 $ 2,230
Net income per shareattributable to Eaton ordinary shareholders–diluted $ 4.23 $ 3.76 Excluding per share impact of acquisition integration charges and transaction costs (after-tax) 0.07 0.21Operating earnings per ordinary share $ 4.30 $ 3.97
Operating earnings per ordinary share excluding litigation settlements and divestiture gain* $ 4.30 $ 4.67
Weighted-average number of ordinary shares outstanding – diluted 467.1 476.8Cash dividends declared per ordinary share $ 2.20 $ 1.96
Total assets $ 31,031 $ 33,529Total debt 8,449 9,034Eaton shareholders’ equity 15,186 15,786
*Operating earnings were $2,230 for 2014, excluding the pre-tax cost for two extraordinary litigation settlements of $644, and a pre-tax gain from two Aerospace divestitures of $154. Operating earnings per ordinary share were $4.67 for 2014, excluding a $0.70 per share impact of the extraordinary litigation settlements and the gain from the Aerospace divestitures. Operating cash flows were $2,532 for 2014, excluding $654 of payments made for the extraordinary litigation settlements.
$16.0 $16.3
$20.9$22.0 $22.6 $4.13
$4.67
$4.30 $2.3
$2.5$2.4
31.8%33.7% 34.5%
$3.96
$1.2
26.5%
$3.94
$1.7
39.2%
NET SALES (Billions of dollars)
OPERATING EARNINGS PER ORDINARY SHARE (Dollars per share)*
CASH FLOW FROM OPERATIONS (Billions of dollars)*
NET-DEBT-TO-TOTAL-CAPITAL RATIO
2015 Financial Highlights
$700
$600
$500
$400
$300
$200
$100
0
The above graph compares the cumulative total return to shareholders for Eaton and the S&P 500 Index on an initial $100 investment over the time period 2000 through 2015. The shareholder returns reflected on the graph assume dividends were reinvested as of the ex-dividend date.
Eaton S&P 500 Index
COMPANY STOCK PERFORMANCE
2000 2001 2002 2003 2004 2005 2006 2007 2008 2009 2010 2011 2012 2013 2014 2015
2011 2012 2013 2014 2015 2011 2012 2013 2014 2015 2011 2012 2013 2014 2015 2011 2012 2013 2014 2015
+ YEARS SERVING EATON
ALEXANDER M. CUTLERChairman and Chief Executive Officer
40
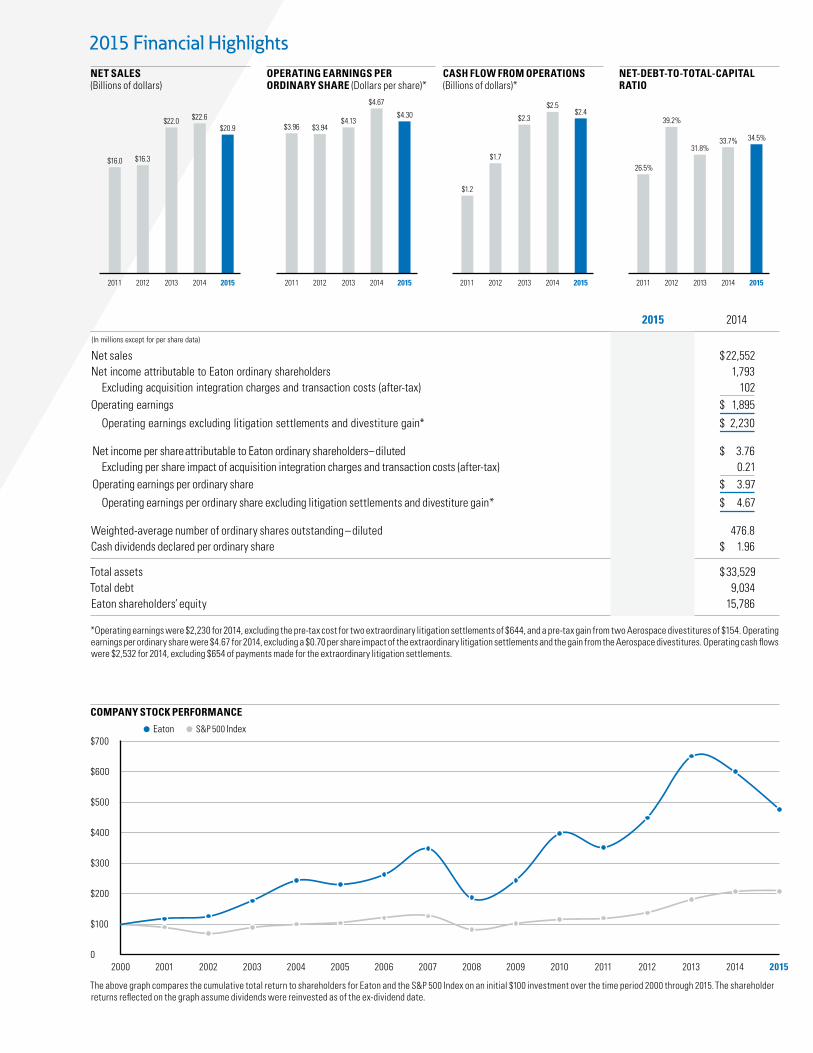
TO OUR SHAREHOLDERS:
2015 was a year of challenges, and of change. We took—and continue to take—decisive steps to counteract ongoing headwinds and build on our accomplishments. We also announced our very talented new leadership team, who will now power Eaton forward.
Delivering credible performance in challenging timesWe entered 2015 planning for modest growth in our end markets. By the end of the first quarter, early signs were apparent that 2015 would unfold very differently. Global industrial malaise, driven by the unwinding of the commodity boom in oil and gas, agriculture and mining, was compounded by the impact of greater-than-expected negative currency translation, creating a very challenging operating environment for U.S. dollar denom-inated multinational companies. Our markets declined and currency translation further decreased revenues by approxi-mately $1.2 billion.
Forward Momentum
We moved decisively in early 2015 to counteract these strong headwinds and undertook a broad set of restructuring and cost containment actions, which helped offset the accelerating weak-ness in our markets during the final three quarters of 2015. Our global teams once again rose to the occasion and allowed us to set a number of performance records in spite of all these challenges.
Among the year’s financial and operating highlights:
• We posted sales of $20.9 billion, down 7½ percent from 2014.
• Operating earnings, which exclude acquisition integration charges, were $2.0 billion, a decrease of 10 percent from 2014, adjusting for the 2014 litigation settlements and the gain on the small aerospace divestitures.
• Operating earnings per share were $4.30, down 8 percent from 2014.
• We generated $2.4 billion in cash from operations.
• We raised our dividend by 12 percent in February 2015 and another 4 percent in February 2016, positioning our dividend yield among the highest within our peer group.
• We repaid $1 billion of the debt we borrowed to finance the Cooper Industries acquisition.
• We contributed $330 million to our pension plans, strength-ening our balance sheet.
• We repurchased $682 million, or 11.3 million, of our shares—approximately 2.4 percent of our outstanding shares.
• We strengthened our commitment to sustainability by reducing emissions and our environmental footprint in waste to landfill and water consumption, while expanding efforts to build safer and healthier workplaces and communities. Additionally, we’re expanding our online sustainability report-ing and transparency in alignment with Global Reporting Initiative G4 standards.
• We improved the safety of our facilities and our work prac-tices—reducing our recordable incident rate by 6 percent from the previous year.
In spite of all these accomplishments, our total return to you, our shareholders, was a disappointing negative 21 percent over 2015. Some may take comfort in the fact that global equity returns were broadly disappointing. We do not. We expect more of ourselves.
Sharpening our focusWe recognize that global growth has slowed and the causes for this are not likely to change soon. Dealing with persistent slow growth demands an even more heightened focus on enterprise-wide competitiveness as well as a different use of our balance sheet.
We are undertaking a three-year (2015 through 2017) $400 mil-lion restructuring plan, which reduces enterprise-wide struc-tural costs and ensures that our company will be able to compete effectively and provide the returns that our investors expect. Having fulfilled our commitment to retire the $2.1 billion debt related to the Cooper acquisition (a final payment of $240 million was made in early January 2016), we have embarked on a different, more balanced use of our free cash flow. Since shar-ing our initial thoughts on capital allocation at mid-year last year, we have announced a plan to buy back a total of $3 billion of our shares from 2015 through 2018. Coupled with our strong divi-dend yield, we believe this will provide a substantial base annual return to our shareholders.
This restructuring plan will both lower our structural enterprise costs and provide year-to-year savings, strengthening our earnings profile.
EATON 2015 Annual Report2
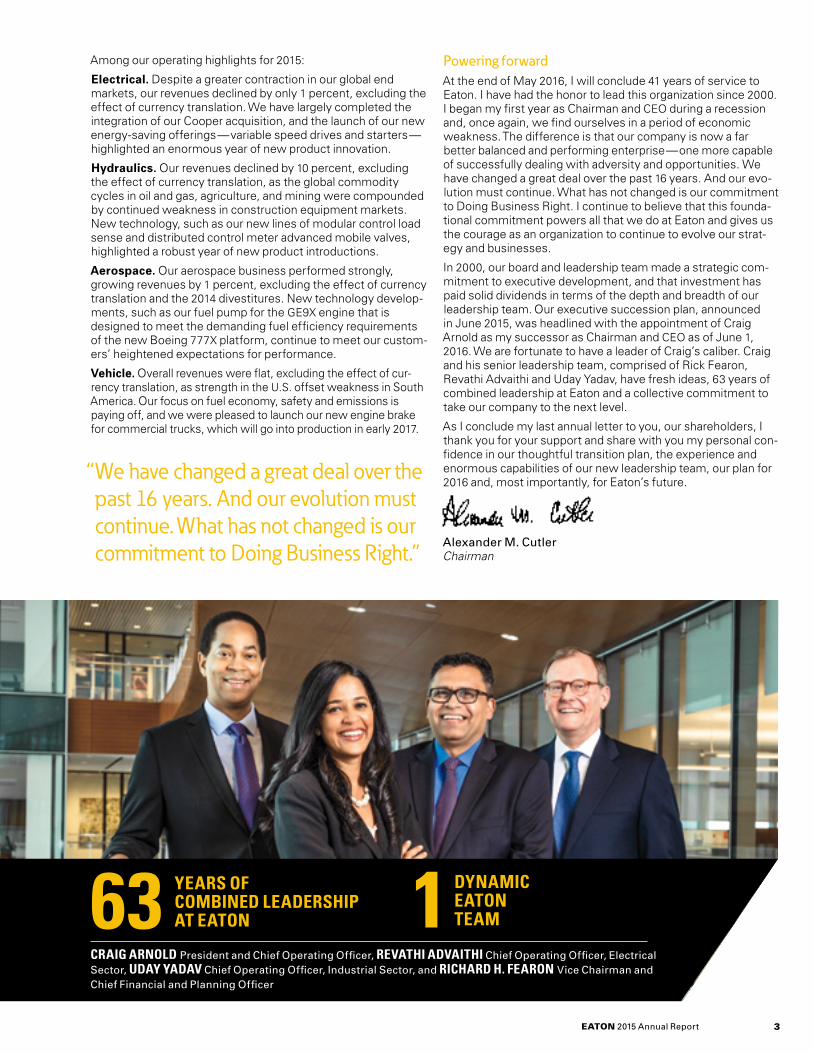
YEARS OF COMBINED LEADERSHIP AT EATON
DYNAMIC EATONTEAM
CRAIG ARNOLD President and Chief Operating Officer, REVATHI ADVAITHI Chief Operating Officer, Electrical Sector, UDAY YADAV Chief Operating Officer, Industrial Sector, and RICHARD H. FEARON Vice Chairman and Chief Financial and Planning Officer
63 1
Powering forwardAt the end of May 2016, I will conclude 41 years of service to Eaton. I have had the honor to lead this organization since 2000. I began my first year as Chairman and CEO during a recession and, once again, we find ourselves in a period of economic weakness. The difference is that our company is now a far better balanced and performing enterprise—one more capable of successfully dealing with adversity and opportunities. We have changed a great deal over the past 16 years. And our evo-lution must continue. What has not changed is our commitment to Doing Business Right. I continue to believe that this founda-tional commitment powers all that we do at Eaton and gives us the courage as an organization to continue to evolve our strat-egy and businesses.
In 2000, our board and leadership team made a strategic com-mitment to executive development, and that investment has paid solid dividends in terms of the depth and breadth of our leadership team. Our executive succession plan, announced in June 2015, was headlined with the appointment of Craig Arnold as my successor as Chairman and CEO as of June 1, 2016. We are fortunate to have a leader of Craig’s caliber. Craig and his senior leadership team, comprised of Rick Fearon, Revathi Advaithi and Uday Yadav, have fresh ideas, 63 years of combined leadership at Eaton and a collective commitment to take our company to the next level.
As I conclude my last annual letter to you, our shareholders, I thank you for your support and share with you my personal con-fidence in our thoughtful transition plan, the experience and enormous capabilities of our new leadership team, our plan for 2016 and, most importantly, for Eaton’s future.
Alexander M. Cutler Chairman
Among our operating highlights for 2015:
Electrical. Despite a greater contraction in our global end markets, our revenues declined by only 1 percent, excluding the effect of currency translation. We have largely completed the integration of our Cooper acquisition, and the launch of our new energy-saving offerings—variable speed drives and starters—highlighted an enormous year of new product innovation.
Hydraulics. Our revenues declined by 10 percent, excluding the effect of currency translation, as the global commodity cycles in oil and gas, agriculture, and mining were compounded by continued weakness in construction equipment markets. New technology, such as our new lines of modular control load sense and distributed control meter advanced mobile valves, highlighted a robust year of new product introductions.
Aerospace. Our aerospace business performed strongly, growing revenues by 1 percent, excluding the effect of currency translation and the 2014 divestitures. New technology develop-ments, such as our fuel pump for the GE9X engine that is designed to meet the demanding fuel efficiency requirements of the new Boeing 777X platform, continue to meet our custom-ers’ heightened expectations for performance.
Vehicle. Overall revenues were flat, excluding the effect of cur-rency translation, as strength in the U.S. offset weakness in South America. Our focus on fuel economy, safety and emissions is paying off, and we were pleased to launch our new engine brake for commercial trucks, which will go into production in early 2017.
“ We have changed a great deal over the past 16 years. And our evolution must continue. What has not changed is our commitment to Doing Business Right.”
EATON 2015 Annual Report 3
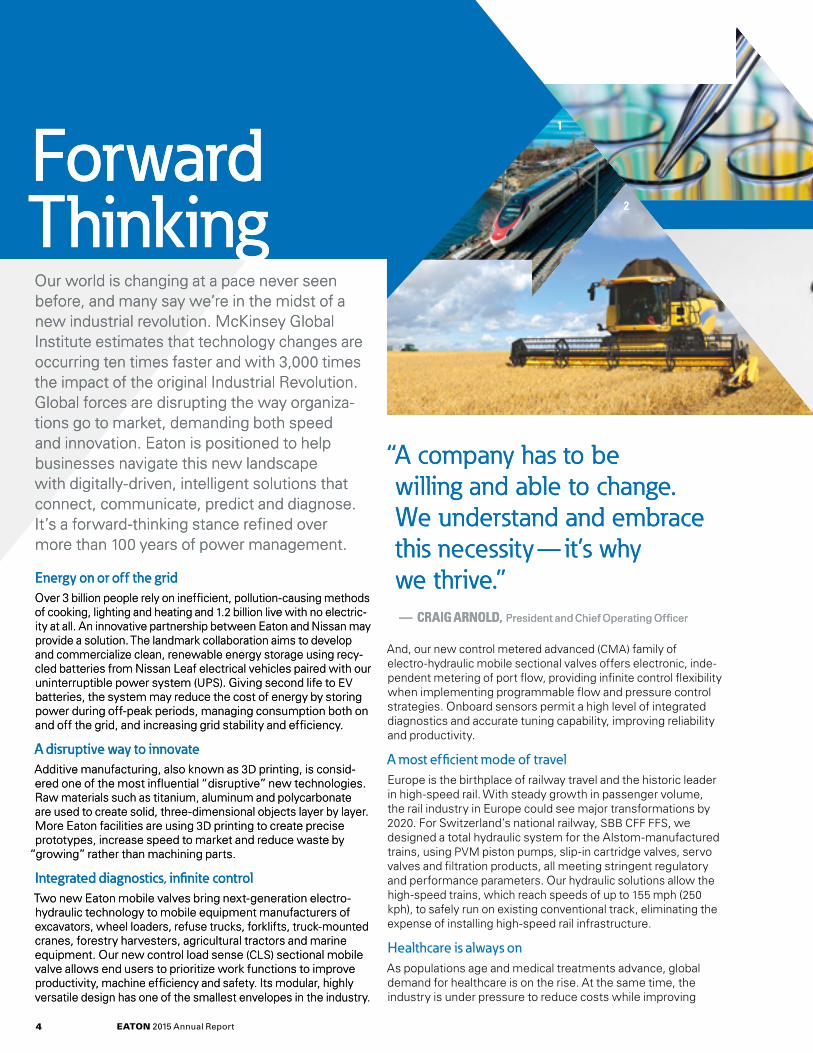
Forward ThinkingOur world is changing at a pace never seen before, and many say we’re in the midst of a new industrial revolution. McKinsey Global Institute estimates that technology changes are occurring ten times faster and with 3,000 times the impact of the original Industrial Revolution. Global forces are disrupting the way organiza-tions go to market, demanding both speed and innovation. Eaton is positioned to help businesses navigate this new landscape with digitally-driven, intelligent solutions that connect, communicate, predict and diagnose. It’s a forward-thinking stance refined over more than 100 years of power management.
Energy on or off the gridOver 3 billion people rely on inefficient, pollution-causing methods of cooking, lighting and heating and 1.2 billion live with no electric-ity at all. An innovative partnership between Eaton and Nissan may provide a solution. The landmark collaboration aims to develop and commercialize clean, renewable energy storage using recy-cled batteries from Nissan Leaf electrical vehicles paired with our uninterruptible power system (UPS). Giving second life to EV batteries, the system may reduce the cost of energy by storing power during off-peak periods, managing consumption both on and off the grid, and increasing grid stability and efficiency.
A disruptive way to innovate Additive manufacturing, also known as 3D printing, is consid-ered one of the most influential “disruptive” new technologies. Raw materials such as titanium, aluminum and polycarbonate are used to create solid, three-dimensional objects layer by layer. More Eaton facilities are using 3D printing to create precise prototypes, increase speed to market and reduce waste by
“growing” rather than machining parts.
Integrated diagnostics, infinite controlTwo new Eaton mobile valves bring next-generation electro-hydraulic technology to mobile equipment manufacturers of excavators, wheel loaders, refuse trucks, forklifts, truck-mounted cranes, forestry harvesters, agricultural tractors and marine equipment. Our new control load sense (CLS) sectional mobile valve allows end users to prioritize work functions to improve productivity, machine efficiency and safety. Its modular, highly versatile design has one of the smallest envelopes in the industry.
And, our new control metered advanced (CMA) family of electro-hydraulic mobile sectional valves offers electronic, inde-pendent metering of port flow, providing infinite control flexibility when implementing programmable flow and pressure control strategies. Onboard sensors permit a high level of integrated diagnostics and accurate tuning capability, improving reliability and productivity.
A most efficient mode of travelEurope is the birthplace of railway travel and the historic leader in high-speed rail. With steady growth in passenger volume, the rail industry in Europe could see major transformations by 2020. For Switzerland’s national railway, SBB CFF FFS, we designed a total hydraulic system for the Alstom-manufactured trains, using PVM piston pumps, slip-in cartridge valves, servo valves and filtration products, all meeting stringent regulatory and performance parameters. Our hydraulic solutions allow the high-speed trains, which reach speeds of up to 155 mph (250 kph), to safely run on existing conventional track, eliminating the expense of installing high-speed rail infrastructure.
Healthcare is always onAs populations age and medical treatments advance, global demand for healthcare is on the rise. At the same time, the industry is under pressure to reduce costs while improving
“ A company has to be willing and able to change. We understand and embrace this necessity—it’s why we thrive.”
— CRAIG ARNOLD, President and Chief Operating Officer
1
2
EATON 2015 Annual Report4
Forward ThinkingOur world is changing at a pace never seen before, and many say we’re in the midst of a new industrial revolution. McKinsey Global Institute estimates that technology changes are occurring ten times faster and with 3,000 times the impact of the original Industrial Revolution. Global forces are disrupting the way organiza-tions go to market, demanding both speed and innovation. Eaton is positioned to help businesses navigate this new landscape with digitally-driven, intelligent solutions that connect, communicate, predict and diagnose. It’s a forward-thinking stance refined over more than 100 years of power management.
Energy on or off the gridOver 3 billion people rely on inefficient, pollution-causing methods of cooking, lighting and heating and 1.2 billion live with no electric-ity at all. An innovative partnership between Eaton and Nissan may provide a solution. The landmark collaboration aims to develop and commercialize clean, renewable energy storage using recy-cled batteries from Nissan Leaf electrical vehicles paired with our uninterruptible power system (UPS). Giving second life to EV batteries, the system may reduce the cost of energy by storing power during off-peak periods, managing consumption both on and off the grid, and increasing grid stability and efficiency.
A disruptive way to innovate Additive manufacturing, also known as 3D printing, is consid-ered one of the most influential “disruptive” new technologies. Raw materials such as titanium, aluminum and polycarbonate are used to create solid, three-dimensional objects layer by layer. More Eaton facilities are using 3D printing to create precise prototypes, increase speed to market and reduce waste by
“growing” rather than machining parts.
Integrated diagnostics, infinite controlTwo new Eaton mobile valves bring next-generation electro-hydraulic technology to mobile equipment manufacturers of excavators, wheel loaders, refuse trucks, forklifts, truck-mounted cranes, forestry harvesters, agricultural tractors and marine equipment. Our new control load sense (CLS) sectional mobile valve allows end users to prioritize work functions to improve productivity, machine efficiency and safety. Its modular, highly versatile design has one of the smallest envelopes in the industry.
“ A company has to be willing and able to change. We understand and embrace this necessity—it’s why we thrive.”
— CRAIG ARNOLD, President and Chief Operating Officer

1— Fugiaect ionserepro tem voluptas aciis sin nateceati aut ra dem.
2 —Ratiur maximol oritatem corum hil ipsa volores aperspera.
3—Iderit, quae dolendem quodict emquamusdanon.
4— Fugiaect ionserepro tem voluptas aciis sin nateceati aut ra dem.
5 —Ratiur maximol oritatem corum hil ipsa volores aperspera.
6—Ratiur maximol oritatem corum hil ipsa volores aperspera.
1—Our hydraulic power units improve safety and comfort on high-speed trains.
2 —Our new load-sensing mobile valves help prioritize work functions.
5
quality, value and safety. North Estonia Medical Centre is one of the top healthcare providers in the Baltic region, with seven clinics and 31 specialist centers. Embarking on a massive expansion to become the most modern hospital in the region, it needed reliable electrical distribution for a 100 percent digital environment containing sensitive medical equipment and specialized laboratories. We helped the Centre create a technol-ogy-rich emergency room complex and renovate an entire section of clinical units. Our end-to-end solutions included environmentally-friendly distribution technology, UPS back-up power systems, emergency lighting, xEffect digital miniature circuit breakers, Arcon arc fault protection and SmartWire-DT intelligent wiring.
Supporting New Jersey’s largest hospital solar installation, we helped CentraState Medical Center generate more than 8 million kilowatt-hours of sustainable energy and offset 25 percent of its total electrical usage. Our solar solutions helped increase electri-cal resiliency in large commercial and utility-scale, grid-connect applications, with our Power Xpert 1500 kilowatt inverters and our Cooper Power series Envirotran direct-coupled transformers. We also provided the medical center with extensive engineering services, including arc flash analysis and coordination studies, to enhance the project’s safety and reliability.
3
4
3—Healthcare environments around the world rely on Eaton for critical power.
4—Eaton/Nissan partnership explores new life for old electric vehicle batteries.
5 —Expanding 3D printing to increase speed-to-market, reduce waste and transform manufacturing.(Source: EOS)
EATON 2015 Annual Report 5

EATON 2015 Annual Report6
1
2
3
4
5
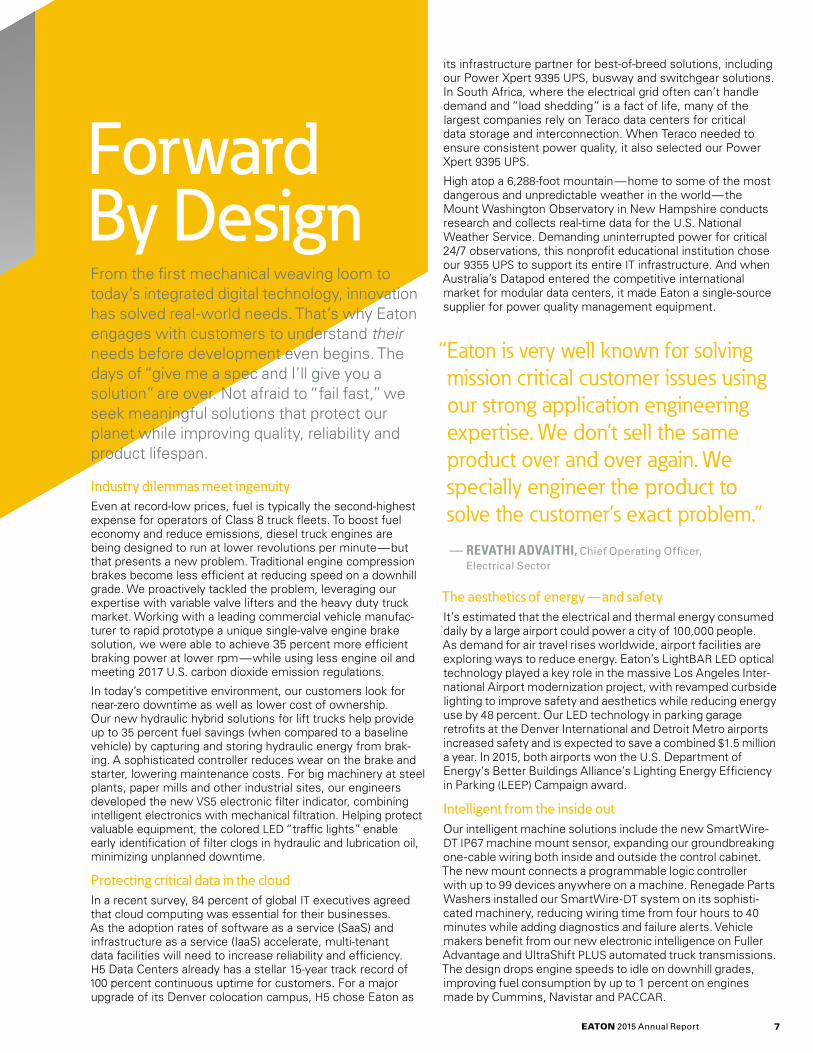
1—Extreme weather at Mt. Washington Observatory is no match for Eaton UPSs.
2 —Protecting valuable industrial equipment with intelligent VS5 electronic filter indicator.
3—Innovative single-valve engine brake adds power while consuming less fuel and oil.
4—Helping cloud computing centers meet global demand for reliability.
5 —Airports get energy efficiency and aesthetics make-over with LED lighting technology.
its infrastructure partner for best-of-breed solutions, including our Power Xpert 9395 UPS, busway and switchgear solutions. In South Africa, where the electrical grid often can’t handle demand and “load shedding” is a fact of life, many of the largest companies rely on Teraco data centers for critical data storage and interconnection. When Teraco needed to ensure consistent power quality, it also selected our Power Xpert 9395 UPS.
High atop a 6,288-foot mountain—home to some of the most dangerous and unpredictable weather in the world—the Mount Washington Observatory in New Hampshire conducts research and collects real-time data for the U.S. National Weather Service. Demanding uninterrupted power for critical 24/7 observations, this nonprofit educational institution chose our 9355 UPS to support its entire IT infrastructure. And when Australia’s Datapod entered the competitive international market for modular data centers, it made Eaton a single-source supplier for power quality management equipment.
“ Eaton is very well known for solving mission critical customer issues using our strong application engineering expertise. We don’t sell the same product over and over again. We specially engineer the product to solve the customer’s exact problem.”
— REVATHI ADVAITHI, Chief Operating Officer, Electrical Sector
The aesthetics of energy—and safety It’s estimated that the electrical and thermal energy consumed daily by a large airport could power a city of 100,000 people. As demand for air travel rises worldwide, airport facilities are exploring ways to reduce energy. Eaton’s LightBAR LED optical technology played a key role in the massive Los Angeles Inter-national Airport modernization project, with revamped curbside lighting to improve safety and aesthetics while reducing energy use by 48 percent. Our LED technology in parking garage retrofits at the Denver International and Detroit Metro airports increased safety and is expected to save a combined $1.5 million a year. In 2015, both airports won the U.S. Department of Energy’s Better Buildings Alliance’s Lighting Energy Efficiency in Parking (LEEP) Campaign award.
Intelligent from the inside outOur intelligent machine solutions include the new SmartWire- DT IP67 machine mount sensor, expanding our groundbreaking one-cable wiring both inside and outside the control cabinet. The new mount connects a programmable logic controller with up to 99 devices anywhere on a machine. Renegade Parts Washers installed our SmartWire-DT system on its sophisti-cated machinery, reducing wiring time from four hours to 40 minutes while adding diagnostics and failure alerts. Vehicle makers benefit from our new electronic intelligence on Fuller Advantage and UltraShift PLUS automated truck transmissions. The design drops engine speeds to idle on downhill grades, improving fuel consumption by up to 1 percent on engines made by Cummins, Navistar and PACCAR.
Forward By DesignFrom the first mechanical weaving loom to today’s integrated digital technology, innovation has solved real-world needs. That’s why Eaton engages with customers to understand their needs before development even begins. The days of “give me a spec and I’ll give you a solution” are over. Not afraid to “fail fast,” we seek meaningful solutions that protect our planet while improving quality, reliability and product lifespan.
Industry dilemmas meet ingenuity Even at record-low prices, fuel is typically the second-highest expense for operators of Class 8 truck fleets. To boost fuel economy and reduce emissions, diesel truck engines are being designed to run at lower revolutions per minute—but that presents a new problem. Traditional engine compression brakes become less efficient at reducing speed on a downhill grade. We proactively tackled the problem, leveraging our expertise with variable valve lifters and the heavy duty truck market. Working with a leading commercial vehicle manufac-turer to rapid prototype a unique single-valve engine brake solution, we were able to achieve 35 percent more efficient braking power at lower rpm—while using less engine oil and meeting 2017 U.S. carbon dioxide emission regulations.
In today’s competitive environment, our customers look for near-zero downtime as well as lower cost of ownership. Our new hydraulic hybrid solutions for lift trucks help provide up to 35 percent fuel savings (when compared to a baseline vehicle) by capturing and storing hydraulic energy from brak-ing. A sophisticated controller reduces wear on the brake and starter, lowering maintenance costs. For big machinery at steel plants, paper mills and other industrial sites, our engineers developed the new VS5 electronic filter indicator, combining intelligent electronics with mechanical filtration. Helping protect valuable equipment, the colored LED “traffic lights” enable early identification of filter clogs in hydraulic and lubrication oil, minimizing unplanned downtime.
Protecting critical data in the cloud In a recent survey, 84 percent of global IT executives agreed that cloud computing was essential for their businesses. As the adoption rates of software as a service (SaaS) and infrastructure as a service (IaaS) accelerate, multi-tenant data facilities will need to increase reliability and efficiency. H5 Data Centers already has a stellar 15-year track record of 100 percent continuous uptime for customers. For a major upgrade of its Denver colocation campus, H5 chose Eaton as
EATON 2015 Annual Report 7

3
4
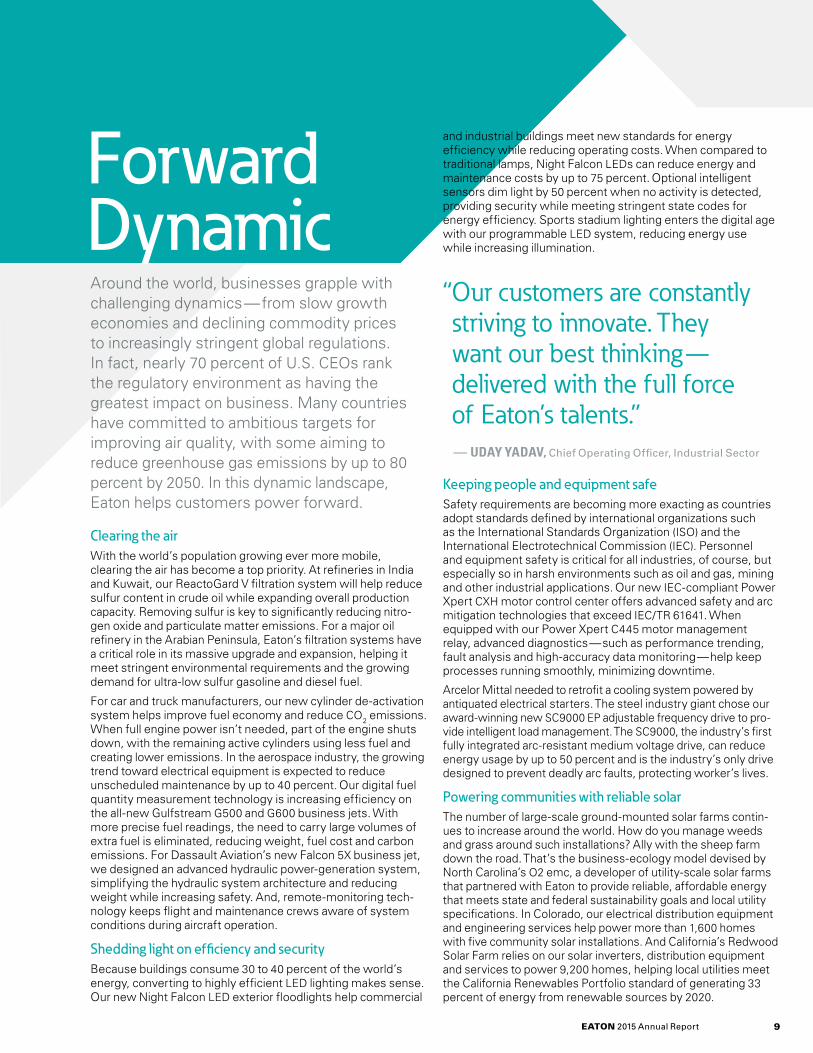
51—Solar farms rely on Eaton inverters to power communities and reduce emissions.
2 —Sports stadiums reduce energy use, enhance lighting with programmable LED systems.
3—Digital and hydraulic technologies help business jets save on fuel, increase safety.
4—Oil refineries boost production while reducing emissions with ReactoGard V filtration.
5 —Cylinder de-activation system for cars and trucks helps reduce CO2 emissions.
1 2
EATON 2015 Annual Report8
and industrial buildings meet new standards for energy efficiency while reducing operating costs. When compared to traditional lamps, Night Falcon LEDs can reduce energy and maintenance costs by up to 75 percent. Optional intelligent sensors dim light by 50 percent when no activity is detected, providing security while meeting stringent state codes for energy efficiency. Sports stadium lighting enters the digital age with our programmable LED system, reducing energy use while increasing illumination.
“ Our customers are constantly striving to innovate. They want our best thinking—delivered with the full force of Eaton’s talents.”
— UDAY YADAV, Chief Operating Officer, Industrial Sector
Keeping people and equipment safeSafety requirements are becoming more exacting as countries adopt standards defined by international organizations such as the International Standards Organization (ISO) and the International Electrotechnical Commission (IEC). Personnel and equipment safety is critical for all industries, of course, but especially so in harsh environments such as oil and gas, mining and other industrial applications. Our new IEC-compliant Power Xpert CXH motor control center offers advanced safety and arc mitigation technologies that exceed IEC/TR 61641. When equipped with our Power Xpert C445 motor management relay, advanced diagnostics—such as performance trending, fault analysis and high-accuracy data monitoring—help keep processes running smoothly, minimizing downtime.
Arcelor Mittal needed to retrofit a cooling system powered by antiquated electrical starters. The steel industry giant chose our award-winning new SC9000 EP adjustable frequency drive to pro-vide intelligent load management. The SC9000, the industry’s first fully integrated arc-resistant medium voltage drive, can reduce energy usage by up to 50 percent and is the industry’s only drive designed to prevent deadly arc faults, protecting worker’s lives.
Powering communities with reliable solarThe number of large-scale ground-mounted solar farms contin-ues to increase around the world. How do you manage weeds and grass around such installations? Ally with the sheep farm down the road. That’s the business-ecology model devised by North Carolina’s O2 emc, a developer of utility-scale solar farms that partnered with Eaton to provide reliable, affordable energy that meets state and federal sustainability goals and local utility specifications. In Colorado, our electrical distribution equipment and engineering services help power more than 1,600 homes with five community solar installations. And California’s Redwood Solar Farm relies on our solar inverters, distribution equipment and services to power 9,200 homes, helping local utilities meet the California Renewables Portfolio standard of generating 33 percent of energy from renewable sources by 2020.
Forward DynamicAround the world, businesses grapple with challenging dynamics—from slow growth economies and declining commodity prices to increasingly stringent global regulations. In fact, nearly 70 percent of U.S. CEOs rank the regulatory environment as having the greatest impact on business. Many countries have committed to ambitious targets for improving air quality, with some aiming to reduce greenhouse gas emissions by up to 80 percent by 2050. In this dynamic landscape, Eaton helps customers power forward.
Clearing the airWith the world’s population growing ever more mobile, clearing the air has become a top priority. At refineries in India and Kuwait, our ReactoGard V filtration system will help reduce sulfur content in crude oil while expanding overall production capacity. Removing sulfur is key to significantly reducing nitro-gen oxide and particulate matter emissions. For a major oil refinery in the Arabian Peninsula, Eaton’s filtration systems have a critical role in its massive upgrade and expansion, helping it meet stringent environmental requirements and the growing demand for ultra-low sulfur gasoline and diesel fuel.
For car and truck manufacturers, our new cylinder de-activation system helps improve fuel economy and reduce CO2 emissions. When full engine power isn’t needed, part of the engine shuts down, with the remaining active cylinders using less fuel and creating lower emissions. In the aerospace industry, the growing trend toward electrical equipment is expected to reduce unscheduled maintenance by up to 40 percent. Our digital fuel quantity measurement technology is increasing efficiency on the all-new Gulfstream G500 and G600 business jets. With more precise fuel readings, the need to carry large volumes of extra fuel is eliminated, reducing weight, fuel cost and carbon emissions. For Dassault Aviation’s new Falcon 5X business jet, we designed an advanced hydraulic power-generation system, simplifying the hydraulic system architecture and reducing weight while increasing safety. And, remote-monitoring tech-nology keeps flight and maintenance crews aware of system conditions during aircraft operation.
Shedding light on efficiency and securityBecause buildings consume 30 to 40 percent of the world’s energy, converting to highly efficient LED lighting makes sense. Our new Night Falcon LED exterior floodlights help commercial
EATON 2015 Annual Report 9

Every day, facility managers around the world need to keep the lights on and power distribution equipment running efficiently,
whether in a building, a data center, hospital or airport. For the more than 37 million passenger flights each year, fuel economy and aircraft safety is crucial. On the road, fleet drivers spend up to 300 days a year hauling big rigs, and it’s essential they minimize fuel use and emissions. And today’s intelligent electro-hydraulics permit the precise choreography needed between operator and machine to get the job done safely.
Sustainability represents an opportunity. From energy-efficient solutions to environmental programs to employees who strengthen our communities, we’re moving forward—with purpose.
Our new, expanded website opens a window into Eaton’s sustainability journey. Learn more about our commitment to protect our world and the communities where we live, work and do business.
www.eaton.com/sustainabilityreporting
Powerful purposeSUSTAINABILITY REPORTING AT EATON
EATON 2015 Annual Report10
5
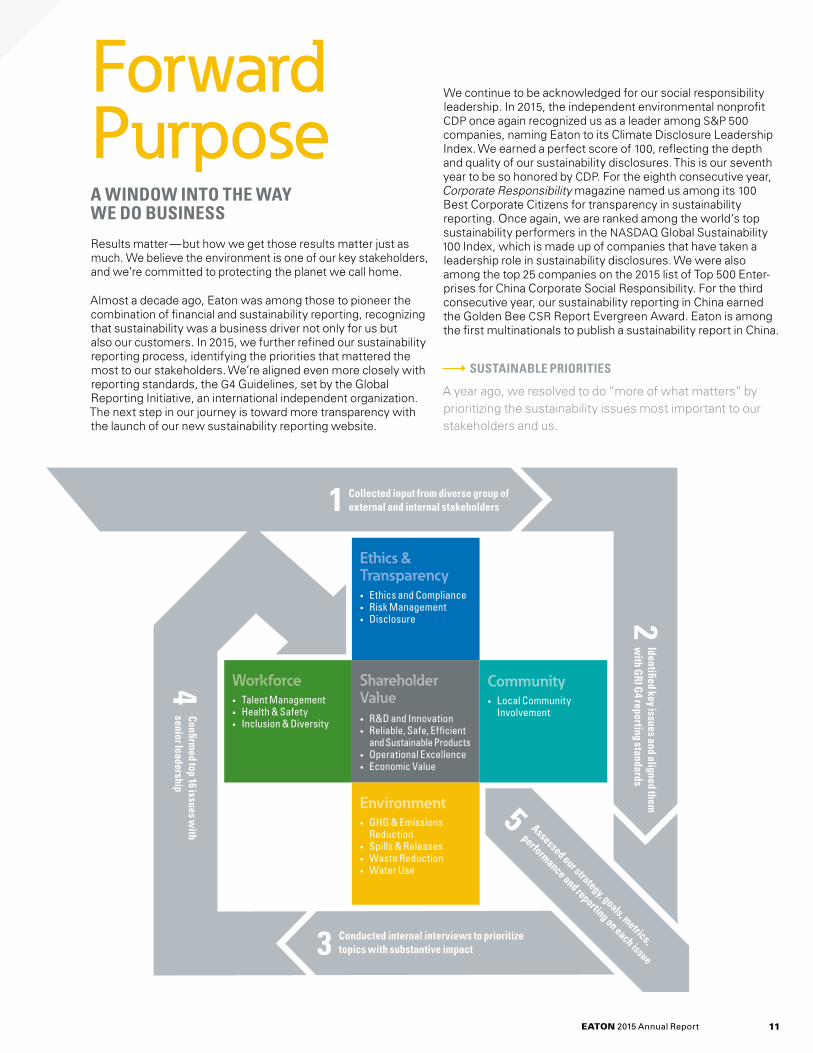
Shareholder Value• R&D and Innovation• Reliable, Safe, Efficient
and Sustainable Products• Operational Excellence• Economic Value
Workforce• Talent Management• Health & Safety• Inclusion & Diversity
Ethics & Transparency• Ethics and Compliance• Risk Management• Disclosure
Community• Local Community
Involvement
Environment• GHG & Emissions
Reduction• Spills & Releases• Waste Reduction• Water Use
Collected input from diverse group of external and internal stakeholders1
Identified key issues and aligned them
with GRI G
4 reporting standards2
Confirmed top 16 issues w
ith senior leadership
4
Conducted internal interviews to prioritize topics with substantive impact3
Assessed our strategy, goals, metrics,
performance and reporting on each issue
5
Forward PurposeA WINDOW INTO THE WAY WE DO BUSINESS
Results matter—but how we get those results matter just as much. We believe the environment is one of our key stakeholders, and we’re committed to protecting the planet we call home.
Almost a decade ago, Eaton was among those to pioneer the combination of financial and sustainability reporting, recognizing that sustainability was a business driver not only for us but also our customers. In 2015, we further refined our sustainability reporting process, identifying the priorities that mattered the most to our stakeholders. We’re aligned even more closely with reporting standards, the G4 Guidelines, set by the Global Reporting Initiative, an international independent organization. The next step in our journey is toward more transparency with the launch of our new sustainability reporting website.
We continue to be acknowledged for our social responsibility leadership. In 2015, the independent environmental nonprofit CDP once again recognized us as a leader among S&P 500 companies, naming Eaton to its Climate Disclosure Leadership Index. We earned a perfect score of 100, reflecting the depth and quality of our sustainability disclosures. This is our seventh year to be so honored by CDP. For the eighth consecutive year, Corporate Responsibility magazine named us among its 100 Best Corporate Citizens for transparency in sustainability reporting. Once again, we are ranked among the world’s top sustainability performers in the NASDAQ Global Sustainability 100 Index, which is made up of companies that have taken a leadership role in sustainability disclosures. We were also among the top 25 companies on the 2015 list of Top 500 Enter-prises for China Corporate Social Responsibility. For the third consecutive year, our sustainability reporting in China earned the Golden Bee CSR Report Evergreen Award. Eaton is among the first multinationals to publish a sustainability report in China.
SUSTAINABLE PRIORITIES
A year ago, we resolved to do “more of what matters” by prioritizing the sustainability issues most important to our stakeholders and us.
EATON 2015 Annual Report 11
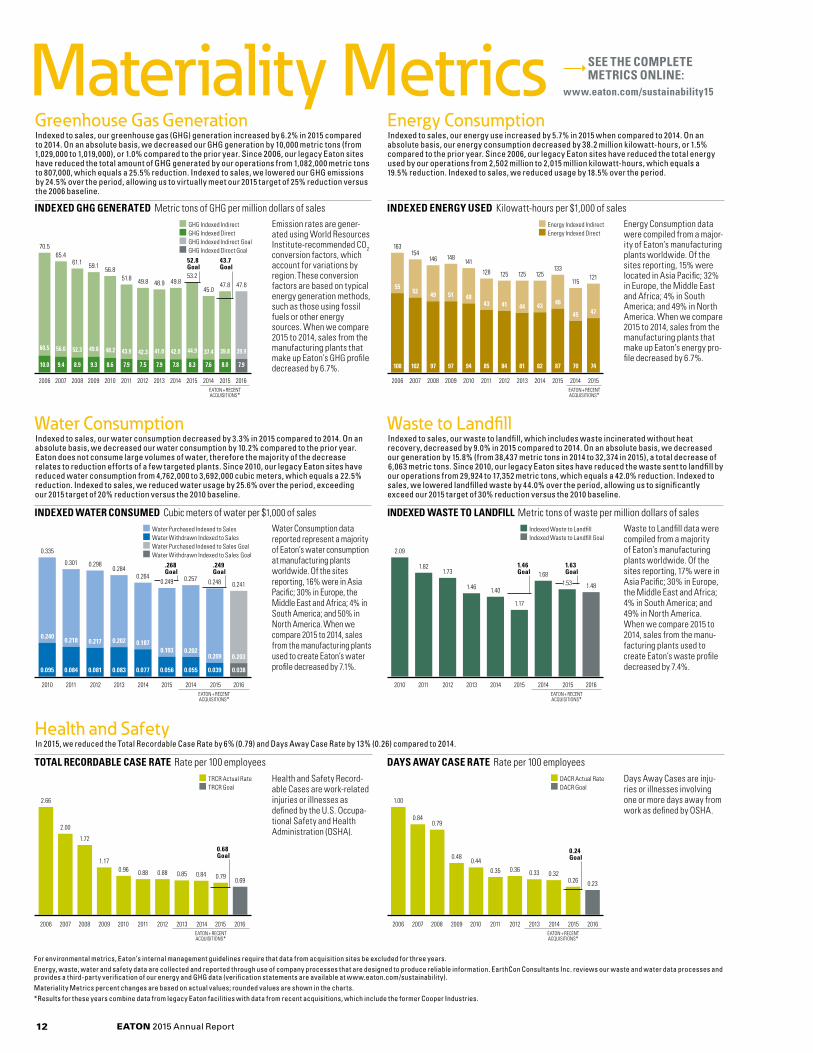
For environmental metrics, Eaton’s internal management guidelines require that data from acquisition sites be excluded for three years.Energy, waste, water and safety data are collected and reported through use of company processes that are designed to produce reliable information. EarthCon Consultants Inc. reviews our waste and water data processes and provides a third-party verification of our energy and GHG data (verification statements are available at www.eaton.com/sustainability). Materiality Metrics percent changes are based on actual values; rounded values are shown in the charts.*Results for these years combine data from legacy Eaton facilities with data from recent acquisitions, which include the former Cooper Industries.
SEE THE COMPLETE METRICS ONLINE:
www.eaton.com/sustainability15
Water Consumption data reported represent a majority of Eaton’s water consumption at manufacturing plants worldwide. Of the sites reporting, 16% were in Asia Pacific; 30% in Europe, the Middle East and Africa; 4% in South America; and 50% in North America. When we compare 2015 to 2014, sales from the manufacturing plants used to create Eaton’s water profile decreased by 7.1%.
INDEXED WATER CONSUMED Cubic meters of water per $1,000 of sales
0.240
0.335
0.095
Water Purchased Indexed to Sales Water Withdrawn Indexed to Sales Water Purchased Indexed to Sales Goal Water Withdrawn Indexed to Sales Goal
Water ConsumptionIndexed to sales, our water consumption decreased by 3.3% in 2015 compared to 2014. On an absolute basis, we decreased our water consumption by 10.2% compared to the prior year. Eaton does not consume large volumes of water, therefore the majority of the decrease relates to reduction efforts of a few targeted plants. Since 2010, our legacy Eaton sites have reduced water consumption from 4,762,000 to 3,692,000 cubic meters, which equals a 22.5% reduction. Indexed to sales, we reduced water usage by 25.6% over the period, exceeding our 2015 target of 20% reduction versus the 2010 baseline.
2.09
1.821.73
1.17
Waste to LandfillIndexed to sales, our waste to landfill, which includes waste incinerated without heat recovery, decreased by 9.0% in 2015 compared to 2014. On an absolute basis, we decreased our generation by 15.8% (from 38,437 metric tons in 2014 to 32,374 in 2015), a total decrease of 6,063 metric tons. Since 2010, our legacy Eaton sites have reduced the waste sent to landfill by our operations from 29,924 to 17,352 metric tons, which equals a 42.0% reduction. Indexed to sales, we lowered landfilled waste by 44.0% over the period, allowing us to significantly exceed our 2015 target of 30% reduction versus the 2010 baseline.
Waste to Landfill data were compiled from a majority of Eaton’s manufacturing plants worldwide. Of the sites reporting, 17% were in Asia Pacific; 30% in Europe, the Middle East and Africa; 4% in South America; and 49% in North America. When we compare 2015 to 2014, sales from the manu-facturing plants used to create Eaton’s waste profile decreased by 7.4%.
INDEXED WASTE TO LANDFILL Metric tons of waste per million dollars of sales Indexed Waste to Landfill Indexed Waste to Landfill Goal
1.46
Health and SafetyIn 2015, we reduced the Total Recordable Case Rate by 6% (0.79) and Days Away Case Rate by 13% (0.26) compared to 2014.
Health and Safety Record-able Cases are work-related injuries or illnesses as defined by the U.S. Occupa-tional Safety and Health Administration (OSHA).
DAYS AWAY CASE RATE Rate per 100 employees DACR Actual Rate DACR Goal
TOTAL RECORDABLE CASE RATE Rate per 100 employees TRCR Actual Rate TRCR Goal
2.00
1.72
1.17
0.88 0.88 0.850.96
0.84
2.66
2006
0.79
Greenhouse Gas GenerationIndexed to sales, our greenhouse gas (GHG) generation increased by 6.2% in 2015 compared to 2014. On an absolute basis, we decreased our GHG generation by 10,000 metric tons (from 1,029,000 to 1,019,000), or 1.0% compared to the prior year. Since 2006, our legacy Eaton sites have reduced the total amount of GHG generated by our operations from 1,082,000 metric tons to 807,000, which equals a 25.5% reduction. Indexed to sales, we lowered our GHG emissions by 24.5% over the period, allowing us to virtually meet our 2015 target of 25% reduction versus the 2006 baseline.
Emission rates are gener-ated using World Resources Institute-recommended CO2 conversion factors, which account for variations by region. These conversion factors are based on typical energy generation methods, such as those using fossil fuels or other energy sources. When we compare 2015 to 2014, sales from the manufacturing plants that make up Eaton’s GHG profile decreased by 6.7%.
INDEXED GHG GENERATED Metric tons of GHG per million dollars of sales GHG Indexed Indirect GHG Indexed Direct GHG Indexed Indirect Goal GHG Indexed Direct Goal
Energy Consumption data were compiled from a major-ity of Eaton’s manufacturing plants worldwide. Of the sites reporting, 15% were located in Asia Pacific; 32% in Europe, the Middle East and Africa; 4% in South America; and 49% in North America. When we compare 2015 to 2014, sales from the manufacturing plants that make up Eaton’s energy pro-file decreased by 6.7%.
INDEXED ENERGY USED Kilowatt-hours per $1,000 of sales Energy Indexed Indirect Energy Indexed Direct
55
163
108
Energy ConsumptionIndexed to sales, our energy use increased by 5.7% in 2015 when compared to 2014. On an absolute basis, our energy consumption decreased by 38.2 million kilowatt-hours, or 1.5% compared to the prior year. Since 2006, our legacy Eaton sites have reduced the total energy used by our operations from 2,502 million to 2,015 million kilowatt-hours, which equals a 19.5% reduction. Indexed to sales, we reduced usage by 18.5% over the period.
70.5
10.0
2006
Days Away Cases are inju-ries or illnesses involving one or more days away from work as defined by OSHA.
1.40
Materiality Metrics
9.4 8.9 9.3 8.6 7.9 7.5 7.9 7.8 8.3 7.6 8.0 7.9
56.0 52.3 49.8 48.2 43.9 42.3 41.0 42.0 44.9 37.4 39.8 39.9
2007 2008 2009 2010 2011 2012 2013 2014 2015 2014 2015 2016
65.461.1 59.1 56.8
51.8 49.8 48.9 49.853.2
45.047.8 47.8
2006 2007 2008 2009 2010 2011 2012 2013 2014 2015 2014 2015
52
154
102
49
146
97
51
148
97
48
141
94
43
128
85
41
125
84
44
125
81
43
125
82
46
133
87
45
115
70
47
121
74
2010 2011 2012 2013 2014 2015 2014
0.084 0.081 0.083 0.077 0.056 0.055 0.039 0.038
0.218 0.217 0.202 0.1870.193 0.202
0.209 0.203
0.301 0.2980.284
0.264 0.257 0.248 0.241
.249Goal
2015 2016 2010 2011 2012 2013 2014 2015 2014 2015 2016
1.68
1.48
1.63Goal
1.53
2007 2008 2009 2010 2011 2012 2013 2014 2015 2016
0.69
0.68Goal
2006 2007 2008 2009 2010 2011 2012 2013 2014 2015 2016
0.840.79
0.48
0.35 0.36 0.33
0.44
0.32
1.00
0.26 0.23
0.24Goal
60.5
52.8Goal
EATON + RECENT ACQUISITIONS*
EATON + RECENT ACQUISITIONS*
43.7Goal
EATON + RECENT ACQUISITIONS*
.268Goal
0.249
EATON + RECENT ACQUISITIONS*
1.46Goal
EATON + RECENT ACQUISITIONS*
EATON + RECENT ACQUISITIONS*
EATON 2015 Annual Report12
Meeting the challenge to protect the environment
Most think about sustainability as an exercise in subtraction—reducing GHG emissions, conserving water or eliminating waste to landfill. But there’s addition, too. When we develop a manufacturing process that uses fewer resources. Or when an Eaton solution helps our customers use energy more efficiently. Or when our employees volunteer to improve their communities.
When we examine the full equation—how our actions and our products affect the environment—we learn that it’s a matter of taking away and giving back, and reaching for a “net positive.”
During 2015, Eaton became a partner in the Sustainability & Health Initiative for NetPositive Enterprise (SHINE). Developed by Harvard’s T.H. Chan School of Public Health, SHINE is creating a framework and metrics to help companies quantify their positive impact. Eaton is taking steps to better measure our own net positive activities, from considering the environmental impact of our products over their lifecycle, to sustainability efforts in our facilities, and to our commitment to community outreach.
For example, Eaton is leading a consortium of manufacturers, users and academics to research ways to build smarter, more energy-efficient data centers, the GreenDataNet project. The ultimate goal is to develop new technologies that will allow urban data centers—which consume a tremendous amount of energy—to use renewable power sources for most of their power needs.
Since 2010, we have reduced waste sent to landfill by 12,572 metric tons, or 44.0 percent (indexed to sales). We reduced our water consumption by 1,070 thousand cubic meters, or 25.6 percent (indexed to sales). Since 2006, we have reduced the total amount of GHG generated by our operations by nearly 276 thousand metric tons, a reduction of 24.5 percent (indexed to sales).
In 2015, 69 of our facilities sent no waste to the landfill, up from 44 the prior year. An Eaton facility is designated as a zero waste-to-landfill site when it consistently achieves a diversion rate of 98 percent through recycling, reuse, composting or incineration (when the heat generated is collected and used to create more energy than required for incineration). By reducing the volume of waste sent to landfills, our global zero waste-to-landfill program also helps reduce the release of GHG associated with landfills.
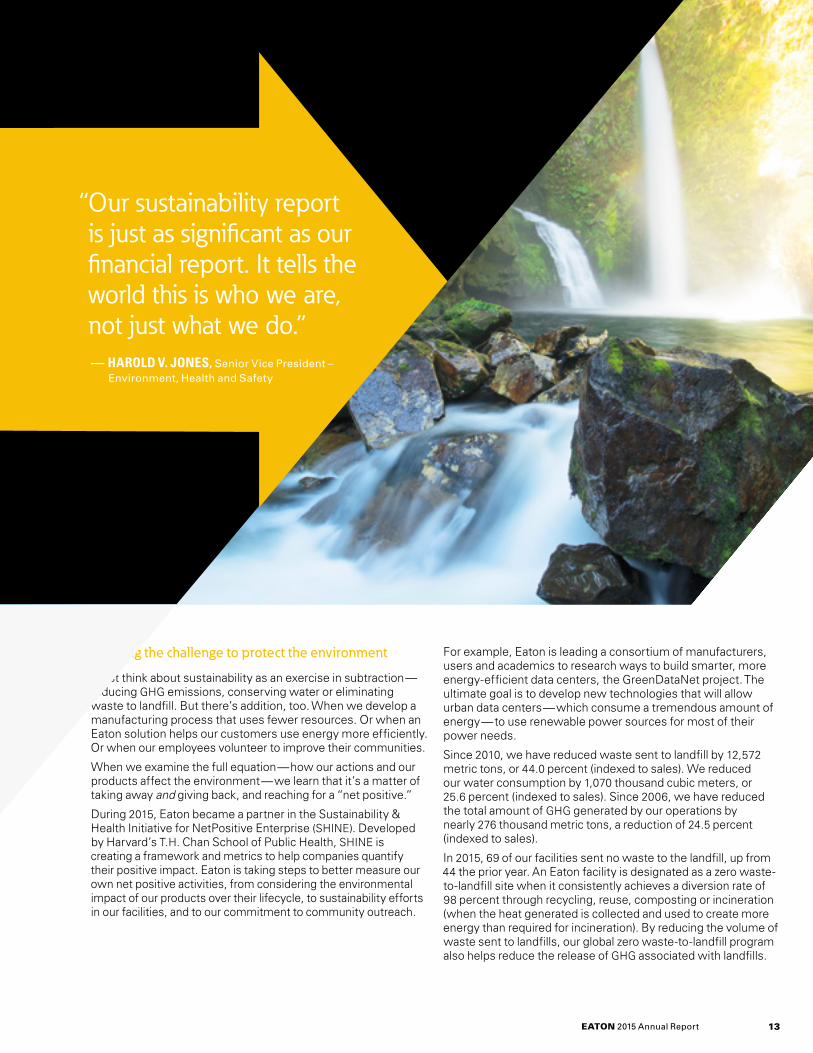
“ Our sustainability report is just as significant as our financial report. It tells the world this is who we are, not just what we do.”
— HAROLD V. JONES, Senior Vice President – Environment, Health and Safety
EATON 2015 Annual Report 13
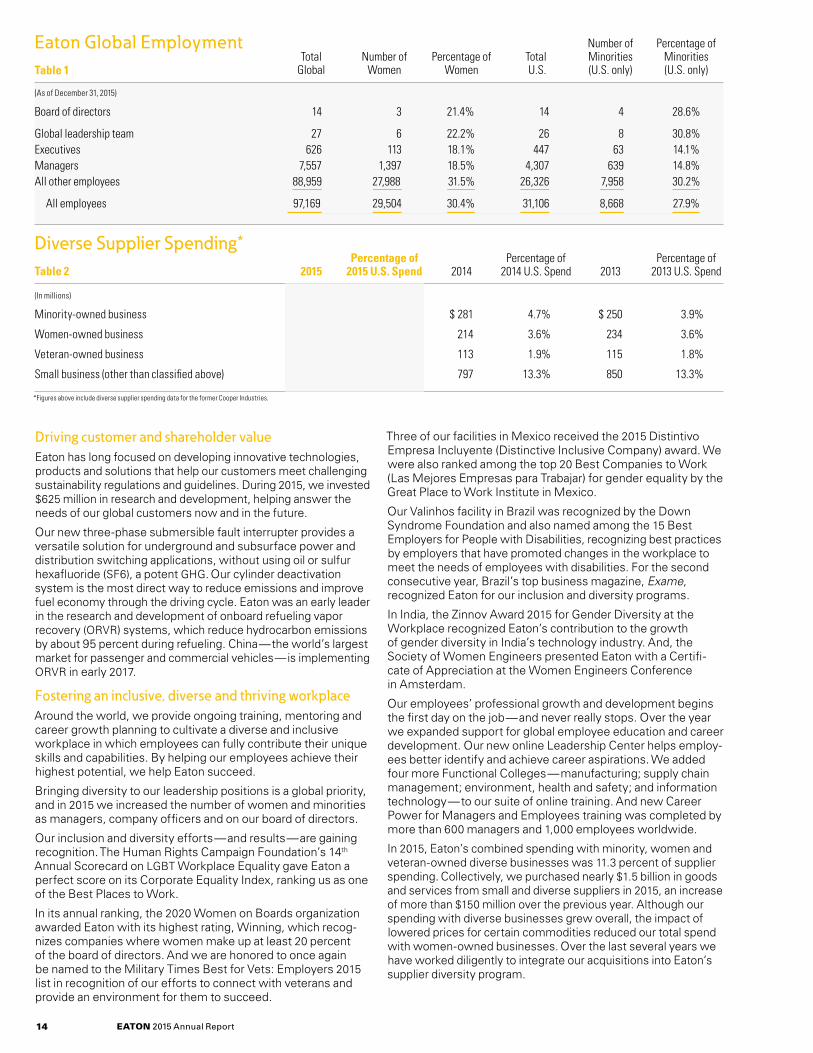
Number of Percentage of Total Number of Percentage of Total Minorities Minorities Global Women Women U.S. (U.S. only) (U.S. only)
(As of December 31, 2015)
Board of directors 14 3 21.4% 14 4 28.6%
Global leadership team 27 6 22.2% 26 8 30.8%Executives 626 113 18.1% 447 63 14.1%Managers 7,557 1,397 18.5% 4,307 639 14.8%All other employees 88,959 27,988 31.5% 26,326 7,958 30.2%
All employees 97,169 29,504 30.4% 31,106 8,668 27.9%
Percentage of Percentage of Percentage of 2015 2015 U.S. Spend 2014 2014 U.S. Spend 2013 2013 U.S. Spend
(In millions)
Minority-owned business $ 310 5.5% $ 281 4.7% $ 250 3.9%
Women-owned business 206 3.7% 214 3.6% 234 3.6%
Veteran-owned business 120 2.1% 113 1.9% 115 1.8%
Small business (other than classified above) 928 16.6% 797 13.3% 850 13.3%
Eaton Global EmploymentTable 1
Diverse Supplier Spending*
Table 2
Driving customer and shareholder valueEaton has long focused on developing innovative technologies, products and solutions that help our customers meet challenging sustainability regulations and guidelines. During 2015, we invested $625 million in research and development, helping answer the needs of our global customers now and in the future.
Our new three-phase submersible fault interrupter provides a versatile solution for underground and subsurface power and distribution switching applications, without using oil or sulfur hexafluoride (SF6), a potent GHG. Our cylinder deactivation system is the most direct way to reduce emissions and improve fuel economy through the driving cycle. Eaton was an early leader in the research and development of onboard refueling vapor recovery (ORVR) systems, which reduce hydrocarbon emissions by about 95 percent during refueling. China—the world’s largest market for passenger and commercial vehicles—is implementing ORVR in early 2017.
Fostering an inclusive, diverse and thriving workplaceAround the world, we provide ongoing training, mentoring and career growth planning to cultivate a diverse and inclusive workplace in which employees can fully contribute their unique skills and capabilities. By helping our employees achieve their highest potential, we help Eaton succeed.
Bringing diversity to our leadership positions is a global priority, and in 2015 we increased the number of women and minorities as managers, company officers and on our board of directors.
Our inclusion and diversity efforts—and results—are gaining recognition. The Human Rights Campaign Foundation’s 14th Annual Scorecard on LGBT Workplace Equality gave Eaton a perfect score on its Corporate Equality Index, ranking us as one of the Best Places to Work.
In its annual ranking, the 2020 Women on Boards organization awarded Eaton with its highest rating, Winning, which recog-nizes companies where women make up at least 20 percent of the board of directors. And we are honored to once again be named to the Military Times Best for Vets: Employers 2015 list in recognition of our efforts to connect with veterans and provide an environment for them to succeed.
Three of our facilities in Mexico received the 2015 Distintivo Empresa Incluyente (Distinctive Inclusive Company) award. We were also ranked among the top 20 Best Companies to Work (Las Mejores Empresas para Trabajar) for gender equality by the Great Place to Work Institute in Mexico.
Our Valinhos facility in Brazil was recognized by the Down Syndrome Foundation and also named among the 15 Best Employers for People with Disabilities, recognizing best practices by employers that have promoted changes in the workplace to meet the needs of employees with disabilities. For the second consecutive year, Brazil’s top business magazine, Exame, recognized Eaton for our inclusion and diversity programs.
In India, the Zinnov Award 2015 for Gender Diversity at the Workplace recognized Eaton’s contribution to the growth of gender diversity in India’s technology industry. And, the Society of Women Engineers presented Eaton with a Certifi-cate of Appreciation at the Women Engineers Conference in Amsterdam.
Our employees’ professional growth and development begins the first day on the job—and never really stops. Over the year we expanded support for global employee education and career development. Our new online Leadership Center helps employ-ees better identify and achieve career aspirations. We added four more Functional Colleges—manufacturing; supply chain management; environment, health and safety; and information technology—to our suite of online training. And new Career Power for Managers and Employees training was completed by more than 600 managers and 1,000 employees worldwide.
In 2015, Eaton’s combined spending with minority, women and veteran-owned diverse businesses was 11.3 percent of supplier spending. Collectively, we purchased nearly $1.5 billion in goods and services from small and diverse suppliers in 2015, an increase of more than $150 million over the previous year. Although our spending with diverse businesses grew overall, the impact of lowered prices for certain commodities reduced our total spend with women-owned businesses. Over the last several years we have worked diligently to integrate our acquisitions into Eaton’s supplier diversity program.
*Figures above include diverse supplier spending data for the former Cooper Industries.
EATON 2015 Annual Report14
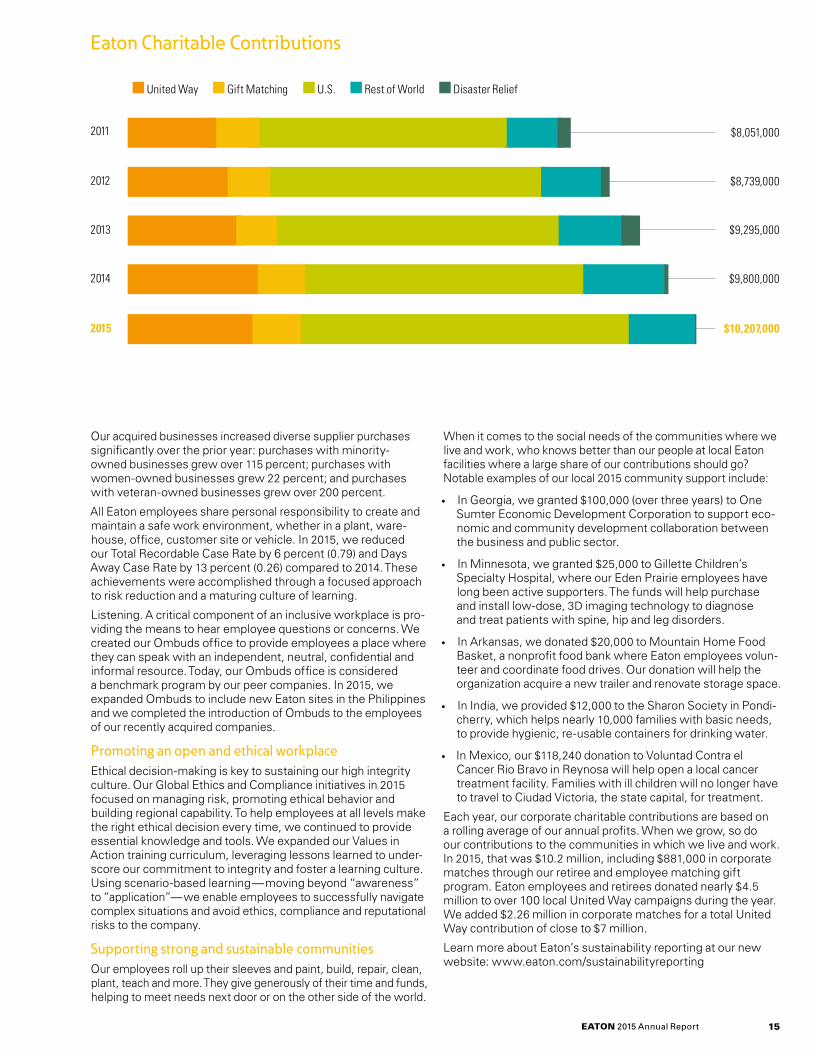
United Way Gift Matching U.S. Rest of World Disaster Relief
Eaton Charitable Contributions
$8,051,0002011
2012 $8,739,000
2013 $9,295,000
2014 $9,800,000
Our acquired businesses increased diverse supplier purchases significantly over the prior year: purchases with minority- owned businesses grew over 115 percent; purchases with women-owned businesses grew 22 percent; and purchases with veteran-owned businesses grew over 200 percent.
All Eaton employees share personal responsibility to create and maintain a safe work environment, whether in a plant, ware-house, office, customer site or vehicle. In 2015, we reduced our Total Recordable Case Rate by 6 percent (0.79) and Days Away Case Rate by 13 percent (0.26) compared to 2014. These achievements were accomplished through a focused approach to risk reduction and a maturing culture of learning.
Listening. A critical component of an inclusive workplace is pro-viding the means to hear employee questions or concerns. We created our Ombuds office to provide employees a place where they can speak with an independent, neutral, confidential and informal resource. Today, our Ombuds office is considered a benchmark program by our peer companies. In 2015, we expanded Ombuds to include new Eaton sites in the Philippines and we completed the introduction of Ombuds to the employees of our recently acquired companies.
Promoting an open and ethical workplace Ethical decision-making is key to sustaining our high integrity culture. Our Global Ethics and Compliance initiatives in 2015 focused on managing risk, promoting ethical behavior and building regional capability. To help employees at all levels make the right ethical decision every time, we continued to provide essential knowledge and tools. We expanded our Values in Action training curriculum, leveraging lessons learned to under-score our commitment to integrity and foster a learning culture. Using scenario-based learning—moving beyond “awareness” to “application”—we enable employees to successfully navigate complex situations and avoid ethics, compliance and reputational risks to the company.
Supporting strong and sustainable communities Our employees roll up their sleeves and paint, build, repair, clean, plant, teach and more. They give generously of their time and funds, helping to meet needs next door or on the other side of the world.
When it comes to the social needs of the communities where we live and work, who knows better than our people at local Eaton facilities where a large share of our contributions should go? Notable examples of our local 2015 community support include:
• In Georgia, we granted $100,000 (over three years) to One Sumter Economic Development Corporation to support eco-nomic and community development collaboration between the business and public sector.
• In Minnesota, we granted $25,000 to Gillette Children’s Specialty Hospital, where our Eden Prairie employees have long been active supporters. The funds will help purchase and install low-dose, 3D imaging technology to diagnose and treat patients with spine, hip and leg disorders.
• In Arkansas, we donated $20,000 to Mountain Home Food Basket, a nonprofit food bank where Eaton employees volun-teer and coordinate food drives. Our donation will help the organization acquire a new trailer and renovate storage space.
• In India, we provided $12,000 to the Sharon Society in Pondi-cherry, which helps nearly 10,000 families with basic needs, to provide hygienic, re-usable containers for drinking water.
• In Mexico, our $118,240 donation to Voluntad Contra el Cancer Rio Bravo in Reynosa will help open a local cancer treatment facility. Families with ill children will no longer have to travel to Ciudad Victoria, the state capital, for treatment.
Each year, our corporate charitable contributions are based on a rolling average of our annual profits. When we grow, so do our contributions to the communities in which we live and work. In 2015, that was $10.2 million, including $881,000 in corporate matches through our retiree and employee matching gift program. Eaton employees and retirees donated nearly $4.5 million to over 100 local United Way campaigns during the year. We added $2.26 million in corporate matches for a total United Way contribution of close to $7 million.
Learn more about Eaton’s sustainability reporting at our new website: www.eaton.com/sustainabilityreporting
2015 $10,207,000
EATON 2015 Annual Report 15
17 Reports on Financial Statements18 Reports on Internal Control Over Financial Reporting19 Consolidated Financial Statements24 Notes to Consolidated Financial Statements48 Management’s Discussion and Analysis54 Quarterly Data55 Ten-Year Consolidated Financial Summary56 Directors and Leadership Team57 Shareholder Information
For more financial information: www.eaton.com/financials15
FINANCIAL INFORMATION
Forward Motion
“ Our balance provides stability. Through uneven market conditions, Eaton has produced strong results.”
— RICHARD H. FEARON Vice Chairman and Chief Financial and Planning Officer
EATON 2015 Annual Report16
EATON 2015 Annual Report 17
The Board of Directors and Shareholders of Eaton Corporation plc
We have audited the accompanying consolidated balance sheets of Eaton Corporation plc (“the Company”) as of December 31, 2015 and 2014, and the related consolidated statements of income, comprehensive income, shareholders' equity and cash flows for each of the three years in the period ended December 31, 2015. These financial statements are the responsibility of the Company's management. Our responsibility is to express an opinion on these financial statements based on our audits.
We conducted our audits in accordance with the standards of the Public Company Accounting Oversight Board (United States). Those standards require that we plan and perform the audit to obtain reasonable assurance about whether the financial statements are free of material misstatement. An audit includes examining, on a test basis, evidence supporting the amounts and disclosures in the financial statements. An audit also includes assessing the accounting principles used and significant estimates made by management, as well as evaluating the overall financial statement presentation. We believe that our audits provide a reasonable basis for our opinion.
In our opinion, the financial statements referred to above present fairly, in all material respects, the consolidated financial position of the Company at December 31, 2015 and 2014, and the consolidated results of its operations and its cash flows for each of the three years in the period ended December 31, 2015, in conformity with U.S. generally accepted accounting principles.
We also have audited, in accordance with the standards of the Public Company Accounting Oversight Board (United States), the Company's internal control over financial reporting as of December 31, 2015, based on criteria established in Internal Control - Integrated Framework issued by the Committee of Sponsoring Organizations of the Treadway Commission (2013 Framework) and our report dated February 24, 2016 expressed an unqualified opinion thereon.
As discussed in Note 1 to the consolidated financial statements, the Company changed its presentation of deferred income taxes effective December 31, 2015.
Ernst & Young LLP
Cleveland, Ohio February 24, 2016
Report of Independent Registered Public Accounting Firm
We have prepared the accompanying consolidated financial statements and related information of Eaton Corporation plc ("Eaton") included herein for the three years ended December 31, 2015. The primary responsibility for the integrity of the financial information included in this annual report rests with management. The financial information included in this annual report has been prepared in accordance with accounting principles generally accepted in the United States based on our best estimates and judgments and giving due consideration to materiality. The opinion of Ernst & Young LLP, Eaton's independent registered public accounting firm, on those financial statements is included herein.
Eaton has high standards of ethical business practices supported by the Eaton Code of Ethics and corporate policies. Careful attention is given to selecting, training and developing personnel, to ensure that management's objectives of establishing and maintaining adequate internal controls and unbiased, uniform reporting standards are attained. Our policies and procedures provide reasonable assurance that operations are conducted in conformity with applicable laws and with the Company's commitment to a high standard of business conduct.
The Board of Directors pursues its responsibility for the quality of Eaton's financial reporting primarily through its Audit Committee, which is composed of five inde-pendent directors. The Audit Committee meets regularly with management, the internal auditors and the independent registered public accounting firm to ensure that they are meeting their responsibilities and to discuss matters concerning accounting, control, audits and financial reporting. The internal auditors and inde-pendent registered public accounting firm have full and free access to senior management and the Audit Committee.
Management’s Report on Financial Statements
Alexander M. Cutler
Principal Executive Officer
Richard H. Fearon
Principal Financial Officer
Ken D. Semelsberger
Principal Accounting Officer
February 24, 2016
EATON 2015 Annual Report18
Alexander M. Cutler
Principal Executive Officer
Richard H. Fearon
Principal Financial Officer
Ken D. Semelsberger
Principal Accounting Officer
February 24, 2016
The Board of Directors and Shareholders of Eaton Corporation plc
We have audited Eaton Corporation plc’s (“the Company”) internal control over financial reporting as of December 31, 2015, based on criteria established in Internal Control-Integrated Framework issued by the Committee of Sponsoring Organizations of the Treadway Commission (2013 Framework) (the COSO criteria). The Company’s management is responsible for maintaining effective internal control over financial reporting, and for its assessment of the effectiveness of internal control over financial reporting included in the accompanying Manage-ment’s Report on Internal Control Over Financial Reporting. Our responsibility is to express an opinion on the Company’s internal control over financial reporting based on our audit.
We conducted our audit in accordance with the standards of the Public Company Accounting Oversight Board (United States). Those standards require that we plan and perform the audit to obtain reasonable assurance about whether effec-tive internal control over financial reporting was maintained in all material respects. Our audit included obtaining an understanding of internal control over financial reporting, assessing the risk that a material weakness exists, testing and evaluating the design and operating effectiveness of internal control based on the assessed risk, and performing such other procedures as we considered necessary in the circumstances. We believe that our audit provides a reasonable basis for our opinion.
A company’s internal control over financial reporting is a process designed to provide reasonable assurance regarding the reliability of financial reporting and the preparation of financial statements for external purposes in accordance with generally accepted accounting principles. A company’s internal control over financial reporting includes those policies and procedures that (1) pertain to the maintenance of records that, in reasonable detail, accurately and fairly reflect the transactions and dispositions of the assets of the company; (2) provide reasonable assurance that transactions are recorded as necessary to permit preparation of financial statements in accordance with generally accepted accounting principles, and that receipts and expenditures of the company are being made only in accordance with authorizations of management and directors of the company; and (3) provide reasonable assurance regarding prevention or timely detection of unauthorized acquisition, use, or disposition of the company’s assets that could have a material effect on the financial statements.
Because of its inherent limitations, internal control over financial reporting may not prevent or detect misstatements. Also, projections of any evaluation of effectiveness to future periods are subject to the risk that controls may become inadequate because of changes in conditions, or that the degree of compliance with the policies or procedures may deteriorate.
In our opinion, the Company maintained, in all material respects, effective internal control over financial reporting as of December 31, 2015 based on the COSO criteria.
We also have audited, in accordance with the standards of the Public Company Accounting Oversight Board (United States), the consolidated balance sheets of the Company as of December 31, 2015 and 2014, and the related consolidated statements of income, comprehensive income, shareholders’ equity and cash flows for each of the three years in the period ended December 31, 2015 and our report dated February 24, 2016 expressed an unqualified opinion thereon.
Ernst & Young LLP
Cleveland, Ohio February 24, 2016
Report of Independent Registered Public Accounting Firm
The management of Eaton Corporation plc ("Eaton") is responsible for establish-ing and maintaining adequate internal control over financial reporting (as defined in Exchange Act rules 13a-15(f)).
Under the supervision and with the participation of Eaton's management, including our principal executive officer and principal financial officer, we conducted an evaluation of the effectiveness of the Company's internal control over financial reporting as of December 31, 2015. In conducting this evaluation, we used the framework set forth by the Committee of Sponsoring Organizations of the Treadway Commission in Internal Control - Integrated Framework (2013 Framework). Based on this evaluation under the framework referred to above, management concluded that the Company's internal control over financial reporting was effective as of December 31, 2015.
The independent registered public accounting firm Ernst & Young LLP has issued an audit report on the effectiveness of the Company's internal control over finan-cial reporting as of December 31, 2015. This report is included herein.
Management’s Report on Internal Control Over Financial Reporting
EATON 2015 Annual Report 19
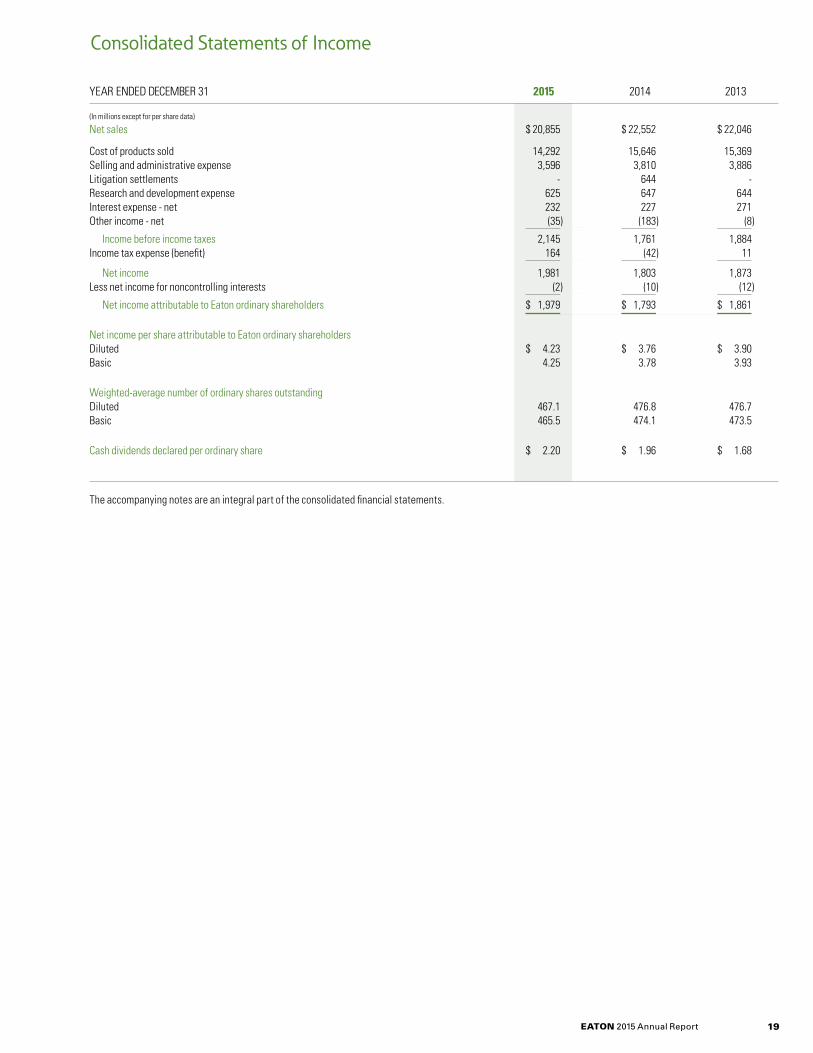
YEAR ENDED DECEMBER 31 2015 2014 2013
(In millions except for per share data)
Net sales $ 20,855 $ 22,552 $ 22,046
Cost of products sold 14,292 15,646 15,369Selling and administrative expense 3,596 3,810 3,886Litigation settlements - 644 -Research and development expense 625 647 644Interest expense - net 232 227 271Other income - net (35) (183) (8)
Income before income taxes 2,145 1,761 1,884Income tax expense (benefit) 164 (42) 11
Net income 1,981 1,803 1,873Less net income for noncontrolling interests (2) (10) (12)
Net income attributable to Eaton ordinary shareholders $ 1,979 $ 1,793 $ 1,861
Net income per share attributable to Eaton ordinary shareholdersDiluted $ 4.23 $ 3.76 $ 3.90Basic 4.25 3.78 3.93
Weighted-average number of ordinary shares outstandingDiluted 467.1 476.8 476.7Basic 465.5 474.1 473.5
Cash dividends declared per ordinary share $ 2.20 $ 1.96 $ 1.68
The accompanying notes are an integral part of the consolidated financial statements.
Consolidated Statements of Income
EATON 2015 Annual Report20
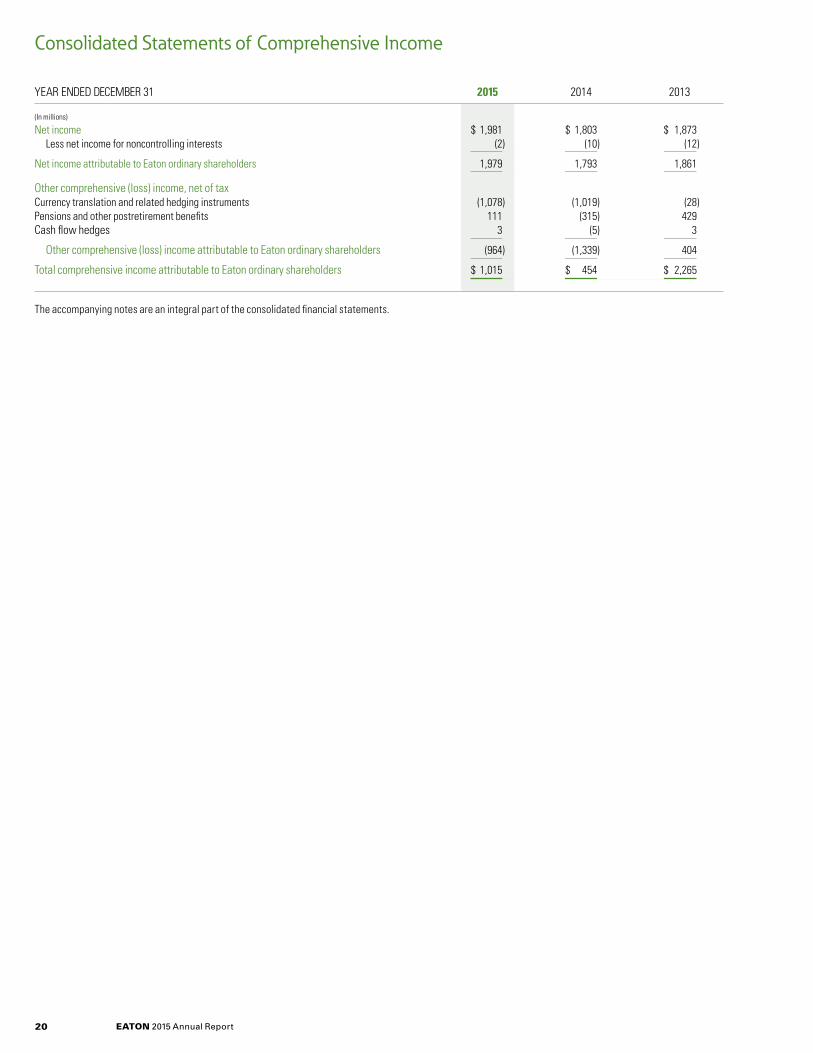
Consolidated Statements of Comprehensive Income
YEAR ENDED DECEMBER 31 2015 2014 2013
(In millions)
Net income $ 1,981 $ 1,803 $ 1,873 Less net income for noncontrolling interests (2) (10) (12)
Net income attributable to Eaton ordinary shareholders 1,979 1,793 1,861
Other comprehensive (loss) income, net of taxCurrency translation and related hedging instruments (1,078) (1,019) (28)Pensions and other postretirement benefits 111 (315) 429Cash flow hedges 3 (5) 3
Other comprehensive (loss) income attributable to Eaton ordinary shareholders (964) (1,339) 404
Total comprehensive income attributable to Eaton ordinary shareholders $ 1,015 $ 454 $ 2,265
The accompanying notes are an integral part of the consolidated financial statements.
EATON 2015 Annual Report 21
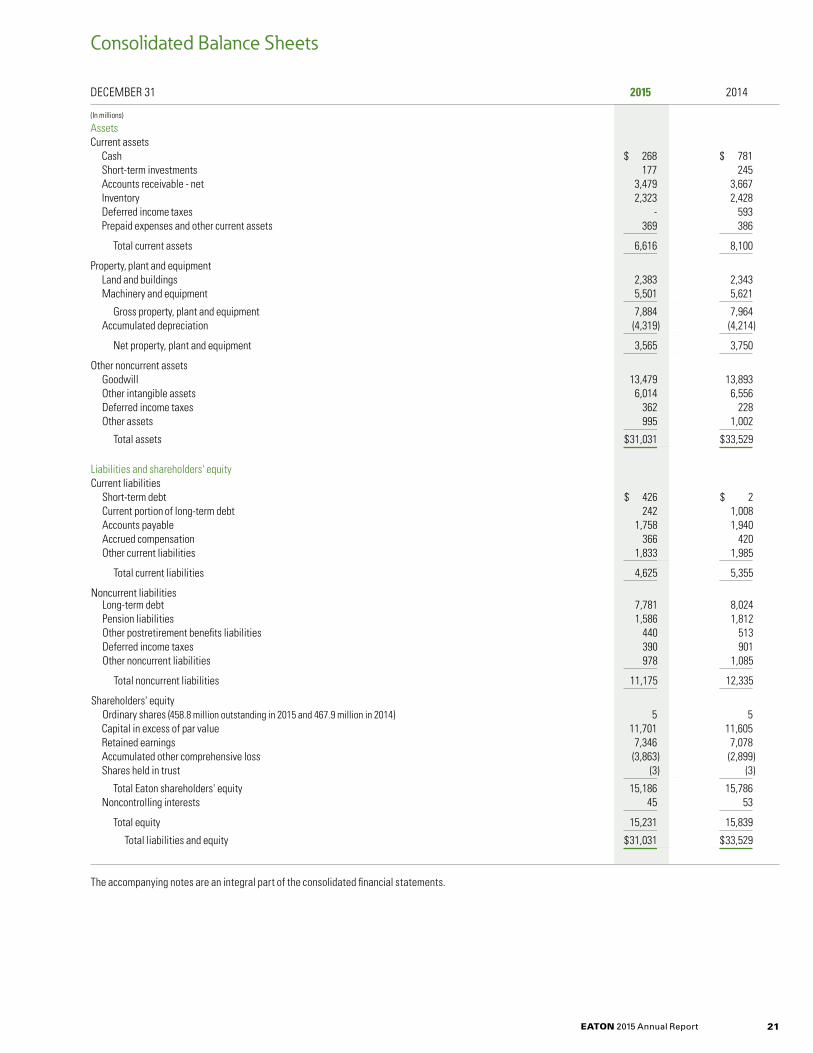
DECEMBER 31 2015 2014
(In millions)
AssetsCurrent assets Cash $ 268 $ 781 Short-term investments 177 245 Accounts receivable - net 3,479 3,667 Inventory 2,323 2,428 Deferred income taxes - 593 Prepaid expenses and other current assets 369 386
Total current assets 6,616 8,100
Property, plant and equipment Land and buildings 2,383 2,343 Machinery and equipment 5,501 5,621
Gross property, plant and equipment 7,884 7,964 Accumulated depreciation (4,319) (4,214)
Net property, plant and equipment 3,565 3,750
Other noncurrent assets Goodwill 13,479 13,893 Other intangible assets 6,014 6,556 Deferred income taxes 362 228 Other assets 995 1,002
Total assets $ 31,031 $ 33,529
Liabilities and shareholders' equityCurrent liabilities Short-term debt $ 426 $ 2 Current portion of long-term debt 242 1,008 Accounts payable 1,758 1,940 Accrued compensation 366 420 Other current liabilities 1,833 1,985
Total current liabilities 4,625 5,355
Noncurrent liabilities Long-term debt 7,781 8,024 Pension liabilities 1,586 1,812 Other postretirement benefits liabilities 440 513 Deferred income taxes 390 901 Other noncurrent liabilities 978 1,085
Total noncurrent liabilities 11,175 12,335
Shareholders' equity Ordinary shares (458.8 million outstanding in 2015 and 467.9 million in 2014) 5 5 Capital in excess of par value 11,701 11,605 Retained earnings 7,346 7,078 Accumulated other comprehensive loss (3,863) (2,899) Shares held in trust (3) (3)
Total Eaton shareholders' equity 15,186 15,786 Noncontrolling interests 45 53
Total equity 15,231 15,839
Total liabilities and equity $ 31,031 $ 33,529
The accompanying notes are an integral part of the consolidated financial statements.
Consolidated Balance Sheets
EATON 2015 Annual Report22
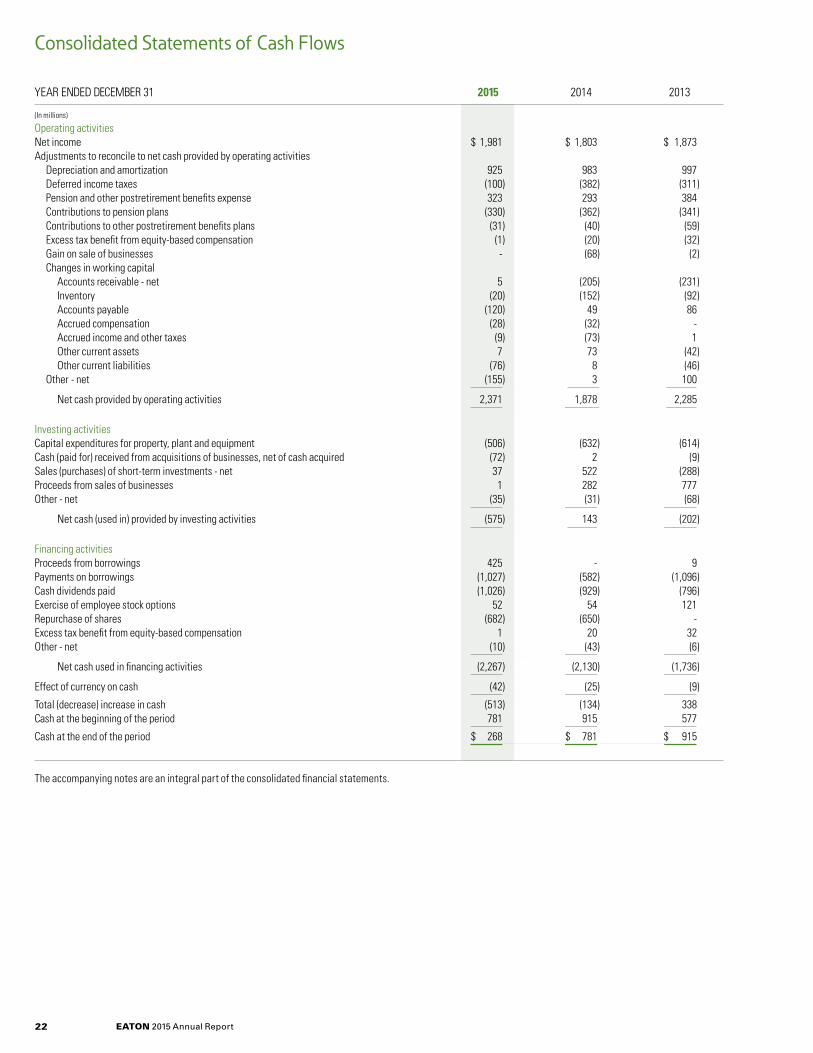
YEAR ENDED DECEMBER 31 2015 2014 2013
(In millions)
Operating activitiesNet income $ 1,981 $ 1,803 $ 1,873Adjustments to reconcile to net cash provided by operating activities Depreciation and amortization 925 983 997 Deferred income taxes (100) (382) (311) Pension and other postretirement benefits expense 323 293 384 Contributions to pension plans (330) (362) (341) Contributions to other postretirement benefits plans (31) (40) (59) Excess tax benefit from equity-based compensation (1) (20) (32) Gain on sale of businesses - (68) (2) Changes in working capital Accounts receivable - net 5 (205) (231) Inventory (20) (152) (92) Accounts payable (120) 49 86 Accrued compensation (28) (32) - Accrued income and other taxes (9) (73) 1 Other current assets 7 73 (42) Other current liabilities (76) 8 (46) Other - net (155) 3 100
Net cash provided by operating activities 2,371 1,878 2,285
Investing activitiesCapital expenditures for property, plant and equipment (506) (632) (614)Cash (paid for) received from acquisitions of businesses, net of cash acquired (72) 2 (9)Sales (purchases) of short-term investments - net 37 522 (288)Proceeds from sales of businesses 1 282 777Other - net (35) (31) (68)
Net cash (used in) provided by investing activities (575) 143 (202)
Financing activitiesProceeds from borrowings 425 - 9 Payments on borrowings (1,027) (582) (1,096)Cash dividends paid (1,026) (929) (796)Exercise of employee stock options 52 54 121Repurchase of shares (682) (650) -Excess tax benefit from equity-based compensation 1 20 32Other - net (10) (43) (6)
Net cash used in financing activities (2,267) (2,130) (1,736)
Effect of currency on cash (42) (25) (9)
Total (decrease) increase in cash (513) (134) 338Cash at the beginning of the period 781 915 577
Cash at the end of the period $ 268 $ 781 $ 915
The accompanying notes are an integral part of the consolidated financial statements.
Consolidated Statements of Cash Flows
EATON 2015 Annual Report 23
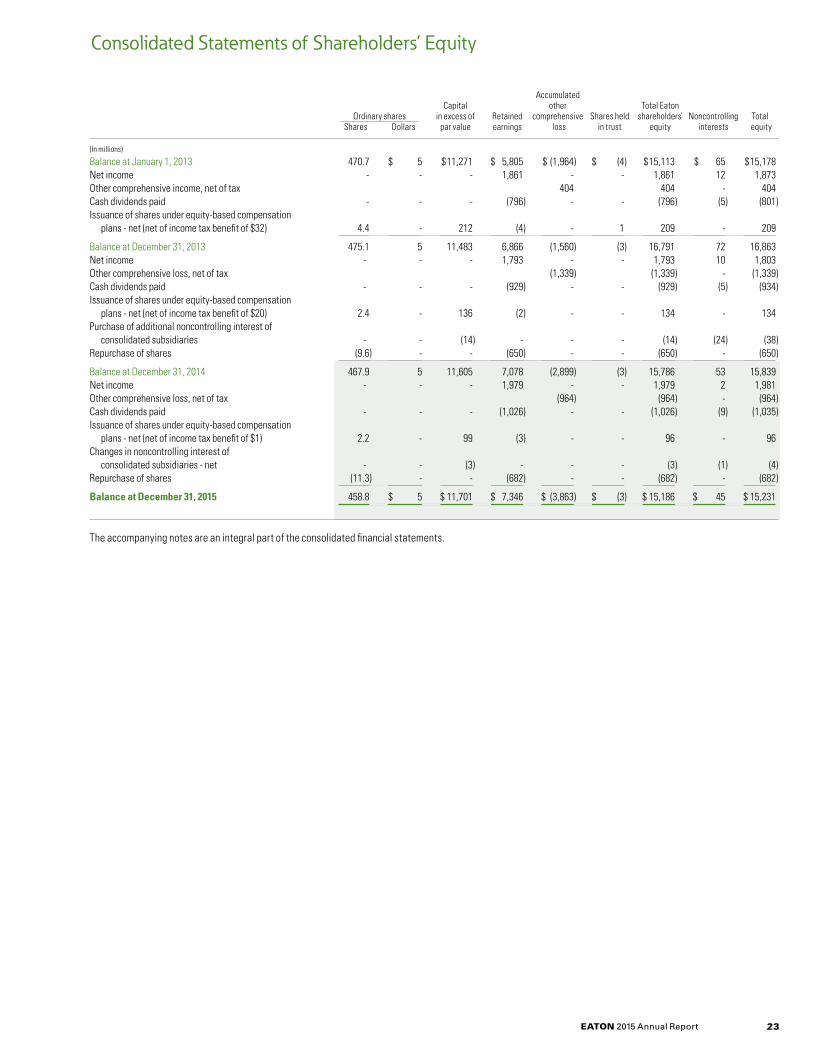
Consolidated Statements of Shareholders’ Equity
Accumulated Capital other Total Eaton Ordinary shares in excess of Retained comprehensive Shares held shareholders’ Noncontrolling Total Shares Dollars par value earnings loss in trust equity interests equity
(In millions)
Balance at January 1, 2013 470.7 $ 5 $ 11,271 $ 5,805 $ (1,964) $ (4) $ 15,113 $ 65 $ 15,178Net income - - - 1,861 - - 1,861 12 1,873Other comprehensive income, net of tax 404 404 - 404Cash dividends paid - - - (796) - - (796) (5) (801)Issuance of shares under equity-based compensation plans - net (net of income tax benefit of $32) 4.4 - 212 (4) - 1 209 - 209
Balance at December 31, 2013 475.1 5 11,483 6,866 (1,560) (3) 16,791 72 16,863Net income - - - 1,793 - - 1,793 10 1,803Other comprehensive loss, net of tax (1,339) (1,339) - (1,339)Cash dividends paid - - - (929) - - (929) (5) (934)Issuance of shares under equity-based compensation plans - net (net of income tax benefit of $20) 2.4 - 136 (2) - - 134 - 134Purchase of additional noncontrolling interest of consolidated subsidiaries - - (14) - - - (14) (24) (38)Repurchase of shares (9.6) - - (650) - - (650) - (650)
Balance at December 31, 2014 467.9 5 11,605 7,078 (2,899) (3) 15,786 53 15,839Net income - - - 1,979 - - 1,979 2 1,981Other comprehensive loss, net of tax (964) (964) - (964)Cash dividends paid - - - (1,026) - - (1,026) (9) (1,035)Issuance of shares under equity-based compensation plans - net (net of income tax benefit of $1) 2.2 - 99 (3) - - 96 - 96Changes in noncontrolling interest of consolidated subsidiaries - net - - (3) - - - (3) (1) (4)Repurchase of shares (11.3) - - (682) - - (682) - (682)
Balance at December 31, 2015 458.8 $ 5 $ 11,701 $ 7,346 $ (3,863) $ (3) $ 15,186 $ 45 $ 15,231
The accompanying notes are an integral part of the consolidated financial statements.
EATON 2015 Annual Report24
Amounts are in millions unless indicated otherwise (per share data assume dilution).
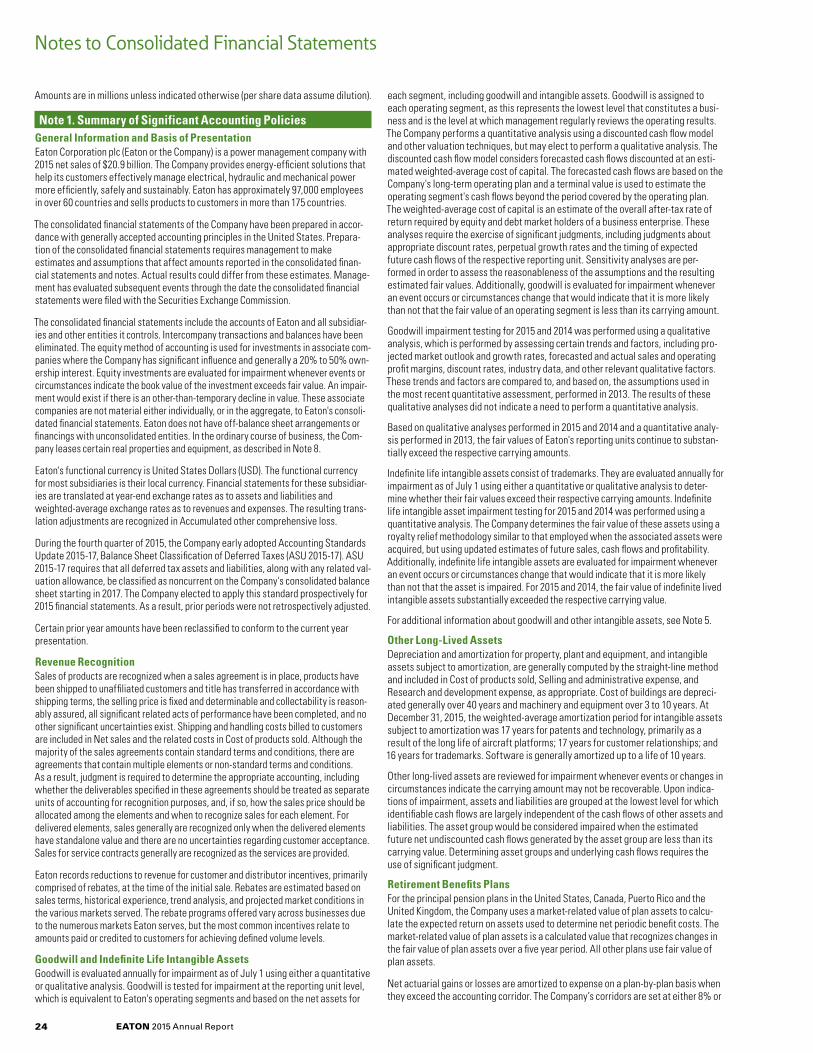
Note 1. Summary of Significant Accounting Policies General Information and Basis of PresentationEaton Corporation plc (Eaton or the Company) is a power management company with 2015 net sales of $20.9 billion. The Company provides energy-efficient solutions that help its customers effectively manage electrical, hydraulic and mechanical power more efficiently, safely and sustainably. Eaton has approximately 97,000 employees in over 60 countries and sells products to customers in more than 175 countries.
The consolidated financial statements of the Company have been prepared in accor-dance with generally accepted accounting principles in the United States. Prepara-tion of the consolidated financial statements requires management to make estimates and assumptions that affect amounts reported in the consolidated finan-cial statements and notes. Actual results could differ from these estimates. Manage-ment has evaluated subsequent events through the date the consolidated financial statements were filed with the Securities Exchange Commission.
The consolidated financial statements include the accounts of Eaton and all subsidiar-ies and other entities it controls. Intercompany transactions and balances have been eliminated. The equity method of accounting is used for investments in associate com-panies where the Company has significant influence and generally a 20% to 50% own-ership interest. Equity investments are evaluated for impairment whenever events or circumstances indicate the book value of the investment exceeds fair value. An impair-ment would exist if there is an other-than-temporary decline in value. These associate companies are not material either individually, or in the aggregate, to Eaton's consoli-dated financial statements. Eaton does not have off-balance sheet arrangements or financings with unconsolidated entities. In the ordinary course of business, the Com-pany leases certain real properties and equipment, as described in Note 8.
Eaton's functional currency is United States Dollars (USD). The functional currency for most subsidiaries is their local currency. Financial statements for these subsidiar-ies are translated at year-end exchange rates as to assets and liabilities and weighted-average exchange rates as to revenues and expenses. The resulting trans-lation adjustments are recognized in Accumulated other comprehensive loss.
During the fourth quarter of 2015, the Company early adopted Accounting Standards Update 2015-17, Balance Sheet Classification of Deferred Taxes (ASU 2015-17). ASU 2015-17 requires that all deferred tax assets and liabilities, along with any related val-uation allowance, be classified as noncurrent on the Company's consolidated balance sheet starting in 2017. The Company elected to apply this standard prospectively for 2015 financial statements. As a result, prior periods were not retrospectively adjusted.
Certain prior year amounts have been reclassified to conform to the current year presentation.
Revenue RecognitionSales of products are recognized when a sales agreement is in place, products have been shipped to unaffiliated customers and title has transferred in accordance with shipping terms, the selling price is fixed and determinable and collectability is reason-ably assured, all significant related acts of performance have been completed, and no other significant uncertainties exist. Shipping and handling costs billed to customers are included in Net sales and the related costs in Cost of products sold. Although the majority of the sales agreements contain standard terms and conditions, there are agreements that contain multiple elements or non-standard terms and conditions. As a result, judgment is required to determine the appropriate accounting, including whether the deliverables specified in these agreements should be treated as separate units of accounting for recognition purposes, and, if so, how the sales price should be allocated among the elements and when to recognize sales for each element. For delivered elements, sales generally are recognized only when the delivered elements have standalone value and there are no uncertainties regarding customer acceptance. Sales for service contracts generally are recognized as the services are provided.
Eaton records reductions to revenue for customer and distributor incentives, primarily comprised of rebates, at the time of the initial sale. Rebates are estimated based on sales terms, historical experience, trend analysis, and projected market conditions in the various markets served. The rebate programs offered vary across businesses due to the numerous markets Eaton serves, but the most common incentives relate to amounts paid or credited to customers for achieving defined volume levels.
Goodwill and Indefinite Life Intangible AssetsGoodwill is evaluated annually for impairment as of July 1 using either a quantitative or qualitative analysis. Goodwill is tested for impairment at the reporting unit level, which is equivalent to Eaton's operating segments and based on the net assets for
each segment, including goodwill and intangible assets. Goodwill is assigned to each operating segment, as this represents the lowest level that constitutes a busi-ness and is the level at which management regularly reviews the operating results. The Company performs a quantitative analysis using a discounted cash flow model and other valuation techniques, but may elect to perform a qualitative analysis. The discounted cash flow model considers forecasted cash flows discounted at an esti-mated weighted-average cost of capital. The forecasted cash flows are based on the Company's long-term operating plan and a terminal value is used to estimate the operating segment's cash flows beyond the period covered by the operating plan. The weighted-average cost of capital is an estimate of the overall after-tax rate of return required by equity and debt market holders of a business enterprise. These analyses require the exercise of significant judgments, including judgments about appropriate discount rates, perpetual growth rates and the timing of expected future cash flows of the respective reporting unit. Sensitivity analyses are per-formed in order to assess the reasonableness of the assumptions and the resulting estimated fair values. Additionally, goodwill is evaluated for impairment whenever an event occurs or circumstances change that would indicate that it is more likely than not that the fair value of an operating segment is less than its carrying amount.
Goodwill impairment testing for 2015 and 2014 was performed using a qualitative analysis, which is performed by assessing certain trends and factors, including pro-jected market outlook and growth rates, forecasted and actual sales and operating profit margins, discount rates, industry data, and other relevant qualitative factors. These trends and factors are compared to, and based on, the assumptions used in the most recent quantitative assessment, performed in 2013. The results of these qualitative analyses did not indicate a need to perform a quantitative analysis.
Based on qualitative analyses performed in 2015 and 2014 and a quantitative analy-sis performed in 2013, the fair values of Eaton's reporting units continue to substan-tially exceed the respective carrying amounts.
Indefinite life intangible assets consist of trademarks. They are evaluated annually for impairment as of July 1 using either a quantitative or qualitative analysis to deter-mine whether their fair values exceed their respective carrying amounts. Indefinite life intangible asset impairment testing for 2015 and 2014 was performed using a quantitative analysis. The Company determines the fair value of these assets using a royalty relief methodology similar to that employed when the associated assets were acquired, but using updated estimates of future sales, cash flows and profitability. Additionally, indefinite life intangible assets are evaluated for impairment whenever an event occurs or circumstances change that would indicate that it is more likely than not that the asset is impaired. For 2015 and 2014, the fair value of indefinite lived intangible assets substantially exceeded the respective carrying value.
For additional information about goodwill and other intangible assets, see Note 5.
Other Long-Lived Assets Depreciation and amortization for property, plant and equipment, and intangible assets subject to amortization, are generally computed by the straight-line method and included in Cost of products sold, Selling and administrative expense, and Research and development expense, as appropriate. Cost of buildings are depreci-ated generally over 40 years and machinery and equipment over 3 to 10 years. At December 31, 2015, the weighted-average amortization period for intangible assets subject to amortization was 17 years for patents and technology, primarily as a result of the long life of aircraft platforms; 17 years for customer relationships; and 16 years for trademarks. Software is generally amortized up to a life of 10 years.
Other long-lived assets are reviewed for impairment whenever events or changes in circumstances indicate the carrying amount may not be recoverable. Upon indica-tions of impairment, assets and liabilities are grouped at the lowest level for which identifiable cash flows are largely independent of the cash flows of other assets and liabilities. The asset group would be considered impaired when the estimated future net undiscounted cash flows generated by the asset group are less than its carrying value. Determining asset groups and underlying cash flows requires the use of significant judgment.
Retirement Benefits PlansFor the principal pension plans in the United States, Canada, Puerto Rico and the United Kingdom, the Company uses a market-related value of plan assets to calcu-late the expected return on assets used to determine net periodic benefit costs. The market-related value of plan assets is a calculated value that recognizes changes in the fair value of plan assets over a five year period. All other plans use fair value of plan assets.
Net actuarial gains or losses are amortized to expense on a plan-by-plan basis when they exceed the accounting corridor. The Company’s corridors are set at either 8% or
Notes to Consolidated Financial Statements

EATON 2015 Annual Report 25
Recently Issued Accounting PronouncementIn May 2014, the Financial Accounting Standards Board issued Accounting Standards Update 2014-09, Revenue from Contracts with Customers (ASU 2014-09). This account-ing standard supersedes all existing US GAAP revenue recognition guidance. Under ASU 2014-09, a company will recognize revenue when it transfers the control of prom-ised goods or services to customers in an amount that reflects the consideration which the company expects to collect in exchange for those goods or services. ASU 2014-09 will require additional disclosures in the notes to the consolidated financial statements and is effective for annual and interim reporting periods beginning after December 15, 2016. In August 2015, the FASB issued ASU 2015-14, Revenue from Contracts with Cus-tomers: Deferral of the Effective Date (ASU 2015-14). This accounting standard defers the effective date of ASU 2014-09 for one year and permits early adoption as of the original effective date. Eaton is evaluating the impact of ASU 2014-09 and an estimate of the impact to the consolidated financial statements cannot be made at this time.
Note 2. Acquisitions and Sales of BusinessesAcquisition of Ephesus Lighting, Inc.On October 28, 2015, Eaton acquired Ephesus Lighting, Inc. (Ephesus). Ephesus is a leader in LED lighting for stadiums and other high lumen outdoor and industrial applica-tions. Its sales over the last twelve months were $23. Ephesus is reported within the Electrical Products business segment.
Acquisition of UK Safety Technology Manufacturer Oxalis Group Ltd.On January 12, 2015, Eaton acquired Oxalis Group Ltd. (Oxalis). Oxalis is a manufacturer of closed-circuit television camera stations, public address and general alarm systems and other electrical products for the hazardous area, marine and industrial communica-tions markets. Its sales over the last twelve months were $9. Oxalis is reported within the Electrical Systems and Services business segment.
Sale of Aerospace Power Distribution Management Solutions and Integrated Cockpit SolutionsOn May 9, 2014, Eaton sold the Aerospace Power Distribution Management Solutions and Integrated Cockpit Solutions businesses to Safran for $270, which resulted in a pre-tax gain of $154.
Sale of Apex Tool Group, LLCIn July 2010, Cooper Industries plc (Cooper) formed a joint venture, named Apex Tool Group, LLC (Apex), with Danaher Corporation (Danaher). On February 1, 2013, Cooper and Danaher sold Apex to Bain Capital for approximately $1.6 billion.
Note 3. Acquisition Integration ChargesEaton incurs integration charges and transaction costs related to acquired businesses. A summary of these charges follows:
2015 2014 2013
Acquisition integration chargesElectrical Products $ 25 $ 66 $ 44Electrical Systems and Services 15 51 37Hydraulics 2 12 36
Total business segments 42 129 117Corporate 5 25 37
Total acquisition integration charges 47 154 154
Transaction costs Corporate - - 8Financing fees - - 1
Total transaction costs - - 9
Total acquisition integration charges and transaction costs before income taxes $ 47 $ 154 $ 163
Total after income taxes $ 31 $ 102 $ 110Per ordinary share - diluted $ 0.07 $ 0.21 $ 0.23
10%, depending on the plan, of the greater of the plan assets or benefit obligations. Gains or losses outside of the corridor are subject to amortization over an average employee future service period that differs by plan, but is approximately 11 years on a weighted average basis. If most or all of the plan’s participants are no longer actively accruing benefits, the average life expectancy is used.
Warranty AccrualsProduct warranty accruals are established at the time the related sale is recognized through a charge to Cost of products sold. Warranty accrual estimates are based pri-marily on historical warranty claim experience and specific customer contracts. Provi-sions for warranty accruals are comprised of basic warranties for products sold, as well as accruals for product recalls and other events when they are known and estimable. See Note 8 for additional information about warranty accruals.
Asset Retirement ObligationsA conditional asset retirement obligation is recognized at fair value when incurred if the fair value of the liability can be reasonably estimated. Uncertainty about the timing or method of settlement of a conditional asset retirement obligation would be consid-ered in the measurement of the liability when sufficient information exists. Eaton believes that for substantially all of its asset retirement obligations, there is an indeter-minate settlement date because the range of time over which the Company may settle the obligation is unknown or cannot be estimated. A liability for these obligations will be recognized when sufficient information is available to estimate fair value.
Income Taxes Deferred income tax assets and liabilities are determined based on the difference between the financial statement and tax basis of the respective assets and liabilities, using enacted tax rates in effect for the year when the differences are expected to reverse. Deferred income tax assets are recognized for income tax loss carryforwards and income tax credit carryforwards. Judgment is required in determining and evaluat-ing income tax provisions and valuation allowances for deferred income tax assets. Eaton recognizes the income tax benefit from an uncertain tax position only if it is more likely than not that the tax position will be sustained on examination by taxing authori-ties, based on the technical merits of the position. Eaton evaluates and adjusts these accruals based on changing facts and circumstances. Eaton recognizes interest and penalties related to unrecognized income tax benefits in the provision for income tax expense. Penalties on unrecognized income tax benefits have been accrued for jurisdic-tions where penalties are automatically applied to any deficiency, regardless of the merit of the position. For additional information about income taxes, see Note 9.
Equity-Based CompensationEaton recognizes equity-based compensation expense based on the grant date fair value of the award. Awards with service conditions are expensed over the period dur-ing which an employee is required to provide service in exchange for the award. Awards with both service and performance conditions are expensed over the period an employee is required to provide service based on the number of units for which achievement of the performance objective is probable. Participants awarded restricted stock units (RSUs) do not receive dividends; therefore, their fair value is determined by reducing the closing market price of the Company’s ordinary shares on the date of grant by the present value of the estimated dividends had they been paid. The RSUs entitle the holder to receive one ordinary share for each RSU upon vesting, generally over three or four years. The fair value of restricted stock awards (RSAs) and performance share units (PSUs) are determined based on the closing market price of the Company’s ordinary shares at the date of grant. RSAs are issued and outstanding at the time of grant, but remain subject to forfeiture until vested, generally over three or four years. PSUs are entitled to receive one ordinary share for each PSU that vests based on satis-faction of a three-year service period and the achievement of certain performance met-rics. Stock options are granted with an exercise price equal to the closing market price of Eaton ordinary shares on the date of grant. The fair value of stock options is deter-mined using a Black-Scholes option-pricing model, which incorporates assumptions regarding the expected volatility, the expected option life, the risk-free interest rate, and the expected dividend yield. See Note 11 for additional information about equity-based compensation.
Derivative Financial Instruments and Hedging ActivitiesEaton uses derivative financial instruments to manage the exposure to the volatility in raw material costs, currency, and interest rates on certain debt. These instruments are marked to fair value in the accompanying Consolidated Balance Sheets. Changes in the fair value of derivative assets or liabilities (i.e., gains or losses) are recognized depend-ing upon the type of hedging relationship and whether an instrument has been desig-nated as a hedge. For those instruments that qualify for hedge accounting, Eaton designates the hedging instrument, based upon the exposure being hedged, as a cash flow hedge, a fair value hedge, or a hedge of a net investment in a foreign operation. Changes in fair value of these instruments that do not qualify for hedge accounting are recognized immediately in net income. See Note 13 for additional information about hedges and derivative financial instruments.
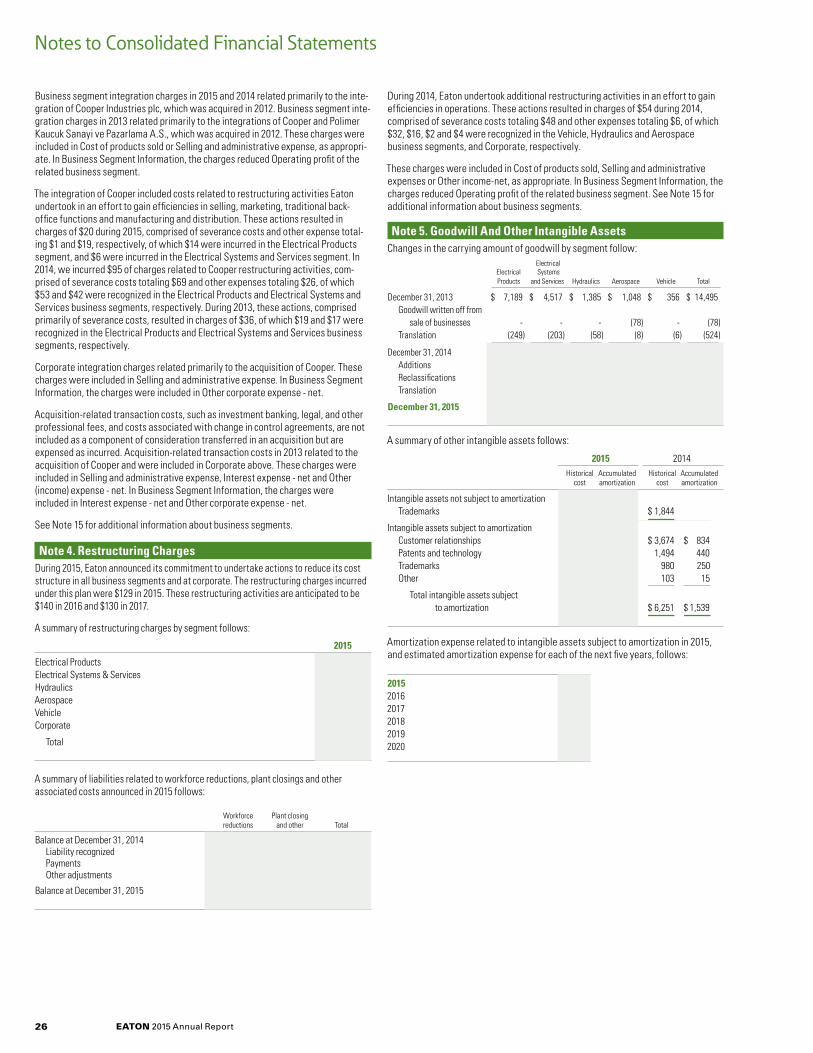
EATON 2015 Annual Report26
Notes to Consolidated Financial Statements
Business segment integration charges in 2015 and 2014 related primarily to the inte-gration of Cooper Industries plc, which was acquired in 2012. Business segment inte-gration charges in 2013 related primarily to the integrations of Cooper and Polimer Kaucuk Sanayi ve Pazarlama A.S., which was acquired in 2012. These charges were included in Cost of products sold or Selling and administrative expense, as appropri-ate. In Business Segment Information, the charges reduced Operating profit of the related business segment.
The integration of Cooper included costs related to restructuring activities Eaton undertook in an effort to gain efficiencies in selling, marketing, traditional back-office functions and manufacturing and distribution. These actions resulted in charges of $20 during 2015, comprised of severance costs and other expense total-ing $1 and $19, respectively, of which $14 were incurred in the Electrical Products segment, and $6 were incurred in the Electrical Systems and Services segment. In 2014, we incurred $95 of charges related to Cooper restructuring activities, com-prised of severance costs totaling $69 and other expenses totaling $26, of which $53 and $42 were recognized in the Electrical Products and Electrical Systems and Services business segments, respectively. During 2013, these actions, comprised primarily of severance costs, resulted in charges of $36, of which $19 and $17 were recognized in the Electrical Products and Electrical Systems and Services business segments, respectively.
Corporate integration charges related primarily to the acquisition of Cooper. These charges were included in Selling and administrative expense. In Business Segment Information, the charges were included in Other corporate expense - net.
Acquisition-related transaction costs, such as investment banking, legal, and other professional fees, and costs associated with change in control agreements, are not included as a component of consideration transferred in an acquisition but are expensed as incurred. Acquisition-related transaction costs in 2013 related to the acquisition of Cooper and were included in Corporate above. These charges were included in Selling and administrative expense, Interest expense - net and Other (income) expense - net. In Business Segment Information, the charges were included in Interest expense - net and Other corporate expense - net.
See Note 15 for additional information about business segments.
Note 4. Restructuring ChargesDuring 2015, Eaton announced its commitment to undertake actions to reduce its cost structure in all business segments and at corporate. The restructuring charges incurred under this plan were $129 in 2015. These restructuring activities are anticipated to be $140 in 2016 and $130 in 2017.
A summary of restructuring charges by segment follows:
2015
Electrical Products $ 12Electrical Systems & Services 29Hydraulics 31Aerospace 5Vehicle 34Corporate 18
Total $ 129
A summary of liabilities related to workforce reductions, plant closings and other associated costs announced in 2015 follows:
Workforce Plant closing reductions and other Total
Balance at December 31, 2014 $ - $ - - Liability recognized 112 17 129 Payments (59) (3) (62) Other adjustments 1 (14) (13)
Balance at December 31, 2015 $ 54 $ - $ 54
During 2014, Eaton undertook additional restructuring activities in an effort to gain efficiencies in operations. These actions resulted in charges of $54 during 2014, comprised of severance costs totaling $48 and other expenses totaling $6, of which $32, $16, $2 and $4 were recognized in the Vehicle, Hydraulics and Aerospace business segments, and Corporate, respectively.
These charges were included in Cost of products sold, Selling and administrative expenses or Other income-net, as appropriate. In Business Segment Information, the charges reduced Operating profit of the related business segment. See Note 15 for additional information about business segments.
Note 5. Goodwill And Other Intangible AssetsChanges in the carrying amount of goodwill by segment follow:
Electrical Electrical Systems Products and Services Hydraulics Aerospace Vehicle Total
December 31, 2013 $ 7,189 $ 4,517 $ 1,385 $ 1,048 $ 356 $ 14,495 Goodwill written off from sale of businesses - - - (78) - (78) Translation (249) (203) (58) (8) (6) (524)
December 31, 2014 6,940 4,314 1,327 962 350 13,893 Additions 31 20 - - - 51 Reclassifications (106) 106 - - - - Translation (223) (161) (68) (6) (7) (465)
December 31, 2015 $ 6,642 $ 4,279 $ 1,259 $ 956 $ 343 $ 13,479
A summary of other intangible assets follows:
2015 2014 Historical Accumulated Historical Accumulated cost amortization cost amortization
Intangible assets not subject to amortization Trademarks $ 1,661 $ 1,844
Intangible assets subject to amortization Customer relationships $ 3,544 $ 1,010 $ 3,674 $ 834 Patents and technology 1,447 511 1,494 440 Trademarks 1,113 311 980 250 Other 103 22 103 15
Total intangible assets subject to amortization $ 6,207 $ 1,854 $ 6,251 $ 1,539
Amortization expense related to intangible assets subject to amortization in 2015, and estimated amortization expense for each of the next five years, follows:
2015 $ 4012016 3942017 3842018 3642019 3572020 352
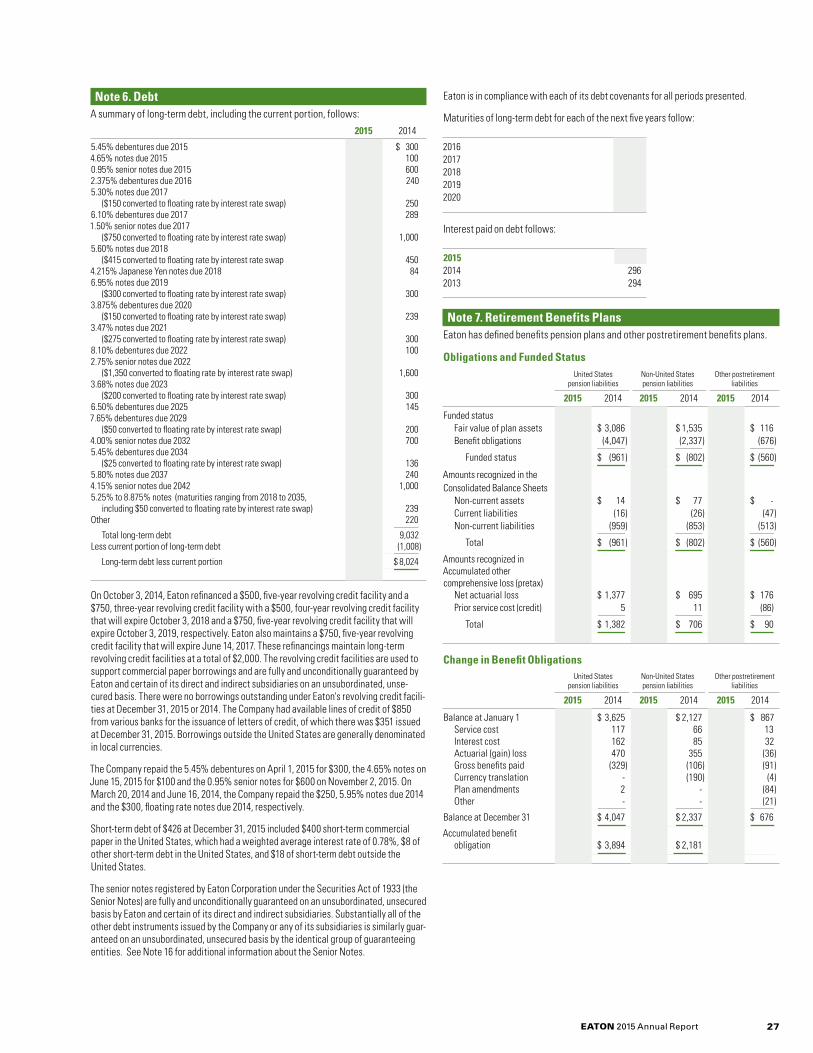
EATON 2015 Annual Report 27
Note 6. DebtA summary of long-term debt, including the current portion, follows:
2015 2014
5.45% debentures due 2015 $ - $ 3004.65% notes due 2015 - 1000.95% senior notes due 2015 - 6002.375% debentures due 2016 240 240 5.30% notes due 2017 ($150 converted to floating rate by interest rate swap) 250 2506.10% debentures due 2017 289 2891.50% senior notes due 2017 ($750 converted to floating rate by interest rate swap) 1,000 1,0005.60% notes due 2018 ($415 converted to floating rate by interest rate swap 450 4504.215% Japanese Yen notes due 2018 83 84 6.95% notes due 2019 ($300 converted to floating rate by interest rate swap) 300 3003.875% debentures due 2020 ($150 converted to floating rate by interest rate swap) 239 2393.47% notes due 2021 ($275 converted to floating rate by interest rate swap) 300 3008.10% debentures due 2022 100 1002.75% senior notes due 2022 ($1,350 converted to floating rate by interest rate swap) 1,600 1,6003.68% notes due 2023 ($200 converted to floating rate by interest rate swap) 300 3006.50% debentures due 2025 145 1457.65% debentures due 2029 ($50 converted to floating rate by interest rate swap) 200 2004.00% senior notes due 2032 700 7005.45% debentures due 2034 ($25 converted to floating rate by interest rate swap) 136 1365.80% notes due 2037 240 2404.15% senior notes due 2042 1,000 1,0005.25% to 8.875% notes (maturities ranging from 2018 to 2035, including $50 converted to floating rate by interest rate swap) 239 239Other 212 220
Total long-term debt 8,023 9,032Less current portion of long-term debt (242) (1,008)
Long-term debt less current portion $ 7,781 $ 8,024
On October 3, 2014, Eaton refinanced a $500, five-year revolving credit facility and a $750, three-year revolving credit facility with a $500, four-year revolving credit facility that will expire October 3, 2018 and a $750, five-year revolving credit facility that will expire October 3, 2019, respectively. Eaton also maintains a $750, five-year revolving credit facility that will expire June 14, 2017. These refinancings maintain long-term revolving credit facilities at a total of $2,000. The revolving credit facilities are used to support commercial paper borrowings and are fully and unconditionally guaranteed by Eaton and certain of its direct and indirect subsidiaries on an unsubordinated, unse-cured basis. There were no borrowings outstanding under Eaton's revolving credit facili-ties at December 31, 2015 or 2014. The Company had available lines of credit of $850 from various banks for the issuance of letters of credit, of which there was $351 issued at December 31, 2015. Borrowings outside the United States are generally denominated in local currencies.
The Company repaid the 5.45% debentures on April 1, 2015 for $300, the 4.65% notes on June 15, 2015 for $100 and the 0.95% senior notes for $600 on November 2, 2015. On March 20, 2014 and June 16, 2014, the Company repaid the $250, 5.95% notes due 2014 and the $300, floating rate notes due 2014, respectively.
Short-term debt of $426 at December 31, 2015 included $400 short-term commercial paper in the United States, which had a weighted average interest rate of 0.78%, $8 of other short-term debt in the United States, and $18 of short-term debt outside the United States.
The senior notes registered by Eaton Corporation under the Securities Act of 1933 (the Senior Notes) are fully and unconditionally guaranteed on an unsubordinated, unsecured basis by Eaton and certain of its direct and indirect subsidiaries. Substantially all of the other debt instruments issued by the Company or any of its subsidiaries is similarly guar-anteed on an unsubordinated, unsecured basis by the identical group of guaranteeing entities. See Note 16 for additional information about the Senior Notes.
Eaton is in compliance with each of its debt covenants for all periods presented.
Maturities of long-term debt for each of the next five years follow:
2016 $ 2422017 1,5442018 5762019 3402020 241
Interest paid on debt follows:
2015 $ 2712014 2962013 294
Note 7. Retirement Benefits Plans Eaton has defined benefits pension plans and other postretirement benefits plans.
Obligations and Funded Status United States Non-United States Other postretirement pension liabilities pension liabilities liabilities
2015 2014 2015 2014 2015 2014
Funded status Fair value of plan assets $ 2,934 $ 3,086 $ 1,472 $ 1,535 $ 93 $ 116 Benefit obligations (3,829) (4,047) (2,175) (2,337) (575) (676)
Funded status $ (895) $ (961) $ (703) $ (802) $ (482) $ (560)
Amounts recognized in the Consolidated Balance Sheets Non-current assets $ 11 $ 14 $ 57 $ 77 $ - $ - Current liabilities (57) (16) (23) (26) (42) (47) Non-current liabilities (849) (959) (737) (853) (440) (513)
Total $ (895) $ (961) $ (703) $ (802) $ (482) $ (560)
Amounts recognized in Accumulated other comprehensive loss (pretax) Net actuarial loss $ 1,322 $ 1,377 $ 644 $ 695 $ 95 $ 176 Prior service cost (credit) 5 5 9 11 (74) (86)
Total $ 1,327 $ 1,382 $ 653 $ 706 $ 21 $ 90
Change in Benefit Obligations United States Non-United States Other postretirement pension liabilities pension liabilities liabilities
2015 2014 2015 2014 2015 2014
Balance at January 1 $ 4,047 $ 3,625 $ 2,337 $ 2,127 $ 676 $ 867 Service cost 123 117 71 66 6 13 Interest cost 156 162 72 85 24 32 Actuarial (gain) loss (179) 470 (23) 355 (66) (36) Gross benefits paid (318) (329) (100) (106) (86) (91) Currency translation - - (182) (190) (8) (4) Plan amendments - 2 - - (1) (84) Other - - - - 30 (21)
Balance at December 31 $ 3,829 $ 4,047 $ 2,175 $ 2,337 $ 575 $ 676
Accumulated benefit obligation $ 3,672 $ 3,894 $ 2,049 $ 2,181

EATON 2015 Annual Report28
Change in Plan Assets
United States Non-United States Other postretirement pension liabilities pension liabilities liabilities
2015 2014 2015 2014 2015 2014
Balance at January 1 $ 3,086 $ 2,940 $ 1,535 $ 1,432 $ 116 $ 138 Actual return on plan assets (55) 226 29 191 1 4 Employer contributions 221 248 109 114 31 40 Gross benefits paid (318) (329) (100) (106) (86) (91) Currency translation - - (101) (96) - - Other - 1 - - 31 25
Balance at December 31 $ 2,934 $ 3,086 $ 1,472 $ 1,535 $ 93 $ 116
The components of pension plans with an accumulated benefit obligation in excess of plan assets at December 31 follow: United States Non-United States pension liabilities pension liabilities
2015 2014 2015 2014
Projected benefit obligation $ 3,376 $ 3,557 $ 1,387 $ 1,524Accumulated benefit obligation 3,219 3,403 1,328 1,446Fair value of plan assets 2,470 2,581 650 673
Changes in pension and other postretirement benefit liabilities recognized in Accumulated other comprehensive loss follow:
United States Non-United States Other postretirement pension liabilities pension liabilities liabilities
2015 2014 2015 2014 2015 2014
Balance at January 1 $ 1,382 $ 1,054 $ 706 $ 528 $ 90 $ 184 Prior service cost arising during the year - 2 - - (1) (84) Net loss (gain) arising during the year 138 490 47 262 (62) (34) Currency translation - - (58) (55) (4) (1) Less amounts included in expense during the year (193) (164) (42) (29) (2) 25
Net change for the year (55) 328 (53) 178 (69) (94)
Balance at December 31 $ 1,327 $ 1,382 $ 653 $ 706 $ 21 $ 90
The estimated pretax net amounts that will be recognized from Accumulated other comprehensive loss into net periodic benefit cost in 2016 follow: United States Non-United Other pension States pension postretirement liabilities liabilities liabilities
Actuarial loss $ 165 $ 34 $ 5Prior service cost (credit) 1 1 (14)
Total $ 166 $ 35 $ (9)
Retirement Benefits Plans AssumptionsFor purposes of determining liabilities related to pension plans and other postretire-ment benefits plans in the United States, the Company updated its mortality assumption in 2014 to use the RP-2014 tables with a generational improvement scale based on MP-2014. In 2015, the Company updated its mortality assumption to use 2014 tables and a generational improvement scale that are based on MP-2015.
Beginning in 2016, the Company will adopt a change in the method it will use to esti-mate the service and interest cost components of net periodic benefit cost for its defined benefit pension and other postretirement benefit plans. Historically, for the vast majority of its plans, the service and interest cost components were estimated using a single weighted-average discount rate derived from the yield curve used to measure the benefit obligation at the beginning of the period. Beginning in 2016, the Company will use a spot rate approach by applying the specific spot rates along the yield curve to the relevant projected cash flows in the estimation of the service and interest components of benefit cost, resulting in a more precise measurement. This change does not affect the measurement of total benefit obligations. The change will be accounted for as a change in estimate and, accordingly, will be accounted for prospectively starting in 2016. The discount rates that will be used to measure ser-vice and interest cost during 2016 are 4.3% and 3.3%, respectively. The discount rate that was measured at December 31, 2015 and would have been used for service and interest cost under the prior estimation method was 4.0%. The reductions in service cost and interest cost for 2016 associated with this change in estimate are expected to be $3 and $42, respectively.
Notes to Consolidated Financial Statements
Benefits Expense United States Non-United States Other postretirement pension benefit expense pension benefit expense benefits expense
2015 2014 2013 2015 2014 2013 2015 2014 2013
Service cost $ 123 $ 117 $ 128 $ 71 $ 66 $ 62 $ 6 $ 13 $ 20Interest cost 156 162 147 72 85 80 24 32 35Expected return on plan assets (262) (246) (226) (99) (98) (85) (5) (6) (6)Amortization 119 93 133 40 27 27 2 6 14
136 126 182 84 80 84 27 45 63
Settlements, curtailments and other 74 71 53 2 2 2 - (31) -
Total expense $ 210 $ 197 $ 235 $ 86 $ 82 $ 86 $ 27 $ 14 $ 63
EATON 2015 Annual Report 29
Pension Plans United States Non-United States pension plans pension plans
2015 2014 2013 2015 2014 2013
Assumptions used to determine benefit obligation at year-end Discount rate 4.22% 3.97% 4.67% 3.46% 3.33% 4.20% Rate of compensation increase 3.18% 3.16% 3.16% 3.12% 3.13% 3.12%
Assumptions used to determine expense Discount rate 3.97% 4.67% 3.97% 3.33% 4.20% 4.17% Expected long-term return on plan assets 8.50% 8.40% 8.45% 6.92% 7.00% 6.92% Rate of compensation increase 3.16% 3.16% 3.16% 3.13% 3.12% 3.09%
The expected long-term rate of return on pension assets was determined for each country and reflects long-term historical data taking into account each plan's target asset allocation. The discount rate was determined using appropriate bond data for each country.
Other Postretirement Benefits PlansSubstantially all of the obligation for other postretirement benefits plans relates to United States plans. Assumptions used to determine other postretirement benefits obligations and expense follow: Other postretirement benefits plans
2015 2014 2013
Assumptions used to determine benefit obligation at year-end Discount rate 4.04% 3.79% 4.48% Health care cost trend rate assumed for next year 7.10% 6.31% 6.64% Ultimate health care cost trend rate 4.75% 4.77% 4.77% Year ultimate health care cost trend rate is achieved 2025 2024 2023
Assumptions used to determine expense Discount rate 3.79% 4.48% 3.79% Initial health care cost trend rate 6.31% 6.64% 6.96% Ultimate health care cost trend rate 4.77% 4.77% 4.53% Year ultimate health care cost trend rate is achieved 2024 2023 2022
Assumed health care cost trend rates may have a significant effect on the amounts reported for the health care plans. A 1-percentage point change in the assumed health care cost trend rates would have the following effects: 1% increase 1% decrease
Effect on total service and interest cost $ 1 $ (1)Effect on other postretirement liabilities 17 (16)
Employer Contributions to Retirement Benefits PlansContributions to pension plans that Eaton expects to make in 2016, and made in 2015, 2014 and 2013, follow: 2016 2015 2014 2013
United States plans $ 59 $ 221 $ 248 $ 196Non-United States plans 103 109 114 145
Total contributions $ 162 $ 330 $ 362 $ 341
The following table provides the estimated pension and other postretirement benefit payments for each of the next five years, and the five years thereafter in the aggre-gate. For other postretirement benefits liabilities, the expected subsidy receipts related to the Medicare Prescription Drug, Improvement, and Modernization Act of 2003, would reduce the gross payments listed below.
Estimated other postretirement benefit payments
Estimated Estimated Medicare United States non-United States prescription pension payments pension payments Gross drug subsidy
2016 $ 334 $ 81 $ 65 $ (5)2017 270 82 61 (4)2018 280 85 57 (4)2019 287 86 52 (3)2020 292 89 48 (2)2021-2025 1,515 491 199 (10)
Pension Plan AssetsInvestment policies and strategies are developed on a country specific basis. The United States plans, representing 67% of worldwide pension assets, and the United Kingdom plans representing 27% of worldwide pension assets, are invested primar-ily for growth, as the majority of the assets are in plans with active participants and ongoing accruals. In general, the plans have their primary allocation to diversified global equities, primarily through index funds in the form of common collective trusts. The United States plans' target allocation is 33% United States equities, 32% non-United States equities, 8% real estate (primarily equity of real estate invest-ment trusts), 22% debt securities and 5% other, including hedge funds, private equity and cash equivalents. The United Kingdom plans' target asset allocations are 65% equities and the remainder in debt securities, cash equivalents and real estate investments. The equity risk for the plans is managed through broad geographic diversification and diversification across industries and levels of market capitaliza-tion. The majority of debt allocations for these plans are longer duration government and corporate debt. The United States, United Kingdom and Canada pension plans are authorized to use derivatives to achieve more economically desired market expo-sures and to use futures, swaps and options to gain or hedge exposures.
Other Postretirement Benefits Plan AssetsThe Voluntary Employee Benefit Association trust which holds U.S. other postre-tirement benefits plan assets has investment guidelines that include allocations to global equities and fixed income investments. The trust's 2015 target investment allocation is 50% diversified global equities and 50% fixed income securities. The fixed income securities are primarily comprised of intermediate term, high quality, dollar denominated, fixed income instruments. The equity allocation is invested in a diversified global equity index fund in the form of a collective trust.
Fair Value MeasurementsFinancial instruments included in pension and other postretirement benefits plan assets are categorized into a fair value hierarchy of three levels, based on the degree of subjectivity inherent in the valuation methodology as follows:
Level 1 – Quoted prices (unadjusted) for identical assets in active marketsLevel 2 – Quoted prices for similar assets in active markets, and inputs that are
observable for the asset, either directly or indirectly, for substantially the full term of the financial instrument.
Level 3 – Unobservable prices or inputs.
EATON 2015 Annual Report30
Pension PlansA summary of the fair value of pension plan assets at December 31, 2015 and 2014, follows:
Quoted prices in active markets Other for identical observable Unobservable assets inputs inputs Total (Level 1) (Level 2) (Level 3)
2015Common collective trusts Non-United States equity and global equities $ 1,347 $ - $ 1,347 $ - United States equity 953 - 953 - Fixed income 514 - 514 - Exchange traded funds 158 - 158 -Fixed income securities 357 - 357 -United States treasuries 105 105 - -Bank loans 136 - 136 -Real estate securities 251 244 - 7Equity securities 98 98 - -Cash equivalents 246 17 229 -Hedge funds 92 - - 92Exchange traded funds 49 49 - -Other 100 - 14 86
Total pension plan assets $ 4,406 $ 513 $ 3,708 $ 185
2014Common collective trusts Non-United States equity and global equities $ 1,458 $ - $ 1,458 $ - United States equity 1,005 - 1,005 - Fixed income 646 - 646 - Exchange traded funds 138 - 138 -Fixed income securities 398 - 398 -United States treasuries 106 106 - -Bank loans 128 - 128 -Real estate securities 263 257 - 6Equity securities 92 92 - -Cash equivalents 218 8 210 -Hedge funds 54 - - 54Exchange traded funds 50 50 - -Other 65 - 5 60
Total pension plan assets $ 4,621 $ 513 $ 3,988 $ 120
The fair value measurement of plan assets using significant unobservable inputs (Level 3) changed during 2014 and 2015 due to the following: Real Estate Hedge Funds Other Total
Balance at December 31, 2013 $ 6 $ - $ 94 $ 100 Actual return on plan assets: Gains (losses) relating to assets still held at year-end - 1 (3) (2) Purchases, sales, settlements - net - 53 - 53 Transfers into or out of Level 3 - - (31) (31)
Balance at December 31, 2014 6 54 60 120 Actual return on plan assets: Gains (losses) relating to assets still held at year-end 1 (5) (2) (6) Purchases, sales, settlements - net - 43 37 80 Transfers into or out of Level 3 - - (9) (9)
Balance at December 31, 2015 $ 7 $ 92 $ 86 $ 185
Other Postretirement Benefits Plans A summary of the fair value of other postretirement benefits plan assets at December 31, 2015 and 2014, follows: Quoted prices in active markets Other for identical observable Unobservable assets inputs inputs Total (Level 1) (Level 2) (Level 3)
2015Common collective trusts Global equities $ 44 $ - $ 44 $ -Fixed income securities 18 - 18 -United States treasuries 20 20 - -Cash equivalents 11 11 - -
Total other postretirement benefits plan assets $ 93 $ 31 $ 62 $ -
2014Common collective trusts Global equities $ 54 $ - $ 54 $ -Fixed income securities 24 - 24 -United States treasuries 37 37 - -Cash equivalents 1 1 - -
Total other postretirement benefits plan assets $ 116 $ 38 $ 78 $ -
Valuation MethodologiesFollowing is a description of the valuation methodologies used for pension and other postretirement benefits plan assets measured at fair value. There have been no changes in the methodologies used at December 31, 2015 and 2014.
• Common collective trusts – Valued at the net unit value of units held by the trust at year end. The unit value is determined by the total value of fund assets divided by the total number of units of the fund owned. The equity investments in collective trusts are predominantly in index funds for which the underlying securities are actively traded in public markets based upon readily measurable prices.
• Fixed income securities – These securities consist of publicly traded United States and non-United States fixed interest obligations (principally corporate and government bonds and debentures). The fair value of corporate and government debt securities is determined through third-party pricing models that consider various assumptions, including time value, yield curves, credit ratings, and cur-rent market prices. The Company verifies the results of trustees or custodians and evaluates the pricing classification of these securities by performing analy-ses using other third-party sources.
• United States treasuries – Valued at the closing price of each security.
• Bank loans – These securities consist of senior secured term loans of publicly traded and privately held United States and non-United States floating rate obli-gations (principally corporations of non-investment grade rating). The fair value is determined through third-party pricing models that primarily utilize dealer quoted current market prices. The Company verifies the results of trustees or custodians and evaluates the pricing classification of these securities by performing analy-ses using other third-party sources.
• Real estate and equity securities – These securities consist of direct investments in the stock of publicly traded companies. Such investments are valued based on the closing price reported in an active market on which the individual securities are traded. As such, the direct investments are classified as Level 1.
• Cash equivalents – Primarily certificates of deposit, commercial paper, money market funds and repurchase agreements.
• Hedge funds – Consists of direct investments in hedge funds through limited partnership interests. Values are based on the estimated fair value of the owner-ship interest in the investment as determined by the General Partner. The major-ity of the holdings of the hedge funds are in equity securities traded on public exchanges. The investment terms of the hedge funds allow capital to be redeemed quarterly given prior notice with certain limitations.
• Exchange traded funds – Valued at the closing price of the exchange traded fund's shares.
Notes to Consolidated Financial Statements
EATON 2015 Annual Report 31
• Other – Primarily insurance contracts for international plans and also futures contracts and over-the-counter options. These investments are valued based on the closing prices of future contracts or indices as available on Bloomberg or similar service, and private equity investments.
For additional information regarding fair value measurements, see Note 12.
Defined Contribution PlansThe Company has various defined contribution benefit plans, primarily consisting of the plans in the United States. The total contributions related to these plans are charged to expense and were as follows:
2015 $ 1372014 1412013 121
Note 8. Commitments and Contingencies Legal ContingenciesEaton is subject to a broad range of claims, administrative and legal proceedings such as lawsuits that relate to contractual allegations, tax audits, patent infringe-ment, personal injuries, antitrust matters, and employment-related matters. Eaton is also subject to asbestos claims from historic products which may have contained asbestos. Historically, significant insurance coverage has been available to cover costs associated with these claims. Although it is not possible to predict with cer-tainty the outcome or cost of these matters, the Company believes they will not have a material adverse effect on the consolidated financial statements.
In December 2010, a Brazilian court held that a judgment obtained by a Brazilian company, Raysul, against another Brazilian company, Saturnia, which was sold by Eaton in 2006, could be enforced against Eaton Ltda. This judgment is based on an alleged violation of an agency agreement between Raysul and Saturnia. At Decem-ber 31, 2015, the Company has a total accrual of 96 Brazilian Reais related to this matter ($24 based on current exchange rates), comprised of 60 Brazilian Reais recog-nized in the fourth quarter of 2010 ($15 based on current exchange rates) with an additional 36 Brazilian Reais recognized through December 31, 2015 ($9 based on current exchange rates). In 2010, Eaton filed motions for clarification with the Brazil-ian court of appeals which were denied on April 6, 2011. Eaton Holding and Eaton Ltda. filed appeals on various issues to the Superior Court of Justice in Brasilia. In April 2013, the Superior Court of Justice ruled in favor of Raysul. Additional motions for clarification were filed with the Superior Court of Justice in Brasilia and were denied. On February 2, 2015, a final appeal was filed with the Superior Court of Jus-tice in Brasilia. The Company expects that any sum it may be required to pay in con-nection with this matter will not exceed the amount of the recorded liability.
On October 5, 2006, ZF Meritor LLC and Meritor Transmission Corporation (collec-tively, Meritor) filed an action against Eaton in the United States District Court for Delaware. The action sought damages, which would have been trebled under United States antitrust laws, as well as injunctive relief and costs. The suit alleged that Eaton engaged in anti-competitive conduct against Meritor in the sale of heavy-duty truck transmissions in North America. On June 23, 2014, Eaton announced it signed a settlement agreement with Meritor in the amount of $500 that resolved the lawsuit and removed the uncertainty of a trial and appeal process. On July 16, 2014, Eaton paid Meritor the $500.
Frisby Corporation, now known as Triumph Actuation Systems, LLC, and other claim-ants (collectively, Triumph) asserted claims alleging, among other things, unfair com-petition, defamation, malicious prosecution, deprivation of civil rights, and antitrust in the Hinds County Circuit Court of Mississippi in 2004 and in the Federal District Court of North Carolina in 2011. Eaton had asserted claims against Triumph regard-ing improper use of trade secrets and these claims were dismissed by the Hinds County Circuit Court. On June 18, 2014, Eaton announced it signed a settlement agreement with Triumph in the amount of $147.5 that resolved all claims and law-suits and removed the uncertainty of a trial and appeal process. On July 8, 2014, Eaton paid Triumph the $147.5.
Environmental ContingenciesEaton has established policies to ensure that its operations are conducted in keeping with good corporate citizenship and with a positive commitment to the protection of the natural and workplace environments. The Company's manufacturing facilities are required to be certified to ISO 14001, an international standard for environmental management systems. The Company routinely reviews EHS performance at each of its facilities and continuously strives to improve pollution prevention.
Eaton is involved in remedial response and voluntary environmental remediation at a number of sites, including certain of its currently-owned or formerly-owned plants. The Company has also been named a potentially responsible party under the United States federal Superfund law, or the state equivalents thereof, at a number of dis-posal sites. The Company became involved in these sites as a result of government action or in connection with business acquisitions. At the end of 2015, the Company was involved with a total of 137 sites worldwide, including the Superfund sites men-tioned above, with none of these sites being individually significant to the Company.
Remediation activities, generally involving soil and/or groundwater contamination, include pre-cleanup activities such as fact finding and investigation, risk assessment, feasibility study, design and action planning, performance (where actions may range from monitoring, to removal of contaminants, to installation of longer-term remedia-tion systems), and operation and maintenance of a remediation system. The extent of expected remediation activities and costs varies by site. A number of factors affect the cost of environmental remediation, including the number of parties involved at a particular site, the determination of the extent of contamination, the length of time the remediation may require, the complexity of environmental regula-tions, and the continuing advancement of remediation technology. Taking these fac-tors into account, Eaton has estimated the costs of remediation, which will be paid over a period of years. The Company accrues an amount on an undiscounted basis, consistent with the estimates of these costs when it is probable that a liability has been incurred. Actual results may differ from these estimates. At December 31, 2015 and 2014, the Company had an accrual totaling $131 and $140, respectively, for these costs.
Based upon Eaton's analysis and subject to the difficulty in estimating these future costs, the Company expects that any sum it may be required to pay in connection with environmental matters is not reasonably possible to exceed the recorded liabil-ity by an amount that would have a material effect on its financial position, results of operations or cash flows.
Warranty AccrualsA summary of the current and long-term warranty accruals follows:
2015 2014 2013
Balance at January 1 $ 213 $189 $ 185 Provision 104 125 107 Settled (114) (120) (99) Other (8) 19 (4)
Balance at December 31 $ 195 $ 213 $ 189
Lease CommitmentsEaton leases certain real properties and equipment. A summary of minimum rental commitments at December 31, 2015 under noncancelable operating leases, which expire at various dates and in most cases contain renewal options, for each of the next five years and thereafter in the aggregate, follow:
2016 $ 1512017 1162018 872019 492020 32Thereafter 55
Total noncancelable lease commitments $ 490
A summary of rental expense follows:
2015 $ 2252014 2442013 241
EATON 2015 Annual Report32
Note 9. Income TaxesEaton Corporation plc is domiciled in Ireland. Income (loss) before income taxes and income tax (benefit) expense are summarized below based on the geographic location of the operation to which such earnings and income taxes are attributable. Certain Eaton operations which are located outside the United States are subject to income tax in both the United States as well as the country in which the operations are located. As a result, income before tax by location and the components of income tax expense by taxing jurisdiction are not directly related. For purposes of this note, Puerto Rico is classified in Foreign - other since Puerto Rico is not part of the United States corporate tax system.
Income (loss) before income taxes
2015 2014 2013
Ireland $ (608) $ (332) $ 184Foreign 2,753 2,093 1,700
Total income before income taxes $ 2,145 $ 1,761 $ 1,884
Income tax expense (benefit)
2015 2014 2013
Current Ireland $ 8 $ (13) $ 17 United States Federal 88 87 89 State and local 22 41 7 Foreign - other 240 239 244
Total current income tax expense 358 354 357
Deferred Ireland 1 2 - United States Federal (65) (224) (295) State and local (6) (49) (23) Foreign - other (124) (125) (28)
Total deferred income tax benefit (194) (396) (346)
Total income tax expense (benefit) $ 164 $ (42) $ 11
Reconciliations of income taxes from the Ireland national statutory rate of 25% to the consolidated effective income tax rate follow:
2015 2014 2013
Income taxes at the applicable statutory rate 25.0% 25.0% 25.0%
Ireland operations Ireland tax on trading income (0.4)% (0.1)% (1.4)% Nondeductible interest expense 7.9% 4.8% -%
United States operations United States (loss) income (0.4)% (2.8)% (2.8)% Nondeductible goodwill - Aerospace divestitures -% 1.4% -% Credit for research activities (0.8)% (1.0)% (2.0)% Other - net 5.4% 1.5% 1.3%
Other foreign operations United States foreign tax credit (0.8)% (1.1)% (1.8)% Other foreign operations (earnings taxed at other than the applicable statutory tax rate) (25.1)% (24.8)% (17.6)% Other foreign operations - other items (0.5)% (1.0)% 0.2%
Worldwide operations Adjustments to tax liabilities (1.4)% (1.7)% (1.1)% Adjustments to valuation allowances (1.2)% (2.6)% 0.8%
Effective income tax expense (benefit) rate 7.7% (2.4)% 0.6%
During 2015, income tax expense of $164 was recognized (an effective tax expense rate of 7.7%) compared to income tax benefit of $42 for 2014 (an effective tax benefit rate of 2.4%) and income tax expense of $11 for 2013 (an effective tax expense rate of 0.6%). Excluding the net tax benefit of 7.6% for the Meritor and Triumph litigation settlements and related legal costs and the gain on the sale of the Aerospace busi-nesses, all of which occurred in the second quarter of 2014, the income tax rate was 5.2% for 2014. The 2015 income tax rate increased from 2014 primarily due to greater levels of income earned in higher tax jurisdictions and net increases in worldwide tax liabilities. Excluding the previously mentioned litigation settlements
and gain on the sale of businesses, the 2014 income tax rate increased from 2013 due to greater levels of income earned in higher tax jurisdictions and net increases in worldwide tax liabilities, partially offset by additional foreign tax credit recognition in the United States and recognition of deferred tax assets in foreign jurisdictions.
See Note 8 and Note 2 for additional information about litigation settlements and sales of businesses, respectively.
No provision has been made for income taxes on undistributed earnings of foreign subsidiaries of approximately $15.1 billion at December 31, 2015, since it is the Compa-ny's intention to indefinitely reinvest undistributed earnings of its foreign subsidiaries. It is not practicable to estimate the additional income taxes and applicable withhold-ing taxes that would be payable on the remittance of such undistributed earnings.
The Company expects to deploy capital to those markets which offer particularly attractive growth opportunities. Given expected population growth and economic growth rates, most of the particularly attractive markets are outside of the United States. The cash that is permanently reinvested is typically used to expand these operations either organically or through acquisitions. Beginning in December 2012, Eaton Corporation became owned by an Irish parent company which has provided enhanced cash flow flexibility without incurring significant incremental tax. In addition, the Company expects that minimal to no Irish tax would apply to dividends paid to the Irish parent due to the impact of the Irish foreign tax credit system. The Company's public dividends and share repurchases are funded primarily from Non-U.S. operations.
Worldwide income tax payments follow:
2015 $ 3022014 2582013 272
Deferred Income Tax Assets and LiabilitiesComponents of current and noncurrent deferred income taxes follow:
2015 2014 Noncurrent Current Noncurrent assets and assets and assets and liabilities liabilities liabilities
Accruals and other adjustments Employee benefits $ 808 $ 148 $ 773 Depreciation and amortization (1,824) - (2,010) Other accruals and adjustments 717 476 282 United States federal income tax loss carryforwards 20 - 58 United States federal income tax credit carryforwards 183 - 150 United States state and local tax loss carryforwards and tax credit carryforwards 63 - 76 Other foreign tax loss carryforwards 2,265 - 2,112Other foreign income tax credit carryforwards 70 - 49 Valuation allowance for income tax loss and income tax credit carryforwards (2,315) (24) (2,134)Other valuation allowances (15) (7) (29)
Total deferred income taxes $ (28) $ 593 $ (673)
During the fourth quarter of 2015, the Company early adopted Accounting Standards Update 2015-17, Balance Sheet Classification of Deferred Taxes (ASU 2015-17). ASU 2015-17 requires that all deferred tax assets and liabilities, along with any related valuation allowance, be classified as noncurrent on the Company's consolidated bal-ance sheet starting in 2017. The Company elected to apply this standard prospec-tively for 2015 financial statements. As a result, prior periods were not retrospectively adjusted.
In July 2013, the FASB issued Accounting Standards Update No. 2013-11, Presenta-tion of an Unrecognized Tax Benefit When a Net Operating Loss Carryforward, a Sim-ilar Loss, or a Tax Credit Carryforward Exists (ASU 2013-11). ASU 2013-11 requires the netting of unrecognized tax benefits against a deferred tax asset for a loss or other carryforward that would apply in settlement of the uncertain tax positions except where the deferred tax asset or other carryforward are not available for use. The adoption of this standard resulted in a reduction of the Company’s consolidated long term deferred tax assets by $262 in 2015 and $146 in 2014.
Notes to Consolidated Financial Statements
EATON 2015 Annual Report 33
At the end of 2015, United States federal income tax loss carryforwards and income tax credit carryforwards are available to reduce future United States federal income tax liabilities. These carryforwards and their respective expiration dates are summa-rized below:
2016 2021 2026 2031 2036 Not through through through through through subject to Valuation 2020 2025 2030 2035 2040 expiration allowance
United States federal income tax loss carryforwards $ - $ - $ 35 $ 415 $ - $ - $ -United States federal deferred income tax assets for income tax loss carryforwards - - 12 107 - - (12)United States federal deferred income tax assets for income tax loss carryforwards after ASU 2013-11 - - 12 8 - - (12)United States federal income tax credit carryforwards 28 69 27 108 21 30 (66)United States federal income tax credit carryforwards after ASU 2013-11 28 69 25 40 21 - (66)
United States state and local tax loss carryforwards and tax credit carryforwards with a future tax benefit are also available at the end of 2015. The deferred tax assets for these carryforwards and their respective expiration dates are summarized below:
2016 2021 2026 2031 2036 Not through through through through through subject to Valuation 2020 2025 2030 2035 2040 expiration allowance
United States state and local deferred income tax assets for income tax loss carryforwards - net of federal tax effect $ 7 $ 17 $ 12 $ 9 $ - $ - $ (18) United States state and local deferred income tax assets for income tax loss carryforwards - net of federal tax effect after ASU 2013-11 - 12 12 9 - - (18)United States state and local income tax credit carryforwards - net of federal tax effect 10 10 6 3 5 - (16)United States state and local income tax credit carryforwards- net of federal tax effect after ASU 2013-11 8 9 6 2 5 - (16)
At December 31, 2015, certain non-United States subsidiaries had tax loss carryforwards and income tax credit carryforwards that are available to offset future taxable income. These carryforwards and their respective expiration dates are summarized below:
2016 2021 2026 2031 Not through through through through subject to Valuation 2020 2025 2030 2035 expiration allowance
Non-United States income tax loss carryforwards $ 125 $ 146 $ 3 $ - $ 10,092 $ -Non-United States deferred income tax assets for income tax loss carryforwards 33 35 1 - 2,196 (2,171)Non-United States income tax credit carryforwards 7 15 16 - 32 (32)
Recoverability of Deferred Income Tax AssetsEaton is subject to the income tax laws in the jurisdictions in which it operates. In order to determine its income tax provision for financial statement purposes, Eaton must make significant estimates and judgments about its business operations in these jurisdictions. These estimates and judgments are also used in determining the deferred income tax assets and liabilities that have been recognized for differences between the financial statement and income tax basis of assets and liabilities, and income tax loss carryforwards and income tax credit carryforwards.
Management evaluates the realizability of deferred income tax assets for each of the jurisdictions in which it operates. If the Company experiences cumulative pretax income in a particular jurisdiction in the three-year period including the current and prior two years, management normally concludes that the deferred income tax assets will more likely than not be realizable and no valuation allowance is recog-nized, unless known or planned operating developments would lead management to conclude otherwise. However, if the Company experiences cumulative pretax losses in a particular jurisdiction in the three-year period including the current and prior two years, management then considers a series of factors in the determination of whether the deferred income tax assets can be realized. These factors include his-torical operating results, known or planned operating developments, the period of time over which certain temporary differences will reverse, consideration of the uti-lization of certain deferred income tax liabilities, tax law carryback capability in the particular country, prudent and feasible tax planning strategies, and estimates of future earnings and taxable income using the same assumptions as those used for the Company's goodwill and other impairment testing. After evaluation of these fac-tors, if the deferred income tax assets are expected to be realized within the tax car-ryforward period allowed for that specific country, management would conclude that no valuation allowance would be required. To the extent that the deferred income tax assets exceed the amount that is expected to be realized within the tax carryforward period for a particular jurisdiction, management would establish a val-uation allowance.
Applying the above methodology, valuation allowances have been established for certain deferred income tax assets to the extent they are not expected to be realized within the particular tax carryforward period.
Unrecognized Income Tax BenefitsA summary of gross unrecognized income tax benefits follows:
2015 2014 2013
Balance at January 1 $ 493 $ 479 $ 444 Increases and decreases as a result of positions taken during prior years Transfers from valuation allowances - (3) 13 Other increases, including currency translation 34 37 7 Other decreases, including currency translation (34) (3) (7) Balances related to acquired businesses (1) (3) 2 Increases as a result of positions taken during the current year 109 65 35 Decreases relating to settlements with tax authorities - (51) (6) Decreases as a result of a lapse of the applicable statute of limitations (17) (28) (9)
Balance at December 31 $ 584 $ 493 $ 479
Eaton's long-term policy has been to enter into tax planning strategies only if it is more likely than not that the benefit would be sustained upon audit. For example, the Company does not enter into any of the United States Internal Revenue Service (IRS) Listed Transactions as set forth in Treasury Regulation 1.6011-4.
If all unrecognized tax benefits were recognized, the net impact on the provision for income tax expense would be $475.
As of December 31, 2015 and 2014, Eaton had accrued approximately $108 and $120, respectively, for the payment of worldwide interest and penalties, which are not included in the table of unrecognized income tax benefits above. Eaton recog-nizes interest and penalties related to unrecognized income tax benefits in the provi-sion for income tax expense. The Company has accrued penalties in jurisdictions primarily where they are automatically applied to any deficiency, regardless of the merit of the position.
The resolution of the majority of Eaton's unrecognized income tax benefits is depen-dent upon uncontrollable factors such as the prospect of retroactive regulations; new case law; the willingness of the income tax authority to settle the issue, includ-ing the timing thereof; and other factors. Therefore, for the majority of unrecognized income tax benefits, it is not reasonably possible to estimate the increase or decrease in the next 12 months. For each of the unrecognized income tax benefits where it is possible to estimate the increase or decrease in the balance within the next 12 months, the Company does not anticipate any significant change.
Eaton or its subsidiaries file income tax returns in Ireland and many countries around the world. The IRS has completed its examination of Eaton Corporation and Includ-ible Subsidiaries United States income tax returns for 2007 through 2010 and has issued a Statutory Notice of Deficiency (Notice) as discussed below. The statute of limitations on these tax years remains open until the matter is resolved. In 2015, the
EATON 2015 Annual Report34
IRS began its examination of tax years 2011 through 2013. During 2015, the Company extended the statute of limitations to September 2018 for tax years 2011 through 2013. Tax years 2014 and 2015 are still subject to examination by the IRS.
With respect to the pre-acquisition years of BZ Holdings Inc. and Subsidiaries (the former U.S. holding company for Cooper Industries), the IRS examination of the United States income tax returns for 2010, 2011, and the period ended December 21, 2012 was completed and settled without significant effect on the consolidated finan-cial statements. The statute of limitations closed for tax years 2010 and 2011 on September 15, 2015. The statute of limitations on the final return period ended December 21, 2012 remains open until September 15, 2016. On December 22, 2012, BZ Holdings Inc. and Subsidiaries joined the Eaton US Holdings Inc. and Includible Subsidiaries consolidated United States income tax return for 2012.
Eaton is also under examination for the income tax filings in various states of the United States and in many other foreign jurisdictions. With only a few exceptions, Eaton Corporation and Includible Subsidiaries are no longer subject to income tax examinations from states and localities within the United States for years before 2011. Income tax returns of states and localities within the United States will be reopened to the extent of United States federal income tax adjustments, if any, going back to 2005 when those audit years are finalized. Some states and localities may not limit their assessment to the United States federal adjustments, and may require the opening of the entire tax year. In addition, with only a few exceptions, BZ Holdings Inc. and Includible Subsidiaries are no longer subject to United States state and local income tax examinations for years before 2011. With only a few exceptions, the other foreign subsidiaries of both Eaton and Cooper are no longer subject to examinations for years before 2007.
At the end of the fourth quarter of 2011, the IRS issued a Notice for Eaton Corpora-tion and Includible Subsidiaries 2005 and 2006 tax years (the 2011 Notice). The 2011 Notice proposed assessments of $75 in additional taxes plus $52 in penalties related primarily to transfer pricing adjustments for products manufactured in the Company's facilities in Puerto Rico and the Dominican Republic and sold to affiliated companies located in the U.S., net of agreed credits and deductions. The Company has set its transfer prices for products sold between these affiliates at the same prices that the Company sells such products to third parties as required by two suc-cessive Advance Pricing Agreements (APAs) the Company entered into with the IRS. For the years 2001 through 2004, the IRS had previously accepted the transfer pric-ing methodology related to these APAs after a comprehensive review conducted in two separate audit cycles. On December 16, 2011, immediately prior to the 2011 Notice being issued, the IRS sent a letter stating that it was retrospectively cancel-ing the APAs, even though their respective APA terms had already expired.
The Company is contesting the proposed assessments. The Company believes that it was in full compliance with the terms of the two APAs, and that the IRS's cancella-tion of these two APAs is without merit. On February 29, 2012, the Company filed a Petition with the U.S. Tax Court in which it asserted that the transfer pricing estab-lished in the APAs meets the arms-length standard set by the U.S. income tax laws, and accordingly, that the APAs should be enforced in accordance with their terms. The case involves both whether the APAs should be enforced and, if not, the appro-priate transfer pricing methodology. The Company believes that another important U.S. Tax Court decision in 2015 further supports the Company's arms-length transfer pricing methodology. The case was tried before the U.S. Tax Court in August and September 2015. The case will be fully submitted to the Court after the parties com-plete post-trial briefing in April 2016.
During the third quarter of 2014, the Company received a Notice from the IRS for the 2007 through 2010 tax years (the 2014 Notice) proposing assessments of $190 in additional taxes plus $72 in penalties, net of agreed credits and deductions. The pro-posed assessments pertain primarily to the same transfer pricing issues that are cur-rently in litigation for the 2011 Notice, as noted above. During 2007 through 2010, the Company set its transfer prices for products sold between these affiliates con-sistent with the terms of a written APA between it and the IRS that covered the years at issue. To establish the relevant transfer prices, the APA relied on prices at which the Company sells the products to third parties. The Company has continued to apply the arms-length transfer pricing methodology for 2011 through the current reporting period. The 2014 Notice includes a separate proposed assessment involv-ing the recognition of income for several of the Company’s controlled foreign corpo-rations. The Company believes that these proposed assessments are without merit. On November 25, 2014, the Company filed a Petition with the U.S. Tax Court in which it challenged the IRS's adjustments. The Company expects the outcome of the 2014 Notice on the transfer pricing matter to be determined by the judicial decision related to the 2011 Notice.
Also during the third quarter of 2014, the Company resolved an uncertain tax position with a European government. The resolution had minimal impact on the Company's Consolidated Statements of Income.
During 2010, the Company received a tax assessment of $64, plus interest and pen-alties, in Brazil for the tax years 2005 through 2008 that relates to the amortization of certain goodwill generated from the acquisition of third-party businesses and cor-porate reorganizations. The Company is contesting the assessment, which is under review at the second of three administrative appeals levels. During 2013, the Brazil-ian tax authorities began an audit of tax years 2009 through 2012. During the third quarter of 2014, the Company received a tax assessment of $50, plus interest and penalties, for the 2009 through 2012 tax years (primarily relating to the same issues concerning the 2005 through 2008 tax years), which the Company is also contesting and is under review in the second of three administrative appeals levels. Multiple outside advisors have stated that Brazilian tax authorities are raising the issue for most clients with similar facts and that the matter is expected to require at least 10 years to resolve. The Company continues to believe that final resolution of the assessments will not have a material impact on its consolidated financial statements.
For the first time, during 2015, the Organization for Economic Cooperation and Devel-opment (OECD), in conjunction with the G20, finalized broad-based international tax policy guidelines that involve transfer pricing and other international tax subjects. While some member jurisdictions automatically adopt the new OECD guidelines, most member countries can adopt the guidelines only by new law or regulations. The Company is currently adopting processes to comply with the reporting requirements specified by the guidelines and is evaluating the other parts of the guidelines.
Note 10. Eaton Shareholders’ EquityThere are 750 million Eaton ordinary shares authorized ($0.01 par value per share), 458.8 million and 467.9 million of which were issued and outstanding at December 31, 2015 and 2014, respectively. Eaton's Memorandum and Articles of Association autho-rized 40 thousand deferred ordinary shares (€1.00 par value per share) and 10 thousand preferred A shares ($1.00 par value per share), all of which were issued and outstand-ing at December 31, 2015 and 2014, and 10 million serial preferred shares ($0.01 par value per share), none of which is outstanding at December 31, 2015 and 2014. At December 31, 2015, there were 18,538 holders of record of Eaton ordinary shares. Addi-tionally, 23,559 current and former employees were shareholders through participation in the Eaton Savings Plan, Eaton Personal Investment Plan, Eaton Puerto Rico Retire-ment Savings Plan.
On September 28, 2011, Eaton Corporation's Board of Directors adopted a common share repurchase program (2011 Program) which authorized the purchase of up to 20 million common shares, not to exceed an aggregate purchase price of $1.25 billion. Dur-ing 2012, no common shares were repurchased under the 2011 Program. On April 24, 2013, the Company's shareholders authorized the Board of Directors to adopt an ordi-nary share repurchase program (the 2013 Program) for up to 40 million ordinary shares at prices between 70% and 120% of the closing price of Eaton's ordinary shares on the day preceding the day of purchase. On October 22, 2013, Eaton's Board of Directors adopted the 2013 Program. The ordinary shares are expected to be repurchased over time, depending on market conditions, the market price of ordinary shares, capital lev-els, and other considerations. During 2015 and 2014, 11.3 million and 9.6 million ordi-nary shares were repurchased under the 2013 Program in the open market at a total cost of $682 and $650, respectively. During 2013, no ordinary shares were repurchased under the 2013 Program.
Eaton has deferral plans that permit certain employees and directors to defer a portion of their compensation. A trust contains $16 and $19 of ordinary shares and marketable securities, as valued at December 31, 2015 and 2014, respectively, to fund a portion of these liabilities. The marketable securities were included in Other assets and the ordi-nary shares were included in Shareholders' equity at historical cost.
On February 24, 2016, Eaton's Board of Directors declared a quarterly dividend of $0.57 per ordinary share, payable on March 18, 2016, to shareholders of record at the close of business on March 7, 2016.
Notes to Consolidated Financial Statements
EATON 2015 Annual Report 35
Comprehensive Income (Loss)Comprehensive income (loss) consists primarily of net income, currency translation and related hedging instruments, changes in unrecognized costs of pension and other postretirement benefits, and changes in the effective portion of open deriva-tive contracts designated as cash flow hedges. The following table summarizes the pre-tax and after-tax amounts recognized in Comprehensive income (loss):
2015 2014 2013
Pre-tax After-tax Pre-tax After-tax Pre-tax After-tax
Currency translation and related hedging instruments $ (1,080) $ (1,078) $ (1,014) $ (1,019) $ (30) $ (28)
Pensions and other postretirement benefits Prior service credit (cost) arising during the year 1 1 82 51 (6) (4) Net (loss) gain arising during the year (123) (89) (718) (519) 456 277 Currency translation 62 46 56 47 (5) (4) Other - (3) - (4) 2 16 Amortization of actuarial loss and prior service cost reclassified to earnings 237 156 168 110 229 144
177 111 (412) (315) 676 429
Cash flow hedges Gain (loss) on derivatives designated as cash flow hedges 20 13 (3) (2) 6 3 Changes in cash flow hedges reclassified to earnings (16) (10) (5) (3) - -
Cash flow hedges, net of reclassification adjustments 4 3 (8) (5) 6 3
Other comprehensive (loss) income attributable to Eaton ordinary shareholders $ (899) $ (964) $ (1,434) $ (1,339) $ 652 $ 404
The changes in Accumulated other comprehensive loss follow:
Currency Pensions and translation and other related hedging postretirement Cash flow instruments benefits hedges Total
Balance at December 31, 2014 $ (1,414) $ (1,485) $ - $ (2,899)
Other comprehensive (loss) income before reclassifications (1,078) (45) 13 (1,110) Amounts reclassified from Accumulated other comprehensive loss (income) - 156 (10) 146
Net current-period Other comprehensive (loss) income (1,078) 111 3 (964)
Balance at December 31, 2015 $ (2,492) $ (1,374) $ 3 $ (3,863)
The reclassifications out of Accumulated other comprehensive loss follow:
December 31, Consolidated Statements 2015 of Income classification
Amortization of defined benefit pension and other postretirement benefits items Actuarial loss and prior service cost $ (237) 1 Tax benefit 81
Total, net of tax (156)
Gains and (losses) on cash flow hedges Currency exchange contracts 16 Cost of products sold Tax expense (6)
Total, net of tax 10
Total reclassifications for the period $ (146)
1 These components of Accumulated other comprehensive loss are included in the computation of net periodic bene-fit cost. See Note 7 for additional information about defined benefit pension and other postretirement benefits items.
Net Income Per Share Attributable to Eaton Ordinary Shareholders
A summary of the calculation of net income per share attributable to Eaton ordinary shareholders follows:
2015 2014 2013(Shares in millions)
Net income attributable to Eaton ordinary shareholders $ 1,979 $ 1,793 $ 1,861
Weighted-average number of ordinary shares outstanding - diluted 467.1 476.8 476.7Less dilutive effect of equity-based compensation 1.6 2.7 3.2 Weighted-average number of ordinary shares outstanding - basic 465.5 474.1 473.5
Net income per share attributable to Eaton ordinary shareholders Diluted $ 4.23 $ 3.76 $ 3.90 Basic 4.25 3.78 3.93
In 2015, 2014, and 2013, 1.6 million, 0.5 million, and 0.2 million stock options, respec-tively, were excluded from the calculation of diluted net income per share attribut-able to Eaton ordinary shareholders because the exercise price of the options exceeded the average market price of the ordinary shares during the period and their effect, accordingly, would have been antidilutive.
Note 11. Equity-Based Compensation Restricted Stock Units and AwardsRestricted stock units (RSUs) and restricted stock awards (RSAs) have been issued to certain employees and directors. Participants awarded RSUs do not receive divi-dends; therefore, the fair value is determined by reducing the closing market price of the Company’s ordinary shares on the date of grant by the present value of the esti-mated dividends had they been paid. The RSUs entitle the holder to receive one ordi-nary share for each RSU upon vesting, generally over three or four years. The fair value of RSAs is determined based on the closing market price of the Company’s ordinary shares at the date of grant. RSAs are issued and outstanding at the time of grant, but remain subject to forfeiture until vested, generally over three or four years. A summary of the RSU and RSA activity for 2015 follows: Weighted- Number of average fair restricted stock value per unit units and awards and award
(Restricted stock units and awards in millions)
Non-vested at January 1 2.8 $ 60.11 Granted 1.1 67.46 Vested (1.6) 57.50 Forfeited (0.2) 66.94
Non-vested at December 31 2.1 $ 65.06
EATON 2015 Annual Report36
Information related to RSUs and RSAs follows:
2015 2014 2013
Pretax expense for RSUs and RSAs $ 68 $ 81 $ 69After-tax expense for RSUs and RSAs 44 53 45Fair value of vested RSUs and RSAs 110 105 82
As of December 31, 2015, total compensation expense not yet recognized related to non-vested RSUs and RSAs was $82, and the weighted-average period in which the expense is expected to be recognized is 2.7 years. Excess tax benefit for RSUs and RSAs totaled $5, and $10 for 2014 and 2013, respectively. There was no excess tax benefit for RSU's and RSA's in 2015.
Performance Share Units
In February 2015, the Compensation and Organization Committee of the Board of Directors approved the grant of performance share units (PSUs) to certain employ-ees that vest based on the satisfaction of a three-year service period and the achievement of certain performance metrics over that same period. Upon vesting, PSU holders receive dividends that accumulate during the vesting period. The fair value of these PSUs is determined based on the closing market price of the Compa-ny's ordinary shares at the date of grant. Equity-based compensation expense is rec-ognized over the period an employee is required to provide service based on the number of PSUs for which achievement of the performance objectives is probable. A summary of PSU activity for 2015 follows:
Number of performance Weighted-average fair (Performance share units in millions) share units value per unit
Non-vested at January 1 - $ -
Granted 0.9 71.72 Vested - - Forfeited (0.1) 71.72
Non-vested at December 31 0.8 $ 71.72
Information related to PSUs follows:
2015
Pretax expense for PSUs $ 2After-tax expense for PSUs 1
As of December 31, 2015, total compensation expense not yet recognized related to non-vested PSUs was $5 and the weighted average period in which the expense is to be recognized is 2 years.
Stock OptionsUnder various plans, stock options have been granted to certain employees and directors to purchase ordinary shares at prices equal to fair market value on the date of grant. Substantially all of these options vest ratably during the three-year period following the date of grant and expire 10 years from the date of grant. Compensation expense is recognized for stock options based on the fair value of the options at the date of grant and amortized on a straight-line basis over the period the employee or director is required to provide service.
The Company uses a Black-Scholes option pricing model to estimate the fair value of stock options. The principal assumptions utilized in valuing stock options include the expected stock price volatility (based on the most recent historical period equal to the expected life of the option); the expected option life (an estimate based on his-torical experience); the expected dividend yield; and the risk-free interest rate (an estimate based on the yield of United States Treasury zero coupon with a maturity equal to the expected life of the option). A summary of the assumptions used in determining the fair value of stock options follows:
2015 2014 2013
Expected volatility 29% 34% 36%Expected option life in years 5.5 5.5 5.5Expected dividend yield 2.6% 2.4% 2.0%Risk-free interest rate 1.6 to 1.5% 1.7 to 1.5% 1.5 to 0.8%Weighted-average fair value of stock options granted $ 15.25 $ 19.46 $ 17.49
A summary of stock option activity follows: Weighted- Weighted- average average exercise remaining Aggregate price per contractual intrinsic (Options in millions) option Options life in years value
Outstanding at January 1, 2015 $ 47.30 7.0 Granted 71.66 0.8 Exercised 37.91 (1.4) Forfeited and canceled 71.18 (0.2)
Outstanding at December 31, 2015 $ 51.94 6.2 4.3 $ 36.2
Exercisable at December 31, 2015 $ 47.23 5.0 3.3 $ 36.2Reserved for future grants at December 31, 2015 25.5
The aggregate intrinsic value in the table above represents the total excess of the $52.04 closing price of Eaton ordinary shares on the last trading day of 2015 over the exercise price of the stock option, multiplied by the related number of options out-standing and exercisable. The aggregate intrinsic value is not recognized for finan-cial accounting purposes and the value changes based on the daily changes in the fair market value of the Company's ordinary shares.
Information related to stock options follows:
2015 2014 2013
Pretax expense for stock options $ 12 $ 12 $ 11After-tax expense for stock options 8 8 7Proceeds from stock options exercised 52 54 121Income tax benefit related to stock options exercised Tax benefit classified in operating activities in the Consolidated Statements of Cash Flows 4 4 3 Excess tax benefit classified in financing activities in the Consolidated Statements of Cash Flows 1 15 22Intrinsic value of stock options exercised 44 55 102Total fair value of stock options vested $ 12 $ 12 $ 11
Stock options exercised, in millions of options 1.4 1.5 3.6
As of December 31, 2015, total compensation expense not yet recognized related to non-vested stock options was $11, and the weighted-average period in which the expense is expected to be recognized is 1.7 years.
Note 12. Fair Value MeasurementsFair value is measured based on an exit price, representing the amount that would be received to sell an asset or paid to satisfy a liability in an orderly transaction between market participants. Fair value is a market-based measurement that should be deter-mined based on assumptions that market participants would use in pricing an asset or liability. As a basis for considering such assumptions, a fair value hierarchy is established, which categorizes the inputs used in measuring fair value as follows: (Level 1) observable inputs such as quoted prices in active markets; (Level 2) inputs, other than the quoted prices in active markets, that are observable either directly or indirectly; and (Level 3) unobservable inputs in which there is little or no market data, which require the reporting entity to develop its own assumptions.
A summary of financial instruments recognized at fair value, and the fair value measurements used, follows: Quoted prices in Other active markets for observable Unobservable identical assets inputs inputs Total (Level 1) (Level 2) (Level 3)
2015Cash $ 268 $ 268 $ - $ -Short-term investments 177 177 - -Net derivative contracts 86 - 86 -Long-term debt converted to floating interest rates by interest rate swaps - net (94) - (94) -
2014Cash $ 781 $ 781 $ - $ -Short-term investments 245 245 - -Net derivative contracts 70 - 70 -Long-term debt converted to floating interest rates by interest rate swaps - net (74) - (74) -
Notes to Consolidated Financial Statements
EATON 2015 Annual Report 37
For derivatives that are not designated as a hedge, any gain or loss is immediately rec-ognized in income. The majority of derivatives used in this manner relate to risks result-ing from assets or liabilities denominated in a foreign currency and certain commodity contracts that arise in the normal course of business. Gains and losses associated with commodity hedge contracts are classified in Cost of products sold.
Eaton uses certain of its debt denominated in foreign currency to hedge portions of its net investments in foreign operations against foreign currency exposure (net invest-ment hedges). Foreign currency denominated debt designated on an after-tax basis as non-derivative net investment hedging instruments was $83 and $84 at December 31, 2015 and 2014, respectively. See Note 6 for additional information about debt.
Interest Rate Risk
Eaton has entered into fixed-to-floating interest rate swaps to manage interest rate risk of certain long-term debt. These interest rate swaps are accounted for as fair value hedges of certain long-term debt. The maturity of the swap corresponds with the maturity of the debt instrument as noted in the table of long-term debt in Note 6. Eaton has also entered into a forward starting floating-to-fixed interest rate swap to manage interest rate risk on an anticipated debt refinancing in 2017.
A summary of interest rate swaps outstanding at December 31, 2015, follows:
Fixed-to-Floating Interest Rate Swaps
Fixed Floating Notional interest rate interest rate Basis for contracted amount received paid floating interest rate paid
$ 150 5.30% 4.59% 1 month LIBOR + 4.26% 750 1.50% 0.71% 1 month LIBOR + 0.46% 415 5.60% 3.78% 6 month LIBOR + 3.18% 300 6.95% 5.66% 3 month LIBOR + 5.07% 25 8.875% 4.59% 6 month LIBOR + 3.84% 150 3.875% 2.45% 1 month LIBOR + 2.12% 275 3.47% 2.07% 1 month LIBOR + 1.74% 1,350 2.75% 0.80% 1 month LIBOR + 0.56% 200 3.68% 1.40% 1 month LIBOR + 1.07% 25 7.625% 3.01% 6 month LIBOR + 2.48% 50 7.65% 3.17% 6 month LIBOR + 2.57% 25 5.45% 0.80% 6 month LIBOR + 0.28%
Forward Starting Floating-to-Fixed Interest Rate Swaps
Fixed Floating Notional interest rate interest rate Basis for contracted amount paid received floating interest rate received
$ 50 2.52% -% 3 month LIBOR + 0.00%
Eaton values its financial instruments using an industry standard market approach, in which prices and other relevant information is generated by market transactions involving identical or comparable assets or liabilities. No financial instruments were measured using unobservable inputs.
Other Fair Value MeasurementsLong-term debt and the current portion of long-term debt had a carrying value of $8,023 and fair value of $8,231 at December 31, 2015 compared to $9,032 and $9,509, respectively, at December 31, 2014. The fair value of Eaton's debt instruments was estimated using prevailing market interest rates on debt with similar creditworthiness, terms and maturities and is considered a Level 2 fair value measurement.
Short-Term InvestmentsEaton invests excess cash generated from operations in short-term marketable investments. For those investments classified as “available-for-sale”, Eaton marks these investments to fair value with the offset recognized in Accumulated other com-prehensive loss. A summary of the carrying value of short-term investments follows:
2015 2014
Time deposits, certificates of deposit and demand deposits with banks $ 122 $ 113Money market investments 55 131Other - 1
Total short-term investments $ 177 $ 245
Note 13. Derivative Financial Instruments and Hedging Activities In the normal course of business, Eaton is exposed to certain risks related to fluctua-tions in interest rates, currency exchange rates and commodity prices. The Company uses various derivative and non-derivative financial instruments, primarily interest rate swaps, currency forward exchange contracts, currency swaps and, to a lesser extent, commodity contracts, to manage risks from these market fluctuations. The instruments used by Eaton are straightforward, non-leveraged instruments. The counterparties to these instruments are financial institutions with strong credit rat-ings. Eaton maintains control over the size of positions entered into with any one counterparty and regularly monitors the credit rating of these institutions. Such instruments are not purchased and sold for trading purposes.
Derivative financial instruments are accounted for at fair value and recognized as assets or liabilities in the Consolidated Balance Sheets. Accounting for the gain or loss resulting from the change in the fair value of the derivative financial instrument depends on whether it has been designated, and is effective, as part of a hedging relationship and, if so, as to the nature of the hedging activity. Eaton formally docu-ments all relationships between derivative financial instruments accounted for as designated hedges and the hedged item, as well as its risk-management objective and strategy for undertaking the hedge transaction. This process includes linking derivative financial instruments to a recognized asset or liability, specific firm com-mitment, forecasted transaction, or net investment in a foreign operation. These financial instruments can be designated as:
• Hedges of the change in the fair value of a recognized fixed-rate asset or liability, or the firm commitment to acquire such an asset or liability (a fair value hedge); for these hedges, the gain or loss from the derivative financial instrument, as well as the off-setting loss or gain on the hedged item attributable to the hedged risk, are recog-nized in income during the period of change in fair value.
• Hedges of the variable cash flows of a recognized variable-rate asset or liability, or the forecasted acquisition of such an asset or liability (a cash flow hedge); for these hedges, the effective portion of the gain or loss from the derivative financial instrument is rec-ognized in Accumulated other comprehensive loss and reclassified to income in the same period when the gain or loss on the hedged item is included in income.
• Hedges of the currency exposure related to a net investment in a foreign operation (a net investment hedge); for these hedges, the effective portion of the gain or loss from the derivative financial instrument is recognized in Accumulated other comprehensive loss and reclassified to income in the same period when the gain or loss related to the net investment in the foreign operation is included in income.
The gain or loss from a derivative financial instrument designated as a hedge that is effective is classified in the same line of the Consolidated Statements of Income as the offsetting loss or gain on the hedged item. The change in fair value of a derivative finan-cial instrument that is not effective as a hedge is immediately recognized in income.
EATON 2015 Annual Report38
Derivative Financial Statement Impacts The fair value of derivative financial instruments recognized in the Consolidated Balance Sheets follows:
Other Other Other Other Notional current noncurrent current noncurrent Type of amount assets assets liabilities liabilities hedge Term
December 31, 2015Derivatives designated as hedges Fixed-to-floating interest rate swaps $ 3,715 $ - $ 96 $ - $ 2 Fair value 2 to 19 years Forward starting floating-to-fixed interest rate swaps 50 - - - - Cash flow 12 years Currency exchange contracts 724 18 1 8 6 Cash flow 1 to 36 months Commodity contracts 1 - - - - Cash flow 1 to 12 months
Total $ 18 $ 97 $ 8 $ 8
Derivatives not designated as hedges Currency exchange contracts $ 4,198 $ 27 $ 40 1 to 12 months
Total $ 27 $ 40
December 31, 2014Derivatives designated as hedges Fixed-to-floating interest rate swaps $ 3,440 $ - $ 84 $ - $ 10 Fair value 2 to 19 years Currency exchange contracts 432 8 1 5 3 Cash flow 1 to 36 months Commodity contracts 1 - - - - Cash flow 1 to 12 months
Total $ 8 $ 85 $ 5 $ 13
Derivatives not designated as hedges Currency exchange contracts $ 4,447 $ 47 $ 52 1 to 12 months
Total $ 47 $ 52
The currency exchange contracts shown in the table above as derivatives not designated as hedges are primarily contracts entered into to manage currency volatility or exposure on intercompany sales and loans. While Eaton does not elect hedge accounting treatment for these derivatives, Eaton targets managing 100% of the intercompany balance sheet exposure to minimize the effect of currency volatility related to the movement of goods and services in the normal course of its operations. This activity repre-sents the great majority of these currency exchange contracts.
Notes to Consolidated Financial Statements
The impact of derivative instruments to the Consolidated Statements of Income and Comprehensive Income follow:
Location of gain Gain (loss) Gain (loss) (loss) reclassified reclassified from recognized in from Accumulated Accumulated other other other comprehensive comprehensive comprehensive (loss) income loss loss
2015 2014 2015 2014
Derivatives designated as cash flow hedges Floating-to-fixed interest rate swaps $ - $ - Interest expense - net $ - $ (1) Currency exchange contracts 20 (3) Cost of products sold 16 6
Total $ 20 $ (3) $ 16 $ 5
Amounts recognized in net income follow:
2015 2014
Derivatives designated as fair value hedges Fixed-to-floating interest rate swaps $ 20 $ 113 Related long-term debt converted to floating interest rates by interest rate swaps (20) (113)
$ - $ -
Gains and losses described above were recognized in Interest expense - net.
Note 14. Accounts Receivable and Inventory
Accounts ReceivableEaton performs ongoing credit evaluation of its customers and maintains sufficient allowances for potential credit losses. The Company evaluates the collectability of its accounts receivable based on the length of time the receivable is past due and any anticipated future write-off based on historic experience. Accounts receivable bal-ances are written off against an allowance for doubtful accounts after a final determi-nation of uncollectability has been made. Accounts receivable are net of an allowance for doubtful accounts of $50 and $60 at December 31, 2015 and 2014, respectively.
InventoryInventory is carried at lower of cost or market. Inventory in the United States is gener-ally accounted for using the last-in, first-out (LIFO) method. Remaining United States and non-United States inventory is accounted for using the first-in, first-out (FIFO) method. Cost components include raw materials, purchased components, direct labor, indirect labor, utilities, depreciation, inbound freight charges, purchasing and receiv-ing costs, inspection costs, warehousing costs, and costs of the distribution network.
The components of inventory follow:
2015 2014
Raw materials $ 885 $ 924Work-in-process 412 422Finished goods 1,131 1,201
Inventory at FIFO 2,428 2,547Excess of FIFO over LIFO cost (105) (119)
Total inventory $ 2,323 $ 2,428
Inventory at FIFO accounted for using the LIFO method was 43% and 41% at the end of 2015 and 2014, respectively
EATON 2015 Annual Report 39
Note 15. Business Segment and Geographic Region InformationOperating segments are defined as components of an enterprise about which separate financial information is available that is evaluated on a regular basis by the chief oper-ating decision maker, or decision making group, in deciding how to allocate resources to an individual segment and in assessing performance. Eaton’s segments are as follows:
Electrical Products and Electrical Systems and ServicesThe Electrical Products segment consists of electrical components, industrial compo-nents, residential products, single phase power quality, emergency lighting, fire detec-tion, wiring devices, structural support systems, circuit protection, and lighting products. The Electrical Systems and Services segment consists of power distribution and assemblies, three phase power quality, hazardous duty electrical equipment, intrinsically safe explosion-proof instrumentation, utility power distribution, power reliability equipment, and services. The principal markets for these segments are industrial, institutional, governmental, utility, commercial, residential and information technology. These products are used wherever there is a demand for electrical power in commercial buildings, data centers, residences, apartment and office buildings, hos-pitals, factories, utilities, and industrial and energy facilities. The segments share sev-eral common global customers, but a large number of customers are located regionally. Sales are made directly to original equipment manufacturers, utilities, and certain other end users, as well as through distributors, resellers, and manufacturers' representatives.
HydraulicsThe Hydraulics segment is a global leader in hydraulics components, systems and ser-vices for industrial and mobile equipment. Eaton offers a wide range of power prod-ucts including pumps, motors and hydraulic power units; a broad range of controls and sensing products including valves, cylinders and electronic controls; a full range of fluid conveyance products including industrial and hydraulic hose, fittings, and assem-blies, thermoplastic hose and tubing, couplings, connectors, and assembly equipment; filtration systems solutions; industrial drum and disc brakes; and golf grips. The princi-pal markets for the Hydraulics segment include oil and gas, renewable energy, marine, agriculture, construction, mining, forestry, utility, material handling, truck and bus, machine tools, molding, primary metals, and power generation. Key manufacturing customers in these markets and other customers are located globally. Products are sold and serviced through a variety of channels.
AerospaceThe Aerospace segment is a leading global supplier of aerospace fuel, hydraulics, and pneumatic systems for commercial and military use. Products include hydraulic power generation systems for aerospace applications including pumps, motors, hydraulic power units, hose and fittings, electro-hydraulic pumps; controls and sensing prod-ucts including valves, cylinders, electronic controls, electromechanical actuators, sensors, aircraft flap and slat systems and nose wheel steering systems; fluid convey-ance products, including hose, thermoplastic tubing, fittings, adapters, couplings, sealing and ducting; and fuel systems including fuel pumps, sensors, valves, adapters and regulators. In addition, products included power and load management systems and displays and panels until these businesses were sold in May of 2014. The princi-pal markets for the Aerospace segment are manufacturers of commercial and military aircraft and related after-market customers. These manufacturers and other custom-ers operate globally. Products are sold and serviced through a variety of channels.
VehicleThe Vehicle segment is a leader in the design, manufacture, marketing, and supply of drivetrain and powertrain systems and critical components that reduce emis-sions and improve fuel economy, stability, performance, and safety of cars, light trucks and commercial vehicles. Products include transmissions, clutches, hybrid power systems, superchargers, engine valves and valve actuation systems, cylin-der heads, locking and limited slip differentials, transmission controls, fuel vapor components, fluid connectors and conveyance products for the global vehicle industry. The principal markets for the Vehicle segment are original equipment manufacturers and aftermarket customers of heavy-, medium-, and light-duty trucks, SUVs, CUVs, passenger cars and agricultural equipment.
Other InformationNo single customer represented greater than 10% of net sales in 2015, 2014 or 2013, respectively.
The accounting policies of the business segments are generally the same as the policies described in Note 1, except that inventory and related cost of products sold of the segments are accounted for using the FIFO method and operating profit only reflects the service cost component related to pensions and other postretire-ment benefits. Intersegment sales and transfers are accounted for at the same prices as if the sales and transfers were made to third parties. These intersegment sales are eliminated in consolidation. Operating profit includes the operating profit from intersegment sales.
For purposes of business segment performance measurement, the Company does not allocate items that are of a non-operating nature or are of a corporate or func-tional governance nature. Corporate expenses consist of transaction costs associ-ated with the acquisition of certain businesses and corporate office expenses including compensation, benefits, occupancy, depreciation, and other administra-tive costs. Identifiable assets of the business segments exclude goodwill, other intangible assets, and general corporate assets, which principally consist of cash, short-term investments, deferred income taxes, certain accounts receivable, cer-tain property, plant and equipment, and certain other assets.
EATON 2015 Annual Report40
Business Segment Information 2015 2014 2013
Net salesElectrical Products $ 6,976 $ 7,254 $ 7,026Electrical Systems and Services 5,931 6,457 6,430Hydraulics 2,459 2,975 2,981Aerospace 1,807 1,860 1,774Vehicle 3,682 4,006 3,835
Total net sales $ 20,855 $ 22,552 $ 22,046
Segment operating profitElectrical Products $ 1,156 $ 1,184 $ 1,090Electrical Systems and Services 776 843 889Hydraulics 246 367 355Aerospace 310 273 252Vehicle 645 645 592
Total segment operating profit 3,133 3,312 3,178
CorporateLitigation settlements - (644) -Amortization of intangible assets (406) (431) (437)Interest expense - net (232) (227) (271)Pension and other postretirement benefits expense (130) (138) (183)Inventory step-up adjustment - - (34)Other corporate expense - net (220) (111) (369)
Income before income taxes 2,145 1,761 1,884Income tax expense (benefit) 164 (42) 11
Net income 1,981 1,803 1,873 Less net income for noncontrolling interests (2) (10) (12)
Net income attributable to Eaton ordinary shareholders $ 1,979 $ 1,793 $ 1,861
Business segment operating profit was reduced by acquisition integration charges as follows: 2015 2014 2013
Electrical Products $ 25 $ 66 $ 44Electrical Systems and Services 15 51 37Hydraulics 2 12 36
Total $ 42 $ 129 $ 117
Corporate acquisition integration charges totaled $5, $25 and $37 in 2015, 2014 and 2013, respectively. Corporate acquisition integration charges related primarily to the acquisition of Cooper and are included above in Other corporate expense - net.
Acquisition-related transaction costs, such as investment banking, legal and other professional fees, and costs associated with change in control agreements, are included above in Interest expense - net and Other corporate expense - net. These charges totaled $9 in 2013. There were no Corporate acquisition-related transition costs in 2014 and 2015. See Note 3 for additional information about acquisition integration charges and transaction costs.
Notes to Consolidated Financial Statements

EATON 2015 Annual Report 41
Business Segment Information 2015 2014 2013
Identifiable assetsElectrical Products $ 2,538 $ 3,012 $ 3,204Electrical Systems and Services 2,285 2,512 2,683Hydraulics 1,138 1,315 1,362Aerospace 841 832 852Vehicle 1,579 1,668 1,716
Total identifiable assets 8,381 9,339 9,817Goodwill 13,479 13,893 14,495Other intangible assets 6,014 6,556 7,186Corporate 3,157 3,741 3,993
Total assets $ 31,031 $ 33,529 $ 35,491
Capital expenditures for property, plant and equipmentElectrical Products $ 137 $ 170 $ 152Electrical Systems and Services 94 147 113Hydraulics 61 79 80Aerospace 33 28 29Vehicle 119 160 161
Total 444 584 535Corporate 62 48 79
Total expenditures for property, plant and equipment $ 506 $ 632 $ 614
Depreciation of property, plant and equipmentElectrical Products $ 137 $ 148 $ 151Electrical Systems and Services 82 90 86Hydraulics 67 67 65Aerospace 28 28 27 Vehicle 113 130 133
Total 427 463 462Corporate 52 51 54
Total depreciation of property, plant and equipment $ 479 $ 514 $ 516
Geographic Region Information 2015 2014 2013
Net sales are measured based on the geographic destination of sales. Long-lived assets consist of property, plant and equipment - net.
Net salesUnited States $ 11,396 $ 11,701 $ 11,092Canada 969 1,113 1,154Latin America 1,726 1,988 2,113Europe 4,379 5,074 5,112Asia Pacific 2,385 2,676 2,575
Total $ 20,855 $ 22,552 $ 22,046
Long-lived assets United States $ 1,982 $ 1,988 $ 1,966Canada 19 25 28Latin America 243 306 331Europe 734 799 856Asia Pacific 587 632 652
Total $ 3,565 $ 3,750 $ 3,833
Note 16. Condensed Consolidating Financial StatementsOn November 14, 2013, Eaton Corporation registered senior notes under the Securities Act of 1933 (the Senior Notes). Eaton and certain other of Eaton's 100% owned direct and indirect subsidiaries (the Guarantors) fully and unconditionally guaranteed (sub-ject, in the case of the Guarantors, other than Eaton, to customary release provisions as described below), on a joint and several basis, the Senior Notes. The following con-densed consolidating financial statements are included so that separate financial statements of Eaton, Eaton Corporation and each of the Guarantors are not required to be filed with the Securities and Exchange Commission. The consolidating adjustments primarily relate to eliminations of investments in subsidiaries and intercompany bal-ances and transactions. The condensed consolidating financial statements present investments in subsidiaries using the equity method of accounting. See Note 6 for additional information related to the Senior Notes.
The guarantee of a Guarantor that is not a parent of the issuer will be automatically and unconditionally released and discharged in the event of any sale of the Guarantor or of all or substantially all of its assets, or in connection with the release or termination of the Guarantor as a guarantor under all other U.S. debt securities or U.S. syndicated credit facilities, subject to limitations set forth in the indenture. The guarantee of a Guarantor that is a direct or indirect parent of the issuer will only be automatically and uncondition-ally released and discharged in connection with the release or termination of such Guar-antor as a guarantor under all other debt securities or syndicated credit facilities (in both cases, U.S. or otherwise), subject to limitations set forth in the indenture.
During 2015, the Company undertook certain steps to restructure ownership of various subsidiaries. The transactions were entirely among wholly-owned subsidiaries under the common control of Eaton. This restructuring has been reflected as of the beginning of the earliest period presented below.
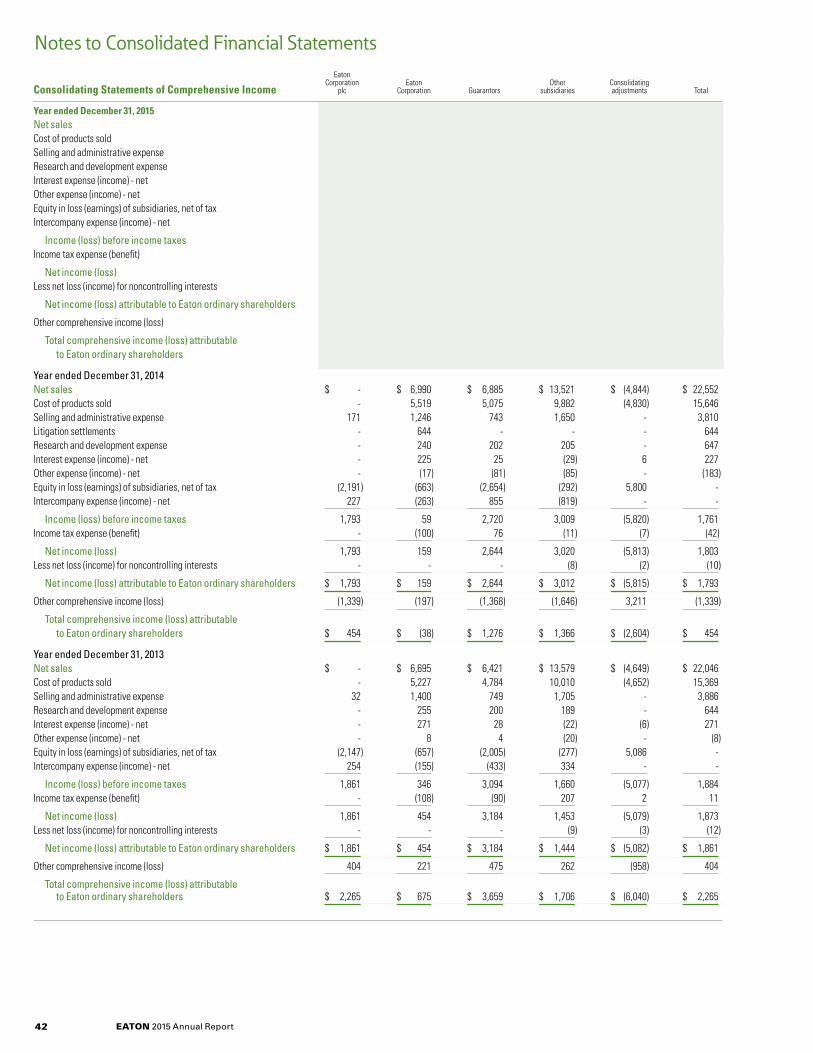
EATON 2015 Annual Report42
Eaton Corporation Eaton Other Consolidating Consolidating Statements of Comprehensive Income plc Corporation Guarantors subsidiaries adjustments Total
Year ended December 31, 2015Net sales $ - $ 6,925 $ 6,654 $ 12,538 $ (5,262) $ 20,855Cost of products sold - 5,508 5,033 8,984 (5,233) 14,292Selling and administrative expense 141 1,223 737 1,495 - 3,596Research and development expense - 266 196 163 - 625Interest expense (income) - net - 222 21 (13) 2 232Other expense (income) - net - 27 2 (64) - (35)Equity in loss (earnings) of subsidiaries, net of tax (2,456) (793) (3,267) (666) 7,182 -Intercompany expense (income) - net 336 (452) 1,239 (1,123) - -
Income (loss) before income taxes 1,979 924 2,693 3,762 (7,213) 2,145Income tax expense (benefit) - 103 (73) 145 (11) 164
Net income (loss) 1,979 821 2,766 3,617 (7,202) 1,981Less net loss (income) for noncontrolling interests - - - (3) 1 (2)
Net income (loss) attributable to Eaton ordinary shareholders $ 1,979 $ 821 $ 2,766 $ 3,614 $ (7,201) $ 1,979
Other comprehensive income (loss) (964) 1 (947) (1,170) 2,116 (964)
Total comprehensive income (loss) attributable to Eaton ordinary shareholders $ 1,015 $ 822 $ 1,819 $ 2,444 $ (5,085) $ 1,015
Year ended December 31, 2014Net sales $ - $ 6,990 $ 6,885 $ 13,521 $ (4,844) $ 22,552Cost of products sold - 5,519 5,075 9,882 (4,830) 15,646Selling and administrative expense 171 1,246 743 1,650 - 3,810Litigation settlements - 644 - - - 644Research and development expense - 240 202 205 - 647Interest expense (income) - net - 225 25 (29) 6 227Other expense (income) - net - (17) (81) (85) - (183)Equity in loss (earnings) of subsidiaries, net of tax (2,191) (663) (2,654) (292) 5,800 -Intercompany expense (income) - net 227 (263) 855 (819) - -
Income (loss) before income taxes 1,793 59 2,720 3,009 (5,820) 1,761Income tax expense (benefit) - (100) 76 (11) (7) (42)
Net income (loss) 1,793 159 2,644 3,020 (5,813) 1,803Less net loss (income) for noncontrolling interests - - - (8) (2) (10)
Net income (loss) attributable to Eaton ordinary shareholders $ 1,793 $ 159 $ 2,644 $ 3,012 $ (5,815) $ 1,793
Other comprehensive income (loss) (1,339) (197) (1,368) (1,646) 3,211 (1,339)
Total comprehensive income (loss) attributable to Eaton ordinary shareholders $ 454 $ (38) $ 1,276 $ 1,366 $ (2,604) $ 454
Year ended December 31, 2013Net sales $ - $ 6,695 $ 6,421 $ 13,579 $ (4,649) $ 22,046Cost of products sold - 5,227 4,784 10,010 (4,652) 15,369Selling and administrative expense 32 1,400 749 1,705 - 3,886Research and development expense - 255 200 189 - 644Interest expense (income) - net - 271 28 (22) (6) 271Other expense (income) - net - 8 4 (20) - (8)Equity in loss (earnings) of subsidiaries, net of tax (2,147) (657) (2,005) (277) 5,086 -Intercompany expense (income) - net 254 (155) (433) 334 - -
Income (loss) before income taxes 1,861 346 3,094 1,660 (5,077) 1,884Income tax expense (benefit) - (108) (90) 207 2 11
Net income (loss) 1,861 454 3,184 1,453 (5,079) 1,873Less net loss (income) for noncontrolling interests - - - (9) (3) (12)
Net income (loss) attributable to Eaton ordinary shareholders $ 1,861 $ 454 $ 3,184 $ 1,444 $ (5,082) $ 1,861
Other comprehensive income (loss) 404 221 475 262 (958) 404
Total comprehensive income (loss) attributable to Eaton ordinary shareholders $ 2,265 $ 675 $ 3,659 $ 1,706 $ (6,040) $ 2,265
Notes to Consolidated Financial Statements
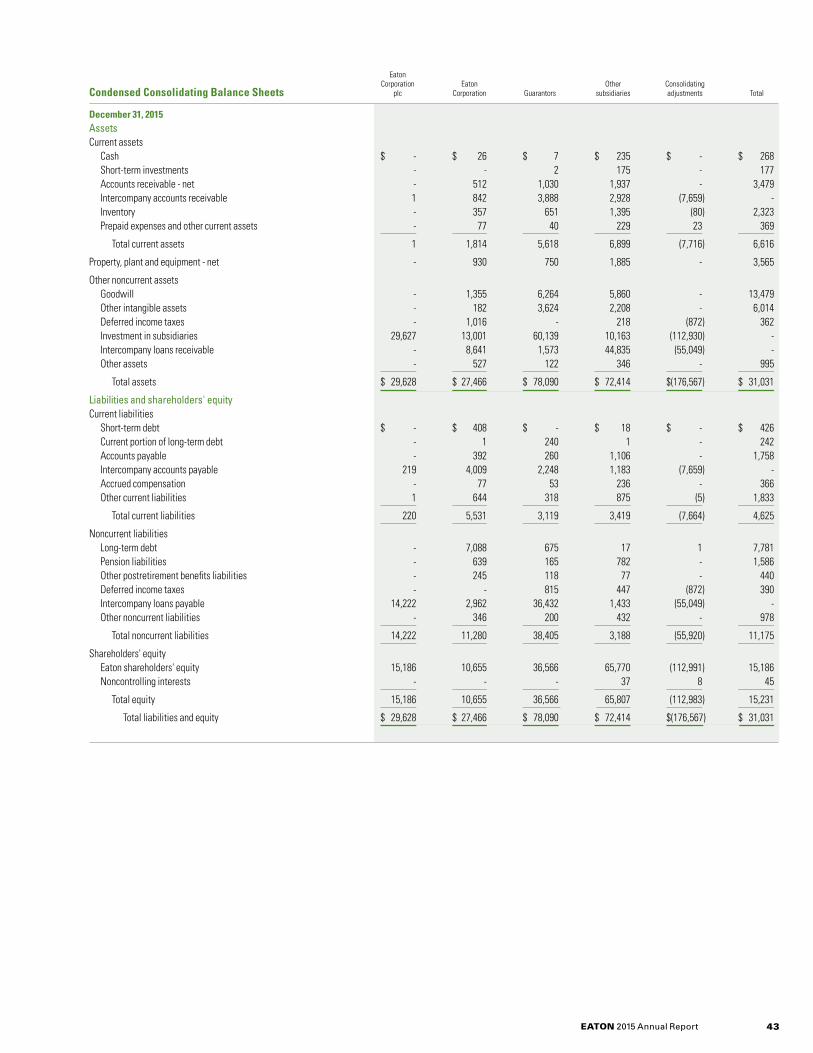
EATON 2015 Annual Report 43
Eaton Corporation Eaton Other Consolidating Condensed Consolidating Balance Sheets plc Corporation Guarantors subsidiaries adjustments Total
December 31, 2015AssetsCurrent assets Cash $ - $ 26 $ 7 $ 235 $ - $ 268 Short-term investments - - 2 175 - 177 Accounts receivable - net - 512 1,030 1,937 - 3,479 Intercompany accounts receivable 1 842 3,888 2,928 (7,659) - Inventory - 357 651 1,395 (80) 2,323 Prepaid expenses and other current assets - 77 40 229 23 369
Total current assets 1 1,814 5,618 6,899 (7,716) 6,616
Property, plant and equipment - net - 930 750 1,885 - 3,565
Other noncurrent assets Goodwill - 1,355 6,264 5,860 - 13,479 Other intangible assets - 182 3,624 2,208 - 6,014 Deferred income taxes - 1,016 - 218 (872) 362 Investment in subsidiaries 29,627 13,001 60,139 10,163 (112,930) - Intercompany loans receivable - 8,641 1,573 44,835 (55,049) - Other assets - 527 122 346 - 995
Total assets $ 29,628 $ 27,466 $ 78,090 $ 72,414 $ (176,567) $ 31,031
Liabilities and shareholders' equityCurrent liabilities Short-term debt $ - $ 408 $ - $ 18 $ - $ 426 Current portion of long-term debt - 1 240 1 - 242 Accounts payable - 392 260 1,106 - 1,758 Intercompany accounts payable 219 4,009 2,248 1,183 (7,659) - Accrued compensation - 77 53 236 - 366 Other current liabilities 1 644 318 875 (5) 1,833
Total current liabilities 220 5,531 3,119 3,419 (7,664) 4,625
Noncurrent liabilities Long-term debt - 7,088 675 17 1 7,781 Pension liabilities - 639 165 782 - 1,586 Other postretirement benefits liabilities - 245 118 77 - 440 Deferred income taxes - - 815 447 (872) 390 Intercompany loans payable 14,222 2,962 36,432 1,433 (55,049) - Other noncurrent liabilities - 346 200 432 - 978
Total noncurrent liabilities 14,222 11,280 38,405 3,188 (55,920) 11,175
Shareholders' equity Eaton shareholders' equity 15,186 10,655 36,566 65,770 (112,991) 15,186 Noncontrolling interests - - - 37 8 45
Total equity 15,186 10,655 36,566 65,807 (112,983) 15,231
Total liabilities and equity $ 29,628 $ 27,466 $ 78,090 $ 72,414 $ (176,567) $ 31,031
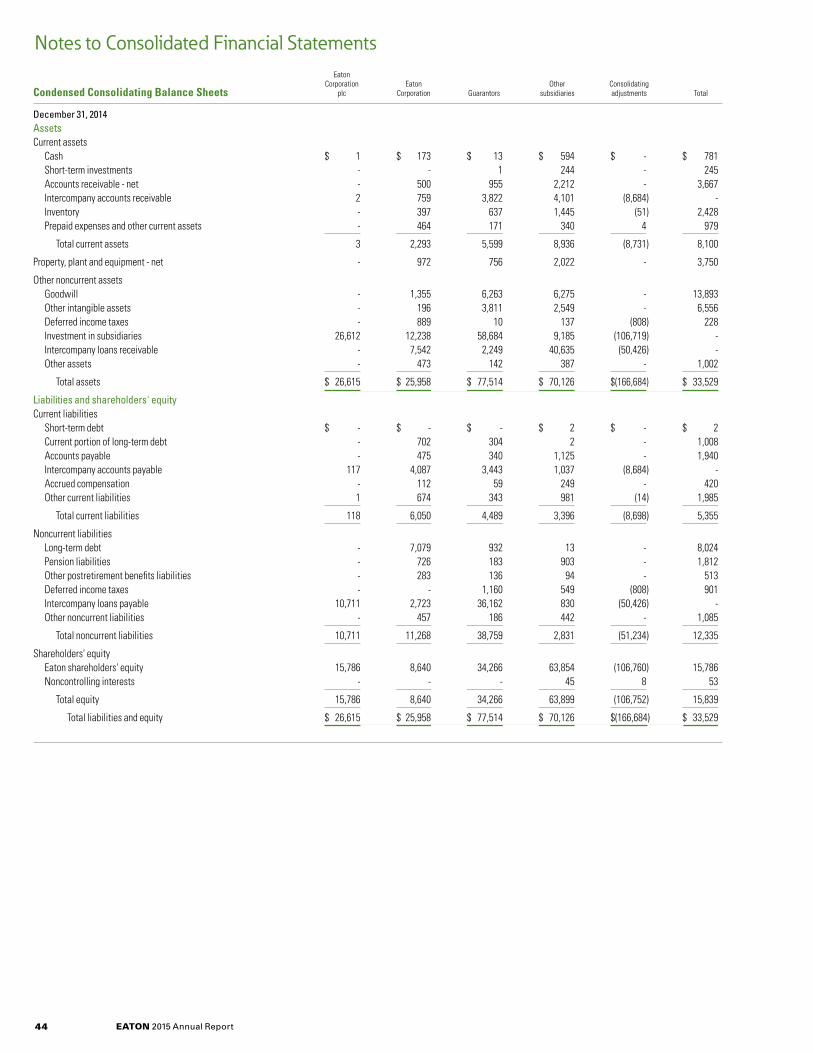
EATON 2015 Annual Report44
Notes to Consolidated Financial Statements Eaton Corporation Eaton Other Consolidating Condensed Consolidating Balance Sheets plc Corporation Guarantors subsidiaries adjustments Total
December 31, 2014AssetsCurrent assets Cash $ 1 $ 173 $ 13 $ 594 $ - $ 781 Short-term investments - - 1 244 - 245 Accounts receivable - net - 500 955 2,212 - 3,667 Intercompany accounts receivable 2 759 3,822 4,101 (8,684) - Inventory - 397 637 1,445 (51) 2,428 Prepaid expenses and other current assets - 464 171 340 4 979
Total current assets 3 2,293 5,599 8,936 (8,731) 8,100
Property, plant and equipment - net - 972 756 2,022 - 3,750
Other noncurrent assets Goodwill - 1,355 6,263 6,275 - 13,893 Other intangible assets - 196 3,811 2,549 - 6,556 Deferred income taxes - 889 10 137 (808) 228 Investment in subsidiaries 26,612 12,238 58,684 9,185 (106,719) - Intercompany loans receivable - 7,542 2,249 40,635 (50,426) - Other assets - 473 142 387 - 1,002
Total assets $ 26,615 $ 25,958 $ 77,514 $ 70,126 $ (166,684) $ 33,529
Liabilities and shareholders' equityCurrent liabilities Short-term debt $ - $ - $ - $ 2 $ - $ 2 Current portion of long-term debt - 702 304 2 - 1,008 Accounts payable - 475 340 1,125 - 1,940 Intercompany accounts payable 117 4,087 3,443 1,037 (8,684) - Accrued compensation - 112 59 249 - 420 Other current liabilities 1 674 343 981 (14) 1,985
Total current liabilities 118 6,050 4,489 3,396 (8,698) 5,355
Noncurrent liabilities Long-term debt - 7,079 932 13 - 8,024 Pension liabilities - 726 183 903 - 1,812 Other postretirement benefits liabilities - 283 136 94 - 513 Deferred income taxes - - 1,160 549 (808) 901 Intercompany loans payable 10,711 2,723 36,162 830 (50,426) - Other noncurrent liabilities - 457 186 442 - 1,085
Total noncurrent liabilities 10,711 11,268 38,759 2,831 (51,234) 12,335
Shareholders' equity Eaton shareholders' equity 15,786 8,640 34,266 63,854 (106,760) 15,786 Noncontrolling interests - - - 45 8 53
Total equity 15,786 8,640 34,266 63,899 (106,752) 15,839
Total liabilities and equity $ 26,615 $ 25,958 $ 77,514 $ 70,126 $ (166,684) $ 33,529

EATON 2015 Annual Report 45
Eaton Corporation Eaton Other Consolidating Condensed Consolidating Statements of Cash Flows plc Corporation Guarantors subsidiaries adjustments Total
December 31, 2015Net cash provided by (used in) operating activities $ (137) $ (46) $ (283) $ 2,841 $ (4) $ 2,371
Investing activitiesCapital expenditures for property, plant and equipment - (94) (146) (266) - (506)Cash received from (paid for) acquisitions of businesses, net of cash acquired - - (36) (36) - (72)Sales (purchases) of short-term investment - net - - (2) 39 - 37Investments in affiliates (1,482) - (1,176) (1,482) 4,140 -Loans to affiliates - (1,235) (39) (10,608) 11,882 -Repayments of loans from affiliates - 342 359 7,148 (7,849) -Proceeds from the sales of businesses - - - 1 - 1Other - net - (50) 47 (32) - (35)
Net cash provided by (used in) investing activities (1,482) (1,037) (993) (5,236) 8,173 (575)
Financing activitiesProceeds from borrowings - 408 - 17 - 425Payments on borrowings - (724) (301) (2) - (1,027)Proceeds from borrowings from affiliates 3,322 6,885 997 678 (11,882) -Payments on borrowings from affiliates (48) (6,122) (1,282) (397) 7,849 -Capital contribution from affiliates - 1,176 1,482 1,482 (4,140) -Other intercompany financing activities - (688) 374 314 - -Cash dividends paid (1,026) - - - - (1,026)Cash dividends paid to affiliates - - - (4) 4 -Exercise of employee stock options 52 - - - - 52Repurchase of shares (682) - - - - (682)Excess tax benefit from equity-based compensation - 1 - - - 1Other - net - - - (10) - (10)
Net cash provided by (used in) financing activities 1,618 936 1,270 2,078 (8,169) (2,267)
Effect of currency on cash - - - (42) - (42)
Total increase (decrease) in cash (1) (147) (6) (359) - (513)Cash at the beginning of the period 1 173 13 594 - 781
Cash at the end of the period $ - $ 26 $ 7 $ 235 $ - $ 268

EATON 2015 Annual Report46
Notes to Consolidated Financial Statements Eaton Corporation Eaton Other Consolidating Condensed Consolidating Statements of Cash Flows plc Corporation Guarantors subsidiaries adjustments Total
December 31, 2014Net cash provided by (used in) operating activities $ (93) $ (411) $ (218) $ 2,568 $ 32 $ 1,878
Investing activitiesCapital expenditures for property, plant and equipment - (127) (168) (337) - (632)Cash received from (paid for) acquisitions of businesses, net of cash acquired - - - 2 - 2Sales (purchases) of short-term investments - net - - 133 389 - 522Investments in affiliates (753) - - (753) 1,506 -Loans to affiliates - (354) (162) (10,546) 11,062 -Repayments of loans from affiliates - 978 212 8,451 (9,641) -Proceeds from the sales of businesses - 93 175 14 - 282Other - net - (47) 44 (28) - (31)
Net cash provided by (used in) investing activities (753) 543 234 (2,808) 2,927 143
Financing activitiesPayments on borrowings - (553) (1) (28) - (582)Proceeds from borrowings from affiliates 2,628 7,599 808 27 (11,062) -Payments on borrowings from affiliates (476) (6,907) (1,875) (383) 9,641 -Capital contribution from affiliates - - 753 753 (1,506) -Other intercompany financing activities 217 (169) 302 (350) - -Cash dividends paid (929) - - - - (929)Cash dividends received from affiliates - - - 32 (32) -Exercise of employee stock options 54 - - - - 54Repurchase of shares (650) - - - - (650)Excess tax benefit from equity-based compensation - 20 - - - 20Other - net - - - (43) - (43)
Net cash provided by (used in) financing activities 844 (10) (13) 8 (2,959) (2,130)
Effect of currency on cash - - - (25) - (25)
Total increase (decrease) in cash (2) 122 3 (257) - (134)Cash at the beginning of the period 3 51 10 851 - 915
Cash at the end of the period $ 1 $ 173 $ 13 $ 594 $ - $ 781
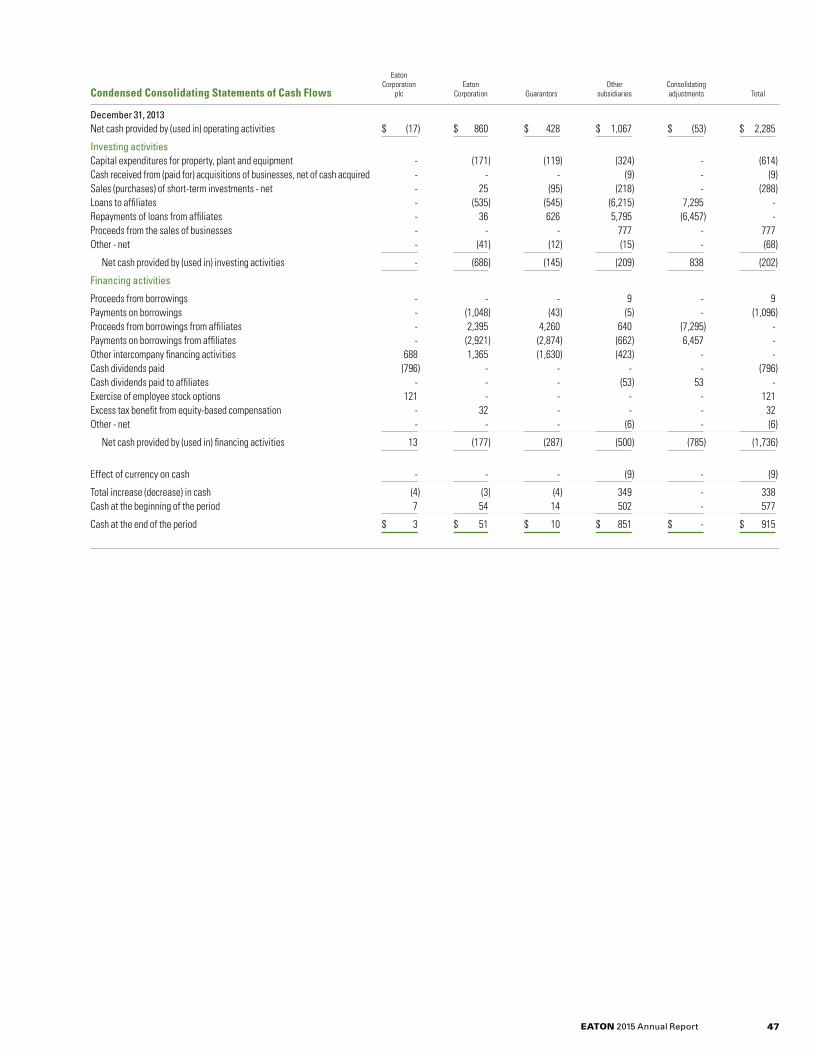
EATON 2015 Annual Report 47
Eaton Corporation Eaton Other Consolidating Condensed Consolidating Statements of Cash Flows plc Corporation Guarantors subsidiaries adjustments Total
December 31, 2013Net cash provided by (used in) operating activities $ (17) $ 860 $ 428 $ 1,067 $ (53) $ 2,285
Investing activitiesCapital expenditures for property, plant and equipment - (171) (119) (324) - (614)Cash received from (paid for) acquisitions of businesses, net of cash acquired - - - (9) - (9)Sales (purchases) of short-term investments - net - 25 (95) (218) - (288)Loans to affiliates - (535) (545) (6,215) 7,295 -Repayments of loans from affiliates - 36 626 5,795 (6,457) -Proceeds from the sales of businesses - - - 777 - 777Other - net - (41) (12) (15) - (68)
Net cash provided by (used in) investing activities - (686) (145) (209) 838 (202)
Financing activities
Proceeds from borrowings - - - 9 - 9Payments on borrowings - (1,048) (43) (5) - (1,096)Proceeds from borrowings from affiliates - 2,395 4,260 640 (7,295) -Payments on borrowings from affiliates - (2,921) (2,874) (662) 6,457 -Other intercompany financing activities 688 1,365 (1,630) (423) - -Cash dividends paid (796) - - - - (796)Cash dividends paid to affiliates - - - (53) 53 -Exercise of employee stock options 121 - - - - 121Excess tax benefit from equity-based compensation - 32 - - - 32Other - net - - - (6) - (6)
Net cash provided by (used in) financing activities 13 (177) (287) (500) (785) (1,736)
Effect of currency on cash - - - (9) - (9)
Total increase (decrease) in cash (4) (3) (4) 349 - 338Cash at the beginning of the period 7 54 14 502 - 577
Cash at the end of the period $ 3 $ 51 $ 10 $ 851 $ - $ 915
EATON 2015 Annual Report48
Amounts are in millions of dollars or shares unless indicated otherwise (per share data assume dilution).
Company OverviewEaton Corporation plc (Eaton or the Company) is a power management company with 2015 net sales of $20.9 billion. The Company provides energy-efficient solutions that help its customers effectively manage electrical, hydraulic and mechanical power more efficiently, safely and sustainably. Eaton has approximately 97,000 employees in over 60 countries and sells products to customers in more than 175 countries.
Summary of Results of OperationsDuring 2015, the Company's results of operations were impacted by decline in several of the Company's end markets. Further, the results of operations were nega-tively impacted by fluctuations in currency exchange rates. Despite the declining market conditions and unfavorable impact from currency translation, the Company generated solid operating margins and net income per share - diluted. During 2015, Eaton took actions to reduce its cost structure and gain efficiencies in all business segments and at corporate in order to respond to declining market conditions and announced a multi-year restructuring initiative. The restructuring charges related to this initiative were $129 in 2015 and were primarily comprised of severance costs. We anticipate additional restructuring charges of $140 in 2016 and $130 in 2017. The projected annualized savings from these restructuring actions are expected to be $400, fully realized in 2018.
During 2014, the Company's results of operations were impacted by modest growth in the Company's end markets, particularly in North America. This was partially off-set by the impact of settlement of two litigation matters with ZF Meritor LLC and Meritor Transmission Corporation (collectively, Meritor) and Triumph Actuation Systems, LLC and other claimants (collectively, Triumph) for $500 and $147.5, respec-tively, and the sale of the Aerospace Power Distribution Management Solutions and Integrated Cockpit Solutions businesses to Safran for $270, which resulted in a pre-tax gain of $154. Also, during the second half of 2014 the Company's results of opera-tions were negatively impacted by shifts in currency exchange rates. Despite the modest growth and negative currency exchange rates, the Company generated net income per share - diluted in 2014 that was broadly in line with the Company's guid-ance at the start of the year after excluding the litigation settlements and the gain on the sale of the Aerospace businesses.
Additional information related to business acquisitions and sales, restructuring activities and the litigation settlements is presented in Note 2, Note 3, Note 4 and Note 8, respectively, of the Notes to the Consolidated Financial Statements.
A summary of Eaton’s Net sales, Net income attributable to Eaton ordinary shareholders, and Net income per share attributable to Eaton ordinary shareholders - diluted follows:
2015 2014 2013
Net sales $ 20,855 $ 22,552 $ 22,046Net income attributable to Eaton ordinary shareholders 1,979 1,793 1,861Net income per share attributable to Eaton ordinary shareholders - diluted $ 4.23 $ 3.76 $ 3.90
Results of Operations
Non-GAAP Financial MeasuresThe following discussion of Consolidated Financial Results and Business Segment Results of Operations includes certain non-GAAP financial measures. These financial measures include operating earnings, operating earnings per ordinary share, and oper-ating profit before acquisition integration charges for each business segment as well as corporate, each of which differs from the most directly comparable measure calculated in accordance with generally accepted accounting principles (GAAP). A reconciliation of operating earnings and operating earnings per ordinary share to the most directly com-parable GAAP measure is included in the table below. Operating profit before acquisi-tion integration charges is reconciled in the discussion of the operating results of each business segment, and excludes acquisition integration expense related primarily to integration of Cooper Industries plc (Cooper). Management believes that these financial measures are useful to investors because they exclude transactions of an unusual nature, allowing investors to more easily compare Eaton’s financial performance period to period. Management uses this information in monitoring and evaluating the on-going performance of Eaton and each business segment. For additional information on acqui-sition integration charges, see Note 3 to the Consolidated Financial Statements.
Consolidated Financial Results Change Change from from 2015 2014 2014 2013 2013
Net sales $ 20,855 (8)% $ 22,552 2% $ 22,046Gross profit 6,563 (5)% 6,906 3% 6,677 Percent of net sales 31.5% 30.6% 30.3%Income before income taxes 2,145 22% 1,761 (7)% 1,884Net income 1,981 10% 1,803 (4)% 1,873 Less net income for noncontrolling interests (2) (10) (12)
Net income attributable to Eaton ordinary shareholders 1,979 10% 1,793 (4)% 1,861 Excluding acquisition integration charges and transaction costs (after-tax) 31 102 110
Operating earnings $ 2,010 6% $ 1,895 (4)% $ 1,971
Net income per share attributable to Eaton ordinary shareholders - diluted $ 4.23 13% $ 3.76 (4)% $ 3.90Excluding per share impact of acquisition integration charges and transaction costs (after-tax) 0.07 0.21 0.23
Operating earnings per ordinary share $ 4.30 8% $ 3.97 (4)% $ 4.13
Net Sales Net sales in 2015 decreased by 8% compared to 2014 due to a decrease of 6% from the impact of currency translation and a decrease of 2% in organic sales. The decrease in organic sales was primarily due to weakening demand in several of the Company's end markets.
Net sales in 2014 increased by 2% compared to 2013 due to an increase in organic sales of 4%, partially offset by a decrease of 1% from the impact of currency transla-tion and a decrease of 1% from the divestiture of Eaton's Aerospace Power Distribu-tion Management Solutions and Integrated Cockpit Solutions businesses. The increase in organic sales in 2014 is primarily due to growth in the Company's end markets, particularly in North America.
Gross ProfitGross profit margin increased from 30.6% in 2014 to 31.5% in 2015. The increase in gross profit margin in 2015 was primarily due to cost savings from restructuring actions taken in the second half of 2015 and other cost control measures, partially offset by restructuring charges incurred in 2015. Gross profit increased from 30.3% in 2013 to 30.6% in 2014. The increase in gross profit margin in 2014 was primarily due to higher sales volumes, offset by certain restructuring activities Eaton undertook in 2014 in an effort to gain efficiencies in the Vehicle, Hydraulics and Aerospace business segments.
Income Taxes During 2015, an income tax expense of $164 was recognized (an effective tax expense rate of 7.7%) compared to income tax benefit of $42 in 2014 (an effective tax benefit rate of 2.4%). Excluding the net tax benefit of 7.6% for the Meritor and Triumph litigation settlements and related legal costs and the gain on the sale of the Aerospace businesses, all of which occurred in the second quarter of 2014, the income tax rate was 5.2% for 2014. The 2015 income tax rate increased from 2014 primarily due to greater levels of income earned in higher tax jurisdictions and net increases in worldwide tax liabilities.
During 2014, an income tax benefit of $42 was recognized (an effective tax benefit rate of 2.4%) compared to income tax expense of $11 for 2013 (an effective tax expense rate of 0.6%). The lower tax rate in 2014 was primarily attributable to the net tax benefit of litigation settlements and related legal costs and gain on sale of business, all of which occurred in the second quarter of 2014. Excluding the previ-ously mentioned litigation settlements and gain on the sale of businesses, the 2014 income tax rate increased from 2013 due to greater levels of income earned in higher tax jurisdictions and net increases in worldwide tax liabilities, partially offset by additional foreign tax credit recognition in the United States and recognition of deferred tax assets in foreign jurisdictions.
Management’s Discussion and Analysis of Financial Condition and Results of Operations
EATON 2015 Annual Report 49
Operating Earnings Operating earnings, a non-GAAP measure discussed above in Non-GAAP Financial Measures, of $2,010 in 2015 increased 6% compared to Operating earnings of $1,895 in 2014. The increase in Operating earnings in 2015 was primarily due to lower income in the second quarter of 2014 as a result of settlement of the Meritor and Triumph liti-gation matters for $500 and $147.5, respectively, partially offset by the impact of the sale of the Aerospace Power Distribution Management Solutions and Integrated Cockpit Solutions businesses. Excluding litigation settlements and gain on sale, oper-ating earnings declined in 2015 due to lower sales volume, the negative impact of cur-rency translation, a higher tax rate, and $129 of restructuring charges incurred in 2015, offset by savings resulting from the 2015 restructuring actions and other cost control measures. Operating earnings of $1,895 in 2014 decreased 4% compared to 2013 Operating earnings of $1,971. The decrease was primarily due to the litigation settlements, partially offset by the gain on the sale of the Aerospace businesses, higher sales volumes as noted above and a lower effective income tax rate.
Operating earnings per ordinary share increased to $4.30 in 2015 compared to $3.97 in 2014. The increase in Operating earnings per ordinary share in 2015 is due to higher Operating earnings and the impact of the Company's share repurchases in 2015. Oper-ating earnings per ordinary share of $3.97 in 2014 decreased 4% from $4.13 in 2013. Operating earnings per ordinary share in 2014 was reduced by $0.70 per share from the litigation settlements partially offset by the gain from the Aerospace divestitures.
Business Segment Results of OperationsThe following is a discussion of Net sales, operating profit and operating profit mar-gin by business segment, which includes a discussion of operating profit and operat-ing profit margin before acquisition integration charges. For additional information related to acquired businesses and integration charges, see Note 2 and Note 3, respectively, to the Consolidated Financial Statements.
Electrical Products Change Change from from 2015 2014 2014 2013 2013
Net sales $ 6,976 (4)% $ 7,254 3% $ 7,026
Operating profit 1,156 (2)% 1,184 9% 1,090Operating margin 16.6% 16.3% 15.5%
Acquisition integration charges $ 25 $ 66 $ 44
Before acquisition integration charges Operating profit $ 1,181 (6)% $ 1,250 10% $ 1,134 Operating margin 16.9% 17.2% 16.1%
Net sales decreased 4% in 2015 compared to 2014 due to a decrease of 5% from the impact of currency translation, partially offset by an increase of 1% in organic sales. Organic sales in 2015 were positively impacted by North American markets. Net sales increased 3% in 2014 compared to 2013 due to an increase of 4% in organic sales, par-tially offset by a decrease of 1% from the impact of currency translation. Organic sales in 2014 were positively impacted by strength in North American markets.
The operating margin before acquisition integration charges decreased from 17.2% in 2014 to 16.9% in 2015. The decrease in operating margin in 2015 was primarily due to lower sales volumes, unfavorable product mix and $12 of restructuring charges, partially offset by $3 of savings from the restructuring actions and other cost control measures. The operating margin before acquisition integration charges increased from 16.1% in 2013 to 17.2% in 2014. The increase in operating margin in 2014 was due to higher sales volumes, as noted above, and incremental synergies related to the acquisition of Cooper.
Electrical Systems and Services Change Change from from 2015 2014 2014 2013 2013
Net sales $ 5,931 (8)% $6,457 -% $ 6,430
Operating profit 776 (8)% 843 (5)% 889Operating margin 13.1% 13.1% 13.8%
Acquisition integration charges $ 15 $ 51 $ 37
Before acquisition integration charges Operating profit $ 791 (12)% $ 894 (3)% $ 926 Operating margin 13.3% 13.8% 14.4%
Net sales decreased 8% in 2015 compared to 2014 due to decreases of 4% in organic sales and 4% from negative currency translation. The organic sales decline in 2015 was primarily due to weakness in global oil and gas and other industrial markets. Net sales in 2014 were flat compared to 2013 due to an increase in organic sales of 2%, offset by a decrease of 2% from the impact of currency translation. The increase in organic sales in 2014 was primarily due to strength in the North American markets.
The operating margin before acquisition integration charges decreased from 13.8% in 2014 to 13.3% in 2015. The decrease in operating margin was primarily due to unfavorable product mix and $29 of restructuring charges, partially offset by $14 of savings from the restructuring actions and savings resulting from cost control mea-sures. The operating margin before acquisition integration charges decreased from 14.4% in 2013 to 13.8% in 2014. The decrease in operating margin in 2014 was pri-marily due to higher logistics costs, unfavorable mix, and pricing pressures.
Hydraulics Change Change from from 2015 2014 2014 2013 2013
Net sales $ 2,459 (17)% $ 2,975 -% $2,981
Operating profit 246 (33)% 367 3% 355Operating margin 10.0% 12.3% 11.9%
Acquisition integration charges $ 2 $ 12 $ 36
Before acquisition integration charges Operating profit $ 248 (35)% $ 379 (3)% $ 391 Operating margin 10.1% 12.7% 13.1%
Net sales in 2015 decreased 17% compared to 2014 due to a decrease in organic sales of 10% and a decrease of 7% from the impact of currency translation. The decrease in organic sales is due to broad weakness in global hydraulics markets. Net sales in 2014 remained flat compared to 2013 due to an increase in organic sales of 2% offset by a decrease of 2% from the impact of currency translation. The increase in organic sales in 2014 was primarily driven by demand for industrial products in North America and growth in distributor sales, partially offset by weakness in the global agricultural equipment market and the China construction equipment market.
The operating margin before acquisition integration charges decreased from 12.7% in 2014 to 10.1% in 2015. The decrease in operating margin was primarily due to lower sales volumes and $31 of restructuring charges, partially offset by $33 of savings from the 2015 restructuring actions, current year cost control measures and efficiencies gen-erated from certain restructuring activities taken in 2014. The operating margin before acquisition integration charges decreased from 13.1% in 2013 to 12.7% in 2014. The decrease in operating margin in 2014 was primarily due to costs related to new initia-tives and certain restructuring activities Eaton undertook in 2014 in an effort to gain efficiencies in the segment.
Aerospace Change Change from from 2015 2014 2014 2013 2013
Net sales $ 1,807 (3)% $ 1,860 5% $ 1,774
Operating profit 310 14% 273 8% 252Operating margin 17.2% 14.7% 14.2%
Net sales in 2015 decreased 3% compared to 2014 due to a decrease of 2% from the impact of currency translation and a decrease of 2% from the divestiture of Eaton's Aerospace Power Distribution Management Solutions and Integrated Cockpit Solu-tions business in the second quarter of 2014, offset by a 1% increase in organic sales. The increase in organic sales during 2015 was related to higher aftermarket sales and strength in commercial OEM markets, offset by a weakness in military OEM markets. Net sales in 2014 increased 5% compared to 2013 due to an increase in organic sales of 8% and an increase of 1% from the impact of currency translation, partially offset by a decrease of 4% due to the divestitures of Eaton's Aerospace Power Distribution Management Solutions and Integrated Cockpit Solutions busi-nesses. The increase in organic sales in 2014 was primarily due to strength in com-mercial OEM markets as well as growth in the commercial and military aftermarkets.
EATON 2015 Annual Report50
The operating margin increased from 14.7% in 2014 to 17.2% in 2015. The increase is primarily due to favorable product mix and $2 of savings resulting from restructuring and other cost control measures, partially offset by $5 of restructuring charges. The operating margin increased from 14.2% in 2013 to 14.7% in 2014. The increase in operating margin in 2014 was due to higher sales volumes, as noted above, partially offset by certain restructuring activities Eaton undertook in 2014 in an effort to gain efficiencies in the segment.
Vehicle Change Change from from 2015 2014 2014 2013 2013
Net sales $ 3,682 (8)% $ 4,006 4% $ 3,835
Operating profit 645 -% 645 9% 592Operating margin 17.5% 16.1% 15.4%
Net sales decreased 8% in 2015 compared to 2014 due to a decrease of 8% from the impact of currency translation. Organic sales remained flat. Organic sales increased in 2015 in North American and Asia Pacific markets, but were offset by weakness in South American markets. Net sales increased 4% in 2014 compared to 2013 due to an increase in organic sales of 6%, partially offset by a decrease of 2% from the impact of currency translation. The increase in organic sales in 2014 was primarily due to strong demand in North American and select Asia Pacific markets, partially offset by weakness in South American markets.
The operating margin increased from 16.1% in 2014 to 17.5% in 2015. The increase in operating margin in 2015 was primarily due to favorable mix, $8 of savings resulting from restructuring actions and other cost control measures, partially offset by lower sales volume and $34 of restructuring charges. The operating margin increased from 15.4% in 2013 to 16.1% in 2014. The increase in operating margin in 2014 was primarily due to higher sales volumes, as noted above, partially offset by certain restructuring activities Eaton undertook in 2014 to generate ongoing efficiencies in the segment.
Corporate Expense Change Change from from 2015 2014 2014 2013 2013
Litigation settlements $ - NM $ 644 NM $ -Amortization of intangible assets 406 (6)% 431 (1)% 437Interest expense - net 232 2% 227 (16)% 271Pension and other postretirement benefits expense 130 (6)% 138 (25)% 183Inventory step-up adjustment - NM - NM 34Gain on divestiture of Aerospace businesses - NM (154) NM -Other corporate expense - net 220 (17)% 265 (28)% 369
Total corporate expense $ 988 (36)% $ 1,551 20% $ 1,294
Total Corporate expense decreased 36% in 2015 to $988 from $1,551 in 2014 primarily due to litigation settlements of $644 during the second quarter of 2014, partially off-set by a gain of $154 on the divestiture of Eaton's Aerospace Power Distribution Man-agement Solutions and Integrated Cockpit Solutions businesses during the second quarter of 2014. Excluding the litigation settlement and gain on the divestiture of the business, total corporate expenses-net decreased 7% in 2015 due to savings from cost control measures. Total corporate expense increased 20% in 2014 to $1,551 from $1,294 in 2013 primarily due to litigation settlements during the second quarter of 2014, partially offset by a gain on the divestiture during the second quarter of 2014 and lower costs associated with the acquisition of Cooper.
Liquidity, Capital Resources and Changes in Financial Condition
Financial Condition and LiquidityEaton’s objective is to finance its business through operating cash flow and an appro-priate mix of equity and long-term and short-term debt. By diversifying its debt matu-rity structure, Eaton reduces liquidity risk. The Company maintains access to the commercial paper markets through a $2.0 billion commercial paper program. To sup-port the commercial paper program, in October 2014 the Company refinanced a $500, five-year revolving credit facility and a $750, three-year revolving credit facility with a $500, four-year revolving credit facility that will expire October 2018 and a $750, five-year revolving credit facility that will expire October 2019, respectively. The Company also maintains a $750, five-year revolving credit facility that will expire June 2017. These refinancings maintain long-term revolving credit facilities at a total of $2,000. The revolving credit facilities are used to support commercial paper bor-rowings and are fully and unconditionally guaranteed by Eaton and certain of its
direct and indirect subsidiaries on an unsubordinated, unsecured basis. There were no borrowings outstanding under Eaton's revolving credit facilities at December 31, 2015 or 2014. The Company had available lines of credit of $850 from various banks for the issuance of letters of credit, of which there was $351 outstanding at Decem-ber 31, 2015. Over the course of a year, cash, short-term investments and short-term debt may fluctuate in order to manage global liquidity. Eaton believes it has the oper-ating flexibility, cash flow, cash and short-term investment balances, and access to capital markets in excess of the liquidity necessary to meet future operating needs of the business as well as scheduled payments of long-term debt.
For additional information on financing transactions and debt, see Note 6 to the Consolidated Financial Statements.
Eaton’s credit facilities and indentures governing certain long-term debt contain various covenants, the violation of which would limit or preclude the use of the credit facilities for future borrowings, or might accelerate the maturity of the related out-standing borrowings covered by the indentures. At Eaton’s present credit rating level, the most restrictive financial covenant provides that the ratio of secured debt (or lease payments due under a sale and leaseback transaction) to adjusted consoli-dated net worth (or consolidated net tangible assets, in each case as defined in the relevant credit agreement or indenture) may not exceed 10%. Eaton's actual ratios are substantially below the required threshold. In addition, Eaton is in compliance with each of its debt covenants for all periods presented.
Sources and Uses of CashOperating Cash FlowNet cash provided by operating activities was $2,371 in 2015, an increase of $493 compared to $1,878 in 2014. The increase was primarily due to payments totaling $654 for the Meritor, Triumph and related litigation in the third quarter of 2014.
Net cash provided by operating activities was $1,878 in 2014, a decrease of $407 compared to $2,285 in 2013. The decrease was primarily due to settlement of the Meritor, Triumph and related litigation in the third quarter of 2014.
For additional information on litigation settlements, see Note 8 to the Consolidated Financial Statements.
Investing Cash FlowNet cash used in investing activities was $575 in 2015, a decrease of $718 compared to net cash provided by investing activities of $143 in 2014. The decrease in 2015 was principally due to fewer net proceeds from short-term investments of $37 in 2015 compared to $522 in 2014, and proceeds from the sale of business of $282 in 2014. Capital expenditures were $506 in 2015 compared to $632 in 2014. Eaton expects approximately $525 in capital expenditures in 2016.
Net cash provided by investing activities was $143 in 2014, an increase of $345 as compared to a use of cash of $202 in 2013. The increase in 2014 was principally due to sales of short-term investments of $522 in 2014 compared to purchases of short- term investments of $288 in 2013. This source of cash in 2014 was partially offset by a decrease in proceeds from the sales of business, from $777 in 2013 to $282 in 2014. Capital expenditures were $632 in 2014 compared to $614 in 2013.
Financing Cash FlowNet cash used in financing activities was $2,267 in 2015, an increase in the use of cash of $137 compared to $2,130 in 2014. The increase in the use of cash was primarily due to higher payment on borrowings of $1,027 in 2015 compared to $582 in 2014 and higher cash dividends paid of $1,026 in 2015 compared to $929 in 2014, offset by proceeds from borrowings of $425 in 2015.
Net cash used in financing activities was $2,130 in 2014, an increase in use of cash of $394 compared to $1,736 in 2013. The increase in the use of cash was primarily due to $650 in share repurchases and an increase in cash dividends paid. Partially offsetting these uses of cash was a decrease in payments on borrowings, from $1,096 in 2013 to $582 in 2014. On February 1, 2013, Eaton repaid the $669 outstanding balance on a $1,669 borrowing on the bridge facility related to financing the acquisition of Cooper Industries plc.
Credit RatingsEaton's debt has been assigned the following credit ratings:
Credit Rating Agency (long- /short-term rating) Rating Outlook
Standard & Poor's A-/A-2 Stable outlookMoody's Baa1/P-2 Stable outlookFitch BBB+/F2 Stable outlook
Management’s Discussion and Analysis of Financial Condition and Results of Operations
EATON 2015 Annual Report 51
Additionally, goodwill is evaluated for impairment whenever an event occurs or cir-cumstances change that would indicate that it is more likely than not that the fair value of an operating segment is less than its carrying amount. Events or circum-stances that may result in an impairment review include changes in macroeconomic conditions, industry and market considerations, cost factors, overall financial perfor-mance, other relevant entity-specific events, specific events affecting the reporting unit or sustained decrease in share price.
Goodwill impairment testing for 2015 and 2014 was performed using a qualitative analysis, which is performed by assessing certain trends and factors that require significant judgment, including projected market outlook and growth rates, fore-casted and actual sales and operating profit margins, discount rates, industry data, and other relevant qualitative factors. These trends and factors are compared to, and based on, the assumptions used in the most recent quantitative assessment. The results of these qualitative analyses did not indicate a need to perform a quanti-tative analysis.
Goodwill impairment testing for 2013 was performed using a quantitative analysis under which the fair value for each reporting unit was estimated using a discounted cash flow model, which considered forecasted cash flows discounted at an esti-mated weighted-average cost of capital. The forecasted cash flows were based on the Company's long-term operating plan and a terminal value was used to estimate the operating segment's cash flows beyond the period covered by the operating plan. The weighted-average cost of capital is an estimate of the overall after-tax rate of return required by equity and debt market holders of a business enterprise. These analyses require the exercise of significant judgments, including judgments about appropriate discount rates, perpetual growth rates and the timing of expected future cash flows of the respective reporting unit. Sensitivity analyses were per-formed in order to assess the reasonableness of the assumptions and the resulting estimated fair values.
Based on quantitative analyses performed in 2015 and 2014 and quantitative analy-sis performed in 2013, the fair values of Eaton's reporting units continue to substan-tially exceed the respective carrying amounts.
Indefinite Life Intangible AssetsIndefinite life intangible assets consist of trademarks. They are evaluated annually for impairment as of July 1 using either a quantitative or qualitative analysis to determine whether their fair values exceed their respective carrying amounts. Indef-inite life intangible asset impairment testing for 2015 and 2014 was performed using a quantitative analysis. Determining the fair value of these assets requires signifi-cant judgment and the Company uses a royalty relief methodology similar to that employed when the associated assets were acquired, but using updated estimates of future sales, cash flows and profitability.
Additionally, indefinite life intangible assets are evaluated for impairment whenever an event occurs or circumstances change that would indicate that it is more likely than not that the asset is impaired. Events or circumstances that may result in an impairment review include changes in industry and market considerations, cost factors, financial performance, and other relevant entity-specific events that could affect inputs used to determine the respective fair values of the indefinite-lived intangible assets.
For 2015 and 2014, the fair value of indefinite lived intangible assets substantially exceeded the respective carrying value.
Other Long-Lived AssetsOther long-lived assets are reviewed for impairment whenever events or changes in circumstances indicate the carrying amount may not be recoverable. Events or cir-cumstances that may result in an impairment review include operations reporting losses, a significant adverse change in the use of an asset, the planned disposal or sale of the asset, a significant adverse change in the business climate or legal factors related to the asset, or a significant decrease in the estimated market value of an asset. Upon indications of impairment, assets and liabilities are grouped at the low-est level for which identifiable cash flows are largely independent of the cash flows of other assets and liabilities. The asset group would be considered impaired when the estimated future net undiscounted cash flows generated by the asset group are less than its carrying value. In instances where the carrying amount of the asset group exceeded the undiscounted cash flows, the fair value of the asset group would be determined and an impairment loss would be recognized based on the amount by which the carrying value of the asset group exceeds its fair value. Determining asset groups and underlying cash flows requires the use of significant judgment.
For additional information about goodwill and other intangible assets, see Note 5 to the Consolidated Financial Statements.
Defined Benefits PlansPension PlansDuring 2015, the fair value of plan assets in the Company’s employee pension plans decreased $215 to $4,406 at December 31, 2015. The decrease in plan assets was primarily due to lower than expected return on assets. At December 31, 2015, the net unfunded position of $1,598 in pension liabilities consisted of $691 in the U.S. quali-fied pension plans, $859 in plans that have no minimum funding requirements, and $105 in all other plans that require minimum funding, partially offset by $57 in plans that are overfunded.
Funding requirements are a major consideration in making contributions to Eaton’s pension plans. With respect to the Company’s pension plans worldwide, the Com-pany intends to contribute annually not less than the minimum required by applicable law and regulations. In 2015, $330 was contributed to the pension plans. The Com-pany anticipates making $162 of contributions to certain pension plans during 2016. The funded status of the Company’s pension plans at the end of 2016, and future con-tributions, will depend primarily on the actual return on assets during the year and the discount rate used to calculate certain benefits at the end of the year. Depending on these factors, and the resulting funded status of the pension plans, the level of future contributions could be materially higher or lower than in 2015.
Off-Balance Sheet Arrangements Eaton does not have off-balance sheet arrangements or financings with unconsoli-dated entities or other persons. In the ordinary course of business, the Company leases certain real properties and equipment, as described in Note 8 to the Consoli-dated Financial Statements.
Critical Accounting Policies The preparation of financial statements in conformity with generally accepted account-ing principles (GAAP) in the United States requires management to make certain esti-mates and assumptions that may involve the exercise of significant judgment. For any estimate or assumption used, there may be other reasonable estimates or assumptions that could have been used. However, based on facts and circumstances inherent in developing estimates and assumptions, management believes it is unlikely that apply-ing other such estimates and assumptions would have caused materially different amounts to have been reported. Actual results may differ from these estimates.
Revenue RecognitionSales of products are recognized when a sales agreement is in place, products have been shipped to unaffiliated customers and title has transferred in accordance with shipping terms, the selling price is fixed and determinable and collectability is reason-ably assured, all significant related acts of performance have been completed, and no other significant uncertainties exist. Shipping and handling costs billed to customers are included in Net sales and the related costs in Cost of products sold. Although the majority of the sales agreements contain standard terms and conditions, there are agreements that contain multiple elements or non-standard terms and conditions. As a result, judgment is required to determine the appropriate accounting, including whether the deliverables specified in these agreements should be treated as separate units of accounting for recognition purposes, and, if so, how the sales price should be allocated among the elements and when to recognize sales for each element. For delivered elements, sales generally are recognized only when the delivered elements have standalone value and there are no uncertainties regarding customer acceptance. Sales for service contracts generally are recognized as the services are provided.
Eaton records reductions to revenue for customer and distributor incentives, primarily comprised of rebates, at the time of the initial sale. Rebates are estimated based on sales terms, historical experience, trend analysis and projected market conditions in the various markets served. The rebate programs offered vary across businesses due to the numerous markets Eaton serves, but the most common incentives relate to amounts paid or credited to customers for achieving defined volume levels.
Impairment of Goodwill and Other Long-Lived Assets GoodwillGoodwill is evaluated annually for impairment as of July 1 using either a quantitative or qualitative analysis. Goodwill is tested for impairment at the reporting unit level, which is equivalent to Eaton's operating segments and based on the net assets for each segment, including goodwill and intangible assets. Goodwill is assigned to each operating segment, as this represents the lowest level that constitutes a busi-ness and is the level at which management regularly reviews the operating results. The Company performs a quantitative analysis using a discounted cash flow model and other valuation techniques, but may elect to perform a qualitative analysis.
EATON 2015 Annual Report52
Recoverability of Deferred Income Tax AssetsEaton is subject to the income tax laws in the jurisdictions in which it operates. In order to determine the income tax provision for financial statement purposes, Eaton must make significant estimates and judgments about its business operations in these jurisdictions. These estimates and judgments are also used in determining the deferred income tax assets and liabilities that have been recognized for differences between the financial statement and income tax basis of assets and liabilities, and income tax loss carryforwards and income tax credit carryforwards.
Management evaluates the realizability of deferred income tax assets for each juris-diction in which it operates. If the Company experiences cumulative pretax income in a particular jurisdiction in a three-year period including the current and prior two years, management normally concludes that the deferred income tax assets will more likely than not be realizable and no valuation allowance is recognized, unless known or planned operating developments would lead management to conclude otherwise. However, if the Company experiences cumulative pretax losses in a particular jurisdic-tion in a three-year period including the current and prior two years, management then considers a series of factors in the determination of whether the deferred income tax assets can be realized. These factors include historical operating results, known or planned operating developments, the period of time over which certain temporary dif-ferences will reverse, consideration of the utilization of certain deferred income tax liabilities, tax law carryback capability in a particular country, prudent and feasible tax planning strategies, and estimates of future earnings and taxable income using the same assumptions as the Company’s goodwill and other impairment testing. After evaluation of these factors, if the deferred income tax assets are expected to be real-ized within the tax carryforward period allowed for that specific country, management would conclude that no valuation allowance would be required. To the extent that the deferred income tax assets exceed the amount that is expected to be realized within the tax carryforward period for a particular jurisdiction, management would establish a valuation allowance. For additional information about income taxes, see Note 9 to the Consolidated Financial Statements.
Pension and Other Postretirement Benefits Plans The measurement of liabilities related to pension plans and other postretirement ben-efits plans is based on assumptions related to future events including interest rates, return on plan assets, rate of compensation increases, and health care cost trend rates. Actual plan asset performance will either reduce or increase losses included in accumulated other comprehensive loss, which ultimately affects net income.
The discount rate for United States plans was determined by discounting the expected future benefit payments using a theoretical zero-coupon spot yield curve derived from a universe of high-quality bonds as of the measurement date and solving for the single rate that generated the same benefit obligation. Only corporate bonds with a rating of Aa or higher by either Moody’s or Standard & Poor's were included. Callable bonds and certain other non-comparable bonds were eliminated. Finally, a subset of bonds was selected by grouping the universe of bonds by duration and retaining 50% of the bonds that had the highest yields.
The discount rates for non-United States plans were determined by region and are based on high quality long-term corporate and government bonds. Consideration has been given to the duration of the liabilities in each plan when selecting the bonds to be used in determining the discount rate.
Key assumptions used to calculate pension and other postretirement benefits expense are adjusted at each year-end. A 1-percentage point change in the assumed rate of return on pension plan assets is estimated to have approximately a $45 effect on pen-sion expense. Likewise, a 1-percentage point change in the discount rate is estimated to have approximately a $78 effect on pension expense. A 1-percentage point change in the assumed rate of return on other postretirement benefits assets is estimated to have approximately a $1 effect on other postretirement benefits expense. A 1-per-centage point change in the discount rate is estimated to have approximately a $3 effect on expense for other postretirement benefits plans.
Beginning in 2016, the Company will adopt a change in the method it will use to esti-mate the service and interest cost components of net periodic benefit cost for its defined benefit pension and other postretirement benefit plans. Historically, for the vast majority of its plans, the service and interest cost components were estimated using a single weighted-average discount rate derived from the yield curve used to measure the benefit obligation at the beginning of the period. Beginning in 2016, the Company will use a spot rate approach by applying the specific spot rates along the yield curve to the relevant projected cash flows in the estimation of the service and interest components of benefit cost, resulting in a more precise measurement. This change does not affect the measurement of total benefit obligations. The change will
be accounted for as a change in estimate and, accordingly, will be accounted for pro-spectively starting in 2016. The reductions in service cost and interest cost for 2016 associated with this change in estimate are expected to be $3 and $42, respectively.
Additional information related to changes in key assumptions used to recognize expense for other postretirement benefits plans is found in Note 7 to the Consolidated Financial Statements.
Environmental ContingenciesAs a result of past operations, Eaton is involved in remedial response and voluntary environmental remediation at a number of sites, including certain of its currently-owned or formerly-owned plants. The Company has also been named a potentially responsible party under the United States federal Superfund law, or the state equivalents thereof, at a number of disposal sites.
A number of factors affect the cost of environmental remediation, including the num-ber of parties involved at a particular site, the determination of the extent of contam-ination, the length of time the remediation may require, the complexity of environmental regulations, and the continuing advancement of remediation technol-ogy. Taking these factors into account, Eaton has estimated the costs of remediation, which will be paid over a period of years. The Company accrues an amount on an undiscounted basis, consistent with the estimates of these costs, when it is proba-ble that a liability has been incurred. At December 31, 2015 and 2014, $131 and $140, respectively, was accrued for these costs.
Based upon Eaton's analysis and subject to the difficulty in estimating these future costs, the Company expects that any sum it may be required to pay in connection with environmental matters is not reasonably possible to exceed the recorded liability by an amount that would have a material effect on its financial position, results of operations or cash flows.
Market Risk DisclosureOn a regular basis, Eaton monitors third-party depository institutions that hold its cash and short-term investments, primarily for safety of principal and secondarily for maximizing yield on those funds. The Company diversifies its cash and short-term investments among counterparties to minimize exposure to any one of these entities. Eaton also monitors the creditworthiness of its customers and suppliers to mitigate any adverse impact.
Eaton uses derivative instruments to manage exposure to volatility in raw material costs, currency, and interest rates on certain debt instruments. Derivative financial instruments used by the Company are straightforward and non-leveraged. The coun-terparties to these instruments are financial institutions with strong credit ratings. Eaton maintains control over the size of positions entered into with any one counter-party and regularly monitors the credit rating of these institutions. See Note 13 to the Consolidated Financial Statements for additional information about hedges and derivative financial instruments.
Eaton’s ability to access the commercial paper market, and the related cost of these borrowings, is based on the strength of its credit rating and overall market condi-tions. The Company has not experienced any material limitations in its ability to access these sources of liquidity. At December 31, 2015, Eaton had $2,000 of long-term revolving credit facilities with banks in support of its commercial paper pro-gram. It has no borrowings outstanding under these credit facilities.
Interest rate risk can be measured by calculating the short-term earnings impact that would result from adverse changes in interest rates. This exposure results from short-term debt, which includes commercial paper at a floating interest rate, long-term debt that has been swapped to floating rates, and money market investments that have not been swapped to fixed rates. Based upon the balances of investments and floating rate debt at year end 2015, a 100 basis-point increase in short-term inter-est rates would have increased the Company’s net, pretax interest expense by $39.
Eaton also measures interest rate risk by estimating the net amount by which the fair value of the Company’s financial liabilities would change as a result of movements in interest rates. Based on Eaton’s best estimate for a hypothetical, 100 basis point decrease in interest rates at December 31, 2015, the market value of the Company’s debt and interest rate swap portfolio, in aggregate, would increase by $407.
Management’s Discussion and Analysis of Financial Condition and Results of Operations
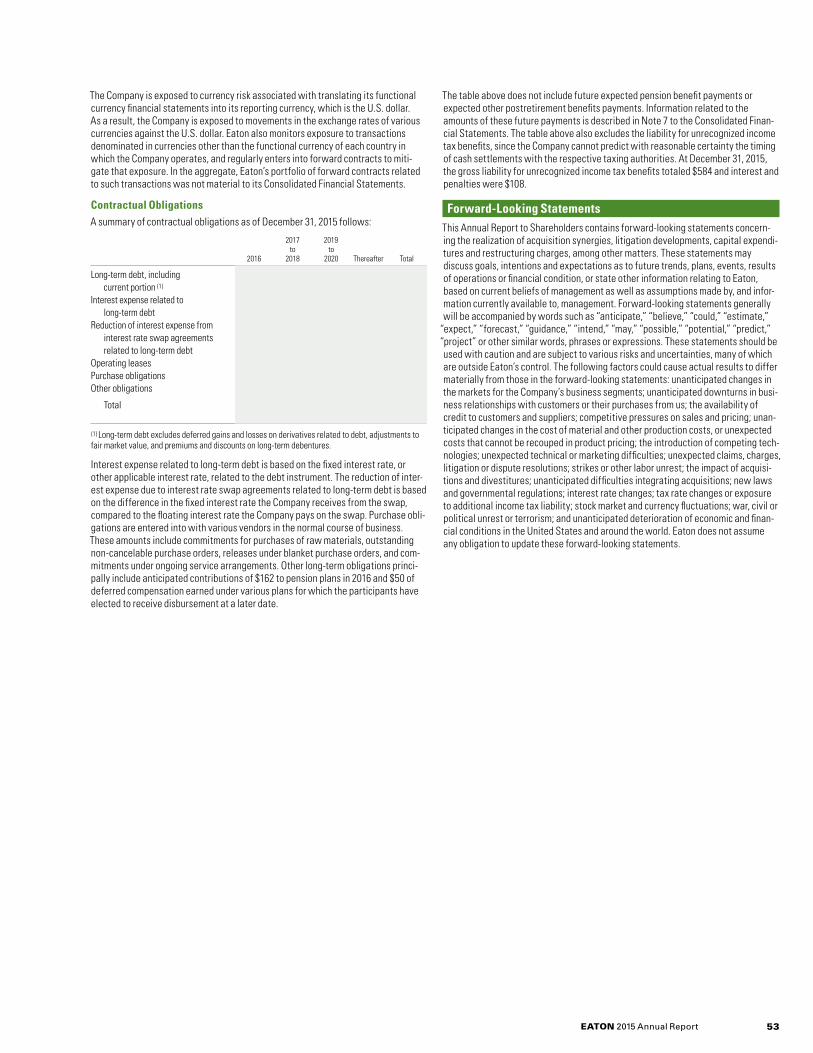
EATON 2015 Annual Report 53
The Company is exposed to currency risk associated with translating its functional currency financial statements into its reporting currency, which is the U.S. dollar. As a result, the Company is exposed to movements in the exchange rates of various currencies against the U.S. dollar. Eaton also monitors exposure to transactions denominated in currencies other than the functional currency of each country in which the Company operates, and regularly enters into forward contracts to miti-gate that exposure. In the aggregate, Eaton’s portfolio of forward contracts related to such transactions was not material to its Consolidated Financial Statements.
Contractual ObligationsA summary of contractual obligations as of December 31, 2015 follows:
2017 2019 to to 2016 2018 2020 Thereafter Total
Long-term debt, including current portion (1) $ 242 $ 2,120 $ 581 $ 4,890 $ 7,833Interest expense related to long-term debt 312 538 431 1,939 3,220Reduction of interest expense from interest rate swap agreements related to long-term debt (59) (79) (33) (74) (245)Operating leases 151 203 81 55 490Purchase obligations 759 89 38 7 893Other obligations 188 18 14 25 245
Total $ 1,593 $ 2,889 $ 1,112 $ 6,842 $ 12,436
(1) Long-term debt excludes deferred gains and losses on derivatives related to debt, adjustments to fair market value, and premiums and discounts on long-term debentures.
Interest expense related to long-term debt is based on the fixed interest rate, or other applicable interest rate, related to the debt instrument. The reduction of inter-est expense due to interest rate swap agreements related to long-term debt is based on the difference in the fixed interest rate the Company receives from the swap, compared to the floating interest rate the Company pays on the swap. Purchase obli-gations are entered into with various vendors in the normal course of business. These amounts include commitments for purchases of raw materials, outstanding non-cancelable purchase orders, releases under blanket purchase orders, and com-mitments under ongoing service arrangements. Other long-term obligations princi-pally include anticipated contributions of $162 to pension plans in 2016 and $50 of deferred compensation earned under various plans for which the participants have elected to receive disbursement at a later date.
The table above does not include future expected pension benefit payments or expected other postretirement benefits payments. Information related to the amounts of these future payments is described in Note 7 to the Consolidated Finan-cial Statements. The table above also excludes the liability for unrecognized income tax benefits, since the Company cannot predict with reasonable certainty the timing of cash settlements with the respective taxing authorities. At December 31, 2015, the gross liability for unrecognized income tax benefits totaled $584 and interest and penalties were $108.
Forward-Looking StatementsThis Annual Report to Shareholders contains forward-looking statements concern-ing the realization of acquisition synergies, litigation developments, capital expendi-tures and restructuring charges, among other matters. These statements may discuss goals, intentions and expectations as to future trends, plans, events, results of operations or financial condition, or state other information relating to Eaton, based on current beliefs of management as well as assumptions made by, and infor-mation currently available to, management. Forward-looking statements generally will be accompanied by words such as “anticipate,” “believe,” “could,” “estimate,”
“expect,” “forecast,” “guidance,” “intend,” “may,” “possible,” “potential,” “predict,” “project” or other similar words, phrases or expressions. These statements should be used with caution and are subject to various risks and uncertainties, many of which are outside Eaton’s control. The following factors could cause actual results to differ materially from those in the forward-looking statements: unanticipated changes in the markets for the Company’s business segments; unanticipated downturns in busi-ness relationships with customers or their purchases from us; the availability of credit to customers and suppliers; competitive pressures on sales and pricing; unan-ticipated changes in the cost of material and other production costs, or unexpected costs that cannot be recouped in product pricing; the introduction of competing tech-nologies; unexpected technical or marketing difficulties; unexpected claims, charges, litigation or dispute resolutions; strikes or other labor unrest; the impact of acquisi-tions and divestitures; unanticipated difficulties integrating acquisitions; new laws and governmental regulations; interest rate changes; tax rate changes or exposure to additional income tax liability; stock market and currency fluctuations; war, civil or political unrest or terrorism; and unanticipated deterioration of economic and finan-cial conditions in the United States and around the world. Eaton does not assume any obligation to update these forward-looking statements.

EATON 2015 Annual Report54
Quarterly Data (unaudited)
Quarter ended in 2015 Quarter ended in 2014
Dec. 31 Sept. 30 June 30 Mar. 31 Dec. 31 Sept. 30 June 30 Mar. 31
(In millions except for per share data)
Net sales $ 5,057 $ 5,203 $ 5,372 $ 5,223 $ 5,565 $ 5,728 $ 5,767 $ 5,492Gross profit 1,630 1,606 1,697 1,630 1,718 1,812 1,742 1,634 Percent of net sales 32.2% 30.9% 31.6% 31.2% 30.9% 31.6% 30.2% 29.8%Income before income taxes 555 487 598 505 609 642 57 453 Net income 534 445 535 467 585 605 172 441
Less net income for noncontrolling interests (2) 1 - (1) (4) (3) (1) (2)
Net income attributable to Eaton ordinary shareholders $ 532 $ 446 $ 535 $ 466 $ 581 $ 602 $ 171 $ 439
Net income per share attributable to Eaton ordinary shareholders Diluted $ 1.15 $ 0.96 $ 1.14 $ 0.99 $ 1.23 $ 1.26 $ 0.36 $ 0.92 Basic 1.15 0.96 1.14 1.00 1.24 1.27 0.36 0.92
Cash dividends declared per ordinary share $ 0.55 $ 0.55 $ 0.55 $ 0.55 $ 0.49 $ 0.49 $ 0.49 $ 0.49
Market price per ordinary share High $ 58.59 $ 68.23 $ 73.82 $ 72.78 $ 70.51 $ 79.98 $ 79.65 $ 78.19 Low 49.46 49.21 66.86 62.80 57.11 62.84 70.26 66.89
Earnings per share for the four quarters in a year may not equal full year earnings per share.
Acquisition integration charges included in Income before income taxes are as follows:
Quarter ended in 2015 Quarter ended in 2014
Dec. 31 Sept. 30 June 30 Mar. 31 Dec. 31 Sept. 30 June 30 Mar. 31
Acquisition integration charges $ 14 $ 10 $ 12 $ 11 $ 32 $ 19 $ 37 $ 66

EATON 2015 Annual Report 55
Ten-Year Consolidated Financial Summary (unaudited)
2015 2014 2013 2012 2011 2010 2009 2008 2007 2006
(In millions except for per share data)
Continuing operations Net sales $ 20,855 $ 22,552 $ 22,046 $ 16,311 $ 16,049 $ 13,715 $ 11,873 $ 15,376 $ 13,033 $ 12,232 Income before income taxes 2,145 1,761 1,884 1,251 1,553 1,036 303 1,140 1,055 979 Income after income taxes 1,981 1,803 1,873 1,220 1,352 937 385 1,067 973 907Income from discontinued operations - - - - - - - 3 35 53
Net income 1,981 1,803 1,873 1,220 1,352 937 385 1,070 1,008 960Less net income for noncontrolling interests (2) (10) (12) (3) (2) (8) (2) (12) (14) (10)
Net income attributable to Eaton ordinary shareholders $ 1,979 $ 1,793 $ 1,861 $ 1,217 $ 1,350 $ 929 $ 383 $ 1,058 $ 994 $ 950
Net income per share attributable to Eaton ordinary shareholders - diluted Continuing operations $ 4.23 $ 3.76 $ 3.90 $ 3.46 $ 3.93 $ 2.73 $ 1.14 $ 3.25 $ 3.19 $ 2.94 Discontinued operations - - - - - - - 0.01 0.12 0.17
Total $ 4.23 $ 3.76 $ 3.90 $ 3.46 $ 3.93 $ 2.73 $ 1.14 $ 3.26 $ 3.31 $ 3.11
Net income per share attributable to Eaton ordinary shareholders - basic Continuing operations $ 4.25 $ 3.78 $ 3.93 $ 3.54 $ 3.98 $ 2.76 $ 1.16 $ 3.29 $ 3.26 $ 2.99 Discontinued operations - - - - - - - 0.01 0.12 0.17
Total $ 4.25 $ 3.78 $ 3.93 $ 3.54 $ 3.98 $ 2.76 $ 1.16 $ 3.30 $ 3.38 $ 3.16
Weighted-average number of ordinary shares outstanding Diluted 467.1 476.8 476.7 350.9 342.8 339.5 335.8 324.6 300.6 305.8 Basic 465.5 474.1 473.5 347.8 338.3 335.5 332.7 320.4 294.6 300.4
Cash dividends declared per ordinary share $ 2.20 $ 1.96 $ 1.68 $ 1.52 $ 1.36 $ 1.08 $ 1.00 $ 1.00 $ 0.86 $ 0.74
Total assets $ 31,031 $ 33,529 $ 35,491 $ 35,810 $ 17,873 $ 17,252 $ 16,282 $ 16,655 $ 13,430 $ 11,417Long-term debt 7,781 8,024 8,969 9,765 3,366 3,382 3,349 3,190 2,432 1,774Total debt 8,449 9,034 9,549 10,836 3,773 3,458 3,467 4,271 3,417 2,586Eaton shareholders’ equity 15,186 15,786 16,791 15,113 7,469 7,362 6,777 6,317 5,172 4,106Eaton shareholders’ equity per ordinary share $ 33.10 $ 33.74 $ 35.34 $ 32.11 $ 22.34 $ 21.66 $ 20.39 $ 19.14 $ 17.71 $ 14.04Ordinary shares outstanding 458.8 467.9 475.1 470.7 334.4 339.9 332.3 330.0 292.0 292.6

EATON 2015 Annual Report56
Directors and Leadership TeamAs of March 1, 2016
Craig ArnoldPresident and Chief Operating Officer, Eaton Corporation, a subsidiary of the company
Todd M. Bluedorn 1, 3
Chief Executive Officer, Lennox International Inc., Richardson, Texas, a global provider of climate control solutions for heating, air conditioning and refrigeration markets
Christopher M. Connor 2*, 3
Executive Chairman, The Sherwin- Williams Company, Cleveland, Ohio, a global manufacturer of paint, architectural coatings, industrial finishes and associated supplies
Michael J. Critelli 1, 4
Chief Executive Officer and President, Dossia Services Corporation, San Francisco, California, a personal health management systems company
Alexander M. Cutler 5*
Chairman, Eaton Corporation plc, Dublin, Ireland, a power management company
Richard H. FearonVice Chairman and Chief Financial Planning Officer, Eaton Corporation, a subsidiary of the company
Charles E. Golden 2, 3*
Retired. Former Executive Vice President and Chief Financial Officer and Director, Eli Lilly and Company, Indianapolis, Indiana, a pharmaceutical company
Linda A. Hill 2, 4
Professor of Business Administration, Harvard Business School, Cambridge, Massachusetts
Arthur E. Johnson 2, 4*
Retired. Former Senior Vice President, Corporate Strategic Development, Lockheed Martin Corporation, Bethesda, Maryland, a manufacturer of advanced technology systems, products and services
Ned C. Lautenbach 2, 4
Retired. Former Partner, Clayton, Dubilier & Rice Inc., New York, N.Y., a private equity investment firm specializing in management buyouts
Deborah L. McCoy 1, 4
Independent consultant. Former Senior Vice President, Flight Operations, Continental Airlines Inc., Houston, Texas, a commercial airline
Gregory R. Page 1*, 4
Executive Director, Cargill Incorporated, Minneapolis, Minnesota, an international marketer, processor and distributor of agricultural, food, financial and industrial products and services
Sandra Pianalto 2, 3
Retired. Former President and Chief Executive Officer of the Federal Reserve Bank of Cleveland
Gerald B. Smith 1, 3
Chairman and Chief Executive Officer, Smith, Graham & Company, Houston, Texas, an investment advisory firm
Directors, Eaton Corporation plc
Each of the non-employee directors serves a four-month term on the Executive Committee. Alexander M. Cutler will serve as Committee Chair until his retirement on May 31, 2016. Craig Arnold will serve as Committee Chair from June 1, 2016 through April 26, 2017.
1 Audit Committee 2 Compensation and Organization Committee 3 Finance Committee 4 Governance Committee 5 Executive Committee * Denotes Committee Chair
January 1, 2015 through April 22, 2015C. E. GoldenD. L. McCoyG. R. PageG. B. Smith
April 22, 2015 through August 31, 2015T. M. BluedornM. J. CritelliS. Pianalto
September 1, 2015 through December 31, 2015C. M. ConnorL. A. HillA. E. JohnsonN. C. Lautenbach
January 1, 2016 through April 26, 2016C. E. GoldenD. L. McCoyG. R. PageG. B. Smith
Board Committees
Alexander M. CutlerChief Executive Officer
Craig ArnoldPresident and Chief Operating Officer
Richard H. FearonVice Chairman and Chief Financial and Planning Officer
Revathi AdvaithiChief Operating Officer, Electrical Sector
Uday YadavChief Operating Officer, Industrial Sector
Brian S. Brickhouse President, Asia Pacific Region, Electrical Sector
Frank C. CampbellPresident–Europe, Middle East and Africa Region, Corporate and Electrical Sector
Kenneth F. DavisPresident–Vehicle Group
Curtis J. HutchinsPresident–Hydraulics Group
Nanda KumarPresident–Aerospace Group
James W. McGillPresident–Americas Region, Electrical Sector
William W. Blausey Jr.Senior Vice President and Chief Information Officer
Cynthia K. BrabanderExecutive Vice President and Chief Human Resources Officer
Rogerio BrancoSenior Vice President–Supply Chain Management
Donald H. BullockSenior Vice President– Investor Relations
Harold V. JonesSenior Vice President–Environment, Health and Safety
Staci KroonExecutive Vice President–Eaton Business System
John J. MatejkaSenior Vice President– Internal Audit
Mark M. McGuireExecutive Vice President and General Counsel
Trent M. MeyerhoeferSenior Vice President–Treasury
Mary Kim ElkinsSenior Vice President–Taxes
Thomas E. Moran*Senior Vice President and Secretary
Molly A. MurphySenior Vice President–Sales and Marketing
Ramanath RamakrishnanExecutive Vice President and Chief Technology Officer
Harpreet SalujaSenior Vice President–Corporate Development and Planning
Ken D. SemelsbergerSenior Vice President and Controller
Deborah R. SeversSenior Vice President–Global Ethics and Compliance
Taras G. SzmagalaSenior Vice President–Public and Community Affairs
Eaton Global Leadership Team
*Officer of Eaton Corporation plc. Other leaders are officers of various Eaton affiliates.
EATON 2015 Annual Report 57
This publication was printed at an FSC®-certified printer. The FSC Logo identifies products that contain wood from well-managed forests certified in accordance with the rules of the Forest Stewardship Council®. Soy-based inks and elemental chlorine-free, acid-free, recycled and recyclable papers were employed throughout this publication.
Eaton Shareholder Contact Information
Shareholder Information
Annual General Meeting of Shareholders
Annual Report on Form 10-K and Other Financial Reports
Annual Certifications
Quarterly Financial Releases
Common Shares
Transfer Agent, Registrar, Dividend Disbursement Agent and Dividend Reinvestment Agent
Dividend Reinvestment and Direct Stock Purchase Plan
Direct Deposit of Dividends
Annual Report to Shareholders
Design and Photo Illustrations: Nesnadny + Schwartz Leadership Photography: Angelo Merendino Photography
Investor Relations, Eaton, 1000 Eaton Boulevard, Cleveland, OH 44122 USA +1 888.328.6647 +1 440.523.5000 www.eaton.com
The company’s 2016 Annual General Meeting of Shareholders will be held at 8:00 a.m., Dublin time, on Wednesday, April 27, 2016, at Eaton House, 30 Pembroke Road, Dublin 4, Ireland. Formal notice of the meeting will be made available on or about March 18, 2016, to each shareholder of record as of February 29, 2016.
Most Eaton shareholders will not receive a mailed copy of the Proxy Statement and Annual Report to Shareholders, but rather a notice that these materials are available online. Eaton shareholders who currently receive paper copies, due to a prior election or due to participation in an employee benefit plan, can register for electronic delivery of these materials as well as online proxy voting, at http://enroll.icsdelivery.com/etn.
Any shareholder may obtain at no charge a copy of Eaton’s Annual Report on Form 10-K for 2015, as filed with the Securities and Exchange Commission, upon written request to the address shown above. The Annual Report on Form 10-K and other public financial reports also are available on Eaton’s website at www.eaton.com.
The most recent certifications required by Sections 302 and 906 of the Sarbanes-Oxley Act of 2002 were filed as Exhibits 31.1,31.2, 32.1 and 32.2 to Eaton’s Annual Report on Form 10-K for 2015. Additionally, Eaton submitted to the New York Stock Exchange its 2015 Chief Executive Officer Certification regarding Eaton’s compliance with the corporate governance listing standards of the Exchange.
Eaton’s financial results are available approximately four weeks after the end of each quarter. Releases are available on Eaton’s website at www.eaton.com. Copies may also be obtained by calling +1 440.523.4254.
Listed for trading: New York Stock Exchange (Ticker Symbol: ETN)
Eaton’s 2015 Annual Report to Shareholders is available online at www.eaton.com/annualreport.
Computershare Inc.First Class/Registered Mail: P.O. Box 30170, College Station, TX 77842-3170Courier Packages: 211 Quality Circle, Suite 210, College Station, TX 77845Toll-free: +1 888.597.8625 +1 312.588.4141 (outside the U.S.)TDD: +1 800.952.9245 (hearing impaired inside the U.S.) TDD: +1 781.575.4592 (hearing impaired outside the U.S.) Computershare may also be contacted via its website at www.computershare.com/investor.
A dividend reinvestment plan is available at no charge to shareholders of record of Eaton Ordinary Shares. Through the plan, shareholders of record may buy additional shares by reinvesting their cash dividends or investing additional cash up to $60,000 per year. Also, new investors may buy Eaton shares under this plan. Interested shareholders of record or new investors should contact Computershare, as shown above.
Shareholders of record may have their dividends directly deposited to their bank accounts. Interested shareholders of record should contact Computershare, as shown above.
EATON, , COOPER INDUSTRIES, , COOPER LIGHTING, EATON BUSINESS SYSTEM, ALERITY, ARCON, CLS, CMA, ENVIROTRAN, FULLER ADVANTAGE, LIGHTBAR, NIGHT FALCON, POWER XPERT, REACTOGARD, SC9000, SMARTWIRE-DT, TVS, TVS2, ULTRASHIFT PLUS, VS5, XEFFECT, and ZERO INCIDENT SAFETY CULTURE are trademarks and/or service marks of Eaton or one of its affiliates.
Trademarks and/or trade names used in this report other than those identified above as belonging to Eaton or one of its affiliates belong to their respective companies.

Power Forward Online: www.eaton.com/AR15
© 2016 EatonAll Rights ReservedPrinted in USA
Eaton Corporation plcEaton House30 Pembroke RoadDublin 4, Irelandwww.eaton.com www.eaton.com/socialbusiness