Embed Size (px)
Citation preview

ILOCAL SERVICEISPECIALIZING IN COMMERCIAL INSURANCE
ILOCAL SERVICEBEST COMPANIES FOR LEADERS SGIVING POLICYHOLDERS SUPERIOR SERVICE AND RESOURCES
TRUSTWORTHYSRECORD SETTING FINANCIAL RESULTS IHELPING OUR AGENTS SELL MOREEINCREASING OUR KNOWLEDGE AND EXPERTISE
BEST COMPANIES FOR LEADERS YIMPROVING THE STRENGTH AND CULTURE OF OUR COMPANYSPARTNERING WITH INDEPENDENT INSURANCE AGENTSLBUILDING STRONG RELATIONSHIPS
ILEADERSHIP COMMITMENTSSERVICE-DRIVEN CULTURELRIGHT PRODUCTS AND SERVICES
IFINANCIAL STRENGTHSEXCEPTIONAL LOSS CONTROL AND SAFETY SERVICES LCONTRIBUTING TO OUR INDUSTRY AND COMMUNITIES
SPECIALIZING IN COMMERCIAL INSURANCE ILOCAL SERVICEBEST COMPANIES FOR LEADERS SGIVING POLICYHOLDERS SUPERIOR SERVICE AND RESOURCES
TRUSTWORTHYSRECORD SETTING FINANCIAL RESULTS IHELPING OUR AGENTS SELL MOREEINCREASING OUR KNOWLEDGE AND EXPERTISE
ILOCAL SERVICEYIMPROVING THE STRENGTH AND CULTURE OF OUR COMPANYSPARTNERING WITH INDEPENDENT INSURANCE AGENTSLBUILDING STRONG RELATIONSHIPS
ILEADERSHIP COMMITMENTSSERVICE-DRIVEN CULTURELRIGHT PRODUCTS AND SERVICES
IFINANCIAL STRENGTHDEXCEPTIONAL LOSS CONTROL AND SAFETY SERVICES LCONTRIBUTING TO OUR INDUSTRY AND COMMUNITIES
SPECIALIZING IN COMMERCIAL INSURANCE SGIVING POLICYHOLDERS SUPERIOR SERVICE AND RESOURCES
TRUSTWORTHYSRECORD SETTING FINANCIAL RESULTS EHELPING OUR AGENTS SELL MOREAINCREASING OUR KNOWLEDGE AND EXPERTISEYIMPROVING THE STRENGTH AND CULTURE OF OUR COMPANYSPARTNERING WITH INDEPENDENT INSURANCE AGENTSBUILDING STRONG RELATIONSHIPS
IFINANCIAL STRENGTHEXCEPTIONAL LOSS CONTROL AND SAFETY SERVICES CONTRIBUTING TO OUR INDUSTRY AND COMMUNITIES
2015 ANNUAL REPORT
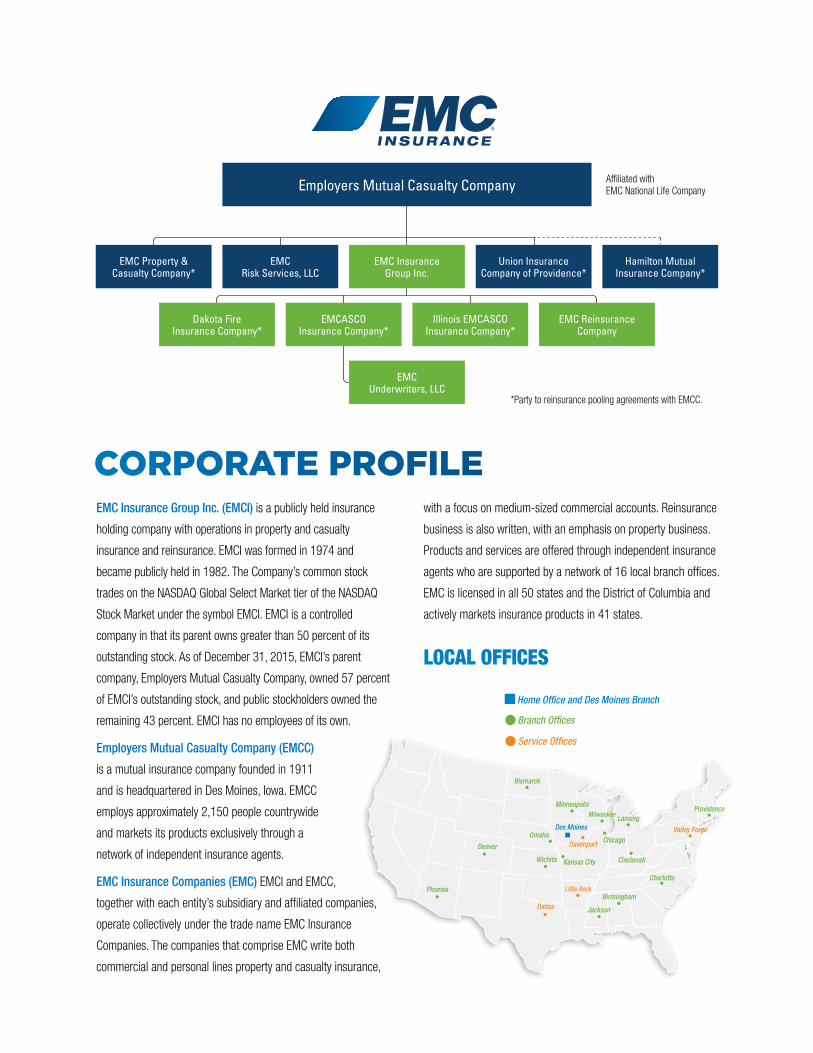
with a focus on medium-sized commercial accounts. Reinsurance
business is also written, with an emphasis on property business.
Products and services are offered through independent insurance
agents who are supported by a network of 16 local branch offices.
EMC is licensed in all 50 states and the District of Columbia and
actively markets insurance products in 41 states.
LOCAL OFFICES
Affiliated with EMC National Life CompanyEmployers Mutual Casualty Company
EMC Property & Casualty Company*
EMC Risk Services, LLC
EMC Insurance Group Inc.
Union Insurance Company of Providence*
Hamilton Mutual Insurance Company*
Dakota Fire Insurance Company*
EMCASCO Insurance Company*
Illinois EMCASCO Insurance Company*
EMC Reinsurance Company
EMC Underwriters, LLC
*Party to reinsurance pooling agreements with EMCC.
CORPORATE PROFILE
Bismarck
Phoenix
Jackson
Charlotte
Wichita
Birmingham
Denver
MinneapolisMilwaukee
Des Moines
Kansas City
Davenport
Valley Forge
Little Rock
Dallas
OmahaChicago
Cincinnati
ProvidenceLansing
Home Office and Des Moines Branch
Branch Offices
Service Offices
EMC Insurance Group Inc. (EMCI) is a publicly held insurance
holding company with operations in property and casualty
insurance and reinsurance. EMCI was formed in 1974 and
became publicly held in 1982. The Company’s common stock
trades on the NASDAQ Global Select Market tier of the NASDAQ
Stock Market under the symbol EMCI. EMCI is a controlled
company in that its parent owns greater than 50 percent of its
outstanding stock. As of December 31, 2015, EMCI’s parent
company, Employers Mutual Casualty Company, owned 57 percent
of EMCI’s outstanding stock, and public stockholders owned the
remaining 43 percent. EMCI has no employees of its own.
Employers Mutual Casualty Company (EMCC)
is a mutual insurance company founded in 1911
and is headquartered in Des Moines, Iowa. EMCC
employs approximately 2,150 people countrywide
and markets its products exclusively through a
network of independent insurance agents.
EMC Insurance Companies (EMC) EMCI and EMCC,
together with each entity’s subsidiary and affiliated companies,
operate collectively under the trade name EMC Insurance
Companies. The companies that comprise EMC write both
commercial and personal lines property and casualty insurance,
3
The success of our strategy in the property and casualty insurance
segment, along with improved sophistication in the use of data in
the underwriting and pricing functions, has been evident during the
most recent market cycle. We have achieved rate level increases on
retained business that have exceeded the industry average since
2011, while maintaining consistently high retention levels. This has
helped us achieve better rate adequacy and an underwriting profit
in the property and casualty insurance segment.
The long-standing domestic and international business
relationships in our assumed reinsurance business, some of which
span multiple decades, has earned us an esteemed reputation
and the trust of our clients. Much has been written regarding the
softening reinsurance marketplace, due primarily to the influx
of nontraditional capital and the relatively low level of insured
catastrophe activity the past few years. Our reinsurance business is
under pricing pressure; however, we have fared well compared to
the industry and are very pleased with the 89.2 percent combined
ratio reported by our reinsurance segment in 2015. We remain
confident in our ability to manage difficult cycles and seize market
opportunities that often arise when a reinsurer provides reliable
customer service and stable capacity.
LETTER TO OUR STOCKHOLDERSIn 2015, we continued to benefit from premium rate level increases
implemented in previous years and catastrophe and storm losses
below our most recent 10-year average, resulting in an excellent
GAAP combined ratio of 96.3 percent. This represents our lowest
combined ratio since 2006 and demonstrates the efficacy of our
strategies as we continue to focus on:
• Building strong relationships with our independent agents and policyholders
• Providing the right products and services in our responsive, service-driven culture
• Maintaining our financial strength
Operating income of $2.24 per share for the year exceeded the
high end of our range of operating income guidance, and book
value per share increased slightly to $25.26 per share, up from
$24.72 per share at the beginning of 2015.
STRONG RELATIONSHIPSEMC Insurance has been underwriting insurance for over 100
years and has grown to become one of the 50 largest property
and casualty insurance organizations in the United States. While
much has changed over the last century, the desire to build and
maintain strong, stable partnerships with our independent agents
remains of utmost importance. We actively write insurance in 41
states, which is supported by 16 full-service branch offices. This
local market presence enhances our underwriting. It provides us
a better understanding of each territory and helps build stronger
relationships with our agents, providing them comfort in placing
and keeping their best business with us.
Bruce G. Kelley, J.D., CPCU, CLU
President, Chief Executive Officer & Treasurer
COMMERCIAL LINES RENEWAL RETENTION RATE BEST SINCE 2006
EMCI COMBINED RATIO
4
Completion of a three for two stock split of the
Company’s outstanding shares of common stock,
aimed at enhancing the liquidity of our shares.
At times, our low float and limited trading volume has made
it more difficult for stockholders to increase or decrease
positions in their shares. This has also added volatility to our
stock price. The stock split will not eliminate this entirely,
but should help. Based on the increase in the average dollar
volume traded on a daily basis following the stock split, it has
been successful at improving liquidity.
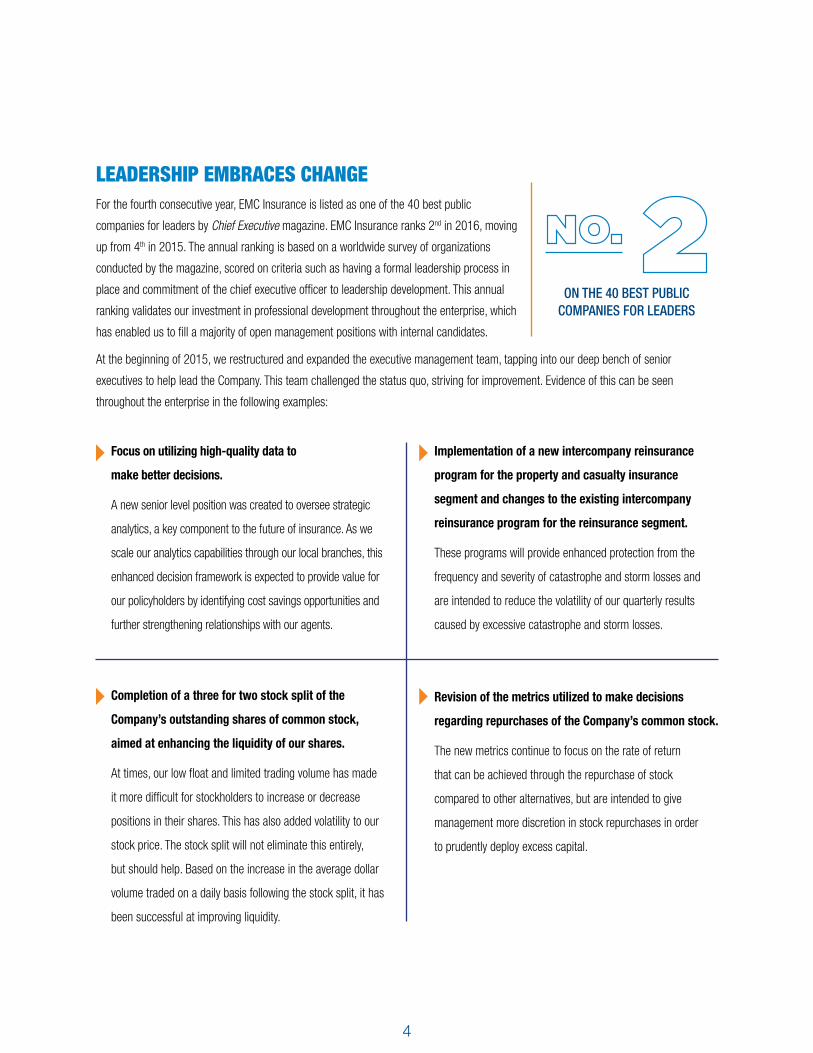
LEADERSHIP EMBRACES CHANGEFor the fourth consecutive year, EMC Insurance is listed as one of the 40 best public
companies for leaders by Chief Executive magazine. EMC Insurance ranks 2nd in 2016, moving
up from 4th in 2015. The annual ranking is based on a worldwide survey of organizations
conducted by the magazine, scored on criteria such as having a formal leadership process in
place and commitment of the chief executive officer to leadership development. This annual
ranking validates our investment in professional development throughout the enterprise, which
has enabled us to fill a majority of open management positions with internal candidates.
At the beginning of 2015, we restructured and expanded the executive management team, tapping into our deep bench of senior
executives to help lead the Company. This team challenged the status quo, striving for improvement. Evidence of this can be seen
throughout the enterprise in the following examples:
Revision of the metrics utilized to make decisions
regarding repurchases of the Company’s common stock.
The new metrics continue to focus on the rate of return
that can be achieved through the repurchase of stock
compared to other alternatives, but are intended to give
management more discretion in stock repurchases in order
to prudently deploy excess capital.
Focus on utilizing high-quality data to
make better decisions.
A new senior level position was created to oversee strategic
analytics, a key component to the future of insurance. As we
scale our analytics capabilities through our local branches, this
enhanced decision framework is expected to provide value for
our policyholders by identifying cost savings opportunities and
further strengthening relationships with our agents.
Implementation of a new intercompany reinsurance
program for the property and casualty insurance
segment and changes to the existing intercompany
reinsurance program for the reinsurance segment.
These programs will provide enhanced protection from the
frequency and severity of catastrophe and storm losses and
are intended to reduce the volatility of our quarterly results
caused by excessive catastrophe and storm losses.
ON THE 40 BEST PUBLIC COMPANIES FOR LEADERS
5
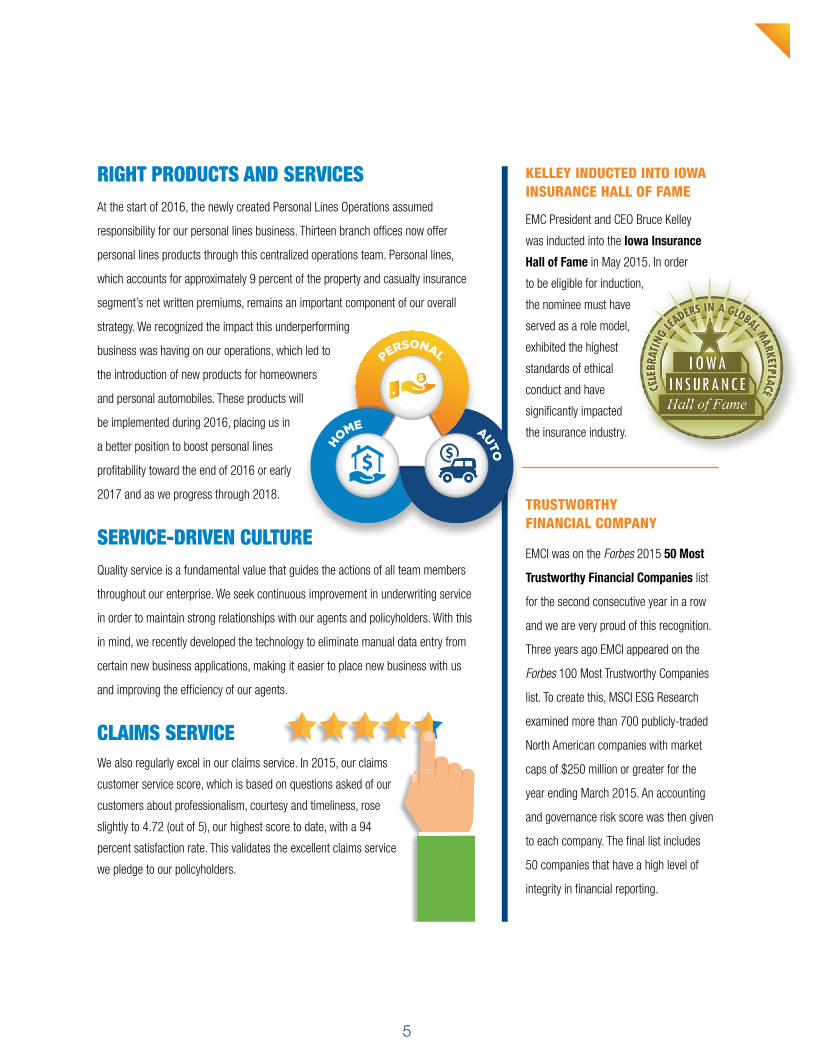
RIGHT PRODUCTS AND SERVICESAt the start of 2016, the newly created Personal Lines Operations assumed
responsibility for our personal lines business. Thirteen branch offices now offer
personal lines products through this centralized operations team. Personal lines,
which accounts for approximately 9 percent of the property and casualty insurance
segment’s net written premiums, remains an important component of our overall
strategy. We recognized the impact this underperforming
business was having on our operations, which led to
the introduction of new products for homeowners
and personal automobiles. These products will
be implemented during 2016, placing us in
a better position to boost personal lines
profitability toward the end of 2016 or early as
2017 and as we progress through 2018.
SERVICE-DRIVEN CULTUREQuality service is a fundamental value that guides the actions of all team members
throughout our enterprise. We seek continuous improvement in underwriting service
in order to maintain strong relationships with our agents and policyholders. With this
in mind, we recently developed the technology to eliminate manual data entry from
certain new business applications, making it easier to place new business with us
and improving the efficiency of our agents.
CLAIMS SERVICEWe also regularly excel in our claims service. In 2015, our claims
customer service score, which is based on questions asked of our
customers about professionalism, courtesy and timeliness, rose
slightly to 4.72 (out of 5), our highest score to date, with a 94
percent satisfaction rate. This validates the excellent claims service
we pledge to our policyholders.
TRUSTWORTHY FINANCIAL COMPANY
EMCI was on the Forbes 2015 50 Most
Trustworthy Financial Companies list
for the second consecutive year in a row
and we are very proud of this recognition.
Three years ago EMCI appeared on the
Forbes 100 Most Trustworthy Companies
list. To create this, MSCI ESG Research
examined more than 700 publicly-traded
North American companies with market
caps of $250 million or greater for the
year ending March 2015. An accounting
and governance risk score was then given
to each company. The final list includes
50 companies that have a high level of
integrity in financial reporting.
PERSONAL
H
OME AUTO
KELLEY INDUCTED INTO IOWA INSURANCE HALL OF FAME
EMC President and CEO Bruce Kelley
was inducted into the Iowa Insurance
Hall of Fame in May 2015. In order
to be eligible for induction,
the nominee must have
served as a role model,
exhibited the highest
standards of ethical
conduct and have
significantly impacted
the insurance industry.
6
FINANCIAL STRENGTHA.M. Best Company affirmed the “A” financial strength ratings of EMC Insurance Companies pool members and EMC Reinsurance
Company in May 2015. This demonstrates our ability to fulfill the promises made to policyholders to pay the claims we owe. Premium
income and the investment income generated from the nearly $1.2 billion of fixed maturity securities provides the liquidity and flexibility to
meet our obligations, including the payment of the quarterly cash dividend, which remains our preferred method of rewarding you with an
attractive return on your investment. The fourth quarter dividend was increased to $0.19 per share, representing a 14 percent increase over the
previous split-adjusted dividend of $0.167 per share. This increase is a reflection of the good results achieved for the year and the confidence
management and our board have in our long-term outlook.
REACHING HIGHERWe have worked hard over the past several years to improve underwriting profitability, so it is satisfying to see such positive results from
those efforts. Looking ahead, we will continue to execute the strategies that led to our success in 2015 as we navigate an increasingly
competitive rate environment. And we are continuously reaching higher in every phase of our operation. By improving our underwriting,
pricing, claim service and the products we sell, and by maintaining the strong relationships with our agents and policyholders, we should
continue to add value to your investment.
Thank you for your continued confidence in EMC Insurance Group Inc.
Sincerely,
Bruce G. Kelley, J.D., CPCU, CLU
President, Chief Executive Officer & Treasurer
10
15
20
25
5
0
1 year 3 year 5 year 10 year
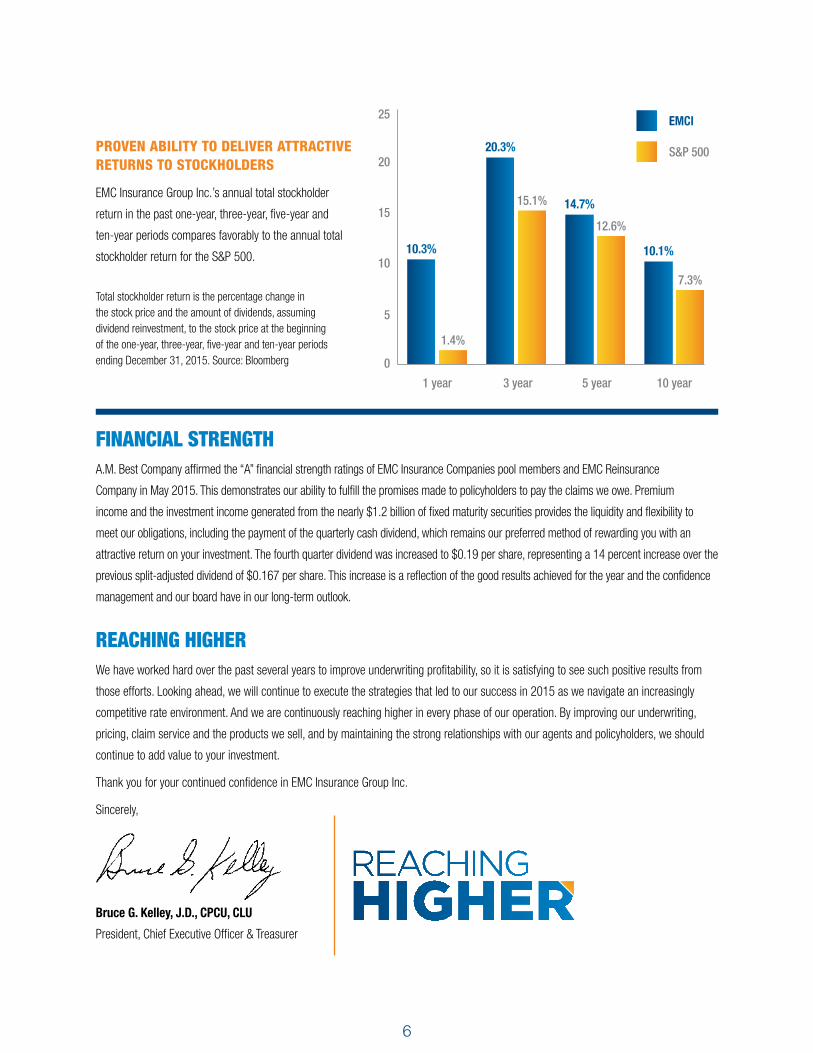
10.3%
1.4%
15.1%
12.6%
7.3%
20.3%
14.7%
10.1%
EMCI
S&P 500PROVEN ABILITY TO DELIVER ATTRACTIVE RETURNS TO STOCKHOLDERS
EMC Insurance Group Inc.’s annual total stockholder
return in the past one-year, three-year, five-year and
ten-year periods compares favorably to the annual total
stockholder return for the S&P 500.
Total stockholder return is the percentage change in the stock price and the amount of dividends, assuming dividend reinvestment, to the stock price at the beginning of the one-year, three-year, five-year and ten-year periods ending December 31, 2015. Source: Bloomberg

7
CAUTIONARY STATEMENTFORWARD-LOOKING STATEMENTS: The Private Securities Litigation Reform Act of 1995 provides issuers the opportunity to make cautionary statements regarding forward-looking statements. Accordingly, any forward-looking statement contained in this report is based on management’s current beliefs, assumptions and expectations of the Company’s future performance, taking into account all information currently available to management. These beliefs, assumptions and expectations can change as the result of many possible events or factors, not all of which are known to management. If a change occurs, the Company’s business, financial condition, liquidity, results of operations, plans and objectives may vary materially from those expressed in the forward-looking statements. The risks and uncertainties that may affect the actual results of the Company include, but are not limited to, the following:
• catastrophic events and the occurrence of significant severe weather conditions;• the adequacy of loss and settlement expense reserves;• state and federal legislation and regulations;• changes in the property and casualty insurance industry, interest rates or the performance of financial markets and the general economy;• rating agency actions;• “other-than-temporary” investment impairment losses; and• other risks and uncertainties inherent to the Company’s business, including those discussed under the heading “Risk Factors” in the
Company’s Annual Report on Form 10-K.
Management intends to identify forward-looking statements when using the words “believe,” “expect,” “anticipate,” “estimate,” “project,” or similar expressions. Undue reliance should not be placed on these forward-looking statements.
2015 2014* 2013*
($ in thousands)
Revenues $ 617,573 $ 590,118 $ 558,988 Realized Investment Gains $ 6,153 $ 4,349 $ 8,997 Income Before Income Taxes $ 71,656 $ 40,907 $ 60,853 Net Income $ 50,162 $ 29,992 $ 43,519
(per share)
Net Income $ 2.43 $ 1.48 $ 2.22 Catastrophe and Storm Losses (after tax) $ 1.40 $ 1.84 $ 1.61 Dividends Paid $ 0.69 $ 0.63 $ 0.57 Book Value $ 25.26 $ 24.72 $ 22.81
($ in thousands)
Average Return on Equity (ROE) 9.8% 6.3% 10.2% Total Assets $ 1,535,955 $ 1,497,820 $ 1,374,501 Stockholders’ Equity $ 524,938 $ 502,886 $ 455,210
FINANCIAL HIGHLIGHTS
COMMON STOCK PERFORMANCE2015 2014*
High Low Dividend High Low Dividend
1st Quarter $ 23.93 $ 19.84 $ 0.167 $ 24.33 $ 17.49 $ 0.153
2nd Quarter $ 26.00 $ 21.67 $ 0.167 $ 24.33 $ 20.01 $ 0.153
3rd Quarter $ 26.52 $ 20.23 $ 0.170 $ 22.08 $ 18.76 $ 0.153
4th Quarter $ 26.83 $ 22.20 $ 0.190 $ 23.81 $ 18.89 $ 0.167
Close at Dec. 31 $ 25.30 $ 23.64
*All prior period per-share amounts have been adjusted for three for two stock split completed on June 23, 2015.
8
COMMON STOCK
EMC Insurance Group Inc.’s common stock trades on the
NASDAQ Global Select Market tier of the NASDAQ Stock
Market under the symbol EMCI. As of February 22, 2016,
the number of registered stockholders was 699.
There are certain regulatory restrictions relating to the
payment of dividends by the Company’s insurance subsidiaries
(see Note 6 of Notes to Consolidated Financial Statements in
the Company’s 2015 Form 10-K). It is the present intention
of the Company’s Board of Directors to declare quarterly
cash dividends, but the amount and timing thereof, if any, are
determined by the Board of Directors at its discretion.
DIVIDEND REINVESTMENT AND
COMMON STOCK PURCHASE PLAN
A dividend reinvestment and common stock purchase
plan provides stockholders with the option of receiving
additional shares of common stock instead of cash dividends.
Participants may also purchase additional shares of common
stock without incurring broker commissions by making optional
cash contributions to the plan, and sell shares of common
stock through the plan (see Note 13 of Notes to Consolidated
Financial Statements in the Company’s 2015 Form 10-K).
More information about the plan can be obtained by calling
American Stock Transfer & Trust Company, LLC, the Company’s
stock transfer agent and plan administrator.
ANNUAL MEETING
We welcome attendance at our annual meeting
on May 19, 2016, at 1:30 p.m. CDT.
EMC Insurance Companies
700 Walnut Street
Des Moines, IA 50309
STOCKHOLDER SERVICES
Corporate Headquarters717 Mulberry StreetDes Moines, IA 50309Phone: 515-280-2511
Transfer AgentAmerican Stock Transfer & Trust Company, LLC6201 15th AvenueBrooklyn, NY 11219Phone: 866-666-1597www.amstock.com
SEC CounselNyemaster Goode, P.C.700 Walnut Street, Suite 1600Des Moines, IA 50309
Insurance CounselBradshaw, Fowler, Proctor and Fairgrave, P.C.801 Grand Avenue, Suite 3700Des Moines, IA 50309
Independent Registered Public Accounting FirmErnst & Young LLP801 Grand Avenue, Suite 3000Des Moines, IA 50309
Information AvailabilityInterested parties can request news releases, annual reports, Forms 10-Q and 10-K and other information at no cost by contacting:
Investor RelationsSteve Walsh, CPAEMC Insurance Group Inc.717 Mulberry StreetDes Moines, IA 50309Phone: 515-345-2515Fax: 515-345-2895Email: [email protected]: www.emcins.com/ir
UNITED STATESSECURITIES AND EXCHANGE COMMISSION
Washington, D.C. 20549
FORM 10-KANNUAL REPORT PURSUANT TO SECTION 13 OR 15(d) OF THE SECURITIES EXCHANGE ACT OF 1934
For the fiscal year ended December 31, 2015
TRANSITION REPORT PURSUANT TO SECTION 13 OR 15(d) OF THE SECURITIES EXCHANGE ACT OF 1934
For the transition period from ________________to __________________
Commission File Number: 0-10956
EMC INSURANCE GROUP INC.(Exact name of registrant as specified in its charter)
Iowa 42-6234555(State or other jurisdiction of incorporation or organization) (I.R.S. Employer Identification No.)
717 Mulberry Street, Des Moines, Iowa 50309(Address of principal executive offices) (Zip Code)
Registrant’s telephone number, including area code: (515) - 345 - 2902Securities registered pursuant to Section 12(b) of the Act:
Common Stock, Par Value $1.00 The NASDAQ OMX Group, Inc.(Title of Class) (Name of each exchange on which registered)
Securities registered pursuant to Section 12 (g) of the Act: None
Indicate by check mark if the registrant is a well-known seasoned issuer, as defined in Rule 405 of the Securities Act Yes No
Indicate by check mark if the registrant is not required to file reports pursuant to Section 13 or Section 15(d) of the Act Yes No
Indicate by check mark whether the registrant (1) has filed all reports required to be filed by Section 13 or 15(d) of theSecurities Exchange Act of 1934 during the preceding 12 months (or for such shorter period that the registrant was requiredto file such reports), and (2) has been subject to such filing requirements for the past 90 days. Yes No
Indicate by check mark whether the registrant has submitted electronically and posted on its corporate Web site, if any, everyInteractive Data File required to be submitted and posted pursuant to Rule 405 of Regulation S-T (§232.405 of this chapter)during the preceding 12 months (or for such shorter period that the registrant was required to submit and post such files). Yes No
Indicate by check mark if disclosure of delinquent filers pursuant to Item 405 of Regulation S-K (§229.405 of this chapter) isnot contained herein, and will not be contained, to the best of registrant’s knowledge, in definitive proxy or informationstatements incorporated by reference in Part III of this Form 10-K or any amendment to this Form 10-K.
Indicate by check mark whether the registrant is a large accelerated filer, an accelerated filer, a non-accelerated filer, or asmaller reporting company (as defined in Rule 12b-2 of the Exchange Act).
Large accelerated filer Accelerated filer Non-accelerated filer Smaller reporting company
Indicate by check mark whether the registrant is a shell company (as defined in Rule 12b-2 of the Act). Yes No
The aggregate market value of the voting stock held by non-affiliates of the registrant as of June 30, 2015 was $222,662,238.
The number of shares outstanding of the registrant's common stock, $1.00 par value, on February 29, 2016, was 20,831,163.
DOCUMENTS INCORPORATED BY REFERENCE
Portions of the registrant’s definitive proxy statement for the Annual Meeting of Stockholders to be held on May 19, 2016, and to be filed pursuant to Regulation 14A within 120 days after the registrant’s fiscal year ended December 31, 2015, are incorporated by reference under Part III.
1
TABLE OF CONTENTS
PagePart IItem 1. Business
Executive Officers of the CompanyItem 1A. Risk FactorsItem 1B. Unresolved Staff CommentsItem 2. PropertiesItem 3. Legal ProceedingsItem 4. Mine Safety Disclosures
Part IIItem 5. Market for Registrant's Common Equity, Related Stockholder Matters and Issuer Purchases of Equity
SecuritiesItem 6. Selected Financial DataItem 7. Management's Discussion and Analysis of Financial Condition and Results of OperationsItem 7A. Quantitative and Qualitative Disclosures About Market RiskItem 8. Financial Statements and Supplementary DataItem 9. Changes in and Disagreements With Accountants on Accounting and Financial DisclosureItem 9A. Controls and ProceduresItem 9B. Other Information
Part IIIItem 10. Directors, Executive Officers and Corporate GovernanceItem 11. Executive CompensationItem 12. Security Ownership of Certain Beneficial Owners and Management and Related Stockholder MattersItem 13. Certain Relationships and Related Transactions, and Director IndependenceItem 14. Principal Accounting Fees and Services
Part IVItem 15. Exhibits, Financial Statement SchedulesIndex to Financial Statement SchedulesSignaturesIndex to Exhibits
2404251515151
51
5557104105172172172
172173173173173
174174177178
2
PART I
ITEM 1. BUSINESS
GENERAL
EMC Insurance Group Inc. is an insurance holding company that was incorporated in Iowa in 1974 by Employers Mutual Casualty Company (Employers Mutual) and became a public company in 1982 following the initial public offering of its common stock. EMC Insurance Group Inc. is approximately 57 percent owned by Employers Mutual, a multiple-line property and casualty insurance company organized as an Iowa mutual insurance company in 1911 that is licensed in all 50 states and the District of Columbia. The term “Company” is used interchangeably to describe EMC Insurance Group Inc. (Parent Company only) and EMC Insurance Group Inc. and its subsidiaries. Employers Mutual and all of its subsidiaries (including the Company) and an affiliate are referred to as the “EMC Insurance Companies.”
The Company conducts operations in property and casualty insurance and reinsurance through its subsidiaries. The Company primarily focuses on the sale of commercial lines of property and casualty insurance to small and medium-sized businesses. These products are sold through independent insurance agents who are supported by a decentralized network of branch offices. Although the Company actively markets its insurance products in 41 states, the majority of its business is marketed and generated in the Midwest.
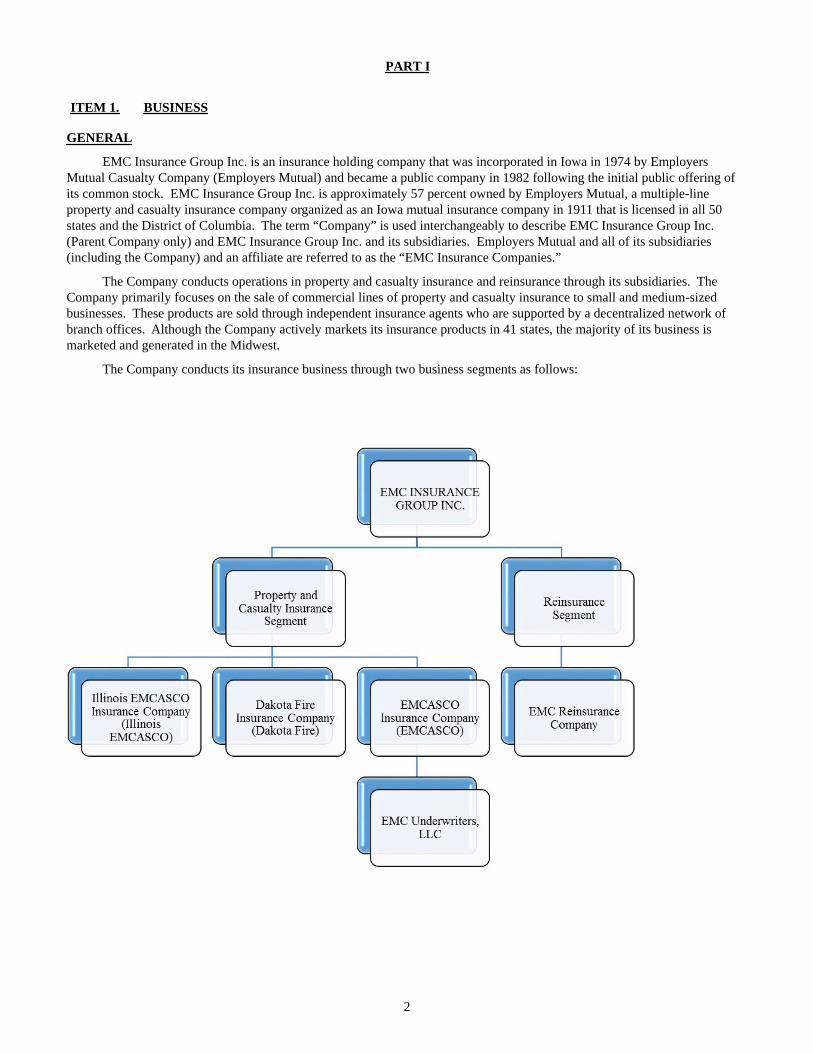
The Company conducts its insurance business through two business segments as follows:
3
Illinois EMCASCO was formed in Illinois in 1976 (and was re-domesticated to Iowa in 2001), Dakota Fire was formed in North Dakota in 1957 and EMCASCO was formed in Iowa in 1958, all for the purpose of writing property and casualty insurance. EMC Reinsurance Company was formed in 1981 to assume reinsurance business from Employers Mutual. The Company’s excess and surplus lines insurance agency, EMC Underwriters, LLC, was formed in Iowa in 1975 and was acquired by the Company in 1985. Effective December 31, 1998, the excess and surplus lines insurance agency was converted to a limited liability company and the ownership was contributed to EMCASCO.
Property and casualty insurance is the most significant segment of the Company’s business, totaling 78 percent of consolidated premiums earned in 2015. The property and casualty insurance operations are integrated with the property and casualty insurance operations of Employers Mutual through participation in a reinsurance pooling agreement. Because the Company conducts its property and casualty insurance operations together with Employers Mutual through the reinsurance pooling agreement, the Company shares the same business philosophy, management, employees and facilities as Employers Mutual and offers the same types of insurance products. For a discussion of the reinsurance pooling agreement and its benefits, please see “Organizational Structure – Property and Casualty Insurance” below.
Reinsurance operations are conducted through EMC Reinsurance Company and accounted for 22 percent of consolidated premiums earned in 2015. The principal business activity of EMC Reinsurance Company is to assume, through a quota share reinsurance agreement, 100 percent of Employers Mutual's assumed reinsurance business, subject to certain exceptions. EMC Reinsurance Company also writes a relatively small amount of assumed reinsurance business on a direct basis (outside the quota share reinsurance agreement). For a discussion of the quota share reinsurance agreement and its benefits, please see “Organizational Structure – Reinsurance” below.
The Company’s insurance agency, EMC Underwriters, LLC, specializes in marketing excess and surplus lines of insurance. The excess and surplus lines markets provide insurance coverage at negotiated rates for risks that are not acceptable to licensed insurance companies. EMC Underwriters accesses this market by working through independent agents and functions as managing underwriter for excess and surplus lines insurance for the pool participants. The Company derives income from this business based on the fees and commissions earned through placement of the business, as opposed to the underwriting of the risks associated with that business.
Organizational Structure
Property and Casualty Insurance
The Company’s three property and casualty insurance subsidiaries and two subsidiaries and an affiliate of Employers Mutual (Union Insurance Company of Providence, EMC Property & Casualty Company and Hamilton Mutual Insurance Company) are parties to reinsurance pooling agreements with Employers Mutual (collectively the “pooling agreement"). Under the terms of the pooling agreement, each company cedes to Employers Mutual all of its insurance business, and assumes from Employers Mutual an amount equal to its participation in the pool. All premiums, losses, settlement expenses, and other underwriting and administrative expenses, excluding the voluntary reinsurance business assumed by Employers Mutual from nonaffiliated insurance companies, are prorated among the parties on the basis of participation in the pool. Employers Mutual negotiates reinsurance agreements that provide protection to the pool and each of its participants, including protection against losses arising from catastrophic events. The aggregate participation of the Company’s property and casualty insurance subsidiaries in the pool is 30 percent.
The Inter-Company Committees of the boards of directors of the Company and Employers Mutual approved a new inter-company reinsurance program between the Company's insurance subsidiaries in the property and casualty insurance segment and Employers Mutual for calendar year 2016. This reinsurance program is intended to reduce the volatility of the Company's quarterly results caused by excessive catastrophe and storm losses, and will provide protection from both the frequency and severity of such losses. The reinsurance program for 2016 will consist of two semi-annual aggregate catastrophe excess of loss treaties. The first treaty will be effective from January 1, 2016 through June 30, 2016, and will have a retention of $20.0 million and a limit of $24.0 million. The cost of this treaty will be approximately $6.3 million. The second treaty will be effective from July 1, 2016 through December 31, 2016, and will have a retention of $15.0 million and a limit of $12.0 million. The cost of this treaty will be approximately $1.5 million. All catastrophe and storm losses assumed by the property and casualty insurance subsidiaries (net of applicable reinsurance recoveries from external reinsurance protections purchased by the pool participants) will be subject to the terms of these treaties, and there is no co-participation provision.
All transactions occurring under the pooling agreement are based on statutory accounting principles. Certain adjustments are made to the statutory-basis amounts assumed by the Company's property and casualty insurance subsidiaries to bring the amounts into compliance with U.S. generally accepted accounting principles (GAAP).
4
Operations of the pool give rise to inter-company balances with Employers Mutual, which are generally settled during the subsequent month. The investment and income tax activities of the pool participants are not subject to the pooling agreement. The pooling agreement provides that Employers Mutual will make up any shortfall or difference resulting from an error in its systems and/or computation processes that would otherwise result in the required restatement of the pool participants’ financial statements.
The purpose of the pooling agreement is to spread the risk of an exposure insured by any of the pool participants among all of the companies. The particular benefits that the Company’s property and casualty insurance subsidiaries realize from participating in the pooling agreement include the following:
• the ability to produce a more uniform and stable underwriting result from year to year than might be experiencedindividually, by spreading the risks over a wide range of geographic locations, lines of insurance written, rate filings,commission plans and policy forms;
• the ability to benefit from the capacity of the entire pool (representing $1.6 billion in direct premiums written in 2015and $1.5 billion in statutory surplus as of December 31, 2015) rather than being limited to policy exposures of a sizecommensurate with each participant’s own surplus level;
• the achievement of an “A” (Excellent) rating from A.M. Best Company on a “group” basis;
• the ability to take advantage of a significant distribution network of independent agencies that the participants mostlikely could not access on an individual basis;
• the ability to negotiate and purchase reinsurance from third-party reinsurers on a combined basis, thereby achievinglarger retentions and better pricing; and
• the ability to achieve and benefit from economies of scale in operations.
The amount of insurance a property and casualty insurance company writes under industry standards is commonlyexpressed as a multiple of its surplus calculated in accordance with statutory accounting practices. Generally, a ratio of 3 or less is considered satisfactory by state insurance departments. The ratios of the pool participants for the past three years are as follows:
Year ended December 31,2015 2014 2013
Employers Mutual 0.74 0.74 0.75EMCASCO (1) 1.54 1.57 1.59Illinois EMCASCO (1) 1.52 1.52 1.54Dakota Fire (1) 1.59 1.61 1.62EMC Property & Casualty Company 0.65 0.64 0.63Union Insurance Company of Providence 0.65 0.65 0.63Hamilton Mutual Insurance Company 0.89 0.90 0.87
(1) The ratios for these companies reflect the issuance of an aggregate $25.0 million of surplus notes to Employers Mutual.Surplus notes are considered to be a component of surplus for statutory reporting purposes; however, under GAAP, surplusnotes are considered to be debt and are reported as a liability in the Company’s financial statements.
Reinsurance
The Company’s reinsurance subsidiary is party to a quota share reinsurance retrocessional agreement (the “quota share agreement”) and an excess of loss reinsurance agreement (the “excess of loss agreement”), with Employers Mutual. Under the terms of the quota share agreement, the reinsurance subsidiary assumes 100 percent of Employers Mutual’s assumed reinsurance business, subject to certain exceptions. Under the terms of the excess of loss agreement (covering both business assumed from Employers Mutual through the quota share agreement, as well as business obtained outside the quota share agreement), the reinsurance subsidiary retains the first $4.0 million of losses per event, and also retains 20.0 percent of any losses between $4.0 million and $10.0 million and 10.0 percent of any losses between $10.0 million and $50.0 million. The cost of the excess of loss reinsurance protection, which includes reimbursement for the cost of reinsurance protection purchased by Employers Mutual to protect itself from the assumption of excessive losses in the event of a major catastrophe, is 8.0 percent (9.0 percent in 2013) of the reinsurance subsidiary’s total assumed reinsurance premiums written.
5
The Inter-Company Committees of the boards of directors of the Company and Employers Mutual approved a change in the inter-company reinsurance program between the Company's reinsurance subsidiary and Employers Mutual for calendar year 2016. The reinsurance program for 2016 will consist of two treaties. The first is a per occurrence catastrophe excess of loss treaty with a retention of $10.0 million, a limit of $10.0 million, 20 percent co-participation, and no reinstatement. The cost of this treaty will be approximately $2.0 million. The second is an annual aggregate catastrophe excess of loss treaty with a retention of $20.0 million, a limit of $100.0 million, and 20 percent co-participation. The cost of this treaty will be approximately $3.1 million. Any losses recovered under the per occurrence treaty will inure to the benefit of the aggregate treaty. Only catastrophic events with total losses greater than $500,000 will be subject to the terms of the aggregate treaty. The reinsurance subsidiary will also purchase additional reinsurance protection (Industry Loss Warranties) in peak exposure territories from external parties in which coverage is triggered when losses experienced by the insurance industry from a catastrophic event exceed a specified threshold. Any reinsurance recoveries received from external parties will reduce the amount of losses ceded to Employers Mutual under the excess of loss agreement. The net cost of the external reinsurance protection is estimated to be approximately $4.0 million.
All transactions occurring under the quota share agreement and the excess of loss agreement are based on statutory accounting principles. Certain adjustments are made to the statutory-basis amounts assumed by the Company's reinsurance subsidiary to bring the amounts into compliance with GAAP.
The reinsurance subsidiary does not directly reinsure any of the insurance business written by Employers Mutual or the other pool participants; however, Employers Mutual assumes reinsurance business from the Mutual Reinsurance Bureau underwriting association (MRB), which provides a small amount of reinsurance protection to the members of the EMC Insurance Companies pooling agreement. As a result, the reinsurance subsidiary’s assumed exposures include a small portion of the EMC Insurance Companies’ direct business, after ceded reinsurance protections purchased by MRB are applied. In addition, the reinsurance subsidiary does not reinsure any “involuntary” facility or pool business that Employers Mutual assumes pursuant to state law. The reinsurance subsidiary assumes all foreign currency exchange gain/loss associated with contracts incepting on January 1, 2006 and thereafter that are subject to the quota share agreement.
Operations of the quota share and excess of loss agreements give rise to inter-company balances with Employers Mutual, which are generally settled during the month following the end of each quarter. The investment and income tax activities of the reinsurance subsidiary are not subject to the quota share agreement.
Under the terms of the quota share agreement, the reinsurance subsidiary receives reinstatement premium income that is collected by Employers Mutual from the ceding companies when reinsurance coverage is reinstated after a loss event; however, the cap on losses assumed per event contained in the excess of loss agreement is automatically reinstated without cost.
Property and Casualty Insurance and Reinsurance
The Company does not have any employees of its own. Employers Mutual performs all operations for all of its subsidiaries and affiliate. Such services include data processing, claims, financial, actuarial, legal, auditing, marketing and underwriting. Employers Mutual allocates a portion of the cost of these services to its subsidiaries that do not participate in the pooling agreement based upon a number of criteria, including usage of the services and the number of transactions. The remaining costs are charged to the pooling agreement and each pool participant shares in the total cost in accordance with its pool participation percentage.
Investment expenses are based on actual expenses incurred by the Company plus an allocation of other investment expenses incurred by Employers Mutual, which is based on a weighted-average of total invested assets and number of investment transactions.
FINANCIAL INFORMATION ABOUT INDUSTRY SEGMENTS
For information concerning the Company’s revenues, results of operations and identifiable assets attributable to each of its industry segments over the past three years, see note 7 of Notes to Consolidated Financial Statements under Part II, Item 8 of this Form 10-K.
6
NARRATIVE DESCRIPTION OF BUSINESS
Principal Products
Property and Casualty Insurance
The Company’s property and casualty insurance subsidiaries and the other parties to the pooling agreement underwrite both commercial and personal lines of property and casualty insurance. Those coverages consist of the following types of insurance:Commercial Lines
• Automobile - policies purchased by insureds engaged in a commercial activity that provide protection against liabilityfor bodily injury and property damage arising from automobile accidents, and protection against loss from damage toautomobiles owned by the insured.
• Property - policies purchased by insureds engaged in a commercial activity that provide protection against damage orloss to property (other than autos) owned by the insured.
• Workers’ Compensation - policies purchased by employers to provide benefits to employees for injuries incurredduring the course of employment. The extent of coverage is established by the workers’ compensation laws of eachstate.
• Liability - policies purchased by insureds engaged in a commercial activity that provide protection against liability forbodily injury or property damage to others resulting from acts or omissions of the insured or its employees.
• Other - includes a broad range of policies purchased by insureds engaged in a commercial activity that provideprotection with respect to burglary and theft loss, aircraft, marine and other types of losses. This category alsoincludes fidelity and surety bonds issued to secure performance.
Personal Lines
• Automobile - policies purchased by individuals that provide protection against liability for bodily injury and propertydamage arising from automobile accidents, and protection against loss from damage to automobiles owned by theinsured.
• Homeowners - policies purchased by individuals that provide protection against damage or loss to property (other thanautos) owned by the individual. This category also includes umbrella policies purchased by individuals that provideprotection against liability for bodily injury or property damage to others resulting from acts or omissions of theinsured.
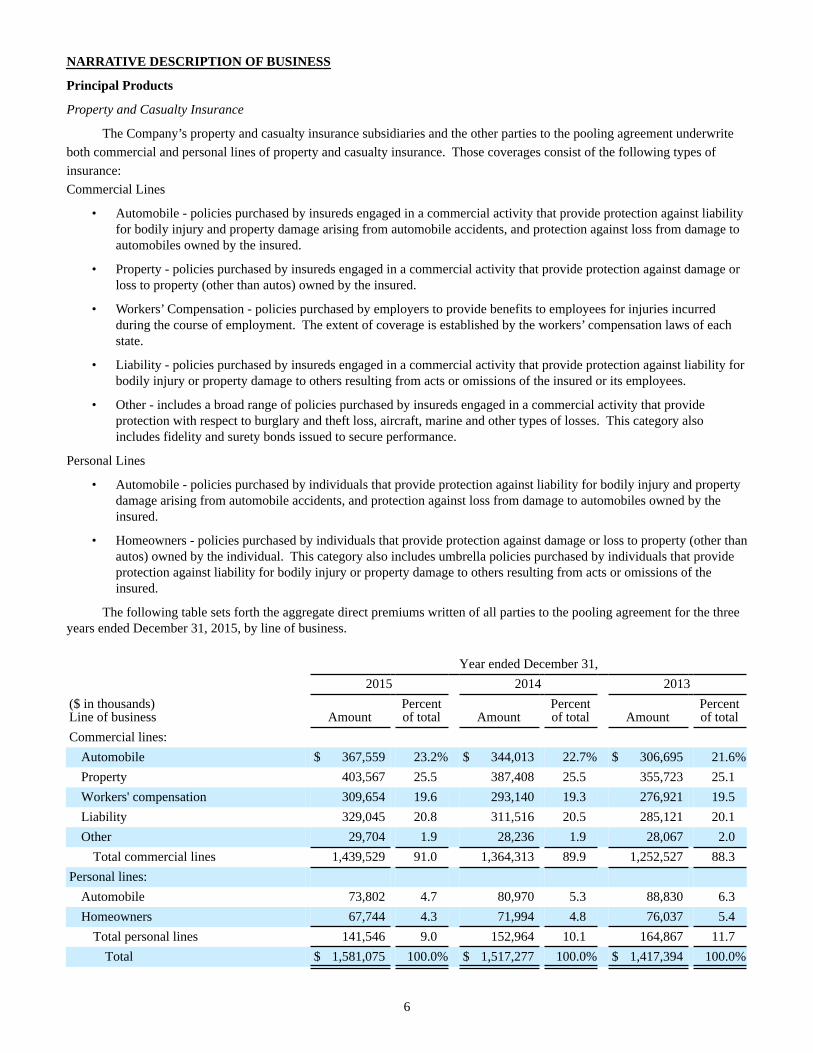
The following table sets forth the aggregate direct premiums written of all parties to the pooling agreement for the three years ended December 31, 2015, by line of business.
Year ended December 31,2015 2014 2013
($ in thousands)Line of business Amount
Percentof total Amount
Percentof total Amount
Percentof total
Commercial lines:Automobile $ 367,559 23.2% $ 344,013 22.7% $ 306,695 21.6%Property 403,567 25.5 387,408 25.5 355,723 25.1Workers' compensation 309,654 19.6 293,140 19.3 276,921 19.5Liability 329,045 20.8 311,516 20.5 285,121 20.1Other 29,704 1.9 28,236 1.9 28,067 2.0
Total commercial lines 1,439,529 91.0 1,364,313 89.9 1,252,527 88.3Personal lines:
Automobile 73,802 4.7 80,970 5.3 88,830 6.3Homeowners 67,744 4.3 71,994 4.8 76,037 5.4
Total personal lines 141,546 9.0 152,964 10.1 164,867 11.7Total $ 1,581,075 100.0% $ 1,517,277 100.0% $ 1,417,394 100.0%
7
Reinsurance
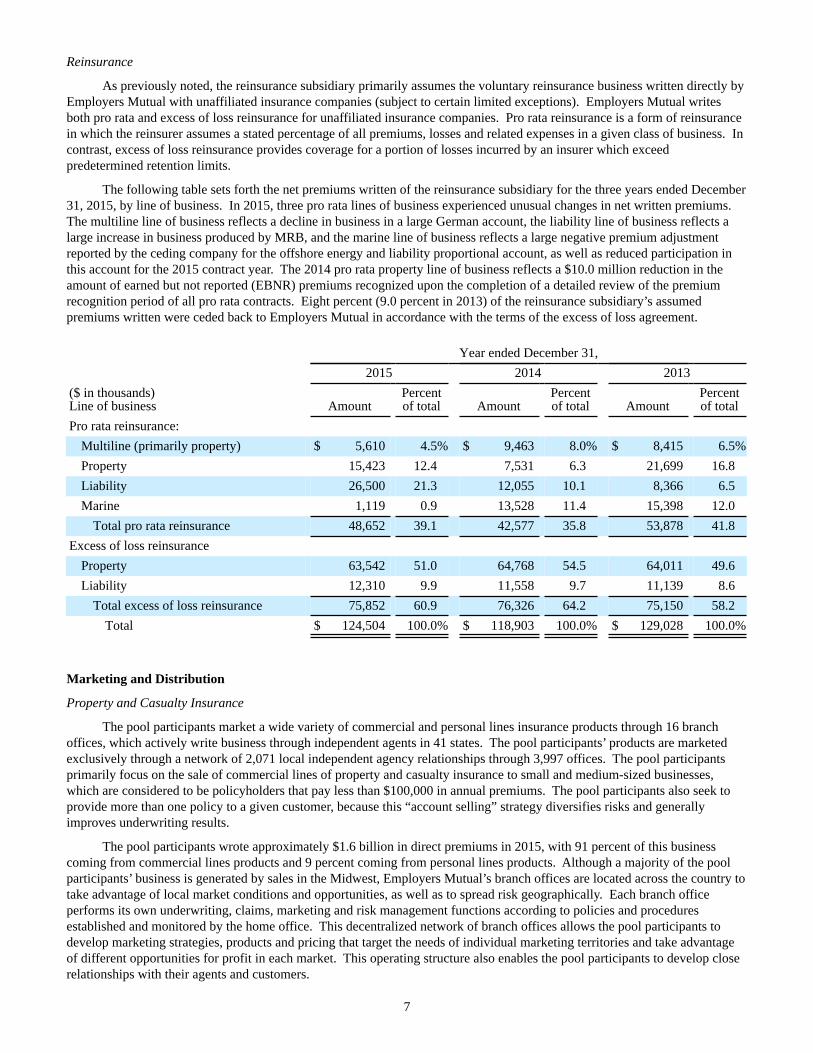
As previously noted, the reinsurance subsidiary primarily assumes the voluntary reinsurance business written directly by Employers Mutual with unaffiliated insurance companies (subject to certain limited exceptions). Employers Mutual writes both pro rata and excess of loss reinsurance for unaffiliated insurance companies. Pro rata reinsurance is a form of reinsurance in which the reinsurer assumes a stated percentage of all premiums, losses and related expenses in a given class of business. In contrast, excess of loss reinsurance provides coverage for a portion of losses incurred by an insurer which exceed predetermined retention limits.
The following table sets forth the net premiums written of the reinsurance subsidiary for the three years ended December 31, 2015, by line of business. In 2015, three pro rata lines of business experienced unusual changes in net written premiums. The multiline line of business reflects a decline in business in a large German account, the liability line of business reflects a large increase in business produced by MRB, and the marine line of business reflects a large negative premium adjustment reported by the ceding company for the offshore energy and liability proportional account, as well as reduced participation in this account for the 2015 contract year. The 2014 pro rata property line of business reflects a $10.0 million reduction in the amount of earned but not reported (EBNR) premiums recognized upon the completion of a detailed review of the premium recognition period of all pro rata contracts. Eight percent (9.0 percent in 2013) of the reinsurance subsidiary’s assumed premiums written were ceded back to Employers Mutual in accordance with the terms of the excess of loss agreement.
Year ended December 31,2015 2014 2013
($ in thousands)Line of business Amount
Percentof total Amount
Percentof total Amount
Percentof total
Pro rata reinsurance:Multiline (primarily property) $ 5,610 4.5% $ 9,463 8.0% $ 8,415 6.5%Property 15,423 12.4 7,531 6.3 21,699 16.8Liability 26,500 21.3 12,055 10.1 8,366 6.5Marine 1,119 0.9 13,528 11.4 15,398 12.0
Total pro rata reinsurance 48,652 39.1 42,577 35.8 53,878 41.8Excess of loss reinsurance
Property 63,542 51.0 64,768 54.5 64,011 49.6Liability 12,310 9.9 11,558 9.7 11,139 8.6
Total excess of loss reinsurance 75,852 60.9 76,326 64.2 75,150 58.2Total $ 124,504 100.0% $ 118,903 100.0% $ 129,028 100.0%
Marketing and Distribution
Property and Casualty Insurance
The pool participants market a wide variety of commercial and personal lines insurance products through 16 branch offices, which actively write business through independent agents in 41 states. The pool participants’ products are marketed exclusively through a network of 2,071 local independent agency relationships through 3,997 offices. The pool participants primarily focus on the sale of commercial lines of property and casualty insurance to small and medium-sized businesses, which are considered to be policyholders that pay less than $100,000 in annual premiums. The pool participants also seek to provide more than one policy to a given customer, because this “account selling” strategy diversifies risks and generally improves underwriting results.
The pool participants wrote approximately $1.6 billion in direct premiums in 2015, with 91 percent of this business coming from commercial lines products and 9 percent coming from personal lines products. Although a majority of the pool participants’ business is generated by sales in the Midwest, Employers Mutual’s branch offices are located across the country to take advantage of local market conditions and opportunities, as well as to spread risk geographically. Each branch office performs its own underwriting, claims, marketing and risk management functions according to policies and procedures established and monitored by the home office. This decentralized network of branch offices allows the pool participants to develop marketing strategies, products and pricing that target the needs of individual marketing territories and take advantage of different opportunities for profit in each market. This operating structure also enables the pool participants to develop close relationships with their agents and customers.
8
Although each branch office offers a slightly different combination of products, the branches generally target three customer segments:
• a wide variety of small to medium-sized businesses, through a comprehensive package of property and liabilitycoverages;
• businesses and institutions eligible for the pool participants’ target market, safety dividend group and EMC Choiceprograms (described below), which offer specialized products geared to their members’ unique protection needs; and
• individual consumers, through a number of personal lines products such as homeowners, automobile and umbrellacoverages.
The pool participants write a number of target market, safety dividend group and EMC Choice programs throughout the country, and have developed a strong reputation for these programs within the marketplace. These programs provide enhanced insurance protection to businesses or institutions that have similar hazards and exposures, and are willing to implement loss prevention programs. These groups include public schools, small municipalities, petroleum marketers, contractors and mobile home parks. As an example, the pool participants write coverage for approximately 1,500 school districts throughout the Midwest. These programs have been successful because they offer risk management products and services that are targeted to the needs of the group members through a local independent agent.
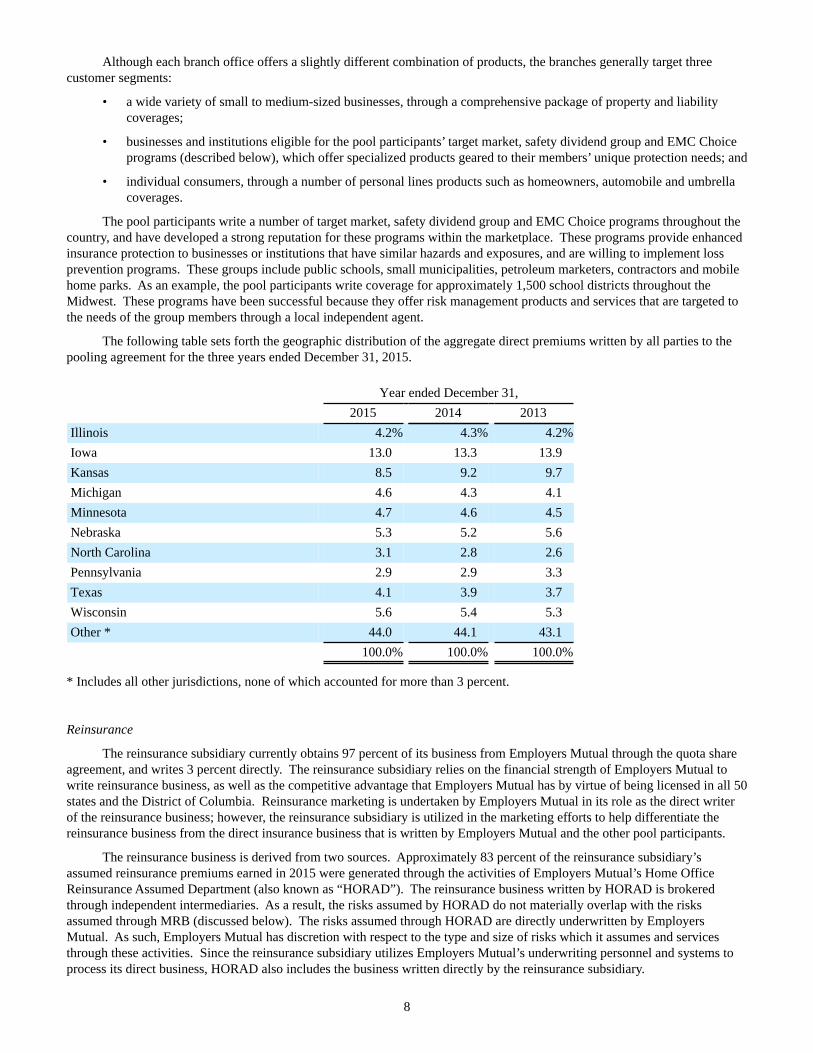
The following table sets forth the geographic distribution of the aggregate direct premiums written by all parties to the pooling agreement for the three years ended December 31, 2015.
Year ended December 31,2015 2014 2013
Illinois 4.2% 4.3% 4.2%Iowa 13.0 13.3 13.9Kansas 8.5 9.2 9.7Michigan 4.6 4.3 4.1Minnesota 4.7 4.6 4.5Nebraska 5.3 5.2 5.6North Carolina 3.1 2.8 2.6Pennsylvania 2.9 2.9 3.3Texas 4.1 3.9 3.7Wisconsin 5.6 5.4 5.3Other * 44.0 44.1 43.1
100.0% 100.0% 100.0%
* Includes all other jurisdictions, none of which accounted for more than 3 percent.
Reinsurance
The reinsurance subsidiary currently obtains 97 percent of its business from Employers Mutual through the quota share agreement, and writes 3 percent directly. The reinsurance subsidiary relies on the financial strength of Employers Mutual to write reinsurance business, as well as the competitive advantage that Employers Mutual has by virtue of being licensed in all 50 states and the District of Columbia. Reinsurance marketing is undertaken by Employers Mutual in its role as the direct writer of the reinsurance business; however, the reinsurance subsidiary is utilized in the marketing efforts to help differentiate the reinsurance business from the direct insurance business that is written by Employers Mutual and the other pool participants.
The reinsurance business is derived from two sources. Approximately 83 percent of the reinsurance subsidiary’s assumed reinsurance premiums earned in 2015 were generated through the activities of Employers Mutual’s Home Office Reinsurance Assumed Department (also known as “HORAD”). The reinsurance business written by HORAD is brokered through independent intermediaries. As a result, the risks assumed by HORAD do not materially overlap with the risks assumed through MRB (discussed below). The risks assumed through HORAD are directly underwritten by Employers Mutual. As such, Employers Mutual has discretion with respect to the type and size of risks which it assumes and services through these activities. Since the reinsurance subsidiary utilizes Employers Mutual’s underwriting personnel and systems to process its direct business, HORAD also includes the business written directly by the reinsurance subsidiary.
9
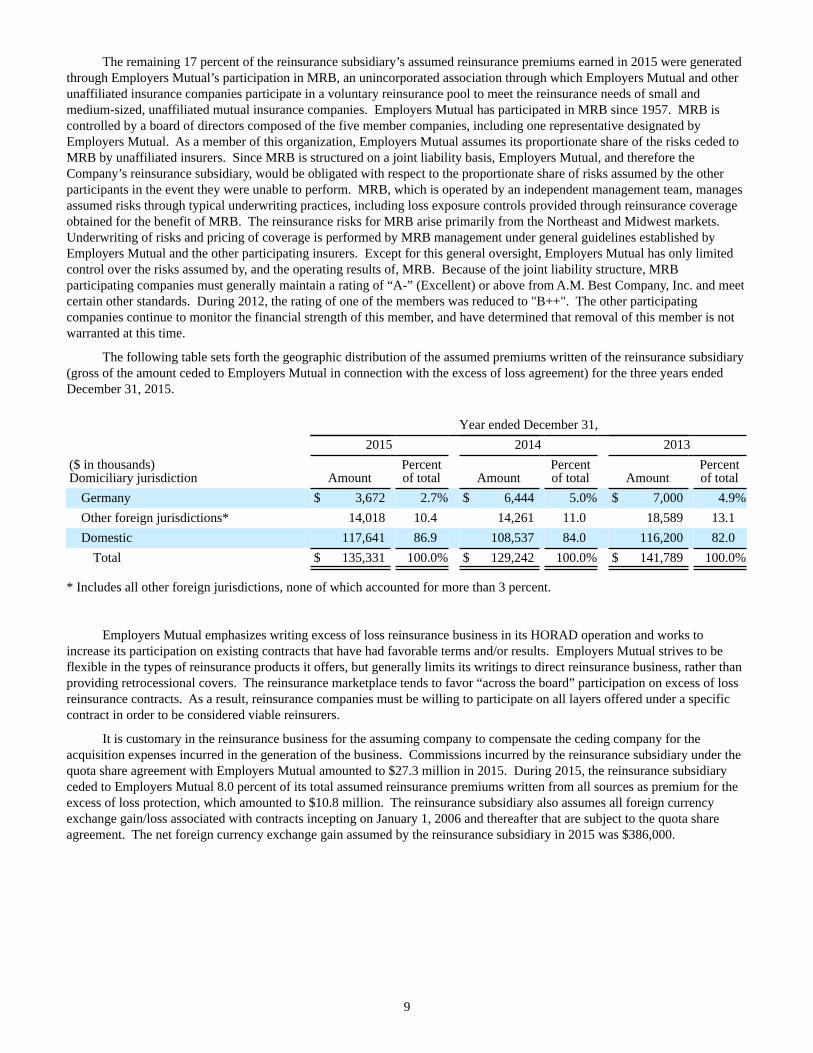
The remaining 17 percent of the reinsurance subsidiary’s assumed reinsurance premiums earned in 2015 were generated through Employers Mutual’s participation in MRB, an unincorporated association through which Employers Mutual and other unaffiliated insurance companies participate in a voluntary reinsurance pool to meet the reinsurance needs of small and medium-sized, unaffiliated mutual insurance companies. Employers Mutual has participated in MRB since 1957. MRB is controlled by a board of directors composed of the five member companies, including one representative designated by Employers Mutual. As a member of this organization, Employers Mutual assumes its proportionate share of the risks ceded to MRB by unaffiliated insurers. Since MRB is structured on a joint liability basis, Employers Mutual, and therefore the Company’s reinsurance subsidiary, would be obligated with respect to the proportionate share of risks assumed by the other participants in the event they were unable to perform. MRB, which is operated by an independent management team, manages assumed risks through typical underwriting practices, including loss exposure controls provided through reinsurance coverage obtained for the benefit of MRB. The reinsurance risks for MRB arise primarily from the Northeast and Midwest markets. Underwriting of risks and pricing of coverage is performed by MRB management under general guidelines established by Employers Mutual and the other participating insurers. Except for this general oversight, Employers Mutual has only limited control over the risks assumed by, and the operating results of, MRB. Because of the joint liability structure, MRB participating companies must generally maintain a rating of “A-” (Excellent) or above from A.M. Best Company, Inc. and meet certain other standards. During 2012, the rating of one of the members was reduced to "B++". The other participating companies continue to monitor the financial strength of this member, and have determined that removal of this member is not warranted at this time.
The following table sets forth the geographic distribution of the assumed premiums written of the reinsurance subsidiary (gross of the amount ceded to Employers Mutual in connection with the excess of loss agreement) for the three years ended December 31, 2015.
Year ended December 31,2015 2014 2013
($ in thousands)Domiciliary jurisdiction Amount
Percentof total Amount
Percentof total Amount
Percentof total
Germany $ 3,672 2.7% $ 6,444 5.0% $ 7,000 4.9%Other foreign jurisdictions* 14,018 10.4 14,261 11.0 18,589 13.1Domestic 117,641 86.9 108,537 84.0 116,200 82.0
Total $ 135,331 100.0% $ 129,242 100.0% $ 141,789 100.0%
* Includes all other foreign jurisdictions, none of which accounted for more than 3 percent.
Employers Mutual emphasizes writing excess of loss reinsurance business in its HORAD operation and works to increase its participation on existing contracts that have had favorable terms and/or results. Employers Mutual strives to be flexible in the types of reinsurance products it offers, but generally limits its writings to direct reinsurance business, rather than providing retrocessional covers. The reinsurance marketplace tends to favor “across the board” participation on excess of loss reinsurance contracts. As a result, reinsurance companies must be willing to participate on all layers offered under a specific contract in order to be considered viable reinsurers.
It is customary in the reinsurance business for the assuming company to compensate the ceding company for the acquisition expenses incurred in the generation of the business. Commissions incurred by the reinsurance subsidiary under the quota share agreement with Employers Mutual amounted to $27.3 million in 2015. During 2015, the reinsurance subsidiary ceded to Employers Mutual 8.0 percent of its total assumed reinsurance premiums written from all sources as premium for the excess of loss protection, which amounted to $10.8 million. The reinsurance subsidiary also assumes all foreign currency exchange gain/loss associated with contracts incepting on January 1, 2006 and thereafter that are subject to the quota share agreement. The net foreign currency exchange gain assumed by the reinsurance subsidiary in 2015 was $386,000.
10
Competition
Property and Casualty Insurance
The property and casualty insurance marketplace is very competitive. The pool participants compete in the United States insurance market with numerous insurers, many of which have substantially greater financial resources. Competition in the types of insurance in which the pool participants are engaged is based on many factors, including the perceived overall financial strength of the insurer, industry ratings, premiums charged, contract terms and conditions, services offered, speed of claim payments, reputation and experience. Because the pool participants’ insurance products are marketed exclusively through independent agencies, they face competition to retain qualified agencies, as well as competition within the agencies. The pool participants also compete with direct writers, who utilize salaried employees and generally offer their products at a lower cost; exclusive agencies, who write insurance business for only one company; and to a lesser extent, internet-based enterprises. Employers Mutual’s decentralized network of 16 branch offices allows the pool participants to enhance business relationships with agents and customers and develop products, marketing strategies and pricing parameters targeted to individual territories. The pool participants also utilize a company-paid trip for qualified agents and a profit-sharing plan as incentives for the independent agencies to place high-quality insurance business with them.
Reinsurance
Employers Mutual, in writing reinsurance business through its HORAD operation, competes in the global reinsurance market with numerous reinsurance companies, many of which have substantially greater financial resources. Competition for reinsurance business is based on many factors, including the perceived financial strength of the reinsurer, industry ratings, stability in products offered and licensing status. There is a segment of the market that favors large, highly-capitalized reinsurance companies who are able to provide “mega” line capacity for multiple lines of business.
While reinsurer competition for national and regional company business is growing, the Company believes that MRB has a competitive advantage in the smaller mutual company market that it serves due to its low operating costs. MRB understands the needs of the smaller company market and operates at a very low expense ratio, enabling it to offer reinsurance coverage (on business that generally presents less risk) to an under-served market at lower margins. However, due to growth in the reinsurance intermediary marketplace, the size of this under-served market has declined.
A.M. Best Company, Inc. Ratings
Property and Casualty Insurance
A.M. Best Company, Inc. (A.M. Best) rates insurance companies based on their relative financial strength and ability tomeet their contractual obligations. During 2013, the Company’s property and casualty insurance subsidiaries' financial strength rating was raised from "A-" to “A” (Excellent) in their capacity as participants in the pooling agreement. A.M. Best re-evaluates its ratings from time to time (normally on an annual basis) and there can be no assurance that the Company’s property and casualty insurance subsidiaries and the other pool participants will maintain their current rating in the future. Management believes that an A.M. Best rating of “A-” (Excellent) or better is important to the Company’s business since many insureds require that companies with which they insure be so rated. A.M. Best’s publications indicate that the “A“ (Excellent) rating is assigned to companies that have achieved excellent overall performance and have a strong ability to meet their obligations over a long period of time. A downgrade of the Company’s property and casualty insurance subsidiaries’ rating (particularly below "A-") would adversely affect the Company’s competitive position and make it more difficult for it to market its products, and retain its existing agents and policyholders. A.M. Best’s ratings are based upon factors of concern to policyholders and insurance agents, and are not directed toward the protection of investors.
Reinsurance
The most recent A.M. Best Property Casualty Key Rating Guide gives the Company’s reinsurance subsidiary a financial strength rating of “A” (Excellent). However, because the majority of the reinsurance business assumed by the reinsurance subsidiary is produced by Employers Mutual, the rating of the reinsurance subsidiary is not critical to the Company’s reinsurance operations. The rating of Employers Mutual is, however, critical to the Company’s reinsurance operations, as the unaffiliated insurance companies that cede business to Employers Mutual view the rating as an indication of Employers Mutual’s ability to meet its obligations to those insurance companies. Employers Mutual’s rating was increased from "A-" to "A" (Excellent) during 2013. This rating increase aids in marketing efforts because some insurance companies require a rating of “A” (Excellent) or higher. A downgrade of Employers Mutual’s rating (particularly below "A-") would have a material adverse impact on the Company’s reinsurance subsidiary, as a downgrade would negatively impact Employers Mutual’s ability to write reinsurance business and, consequently, to cede that business to the Company’s reinsurance subsidiary.
11
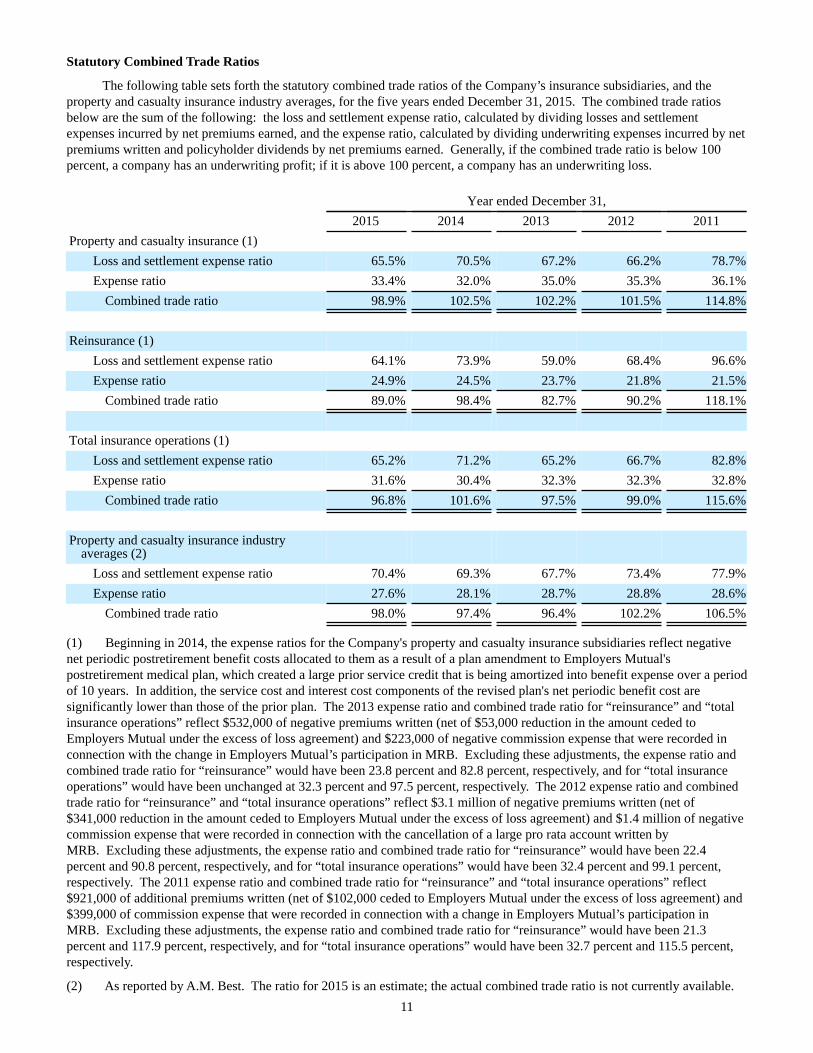
Statutory Combined Trade Ratios
The following table sets forth the statutory combined trade ratios of the Company’s insurance subsidiaries, and the property and casualty insurance industry averages, for the five years ended December 31, 2015. The combined trade ratios below are the sum of the following: the loss and settlement expense ratio, calculated by dividing losses and settlement expenses incurred by net premiums earned, and the expense ratio, calculated by dividing underwriting expenses incurred by net premiums written and policyholder dividends by net premiums earned. Generally, if the combined trade ratio is below 100 percent, a company has an underwriting profit; if it is above 100 percent, a company has an underwriting loss.
Year ended December 31,2015 2014 2013 2012 2011
Property and casualty insurance (1)Loss and settlement expense ratio 65.5% 70.5% 67.2% 66.2% 78.7%Expense ratio 33.4% 32.0% 35.0% 35.3% 36.1%
Combined trade ratio 98.9% 102.5% 102.2% 101.5% 114.8%
Reinsurance (1)Loss and settlement expense ratio 64.1% 73.9% 59.0% 68.4% 96.6%Expense ratio 24.9% 24.5% 23.7% 21.8% 21.5%
Combined trade ratio 89.0% 98.4% 82.7% 90.2% 118.1%
Total insurance operations (1)Loss and settlement expense ratio 65.2% 71.2% 65.2% 66.7% 82.8%Expense ratio 31.6% 30.4% 32.3% 32.3% 32.8%
Combined trade ratio 96.8% 101.6% 97.5% 99.0% 115.6%
Property and casualty insurance industryaverages (2)
Loss and settlement expense ratio 70.4% 69.3% 67.7% 73.4% 77.9%Expense ratio 27.6% 28.1% 28.7% 28.8% 28.6%
Combined trade ratio 98.0% 97.4% 96.4% 102.2% 106.5%
(1) Beginning in 2014, the expense ratios for the Company's property and casualty insurance subsidiaries reflect negativenet periodic postretirement benefit costs allocated to them as a result of a plan amendment to Employers Mutual'spostretirement medical plan, which created a large prior service credit that is being amortized into benefit expense over a periodof 10 years. In addition, the service cost and interest cost components of the revised plan's net periodic benefit cost aresignificantly lower than those of the prior plan. The 2013 expense ratio and combined trade ratio for “reinsurance” and “totalinsurance operations” reflect $532,000 of negative premiums written (net of $53,000 reduction in the amount ceded toEmployers Mutual under the excess of loss agreement) and $223,000 of negative commission expense that were recorded inconnection with the change in Employers Mutual’s participation in MRB. Excluding these adjustments, the expense ratio andcombined trade ratio for “reinsurance” would have been 23.8 percent and 82.8 percent, respectively, and for “total insuranceoperations” would have been unchanged at 32.3 percent and 97.5 percent, respectively. The 2012 expense ratio and combinedtrade ratio for “reinsurance” and “total insurance operations” reflect $3.1 million of negative premiums written (net of$341,000 reduction in the amount ceded to Employers Mutual under the excess of loss agreement) and $1.4 million of negativecommission expense that were recorded in connection with the cancellation of a large pro rata account written byMRB. Excluding these adjustments, the expense ratio and combined trade ratio for “reinsurance” would have been 22.4percent and 90.8 percent, respectively, and for “total insurance operations” would have been 32.4 percent and 99.1 percent,respectively. The 2011 expense ratio and combined trade ratio for “reinsurance” and “total insurance operations” reflect$921,000 of additional premiums written (net of $102,000 ceded to Employers Mutual under the excess of loss agreement) and$399,000 of commission expense that were recorded in connection with a change in Employers Mutual’s participation inMRB. Excluding these adjustments, the expense ratio and combined trade ratio for “reinsurance” would have been 21.3percent and 117.9 percent, respectively, and for “total insurance operations” would have been 32.7 percent and 115.5 percent,respectively.
(2) As reported by A.M. Best. The ratio for 2015 is an estimate; the actual combined trade ratio is not currently available.
12
Claims Management
Effective claims management is critical to the success of the pool participants. To this end, the pool participants have adopted a customer-focused claims management process that is cost efficient, and delivers a high level of claims service that produces superior results. The claims management process is focused on handling claims from their inception, accelerating communication to insureds and claimants, and compressing the cycle time of claims to control both loss costs and claims-handling costs. This process provides quality service and results in the appropriate handling of claims, allowing the pool participants to cost-effectively pay valid claims and contest fraudulent claims.
The claims management operation includes adjusters, appraisers, special investigators, attorneys and claims administrative personnel. The pool participants conduct their claims management operations out of 16 branch offices and four service offices located throughout the United States. The home office claims group provides advice and counsel for branch claims staff in investigating, reserving and settling claims. The home office claims staff also evaluates branch claims operations and makes recommendations for improvements in performance. Additional home office services provided include: complex claim handling, physical damage and property review, medical case management, medical bill review, legal coverage analysis, a special investigative unit, litigation management and subrogation. Management believes these home office services assist the branch claims personnel in producing greater efficiencies than can be achieved at the local level.
Each branch office is responsible for evaluating and settling claims within the authority provided by home office claims. Authority levels within the branch offices are granted based upon an adjuster’s experience and expertise. A branch office must request input from home office claims once a case exceeds its authority level. The Senior Vice President of Claims participates in a claims committee that exists within the home office. This committee meets on a weekly basis to assist the branches in evaluating and settling claims beyond their authority level.
The pool participants manage litigated claims arising from value disputes and questionable liability, and will defend appropriate denials of coverage. The pool participants retain outside defense counsel to defend such matters; however, internal claims professionals manage the litigation process. The pool participants have implemented an internally developed litigation management system that allows the claims staff to evaluate the quality and cost effectiveness of outside legal services. Cases are constantly reviewed to adjust the litigation plan as necessary, and all cases going to trial are carefully reviewed to assess the value of a trial verses a settlement.
Loss and Settlement Expense Reserves
The Company's liabilities for losses and settlement expenses represent management's best estimates at a given point in time of ultimate unpaid losses and settlement expenses for both reported and unreported claims. The estimates of the liabilities for losses and settlement expenses include assumptions of future trends and claims severity, judicial theories of liability, historic loss emergence and other factors. Because of the inherent uncertainties involved in the establishment of reserves for less mature accident years, management’s reserving methodology for the current and more recent accident years utilizes prudently conservative assumptions. During the loss settlement period, which may cover many years in some cases, the inherent uncertainty associated with these accident years declines as the Company learns additional facts regarding individual claims and potential future claims, and consequently it often becomes necessary to refine and adjust its estimates of liability. The Company reflects any adjustments to its liabilities for losses and settlement expenses in its operating results in the period in which the changes in estimates are made.
The amount of reserves for reported claims, known as “case reserves”, is primarily based upon a case-by-case evaluation of the specific type of claim, knowledge of the circumstances surrounding each claim and the policy provisions relating to the type of loss. Case reserves on assumed reinsurance business are the amounts reported by the ceding companies.
The amount of reserves for unreported claims, known as “Incurred But Not Reported (IBNR) loss reserves”, is determined on the basis of statistical information for each line of insurance with respect to expected loss emergence arising from occurrences that have not yet been reported. Established reserves (for both reported and unreported claims) are closely monitored and are frequently examined using a variety of formulas and statistical techniques for analyzing loss development, as well as other economic and social factors.
Settlement expense reserves are intended to cover the ultimate cost of investigating claims and defending lawsuits arising from claims. These reserves are established each quarter based on previous periods’ experience to project the ultimate cost of settlement expenses. To the extent that adjustments are required to be made in the amount of loss reserves each year, settlement expense reserves are correspondingly revised, if necessary.
13
The Company does not discount reserves. Inflation is implicitly provided for in the reserving function through analysis of cost trends, reviews of historical reserving results and projections of future economic conditions. Estimates of individual case loss reserves are monitored and reviewed on a regular basis by claim staff members. Special attention is given to claims of $100,000 or greater, and long-term and lifetime medical claims. Based on currently available information, individual case loss reserves are revised to reflect changes in estimated ultimate settlement values.
Despite the inherent uncertainties of estimating loss and settlement expense reserves, management believes that the Company’s reserves are being calculated in accordance with sound actuarial practices and, based upon current information, that the reserve for losses and settlement expenses at December 31, 2015 represents management’s best estimate of the Company’s overall liability.
Reserving Methodology
Property and Casualty Insurance
Management does not use accident year loss picks to establish the property and casualty insurance segment's carried reserves. Case loss and IBNR loss reserves, as well as settlement expense reserves, are established independently of each other and added together to get the total loss and settlement expense reserve. The property and casualty insurance segment's reserving methodology also includes bulk case loss reserves, which supplement the aggregate case loss reserves and are used by management to establish its best estimate of the liability for reported claims. By establishing bulk (i.e. IBNR loss, bulk case loss, and settlement expense) reserves independently of the case loss reserves, management believes that it is able to appropriately estimate the property and casualty insurance segment's total loss and settlement expense exposures.
Case loss reserves are the individual reserves established based on the specific facts for each reported claim. Individual case loss reserves are based on the probable, or most likely, outcome for each claim, with probable outcome defined as what is most likely to be awarded if the case were to be decided by a civil court in the applicable venue or, in the case of a workers’ compensation case, by that state’s Workers’ Compensation Commission. Bulk case loss reserves are actuarially derived and are allocated to the various accident years on the basis of an annual study of indicated reserve adequacy by accident year maturity.
IBNR loss reserves are established by applying actuarially derived “IBNR factors” to the previous twelve months earned premiums. The IBNR factors are determined for each line of business on an annual basis through an actuarial study of historic IBNR emergence relative to "on-level" premium. The IBNR factors are adjusted on a quarterly basis for rate level changes, and may be further adjusted if the actuarial department recommends that a change in the overall reserve level is warranted. The formula IBNR loss reserve established through this process is for all accident years combined, and the total is allocated to the various accident years by applying an allocation factor to the total formula IBNR amount. The accident year allocation factors are determined by line-of-business, and are based on an annual study of indicated reserve adequacy by accident year maturity, as well as historic IBNR loss emergence.
Other categories of the IBNR loss reserve, which are used to cover exposures associated with asbestos and environmental claims, storms, and catastrophic events, are established independently. IBNR loss reserves associated with storms and catastrophic events are event-specific. When a storm or catastrophic event occurs, the location of the event is overlaid over a map of the Company’s exposures. Using this information and other factors (such as wind speed and the size of any hail), the affected branch office(s) are contacted and requested to develop a loss estimate based on projections of loss frequency and severity in their location. To develop this loss estimate, large accounts located in the affected areas are contacted. Based on this information and discussions with local agents, both the number and severity of estimated losses are projected by location. Management then compiles and analyzes this information and calculates a total loss estimate. The total loss estimate is generally established within two weeks of an event and is adjusted, if necessary, as the actual claims are inspected. At each reporting date, the total amount of reported losses associated with each storm/catastrophic event is compared to the most recent total loss estimate for that event, and the difference is recorded as the storm/catastrophe IBNR loss reserve.
The IBNR loss reserves and settlement expense reserves are established jointly for asbestos and environmental liabilities as the available estimation methodologies require the consideration of both loss and loss settlement expense payments together. Management's internal ultimate loss and settlement expense evaluations consist of runoff scenarios based on recent payment activity and various future payout decay assumptions. The assumptions include published research on industry payout curves as well as reasonable alternative assumptions selected by Employers Mutual's actuaries. Company and industry survival ratios are also monitored to assist in validating assumptions underlying the payout scenarios.
Settlement expense reserves (other than for asbestos and environmental claims) are established by applying actuarially derived “settlement expense factors” to the loss reserves. The settlement expense factors are determined for each line of business on a quarterly basis through an actuarial study of historical ratios of paid expenses to paid losses. The settlement expense reserve established through this process is for all accident years combined, and the total is allocated to the various accident years proportional to the loss reserves.
14
Reinsurance
Reserves for the HORAD book of business are reviewed quarterly. The latest five contract years are typically reviewed during each of the first three quarters of any given year; while all contract years 1988 and subsequent are reviewed during the fourth quarter (detailed contract year information is not available prior to 1988). Accident years 1981-1987 are reviewed separately during the fourth quarter.
Premium, loss and settlement expense data is generally reported by ceding companies on a contract year basis; however, some loss and settlement expense data is reported on an accident year basis. Some ceding companies also report IBNR loss reserves. The reinsurance segment books these IBNR loss reserve amounts, and then deducts them from the indicated IBNR loss reserves calculated by Employers Mutual’s actuaries. The reinsurance segment may also book “additional case reserves” for ceding companies whose reported case reserves related to certain claims are believed to be less than adequate.
Using the reported data, excluding the reported IBNR loss reserves, Employers Mutual's actuaries develop an indicated ultimate loss, and corresponding IBNR loss reserve, by type of contract (property/casualty/excess/pro rata/multi-line) and by contract year. The actuaries employ the standard paid and incurred chain ladder (triangle) development methods and the Bornheutter-Furgeson "expected loss ratio" method to produce the indicated ultimate loss, and corresponding IBNR loss reserves. In addition, a loss ratio approach and judgment are applied to a few minor contract types which represent an insignificant portion of the total book of business.
For the major contract types, the reinsurance segment uses its own paid and incurred development data aggregated on a contract year basis. The reason for aggregating by contract year, rather than accident year, is to ensure an accurate aggregation, as ceding companies have not always provided sufficient detail to determine the proper accident year assignment. In addition, the reinsurance segment uses data from the Reinsurance Association of America (RAA) to assist in estimating reserve development for casualty excess contracts.
The "expected loss ratios" used in the Bornheutter-Ferguson method for the current contract year are calculated by contract type during the first quarter. Once established, the "expected loss ratios" for the various contract years are generally not revised. The "expected loss ratios" are calculated by dividing the "projected ultimate losses" for contract years having at least five years of maturity by the contract-year earned premium brought to the current rate-level. The current rate-level loss ratios are then trended to the current contract period. In addition, when large accounts are first written, there is generally some underwriting or reserving data available from which an "expected loss ratio" may be determined.
After establishing the ultimate loss, and corresponding IBNR loss reserve, by treaty type and contract year, an allocation must be made in order to book the IBNR loss reserve by accident year and line-of-business. This is accomplished by a historical study of the ultimate accident year distribution of reported losses and reported loss types (for those treaty types which may cover multiple lines of business). For the latest contract years, consideration is also given to the distribution of the contract effective dates and the expected earnings pattern of the contract types (occurrence vs. risks attaching contracts).
The reinsurance segment also books EBNR premiums on pro rata contracts, and accrued reinstatement premiums on catastrophe excess contracts. EBNR premium is estimated by applying selected earnings patterns to the expected ultimate contract year premium associated with each individual pro rata account, and netting the reported-to-date amount from the estimated earned-to-date amount. The account level earnings patterns are selected from an examination of all available information regarding distribution of risk attachment dates during the contract period and a review of each ceding company's historical reporting patterns. It is important to note that whenever EBNR premium is booked, there is an associated IBNR loss reserve established as well. Accrued reinstatement premiums are estimated by applying a historically selected ratio of "ultimate reinstatement premium to incurred losses" to the "expected ultimate" incurred catastrophe loss by contract year. Netting the reported reinstatement premiums-to-date from this ultimate produces the booked accrual.
Reported loss and IBNR loss reserves associated with the MRB book of business are established by that entity’s management, and booked by the reinsurance segment on a monthly basis. MRB claims files are audited annually by the member companies’ reinsurance claim departments, and the member company actuarial departments perform an annual reserve adequacy review. The reinsurance segment estimates and books a relatively small IBNR loss reserve and EBNR premium amount to account for a one month lag in reporting. The booking of the lag IBNR loss reserve may be suspended during periods when actuarial reviews indicate MRB's carried reserves are more than adequate to cover its liabilities.
15
Reserve Evaluation and Determination of Management’s Best Estimate of Overall Liability
Property and casualty insurance
Prior to the end of each quarter, Employers Mutual's actuaries utilize standard loss development methodologies to evaluate the adequacy of the previous quarter’s carried reserves. The actuaries employ the use of the standard paid and incurred chain ladder (triangle) development methods to perform this evaluation. The actuaries organize the paid and incurred losses on a “rolling” accident year basis, meaning that at any particular quarter-end, an accident year is defined by the most recent four quarters and will, therefore, cross calendar years except at year-end. Using five different averaging periods to compute loss development factors, five separate point estimates of indicated reserves are developed for each paid and incurred triangle. The high and low point estimates derived from this process establish the actuarial range of reasonable reserves. An additional benchmark, referred to as the actuarial central estimate, is determined by calculating a separate point estimate using “selected paid” and “selected incurred” estimates. This actuarial central estimate is deemed to be an action point in the evaluation of the property and casualty insurance segment's carried reserves. If the prior quarter’s total carried reserves fall below this threshold, the actuarial department will recommend that an adjustment be made to the current quarter’s carried reserves.
A separate evaluation of the prior quarter’s case and bulk case loss reserves is also performed each quarter. The evaluation methodology utilized is similar to the review performed on total carried reserves, except that the accident year triangles include development on reported claims only.
The determination of management’s best estimate of the property and casualty insurance segment's overall liability at each quarterly reporting date begins with the actuarial department performing a comparison of the prior quarter’s total carried reserves to the actuarial range of reasonable reserves and actuarial central estimate (as described in the preceding paragraph) for such prior quarter. Generally, if the prior quarter’s carried reserves are within a few percentage points of, but not below, the actuarial central estimate, and if the separate review of the case and bulk case loss reserves indicates that those reserves are within a few percentage points of the actuarial central estimate for the case reserves, the actuarial department will report that it is comfortable with the current quarter’s carried reserves, and the current quarter’s total carried reserves are deemed to be management’s best estimate of the property and casualty insurance segment's overall liability. If the prior quarter’s total carried reserves fall outside of that quarter’s actuarial range of reasonable reserves, or if the review of the previous quarter’s total carried reserve and/or case and bulk case loss reserves indicates that those reserves are not within a few percentage points of their respective actuarial central estimate, the actuarial department will recommend that an adjustment be made to the current quarter’s total carried reserves. Management reviews all recommendations submitted by the actuarial department and considers such recommendations in the determination of its best estimate of overall liability.
Reinsurance
The IBNR loss reserves for the HORAD book of business are determined and booked each quarter along with the ceding companies’ reported losses/reserves. The methodologies used to establish the IBNR loss reserves produce a range of indicated reserves for each contract type and contract year. Employers Mutual’s actuaries examine the reasonableness of each range, and then select a point estimate within those ranges. For the more recent contract years, the selected IBNR loss reserve estimate tends to be higher in the range, typically in the fourth quartile, due to the considerable uncertainty associated with these immature contract years. The IBNR loss reserve selected for the more mature contract years tends to be at, or slightly above, the midpoint of the range of reasonable reserves. In addition to the actuarially determined reserves, an additional IBNR loss reserve is established when large catastrophic events occur, based on an examination of impacted contracts/exposures and reported industry-wide loss estimates. In aggregate, the IBNR loss reserve selected using these methods and procedures, combined with reserves reported by the ceding companies, becomes management’s best estimate of the reinsurance segment’s overall liability.
The reported loss and IBNR loss reserves associated with the MRB book of business are established by that entity’s management, and the reinsurance segment books its share of those amounts on a monthly basis. The Company also estimates and books a relatively small IBNR loss reserve and EBNR premium accrual to the current accident year, to account for a one month lag in reporting. The booking of the lag IBNR loss reserve may be suspended during periods when actuarial reviews indicate MRB's carried reserves are more than adequate to cover its liabilities.
16
Reserve Development
Property and casualty insurance
There is an inherent amount of uncertainty involved in the establishment of insurance liabilities. This uncertainty is greatest in the current and more recent accident years because a smaller percentage of the expected ultimate claims have been reported, adjusted and settled compared to more mature accident years. For this reason, carried reserves for these accident years reflect prudently conservative assumptions. As the carried reserves for these accident years run off, the overall expectation is that, more often than not, favorable development will occur. However, there is also the possibility that the ultimate settlement of liabilities associated with these accident years will show adverse development, and such adverse development could be substantial.
As previously noted, the property and casualty insurance segment's bulk reserves (formula IBNR loss reserve, bulk case loss reserve and settlement expense reserve) are initially established for all accident years combined, and the total is then allocated to the various accident years. During this allocation process, a portion of the total bulk reserves may be reallocated from the current accident year to prior accident years, or from prior accident years to the current accident year, to achieve the actuarial department's desired reserve level by accident year. When reserves are moved to, or from, prior accident years, the change is reported as development on prior years' reserves. However, this type of development is "mechanical" in nature, and does not have an impact on earnings. This is due to the fact that such development is simply a mathematical by-product of the mechanical process used to reallocate bulk reserves to the various accident years. Earnings are only impacted by changes in the total amount of carried reserves.
Reinsurance
There are inherent uncertainties involved in establishing reserves for assumed reinsurance business. Such uncertainties include the fact that a reinsurance company generally has less knowledge than the ceding companies about the underlying book of business and the ceding companies' reserving practices. For this reason, the carried reserves for the reinsurance segment are generally in the upper quartile of the range of actuarial reserve indications. As the carried reserves run off, the overall expectation is that, more often than not, favorable development will occur. However, there is also the possibility that the ultimate settlement of liabilities will show adverse development, and such adverse development could be substantial.

17
The following table sets forth a reconciliation of beginning and ending reserves for losses and settlement expenses of the property and casualty insurance subsidiaries and the reinsurance subsidiary. Amounts presented are on a net basis, with a reconciliation of beginning and ending reserves to the gross amounts presented in the consolidated financial statements.
Year ended December 31,($ in thousands) 2015 2014 2013Gross reserves at beginning of year $ 661,309 $ 610,181 $ 583,097Re-valuation due to foreign currency exchange rates (2,061) 333 (2)Less ceded reserves at beginning of year 28,253 30,118 31,390Net reserves at beginning of year 635,117 579,730 551,709
Incurred losses and settlement expenses related to:Current year 405,850 406,266 346,072Prior years (35,114) (20,792) (12,785)
Total incurred losses and settlement expenses 370,736 385,474 333,287
Paid losses and settlement expenses related to:Current year 154,958 162,905 137,998Prior years 193,123 167,182 167,268
Total paid losses and settlement expenses 348,081 330,087 305,266
Net reserves at end of year 657,772 635,117 579,730Plus ceded reserves at end of year 23,477 28,253 30,118Re-valuation due to foreign currency exchange rates (2,475) (2,061) 333Gross reserves at end of year $ 678,774 $ 661,309 $ 610,181
The following table presents the reported amounts of favorable development experienced on prior years’ reserves and the portion of the reported development amounts that resulted solely from changes in the allocation of bulk reserves between the current and prior accident years (no impact on earnings). The result is an approximation of the implied amount of favorable development that had an impact on earnings.
Year ended December 31,($ in thousands) 2015 2014 2013Reported amount of favorable development experienced on prior
years' reserves $ (35,114) $ (20,792) $ (12,785)Adjustment for (adverse) favorable development included in the
reported development amount that had no impact on earnings (618) 2,151 6,526Approximation of the implied amount of favorable development that
had an impact on earnings $ (35,732) $ (18,641) $ (6,259)
Following is a detailed analysis of the development the Company has experienced on its prior accident years’ reserves during the past three years. Care should be exercised when attempting to analyze the financial impact of the reported development amounts because, as previously noted, 1) the overall expectation is that, more often than not, favorable development will occur as the prior accident years’ reserves run off, and 2) development on prior years’ reserves resulting solely from changes in the allocation of bulk reserves between the current and prior accident years does not have an impact on earnings.
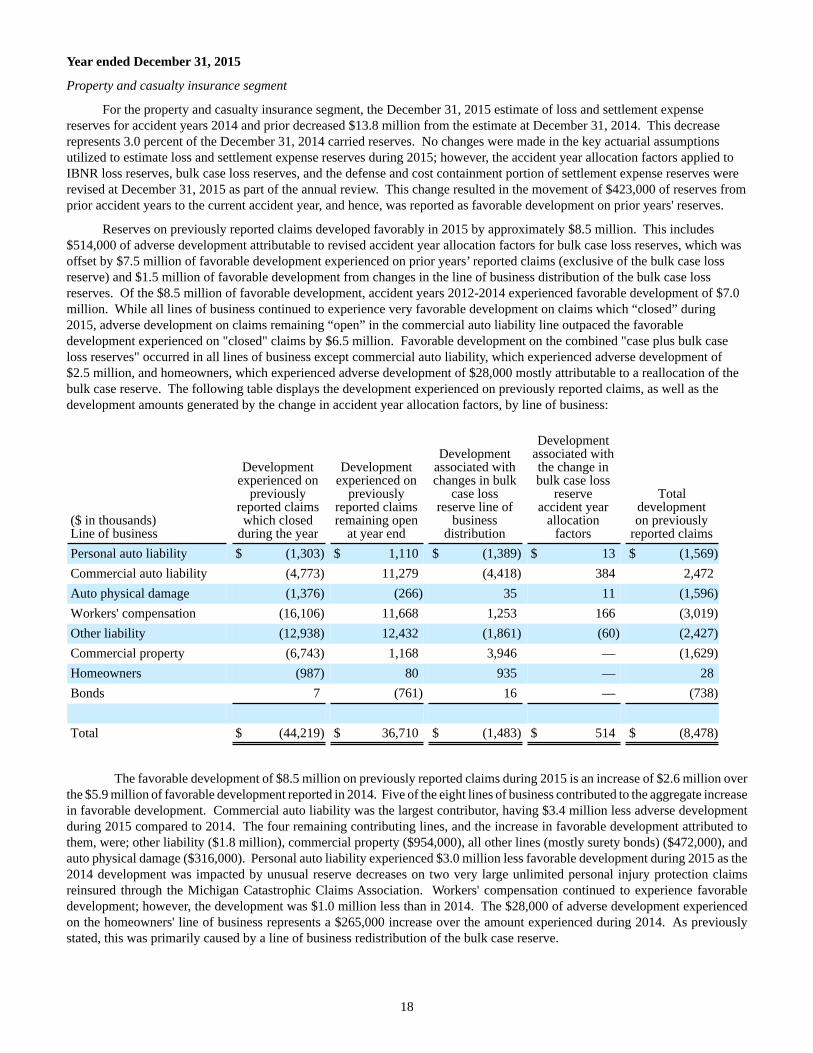
18
Year ended December 31, 2015
Property and casualty insurance segment
For the property and casualty insurance segment, the December 31, 2015 estimate of loss and settlement expense reserves for accident years 2014 and prior decreased $13.8 million from the estimate at December 31, 2014. This decrease represents 3.0 percent of the December 31, 2014 carried reserves. No changes were made in the key actuarial assumptions utilized to estimate loss and settlement expense reserves during 2015; however, the accident year allocation factors applied to IBNR loss reserves, bulk case loss reserves, and the defense and cost containment portion of settlement expense reserves were revised at December 31, 2015 as part of the annual review. This change resulted in the movement of $423,000 of reserves from prior accident years to the current accident year, and hence, was reported as favorable development on prior years' reserves.
Reserves on previously reported claims developed favorably in 2015 by approximately $8.5 million. This includes $514,000 of adverse development attributable to revised accident year allocation factors for bulk case loss reserves, which was offset by $7.5 million of favorable development experienced on prior years’ reported claims (exclusive of the bulk case loss reserve) and $1.5 million of favorable development from changes in the line of business distribution of the bulk case loss reserves. Of the $8.5 million of favorable development, accident years 2012-2014 experienced favorable development of $7.0 million. While all lines of business continued to experience very favorable development on claims which “closed” during 2015, adverse development on claims remaining “open” in the commercial auto liability line outpaced the favorable development experienced on "closed" claims by $6.5 million. Favorable development on the combined "case plus bulk case loss reserves" occurred in all lines of business except commercial auto liability, which experienced adverse development of $2.5 million, and homeowners, which experienced adverse development of $28,000 mostly attributable to a reallocation of the bulk case reserve. The following table displays the development experienced on previously reported claims, as well as the development amounts generated by the change in accident year allocation factors, by line of business:
($ in thousands)Line of business
Developmentexperienced on
previouslyreported claimswhich closed
during the year
Developmentexperienced on
previouslyreported claimsremaining open
at year end
Developmentassociated withchanges in bulk
case lossreserve line of
businessdistribution
Developmentassociated withthe change inbulk case loss
reserveaccident year
allocationfactors
Totaldevelopmenton previously
reported claimsPersonal auto liability $ (1,303) $ 1,110 $ (1,389) $ 13 $ (1,569)Commercial auto liability (4,773) 11,279 (4,418) 384 2,472Auto physical damage (1,376) (266) 35 11 (1,596)Workers' compensation (16,106) 11,668 1,253 166 (3,019)Other liability (12,938) 12,432 (1,861) (60) (2,427)Commercial property (6,743) 1,168 3,946 — (1,629)Homeowners (987) 80 935 — 28Bonds 7 (761) 16 — (738)
Total $ (44,219) $ 36,710 $ (1,483) $ 514 $ (8,478)
The favorable development of $8.5 million on previously reported claims during 2015 is an increase of $2.6 million over the $5.9 million of favorable development reported in 2014. Five of the eight lines of business contributed to the aggregate increase in favorable development. Commercial auto liability was the largest contributor, having $3.4 million less adverse development during 2015 compared to 2014. The four remaining contributing lines, and the increase in favorable development attributed to them, were; other liability ($1.8 million), commercial property ($954,000), all other lines (mostly surety bonds) ($472,000), and auto physical damage ($316,000). Personal auto liability experienced $3.0 million less favorable development during 2015 as the 2014 development was impacted by unusual reserve decreases on two very large unlimited personal injury protection claims reinsured through the Michigan Catastrophic Claims Association. Workers' compensation continued to experience favorable development; however, the development was $1.0 million less than in 2014. The $28,000 of adverse development experienced on the homeowners' line of business represents a $265,000 increase over the amount experienced during 2014. As previously stated, this was primarily caused by a line of business redistribution of the bulk case reserve.
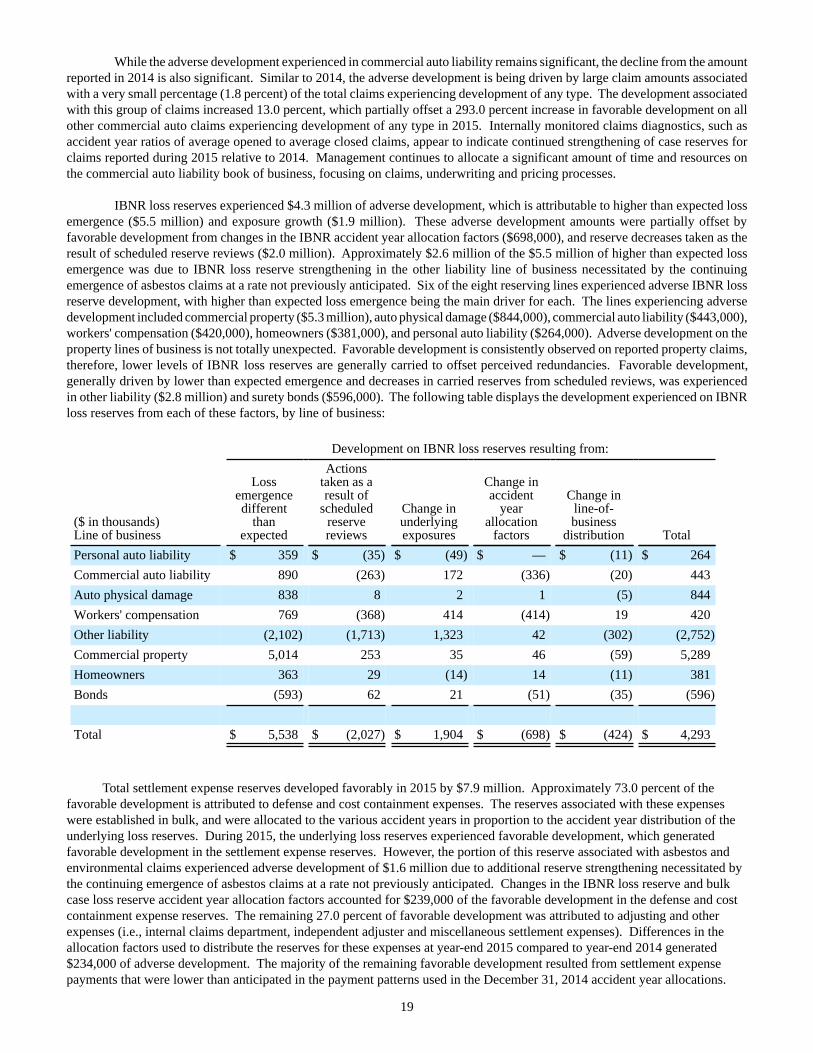
19
While the adverse development experienced in commercial auto liability remains significant, the decline from the amount reported in 2014 is also significant. Similar to 2014, the adverse development is being driven by large claim amounts associated with a very small percentage (1.8 percent) of the total claims experiencing development of any type. The development associated with this group of claims increased 13.0 percent, which partially offset a 293.0 percent increase in favorable development on all other commercial auto claims experiencing development of any type in 2015. Internally monitored claims diagnostics, such as accident year ratios of average opened to average closed claims, appear to indicate continued strengthening of case reserves for claims reported during 2015 relative to 2014. Management continues to allocate a significant amount of time and resources on the commercial auto liability book of business, focusing on claims, underwriting and pricing processes.
IBNR loss reserves experienced $4.3 million of adverse development, which is attributable to higher than expected loss emergence ($5.5 million) and exposure growth ($1.9 million). These adverse development amounts were partially offset by favorable development from changes in the IBNR accident year allocation factors ($698,000), and reserve decreases taken as the result of scheduled reserve reviews ($2.0 million). Approximately $2.6 million of the $5.5 million of higher than expected loss emergence was due to IBNR loss reserve strengthening in the other liability line of business necessitated by the continuing emergence of asbestos claims at a rate not previously anticipated. Six of the eight reserving lines experienced adverse IBNR loss reserve development, with higher than expected loss emergence being the main driver for each. The lines experiencing adverse development included commercial property ($5.3 million), auto physical damage ($844,000), commercial auto liability ($443,000), workers' compensation ($420,000), homeowners ($381,000), and personal auto liability ($264,000). Adverse development on the property lines of business is not totally unexpected. Favorable development is consistently observed on reported property claims, therefore, lower levels of IBNR loss reserves are generally carried to offset perceived redundancies. Favorable development, generally driven by lower than expected emergence and decreases in carried reserves from scheduled reviews, was experienced in other liability ($2.8 million) and surety bonds ($596,000). The following table displays the development experienced on IBNR loss reserves from each of these factors, by line of business:
Development on IBNR loss reserves resulting from:
($ in thousands)Line of business
Lossemergencedifferent
thanexpected
Actionstaken as aresult of
scheduledreservereviews
Change inunderlyingexposures
Change inaccident
yearallocation
factors
Change inline-of-business
distribution TotalPersonal auto liability $ 359 $ (35) $ (49) $ — $ (11) $ 264Commercial auto liability 890 (263) 172 (336) (20) 443Auto physical damage 838 8 2 1 (5) 844Workers' compensation 769 (368) 414 (414) 19 420Other liability (2,102) (1,713) 1,323 42 (302) (2,752)Commercial property 5,014 253 35 46 (59) 5,289Homeowners 363 29 (14) 14 (11) 381Bonds (593) 62 21 (51) (35) (596)
Total $ 5,538 $ (2,027) $ 1,904 $ (698) $ (424) $ 4,293
Total settlement expense reserves developed favorably in 2015 by $7.9 million. Approximately 73.0 percent of the favorable development is attributed to defense and cost containment expenses. The reserves associated with these expenses were established in bulk, and were allocated to the various accident years in proportion to the accident year distribution of the underlying loss reserves. During 2015, the underlying loss reserves experienced favorable development, which generated favorable development in the settlement expense reserves. However, the portion of this reserve associated with asbestos and environmental claims experienced adverse development of $1.6 million due to additional reserve strengthening necessitated by the continuing emergence of asbestos claims at a rate not previously anticipated. Changes in the IBNR loss reserve and bulk case loss reserve accident year allocation factors accounted for $239,000 of the favorable development in the defense and cost containment expense reserves. The remaining 27.0 percent of favorable development was attributed to adjusting and other expenses (i.e., internal claims department, independent adjuster and miscellaneous settlement expenses). Differences in the allocation factors used to distribute the reserves for these expenses at year-end 2015 compared to year-end 2014 generated $234,000 of adverse development. The majority of the remaining favorable development resulted from settlement expense payments that were lower than anticipated in the payment patterns used in the December 31, 2014 accident year allocations.
20
Prior accident years’ reserves for non-voluntary assumed business developed favorably by $464,000, attributed primarily to assigned risk pools.
The above results reflect prior accident year reserve development on a direct and assumed basis. During 2015, ceded losses and settlement expenses for prior accident years increased $1.6 million. This increase in reinsurance recoveries is reported as favorable development.
Reinsurance segment
For the reinsurance segment, the December 31, 2015 estimate of loss and settlement expense reserves for accident years 2014 and prior decreased $21.3 million from the estimate at December 31, 2014. This decrease represents 10.8 percent of the December 31, 2014 carried reserves. No changes were made in the key actuarial assumptions utilized to estimate loss and settlement expense reserves during 2015; however, the accident year allocation factors applied to IBNR loss reserves were revised during 2015. This change resulted in the movement of $1.0 million of reserves from the current accident year to prior accident years, and hence, was reported as adverse development on prior years' reserves. The HORAD portion of the book experienced favorable development of approximately $18.1 million, while MRB experienced favorable development of approximately $3.2 million.
The vast majority of HORAD’s favorable development occurred in four contract types; ocean marine pro rata ($8.5 million), casualty excess ($5.1 million), per risk excess ($3.3 million), and property pro rata with wind ($2.0 million). Approximately 15.0 percent of the favorable development experienced in ocean marine pro rata is attributable to a large negative premium adjustment (for contracts effective during the three previous years) reported by the ceding company for the offshore energy and liability proportional account, which reduced the amount of IBNR loss reserves carried for those years. In addition, as this particular set of contracts has matured, carried IBNR loss reserves have declined because emerged loss experience has been better than expected. The development in the remaining contract types experiencing favorable development is attributable to the reinsurance segment's prudently conservative reserving approach, and reflects a reduction in carried IBNR loss reserves that could no longer be justified. Three contract types experienced adverse development; property/casualty global pro rata ($3.0 million), property/casualty global excess ($389,000), and crop/hail pro rata ($86,000). For the property/casualty global contracts, increases in cedants’ reported losses exceeded the decrease in IBNR loss reserves. Significant IBNR loss reserves remain for these contract types, so the possibility for improved profitability on prior accident years still exists.
Historically, the MRB book of business has experienced very little development on prior years' loss and settlement expense reserves. The Company’s actuarial reviews of MRB's reported reserves have consistently indicated that those reserves challenge the upper level of the range of reasonable reserves. To address this issue, a negative bulk IBNR loss reserve was established in 2015 for this business. This negative IBNR loss reserve is responsible for approximately $3.0 million of the $3.2 million of favorable development reported on prior years’ reserves.
No changes were made in the "expected loss ratios" utilized for prior contract years. The "expected loss ratios" utilized for the 2015 contract year were based on an extensive actuarial analysis of trended historic ultimate loss ratios based on current-level earned premiums. Where applicable, new contract loss information or loss histories were also incorporated into the "expected loss ratio" selection process. Compared to the 2014 contract year selections, the 2015 contract year expected loss ratios for the per risk excess and casualty excess lines of business increased by 7.5 percentage points and 2.5 percentage points, respectively. The 2015 contract year expected loss ratio for the ocean marine pro rata line of business decreased 5.5 percentage points due to the favorable experience that has occurred during the previous three contract years.
Year ended December 31, 2014
Property and casualty insurance segment
For the property and casualty insurance segment, the December 31, 2014 estimate of loss and settlement expense reserves for accident years 2013 and prior decreased $8.1 million from the estimate at December 31, 2013. This decrease represented 1.9 percent of the December 31, 2013 carried reserves. No changes were made in the key actuarial assumptions utilized to estimate loss and settlement expense reserves during 2014; however, the accident year allocation factors applied to IBNR loss reserves, bulk case loss reserves, and the defense and cost containment portion of settlement expense reserves were revised at December 31, 2014 as part of the annual review. This change resulted in the movement of $2.2 million of reserves from prior accident years to the current accident year, and hence, was reported as favorable development on prior years' reserves.
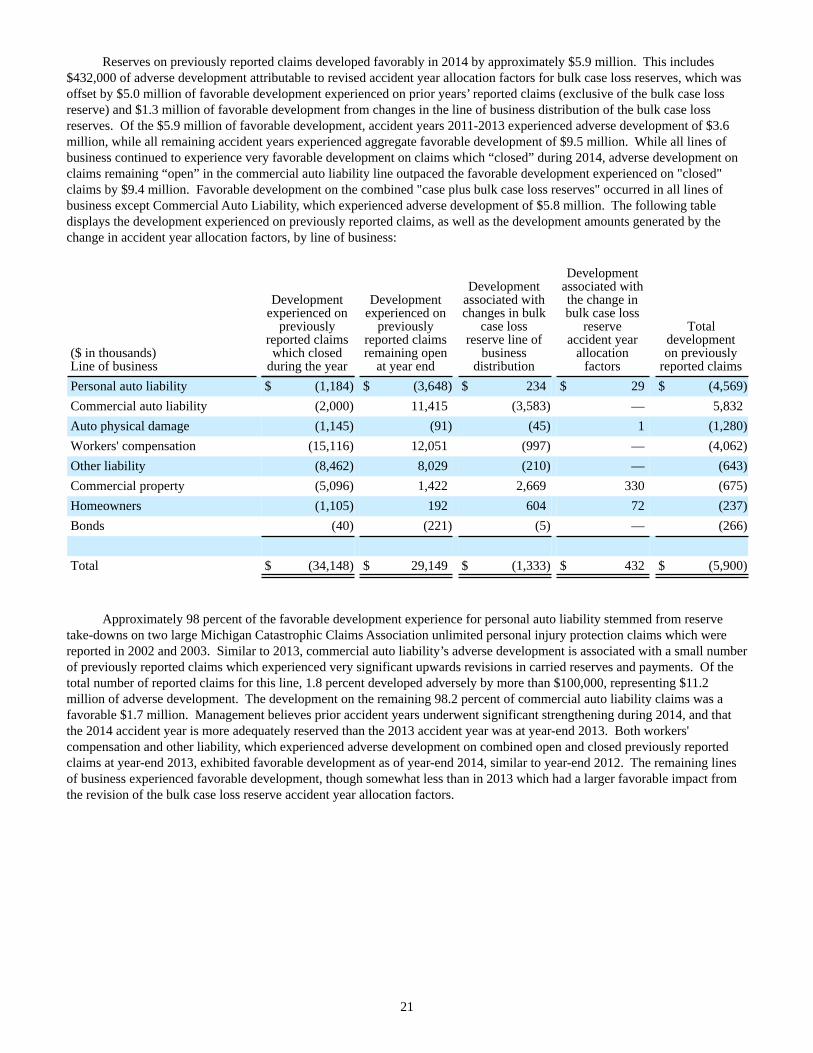
21
Reserves on previously reported claims developed favorably in 2014 by approximately $5.9 million. This includes $432,000 of adverse development attributable to revised accident year allocation factors for bulk case loss reserves, which was offset by $5.0 million of favorable development experienced on prior years’ reported claims (exclusive of the bulk case loss reserve) and $1.3 million of favorable development from changes in the line of business distribution of the bulk case loss reserves. Of the $5.9 million of favorable development, accident years 2011-2013 experienced adverse development of $3.6 million, while all remaining accident years experienced aggregate favorable development of $9.5 million. While all lines of business continued to experience very favorable development on claims which “closed” during 2014, adverse development on claims remaining “open” in the commercial auto liability line outpaced the favorable development experienced on "closed" claims by $9.4 million. Favorable development on the combined "case plus bulk case loss reserves" occurred in all lines of business except Commercial Auto Liability, which experienced adverse development of $5.8 million. The following table displays the development experienced on previously reported claims, as well as the development amounts generated by the change in accident year allocation factors, by line of business:
($ in thousands)Line of business
Developmentexperienced on
previouslyreported claimswhich closed
during the year
Developmentexperienced on
previouslyreported claimsremaining open
at year end
Developmentassociated withchanges in bulk
case lossreserve line of
businessdistribution
Developmentassociated withthe change inbulk case loss
reserveaccident year
allocationfactors
Totaldevelopmenton previously
reported claimsPersonal auto liability $ (1,184) $ (3,648) $ 234 $ 29 $ (4,569)Commercial auto liability (2,000) 11,415 (3,583) — 5,832Auto physical damage (1,145) (91) (45) 1 (1,280)Workers' compensation (15,116) 12,051 (997) — (4,062)Other liability (8,462) 8,029 (210) — (643)Commercial property (5,096) 1,422 2,669 330 (675)Homeowners (1,105) 192 604 72 (237)Bonds (40) (221) (5) — (266)
Total $ (34,148) $ 29,149 $ (1,333) $ 432 $ (5,900)
Approximately 98 percent of the favorable development experience for personal auto liability stemmed from reserve take-downs on two large Michigan Catastrophic Claims Association unlimited personal injury protection claims which were reported in 2002 and 2003. Similar to 2013, commercial auto liability’s adverse development is associated with a small number of previously reported claims which experienced very significant upwards revisions in carried reserves and payments. Of the total number of reported claims for this line, 1.8 percent developed adversely by more than $100,000, representing $11.2 million of adverse development. The development on the remaining 98.2 percent of commercial auto liability claims was a favorable $1.7 million. Management believes prior accident years underwent significant strengthening during 2014, and that the 2014 accident year is more adequately reserved than the 2013 accident year was at year-end 2013. Both workers' compensation and other liability, which experienced adverse development on combined open and closed previously reported claims at year-end 2013, exhibited favorable development as of year-end 2014, similar to year-end 2012. The remaining lines of business experienced favorable development, though somewhat less than in 2013 which had a larger favorable impact from the revision of the bulk case loss reserve accident year allocation factors.
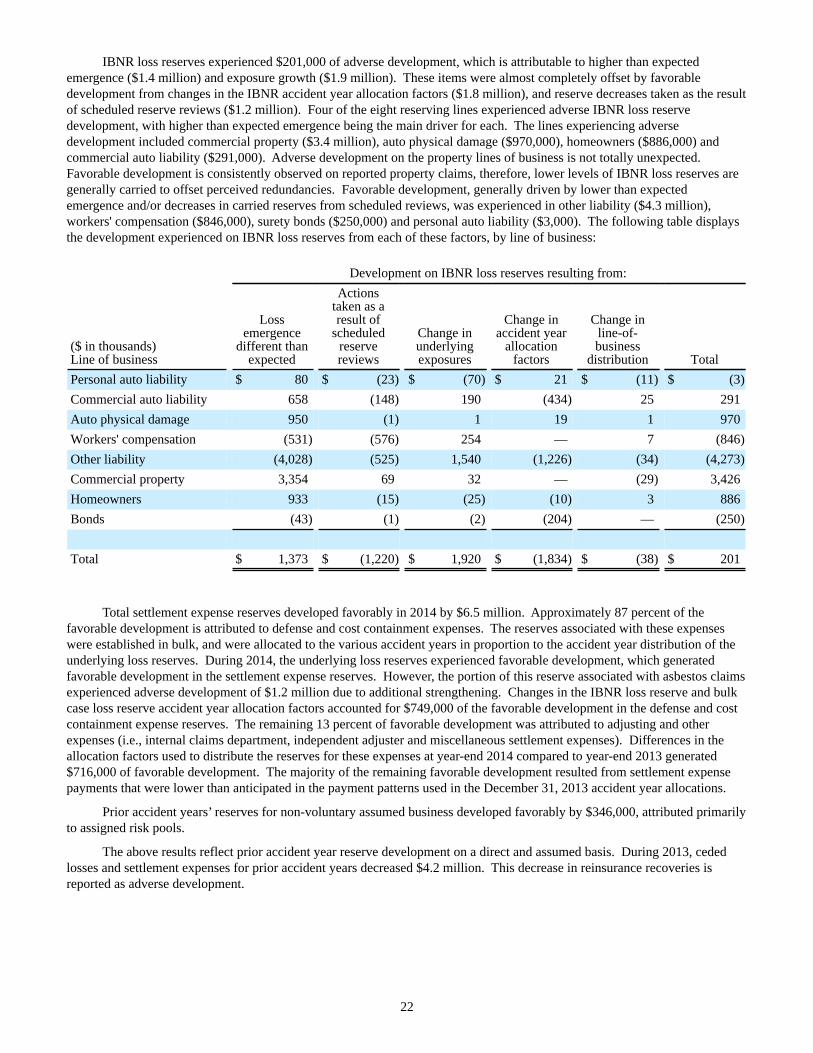
22
IBNR loss reserves experienced $201,000 of adverse development, which is attributable to higher than expected emergence ($1.4 million) and exposure growth ($1.9 million). These items were almost completely offset by favorable development from changes in the IBNR accident year allocation factors ($1.8 million), and reserve decreases taken as the result of scheduled reserve reviews ($1.2 million). Four of the eight reserving lines experienced adverse IBNR loss reserve development, with higher than expected emergence being the main driver for each. The lines experiencing adverse development included commercial property ($3.4 million), auto physical damage ($970,000), homeowners ($886,000) and commercial auto liability ($291,000). Adverse development on the property lines of business is not totally unexpected. Favorable development is consistently observed on reported property claims, therefore, lower levels of IBNR loss reserves are generally carried to offset perceived redundancies. Favorable development, generally driven by lower than expected emergence and/or decreases in carried reserves from scheduled reviews, was experienced in other liability ($4.3 million), workers' compensation ($846,000), surety bonds ($250,000) and personal auto liability ($3,000). The following table displays the development experienced on IBNR loss reserves from each of these factors, by line of business:
Development on IBNR loss reserves resulting from:
($ in thousands)Line of business
Lossemergence
different thanexpected
Actionstaken as aresult of
scheduledreservereviews
Change inunderlyingexposures
Change inaccident year
allocationfactors
Change inline-of-business
distribution TotalPersonal auto liability $ 80 $ (23) $ (70) $ 21 $ (11) $ (3)Commercial auto liability 658 (148) 190 (434) 25 291Auto physical damage 950 (1) 1 19 1 970Workers' compensation (531) (576) 254 — 7 (846)Other liability (4,028) (525) 1,540 (1,226) (34) (4,273)Commercial property 3,354 69 32 — (29) 3,426Homeowners 933 (15) (25) (10) 3 886Bonds (43) (1) (2) (204) — (250)
Total $ 1,373 $ (1,220) $ 1,920 $ (1,834) $ (38) $ 201
Total settlement expense reserves developed favorably in 2014 by $6.5 million. Approximately 87 percent of the favorable development is attributed to defense and cost containment expenses. The reserves associated with these expenses were established in bulk, and were allocated to the various accident years in proportion to the accident year distribution of the underlying loss reserves. During 2014, the underlying loss reserves experienced favorable development, which generated favorable development in the settlement expense reserves. However, the portion of this reserve associated with asbestos claims experienced adverse development of $1.2 million due to additional strengthening. Changes in the IBNR loss reserve and bulk case loss reserve accident year allocation factors accounted for $749,000 of the favorable development in the defense and cost containment expense reserves. The remaining 13 percent of favorable development was attributed to adjusting and other expenses (i.e., internal claims department, independent adjuster and miscellaneous settlement expenses). Differences in the allocation factors used to distribute the reserves for these expenses at year-end 2014 compared to year-end 2013 generated $716,000 of favorable development. The majority of the remaining favorable development resulted from settlement expense payments that were lower than anticipated in the payment patterns used in the December 31, 2013 accident year allocations.
Prior accident years’ reserves for non-voluntary assumed business developed favorably by $346,000, attributed primarily to assigned risk pools.
The above results reflect prior accident year reserve development on a direct and assumed basis. During 2013, ceded losses and settlement expenses for prior accident years decreased $4.2 million. This decrease in reinsurance recoveries is reported as adverse development.
23
Reinsurance segment
For the reinsurance segment, the December 31, 2014 estimate of loss and settlement expense reserves for accident years 2013 and prior decreased $12.7 million from the estimate at December 31, 2013. This decrease represented 6.9 percent of the December 31, 2013 carried reserves. The HORAD portion of the book experienced favorable development of approximately $11.8 million, while MRB experienced favorable development of approximately $833,000. MRB accident year 2013 experienced adverse development of $277,000. This adverse development was more than offset by favorable development on accident years 2011 ($237,000) and 2009 ($638,000), plus favorable development on most of the remaining prior accident years. For the HORAD book of business, accident years 2010 and prior accounted for approximately 80 percent of the favorable development, with less significant amounts of favorable development occurring in most of the remaining prior accident years. Development for accident year 2013 was an adverse $1.8 million due to reserve strengthening. The increase in favorable development in the HORAD book of business in 2014 compared to 2013 was greater than expected, and was driven mostly by a reduction of IBNR loss reserves for accident years 2010 and prior because the amount previously carried was no longer indicated in the actuarial analysis.
No changes were made in the key actuarial assumptions utilized to estimate loss and settlement expense reserves during 2014, including the "expected loss ratios" utilized for prior contract years. The "expected loss ratios" utilized for the 2014 contract year were based on an extensive actuarial analysis of trended historic ultimate loss ratios based on current-level earned premiums. Where applicable, new contract loss information or loss histories were also incorporated into the selection process. Compared to the 2013 contract year selections, the property per risk "expected loss ratios" increased moderately. The casualty excess and property/casualty global pro rata "expected loss ratios" decreased slightly from the 2013 selections.
Year ended December 31, 2013
Property and casualty insurance segment
For the property and casualty insurance segment, the December 31, 2013 estimate of loss and settlement expense reserves for accident years 2012 and prior decreased $7.3 million from the estimate at December 31, 2012. This decrease represented 1.8 percent of the December 31, 2012 carried reserves. No changes were made in the key actuarial assumptions utilized to estimate loss and settlement expense reserves during 2013; however, the accident year allocation factors applied to IBNR loss reserves, bulk case loss reserves, and the defense and cost containment portion of settlement expense reserves were revised at December 31, 2013 as part of the annual review. This change resulted in the movement of $6.5 million of reserves from prior accident years to the current accident year, and hence, was reported as favorable development on prior years’ reserves.
Reserves on previously reported claims developed favorably in 2013 by approximately $106,000. This included $2.7 million of favorable development attributable to revised accident year allocation factors for bulk case loss reserves, which offset $1.0 million of adverse development experienced on prior years’ reported claims (exclusive of the bulk case loss reserve) and $1.6 million of adverse development from increases in the bulk case loss reserve. Of the $106,000 of favorable development, accident years 2009, 2010 and 2012 experienced adverse development of $3.5 million, while all remaining accident years experienced aggregate favorable development of $3.6 million. While all lines of business continued to experience very favorable development on claims which “closed” during 2013, adverse development (exclusive of bulk case loss reserve changes or accident year reallocation impacts) on claims remaining “open” outpaced the favorable development experienced on "closed" claims in four lines of business: personal auto liability ($56,000), commercial auto liability ($6.2 million), workers compensation ($931,000) and other liability ($1.5 million). Favorable development on the combined "case plus bulk case loss reserves" occurred in five of the eight major lines of business. The lines experiencing adverse development included Personal Auto Liability ($114,000), Commercial Auto Liability ($4.6 million), and Other Liability ($2.5 million). The following table displays the development experienced on previously reported claims, as well as the development amounts generated by the change in accident year allocation factors, by line of business:
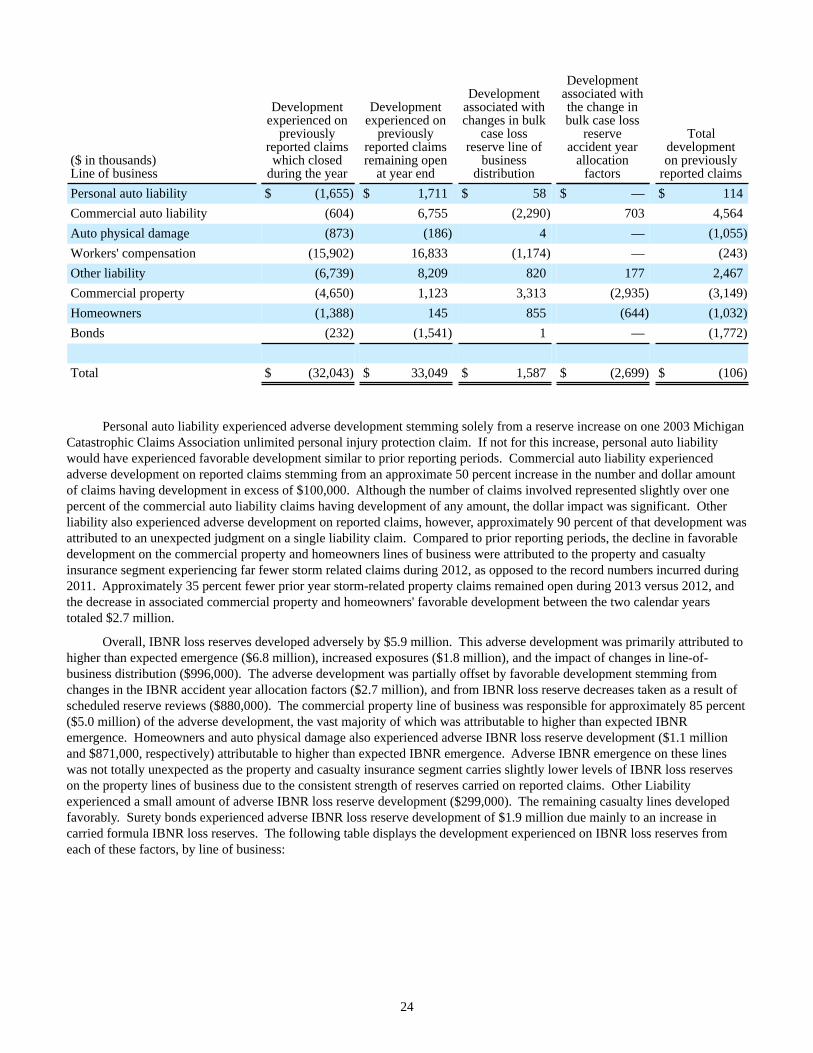
24
($ in thousands)Line of business
Developmentexperienced on
previouslyreported claimswhich closed
during the year
Developmentexperienced on
previouslyreported claimsremaining open
at year end
Developmentassociated withchanges in bulk
case lossreserve line of
businessdistribution
Developmentassociated withthe change inbulk case loss
reserveaccident year
allocationfactors
Totaldevelopmenton previously
reported claimsPersonal auto liability $ (1,655) $ 1,711 $ 58 $ — $ 114Commercial auto liability (604) 6,755 (2,290) 703 4,564Auto physical damage (873) (186) 4 — (1,055)Workers' compensation (15,902) 16,833 (1,174) — (243)Other liability (6,739) 8,209 820 177 2,467Commercial property (4,650) 1,123 3,313 (2,935) (3,149)Homeowners (1,388) 145 855 (644) (1,032)Bonds (232) (1,541) 1 — (1,772)
Total $ (32,043) $ 33,049 $ 1,587 $ (2,699) $ (106)
Personal auto liability experienced adverse development stemming solely from a reserve increase on one 2003 Michigan Catastrophic Claims Association unlimited personal injury protection claim. If not for this increase, personal auto liability would have experienced favorable development similar to prior reporting periods. Commercial auto liability experienced adverse development on reported claims stemming from an approximate 50 percent increase in the number and dollar amount of claims having development in excess of $100,000. Although the number of claims involved represented slightly over one percent of the commercial auto liability claims having development of any amount, the dollar impact was significant. Other liability also experienced adverse development on reported claims, however, approximately 90 percent of that development was attributed to an unexpected judgment on a single liability claim. Compared to prior reporting periods, the decline in favorable development on the commercial property and homeowners lines of business were attributed to the property and casualty insurance segment experiencing far fewer storm related claims during 2012, as opposed to the record numbers incurred during 2011. Approximately 35 percent fewer prior year storm-related property claims remained open during 2013 versus 2012, and the decrease in associated commercial property and homeowners' favorable development between the two calendar years totaled $2.7 million.
Overall, IBNR loss reserves developed adversely by $5.9 million. This adverse development was primarily attributed to higher than expected emergence ($6.8 million), increased exposures ($1.8 million), and the impact of changes in line-of-business distribution ($996,000). The adverse development was partially offset by favorable development stemming from changes in the IBNR accident year allocation factors ($2.7 million), and from IBNR loss reserve decreases taken as a result of scheduled reserve reviews ($880,000). The commercial property line of business was responsible for approximately 85 percent ($5.0 million) of the adverse development, the vast majority of which was attributable to higher than expected IBNR emergence. Homeowners and auto physical damage also experienced adverse IBNR loss reserve development ($1.1 million and $871,000, respectively) attributable to higher than expected IBNR emergence. Adverse IBNR emergence on these lines was not totally unexpected as the property and casualty insurance segment carries slightly lower levels of IBNR loss reserves on the property lines of business due to the consistent strength of reserves carried on reported claims. Other Liability experienced a small amount of adverse IBNR loss reserve development ($299,000). The remaining casualty lines developed favorably. Surety bonds experienced adverse IBNR loss reserve development of $1.9 million due mainly to an increase in carried formula IBNR loss reserves. The following table displays the development experienced on IBNR loss reserves from each of these factors, by line of business:
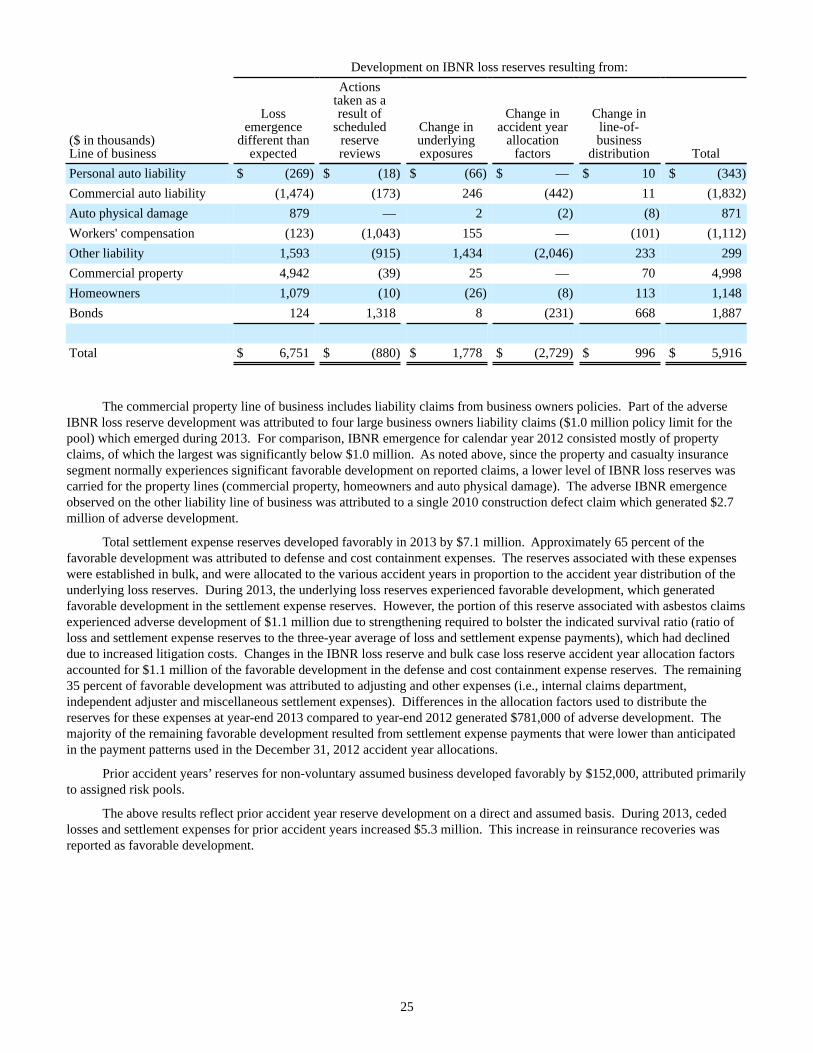
25
Development on IBNR loss reserves resulting from:
($ in thousands)Line of business
Lossemergence
different thanexpected
Actionstaken as aresult of
scheduledreservereviews
Change inunderlyingexposures
Change inaccident year
allocationfactors
Change inline-of-business
distribution TotalPersonal auto liability $ (269) $ (18) $ (66) $ — $ 10 $ (343)Commercial auto liability (1,474) (173) 246 (442) 11 (1,832)Auto physical damage 879 — 2 (2) (8) 871Workers' compensation (123) (1,043) 155 — (101) (1,112)Other liability 1,593 (915) 1,434 (2,046) 233 299Commercial property 4,942 (39) 25 — 70 4,998Homeowners 1,079 (10) (26) (8) 113 1,148Bonds 124 1,318 8 (231) 668 1,887
Total $ 6,751 $ (880) $ 1,778 $ (2,729) $ 996 $ 5,916
The commercial property line of business includes liability claims from business owners policies. Part of the adverse IBNR loss reserve development was attributed to four large business owners liability claims ($1.0 million policy limit for the pool) which emerged during 2013. For comparison, IBNR emergence for calendar year 2012 consisted mostly of property claims, of which the largest was significantly below $1.0 million. As noted above, since the property and casualty insurance segment normally experiences significant favorable development on reported claims, a lower level of IBNR loss reserves was carried for the property lines (commercial property, homeowners and auto physical damage). The adverse IBNR emergence observed on the other liability line of business was attributed to a single 2010 construction defect claim which generated $2.7 million of adverse development.
Total settlement expense reserves developed favorably in 2013 by $7.1 million. Approximately 65 percent of the favorable development was attributed to defense and cost containment expenses. The reserves associated with these expenses were established in bulk, and were allocated to the various accident years in proportion to the accident year distribution of the underlying loss reserves. During 2013, the underlying loss reserves experienced favorable development, which generated favorable development in the settlement expense reserves. However, the portion of this reserve associated with asbestos claims experienced adverse development of $1.1 million due to strengthening required to bolster the indicated survival ratio (ratio of loss and settlement expense reserves to the three-year average of loss and settlement expense payments), which had declined due to increased litigation costs. Changes in the IBNR loss reserve and bulk case loss reserve accident year allocation factors accounted for $1.1 million of the favorable development in the defense and cost containment expense reserves. The remaining 35 percent of favorable development was attributed to adjusting and other expenses (i.e., internal claims department, independent adjuster and miscellaneous settlement expenses). Differences in the allocation factors used to distribute the reserves for these expenses at year-end 2013 compared to year-end 2012 generated $781,000 of adverse development. The majority of the remaining favorable development resulted from settlement expense payments that were lower than anticipated in the payment patterns used in the December 31, 2012 accident year allocations.
Prior accident years’ reserves for non-voluntary assumed business developed favorably by $152,000, attributed primarily to assigned risk pools.
The above results reflect prior accident year reserve development on a direct and assumed basis. During 2013, ceded losses and settlement expenses for prior accident years increased $5.3 million. This increase in reinsurance recoveries was reported as favorable development.
26
Reinsurance segment
For the reinsurance segment, the December 31, 2013 estimate of loss and settlement expense reserves for accident years 2012 and prior decreased $5.5 million from the estimate at December 31, 2012. This decrease represented 3.2 percent of the December 31, 2012 carried reserves. The HORAD portion of the book experienced favorable development of approximately $5.6 million, while MRB experienced adverse development of approximately $74,000. MRB accident years 2012 and 2010 experienced adverse development of $997,000 and $110,000, respectively. The adverse development was mostly offset by favorable development on accident years 2006 ($431,000) and 2008 ($259,000), plus favorable development on most of the remaining prior accident years. For the HORAD book of business, accident years 2009-2012 accounted for approximately 85 percent of the favorable development, with less significant amounts of favorable development occurring in most of the remaining prior accident years. The decline in favorable development in the HORAD book of business in 2013 compared to 2012 was generally expected by management as the expected loss ratios used in the development methodologies applied to the 2012 contract year were somewhat lower than previous contact years due to an extensive actuarial study performed during 2012. Much of the favorable development experienced in 2013 was attributed to reported losses that were below December 2012 implicit projections for policy year 2012 in the property per risk, catastrophe excess, multi-line excess and property pro rata treaty types.
No changes were made in the key actuarial assumptions utilized to estimate loss and settlement expense reserves during 2013, including the "expected loss ratios" utilized for prior contract years. The "expected loss ratios" utilized for the 2013 contract year were based on an extensive actuarial analysis of trended historic ultimate loss ratios based on current-level earned premiums. Where applicable, new contract loss information or loss histories were also incorporated into the selection process. Compared to the 2012 contract year selections, the property excess "expected loss ratios" increased slightly, as did the ocean marine pro rata "expected loss ratios". The casualty excess "expected loss ratio" decreased very slightly. The addition of a large account with favorable loss history to the small casualty pro rata portfolio that previously existed significantly lowered the "expected loss ratio" applied to that contract type.
Calendar Year Development Table
The following table shows the calendar year development of the loss and settlement expense reserves of the property and casualty insurance subsidiaries and the reinsurance subsidiary. Amounts presented are on a net basis with (i) a reconciliation of the net loss and settlement expense reserves to the gross amounts presented in the consolidated financial statements and (ii) disclosure of the gross re-estimated loss and settlement expense reserves and the related re-estimated reinsurance receivables.
The differences between the loss and settlement expense reserves reported on a GAAP basis compared to the statutory basis are primarily due to a reclassification of certain pension and postretirement benefit reserves. For statutory reporting, a portion of the liability for pension and postretirement benefit obligations is included in the loss and settlement expense reserves. For GAAP reporting, this classification is reversed and the entire liability for pension and postretirement benefit obligations is reported on a separate line in the balance sheet. These differences, along with other smaller adjustments, are referred to in the following table as “GAAP Adjustments.”
In evaluating the table, it should be noted that each cumulative redundancy amount includes the effects of all changes in reserves for prior periods. Conditions and trends that have affected development of the liability in the past, such as a time lag in the reporting of assumed reinsurance business, the high rate of inflation associated with medical services and supplies and the reform measures implemented by several states to control administrative costs for workers’ compensation insurance, may not necessarily occur in the future. Accordingly, it may not be appropriate to project future development of reserves based on this table.
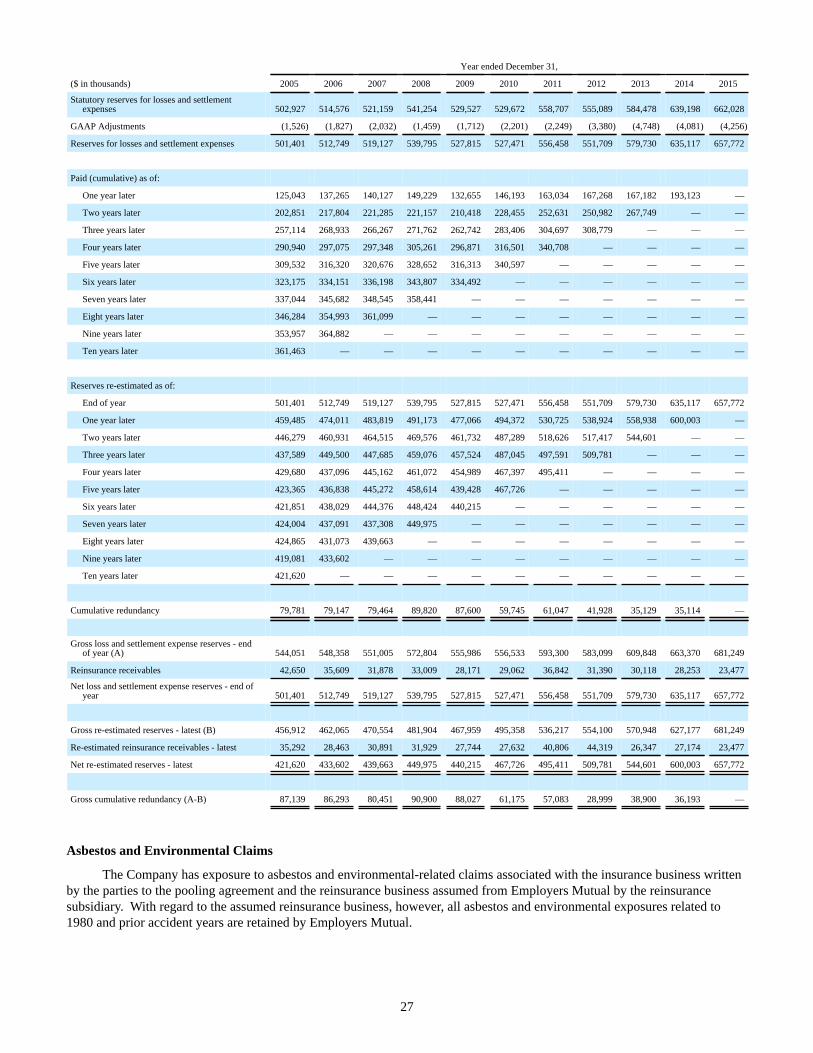
27
Year ended December 31,
($ in thousands) 2005 2006 2007 2008 2009 2010 2011 2012 2013 2014 2015
Statutory reserves for losses and settlementexpenses 502,927 514,576 521,159 541,254 529,527 529,672 558,707 555,089 584,478 639,198 662,028
GAAP Adjustments (1,526) (1,827) (2,032) (1,459) (1,712) (2,201) (2,249) (3,380) (4,748) (4,081) (4,256)
Reserves for losses and settlement expenses 501,401 512,749 519,127 539,795 527,815 527,471 556,458 551,709 579,730 635,117 657,772
Paid (cumulative) as of:
One year later 125,043 137,265 140,127 149,229 132,655 146,193 163,034 167,268 167,182 193,123 —
Two years later 202,851 217,804 221,285 221,157 210,418 228,455 252,631 250,982 267,749 — —
Three years later 257,114 268,933 266,267 271,762 262,742 283,406 304,697 308,779 — — —
Four years later 290,940 297,075 297,348 305,261 296,871 316,501 340,708 — — — —
Five years later 309,532 316,320 320,676 328,652 316,313 340,597 — — — — —
Six years later 323,175 334,151 336,198 343,807 334,492 — — — — — —
Seven years later 337,044 345,682 348,545 358,441 — — — — — — —
Eight years later 346,284 354,993 361,099 — — — — — — — —
Nine years later 353,957 364,882 — — — — — — — — —
Ten years later 361,463 — — — — — — — — — —
Reserves re-estimated as of:
End of year 501,401 512,749 519,127 539,795 527,815 527,471 556,458 551,709 579,730 635,117 657,772
One year later 459,485 474,011 483,819 491,173 477,066 494,372 530,725 538,924 558,938 600,003 —
Two years later 446,279 460,931 464,515 469,576 461,732 487,289 518,626 517,417 544,601 — —
Three years later 437,589 449,500 447,685 459,076 457,524 487,045 497,591 509,781 — — —
Four years later 429,680 437,096 445,162 461,072 454,989 467,397 495,411 — — — —
Five years later 423,365 436,838 445,272 458,614 439,428 467,726 — — — — —
Six years later 421,851 438,029 444,376 448,424 440,215 — — — — — —
Seven years later 424,004 437,091 437,308 449,975 — — — — — — —
Eight years later 424,865 431,073 439,663 — — — — — — — —
Nine years later 419,081 433,602 — — — — — — — — —
Ten years later 421,620 — — — — — — — — — —
Cumulative redundancy 79,781 79,147 79,464 89,820 87,600 59,745 61,047 41,928 35,129 35,114 —
Gross loss and settlement expense reserves - endof year (A) 544,051 548,358 551,005 572,804 555,986 556,533 593,300 583,099 609,848 663,370 681,249
Reinsurance receivables 42,650 35,609 31,878 33,009 28,171 29,062 36,842 31,390 30,118 28,253 23,477
Net loss and settlement expense reserves - end ofyear 501,401 512,749 519,127 539,795 527,815 527,471 556,458 551,709 579,730 635,117 657,772
Gross re-estimated reserves - latest (B) 456,912 462,065 470,554 481,904 467,959 495,358 536,217 554,100 570,948 627,177 681,249
Re-estimated reinsurance receivables - latest 35,292 28,463 30,891 31,929 27,744 27,632 40,806 44,319 26,347 27,174 23,477
Net re-estimated reserves - latest 421,620 433,602 439,663 449,975 440,215 467,726 495,411 509,781 544,601 600,003 657,772
Gross cumulative redundancy (A-B) 87,139 86,293 80,451 90,900 88,027 61,175 57,083 28,999 38,900 36,193 —
Asbestos and Environmental Claims
The Company has exposure to asbestos and environmental-related claims associated with the insurance business written by the parties to the pooling agreement and the reinsurance business assumed from Employers Mutual by the reinsurance subsidiary. With regard to the assumed reinsurance business, however, all asbestos and environmental exposures related to 1980 and prior accident years are retained by Employers Mutual.
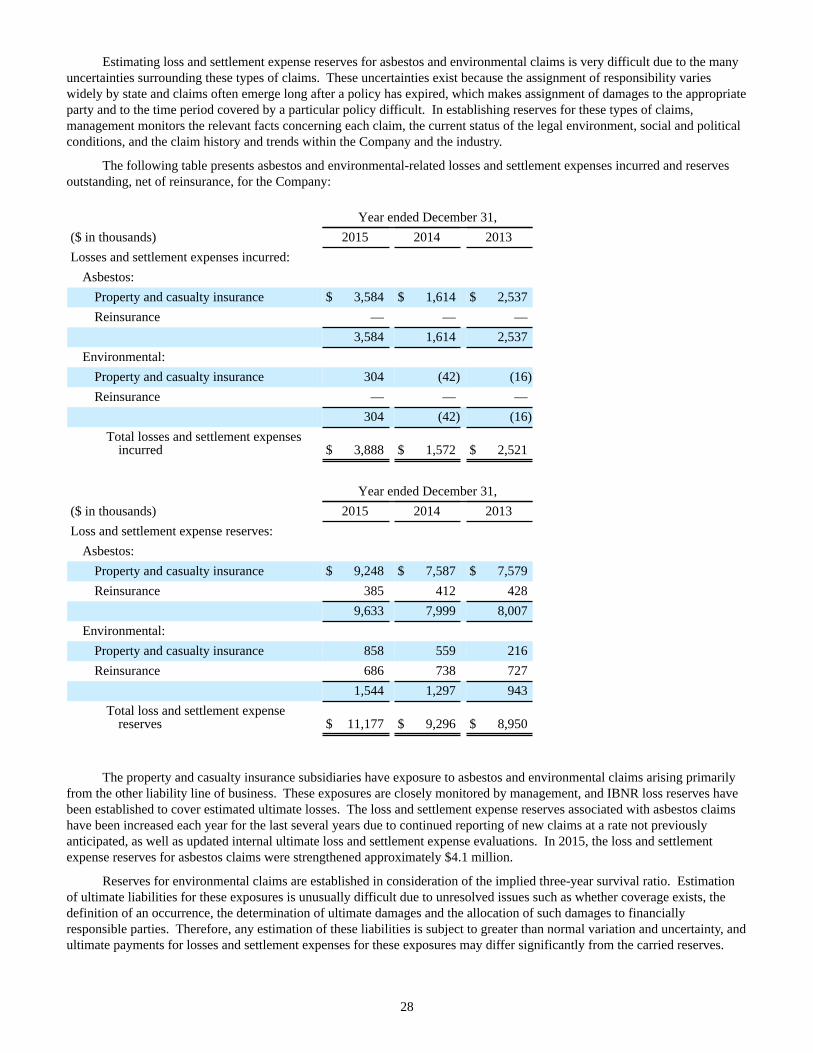
28
Estimating loss and settlement expense reserves for asbestos and environmental claims is very difficult due to the many uncertainties surrounding these types of claims. These uncertainties exist because the assignment of responsibility varies widely by state and claims often emerge long after a policy has expired, which makes assignment of damages to the appropriate party and to the time period covered by a particular policy difficult. In establishing reserves for these types of claims, management monitors the relevant facts concerning each claim, the current status of the legal environment, social and political conditions, and the claim history and trends within the Company and the industry.
The following table presents asbestos and environmental-related losses and settlement expenses incurred and reserves outstanding, net of reinsurance, for the Company:
Year ended December 31,($ in thousands) 2015 2014 2013Losses and settlement expenses incurred:
Asbestos:Property and casualty insurance $ 3,584 $ 1,614 $ 2,537Reinsurance — — —
3,584 1,614 2,537Environmental:
Property and casualty insurance 304 (42) (16)Reinsurance — — —
304 (42) (16)Total losses and settlement expenses
incurred $ 3,888 $ 1,572 $ 2,521
Year ended December 31,($ in thousands) 2015 2014 2013Loss and settlement expense reserves:
Asbestos:Property and casualty insurance $ 9,248 $ 7,587 $ 7,579Reinsurance 385 412 428
9,633 7,999 8,007Environmental:
Property and casualty insurance 858 559 216Reinsurance 686 738 727
1,544 1,297 943Total loss and settlement expense
reserves $ 11,177 $ 9,296 $ 8,950
The property and casualty insurance subsidiaries have exposure to asbestos and environmental claims arising primarily from the other liability line of business. These exposures are closely monitored by management, and IBNR loss reserves have been established to cover estimated ultimate losses. The loss and settlement expense reserves associated with asbestos claims have been increased each year for the last several years due to continued reporting of new claims at a rate not previously anticipated, as well as updated internal ultimate loss and settlement expense evaluations. In 2015, the loss and settlement expense reserves for asbestos claims were strengthened approximately $4.1 million.
Reserves for environmental claims are established in consideration of the implied three-year survival ratio. Estimation of ultimate liabilities for these exposures is unusually difficult due to unresolved issues such as whether coverage exists, the definition of an occurrence, the determination of ultimate damages and the allocation of such damages to financially responsible parties. Therefore, any estimation of these liabilities is subject to greater than normal variation and uncertainty, and ultimate payments for losses and settlement expenses for these exposures may differ significantly from the carried reserves.
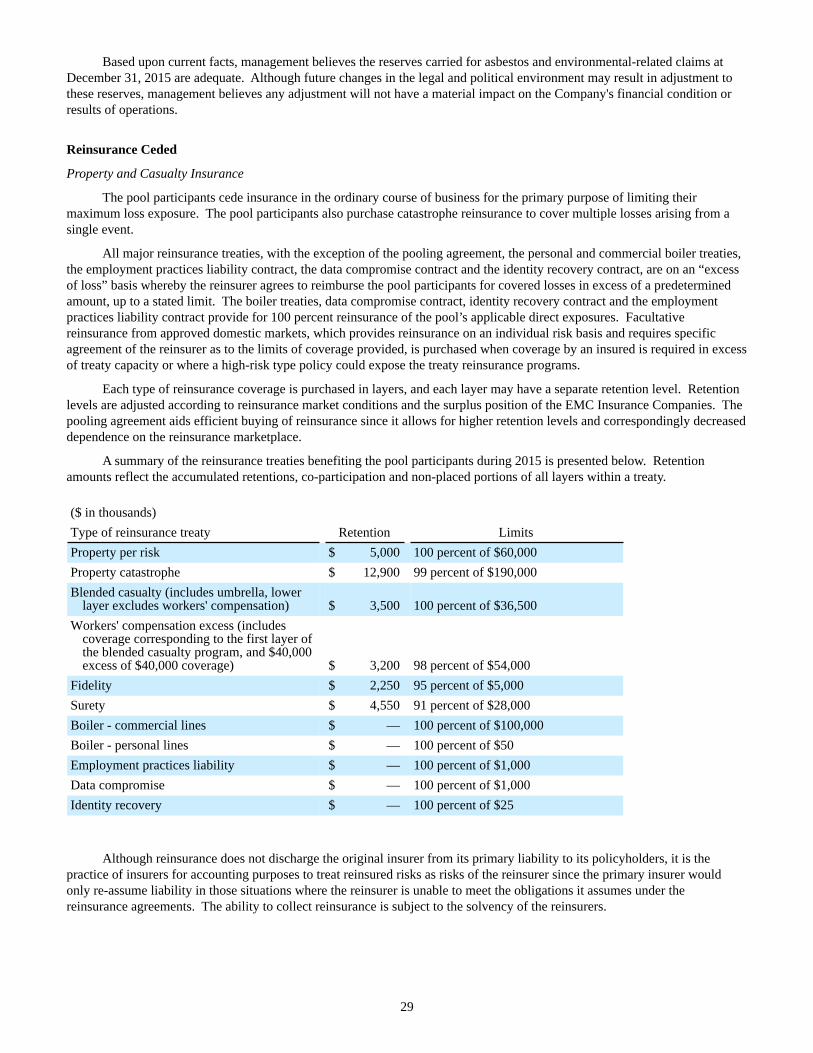
29
Based upon current facts, management believes the reserves carried for asbestos and environmental-related claims at December 31, 2015 are adequate. Although future changes in the legal and political environment may result in adjustment to these reserves, management believes any adjustment will not have a material impact on the Company's financial condition or results of operations.
Reinsurance Ceded
Property and Casualty Insurance
The pool participants cede insurance in the ordinary course of business for the primary purpose of limiting their maximum loss exposure. The pool participants also purchase catastrophe reinsurance to cover multiple losses arising from a single event.
All major reinsurance treaties, with the exception of the pooling agreement, the personal and commercial boiler treaties, the employment practices liability contract, the data compromise contract and the identity recovery contract, are on an “excess of loss” basis whereby the reinsurer agrees to reimburse the pool participants for covered losses in excess of a predetermined amount, up to a stated limit. The boiler treaties, data compromise contract, identity recovery contract and the employment practices liability contract provide for 100 percent reinsurance of the pool’s applicable direct exposures. Facultative reinsurance from approved domestic markets, which provides reinsurance on an individual risk basis and requires specific agreement of the reinsurer as to the limits of coverage provided, is purchased when coverage by an insured is required in excess of treaty capacity or where a high-risk type policy could expose the treaty reinsurance programs.
Each type of reinsurance coverage is purchased in layers, and each layer may have a separate retention level. Retention levels are adjusted according to reinsurance market conditions and the surplus position of the EMC Insurance Companies. The pooling agreement aids efficient buying of reinsurance since it allows for higher retention levels and correspondingly decreased dependence on the reinsurance marketplace.
A summary of the reinsurance treaties benefiting the pool participants during 2015 is presented below. Retention amounts reflect the accumulated retentions, co-participation and non-placed portions of all layers within a treaty.
($ in thousands)Type of reinsurance treaty Retention LimitsProperty per risk $ 5,000 100 percent of $60,000Property catastrophe $ 12,900 99 percent of $190,000Blended casualty (includes umbrella, lower
layer excludes workers' compensation) $ 3,500 100 percent of $36,500Workers' compensation excess (includes
coverage corresponding to the first layer ofthe blended casualty program, and $40,000excess of $40,000 coverage) $ 3,200 98 percent of $54,000
Fidelity $ 2,250 95 percent of $5,000Surety $ 4,550 91 percent of $28,000Boiler - commercial lines $ — 100 percent of $100,000Boiler - personal lines $ — 100 percent of $50Employment practices liability $ — 100 percent of $1,000Data compromise $ — 100 percent of $1,000Identity recovery $ — 100 percent of $25
Although reinsurance does not discharge the original insurer from its primary liability to its policyholders, it is the practice of insurers for accounting purposes to treat reinsured risks as risks of the reinsurer since the primary insurer would only re-assume liability in those situations where the reinsurer is unable to meet the obligations it assumes under the reinsurance agreements. The ability to collect reinsurance is subject to the solvency of the reinsurers.
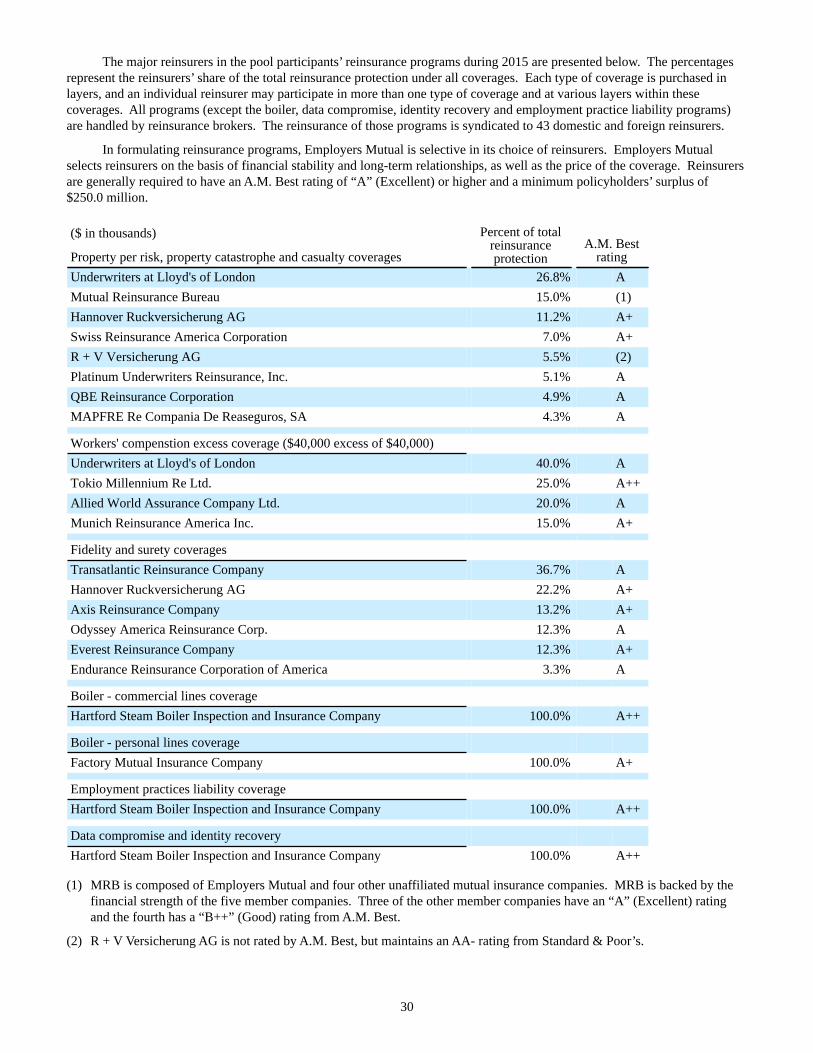
30
The major reinsurers in the pool participants’ reinsurance programs during 2015 are presented below. The percentages represent the reinsurers’ share of the total reinsurance protection under all coverages. Each type of coverage is purchased in layers, and an individual reinsurer may participate in more than one type of coverage and at various layers within these coverages. All programs (except the boiler, data compromise, identity recovery and employment practice liability programs) are handled by reinsurance brokers. The reinsurance of those programs is syndicated to 43 domestic and foreign reinsurers.
In formulating reinsurance programs, Employers Mutual is selective in its choice of reinsurers. Employers Mutual selects reinsurers on the basis of financial stability and long-term relationships, as well as the price of the coverage. Reinsurers are generally required to have an A.M. Best rating of “A” (Excellent) or higher and a minimum policyholders’ surplus of $250.0 million.
($ in thousands) Percent of totalreinsuranceprotection
A.M. BestratingProperty per risk, property catastrophe and casualty coverages
Underwriters at Lloyd's of London 26.8% AMutual Reinsurance Bureau 15.0% (1)Hannover Ruckversicherung AG 11.2% A+Swiss Reinsurance America Corporation 7.0% A+R + V Versicherung AG 5.5% (2)Platinum Underwriters Reinsurance, Inc. 5.1% AQBE Reinsurance Corporation 4.9% AMAPFRE Re Compania De Reaseguros, SA 4.3% A
Workers' compenstion excess coverage ($40,000 excess of $40,000)Underwriters at Lloyd's of London 40.0% ATokio Millennium Re Ltd. 25.0% A++Allied World Assurance Company Ltd. 20.0% AMunich Reinsurance America Inc. 15.0% A+
Fidelity and surety coveragesTransatlantic Reinsurance Company 36.7% AHannover Ruckversicherung AG 22.2% A+Axis Reinsurance Company 13.2% A+Odyssey America Reinsurance Corp. 12.3% AEverest Reinsurance Company 12.3% A+Endurance Reinsurance Corporation of America 3.3% A
Boiler - commercial lines coverageHartford Steam Boiler Inspection and Insurance Company 100.0% A++
Boiler - personal lines coverageFactory Mutual Insurance Company 100.0% A+
Employment practices liability coverageHartford Steam Boiler Inspection and Insurance Company 100.0% A++
Data compromise and identity recoveryHartford Steam Boiler Inspection and Insurance Company 100.0% A++
(1) MRB is composed of Employers Mutual and four other unaffiliated mutual insurance companies. MRB is backed by thefinancial strength of the five member companies. Three of the other member companies have an “A” (Excellent) ratingand the fourth has a “B++” (Good) rating from A.M. Best.
(2) R + V Versicherung AG is not rated by A.M. Best, but maintains an AA- rating from Standard & Poor’s.
31
The Terrorism Risk Insurance Program Reauthorization Act of 2015 (effective through December 31, 2020, referred to herein as the "TRIA Reauthorization Act") continues the Federal backstop on losses from certified terrorism events from foreign sources, and includes coverage for domestic terrorism as well. The TRIA Reauthorization Act covers most direct commercial lines of business, including coverage for losses from nuclear, biological and chemical exposures if coverage was afforded by an insurer, but with exclusions for commercial automobile insurance, burglary and theft insurance, surety insurance, professional liability insurance, and farm owners multiple peril insurance.
The program trigger threshold for federal participation in losses was $100.0 million in 2015. Beginning on January 1, 2016, this threshold increases $20.0 million per year until reaching $200.0 million on January 1, 2020. A loss must be $5.0 million or more to count towards the program trigger threshold. Each insurer has a deductible amount (20 percent of the prior year’s direct commercial lines premiums earned for the applicable lines of business) and a retention above the deductible (15 percent in 2015, increasing by one percentage point each year (beginning January 1, 2016) until reaching 20 percent on January 1, 2020). The TRIA Reauthorization Act caps losses at $100.0 billion annually; no insurer that has met its deductible will be liable for payment of any portion of losses above that amount. For the Company, the TRIA Reauthorization Act deductible is approximately $57.6 million.
Coverage for terrorism losses is included in the pool participants’ reinsurance programs for property and casualty risks (including coverage for the aggregation of property claims from catastrophic losses, subject to a $10.0 million per any one risk limit under the property catastrophe program). In summary, coverage under the property contracts includes both domestic and foreign terrorism, though foreign terrorism is limited to one limit per layer. Terrorism coverage in property lines is further restricted to exclude from coverage nuclear, biological, chemical and radiation (NBCR) losses, regardless of foreign or domestic source. Coverage under the casualty contracts also includes both domestic and foreign terrorism, though foreign terrorism, foreign NBCR terrorism or domestic NBCR terrorism is covered for one limit per layer.
Reinsurance
The reinsurance subsidiary does not purchase outside reinsurance protection due to the excess of loss agreement with Employers Mutual. During 2015, the reinsurance subsidiary paid premiums to Employers Mutual for this coverage calculated at 8.0 percent of total assumed reinsurance premiums written, which amounted to $10.8 million.
The reinsurance subsidiary does, however, assume and cede some selected reinsurance business through the quota share agreement in connection with “fronting” activities initiated by Employers Mutual whereby an agreed upon percentage of the selected assumed business is ceded to other reinsurer(s) on a pro rata basis. Ceded earned premiums associated with this fronting activity amounted to $5.9 million during 2015. The ceding of this reinsurance business through these fronting activities does not discharge the reinsurance subsidiary from its assumed liability to the original cedants, and the ability to collect reinsurance is subject to the solvency of the reinsurers.
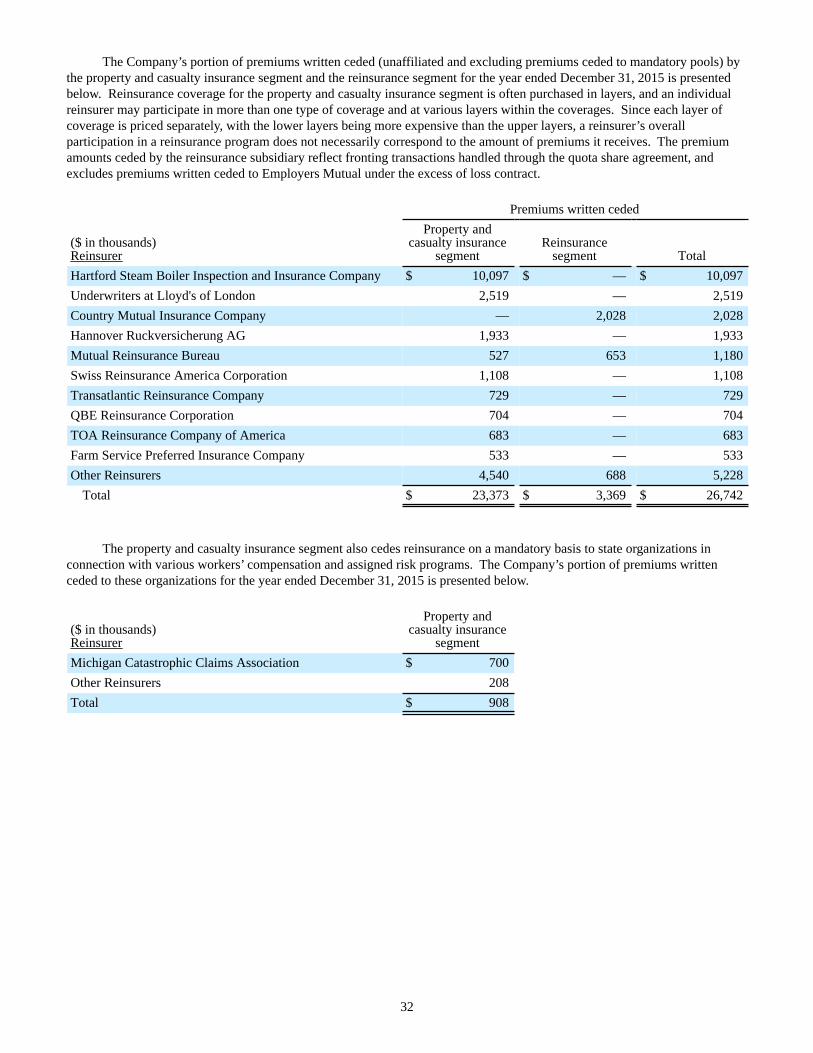
32
The Company’s portion of premiums written ceded (unaffiliated and excluding premiums ceded to mandatory pools) by the property and casualty insurance segment and the reinsurance segment for the year ended December 31, 2015 is presented below. Reinsurance coverage for the property and casualty insurance segment is often purchased in layers, and an individual reinsurer may participate in more than one type of coverage and at various layers within the coverages. Since each layer of coverage is priced separately, with the lower layers being more expensive than the upper layers, a reinsurer’s overall participation in a reinsurance program does not necessarily correspond to the amount of premiums it receives. The premium amounts ceded by the reinsurance subsidiary reflect fronting transactions handled through the quota share agreement, and excludes premiums written ceded to Employers Mutual under the excess of loss contract.
Premiums written ceded
($ in thousands) Reinsurer
Property andcasualty insurance
segmentReinsurance
segment TotalHartford Steam Boiler Inspection and Insurance Company $ 10,097 $ — $ 10,097Underwriters at Lloyd's of London 2,519 — 2,519Country Mutual Insurance Company — 2,028 2,028Hannover Ruckversicherung AG 1,933 — 1,933Mutual Reinsurance Bureau 527 653 1,180Swiss Reinsurance America Corporation 1,108 — 1,108Transatlantic Reinsurance Company 729 — 729QBE Reinsurance Corporation 704 — 704TOA Reinsurance Company of America 683 — 683Farm Service Preferred Insurance Company 533 — 533Other Reinsurers 4,540 688 5,228
Total $ 23,373 $ 3,369 $ 26,742
The property and casualty insurance segment also cedes reinsurance on a mandatory basis to state organizations in connection with various workers’ compensation and assigned risk programs. The Company’s portion of premiums written ceded to these organizations for the year ended December 31, 2015 is presented below.
($ in thousands)Reinsurer
Property andcasualty insurance
segmentMichigan Catastrophic Claims Association $ 700Other Reinsurers 208Total $ 908
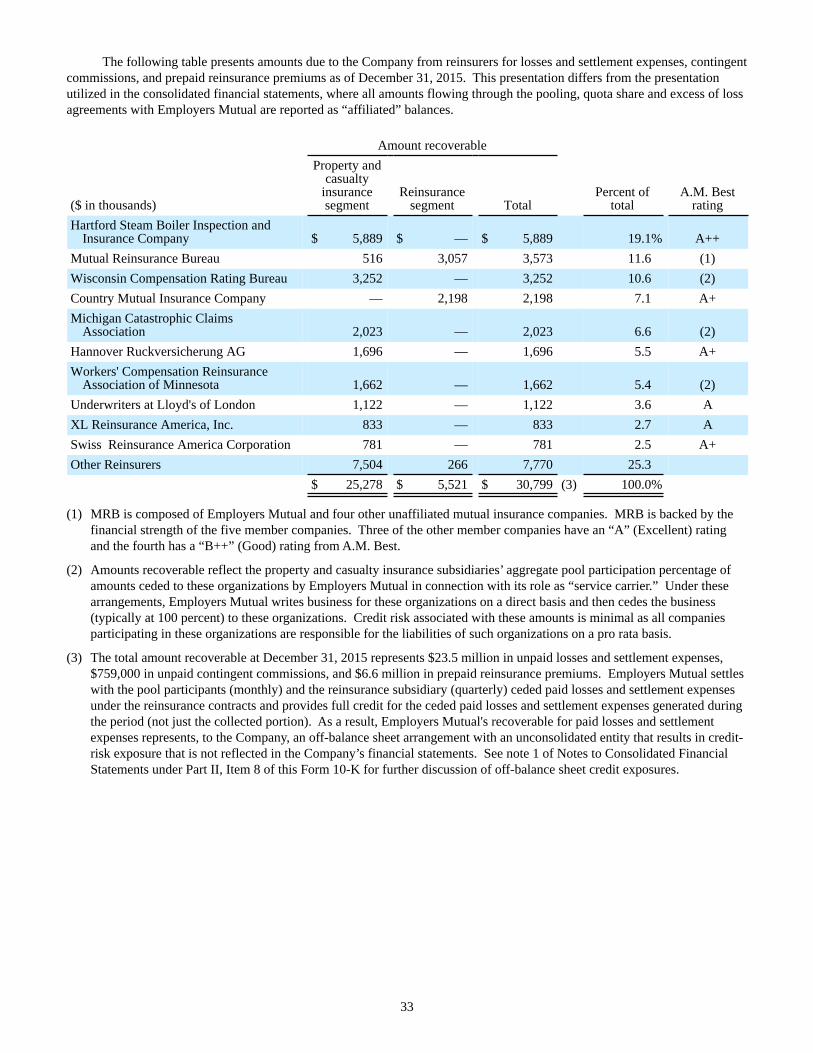
33
The following table presents amounts due to the Company from reinsurers for losses and settlement expenses, contingent commissions, and prepaid reinsurance premiums as of December 31, 2015. This presentation differs from the presentation utilized in the consolidated financial statements, where all amounts flowing through the pooling, quota share and excess of loss agreements with Employers Mutual are reported as “affiliated” balances.
Amount recoverable
($ in thousands)
Property andcasualty
insurancesegment
Reinsurancesegment Total
Percent oftotal
A.M. Bestrating
Hartford Steam Boiler Inspection andInsurance Company $ 5,889 $ — $ 5,889 19.1% A++
Mutual Reinsurance Bureau 516 3,057 3,573 11.6 (1)Wisconsin Compensation Rating Bureau 3,252 — 3,252 10.6 (2)Country Mutual Insurance Company — 2,198 2,198 7.1 A+Michigan Catastrophic Claims
Association 2,023 — 2,023 6.6 (2)Hannover Ruckversicherung AG 1,696 — 1,696 5.5 A+Workers' Compensation Reinsurance
Association of Minnesota 1,662 — 1,662 5.4 (2)Underwriters at Lloyd's of London 1,122 — 1,122 3.6 AXL Reinsurance America, Inc. 833 — 833 2.7 ASwiss Reinsurance America Corporation 781 — 781 2.5 A+Other Reinsurers 7,504 266 7,770 25.3
$ 25,278 $ 5,521 $ 30,799 (3) 100.0%
(1) MRB is composed of Employers Mutual and four other unaffiliated mutual insurance companies. MRB is backed by thefinancial strength of the five member companies. Three of the other member companies have an “A” (Excellent) ratingand the fourth has a “B++” (Good) rating from A.M. Best.
(2) Amounts recoverable reflect the property and casualty insurance subsidiaries’ aggregate pool participation percentage ofamounts ceded to these organizations by Employers Mutual in connection with its role as “service carrier.” Under thesearrangements, Employers Mutual writes business for these organizations on a direct basis and then cedes the business(typically at 100 percent) to these organizations. Credit risk associated with these amounts is minimal as all companiesparticipating in these organizations are responsible for the liabilities of such organizations on a pro rata basis.
(3) The total amount recoverable at December 31, 2015 represents $23.5 million in unpaid losses and settlement expenses,$759,000 in unpaid contingent commissions, and $6.6 million in prepaid reinsurance premiums. Employers Mutual settleswith the pool participants (monthly) and the reinsurance subsidiary (quarterly) ceded paid losses and settlement expensesunder the reinsurance contracts and provides full credit for the ceded paid losses and settlement expenses generated duringthe period (not just the collected portion). As a result, Employers Mutual's recoverable for paid losses and settlementexpenses represents, to the Company, an off-balance sheet arrangement with an unconsolidated entity that results in credit-risk exposure that is not reflected in the Company’s financial statements. See note 1 of Notes to Consolidated FinancialStatements under Part II, Item 8 of this Form 10-K for further discussion of off-balance sheet credit exposures.
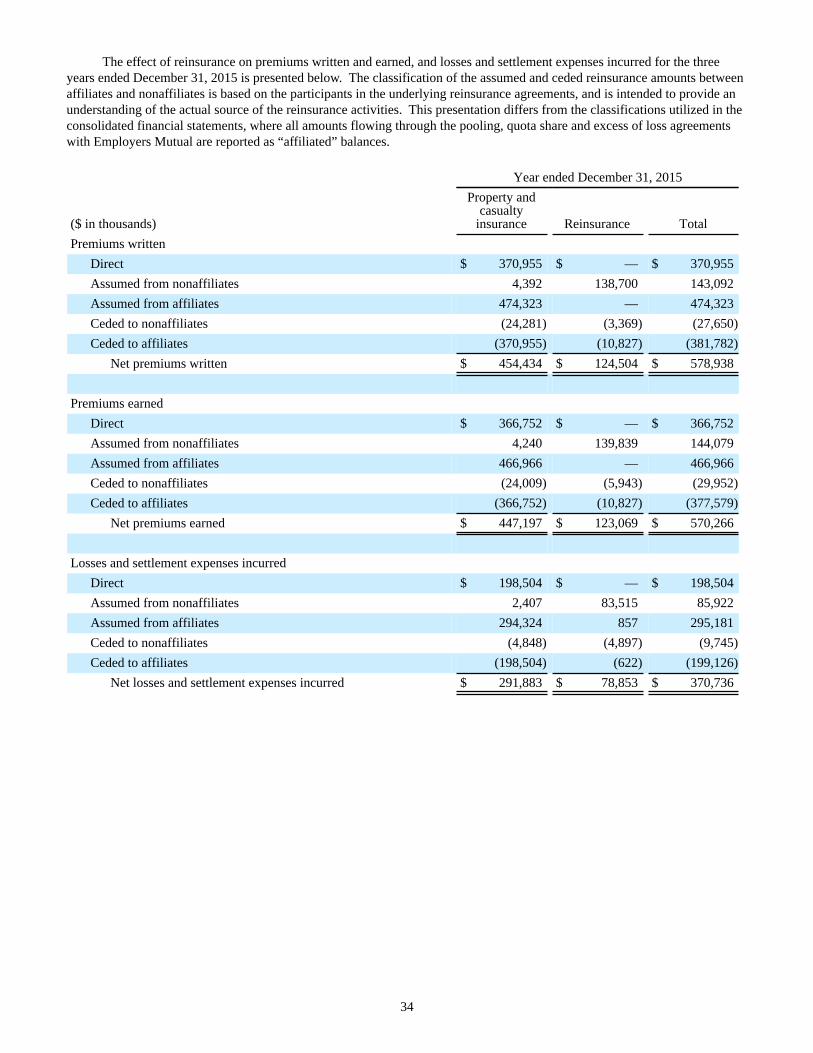
34
The effect of reinsurance on premiums written and earned, and losses and settlement expenses incurred for the three years ended December 31, 2015 is presented below. The classification of the assumed and ceded reinsurance amounts between affiliates and nonaffiliates is based on the participants in the underlying reinsurance agreements, and is intended to provide an understanding of the actual source of the reinsurance activities. This presentation differs from the classifications utilized in the consolidated financial statements, where all amounts flowing through the pooling, quota share and excess of loss agreements with Employers Mutual are reported as “affiliated” balances.
Year ended December 31, 2015
($ in thousands)
Property andcasualty
insurance Reinsurance TotalPremiums written
Direct $ 370,955 $ — $ 370,955Assumed from nonaffiliates 4,392 138,700 143,092Assumed from affiliates 474,323 — 474,323Ceded to nonaffiliates (24,281) (3,369) (27,650)Ceded to affiliates (370,955) (10,827) (381,782)
Net premiums written $ 454,434 $ 124,504 $ 578,938
Premiums earnedDirect $ 366,752 $ — $ 366,752Assumed from nonaffiliates 4,240 139,839 144,079Assumed from affiliates 466,966 — 466,966Ceded to nonaffiliates (24,009) (5,943) (29,952)Ceded to affiliates (366,752) (10,827) (377,579)
Net premiums earned $ 447,197 $ 123,069 $ 570,266
Losses and settlement expenses incurredDirect $ 198,504 $ — $ 198,504Assumed from nonaffiliates 2,407 83,515 85,922Assumed from affiliates 294,324 857 295,181Ceded to nonaffiliates (4,848) (4,897) (9,745)Ceded to affiliates (198,504) (622) (199,126)
Net losses and settlement expenses incurred $ 291,883 $ 78,853 $ 370,736
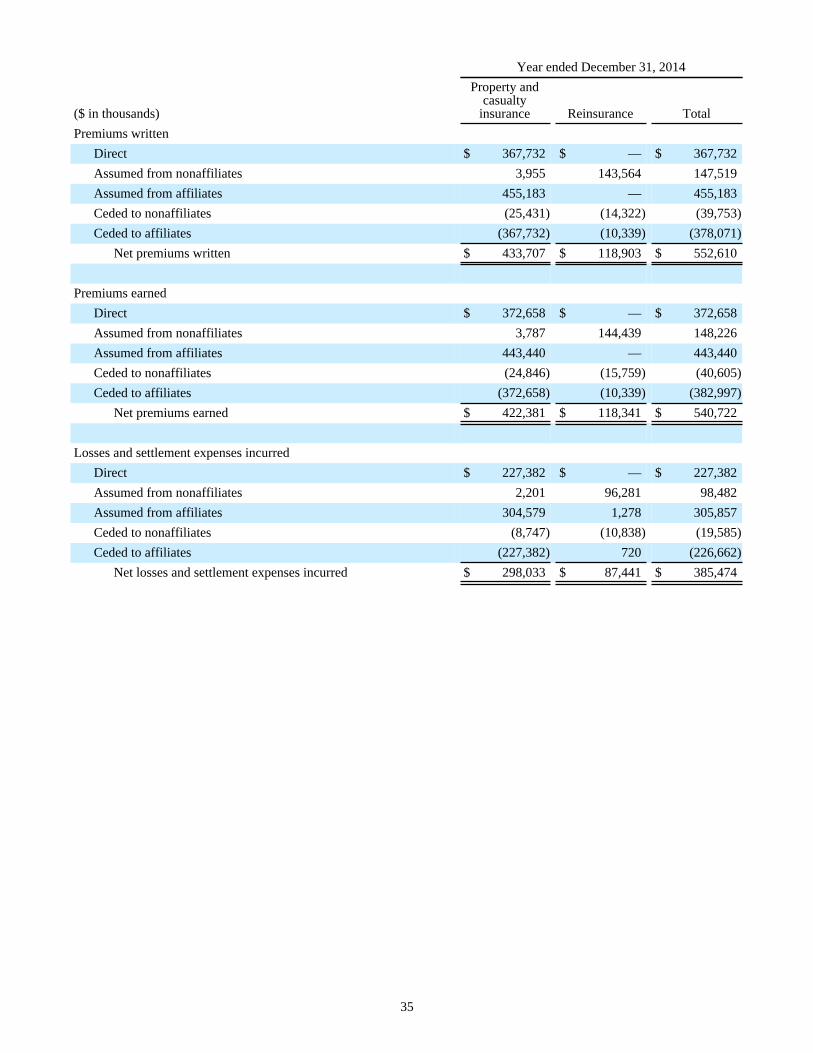
35
Year ended December 31, 2014
($ in thousands)
Property andcasualty
insurance Reinsurance TotalPremiums written
Direct $ 367,732 $ — $ 367,732Assumed from nonaffiliates 3,955 143,564 147,519Assumed from affiliates 455,183 — 455,183Ceded to nonaffiliates (25,431) (14,322) (39,753)Ceded to affiliates (367,732) (10,339) (378,071)
Net premiums written $ 433,707 $ 118,903 $ 552,610
Premiums earnedDirect $ 372,658 $ — $ 372,658Assumed from nonaffiliates 3,787 144,439 148,226Assumed from affiliates 443,440 — 443,440Ceded to nonaffiliates (24,846) (15,759) (40,605)Ceded to affiliates (372,658) (10,339) (382,997)
Net premiums earned $ 422,381 $ 118,341 $ 540,722
Losses and settlement expenses incurredDirect $ 227,382 $ — $ 227,382Assumed from nonaffiliates 2,201 96,281 98,482Assumed from affiliates 304,579 1,278 305,857Ceded to nonaffiliates (8,747) (10,838) (19,585)Ceded to affiliates (227,382) 720 (226,662)
Net losses and settlement expenses incurred $ 298,033 $ 87,441 $ 385,474
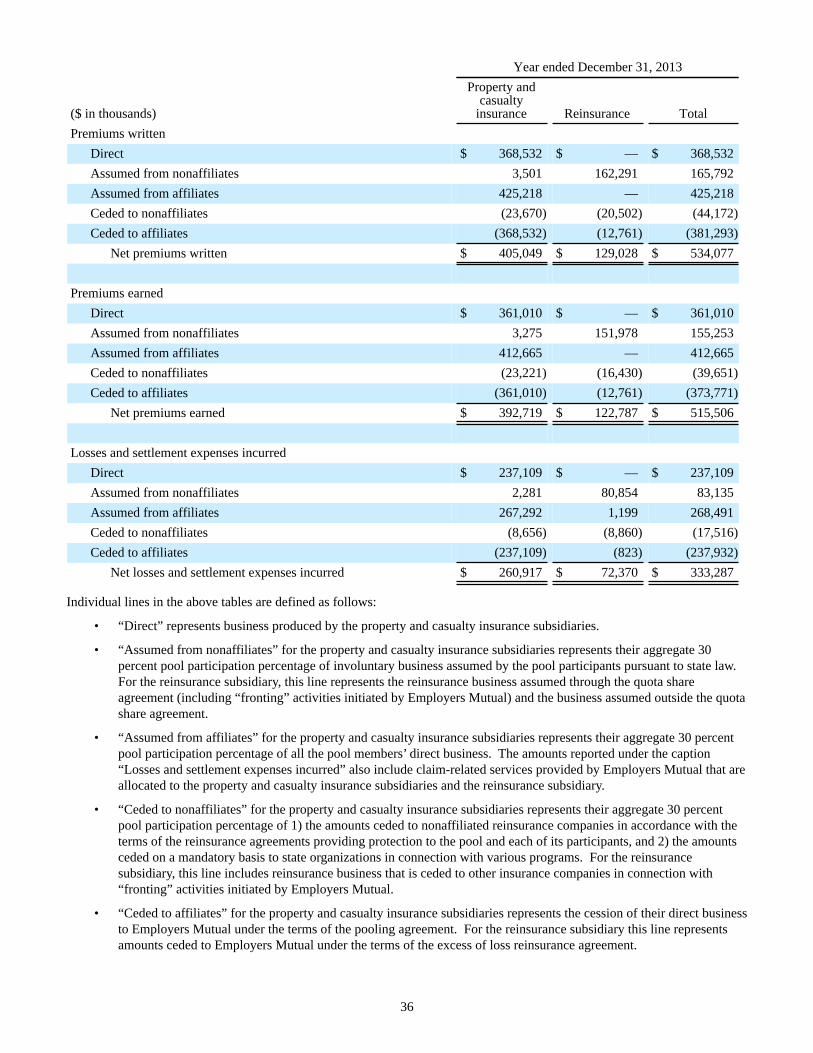
36
Year ended December 31, 2013
($ in thousands)
Property andcasualty
insurance Reinsurance TotalPremiums written
Direct $ 368,532 $ — $ 368,532Assumed from nonaffiliates 3,501 162,291 165,792Assumed from affiliates 425,218 — 425,218Ceded to nonaffiliates (23,670) (20,502) (44,172)Ceded to affiliates (368,532) (12,761) (381,293)
Net premiums written $ 405,049 $ 129,028 $ 534,077
Premiums earnedDirect $ 361,010 $ — $ 361,010Assumed from nonaffiliates 3,275 151,978 155,253Assumed from affiliates 412,665 — 412,665Ceded to nonaffiliates (23,221) (16,430) (39,651)Ceded to affiliates (361,010) (12,761) (373,771)
Net premiums earned $ 392,719 $ 122,787 $ 515,506
Losses and settlement expenses incurredDirect $ 237,109 $ — $ 237,109Assumed from nonaffiliates 2,281 80,854 83,135Assumed from affiliates 267,292 1,199 268,491Ceded to nonaffiliates (8,656) (8,860) (17,516)Ceded to affiliates (237,109) (823) (237,932)
Net losses and settlement expenses incurred $ 260,917 $ 72,370 $ 333,287
Individual lines in the above tables are defined as follows:
• “Direct” represents business produced by the property and casualty insurance subsidiaries.
• “Assumed from nonaffiliates” for the property and casualty insurance subsidiaries represents their aggregate 30percent pool participation percentage of involuntary business assumed by the pool participants pursuant to state law.For the reinsurance subsidiary, this line represents the reinsurance business assumed through the quota shareagreement (including “fronting” activities initiated by Employers Mutual) and the business assumed outside the quotashare agreement.
• “Assumed from affiliates” for the property and casualty insurance subsidiaries represents their aggregate 30 percentpool participation percentage of all the pool members’ direct business. The amounts reported under the caption“Losses and settlement expenses incurred” also include claim-related services provided by Employers Mutual that areallocated to the property and casualty insurance subsidiaries and the reinsurance subsidiary.
• “Ceded to nonaffiliates” for the property and casualty insurance subsidiaries represents their aggregate 30 percentpool participation percentage of 1) the amounts ceded to nonaffiliated reinsurance companies in accordance with theterms of the reinsurance agreements providing protection to the pool and each of its participants, and 2) the amountsceded on a mandatory basis to state organizations in connection with various programs. For the reinsurancesubsidiary, this line includes reinsurance business that is ceded to other insurance companies in connection with“fronting” activities initiated by Employers Mutual.
• “Ceded to affiliates” for the property and casualty insurance subsidiaries represents the cession of their direct businessto Employers Mutual under the terms of the pooling agreement. For the reinsurance subsidiary this line representsamounts ceded to Employers Mutual under the terms of the excess of loss reinsurance agreement.
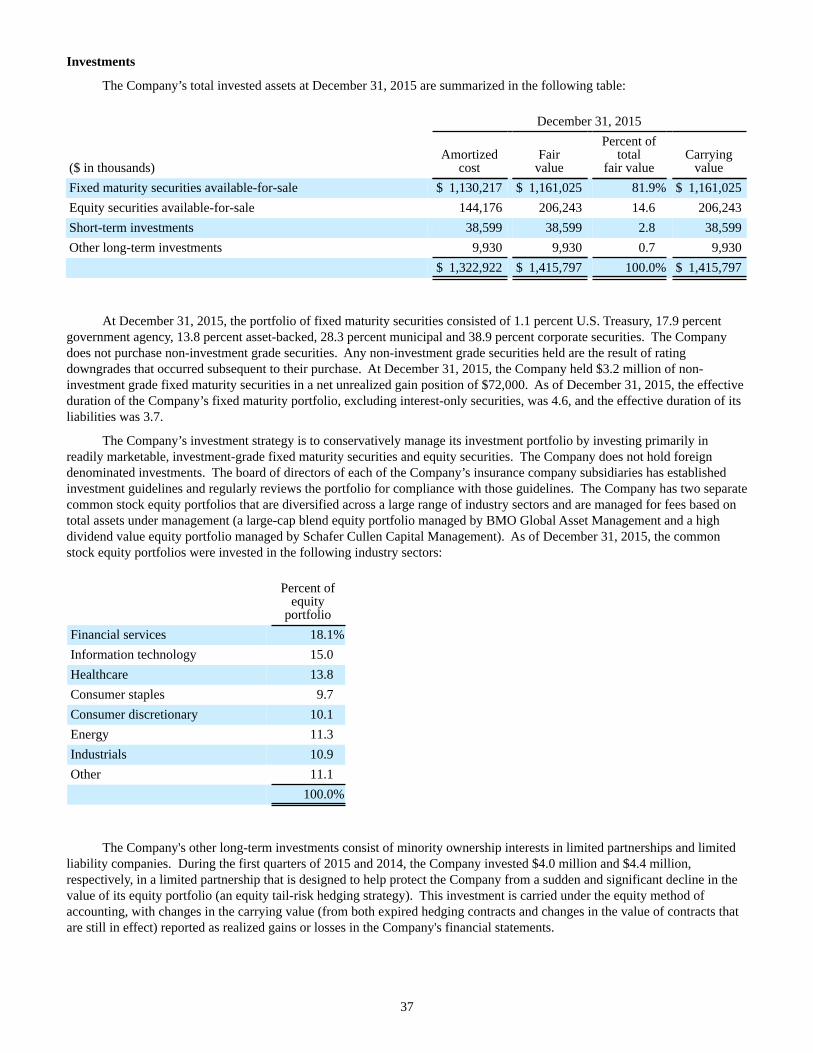
37
Investments
The Company’s total invested assets at December 31, 2015 are summarized in the following table:
December 31, 2015
($ in thousands)Amortized
costFair
value
Percent oftotal
fair valueCarrying
valueFixed maturity securities available-for-sale $ 1,130,217 $ 1,161,025 81.9% $ 1,161,025Equity securities available-for-sale 144,176 206,243 14.6 206,243Short-term investments 38,599 38,599 2.8 38,599Other long-term investments 9,930 9,930 0.7 9,930
$ 1,322,922 $ 1,415,797 100.0% $ 1,415,797
At December 31, 2015, the portfolio of fixed maturity securities consisted of 1.1 percent U.S. Treasury, 17.9 percent government agency, 13.8 percent asset-backed, 28.3 percent municipal and 38.9 percent corporate securities. The Company does not purchase non-investment grade securities. Any non-investment grade securities held are the result of rating downgrades that occurred subsequent to their purchase. At December 31, 2015, the Company held $3.2 million of non-investment grade fixed maturity securities in a net unrealized gain position of $72,000. As of December 31, 2015, the effective duration of the Company’s fixed maturity portfolio, excluding interest-only securities, was 4.6, and the effective duration of its liabilities was 3.7.
The Company’s investment strategy is to conservatively manage its investment portfolio by investing primarily in readily marketable, investment-grade fixed maturity securities and equity securities. The Company does not hold foreign denominated investments. The board of directors of each of the Company’s insurance company subsidiaries has established investment guidelines and regularly reviews the portfolio for compliance with those guidelines. The Company has two separate common stock equity portfolios that are diversified across a large range of industry sectors and are managed for fees based on total assets under management (a large-cap blend equity portfolio managed by BMO Global Asset Management and a high dividend value equity portfolio managed by Schafer Cullen Capital Management). As of December 31, 2015, the common stock equity portfolios were invested in the following industry sectors:
Percent ofequity
portfolioFinancial services 18.1%Information technology 15.0Healthcare 13.8Consumer staples 9.7Consumer discretionary 10.1Energy 11.3Industrials 10.9Other 11.1
100.0%
The Company's other long-term investments consist of minority ownership interests in limited partnerships and limited liability companies. During the first quarters of 2015 and 2014, the Company invested $4.0 million and $4.4 million, respectively, in a limited partnership that is designed to help protect the Company from a sudden and significant decline in the value of its equity portfolio (an equity tail-risk hedging strategy). This investment is carried under the equity method of accounting, with changes in the carrying value (from both expired hedging contracts and changes in the value of contracts that are still in effect) reported as realized gains or losses in the Company's financial statements.
38
Employees
EMC Insurance Group Inc. and its subsidiaries have no employees. The Company’s business activities are conducted by the 2,160 employees of Employers Mutual. EMC Insurance Group Inc., EMC Reinsurance Company and EMC Underwriters, LLC are charged their proportionate share of salary and employee benefit costs based on time allocations. Costs not allocated to these companies, and other subsidiaries of Employers Mutual outside the pooling agreement, are charged to the pooling agreement. The Company’s property and casualty insurance subsidiaries share the costs charged to the pooling agreement in accordance with their pool participation percentages.
Regulation
The Company’s insurance subsidiaries are subject to extensive regulation and supervision by their state of domicile, as well as those states in which they do business. The purpose of such regulation and supervision is primarily to provide safeguards for policyholders, rather than to protect the interests of stockholders. The insurance laws of the various states establish regulatory agencies with broad administrative powers, including the power to grant or revoke operating licenses and regulate trade practices, investments, premium rates, deposits of securities, the form and content of financial statements and insurance policies, accounting practices and the maintenance of specified reserves and capital for the protection of policyholders.
Premium rate regulation varies greatly among jurisdictions and lines of insurance. In most states in which the Company’s subsidiaries and the other pool participants write insurance, premium rates for the various lines of insurance are subject to either prior approval or limited review upon implementation. States require rates for property and casualty insurance that are adequate, not excessive, and not unfairly discriminatory.
Like other insurance companies, the pool participants are required to participate in mandatory shared-market mechanisms or state pooling arrangements as a condition for maintaining their insurance licenses to do business in various states. The purpose of these state-mandated arrangements is to provide insurance coverage to individuals who, because of poor driving records or other underwriting reasons, are unable to purchase such coverage voluntarily provided by private insurers. These risks can be assigned to all insurers licensed in the state and the maximum volume of such risks that any one insurance company may be assigned typically is proportional to that insurance company’s annual premium volume in that state. The underwriting results of this mandatory business traditionally have been unprofitable.
The Company’s insurance subsidiaries are required to file detailed annual reports with the appropriate regulatory agency in each state in which they do business based on applicable statutory regulations, which differ from U.S. generally accepted accounting principles. Their business and accounts are subject to examination by such agencies at any time. Since three of the Company’s four insurance subsidiaries and Employers Mutual are domiciled in Iowa, the State of Iowa exercises principal regulatory supervision, and Iowa law requires periodic examination.
State laws governing insurance holding companies also impose standards on certain transactions with related companies, which include, among other requirements, that all transactions be fair and reasonable and that an insurer’s surplus as regards policyholders be reasonable and adequate in relation to its liabilities. Under Iowa law, dividends or distributions made by registered insurers are restricted in amount and may be subject to approval from the Iowa Commissioner of Insurance. “Extraordinary” dividends or distributions are subject to prior approval and are defined as dividends or distributions made within a 12 month period which exceed the greater of 10 percent of statutory surplus as regards policyholders as of the preceding December 31, or net income of the preceding calendar year on a statutory basis. North Dakota imposes similar restrictions on the payment of dividends and distributions. At December 31, 2015, $49.8 million was available for distribution to the Company in 2016 without prior approval. See note 6 of Notes to Consolidated Financial Statements under Part II, Item 8 of this Form 10-K.
Under state insurance guaranty fund laws, insurance companies doing business in a state can be assessed for certain obligations of insolvent insurance companies to such companies’ policyholders and claimants. Maximum assessments allowed in any one year generally vary between one percent and two percent of annual premiums written in that state, but it is possible that caps on such assessments could be raised if there are numerous or large insolvencies. In most states, guaranty fund assessments are recoverable either through future policy surcharges or offsets to state premium tax liabilities.
39
The National Association of Insurance Commissioners (NAIC) utilizes a risk-based capital model to help state regulators assess the capital adequacy of insurance companies and identify insurers that are in, or are perceived as approaching, financial difficulty. This model establishes minimum capital needs based on the risks applicable to the operations of the individual insurer. The risk-based capital requirements for property and casualty insurance companies measure three major areas of risk: asset risk, credit risk and underwriting risk. Companies having less statutory surplus than required by the risk-based capital requirements are subject to varying degrees of regulatory scrutiny and intervention, depending on the severity of the inadequacy. At December 31, 2015, the Company’s insurance subsidiaries had total adjusted statutory capital of $485.2 million, which is well in excess of the minimum risk-based capital requirement of $77.4 million.
AVAILABLE INFORMATION
The Company’s internet address is www.emcins.com. The Company’s Annual Report on Form 10-K, Quarterly Reports on Form 10-Q, Current Reports on Form 8-K and any amendments to these reports filed or furnished pursuant to Section 13(a) of the Securities Exchange Act of 1934, as amended (the “Exchange Act”) are available free of charge through the Company’s website as soon as reasonably practicable after the filing or furnishing of such material with the Securities and Exchange Commission.
40
EXECUTIVE OFFICERS OF THE COMPANY
The Company’s executive officers, their positions and ages are shown in the table below:
NAME AGE POSITIONIan C. Asplund 35 Vice President-Chief Actuary of the Company and Employers Mutual since 2015. Assistant
Vice President of Employers Mutual from 2012 to 2014. He has been employed byEmployers Mutual since 2003.
Jason R. Bogart 54 Senior Vice President of the Company and Senior Vice President of Branch Operations ofEmployers Mutual since 2013. Vice President of the Company and Vice President ofBranch Operations of Employers Mutual from 2010 to 2013. Resident Vice President-Lansing Branch of Employers Mutual from 2003 until 2010. He has been employed byEmployers Mutual since 1993.
Bradley J. Fredericks 42 Vice President-Chief Investment Officer of the Company and Employers Mutual since2014. Assistant Vice President of Employers Mutual from 2013 to 2014. He has beenemployed by Employers Mutual since 2010.
Rodney D. Hanson 60 Senior Vice President-Information Technology of the Company and Employers Mutualsince 2013. Vice President-Information Technology of the Company and Employers Mutualfrom 2003 to 2013. He has been employed by Employers Mutual since 1978.
Richard W. Hoffmann 62 Vice President, General Counsel and Secretary of the Company and Vice President andGeneral Counsel of Employers Mutual since 2001. He has been employed by EmployersMutual since 1989.
Kevin J. Hovick 61 Executive Vice President and Chief Operating Officer of the Company and of EmployersMutual since 2011. Senior Vice President-Business Development of the Company from2004 until 2011 and Employers Mutual from 2001 until 2011. Vice President-Marketing ofEmployers Mutual from 1997 to 2001. He has been employed by Employers Mutual since1979.
Scott R. Jean 44 Executive Vice President for Finance & Analytics of the Company and Employers Mutualsince 2015. Senior Vice President-Chief Actuary of the Company and Employers Mutual in2014. Vice President-Chief Actuary of the Company and of Employers Mutual from 2009to 2014. He has been employed by Employers Mutual since 1993.
Bruce G. Kelley 61 President and Chief Executive Officer of the Company and Employers Mutual since 1992.Reappointed Treasurer of the Company and Employers Mutual in 2014 (previously held thattitle for Employers Mutual from 1996 until 2000 and the Company from 1996 until 2001).President and Chief Operating Officer of the Company and Employers Mutual from 1991 to1992 and Executive Vice President of the Company and Employers Mutual from 1989 to1991. He has been employed by Employers Mutual since 1985.
Aaron M. Larson 43 Senior Vice President-Strategic Analytics of the Company and of Employers Mutual since2015. Prior to joining Employers Mutual he was Vice President-Analytics of NavistarFinancial Corporation from 2014 to 2015, and Vice President-Product Management ofContinental Western Group, a subsidiary of W.R. Berkley Corporation, and later VicePresident of W.R. Berkley Corporation from 2006-2014.
Robert L. Link 58 Senior Vice President and Assistant Secretary of the Company and Senior Vice Presidentand Corporate Secretary-Administration of Employers Mutual since 2012. Vice President ofthe Company from 2007 to 2012 and Vice President and Corporate Secretary-Administration of Employers Mutual from 2005 to 2012. He has been employed byEmployers Mutual since 1977.
41
Mick A. Lovell 53 Executive Vice President for Corporate Development of the Company and EmployersMutual since 2015. Senior Vice President for Corporate Development of the Company andEmployers Mutual in 2014. Vice President of the Company and Vice President-BusinessDevelopment of Employers Mutual from 2011 to 2014. Assistant Vice President of theCompany and Assistant Vice President-Director of Product Management of EmployersMutual from 2003 to 2011. He has been employed by Employers Mutual since 2003.
Elizabeth A. Nigut 46 Senior Vice President of the Company and Senior Vice President-Human Resources ofEmployers Mutual since 2014. Vice President of the Company and Vice President-HumanResources of Employers Mutual from 2010 to 2014. She has been employed by EmployersMutual since 2010.
Larry W. Phillips 62 Senior Vice President-Business Development of the Company and Employers Mutual since2015. Vice President-Underwriting of Employers Mutual from 2013 to 2015. He has beenemployed by Employers Mutual since 2012. Prior to joining Employers Mutual he wasExecutive Director of the Iowa Fair Plan from 2011 to 2012, and Vice President ofUnderwriting of Midwest Family Mutual Insurance Company from 2009 to 2011.
Mark E. Reese 58 Senior Vice President and Chief Financial Officer of the Company and of Employers Mutualsince 2004. Vice President of the Company and Employers Mutual from 1996 until 2004and has been Chief Financial Officer of the Company and Employers Mutual since1997. He has been employed by Employers Mutual since 1984.
Lisa A. Simonetta 56 Senior Vice President-Claims of the Company and Employers Mutual since 2013. VicePresident Claims-Legal of the Company and Vice President of Employers Mutual from 2002to 2013. She has been employed by Employers Mutual since 1992.
42
ITEM 1A. RISK FACTORS
Set forth below is a description of risk factors related to the Company’s business, provided to enable investors to assess, and be appropriately apprised of, certain risks and uncertainties the Company faces in conducting its business. An investor should carefully consider the risks described below and elsewhere in this Form 10-K which could materially and adversely affect the Company’s business, financial condition or results of operations. The risks and uncertainties discussed below are also applicable to forward-looking statements contained in this Form 10-K and in other reports filed by the Company with the Securities and Exchange Commission, and in management presentations delivered and press releases issued by the Company. Given these risks and uncertainties, investors are cautioned not to place undue reliance on forward-looking statements.
Risks Relating to the Company and Its Business
The Company’s operations are integrated with those of Employers Mutual, the parent company, and potential and actual conflicts exist between the best interests of the Company’s stockholders and the best interests of the policyholders of Employers Mutual.
Employers Mutual currently owns shares of the Company’s common stock entitling it to cast approximately 57 percent of the aggregate votes eligible to be cast by the Company’s stockholders at any meeting of stockholders. These holdings enable Employers Mutual to control the election of the Company’s board of directors. In addition, one of the five members of the Company’s board of directors is also a member of the board of directors of Employers Mutual. This director has a fiduciary duty to both the Company’s stockholders and to the policyholders of Employers Mutual. The Company’s executive officers hold the same positions with both Employers Mutual and the Company, and therefore also have a fiduciary duty to both the stockholders of the Company and to the policyholders of Employers Mutual. Certain potential and actual conflicts of interest arise from the Company’s relationship with Employers Mutual and these competing fiduciary duties. Among these conflicts of interest are:
• the Company and Employers Mutual must establish the relative participation interests of all the participating insurersin the pooling arrangement, along with other terms of the pooling agreement;
• the Company and Employers Mutual must establish the terms of the quota share and excess of loss agreementsbetween Employers Mutual and the Company’s reinsurance subsidiary, and, beginning in 2016, the terms of thereinsurance contract between Employers Mutual and the Company's property and casualty insurance subsidiaries;
• the Company and Employers Mutual must establish the terms (including the interest rate, which is reviewed everyfive years) of the surplus notes issued by the Company’s property and casualty insurance subsidiaries to EmployersMutual;
• the Company and Employers Mutual must establish the terms (including the interest rate) of any inter-company loansbetween Employers Mutual and any of the Company’s insurance company subsidiaries;
• the Company and Employers Mutual must make judgments about the allocation of expenses to the Company and itssubsidiaries and to Employers Mutual’s subsidiaries that do not participate in the pooling agreement; and
• the Company may enter into other transactions and contractual relationships with Employers Mutual and itssubsidiaries or affiliates.
As a consequence, the Company and Employers Mutual have each established an Inter-Company Committee, with the Company’s Inter-Company Committee consisting of three of the Company’s independent directors who are not directors of Employers Mutual and Employers Mutual’s Inter-Company Committee consisting of three directors of Employers Mutual who are not members of the Company’s board of directors. Any new material agreement or transaction between Employers Mutual and the Company, as well as any proposed material change to an existing material agreement between Employers Mutual and the Company, must receive the approval of both Inter-Company Committees. This approval is granted only if the members of the Company’s Inter-Company Committee unanimously conclude that the new agreement or transaction, or proposed material change to an existing agreement, is fair and reasonable to the Company and its stockholders, and the members of Employers Mutual’s Inter-Company Committee unanimously conclude that the new agreement or transaction, or proposed change to an existing agreement, is fair and reasonable to Employers Mutual and its policyholders.
43
The Company relies on Employers Mutual to provide employees, facilities and information technology systems to conduct its operations.
The Company does not employ any staff to conduct its operations, nor does the Company own or, with one exception, lease any facilities or information technology systems necessary for its operations. As a result, the Company is totally dependent on Employers Mutual’s employees, facilities and information technology systems to conduct its business. There are no agreements in place that obligate Employers Mutual to provide the Company with access to its employees, facilities or information technology systems. In addition, the Company does not have any employment agreements with its executive officers, all of whom are employed by Employers Mutual. These arrangements make it unlikely that anyone could acquire control of the Company or replace its management unless Employers Mutual was in favor of such action. Any of these arrangements could diminish the value of the Company’s common stock.
The Company’s results of operations could suffer if the pool participants were to forecast future losses inaccurately, experience unusually severe or frequent losses or inadequately price their insurance products.
The Company’s property and casualty insurance subsidiaries participate in a pooling agreement under which they share the underwriting results of the property and casualty insurance business written by all the pool participants (excluding certain assumed reinsurance business). Because of the pooled business the Company is allocated, the insurance operations of the Company’s pool participants are integrated with the insurance operations of the Employers Mutual pool participants, and the Company’s results of operations depend upon the forecasts, pricing and underwriting results of the Employers Mutual pool participants. Although the pool is intended to produce a more uniform and stable underwriting result from year to year for the participants than they would experience separately by spreading the risk of losses among the participants, if any of the pool participants experience unusually severe or frequent losses or do not adequately price their insurance products, the Company’s business, financial condition or results of operations could suffer.
One of the distinguishing features of the property and casualty insurance industry is that its products are priced before the costs are known, as premium rates are generally determined before losses are reported. Accordingly, the pool participants must establish premium rates from forecasts of the ultimate costs they expect to incur from risks underwritten during the policy period, and premiums may not be adequate to cover the ultimate losses incurred. Further, the pool participants must establish reserves for losses and settlement expenses based upon estimates involving actuarial and statistical projections of expected ultimate liability at a given time, and it is possible that the ultimate liability will exceed these estimates because of the future development of known losses, the existence of losses that have occurred but are currently unreported, or larger than expected settlements on pending and unreported claims. Prior to the end of each quarter, Employers Mutual’s actuaries review the adequacy of the pool's previous quarter's reserves for the various lines of business underwritten and these reviews have in the past, and may in the future, indicate that additional reserves are necessary to adequately cover anticipated losses and settlement expenses. The process of estimating reserves is inherently judgmental and can be influenced by factors that are subject to variation. If the premium rates or reserves established are not sufficient, the Company’s business, financial condition and/or results of operations may be adversely impacted.
An increase in asbestos and environmental claims could have a material adverse effect on the Company's financial condition or results of operations.
The Company has exposure to asbestos and environmental claims arising from the other liability line of business written by the parties to the pooling agreement, as well as the pro rata and excess of loss business assumed by the reinsurance subsidiary. These exposures are closely monitored by management and reserves have been established to cover estimated ultimate losses. Estimating loss and settlement expense reserves for asbestos and environmental claims is very difficult due to the many uncertainties surrounding these types of claims, such as whether coverage exists, the definition of an occurrence, determination of ultimate damages and the assignment of damages to the responsible parties. These uncertainties are compounded by the fact that claims typically emerge long after a policy has expired. It is possible that the ultimate liability for these exposures may increase significantly as a result of the settlement of lawsuits or the receipt of additional claims, which could have a material adverse effect on the Company's financial condition and/or results of operations.
44
The Company’s business may not continue to grow and may be adversely affected if it cannot retain existing, and attract new, independent agents, or if insurance consumers increase their use of other insurance delivery systems.
The continued growth of the Company’s business will depend upon the pool participants’ ability to retain existing, and attract new, independent agents. The pool participants’ agency force is one of the most important components of their competitive position. To the extent that the pool participants’ existing agents cannot maintain current levels of production, the Company’s business, financial condition and results of operations will suffer. Moreover, if independent agencies find it easier to do business with the pool participants’ competitors, it could be difficult for them to retain their existing business or attract new business. While the pool participants believe they maintain good relationships with their independent agents, they cannot be certain that these independent agents will continue to sell their products to the consumers they represent. Some of the factors that could adversely affect the ability to retain existing, and attract new, independent agents include:
• competition in the insurance industry to attract independent agents;
• the pool participants’ requirement that independent agents adhere to disciplined underwriting standards; and
• the pool participants’ ability to pay competitive and attractive commissions, profit share bonuses and otherincentives to independent agents as compensation for selling their products.
While the pool participants sell substantially all their insurance through their network of independent agents, many of their competitors sell insurance through a variety of other delivery methods, including captive agencies, the internet and direct sales. To the extent that businesses and individuals represented by the pool participants’ independent agents change their delivery system preferences, the Company’s business, financial condition or results of operations may be adversely affected.
The failure of the pool participants to maintain their current financial strength rating could materially and adversely affect the Company’s business and competitive position.
The pool participants, including the Company’s property and casualty insurance subsidiaries, are currently rated “A” (Excellent) by A.M. Best, an industry-accepted source of property and casualty insurance company financial strength ratings. A.M. Best ratings are specifically designed to provide an independent opinion of an insurance company’s financial health and its ability to meet ongoing obligations to policyholders. These ratings are directed toward the protection of policyholders, not investors. If the ratings of the pool participants were to be downgraded (particularly below "A-") by A.M. Best, it would adversely affect the Company’s competitive position and make it more difficult for it to market its products, and retain its existing agents and policyholders. A downgrade of Employers Mutual's rating below "A-" could make it ineligible to assume certain reinsurance business, which could lead to a reduction in the amount of business ceded to the Company's reinsurance subsidiary under the quota share agreement. Thus, a downgrade in the pool participants’ (including Employers Mutual’s) A.M. Best ratings below "A-" would likely result in a material reduction in the amount of the Company’s business.
The insolvency of Employers Mutual or one of its subsidiaries or affiliate could result in additional liabilities for the Company’s insurance subsidiaries participating in the pooling agreement.
The pooling agreement requires each pool participant to assume its pro rata share (based on its participation interest in the pool) of the liabilities of any pool participant that becomes insolvent or is otherwise subject to liquidation or receivership proceedings. Under this provision, the Company’s pool participants could become financially responsible for their pro rata share of the liabilities of one or more of the Employers Mutual pool participants in the event of an insolvency, or a liquidation or receivership proceeding involving such participant(s).
The Company is dependent on dividends from its subsidiaries for the payment of its operating expenses and dividends to stockholders; however, its subsidiaries may be unable to pay dividends to the Company.
As a holding company, the Company relies primarily on dividends from its subsidiaries as a source of funds to meet its corporate obligations and pay dividends to its stockholders. Payment of dividends by the Company’s subsidiaries is subject to regulatory restrictions, and depends on the surplus position of its subsidiaries. The maximum amount of dividends that the Company’s subsidiaries can pay it in 2016 without prior regulatory approval is approximately $49.8 million. In addition, state insurance regulators have broad discretion to limit the payment of dividends by the Company’s subsidiaries in the future. The ability of its subsidiaries to pay dividends to it may be further constrained by business and regulatory considerations, such as the impact of dividends on surplus, competitive position and the amount of premiums that can be written.
45
The Company’s investment portfolio is subject to economic loss, principally from changes in the market value of financial instruments.
The Company had fixed maturity investments with a fair value of $1.2 billion at December 31, 2015 that are subject to:
• market risk, which is the risk that the Company’s invested assets will decrease in value due to:
• an increase in interest rates or a change in the prevailing market yields on its investments,
• an unfavorable change in the liquidity of an investment, or
• an unfavorable change in the financial prospects, or a downgrade in the credit rating, of the issuer of aninvestment;
• reinvestment risk, which is the risk that interest rates will decline and funds reinvested will earn less investmentincome than previously earned; and
• liquidity risk, which is the risk that the Company may have to sell assets at an undesirable time and/or price toprovide cash for the payment of claims.
The Company maintains a well diversified portfolio of fixed maturity securities in an attempt to manage market, reinvestment and liquidity risk. The Company primarily pursues a buy and hold strategy for fixed maturity investments. Fixed maturity securities are purchased as new funds become available to the portfolio. This strategy has a laddering effect on portfolio maturities that mitigates some of the effects of adverse interest rate movements.
The Company’s fixed maturity investment portfolio includes mortgage-backed securities. As of December 31, 2015, mortgage-backed securities constituted approximately 12.3 percent of the fixed maturity portfolio. As with other fixed maturity investments, the fair value of these securities fluctuates depending on market and other general economic conditions and the interest rate environment. Changes in interest rates can expose the Company to prepayment risks on these investments. In periods of declining interest rates, mortgage prepayments generally increase and mortgage-backed securities are paid more quickly, requiring the Company to reinvest the proceeds at the then current market rates.
The Company’s common stock equity portfolio, with a fair value of $187.2 million as of December 31, 2015, is subject to economic loss from a decline in market prices. The Company invests in publicly traded companies listed in the United States with large market capitalizations. An adverse development in the stock market, or one or more securities that the Company invests in, could adversely affect its capital position. The Company is currently invested in a limited partnership that is designed to help protect the Company from significant monthly downside price volatility in the equity markets. However, this type of protection may be discontinued in the future depending on market conditions and/or the cost of the protection.
The success of any investment activity is affected by general economic conditions, which may adversely affect the markets for fixed maturity and equity securities. Unexpected volatility or illiquidity in the markets in which the Company holds securities could reduce its liquidity and stockholders’ equity. To mitigate these risks, the Company’s insurance and reinsurance subsidiaries are able to borrow funds on a short-term basis from Employers Mutual and its subsidiaries and affiliate under an Inter-Company Loan Agreement.
Changes in key assumptions or a deterioration in the debt and equity markets could lead to an increase in Employers Mutual’s employee benefit plans' costs and a decline in the funded status, which could have a material adverse effect on the Company’s financial condition and/or results of operations.
Employers Mutual's employee benefit plans' costs and funded status reflect the use of key assumptions regarding the discount rate, the expected long-term rate of return on plan assets, and the rate of future compensation increases (pension plans only). Changes in these assumptions could result in a significant decrease in the plans’ funded status and increase the future net periodic costs associated with these plans. In addition, large declines in the fair value of the assets held in the plans could result in a significant decrease in the plans’ funded status and increase the future net periodic costs associated with these plans. A decrease to the plans' funded status could require Employers Mutual to make significant contributions to its employee benefit plans to maintain adequate funding levels, and the Company would be responsible for its share of these contributions under the pooling agreement. The occurrence of these events could have a material adverse effect on the Company’s financial condition and/or results of operations.
46
The pool participants currently conduct business in all 50 states and the District of Columbia, with a concentration of business in the Midwest. The occurrence of catastrophes, or other conditions affecting losses in this region, could adversely affect the Company’s business, financial condition or results of operations.
In 2015, 69 percent of the pool participant’s direct premiums written were generated through ten Midwest branch offices, with 13 percent of the direct premiums written generated in Iowa. While the pool participants actively manage their exposure to catastrophes through their underwriting process and the purchase of third-party reinsurance, a single catastrophic occurrence, destructive weather pattern, changing climate conditions, general economic trend, terrorist attack, regulatory development or any other condition affecting the states in which the pool participants conduct substantial business could materially adversely affect the Company’s business, financial condition or results of operations. Moreover, the Company’s revenues and profitability are affected by the prevailing regulatory, economic, demographic, competitive and other conditions in these states. Changes in any of these conditions could make it more costly or more difficult for the pool participants to conduct their business. Adverse regulatory developments in these states could include reductions in the maximum rates permitted to be charged, restrictions on rate increases, or fundamental changes to the design or operation of the regulatory framework, and any of these could have a material adverse effect on the Company’s business, financial condition or results of operations.
The Company cannot predict the impact that changing climate conditions, including legal, regulatory, and social responses thereto, may have on the Company’s business, financial condition or results of operations.
Some scientists, environmentalists, and other experts believe that changing climate conditions have added to the unpredictability, frequency, and severity of weather-related losses. If climate conditions are changing and affecting weather patterns, the Company could experience additional losses from catastrophic events and destructive weather patterns. The Company cannot predict the impact that changing climate conditions, if any, will have on the Company’s business, financial condition or results of operations. It is also possible that legal, regulatory and social responses to climate change could have a material adverse effect on the Company’s business, financial condition or results of operations.
The frequency and severity of significant catastrophe and storm activity could adversely affect the Company’s business, financial condition or results of operations.
The Company's insurance operations expose the Company to claims arising out of catastrophic events. Common catastrophic events include tornadoes, wind and hail storms, hurricanes, earthquakes, fires, explosions and severe winter storms. If changing climate conditions result in an increase in the frequency and severity of weather-related losses, the Company could experience additional losses from catastrophic events and destructive weather patterns. High levels of catastrophe and storm losses could lead to changes in the reinsurance programs protecting the Company (including the reinsurance coverage provided by Employers Mutual to the Company’s property and casualty insurance subsidiaries and reinsurance subsidiary). These changes could include increases in the amount of losses retained, increased pricing and, for the pool participants, decreased availability of catastrophe reinsurance protection. Examples of such changes include increases in the pool participants’ retention amounts on ceded contracts covering the pool business, and increases in the amount of losses retained by the reinsurance subsidiary. Future increases in the cost of reinsurance protection, and/or the amount of catastrophe and storm losses retained, could materially adversely affect the Company’s business, financial condition or results of operations.
Losses related to a terrorist attack could have a material adverse impact on the Company’s business, financial condition or results of operations.
Terrorist attacks could cause significant losses from insurance claims related to the property and casualty insurance operations of the pool participants and the reinsurance operations of the Company’s reinsurance subsidiary, and have a material adverse impact on the Company’s business, financial condition or results of operations. The TRIA Reauthorization Act requires that some coverage for terrorism losses be offered by primary property and casualty insurers, and provides federal assistance for recovery of a portion of claims incurred (effective through December 31, 2020). While the pool participants are protected by this federally funded terrorism reinsurance with respect to claims under most commercial insurance products, the pool participants are prohibited from adding terrorism exclusions to the commercial lines policies they write, and a substantial deductible must be met before the TRIA Reauthorization Act provides coverage to the pool. The pool participants’ personal lines products do not provide terrorism coverage. The pool participants have underlying reinsurance coverage to partially cover the TRIA Reauthorization Act deductible, but the Company can offer no assurances that the threats or actual occurrence of future terrorist-like events in the United States and abroad, or military actions by the United States, will not have a material adverse effect on its business, financial condition or results of operations.
47
The profitability of the Company’s reinsurance subsidiary is dependent upon the experience of Employers Mutual, and changes to this relationship may adversely affect the reinsurance subsidiary’s operations.
The Company’s reinsurance subsidiary operates under a quota share reinsurance agreement with Employers Mutual, which generated 21 percent of the Company’s net premiums earned in 2015. Under the quota share reinsurance agreement, the reinsurance subsidiary assumes the voluntary reinsurance business written directly by Employers Mutual (subject to certain limited exceptions). The reinsurance subsidiary also has an excess of loss agreement with Employers Mutual, which is being modified for 2016. The reinsurance subsidiary primarily relies on these agreements and on Employers Mutual for its business. If Employers Mutual terminates or otherwise seeks to modify these agreements, the reinsurance subsidiary may not be able to enter into similar arrangements with other companies and may be adversely affected.
Through the quota share reinsurance agreement, the reinsurance subsidiary assumes the voluntary reinsurance business written directly by Employers Mutual with unaffiliated insurance companies, and the reinsurance business assumed by Employers Mutual from MRB, a voluntary underwriting association of property and casualty insurers in which Employers Mutual participates. If Employers Mutual or the other participants of MRB discontinue or reduce the assumption of property and casualty risks, the reinsurance subsidiary could be adversely affected. In connection with the risks assumed from MRB, officers of the reinsurance subsidiary and Employers Mutual have reviewed the relevant underwriting policies and procedures, however, no officer of the reinsurance subsidiary directly reviews such risks assumed at the time of underwriting. If Employers Mutual or MRB are unable to sell reinsurance at adequate premium rates, or were to have poor underwriting experience, the reinsurance subsidiary could be adversely affected. In addition, since MRB is structured on a joint liability basis, Employers Mutual, and therefore the Company’s reinsurance subsidiary, would be obligated with respect to the proportionate share of risks assumed by the other participants in the event they were unable to perform. The failure of the other MRB participants to perform could have a material adverse effect on the Company’s financial condition or results of operations.
The Company may not be successful in reducing its risks and increasing its underwriting capacity through reinsurance arrangements, which could adversely affect its business, financial condition or results of operations.
In order to reduce underwriting risk and increase underwriting capacity, the pool participants transfer portions of the pool’s insurance risk to other insurers through reinsurance contracts. The availability, cost and structure of reinsurance protection is subject to changing market conditions that are outside of the pool participants’ control. In order for these contracts to qualify for reinsurance accounting and thereby provide the additional underwriting capacity that the pool participants desire, the reinsurer generally must assume significant risk and have a reasonable possibility of a significant loss.
The reinsurance subsidiary assumes and cedes some selected reinsurance business through the quota share agreement in connection with “fronting” activities initiated by Employers Mutual. Under these arrangements, an agreed upon percentage of the selected assumed business is ceded to other reinsurer(s) on a pro rata basis.
Although the reinsurers are liable to the extent they assume risk, the Company’s insurance subsidiaries remain ultimately liable on all risks reinsured. As a result, ceded reinsurance arrangements do not limit the ultimate obligation to pay claims. The Company’s insurance subsidiaries are subject to the credit risks of their reinsurers. They are also subject to the risk that their reinsurers may dispute obligations to pay their claims. As a result, the Company’s insurance subsidiaries may not recover on claims made against their reinsurers in a timely manner, if at all, which could have a material adverse effect on the Company’s business, financial condition or results of operations.
The Company’s business is highly cyclical and competitive, which may make it difficult for it to market its products effectively and profitably.
The property and casualty insurance industry is highly cyclical and competitive, and individual lines of business experience their own cycles within the overall insurance industry cycle. Premium rate levels are subject to many variables, including the availability of insurance coverage, which can vary according to the level of capital within the industry. Increases in industry capital have generally been accompanied by increased price competition. If the pool participants find it necessary to reduce premiums or limit premium increases due to these competitive pressures on pricing, the Company may experience a reduction in its profit margins and revenues and, therefore, lower profitability.
The pool participants compete with insurers that sell insurance policies through independent agents and/or directly to their customers. These competitors are not only national companies, but also insurers and independent agents that operate in a specific region or a single state. Some of these competitors have substantially greater financial and other resources than the pool participants, and may offer a broader range of products or offer competing products at lower prices. The Company’s financial condition and results of operations could be materially and adversely affected by a loss of business to its competitors.
48
The reinsurance business is also highly cyclical and competitive. Employers Mutual, in writing reinsurance business through its HORAD operation, competes in the global reinsurance market with numerous reinsurance companies, many of which have substantially greater financial resources. Competition for reinsurance business is based on many factors, including the perceived financial strength of the reinsurer, industry ratings, stability in products offered and licensing status. There is a segment of the market that favors large, highly-capitalized reinsurance companies who are able to provide “mega” line capacity for multiple lines of business. Employers Mutual faces the risk of ceding companies becoming less interested in diversity and spread of reinsurance risk in favor of having fewer, highly-capitalized reinsurance companies on their program. If Employers Mutual loses reinsurance business to its competitors, the Company’s financial condition and results of operations could be materially and adversely affected.
New pricing, claims, coverage issues, class action litigation, and technology innovations are continually emerging in the property and casualty insurance industry, and these new issues could adversely impact the Company’s revenues or its methods of doing business.
As property and casualty insurance industry practices, and regulatory, judicial and consumer conditions change, unexpected and unintended issues related to claims, coverages and business practices may emerge. These issues could have an adverse effect on the Company’s business by changing the way the pool participants price their products, by extending coverages beyond their underwriting intent, or by increasing the size of claims. The effect of unforeseen emerging issues could negatively affect the Company’s results of operations or its methods of doing business. In addition, the advent of driverless cars and usage-based insurance could materially alter the way that automobile insurance is marketed, priced, and underwritten.
The Company is subject to comprehensive regulation that may restrict its ability to earn profits.
The Company is subject to comprehensive regulation and supervision by the insurance departments in the states where its subsidiaries are domiciled and where its subsidiaries and the other pool participants sell insurance products, issue policies and handle claims. Certain regulatory restrictions and prior approval requirements may affect the pool participants’ ability to operate, compete, innovate or obtain necessary rate adjustments in a timely manner, and may also increase their costs and reduce profitability.
Supervision and regulation by insurance departments extend, among other things, to:
Required Licensing. The pool participants operate under licenses issued by various state insurance departments. These licenses govern, among other things, the types of insurance coverages, agency and claims services, and products that the pool participants may offer consumers in the states in which they operate. The pool participants must apply for and obtain appropriate licenses before they can implement any plan to expand into a new state or offer a new line of insurance or other new products that require separate licensing. If a regulatory authority denies or delays granting a new license, the pool participants’ ability to enter new markets quickly or offer new products they believe will be profitable can be substantially impaired.
Regulation of Premium Rates and Approval of Policy Forms. The insurance laws of most states in which the pool participants operate require insurance companies to file premium rate schedules and insurance policy forms for review and approval. State insurance departments have broad discretion in judging whether the pool participants’ rates are adequate, not excessive and not unfairly discriminatory. The speed at which the pool participants can change their rates in response to competition or increased costs depends, in part, on the method by which the applicable state’s rating laws are administered. Generally, state insurance departments have the authority to disapprove the pool participants’ requested rates. Thus, if the pool participants begin using new rates before they are approved, as permitted in some states, they may be required to issue premium refunds or credits to their policyholders if the new rates are ultimately deemed excessive or unfair, and are disapproved by the applicable state department. In addition, in some states, there has been pressure in past years to reduce premium rates for automobile and other personal insurance, or to limit how often an insurer may request increases for such rates. In states where such pressure is applied, the pool participants’ ability to respond to market developments or increased costs can be adversely affected.
Restrictions on Cancellation, Non-Renewal or Withdrawal. Many states have laws and regulations that limit an insurer’s ability to exit a market. Some states prohibit an insurer from withdrawing from one or more lines of business in the state, except pursuant to a plan approved by the state insurance department. A state insurance department may disapprove a plan that may lead, under its analyses, to market disruption. These laws and regulations could limit the pool participants’ ability to exit unprofitable markets or discontinue unprofitable products in the future.
Investment Restrictions. The Company’s subsidiaries are subject to state laws and regulations that require diversification of their investment portfolios, and that limit the amount of investments in certain categories. Failure to comply with these laws and regulations would cause nonconforming investments to be treated as non-admitted assets for purposes of measuring statutory surplus and, in some instances, would require divestiture.
49
Other Regulations. The Company must also comply with laws and regulations involving, among other things:
• disclosure, and in some cases prior approval, of transactions between members of an insurance holding companysystem;
• acquisition or disposition of an insurance company, or of any company controlling an insurance company;
• involuntary assignments of high-risk policies, participation in reinsurance facilities and underwriting associations,and assessments and other governmental charges;
• use of non-public consumer information and related privacy issues; and
• use of credit history in underwriting and rating.
These laws and regulations could adversely affect the Company’s profitability.
The Company cannot provide any assurance that states will not make existing insurance laws and regulations morerestrictive in the future, or enact new restrictive laws.
From time to time, the United States Congress and certain federal agencies investigate the current condition of the insurance industry to determine whether federal regulation is necessary. The Company closely monitors the activities of the United States Congress and federal agencies through its membership in various organizations. In particular, our trade organizations are working to monitor and ensure appropriate implementation of the federal terrorism risk insurance program, to shape the activities of the Federal Insurance Office as it continues to evolve and exercise its authority to monitor the insurance industry, to pass appropriate tax reform legislation, and to extend the judicial relief from the remand to an exemption for property and hazard and homeowners insurance from application of the Department of Housing and Urban Development’s Disparate Impact Rule. The Company is unable to predict whether, or to what extent, new laws and regulations that could affect its business will be adopted in the future, the timing of any such adoption and what effects, if any, they may have on its business, financial condition or results of operations.
Changes to existing accounting standards may adversely affect the Company’s consolidated financial statements.
The Company is required to prepare its consolidated financial statements in accordance with GAAP, as promulgated by the Financial Accounting Standards Board ("FASB"), subject to accounting rules and interpretations of the Securities and Exchange Commission. Accordingly, the Company is required to adopt new or revised accounting standards issued by these authoritative bodies from time to time. It is possible that changes to the Company’s accounting policies resulting from the adoption of future changes in GAAP, including an updated financial instruments standard issued in January 2016 and a new lease accounting standard issued in February 2016, could have a material adverse effect on the Company’s reported financial condition and/or results of operations. The Company's significant accounting policies are described in note 1 of Notes to Consolidated Financial Statements under Part II, Item 8 of this Form 10-K.
The Company relies on Employer Mutual’s information technology and telecommunication systems, and the disruption or failure of these systems, or the compromise of the security of the systems that results in the misuse of confidential information, could materially and adversely affect its business.
The Company’s business is highly dependent upon the successful and uninterrupted functioning of Employers Mutual’s information technology and telecommunications systems. The Company relies on the capacity, reliability and security of these systems to process new and renewal business, provide customer service, process and pay claims, and facilitate collections and cancellations. These systems also enable the performance of actuarial and other modeling functions necessary for underwriting and rate development and establishing and evaluating reserves. Despite security measures in place, the information technology systems could be vulnerable to computer malware or viruses, unauthorized access, or other cyber attacks that could disrupt the systems. The failure or disruption of these systems could interrupt the Company’s operations through reduced ability to underwrite and process new and renewal business, pay claims in a timely manner and provide customer service.
A security breach of information technology systems that results in the misuse or misappropriation of confidential information could expose Employers Mutual to litigation, or damage Employers Mutual’s reputation. Any legal or other expenses resulting from the misuse of confidential information would be shared by all users of the systems, including the Company and its subsidiaries, and such losses could be significant.
50
Although Employers Mutual maintains insurance on its real property and other physical assets, this insurance will not compensate Employers Mutual for losses that may occur due to disruptions in service as a result of a computer, data processing or telecommunication systems failure unrelated to covered property damage. Also, this insurance may not necessarily compensate Employers Mutual for all losses resulting from covered events. Employers Mutual retains the risks from disruptions in computer processing and telecommunications services, and has implemented a variety of controls to mitigate these risks including, but not limited to, off-site back-up and redundant processing capabilities, access restrictions to confidential customer data, and documented plans for resuming operations upon the occurrence of an event. A portion of any losses resulting from the failure or disruption of Employers Mutual’s information technology and telecommunication systems would be shared by all users of the systems, including the Company and its subsidiaries, and such losses could be significant.
Risks Relating to the Company’s Common Stock
Employers Mutual has the ability to determine the outcome of all matters submitted to the Company’s stockholders for approval. The price of the Company’s common stock may be adversely affected because of Employers Mutual’s majority ownership of the Company’s common stock.
The Company’s common stock has one vote per share and voting control of the Company is currently vested in Employers Mutual, which owns approximately 57 percent of the Company’s outstanding common stock. Employers Mutual must retain a minimum 50.1 percent ownership of the Company’s outstanding common stock at all times in order for the pool participants to have their A.M. Best financial strength ratings determined on a “group” basis. Accordingly, Employers Mutual will retain the ability to control:
• the election of the Company’s entire board of directors, which in turn determines its management and policies;
• the outcome of any corporate transaction or other matter submitted to the Company’s stockholders for approval,including mergers or other transactions providing for a change of control; and
• the amendment of the Company’s organizational documents.
The interests of Employers Mutual may conflict with the interests of the Company’s other stockholders and may have anegative effect on the price of the Company’s common stock.
Employers Mutual’s ownership of the Company’s common stock and provisions of certain state laws make it unlikely anyone could acquire control of the Company or replace or remove its management unless Employers Mutual were in favor of such action, which could diminish the value of the Company’s common stock.
Employers Mutual’s ownership of the Company’s common stock and the laws and regulations of Iowa and North Dakota could delay, or prevent, the removal of members of its board of directors, and could make a merger, tender offer or proxy contest involving the Company more difficult to complete, even if such events were beneficial to the interest of its stockholders other than Employers Mutual. The insurance laws of the states in which the Company’ subsidiaries are domiciled prohibit any person from acquiring control of it, and thus indirect control of its subsidiaries, without the prior approval of each such state insurance department. Generally, these laws presume that control exists where any person, directly or indirectly, owns, controls, holds the power to vote, or holds proxies representing 10 percent or more of the Company’s outstanding common stock. Even persons who do not acquire beneficial ownership of 10 percent or more of the outstanding shares of the Company’s common stock may be deemed to have acquired such control, if the relevant insurance department determines that such control exists in fact. Therefore, any person seeking to acquire a controlling interest in the Company would face regulatory obstacles, which could delay, deter or prevent an acquisition that stockholders might consider to be in their best interests. Moreover, the Iowa Business Corporation Act, which governs the Company’s corporate activities, contains certain provisions that prohibit certain business combination transactions under certain circumstances. These factors could discourage a third party from attempting to acquire control of the Company and thus could have a negative impact on the value of the Company's common stock.
Although the Company has consistently paid cash dividends in the past, it may not be able to pay cash dividends in the future.
The Company has paid cash dividends to its stockholders on a consistent basis since 1982, following the initial public offering of its common stock. However, future cash dividends will depend upon various factors, including the ability of the Company’s subsidiaries to make distributions to it, which may be restricted by financial or regulatory constraints. Also, there can be no assurance that the Company will continue to pay dividends even if the necessary financial and regulatory conditions are met and if sufficient cash is available for distribution.
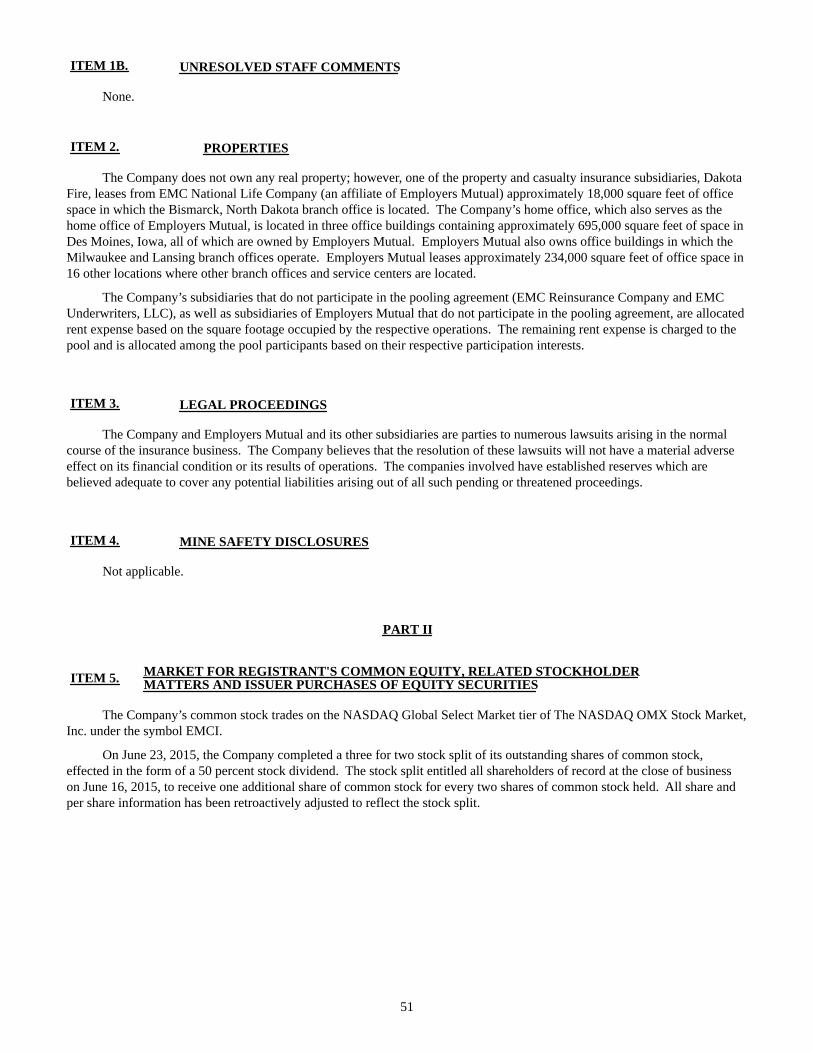
51
ITEM 1B. UNRESOLVED STAFF COMMENTS
None.
ITEM 2. PROPERTIES
The Company does not own any real property; however, one of the property and casualty insurance subsidiaries, Dakota Fire, leases from EMC National Life Company (an affiliate of Employers Mutual) approximately 18,000 square feet of office space in which the Bismarck, North Dakota branch office is located. The Company’s home office, which also serves as the home office of Employers Mutual, is located in three office buildings containing approximately 695,000 square feet of space in Des Moines, Iowa, all of which are owned by Employers Mutual. Employers Mutual also owns office buildings in which the Milwaukee and Lansing branch offices operate. Employers Mutual leases approximately 234,000 square feet of office space in 16 other locations where other branch offices and service centers are located.
The Company’s subsidiaries that do not participate in the pooling agreement (EMC Reinsurance Company and EMC Underwriters, LLC), as well as subsidiaries of Employers Mutual that do not participate in the pooling agreement, are allocated rent expense based on the square footage occupied by the respective operations. The remaining rent expense is charged to the pool and is allocated among the pool participants based on their respective participation interests.
ITEM 3. LEGAL PROCEEDINGS
The Company and Employers Mutual and its other subsidiaries are parties to numerous lawsuits arising in the normal course of the insurance business. The Company believes that the resolution of these lawsuits will not have a material adverse effect on its financial condition or its results of operations. The companies involved have established reserves which are believed adequate to cover any potential liabilities arising out of all such pending or threatened proceedings.
ITEM 4. MINE SAFETY DISCLOSURES
Not applicable.
PART II
ITEM 5. MARKET FOR REGISTRANT'S COMMON EQUITY, RELATED STOCKHOLDERMATTERS AND ISSUER PURCHASES OF EQUITY SECURITIES
The Company’s common stock trades on the NASDAQ Global Select Market tier of The NASDAQ OMX Stock Market, Inc. under the symbol EMCI.
On June 23, 2015, the Company completed a three for two stock split of its outstanding shares of common stock, effected in the form of a 50 percent stock dividend. The stock split entitled all shareholders of record at the close of business on June 16, 2015, to receive one additional share of common stock for every two shares of common stock held. All share and per share information has been retroactively adjusted to reflect the stock split.
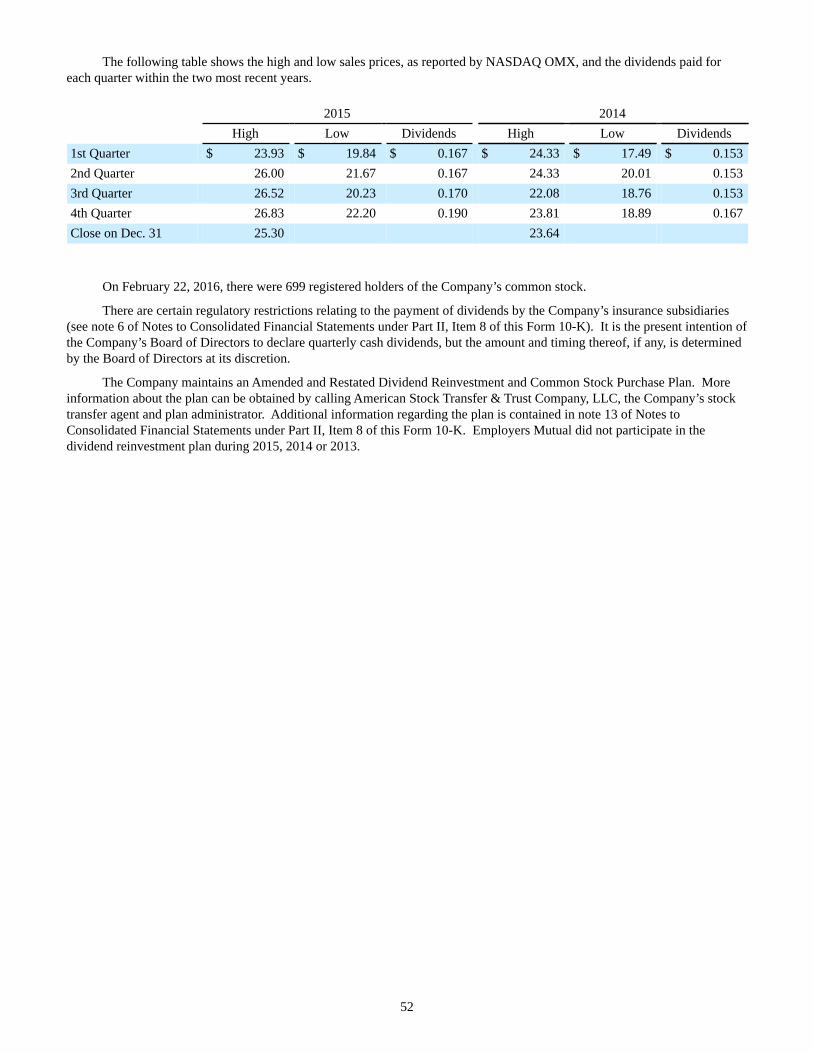
52
The following table shows the high and low sales prices, as reported by NASDAQ OMX, and the dividends paid for each quarter within the two most recent years.
2015 2014High Low Dividends High Low Dividends
1st Quarter $ 23.93 $ 19.84 $ 0.167 $ 24.33 $ 17.49 $ 0.1532nd Quarter 26.00 21.67 0.167 24.33 20.01 0.1533rd Quarter 26.52 20.23 0.170 22.08 18.76 0.1534th Quarter 26.83 22.20 0.190 23.81 18.89 0.167Close on Dec. 31 25.30 23.64
On February 22, 2016, there were 699 registered holders of the Company’s common stock.
There are certain regulatory restrictions relating to the payment of dividends by the Company’s insurance subsidiaries (see note 6 of Notes to Consolidated Financial Statements under Part II, Item 8 of this Form 10-K). It is the present intention of the Company’s Board of Directors to declare quarterly cash dividends, but the amount and timing thereof, if any, is determined by the Board of Directors at its discretion.
The Company maintains an Amended and Restated Dividend Reinvestment and Common Stock Purchase Plan. More information about the plan can be obtained by calling American Stock Transfer & Trust Company, LLC, the Company’s stock transfer agent and plan administrator. Additional information regarding the plan is contained in note 13 of Notes to Consolidated Financial Statements under Part II, Item 8 of this Form 10-K. Employers Mutual did not participate in the dividend reinvestment plan during 2015, 2014 or 2013.
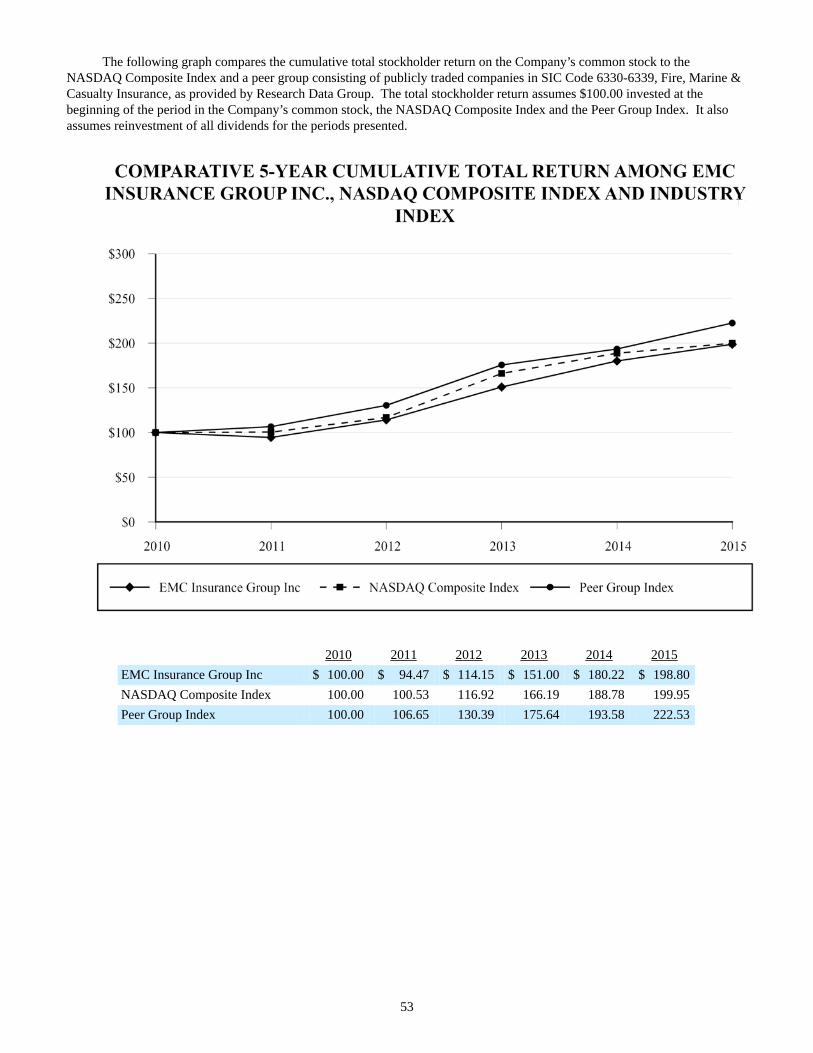
53
The following graph compares the cumulative total stockholder return on the Company’s common stock to the NASDAQ Composite Index and a peer group consisting of publicly traded companies in SIC Code 6330-6339, Fire, Marine & Casualty Insurance, as provided by Research Data Group. The total stockholder return assumes $100.00 invested at the beginning of the period in the Company’s common stock, the NASDAQ Composite Index and the Peer Group Index. It also assumes reinvestment of all dividends for the periods presented.
2010 2011 2012 2013 2014 2015EMC Insurance Group Inc $ 100.00 $ 94.47 $ 114.15 $ 151.00 $ 180.22 $ 198.80NASDAQ Composite Index 100.00 100.53 116.92 166.19 188.78 199.95Peer Group Index 100.00 106.65 130.39 175.64 193.58 222.53
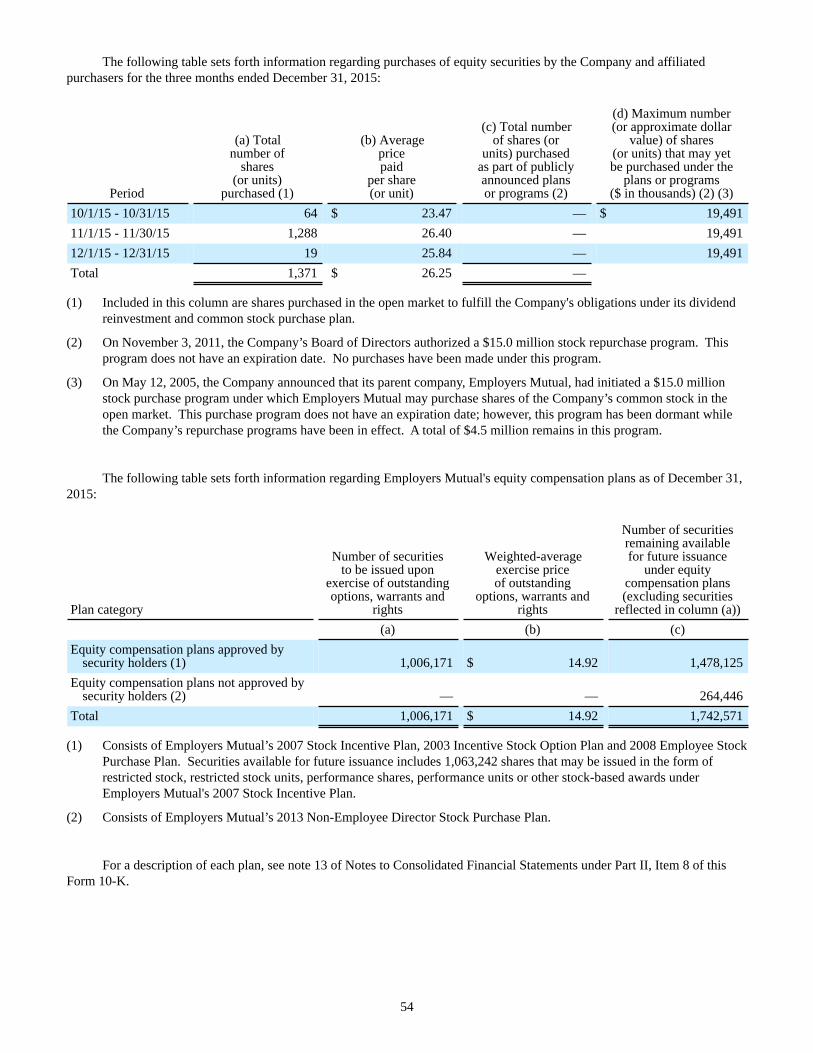
54
The following table sets forth information regarding purchases of equity securities by the Company and affiliated purchasers for the three months ended December 31, 2015:
Period
(a) Totalnumber of
shares(or units)
purchased (1)
(b) Averagepricepaid
per share(or unit)
(c) Total numberof shares (or
units) purchasedas part of publiclyannounced plansor programs (2)
(d) Maximum number(or approximate dollar
value) of shares(or units) that may yetbe purchased under the
plans or programs($ in thousands) (2) (3)
10/1/15 - 10/31/15 64 $ 23.47 — $ 19,49111/1/15 - 11/30/15 1,288 26.40 — 19,49112/1/15 - 12/31/15 19 25.84 — 19,491Total 1,371 $ 26.25 —
(1) Included in this column are shares purchased in the open market to fulfill the Company's obligations under its dividendreinvestment and common stock purchase plan.
(2) On November 3, 2011, the Company’s Board of Directors authorized a $15.0 million stock repurchase program. Thisprogram does not have an expiration date. No purchases have been made under this program.
(3) On May 12, 2005, the Company announced that its parent company, Employers Mutual, had initiated a $15.0 millionstock purchase program under which Employers Mutual may purchase shares of the Company’s common stock in theopen market. This purchase program does not have an expiration date; however, this program has been dormant whilethe Company’s repurchase programs have been in effect. A total of $4.5 million remains in this program.
The following table sets forth information regarding Employers Mutual's equity compensation plans as of December 31, 2015:
Plan category
Number of securitiesto be issued upon
exercise of outstandingoptions, warrants and
rights
Weighted-averageexercise priceof outstanding
options, warrants andrights
Number of securitiesremaining availablefor future issuance
under equitycompensation plans(excluding securities
reflected in column (a))(a) (b) (c)
Equity compensation plans approved bysecurity holders (1) 1,006,171 $ 14.92 1,478,125
Equity compensation plans not approved bysecurity holders (2) — — 264,446
Total 1,006,171 $ 14.92 1,742,571
(1) Consists of Employers Mutual’s 2007 Stock Incentive Plan, 2003 Incentive Stock Option Plan and 2008 Employee StockPurchase Plan. Securities available for future issuance includes 1,063,242 shares that may be issued in the form ofrestricted stock, restricted stock units, performance shares, performance units or other stock-based awards underEmployers Mutual's 2007 Stock Incentive Plan.
(2) Consists of Employers Mutual’s 2013 Non-Employee Director Stock Purchase Plan.
For a description of each plan, see note 13 of Notes to Consolidated Financial Statements under Part II, Item 8 of this Form 10-K.
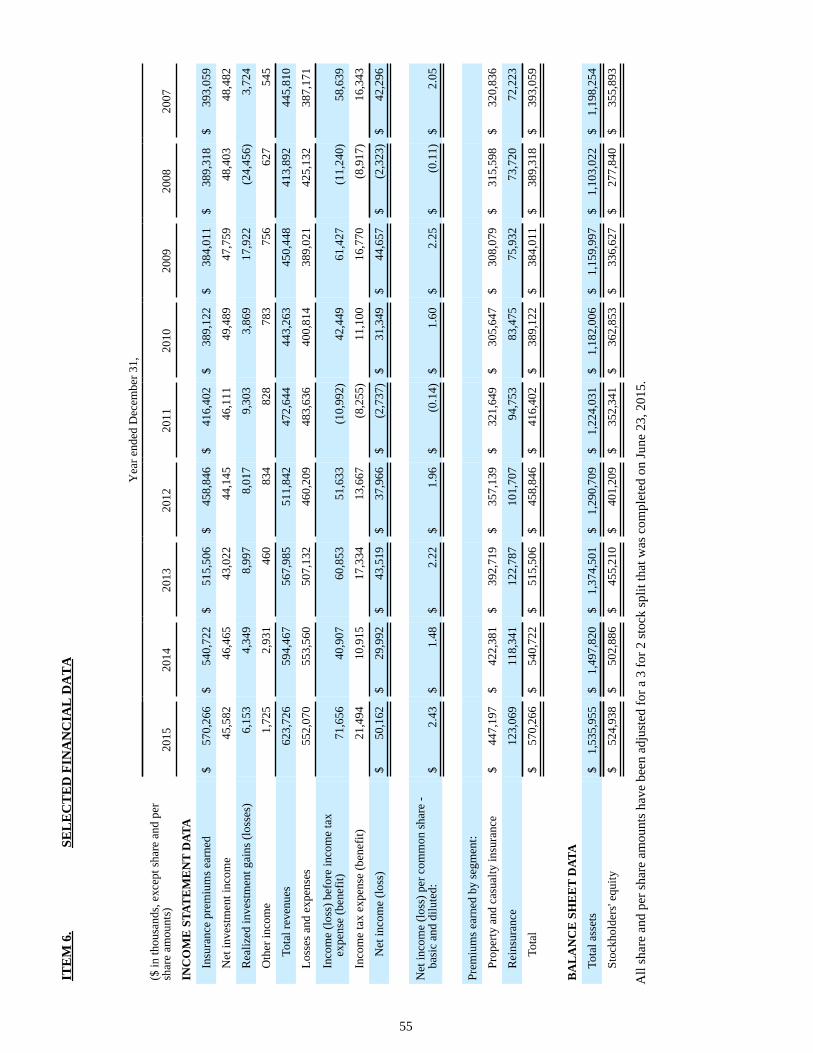
55
ITE
M 6
.SE
LE
CT
ED
FIN
AN
CIA
L D
AT
A
Yea
r end
ed D
ecem
ber 3
1,
($ in
thou
sand
s, ex
cept
shar
e an
d pe
r sh
are
amou
nts)
2015
2014
2013
2012
2011
2010
2009
2008
2007
INC
OM
E S
TAT
EM
EN
T D
ATA
Insu
ranc
e pr
emiu
ms e
arne
d$
570,
266
$54
0,72
2$
515,
506
$45
8,84
6$
416,
402
$38
9,12
2$
384,
011
$38
9,31
8$
393,
059
Net
inve
stm
ent i
ncom
e45
,582
46,4
6543
,022
44,1
4546
,111
49,4
8947
,759
48,4
0348
,482
Rea
lized
inve
stm
ent g
ains
(los
ses)
6,15
34,
349
8,99
78,
017
9,30
33,
869
17,9
22(2
4,45
6)3,
724
Oth
er in
com
e1,
725
2,93
146
083
482
878
375
662
754
5
Tota
l rev
enue
s62
3,72
659
4,46
756
7,98
551
1,84
247
2,64
444
3,26
345
0,44
841
3,89
244
5,81
0
Loss
es a
nd e
xpen
ses
552,
070
553,
560
507,
132
460,
209
483,
636
400,
814
389,
021
425,
132
387,
171
Inco
me
(loss
) bef
ore
inco
me
tax
expe
nse
(ben
efit)
71,6
5640
,907
60,8
5351
,633
(10,
992)
42,4
4961
,427
(11,
240)
58,6
39
Inco
me
tax
expe
nse
(ben
efit)
21,4
9410
,915
17,3
3413
,667
(8,2
55)
11,1
0016
,770
(8,9
17)
16,3
43
Net
inco
me
(loss
)$
50,1
62$
29,9
92$
43,5
19$
37,9
66$
(2,7
37)
$31
,349
$44
,657
$(2
,323
)$
42,2
96
Net
inco
me
(loss
) per
com
mon
shar
e -
basi
c an
d di
lute
d:$
2.43
$1.
48$
2.22
$1.
96$
(0.1
4)$
1.60
$2.
25$
(0.1
1)$
2.05
Prem
ium
s ear
ned
by se
gmen
t:
Prop
erty
and
cas
ualty
insu
ranc
e$
447,
197
$42
2,38
1$
392,
719
$35
7,13
9$
321,
649
$30
5,64
7$
308,
079
$31
5,59
8$
320,
836
Rei
nsur
ance
123,
069
118,
341
122,
787
101,
707
94,7
5383
,475
75,9
3273
,720
72,2
23
Tota
l$
570,
266
$54
0,72
2$
515,
506
$45
8,84
6$
416,
402
$38
9,12
2$
384,
011
$38
9,31
8$
393,
059
BA
LA
NC
E S
HE
ET
DAT
A
Tota
l ass
ets
$1,
535,
955
$1,
497,
820
$1,
374,
501
$1,
290,
709
$1,
224,
031
$1,
182,
006
$1,
159,
997
$1,
103,
022
$1,
198,
254
Stoc
khol
ders
' equ
ity$
524,
938
$50
2,88
6$
455,
210
$40
1,20
9$
352,
341
$36
2,85
3$
336,
627
$27
7,84
0$
355,
893
All
shar
e an
d pe
r sha
re a
mou
nts h
ave
been
adj
uste
d fo
r a 3
for 2
stoc
k sp
lit th
at w
as c
ompl
eted
on
June
23,
201
5.
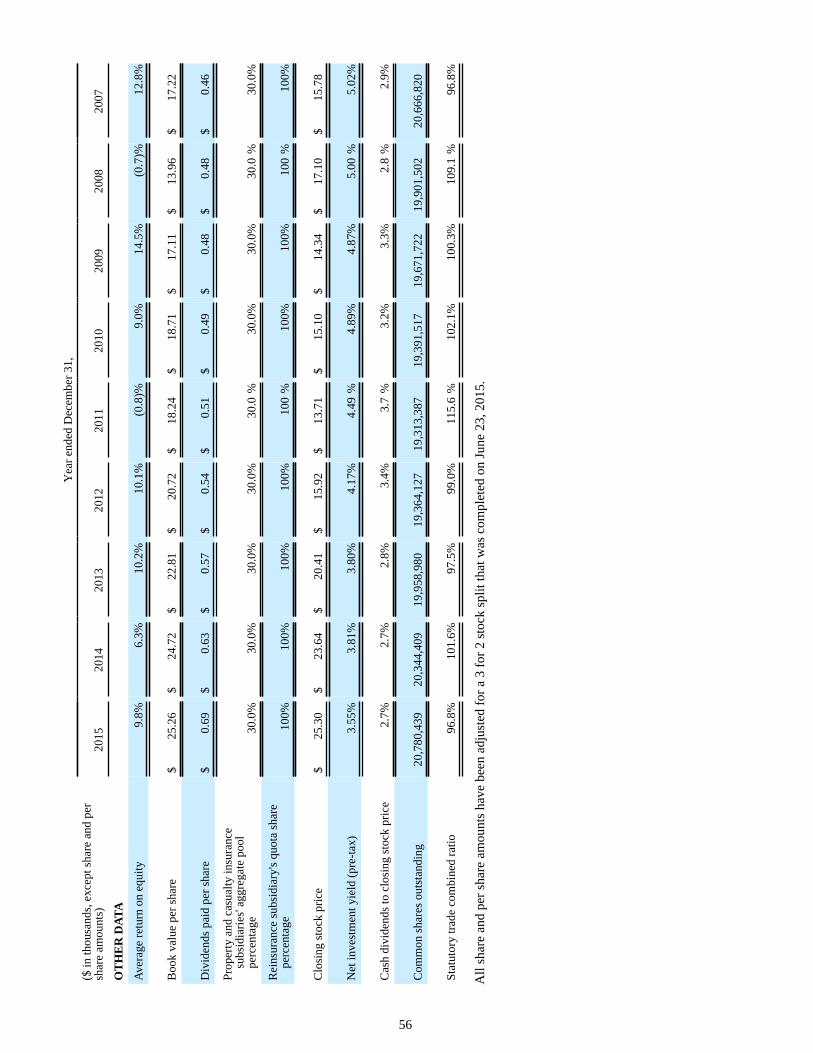
56
Yea
r end
ed D
ecem
ber 3
1,($
in th
ousa
nds,
exce
pt sh
are
and
per
shar
e am
ount
s)20
1520
1420
1320
1220
1120
1020
0920
0820
07
OT
HE
R D
ATA
Aver
age
retu
rn o
n eq
uity
9.8%
6.3%
10.2
%10
.1%
(0.8
)%9.
0%14
.5%
(0.7
)%12
.8%
Boo
k va
lue
per s
hare
$25
.26
$24
.72
$22
.81
$20
.72
$18
.24
$18
.71
$17
.11
$13
.96
$17
.22
Div
iden
ds p
aid
per s
hare
$0.
69$
0.63
$0.
57$
0.54
$0.
51$
0.49
$0.
48$
0.48
$0.
46
Prop
erty
and
cas
ualty
insu
ranc
e su
bsid
iarie
s' ag
greg
ate
pool
pe
rcen
tage
30.0
%30
.0%
30.0
%30
.0%
30.0
%30
.0%
30.0
%30
.0%
30.0
%
Rei
nsur
ance
subs
idia
ry's
quot
a sh
are
perc
enta
ge10
0%10
0%10
0%10
0%10
0%
100%
100%
100
%10
0%
Clo
sing
stoc
k pr
ice
$25
.30
$23
.64
$20
.41
$15
.92
$13
.71
$15
.10
$14
.34
$17
.10
$15
.78
Net
inve
stm
ent y
ield
(pre
-tax)
3.55
%3.
81%
3.80
%4.
17%
4.49
%4.
89%
4.87
%5.
00%
5.02
%
Cas
h di
vide
nds t
o cl
osin
g st
ock
pric
e2.
7%2.
7%2.
8%3.
4%3.
7%
3.2%
3.3%
2.8
%2.
9%
Com
mon
shar
es o
utst
andi
ng20
,780
,439
20,3
44,4
0919
,958
,980
19,3
64,1
2719
,313
,387
19,3
91,5
1719
,671
,722
19,9
01,5
0220
,666
,820
Stat
utor
y tra
de c
ombi
ned
ratio
96.8
%10
1.6%
97.5
%99
.0%
115.
6%
102.
1%10
0.3%
109.
1%
96.8
%
All
shar
e an
d pe
r sha
re a
mou
nts h
ave
been
adj
uste
d fo
r a 3
for 2
stoc
k sp
lit th
at w
as c
ompl
eted
on
June
23,
201
5.
57
EMC INSURANCE GROUP INC. AND SUBSIDIARIES
ITEM 7. MANAGEMENT’S DISCUSSION AND ANALYSIS OF FINANCIAL CONDITION AND RESULTS OF OPERATIONS
The term “Company” is used below interchangeably to describe EMC Insurance Group Inc. (Parent Company only) and EMC Insurance Group Inc. and its subsidiaries. The following discussion and analysis of the Company’s financial condition and results of operations should be read in conjunction with the Consolidated Financial Statements and Notes to Consolidated Financial Statements included under Part II, Item 8 of this Form 10-K.
CAUTIONARY STATEMENT REGARDING FORWARD-LOOKING STATEMENTS
The Private Securities Litigation Reform Act of 1995 provides issuers the opportunity to make cautionary statements regarding forward-looking statements. Accordingly, any forward-looking statement contained in this report is based on management’s current beliefs, assumptions and expectations of the Company’s future performance, taking all information currently available into account. These beliefs, assumptions and expectations can change as the result of many possible events or factors, not all of which are known to management. If a change occurs, the Company’s business, financial condition, liquidity, results of operations, plans and objectives may vary materially from those expressed in the forward-looking statements. The risks and uncertainties that may affect the actual results of the Company include, but are not limited to, the following:
• catastrophic events and the occurrence of significant severe weather conditions;
• the adequacy of loss and settlement expense reserves;
• state and federal legislation and regulations;
• changes in the property and casualty insurance industry, interest rates or the performance of financial markets andthe general economy;
• rating agency actions;
• “other-than-temporary” investment impairment losses; and
• other risks and uncertainties inherent to the Company’s business, including those discussed under the heading “RiskFactors” in Part I, Item 1A, of this Form 10-K.
Management intends to identify forward-looking statements when using the words “believe”, “expect”, “anticipate”, “estimate”, “project” or similar expressions. Undue reliance should not be placed on these forward-looking statements. The Company disclaims any obligation to update such statements or to announce publicly the results of any revisions that it may make to any forward-looking statements to reflect the occurrence of anticipated or unanticipated events or circumstances after the date of such statements.
COMPANY OVERVIEW
The Company, a majority owned subsidiary of Employers Mutual Casualty Company (Employers Mutual), is an insurance holding company with operations in property and casualty insurance and reinsurance. The operations of the Company are highly integrated with those of Employers Mutual through participation in a property and casualty reinsurance pooling agreement (the "pooling agreement"), a reinsurance retrocessional quota share agreement (the "quota share agreement") and an excess of loss reinsurance agreement (the “excess of loss agreement”). All transactions occurring under the pooling agreement, quota share agreement and excess of loss agreement are based on statutory accounting principles. Certain adjustments are made to the statutory-basis amounts assumed by the property and casualty insurance subsidiaries and the reinsurance subsidiary to bring the amounts into compliance with U.S. generally accepted accounting principles (GAAP).
58
Property and casualty insurance operations are conducted through three subsidiaries and represent the most significant segment of the Company’s business, totaling 78 percent of consolidated premiums earned in 2015. The Company’s three property and casualty insurance subsidiaries and two subsidiaries and an affiliate of Employers Mutual (Union Insurance Company of Providence, EMC Property & Casualty Company and Hamilton Mutual Insurance Company) are parties to a pooling agreement with Employers Mutual. Under the terms of the pooling agreement, each company cedes to Employers Mutual all of its insurance business, and assumes from Employers Mutual an amount equal to its participation in the pool. All premiums, losses, settlement expenses, and other underwriting and administrative expenses, excluding the voluntary reinsurance business assumed by Employers Mutual from nonaffiliated insurance companies, are prorated among the parties on the basis of participation in the pool. Employers Mutual negotiates reinsurance agreements that provide protection to the pool and each of its participants, including protection against losses arising from catastrophic events. The aggregate participation of the Company’s property and casualty insurance subsidiaries in the pool is 30 percent.
The Inter-Company Committees of the boards of directors of the Company and Employers Mutual approved a new inter-company reinsurance program between the Company's insurance subsidiaries in the property and casualty insurance segment and Employers Mutual for calendar year 2016. This reinsurance program is intended to reduce the volatility of the Company's quarterly results caused by excessive catastrophe and storm losses, and will provide protection from both the frequency and severity of such losses. The reinsurance program for 2016 will consist of two semi-annual aggregate catastrophe excess of loss treaties. The first treaty will be effective from January 1, 2016 through June 30, 2016, and will have a retention of $20.0 million and a limit of $24.0 million. The cost of this treaty will be approximately $6.3 million. The second treaty will be effective from July 1, 2016 through December 31, 2016, and will have a retention of $15.0 million and a limit of $12.0 million. The cost of this treaty will be approximately $1.5 million. All catastrophe and storm losses assumed by the property and casualty insurance subsidiaries (net of applicable reinsurance recoveries from external reinsurance protections purchased by the pool participants) will be subject to the terms of these treaties, and there is no co-participation provision.
Operations of the pool give rise to inter-company balances with Employers Mutual, which are generally settled during the subsequent month. The investment and income tax activities of the pool participants are not subject to the pooling agreement. The pooling agreement provides that Employers Mutual will make up any shortfall or difference resulting from an error in its systems and/or computation processes that would otherwise result in the required restatement of the pool participants’ financial statements.
The purpose of the pooling agreement is to spread the risk of an exposure insured by any of the pool participants among all the companies. The pooling agreement produces a more uniform and stable underwriting result from year to year for all companies in the pool than might be experienced individually. In addition, each company benefits from the capacity of the entire pool, rather than being limited to policy exposures of a size commensurate with its own assets, and from the wide range of policy forms, lines of insurance written, rate filings and commission plans offered by each of the companies.
Reinsurance operations are conducted through EMC Reinsurance Company and accounted for 22 percent of consolidated premiums earned in 2015. The Company’s reinsurance subsidiary is party to a quota share agreement and an excess of loss agreement with Employers Mutual. Under the terms of the quota share agreement, the reinsurance subsidiary assumes 100 percent of Employers Mutual’s assumed reinsurance business, subject to certain exceptions. Under the terms of the excess of loss agreement (covering both business assumed from Employers Mutual through the quota share agreement, as well as business obtained outside the quota share agreement), the reinsurance subsidiary retains the first $4.0 million of losses per event, and also retains 20.0 percent of any losses between $4.0 million and $10.0 million and 10.0 percent of any losses between $10.0 million and $50.0 million. The cost of the excess of loss reinsurance protection, which includes reimbursement for the cost of reinsurance protection purchased by Employers Mutual to protect itself from the assumption of excessive losses in the event of a major catastrophe, is 8.0 percent (9.0 percent in 2013) of the reinsurance subsidiary’s total assumed reinsurance premiums written.
The Inter-Company Committees of the boards of directors of the Company and Employers Mutual approved a change in the inter-company reinsurance program between the Company's reinsurance subsidiary and Employers Mutual for calendar year 2016. The reinsurance program for 2016 will consist of two treaties. The first is a per occurrence catastrophe excess of loss treaty with a retention of $10.0 million, a limit of $10.0 million, 20 percent co-participation, and no reinstatement. The cost of this treaty will be approximately $2.0 million. The second is an annual aggregate catastrophe excess of loss treaty with a retention of $20.0 million, a limit of $100.0 million, and 20 percent co-participation. The cost of this treaty will be approximately $3.1 million. Any losses recovered under the per occurrence treaty will inure to the benefit of the aggregate treaty. Only catastrophic events with total losses greater than $500,000 will be subject to the terms of the aggregate treaty. The reinsurance subsidiary will also purchase additional reinsurance protection (Industry Loss Warranties) in peak exposure territories from external parties in which coverage is triggered when losses experienced by the insurance industry from a catastrophic event exceed a specified threshold. Any reinsurance recoveries received from external parties will reduce the amount of losses ceded to Employers Mutual under the excess of loss agreement. The net cost of the external reinsurance protection is estimated to be approximately $4.0 million.
59
The reinsurance subsidiary does not directly reinsure any of the insurance business written by Employers Mutual or the other pool participants; however, Employers Mutual assumes reinsurance business from the Mutual Reinsurance Bureau underwriting association (MRB), which provides a small amount of reinsurance protection to the members of the EMC Insurance Companies pooling agreement. As a result, the reinsurance subsidiary’s assumed exposures include a small portion of the EMC Insurance Companies’ direct business, after ceded reinsurance protections purchased by MRB are applied. In addition, the reinsurance subsidiary does not reinsure any “involuntary” facility or pool business that Employers Mutual assumes pursuant to state law. The reinsurance subsidiary assumes all foreign currency exchange gain/loss associated with contracts incepting on January 1, 2006 and thereafter that are subject to the quota share agreement. Operations of the quota share and excess of loss agreements give rise to inter-company balances with Employers Mutual, which are generally settled during the month following the end of each quarter. The investment and income tax activities of the reinsurance subsidiary are not subject to the quota share agreement.
Under the terms of the quota share agreement, the reinsurance subsidiary receives reinstatement premium income that is collected by Employers Mutual from the ceding companies when reinsurance coverage is reinstated after a loss event; however, the cap on losses assumed per event contained in the excess of loss agreement is automatically reinstated without cost.
INDUSTRY OVERVIEW
An insurance company’s underwriting results reflect the profitability of its insurance operations, excluding investment income. Underwriting profit or loss is calculated by subtracting losses and expenses incurred from premiums earned.
Insurance companies collect cash in the form of insurance premiums and pay out cash in the form of loss and settlement expense payments. Additional cash outflows occur through the payment of acquisition and underwriting costs such as commissions, premium taxes, salaries and general overhead. During the loss settlement period, which varies by line of business and by the circumstances surrounding each claim and may cover several years, insurance companies invest the cash premiums; thereby earning interest and dividend income. This investment income supplements underwriting results and contributes to net earnings. Funds from called and matured fixed maturity securities are reinvested at current interest rates. The low interest rate environment that has existed during the past several years has had a negative impact on the insurance industry’s investment income.
Insurance pricing has historically been cyclical in nature. Periods of excess capital and increased competition encourage price reductions and liberal underwriting practices (referred to as a soft market) as insurance companies compete for market share, while attempting to cover the inevitable underwriting losses from these actions with investment income. A prolonged soft market generally leads to a reduction in the adequacy of capital in the insurance industry. To cure this condition, underwriting practices are tightened, premium rate levels increase and competition subsides as companies strive to strengthen their balance sheets (referred to as a hard market). At the end of 2013, premium rate level increases were beginning to decline, after increasing consistently during the three previous years. This trend of declining premium rate increases continued through 2015, with premium rate increases currently in the low single digits. It is important to note that the hardening of the market that occurred during 2011, 2012 and 2013 was somewhat unusual in that it was not driven by a reduction in capital adequacy, but rather by a persistent decline in investment income and an increase in severe weather events. The outlook for 2016 is that the Company's overall premium rate level will continue to increase, but only by a few percentage points.
A substantial determinant of an insurance company’s underwriting results is its loss and settlement expense reserving practices. Insurance companies must estimate the amount of losses and settlement expenses that will ultimately be paid to settle claims that have occurred to date (loss and settlement expense reserves). This estimation process is inherently subjective with the possibility of widely varying results, particularly for certain highly volatile types of claims (i.e., asbestos, environmental and various casualty exposures, such as products liability, where the loss amount and the parties responsible are difficult to determine). During a soft market, inadequate premium rates put pressure on insurance companies to under-estimate their loss and settlement expense reserves in order to report better results. Correspondingly, inadequate reserves can play an integral part in bringing about a hard market, because increased profitability from higher premium rate levels can be used to strengthen inadequate reserves.
The Company closely monitors the activities of state legislatures, the United States Congress and federal and state agencies through its membership in various organizations. In particular, our trade organizations are working to achieve a nationwide data security and breach standard, to promote accident avoidance and accident prevention technology, to oppose legislative or regulatory changes that weaken the private workers' compensation insurance marketplace, to prevent the Federal Insurance Office and other federal and international entities expanding their control of the insurance industry from undermining the consumer-focused state insurance regulatory system, to pass appropriate tax reform legislation, and to continue efforts to obtain an exemption for homeowners’ insurers from disparate impact liability under the Fair Housing Act.
60
MANAGEMENT ISSUES AND PERSPECTIVES
Low interest rate environment
The persistent low interest rate environment has an influence on several operational areas that have the potential to materially impact the Company’s financial condition and results of operations. Following is a brief discussion of the major operational areas being monitored by management in light of the current low interest rate environment.
Investment portfolio
The majority of the Company’s investment portfolio is invested in fixed maturity securities. The prolonged low interest rate environment has had a positive impact on the Company’s financial condition because the portfolio of fixed maturity securities available-for-sale had net unrealized holding gains of $20.0 million at December 31, 2015, reflecting the fact that the average yield on the Company’s portfolio is higher than the yields currently available in the fixed maturity marketplace. However, proceeds from maturing securities and cash from operating activities are being invested at the current low yields, which has had a negative impact on investment income over the past several years. Interest rates increased approximately 10 basis points during 2015, which reduced the amount of unrealized gains on the Company's fixed maturity portfolio. If the current low interest rate environment continues, future growth in investment income will be negatively impacted.
Underwriting results
The Company’s portfolio of fixed maturity securities provides a substantial amount of investment income that supplements underwriting results and contributes to net earnings. The prolonged low interest rate environment has resulted in limited growth in investment income, which has increased the need to achieve a consistent underwriting profit. Management continually stresses the importance of striving for an underwriting profit, and is working diligently with the branch offices to maintain prudent underwriting and pricing standards, and establish long-term business plans with the Company’s agency force.
Equity portfolio market risk
Approximately 14.6 percent of the Company’s investment portfolio is invested in equity securities. Net unrealized investment gains on the equity portfolio totaled approximately $40.3 million at December 31, 2015, which is reflected as accumulated other comprehensive income in the Company’s financial statements and represents $1.94 per share of the Company’s December 31, 2015 book value of $25.26 per share. To help protect the Company from a sudden and significant decline in the value of its equity portfolio, management invested in a limited partnership during the first quarters of 2014 and 2015 to implement and maintain an equity tail-risk hedging strategy. This hedging strategy is designed to help protect the Company from significant monthly downside price volatility in the equity markets. By implementing this hedging strategy, management was able to reduce the level of risk contained in the Company’s financial statements without reducing the size of the equity portfolio. While there is a cost associated with this protection, management views this cost similar to the cost of an insurance policy. The cost of the hedging strategy is equal to the decline in the carrying value of the limited partnership that the Company invested in to implement the strategy, and is reported as a realized investment loss in the Company's financial statements. The decline in the carrying value of the limited partnership primarily reflects the cost of hedging contracts that expired without value during the year, but also includes changes in the value of contracts that were still in effect at year-end.
Premium rate levels
Premium rate levels have improved steadily during the past four years, and management has worked diligently with the sixteen branch offices to stress the importance of achieving modest, but consistent, commercial lines rate level increases whenever possible. These efforts have been successful, as the Company was able to implement high-single-digit rate level increases during 2012 and 2013, and more modest increases during 2014 and 2015. Rate levels for commercial lines of business are projected to decline on an industry-wide basis in 2016, but management currently expects the Company's overall rate level to increase in the low-single-digit range in 2016. Management will continue to work with the branch offices to ensure that all opportunities for additional rate level increases are pursued.
61
Change in personal lines operation
Effective January 1, 2016, a new Personal Lines Operations department will assume responsibility for the growth and profitability of personal lines business throughout the country. In connection with this change in oversight, management will be implementing new personal auto and homeowners products that are expected to improve profitability. Although it will take some time before the new products are rolled-out in all locations, management expects to begin seeing improved performance in these lines of business by late 2016 or early 2017. In addition to the potential for improved profitability in the personal lines of business, this change in oversight will allow the 16 local branch offices to focus their efforts on commercial lines of business, which accounts for approximately 90 percent of the property and casualty insurance segment's net written premiums.
Commercial Auto Line of Business
The Company, like most of the insurance industry, has experienced a significant increase in both claims frequency and severity in the commercial auto line of business in recent years. To address this issue, management has created a commercial auto task force charged with identifying the causes of the increase in claims, and developing solutions to improve profitability. Areas that the task force has identified for improvement include more aggressive underwriting and pricing, proper classification of risks, and a more thorough review of driver qualifications and class of business restrictions. Management will continue to monitor and scrutinize the profitability of this line of business, as the success of this initiative is of utmost importance in the increasingly competitive marketplace.
Strategic Analytics
During 2015, management created a new senior level position to oversee strategic analytics. One of the key priorities for this position is to partner with the Company's 16 local branch offices to provide differentiated value to our agency partners and policyholders. This will be accomplished by the development of innovative products and services, improved claims fraud detection capabilities, prioritized claims resources, and the integration of decision science discipline into the decision making process. This increased focus on strategic analytics is expected to enhance agency relationships, provide value to the Company's policyholders by identifying cost savings opportunities, and improve overall profitability.
Catastrophe and storm losses
The Company's property and casualty insurance subsidiaries write over 50 percent of their business in the Midwest, and therefore have exposure to wind, hail, and tornado losses caused by convective storms. Prior to 2013, the Company experienced five consecutive years of above average catastrophe and storm losses, and experienced record levels of catastrophe and storm losses in two of those five years (2008 and 2011). Due to the volatility of catastrophe and storm losses, the Company's net income has historically varied significantly from quarter to quarter and year to year. In an effort to reduce the volatility of the Company's quarterly net income, management has implemented a new inter-company reinsurance arrangement between the three insurance subsidiaries in the property and casualty insurance segment and Employers Mutual effective January 1, 2016. In addition, the excess of loss reinsurance agreement between the Company's reinsurance subsidiary and Employers Mutual has been modified for 2016. It is expected that these new reinsurance arrangements will reduce the volatility of the Company's quarterly net income caused by excessive catastrophe and storm losses.
Changes in GAAP
The Financial Accounting Standards Board (FASB) has approved, or is in the final stages of approving, several significant changes to GAAP that must be implemented during the next four years, including the prescribed accounting for financial instruments and leases. As a result of these changes, the accounting rules and required disclosures for public companies will change significantly in future years. Management has been closely monitoring these developments and will begin performing research in 2016 to determine the changes that will be required in the Company’s data/systems to comply with the new accounting standards, as well as the impact the new standards will have on the Company's financial statements.
The most significant change in the accounting for financial instruments is the requirement that changes in the fair value of equity securities be recognized in net income, rather than other comprehensive income, which will introduce a material amount of volatility into net income. The change in lease accounting will require that the total obligation for all leased assets, which is currently disclosed in the notes to financial statements, be reflected on the balance sheet, with a corresponding asset established for the "right of use" of leased assets.
62
Reserving methodology
The Company’s reserving methodology is focused on maintaining a consistent level of overall reserve adequacy. Management does not use accident year loss picks to establish the property and casualty insurance segment's carried reserves. Case and incurred but not reported (IBNR) loss reserves, as well as settlement expense reserves, are established independently of each other and added together to get the total loss and settlement expense reserve. The property and casualty insurance segment's reserving methodology also includes bulk case loss reserves, which supplement the aggregate case loss reserves and are used by management to establish its best estimate of the liability for reported claims.
There is an inherent amount of uncertainty involved in the establishment of insurance liabilities. This uncertainty is greatest in the current and more recent accident years because a smaller percentage of the expected ultimate claims have been reported, adjusted and settled compared to more mature accident years. For this reason, the property and casualty insurance segment's carried reserves for these accident years reflect prudently conservative assumptions. As the carried reserves for these accident years run off, the overall expectation is that, more often than not, favorable development will occur. However, there is also the possibility that the ultimate settlement of liabilities associated with these accident years will show adverse development, and such adverse development could be substantial.
The property and casualty insurance segment's bulk reserves (formula IBNR loss reserve, bulk case loss reserve and settlement expense reserve) are initially established for all accident years combined, and the total is then allocated to the various accident years. During this allocation process, a portion of the total bulk reserves may be reallocated from the current accident year to prior accident years, or from prior accident years to the current accident year, to achieve the actuarial department's desired reserve level by accident year. When reserves are moved to, or from, prior accident years, the change is reported as development on prior years' reserves. However, this type of development is "mechanical" in nature, and does not have an impact on earnings because the total amount of carried reserves did not change. Management identifies, quantifies and discloses this "mechanical" development so that users of the Company's financial statements can better understand how development on prior years' reserves impacts the Company's results of operations.
For the reasons noted above, development amounts reported on prior accident years’ reserves are less meaningful under the property and casualty insurance segment’s reserving methodology than reserving methodologies utilized by other insurers. Accordingly, from management’s perspective, whether the Company has maintained a consistent level of overall reserve adequacy is more relevant to understanding the Company’s results of operations than the composition of the underwriting results between the current and prior accident years.
MEASUREMENT OF RESULTS
The Company’s consolidated financial statements are prepared on the basis of GAAP. The Company also prepares financial statements for each of its insurance subsidiaries based on statutory accounting principles that are filed with insurance regulatory authorities in the states where they do business. Statutory accounting principles are designed to address the concerns of state regulators and stress the measurement of the insurer’s ability to satisfy its obligations to its policyholders and creditors.
Management evaluates the Company’s operations by monitoring key measures of growth and profitability. Management measures the Company’s growth by examining direct premiums written and, perhaps more importantly, premiums written assumed from affiliates. Management generally measures the Company’s operating results by examining the Company’s net income and return on equity, as well as the loss and settlement expense, acquisition expense and combined ratios. The following provides further explanation of the key measures management uses to evaluate the Company’s results:
Direct Premiums Written. Direct premiums written is the sum of the total policy premiums, net of cancellations, associated with policies underwritten and issued by the Company’s property and casualty insurance subsidiaries. These direct premiums written are transferred to Employers Mutual under the terms of the pooling agreement and are reflected in the Company’s consolidated financial statements as premiums written ceded to affiliates. See note 3 of Notes to Consolidated Financial Statements.
Premiums Written Assumed From Affiliates and Premiums Written Assumed From Nonaffiliates. For the property and casualty insurance segment, premiums written assumed from affiliates and nonaffiliates reflects the property and casualty insurance subsidiaries’ aggregate 30 percent participation interest in 1) the total direct premiums written by all the participants in the pooling arrangement, and 2) the involuntary business assumed by the pool participants pursuant to state law, respectively. For the reinsurance segment, premiums written assumed from nonaffiliates reflects the reinsurance business assumed through the quota share agreement (including “fronting” activities initiated by Employers Mutual) and reinsurance business assumed outside the quota share agreement. See note 3 of Notes to Consolidated Financial Statements. Management uses premiums written assumed from affiliates and nonaffiliates, which excludes the impact of written premiums ceded to reinsurers, as a measure of the underlying growth of the Company’s insurance business from period to period.
63
Net Premiums Written. Net premiums written is calculated by summing direct premiums written, premiums written assumed from affiliates and nonaffiliates, and then subtracting from that result premiums written ceded to affiliates and nonaffiliates. For the property and casualty insurance segment, premiums written ceded to nonaffiliates is the portion of the direct and assumed premiums written that is transferred to 1) reinsurers in accordance with the terms of the underlying reinsurance contracts, based upon the risks they accept, and 2) state organizations on a mandatory basis in connection with various workers' compensation and assigned risk programs. For the reinsurance segment, premiums written ceded to nonaffiliates reflects reinsurance business that is ceded to other insurance companies in connection with “fronting” activities initiated by Employers Mutual. Premiums written ceded to affiliates includes both the cession of the Company’s property and casualty insurance subsidiaries’ direct business to Employers Mutual under the terms of the pooling agreement, and premiums ceded by the Company’s reinsurance subsidiary to Employers Mutual under the terms of the excess of loss agreement with Employers Mutual. See note 3 of Notes to Consolidated Financial Statements. Management uses net premiums written to measure the amount of business retained after cessions to reinsurers.
Loss and Settlement Expense Ratio. The loss and settlement expense ratio is the ratio (expressed as a percentage) of losses and settlement expenses incurred to premiums earned, and measures the underwriting profitability of a company’s insurance business. The loss and settlement expense ratio is generally measured on both a gross (direct and assumed) and net (gross less ceded) basis. Management uses the gross loss and settlement expense ratio as a measure of the Company’s overall underwriting profitability of the insurance business it writes and to assess the adequacy of the Company’s pricing. The net loss and settlement expense ratio is meaningful in evaluating the Company’s financial results, which are net of ceded reinsurance, as reflected in the consolidated financial statements. The loss and settlement expense ratios are generally calculated in the same way for GAAP and statutory accounting purposes.
Acquisition Expense Ratio. The acquisition expense ratio is the ratio (expressed as a percentage) of net acquisition and other expenses incurred to premiums earned, and measures a company’s operational efficiency in producing, underwriting and administering its insurance business. For statutory accounting purposes, acquisition and other expenses of an insurance company exclude investment expenses. There is no such industry definition for determining an acquisition expense ratio for GAAP purposes. As a result, management applies the statutory definition to calculate the Company’s acquisition expense ratio on a GAAP basis. The net acquisition expense ratio is meaningful in evaluating the Company’s financial results, which are net of ceded reinsurance, as reflected in the consolidated financial statements.
GAAP Combined Ratio. The combined ratio (expressed as a percentage) is the sum of the loss and settlement expense ratio and the acquisition expense ratio, and measures a company’s overall underwriting profit/loss. If the combined ratio is at or above 100, an insurance company cannot be profitable without investment income (and may not be profitable if investment income is insufficient). Management uses the GAAP combined ratio in evaluating the Company’s overall underwriting profitability and as a measure for comparison of the Company’s profitability relative to the profitability of its competitors who prepare GAAP-basis financial statements.
Statutory Combined Ratio. The statutory combined ratio (expressed as a percentage) is calculated in the same manner as the GAAP combined ratio, but is based on results determined pursuant to statutory accounting rules and regulations. The statutory “trade combined ratio” differs from the statutory combined ratio in that the acquisition expense ratio is based on net premiums written rather than net premiums earned. Management uses the statutory trade combined ratio as a measure for comparison of the Company’s profitability relative to the profitability of its competitors, all of whom must file statutory-basis financial statements with insurance regulatory authorities.
Catastrophe and storm losses. For the property and casualty insurance segment, catastrophe and storm losses include losses attributed to events that have occurred in the United States which have been assigned an occurrence number by the Property & Liability Resource Bureau (PLRB) Catastrophe Services. According to PLRB, an occurrence number is assigned when an event has produced conditions severe enough to have caused, or to be likely to have caused, property damage. For the reinsurance segment, catastrophe and storm losses include losses that have occurred in the United States, Puerto Rico and the U.S. Virgin Islands which have been designated as catastrophes by Property Claims Services (PCS), as well as non-U.S. catastrophe and storm losses reported by the ceding companies. According to PCS, catastrophe serial numbers are assigned to events that cause $25.0 million or more in direct insured losses to property, and affect a significant number of policyholders and insurers.
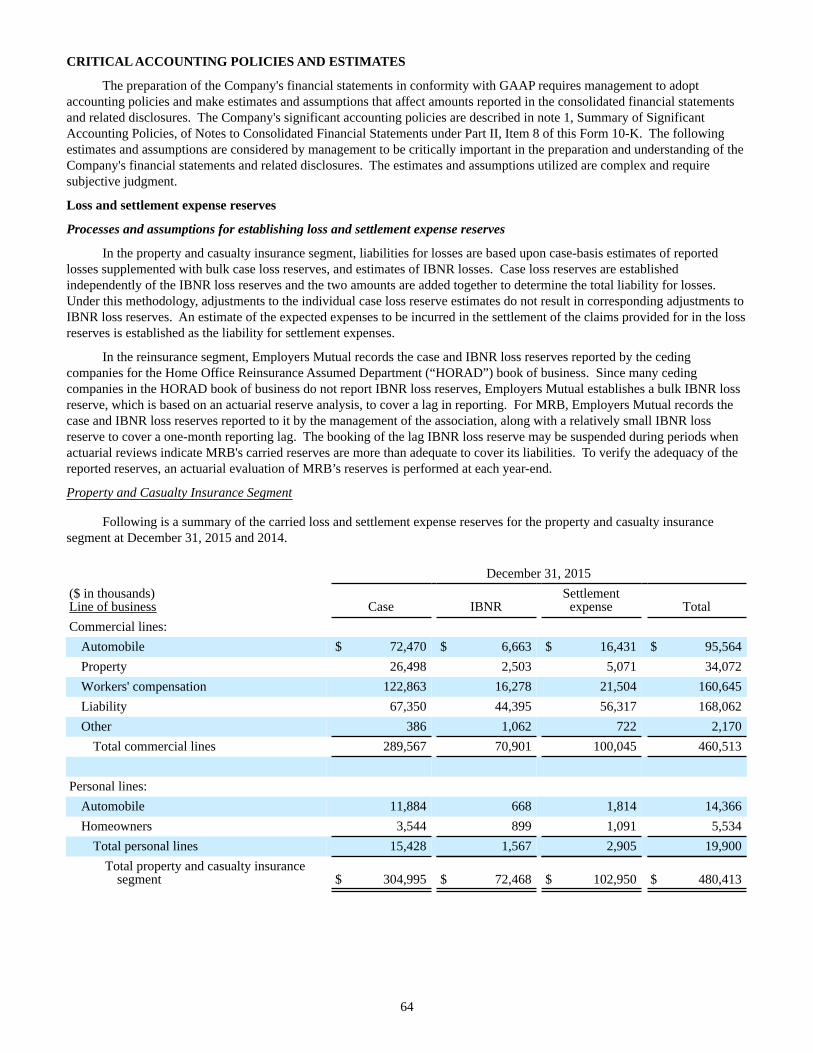
64
CRITICAL ACCOUNTING POLICIES AND ESTIMATES
The preparation of the Company's financial statements in conformity with GAAP requires management to adopt accounting policies and make estimates and assumptions that affect amounts reported in the consolidated financial statements and related disclosures. The Company's significant accounting policies are described in note 1, Summary of Significant Accounting Policies, of Notes to Consolidated Financial Statements under Part II, Item 8 of this Form 10-K. The following estimates and assumptions are considered by management to be critically important in the preparation and understanding of the Company's financial statements and related disclosures. The estimates and assumptions utilized are complex and require subjective judgment.
Loss and settlement expense reserves
Processes and assumptions for establishing loss and settlement expense reserves
In the property and casualty insurance segment, liabilities for losses are based upon case-basis estimates of reported losses supplemented with bulk case loss reserves, and estimates of IBNR losses. Case loss reserves are established independently of the IBNR loss reserves and the two amounts are added together to determine the total liability for losses. Under this methodology, adjustments to the individual case loss reserve estimates do not result in corresponding adjustments to IBNR loss reserves. An estimate of the expected expenses to be incurred in the settlement of the claims provided for in the loss reserves is established as the liability for settlement expenses.
In the reinsurance segment, Employers Mutual records the case and IBNR loss reserves reported by the ceding companies for the Home Office Reinsurance Assumed Department (“HORAD”) book of business. Since many ceding companies in the HORAD book of business do not report IBNR loss reserves, Employers Mutual establishes a bulk IBNR loss reserve, which is based on an actuarial reserve analysis, to cover a lag in reporting. For MRB, Employers Mutual records the case and IBNR loss reserves reported to it by the management of the association, along with a relatively small IBNR loss reserve to cover a one-month reporting lag. The booking of the lag IBNR loss reserve may be suspended during periods when actuarial reviews indicate MRB's carried reserves are more than adequate to cover its liabilities. To verify the adequacy of the reported reserves, an actuarial evaluation of MRB’s reserves is performed at each year-end.
Property and Casualty Insurance Segment
Following is a summary of the carried loss and settlement expense reserves for the property and casualty insurance segment at December 31, 2015 and 2014.
December 31, 2015($ in thousands)Line of business Case IBNR
Settlementexpense Total
Commercial lines:Automobile $ 72,470 $ 6,663 $ 16,431 $ 95,564Property 26,498 2,503 5,071 34,072Workers' compensation 122,863 16,278 21,504 160,645Liability 67,350 44,395 56,317 168,062Other 386 1,062 722 2,170
Total commercial lines 289,567 70,901 100,045 460,513
Personal lines:Automobile 11,884 668 1,814 14,366Homeowners 3,544 899 1,091 5,534
Total personal lines 15,428 1,567 2,905 19,900Total property and casualty insurance
segment $ 304,995 $ 72,468 $ 102,950 $ 480,413
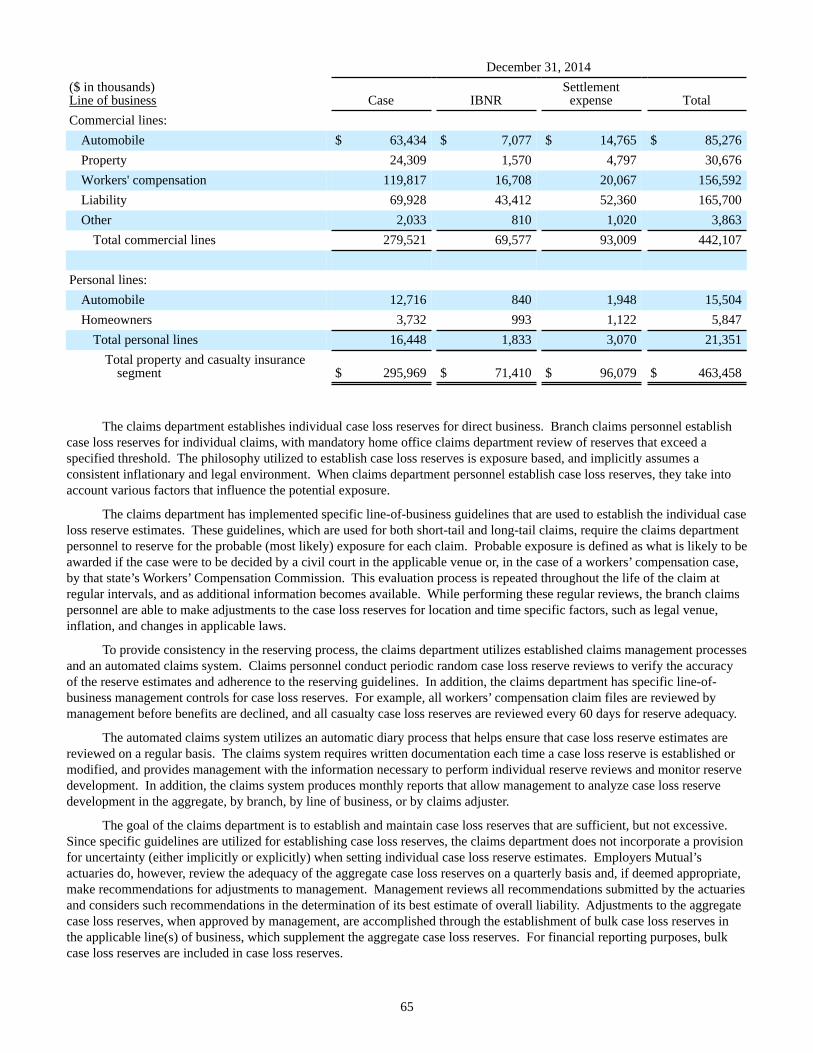
65
December 31, 2014($ in thousands)Line of business Case IBNR
Settlementexpense Total
Commercial lines:Automobile $ 63,434 $ 7,077 $ 14,765 $ 85,276Property 24,309 1,570 4,797 30,676Workers' compensation 119,817 16,708 20,067 156,592Liability 69,928 43,412 52,360 165,700Other 2,033 810 1,020 3,863
Total commercial lines 279,521 69,577 93,009 442,107
Personal lines:Automobile 12,716 840 1,948 15,504Homeowners 3,732 993 1,122 5,847
Total personal lines 16,448 1,833 3,070 21,351Total property and casualty insurance
segment $ 295,969 $ 71,410 $ 96,079 $ 463,458
The claims department establishes individual case loss reserves for direct business. Branch claims personnel establish case loss reserves for individual claims, with mandatory home office claims department review of reserves that exceed a specified threshold. The philosophy utilized to establish case loss reserves is exposure based, and implicitly assumes a consistent inflationary and legal environment. When claims department personnel establish case loss reserves, they take into account various factors that influence the potential exposure.
The claims department has implemented specific line-of-business guidelines that are used to establish the individual case loss reserve estimates. These guidelines, which are used for both short-tail and long-tail claims, require the claims department personnel to reserve for the probable (most likely) exposure for each claim. Probable exposure is defined as what is likely to be awarded if the case were to be decided by a civil court in the applicable venue or, in the case of a workers’ compensation case, by that state’s Workers’ Compensation Commission. This evaluation process is repeated throughout the life of the claim at regular intervals, and as additional information becomes available. While performing these regular reviews, the branch claims personnel are able to make adjustments to the case loss reserves for location and time specific factors, such as legal venue, inflation, and changes in applicable laws.
To provide consistency in the reserving process, the claims department utilizes established claims management processes and an automated claims system. Claims personnel conduct periodic random case loss reserve reviews to verify the accuracy of the reserve estimates and adherence to the reserving guidelines. In addition, the claims department has specific line-of-business management controls for case loss reserves. For example, all workers’ compensation claim files are reviewed by management before benefits are declined, and all casualty case loss reserves are reviewed every 60 days for reserve adequacy.
The automated claims system utilizes an automatic diary process that helps ensure that case loss reserve estimates are reviewed on a regular basis. The claims system requires written documentation each time a case loss reserve is established or modified, and provides management with the information necessary to perform individual reserve reviews and monitor reserve development. In addition, the claims system produces monthly reports that allow management to analyze case loss reserve development in the aggregate, by branch, by line of business, or by claims adjuster.
The goal of the claims department is to establish and maintain case loss reserves that are sufficient, but not excessive. Since specific guidelines are utilized for establishing case loss reserves, the claims department does not incorporate a provision for uncertainty (either implicitly or explicitly) when setting individual case loss reserve estimates. Employers Mutual’s actuaries do, however, review the adequacy of the aggregate case loss reserves on a quarterly basis and, if deemed appropriate, make recommendations for adjustments to management. Management reviews all recommendations submitted by the actuaries and considers such recommendations in the determination of its best estimate of overall liability. Adjustments to the aggregate case loss reserves, when approved by management, are accomplished through the establishment of bulk case loss reserves in the applicable line(s) of business, which supplement the aggregate case loss reserves. For financial reporting purposes, bulk case loss reserves are included in case loss reserves.
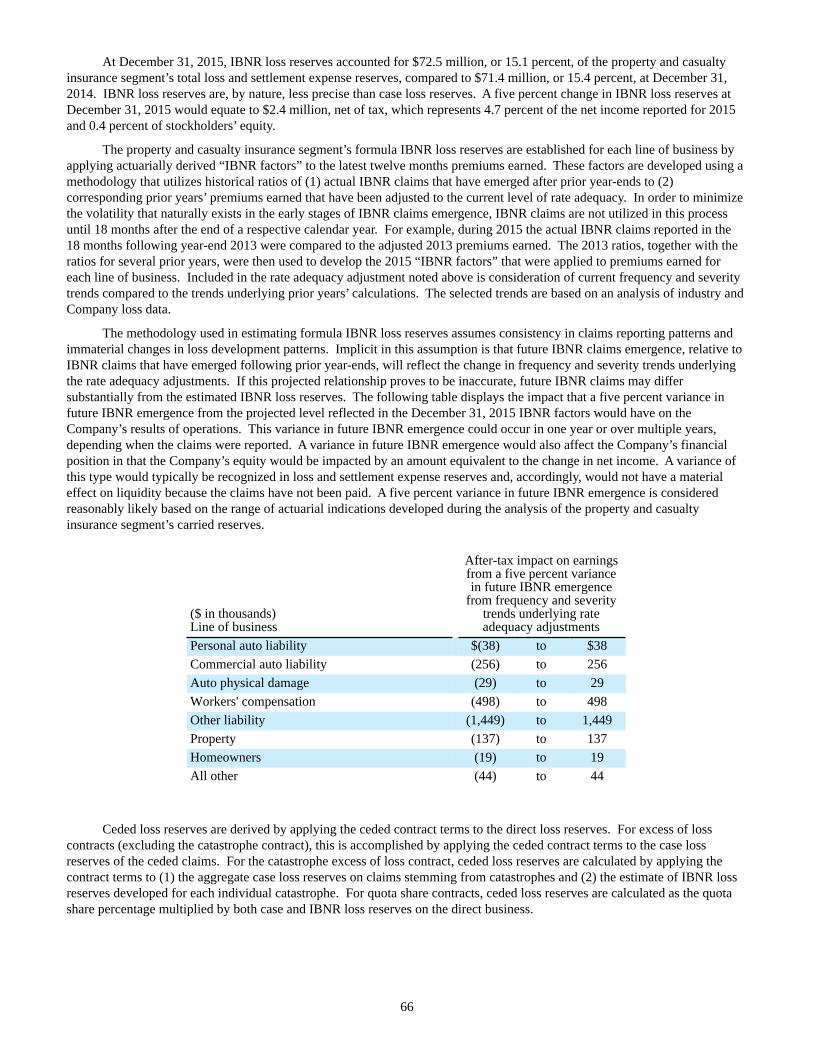
66
At December 31, 2015, IBNR loss reserves accounted for $72.5 million, or 15.1 percent, of the property and casualty insurance segment’s total loss and settlement expense reserves, compared to $71.4 million, or 15.4 percent, at December 31, 2014. IBNR loss reserves are, by nature, less precise than case loss reserves. A five percent change in IBNR loss reserves at December 31, 2015 would equate to $2.4 million, net of tax, which represents 4.7 percent of the net income reported for 2015 and 0.4 percent of stockholders’ equity.
The property and casualty insurance segment’s formula IBNR loss reserves are established for each line of business by applying actuarially derived “IBNR factors” to the latest twelve months premiums earned. These factors are developed using a methodology that utilizes historical ratios of (1) actual IBNR claims that have emerged after prior year-ends to (2) corresponding prior years’ premiums earned that have been adjusted to the current level of rate adequacy. In order to minimize the volatility that naturally exists in the early stages of IBNR claims emergence, IBNR claims are not utilized in this process until 18 months after the end of a respective calendar year. For example, during 2015 the actual IBNR claims reported in the 18 months following year-end 2013 were compared to the adjusted 2013 premiums earned. The 2013 ratios, together with the ratios for several prior years, were then used to develop the 2015 “IBNR factors” that were applied to premiums earned for each line of business. Included in the rate adequacy adjustment noted above is consideration of current frequency and severity trends compared to the trends underlying prior years’ calculations. The selected trends are based on an analysis of industry and Company loss data.
The methodology used in estimating formula IBNR loss reserves assumes consistency in claims reporting patterns and immaterial changes in loss development patterns. Implicit in this assumption is that future IBNR claims emergence, relative to IBNR claims that have emerged following prior year-ends, will reflect the change in frequency and severity trends underlying the rate adequacy adjustments. If this projected relationship proves to be inaccurate, future IBNR claims may differ substantially from the estimated IBNR loss reserves. The following table displays the impact that a five percent variance in future IBNR emergence from the projected level reflected in the December 31, 2015 IBNR factors would have on the Company’s results of operations. This variance in future IBNR emergence could occur in one year or over multiple years, depending when the claims were reported. A variance in future IBNR emergence would also affect the Company’s financial position in that the Company’s equity would be impacted by an amount equivalent to the change in net income. A variance of this type would typically be recognized in loss and settlement expense reserves and, accordingly, would not have a material effect on liquidity because the claims have not been paid. A five percent variance in future IBNR emergence is considered reasonably likely based on the range of actuarial indications developed during the analysis of the property and casualty insurance segment’s carried reserves.
($ in thousands)Line of business
After-tax impact on earningsfrom a five percent variancein future IBNR emergence
from frequency and severitytrends underlying rateadequacy adjustments
Personal auto liability $(38) to $38Commercial auto liability (256) to 256Auto physical damage (29) to 29Workers' compensation (498) to 498Other liability (1,449) to 1,449Property (137) to 137Homeowners (19) to 19All other (44) to 44
Ceded loss reserves are derived by applying the ceded contract terms to the direct loss reserves. For excess of loss contracts (excluding the catastrophe contract), this is accomplished by applying the ceded contract terms to the case loss reserves of the ceded claims. For the catastrophe excess of loss contract, ceded loss reserves are calculated by applying the contract terms to (1) the aggregate case loss reserves on claims stemming from catastrophes and (2) the estimate of IBNR loss reserves developed for each individual catastrophe. For quota share contracts, ceded loss reserves are calculated as the quota share percentage multiplied by both case and IBNR loss reserves on the direct business.
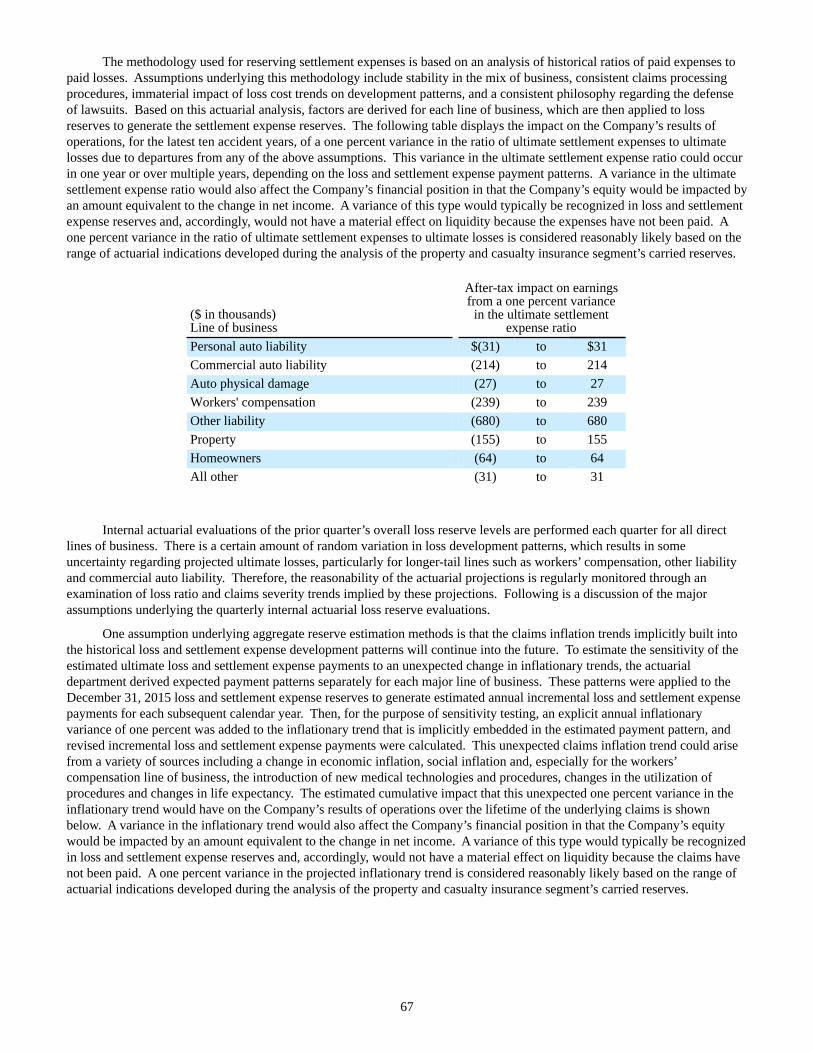
67
The methodology used for reserving settlement expenses is based on an analysis of historical ratios of paid expenses to paid losses. Assumptions underlying this methodology include stability in the mix of business, consistent claims processing procedures, immaterial impact of loss cost trends on development patterns, and a consistent philosophy regarding the defense of lawsuits. Based on this actuarial analysis, factors are derived for each line of business, which are then applied to loss reserves to generate the settlement expense reserves. The following table displays the impact on the Company’s results of operations, for the latest ten accident years, of a one percent variance in the ratio of ultimate settlement expenses to ultimate losses due to departures from any of the above assumptions. This variance in the ultimate settlement expense ratio could occur in one year or over multiple years, depending on the loss and settlement expense payment patterns. A variance in the ultimate settlement expense ratio would also affect the Company’s financial position in that the Company’s equity would be impacted by an amount equivalent to the change in net income. A variance of this type would typically be recognized in loss and settlement expense reserves and, accordingly, would not have a material effect on liquidity because the expenses have not been paid. A one percent variance in the ratio of ultimate settlement expenses to ultimate losses is considered reasonably likely based on the range of actuarial indications developed during the analysis of the property and casualty insurance segment’s carried reserves.
($ in thousands)Line of business
After-tax impact on earningsfrom a one percent variance
in the ultimate settlementexpense ratio
Personal auto liability $(31) to $31Commercial auto liability (214) to 214Auto physical damage (27) to 27Workers' compensation (239) to 239Other liability (680) to 680Property (155) to 155Homeowners (64) to 64All other (31) to 31
Internal actuarial evaluations of the prior quarter’s overall loss reserve levels are performed each quarter for all direct lines of business. There is a certain amount of random variation in loss development patterns, which results in some uncertainty regarding projected ultimate losses, particularly for longer-tail lines such as workers’ compensation, other liability and commercial auto liability. Therefore, the reasonability of the actuarial projections is regularly monitored through an examination of loss ratio and claims severity trends implied by these projections. Following is a discussion of the major assumptions underlying the quarterly internal actuarial loss reserve evaluations.
One assumption underlying aggregate reserve estimation methods is that the claims inflation trends implicitly built into the historical loss and settlement expense development patterns will continue into the future. To estimate the sensitivity of the estimated ultimate loss and settlement expense payments to an unexpected change in inflationary trends, the actuarial department derived expected payment patterns separately for each major line of business. These patterns were applied to the December 31, 2015 loss and settlement expense reserves to generate estimated annual incremental loss and settlement expense payments for each subsequent calendar year. Then, for the purpose of sensitivity testing, an explicit annual inflationary variance of one percent was added to the inflationary trend that is implicitly embedded in the estimated payment pattern, and revised incremental loss and settlement expense payments were calculated. This unexpected claims inflation trend could arise from a variety of sources including a change in economic inflation, social inflation and, especially for the workers’ compensation line of business, the introduction of new medical technologies and procedures, changes in the utilization of procedures and changes in life expectancy. The estimated cumulative impact that this unexpected one percent variance in the inflationary trend would have on the Company’s results of operations over the lifetime of the underlying claims is shown below. A variance in the inflationary trend would also affect the Company’s financial position in that the Company’s equity would be impacted by an amount equivalent to the change in net income. A variance of this type would typically be recognized in loss and settlement expense reserves and, accordingly, would not have a material effect on liquidity because the claims have not been paid. A one percent variance in the projected inflationary trend is considered reasonably likely based on the range of actuarial indications developed during the analysis of the property and casualty insurance segment’s carried reserves.
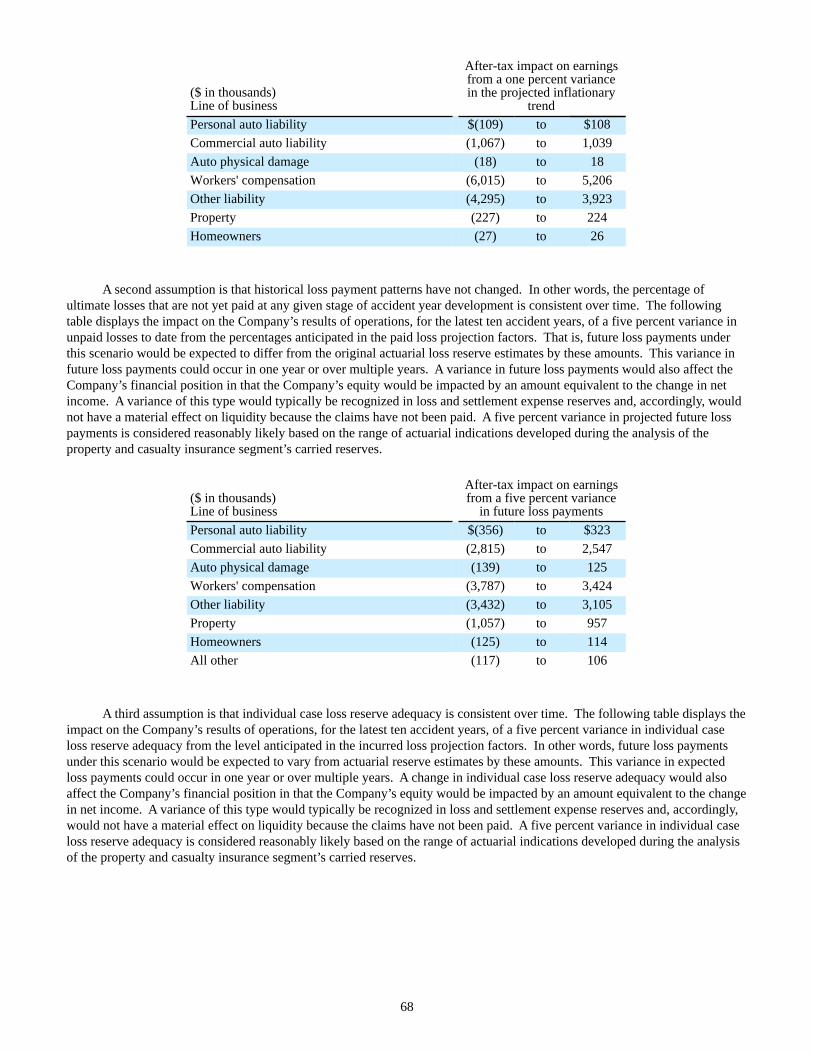
68
($ in thousands)Line of business
After-tax impact on earningsfrom a one percent variancein the projected inflationary
trendPersonal auto liability $(109) to $108Commercial auto liability (1,067) to 1,039Auto physical damage (18) to 18Workers' compensation (6,015) to 5,206Other liability (4,295) to 3,923Property (227) to 224Homeowners (27) to 26
A second assumption is that historical loss payment patterns have not changed. In other words, the percentage of ultimate losses that are not yet paid at any given stage of accident year development is consistent over time. The following table displays the impact on the Company’s results of operations, for the latest ten accident years, of a five percent variance in unpaid losses to date from the percentages anticipated in the paid loss projection factors. That is, future loss payments under this scenario would be expected to differ from the original actuarial loss reserve estimates by these amounts. This variance in future loss payments could occur in one year or over multiple years. A variance in future loss payments would also affect the Company’s financial position in that the Company’s equity would be impacted by an amount equivalent to the change in net income. A variance of this type would typically be recognized in loss and settlement expense reserves and, accordingly, would not have a material effect on liquidity because the claims have not been paid. A five percent variance in projected future loss payments is considered reasonably likely based on the range of actuarial indications developed during the analysis of the property and casualty insurance segment’s carried reserves.
($ in thousands)Line of business
After-tax impact on earningsfrom a five percent variance
in future loss paymentsPersonal auto liability $(356) to $323Commercial auto liability (2,815) to 2,547Auto physical damage (139) to 125Workers' compensation (3,787) to 3,424Other liability (3,432) to 3,105Property (1,057) to 957Homeowners (125) to 114All other (117) to 106
A third assumption is that individual case loss reserve adequacy is consistent over time. The following table displays the impact on the Company’s results of operations, for the latest ten accident years, of a five percent variance in individual case loss reserve adequacy from the level anticipated in the incurred loss projection factors. In other words, future loss payments under this scenario would be expected to vary from actuarial reserve estimates by these amounts. This variance in expected loss payments could occur in one year or over multiple years. A change in individual case loss reserve adequacy would also affect the Company’s financial position in that the Company’s equity would be impacted by an amount equivalent to the change in net income. A variance of this type would typically be recognized in loss and settlement expense reserves and, accordingly, would not have a material effect on liquidity because the claims have not been paid. A five percent variance in individual case loss reserve adequacy is considered reasonably likely based on the range of actuarial indications developed during the analysis of the property and casualty insurance segment’s carried reserves.
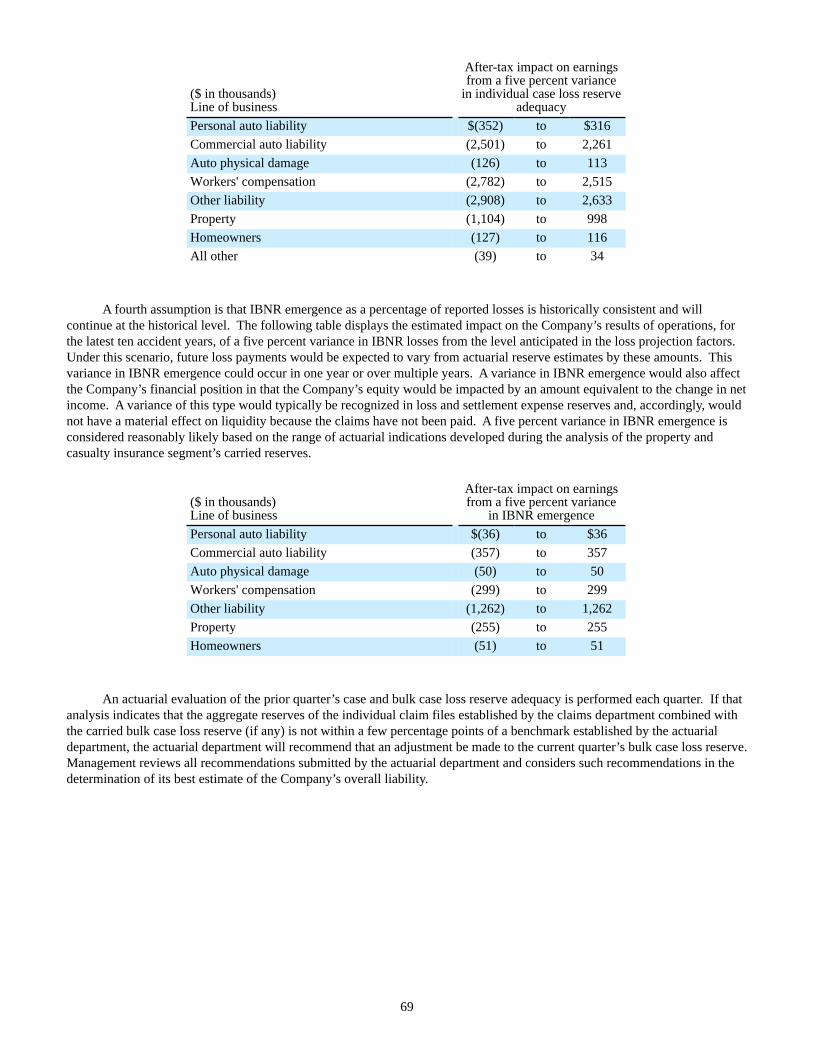
69
($ in thousands)Line of business
After-tax impact on earningsfrom a five percent variance
in individual case loss reserveadequacy
Personal auto liability $(352) to $316Commercial auto liability (2,501) to 2,261Auto physical damage (126) to 113Workers' compensation (2,782) to 2,515Other liability (2,908) to 2,633Property (1,104) to 998Homeowners (127) to 116All other (39) to 34
A fourth assumption is that IBNR emergence as a percentage of reported losses is historically consistent and will continue at the historical level. The following table displays the estimated impact on the Company’s results of operations, for the latest ten accident years, of a five percent variance in IBNR losses from the level anticipated in the loss projection factors. Under this scenario, future loss payments would be expected to vary from actuarial reserve estimates by these amounts. This variance in IBNR emergence could occur in one year or over multiple years. A variance in IBNR emergence would also affect the Company’s financial position in that the Company’s equity would be impacted by an amount equivalent to the change in net income. A variance of this type would typically be recognized in loss and settlement expense reserves and, accordingly, would not have a material effect on liquidity because the claims have not been paid. A five percent variance in IBNR emergence is considered reasonably likely based on the range of actuarial indications developed during the analysis of the property and casualty insurance segment’s carried reserves.
($ in thousands)Line of business
After-tax impact on earningsfrom a five percent variance
in IBNR emergencePersonal auto liability $(36) to $36Commercial auto liability (357) to 357Auto physical damage (50) to 50Workers' compensation (299) to 299Other liability (1,262) to 1,262Property (255) to 255Homeowners (51) to 51
An actuarial evaluation of the prior quarter’s case and bulk case loss reserve adequacy is performed each quarter. If that analysis indicates that the aggregate reserves of the individual claim files established by the claims department combined with the carried bulk case loss reserve (if any) is not within a few percentage points of a benchmark established by the actuarial department, the actuarial department will recommend that an adjustment be made to the current quarter’s bulk case loss reserve. Management reviews all recommendations submitted by the actuarial department and considers such recommendations in the determination of its best estimate of the Company’s overall liability.
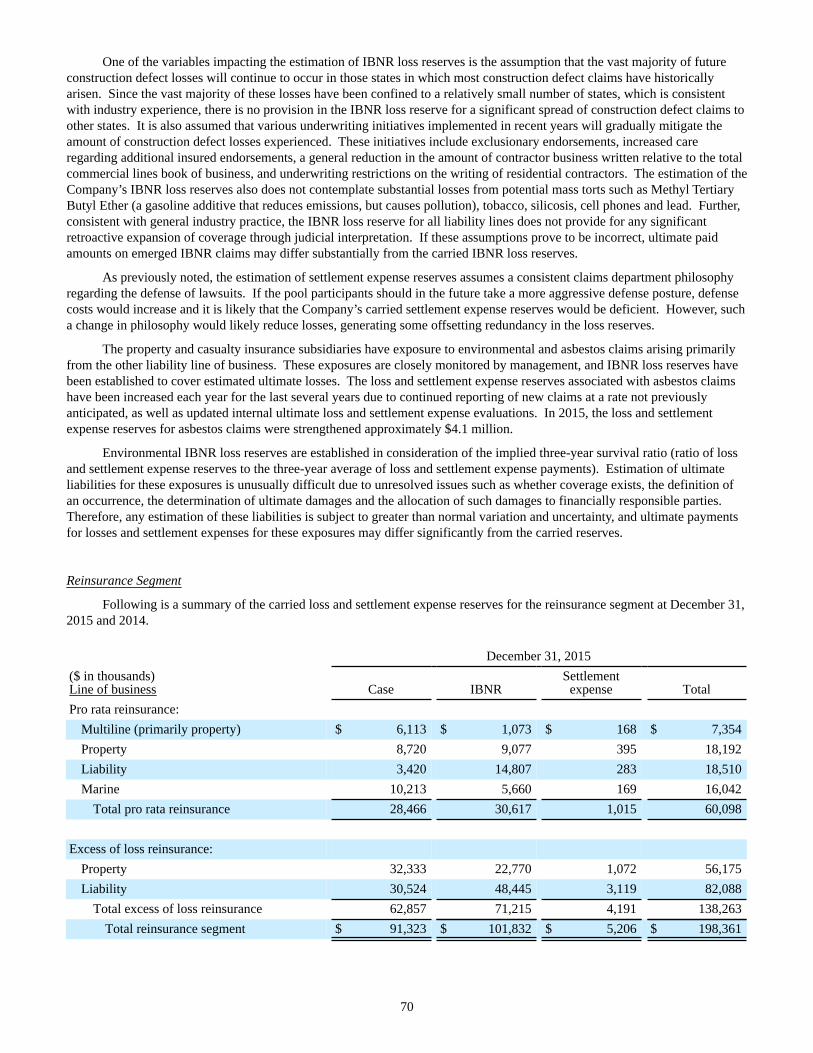
70
One of the variables impacting the estimation of IBNR loss reserves is the assumption that the vast majority of future construction defect losses will continue to occur in those states in which most construction defect claims have historically arisen. Since the vast majority of these losses have been confined to a relatively small number of states, which is consistent with industry experience, there is no provision in the IBNR loss reserve for a significant spread of construction defect claims to other states. It is also assumed that various underwriting initiatives implemented in recent years will gradually mitigate the amount of construction defect losses experienced. These initiatives include exclusionary endorsements, increased care regarding additional insured endorsements, a general reduction in the amount of contractor business written relative to the total commercial lines book of business, and underwriting restrictions on the writing of residential contractors. The estimation of the Company’s IBNR loss reserves also does not contemplate substantial losses from potential mass torts such as Methyl Tertiary Butyl Ether (a gasoline additive that reduces emissions, but causes pollution), tobacco, silicosis, cell phones and lead. Further, consistent with general industry practice, the IBNR loss reserve for all liability lines does not provide for any significant retroactive expansion of coverage through judicial interpretation. If these assumptions prove to be incorrect, ultimate paid amounts on emerged IBNR claims may differ substantially from the carried IBNR loss reserves.
As previously noted, the estimation of settlement expense reserves assumes a consistent claims department philosophy regarding the defense of lawsuits. If the pool participants should in the future take a more aggressive defense posture, defense costs would increase and it is likely that the Company’s carried settlement expense reserves would be deficient. However, such a change in philosophy would likely reduce losses, generating some offsetting redundancy in the loss reserves.
The property and casualty insurance subsidiaries have exposure to environmental and asbestos claims arising primarily from the other liability line of business. These exposures are closely monitored by management, and IBNR loss reserves have been established to cover estimated ultimate losses. The loss and settlement expense reserves associated with asbestos claims have been increased each year for the last several years due to continued reporting of new claims at a rate not previously anticipated, as well as updated internal ultimate loss and settlement expense evaluations. In 2015, the loss and settlement expense reserves for asbestos claims were strengthened approximately $4.1 million.
Environmental IBNR loss reserves are established in consideration of the implied three-year survival ratio (ratio of loss and settlement expense reserves to the three-year average of loss and settlement expense payments). Estimation of ultimate liabilities for these exposures is unusually difficult due to unresolved issues such as whether coverage exists, the definition of an occurrence, the determination of ultimate damages and the allocation of such damages to financially responsible parties. Therefore, any estimation of these liabilities is subject to greater than normal variation and uncertainty, and ultimate payments for losses and settlement expenses for these exposures may differ significantly from the carried reserves.
Reinsurance Segment
Following is a summary of the carried loss and settlement expense reserves for the reinsurance segment at December 31, 2015 and 2014.
December 31, 2015($ in thousands)Line of business Case IBNR
Settlementexpense Total
Pro rata reinsurance:Multiline (primarily property) $ 6,113 $ 1,073 $ 168 $ 7,354Property 8,720 9,077 395 18,192Liability 3,420 14,807 283 18,510Marine 10,213 5,660 169 16,042
Total pro rata reinsurance 28,466 30,617 1,015 60,098
Excess of loss reinsurance:Property 32,333 22,770 1,072 56,175Liability 30,524 48,445 3,119 82,088
Total excess of loss reinsurance 62,857 71,215 4,191 138,263Total reinsurance segment $ 91,323 $ 101,832 $ 5,206 $ 198,361
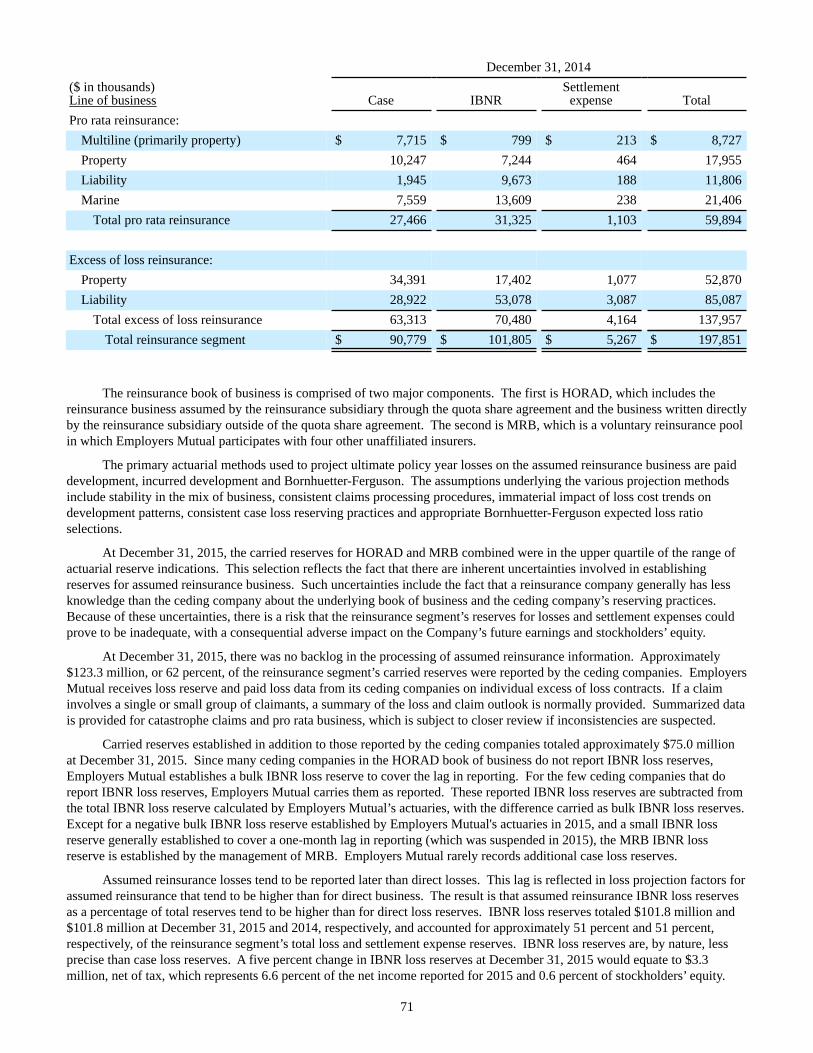
71
December 31, 2014($ in thousands)Line of business Case IBNR
Settlementexpense Total
Pro rata reinsurance:Multiline (primarily property) $ 7,715 $ 799 $ 213 $ 8,727Property 10,247 7,244 464 17,955Liability 1,945 9,673 188 11,806Marine 7,559 13,609 238 21,406
Total pro rata reinsurance 27,466 31,325 1,103 59,894
Excess of loss reinsurance:Property 34,391 17,402 1,077 52,870Liability 28,922 53,078 3,087 85,087
Total excess of loss reinsurance 63,313 70,480 4,164 137,957Total reinsurance segment $ 90,779 $ 101,805 $ 5,267 $ 197,851
The reinsurance book of business is comprised of two major components. The first is HORAD, which includes the reinsurance business assumed by the reinsurance subsidiary through the quota share agreement and the business written directly by the reinsurance subsidiary outside of the quota share agreement. The second is MRB, which is a voluntary reinsurance pool in which Employers Mutual participates with four other unaffiliated insurers.
The primary actuarial methods used to project ultimate policy year losses on the assumed reinsurance business are paid development, incurred development and Bornhuetter-Ferguson. The assumptions underlying the various projection methods include stability in the mix of business, consistent claims processing procedures, immaterial impact of loss cost trends on development patterns, consistent case loss reserving practices and appropriate Bornhuetter-Ferguson expected loss ratio selections.
At December 31, 2015, the carried reserves for HORAD and MRB combined were in the upper quartile of the range of actuarial reserve indications. This selection reflects the fact that there are inherent uncertainties involved in establishing reserves for assumed reinsurance business. Such uncertainties include the fact that a reinsurance company generally has less knowledge than the ceding company about the underlying book of business and the ceding company’s reserving practices. Because of these uncertainties, there is a risk that the reinsurance segment’s reserves for losses and settlement expenses could prove to be inadequate, with a consequential adverse impact on the Company’s future earnings and stockholders’ equity.
At December 31, 2015, there was no backlog in the processing of assumed reinsurance information. Approximately $123.3 million, or 62 percent, of the reinsurance segment’s carried reserves were reported by the ceding companies. Employers Mutual receives loss reserve and paid loss data from its ceding companies on individual excess of loss contracts. If a claim involves a single or small group of claimants, a summary of the loss and claim outlook is normally provided. Summarized data is provided for catastrophe claims and pro rata business, which is subject to closer review if inconsistencies are suspected.
Carried reserves established in addition to those reported by the ceding companies totaled approximately $75.0 million at December 31, 2015. Since many ceding companies in the HORAD book of business do not report IBNR loss reserves, Employers Mutual establishes a bulk IBNR loss reserve to cover the lag in reporting. For the few ceding companies that do report IBNR loss reserves, Employers Mutual carries them as reported. These reported IBNR loss reserves are subtracted from the total IBNR loss reserve calculated by Employers Mutual’s actuaries, with the difference carried as bulk IBNR loss reserves. Except for a negative bulk IBNR loss reserve established by Employers Mutual's actuaries in 2015, and a small IBNR loss reserve generally established to cover a one-month lag in reporting (which was suspended in 2015), the MRB IBNR loss reserve is established by the management of MRB. Employers Mutual rarely records additional case loss reserves.
Assumed reinsurance losses tend to be reported later than direct losses. This lag is reflected in loss projection factors for assumed reinsurance that tend to be higher than for direct business. The result is that assumed reinsurance IBNR loss reserves as a percentage of total reserves tend to be higher than for direct loss reserves. IBNR loss reserves totaled $101.8 million and $101.8 million at December 31, 2015 and 2014, respectively, and accounted for approximately 51 percent and 51 percent, respectively, of the reinsurance segment’s total loss and settlement expense reserves. IBNR loss reserves are, by nature, less precise than case loss reserves. A five percent change in IBNR loss reserves at December 31, 2015 would equate to $3.3 million, net of tax, which represents 6.6 percent of the net income reported for 2015 and 0.6 percent of stockholders’ equity.
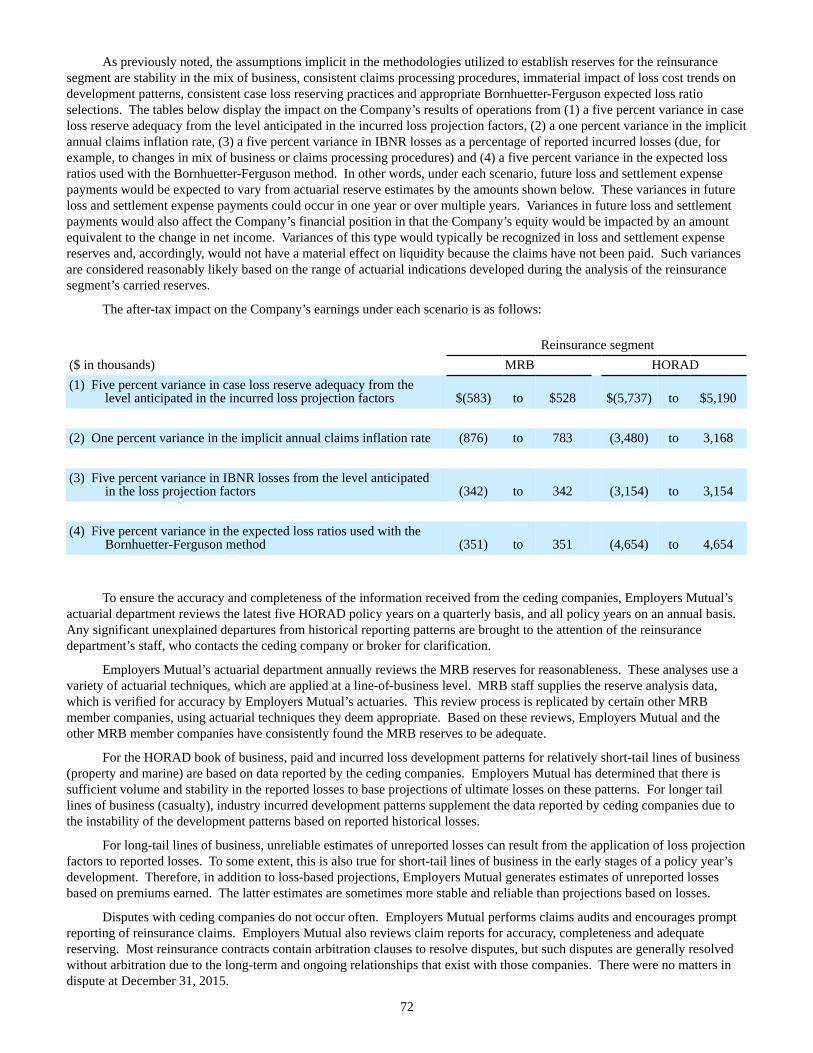
72
As previously noted, the assumptions implicit in the methodologies utilized to establish reserves for the reinsurance segment are stability in the mix of business, consistent claims processing procedures, immaterial impact of loss cost trends on development patterns, consistent case loss reserving practices and appropriate Bornhuetter-Ferguson expected loss ratio selections. The tables below display the impact on the Company’s results of operations from (1) a five percent variance in case loss reserve adequacy from the level anticipated in the incurred loss projection factors, (2) a one percent variance in the implicit annual claims inflation rate, (3) a five percent variance in IBNR losses as a percentage of reported incurred losses (due, for example, to changes in mix of business or claims processing procedures) and (4) a five percent variance in the expected loss ratios used with the Bornhuetter-Ferguson method. In other words, under each scenario, future loss and settlement expense payments would be expected to vary from actuarial reserve estimates by the amounts shown below. These variances in future loss and settlement expense payments could occur in one year or over multiple years. Variances in future loss and settlement payments would also affect the Company’s financial position in that the Company’s equity would be impacted by an amount equivalent to the change in net income. Variances of this type would typically be recognized in loss and settlement expense reserves and, accordingly, would not have a material effect on liquidity because the claims have not been paid. Such variances are considered reasonably likely based on the range of actuarial indications developed during the analysis of the reinsurance segment’s carried reserves.
The after-tax impact on the Company’s earnings under each scenario is as follows:
Reinsurance segment($ in thousands) MRB HORAD(1) Five percent variance in case loss reserve adequacy from the
level anticipated in the incurred loss projection factors $(583) to $528 $(5,737) to $5,190
(2) One percent variance in the implicit annual claims inflation rate (876) to 783 (3,480) to 3,168
(3) Five percent variance in IBNR losses from the level anticipatedin the loss projection factors (342) to 342 (3,154) to 3,154
(4) Five percent variance in the expected loss ratios used with theBornhuetter-Ferguson method (351) to 351 (4,654) to 4,654
To ensure the accuracy and completeness of the information received from the ceding companies, Employers Mutual’s actuarial department reviews the latest five HORAD policy years on a quarterly basis, and all policy years on an annual basis. Any significant unexplained departures from historical reporting patterns are brought to the attention of the reinsurance department’s staff, who contacts the ceding company or broker for clarification.
Employers Mutual’s actuarial department annually reviews the MRB reserves for reasonableness. These analyses use a variety of actuarial techniques, which are applied at a line-of-business level. MRB staff supplies the reserve analysis data, which is verified for accuracy by Employers Mutual’s actuaries. This review process is replicated by certain other MRB member companies, using actuarial techniques they deem appropriate. Based on these reviews, Employers Mutual and the other MRB member companies have consistently found the MRB reserves to be adequate.
For the HORAD book of business, paid and incurred loss development patterns for relatively short-tail lines of business (property and marine) are based on data reported by the ceding companies. Employers Mutual has determined that there is sufficient volume and stability in the reported losses to base projections of ultimate losses on these patterns. For longer tail lines of business (casualty), industry incurred development patterns supplement the data reported by ceding companies due to the instability of the development patterns based on reported historical losses.
For long-tail lines of business, unreliable estimates of unreported losses can result from the application of loss projection factors to reported losses. To some extent, this is also true for short-tail lines of business in the early stages of a policy year’s development. Therefore, in addition to loss-based projections, Employers Mutual generates estimates of unreported losses based on premiums earned. The latter estimates are sometimes more stable and reliable than projections based on losses.
Disputes with ceding companies do not occur often. Employers Mutual performs claims audits and encourages prompt reporting of reinsurance claims. Employers Mutual also reviews claim reports for accuracy, completeness and adequate reserving. Most reinsurance contracts contain arbitration clauses to resolve disputes, but such disputes are generally resolved without arbitration due to the long-term and ongoing relationships that exist with those companies. There were no matters in dispute at December 31, 2015.
73
Toxic tort (primarily asbestos), environmental and other uncertain exposures (property and casualty insurance segment and reinsurance segment)
Toxic tort claims include those where the claimant seeks compensation for harm allegedly caused by exposure to a toxic substance or a substance that increases the risk of contracting a serious disease, such as cancer. Typically the injury is caused by latent effects of direct or indirect exposure to a substance or combination of substances through absorption, contact, ingestion, inhalation, implantation or injection. Examples of toxic tort claims include injuries arising out of exposure to asbestos, silica, mold, drugs, carbon monoxide, chemicals and lead.
Since 1989, the pool participants have included an asbestos exclusion in liability policies issued for most lines of business. The exclusion prohibits liability coverage for “bodily injury”, “personal injury” or “property damage” (including any associated clean-up obligations) arising out of the installation, existence, removal or disposal of asbestos or any substance containing asbestos fibers. Therefore, the pool participants’ current asbestos exposures are primarily limited to commercial policies issued prior to 1989. At present, the pool participants are defending approximately 1,809 asbestos bodily injury lawsuits, some of which involve multiple plaintiffs. Claims activity associated with eight policyholders dominates the pool participants’ asbestos claims, representing an aggregate 1,757 lawsuits with 1,981 claimants. Most of the lawsuits are subject to express reservation of rights based upon the lack of an injury within the applicable policy periods, because many asbestos lawsuits do not specifically allege dates of asbestos exposure or dates of injury. The pool participants’ policyholders named as defendants in these asbestos lawsuits are typically peripheral defendants who have little or no exposure and are routinely dismissed from asbestos litigation with nominal or no payment (i.e., small contractors, supply companies, and a furnace manufacturer).
Prior to 2008, actual losses paid for asbestos-related claims had been minimal due to the plaintiffs’ failure to identify an exposure to any asbestos-containing products associated with the pool participants’ current and former policyholders. However, paid losses and settlement expenses have increased significantly since 2008 as a result of claims attributed to one former policyholder. During the period 2009 through 2015, the Company's share of paid losses and settlement expenses attributed to this former policyholder, a furnace manufacturer, was $9.4 million (primarily settlement expenses). The asbestos exposure associated with this former policyholder has increased in recent years, and this trend may possibly continue into the future with increased per plaintiff settlements. Settlement expense payments associated with this former policyholder have increased significantly since 2008 and have been a driver behind recently implemented reserve increases. The primary cause of this increase in paid settlement expenses is the retention of a national coordinating counsel in 2008 due to this former policyholder’s exposure in numerous jurisdictions. The national coordinating counsel has provided, and continues to provide, significant services in the areas of document review, discovery, deposition and trial preparation. Approximately 655 asbestos exposure claims associated with this former policyholder remain open. Whenever possible, the pool participants have participated in cost sharing agreements with other insurance companies to reduce overall expenses.
The pool participants are defending approximately 70 claim files as a result of lawsuits alleging “silica” exposure in Texas and Mississippi jurisdictions, some of which involve multiple plaintiffs. The plaintiffs allege employment exposure to “airborne respirable silica dust,” causing “serious and permanent lung injuries” (i.e., silicosis). Silicosis injuries are identified in the upper lobes of the lungs, while asbestos injuries are localized in the lower lobes.
The plaintiffs in the silicosis lawsuits are sandblasters, gravel and concrete workers, ceramic workers and road construction workers. All of these lawsuits are subject to express reservation of rights based upon the lack of an injury within the applicable policy periods because many silica lawsuits, like asbestos lawsuits, do not specifically allege dates of exposure or dates of injury. The pool participants’ policyholders (a refractory product manufacturer, small local concrete and gravel companies and a concrete cutting machine manufacturer) that have been named as defendants in these silica lawsuits have had little or no exposure, and are routinely dismissed from silica litigation with nominal or no payment. While the expense of handling these lawsuits is high, it is not proportional to the number of plaintiffs, and is mitigated through cost sharing agreements with other insurance companies.
Since 2004, the pool participants have included a “pneumoconiosis dust” exclusion to their commercial lines liability policies in the majority of jurisdictions where such action was warranted. This exclusion precludes liability coverage due to “mixed dust” pneumoconiosis, pleural plaques, pleural effusion, mesothelioma, lung cancer, emphysema, bronchitis, tuberculosis or pleural thickening, or other pneumoconiosis-related ailments such as arthritis, cancer (other than lung), lupus, heart, kidney or gallbladder disease. “Mixed dust” includes dusts composed of asbestos, silica, fiberglass, coal, cement, or various other elements. It is anticipated that this mixed dust exclusion will further limit the pool participants’ exposure in silica claims, and may be broad enough to limit exposure in other dust claims.
74
The Company’s environmental claims are defined as 1) claims for bodily injury, personal injury, property damage, loss of use of property, diminution of property value, etc., allegedly due to contamination of air, and/or contamination of surface soil or surface water, and/or contamination of ground water, aquifers, wells, etc.; or 2) any/all claims for remediation or clean-up of hazardous waste sites by the United States Environmental Protection Agency, or similar state and local environmental or government agencies, usually presented in conjunction with Federal or local clean up statutes (i.e., CERCLA, RCRA, etc.).
Examples include, but are not limited to: chemical waste; hazardous waste treatment, storage and/or disposal facilities; industrial waste disposal facilities; landfills; superfund sites; toxic waste spills; and underground storage tanks. Widespread use of pollution exclusions since 1970 in virtually all lines of business, except personal lines, has resulted in limited exposure to environmental claims. Absolute pollution exclusions have been used since the 1980’s; however, the courts in the State of Indiana have ruled that the absolute pollution exclusion is ambiguous.
The Company’s current exposures to environmental claims include losses involving petroleum haulers, lead contamination, and soil and groundwater contamination in the State of Indiana. Claims from petroleum haulers are generally caused by overturned commercial vehicles and overfills at commercial and residential properties. Exposures for accident year losses preceding the 1980s include municipality exposures for closed landfills, small commercial businesses involved with disposing waste at landfills, leaking underground storage tanks and contamination from dry cleaning operations. As of December 31, 2015, all Methyl Tertiary Butyl Ether (“MTBE”) claims related to the pool participants’ policyholders had been dismissed.
During 2009, the Company completed a comprehensive policy search and coverage review, and began defending (pursuant to policies issued 1969-1975) a lawsuit filed against a municipalities’ sewerage commission in United States District Court in Wisconsin in 2008. The Company has a joint defense agreement with two other companies, but currently retains the majority share. The lawsuit is potentially one of the largest CERCLA actions pending against numerous parties in the United States and seeks in excess of $1.5 billion from the defendants. The pool participants reached a settlement with the insured and issued payment for $625,000 (the Company’s share) during 2015. The settlement has been approved by the Court. The case remains open while a final agreement is reached to conclude the pending legal expenses.
The Company’s exposure to asbestos and environmental claims through assumed reinsurance is very limited due to the fact that the Company’s reinsurance subsidiary entered into the reinsurance marketplace in the early 1980’s, after much attention had already been brought to these issues.
At December 31, 2015, the Company carried asbestos and environmental reserves for direct insurance and assumed reinsurance business totaling $11.5 million, which represents 1.7 percent of total loss and settlement expense reserves. The asbestos and environmental reserves include $4.6 million of case loss reserves, $4.4 million of IBNR loss reserves and $2.5 million of bulk settlement expense reserves. Ceded reinsurance on these reserves totaled $320,000. Loss and settlement expense reserves were increased in 2015 because of deterioration in the implied survival ratio.
The pool participants’ non-asbestos direct product liability claims are considered to be highly uncertain exposures due to the many uncertainties inherent in determining the loss, and the significant periods of time that can elapse between the occurrence of the loss and the ultimate settlement of the claim. The majority of the pool participants’ product liability claims arise from small to medium-sized manufacturers, contractors, petroleum distributors, and mobile home and auto dealerships. No specific claim trends are evident from the pool participants’ manufacturing clients, as the claims activity on these policies is generally isolated and can be severe. Specific product liability coverage is provided to the pool participants’ mobile home and auto dealership policyholders, and the claims from these policies tend to be relatively small. Certain construction defect claims are also reported under product liability coverage. During 2015, 33 of these claims were reported to the pool participants.
The Company has exposure to construction defect claims arising from general liability policies issued by the pool participants to contractors. Most of the pool participants’ construction defect claims are concentrated in a limited number of states, and the pool participants have taken steps to mitigate this exposure. Construction defect is a highly uncertain exposure due to such issues as whether coverage exists, definition of an occurrence, determination of ultimate damages, and allocation of such damages to financially responsible parties. Newly reported construction defect claims numbered 338, 385 and 232 in 2015, 2014 and 2013, respectively, and produced incurred losses and paid settlement expenses of approximately $3.2 million, $2.9 million and $5.1 million in each respective period. Incurred losses and paid settlement expenses on all construction defect claims totaled approximately $4.8 million in 2015. At December 31, 2015, the Company carried case loss reserves of approximately $5.6 million on 398 open construction defect claims.

75
The Company’s assumed casualty excess reinsurance business is also considered a highly uncertain exposure due to the significant periods of time that can elapse during the settlement of the underlying claims, and the fact that a reinsurance company generally has less knowledge than the ceding company about the underlying book of business and the ceding company’s reserving practices. Employers Mutual attempts to account for this uncertainty by establishing bulk IBNR loss reserves, using conservative assumed treaty limits and, to a much lesser extent, booking of individual treaty IBNR loss reserves (if reported by the ceding company) or establishing additional case loss reserves if the reported case loss reserves appear inadequate on an individual claim. While Employers Mutual is predominantly a property reinsurer, it does write casualty excess business oriented mainly towards shorter-tail casualty lines of coverage. Employers Mutual avoids reinsuring large company working layer casualty risks, and does not write risks with heavy product liability exposures, risks with obvious latent injury manifestation and medical malpractice. Casualty excess business on large companies is written, but generally on a “clash” basis only (layers above the limits written for any individual policyholder) or specialty casualty written with claims-made forms.
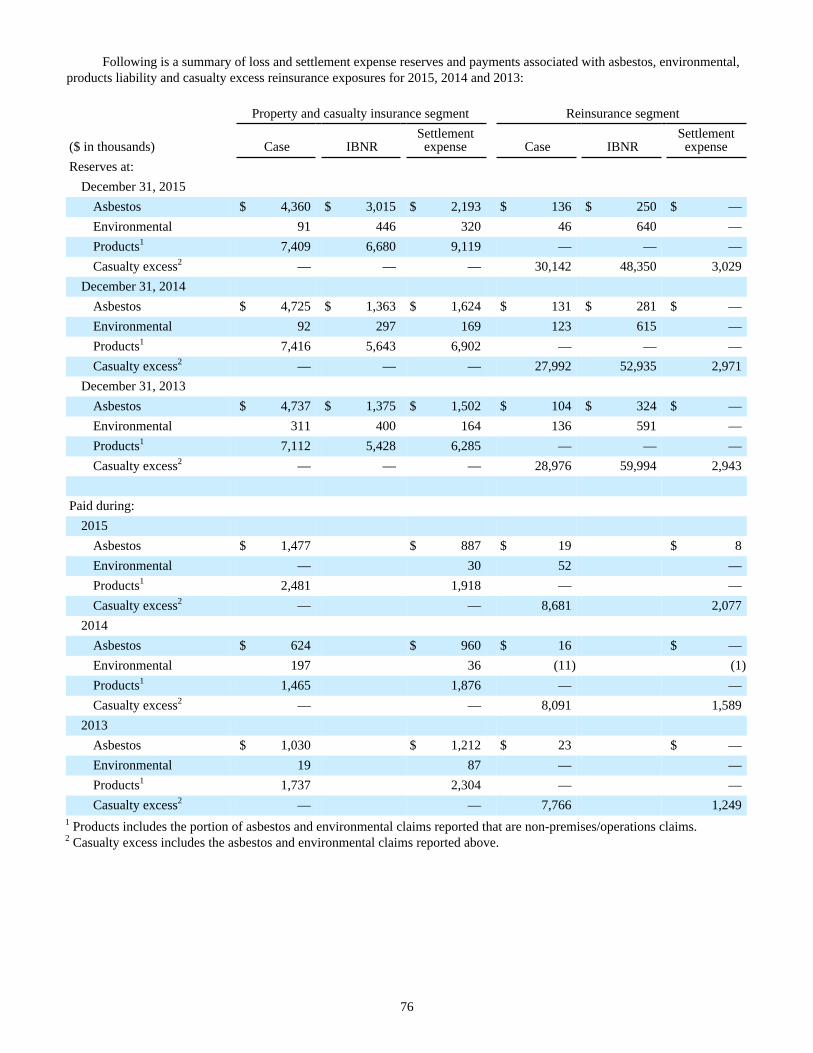
76
Following is a summary of loss and settlement expense reserves and payments associated with asbestos, environmental, products liability and casualty excess reinsurance exposures for 2015, 2014 and 2013:
Property and casualty insurance segment Reinsurance segment
($ in thousands) Case IBNRSettlement
expense Case IBNRSettlement
expenseReserves at:
December 31, 2015Asbestos $ 4,360 $ 3,015 $ 2,193 $ 136 $ 250 $ —Environmental 91 446 320 46 640 —Products1 7,409 6,680 9,119 — — —Casualty excess2 — — — 30,142 48,350 3,029
December 31, 2014Asbestos $ 4,725 $ 1,363 $ 1,624 $ 131 $ 281 $ —Environmental 92 297 169 123 615 —Products1 7,416 5,643 6,902 — — —Casualty excess2 — — — 27,992 52,935 2,971
December 31, 2013Asbestos $ 4,737 $ 1,375 $ 1,502 $ 104 $ 324 $ —Environmental 311 400 164 136 591 —Products1 7,112 5,428 6,285 — — —Casualty excess2 — — — 28,976 59,994 2,943
Paid during:2015
Asbestos $ 1,477 $ 887 $ 19 $ 8Environmental — 30 52 —Products1 2,481 1,918 — —Casualty excess2 — — 8,681 2,077
2014Asbestos $ 624 $ 960 $ 16 $ —Environmental 197 36 (11) (1)Products1 1,465 1,876 — —Casualty excess2 — — 8,091 1,589
2013Asbestos $ 1,030 $ 1,212 $ 23 $ —Environmental 19 87 — —Products1 1,737 2,304 — —Casualty excess2 — — 7,766 1,249
1 Products includes the portion of asbestos and environmental claims reported that are non-premises/operations claims.2 Casualty excess includes the asbestos and environmental claims reported above.
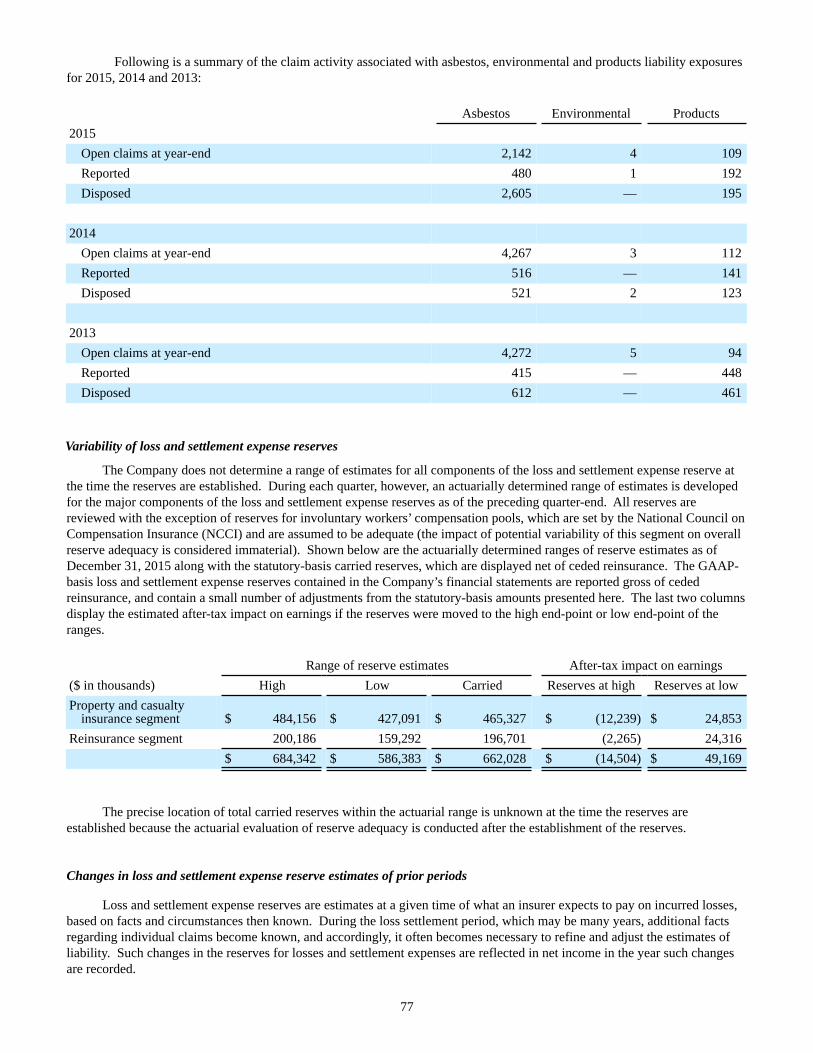
77
Following is a summary of the claim activity associated with asbestos, environmental and products liability exposures for 2015, 2014 and 2013:
Asbestos Environmental Products2015
Open claims at year-end 2,142 4 109Reported 480 1 192Disposed 2,605 — 195
2014Open claims at year-end 4,267 3 112Reported 516 — 141Disposed 521 2 123
2013Open claims at year-end 4,272 5 94Reported 415 — 448Disposed 612 — 461
Variability of loss and settlement expense reserves
The Company does not determine a range of estimates for all components of the loss and settlement expense reserve at the time the reserves are established. During each quarter, however, an actuarially determined range of estimates is developed for the major components of the loss and settlement expense reserves as of the preceding quarter-end. All reserves are reviewed with the exception of reserves for involuntary workers’ compensation pools, which are set by the National Council on Compensation Insurance (NCCI) and are assumed to be adequate (the impact of potential variability of this segment on overall reserve adequacy is considered immaterial). Shown below are the actuarially determined ranges of reserve estimates as of December 31, 2015 along with the statutory-basis carried reserves, which are displayed net of ceded reinsurance. The GAAP-basis loss and settlement expense reserves contained in the Company’s financial statements are reported gross of ceded reinsurance, and contain a small number of adjustments from the statutory-basis amounts presented here. The last two columns display the estimated after-tax impact on earnings if the reserves were moved to the high end-point or low end-point of the ranges.
Range of reserve estimates After-tax impact on earnings($ in thousands) High Low Carried Reserves at high Reserves at lowProperty and casualty
insurance segment $ 484,156 $ 427,091 $ 465,327 $ (12,239) $ 24,853Reinsurance segment 200,186 159,292 196,701 (2,265) 24,316
$ 684,342 $ 586,383 $ 662,028 $ (14,504) $ 49,169
The precise location of total carried reserves within the actuarial range is unknown at the time the reserves are established because the actuarial evaluation of reserve adequacy is conducted after the establishment of the reserves.
Changes in loss and settlement expense reserve estimates of prior periods
Loss and settlement expense reserves are estimates at a given time of what an insurer expects to pay on incurred losses, based on facts and circumstances then known. During the loss settlement period, which may be many years, additional facts regarding individual claims become known, and accordingly, it often becomes necessary to refine and adjust the estimates of liability. Such changes in the reserves for losses and settlement expenses are reflected in net income in the year such changes are recorded.
78
For a detailed discussion of the development experienced on prior accident years’ reserves during the past three years, see the discussion entitled “Loss and Settlement Expense Reserves” under the “Narrative Description of Business” heading in the Business Section under Part I, Item 1 of this Form 10-K.
Investments
Fair Value Measurement
Fair value is defined as the price that would be received to sell an asset or paid to transfer a liability in an orderly transaction between market participants at the measurement date. The following fair value hierarchy prioritizes inputs to valuation techniques used to measure fair value:
Level 1 - Unadjusted quoted prices for identical assets or liabilities in active markets that the Company has the abilityto access.
Level 2 - Quoted prices for similar assets or liabilities in active markets; quoted prices for identical or similar assetsor liabilities in inactive markets; or valuations based on models where the significant inputs are observable(e.g., interest rates, yield curves, prepayment speeds, default rates, loss severities, etc.) or can becorroborated by observable market data.
Level 3 - Prices or valuation techniques that require significant unobservable inputs because observable inputs are notavailable. The unobservable inputs may reflect the Company’s own judgments about the assumptions thatmarket participants would use.
The Company uses an independent pricing source to obtain the estimated fair values of a majority of its securities, subject to an internal validation. The fair values are based on quoted market prices, where available. This is typically the case for equity securities and money market funds, which are accordingly classified as Level 1 fair value measurements. In cases where quoted market prices are not available, fair values are based on a variety of valuation techniques depending on the type of security. Fixed maturity securities, non-redeemable preferred stocks and various short-term investments in the Company’s portfolio may not trade on a daily basis; however, observable inputs are utilized in their valuations, and these securities are therefore classified as Level 2 fair value measurements. Following is a brief description of the various pricing techniques used by the independent pricing source for different asset classes.
• U.S. Treasury securities (including bonds, notes, and bills) are priced according to a number of live data sources,including active market makers and inter-dealer brokers. Prices from these sources are reviewed based on thesources’ historical accuracy for individual issues and maturity ranges.
• U.S. government-sponsored agencies and corporate securities (including fixed-rate corporate bonds and medium-term notes) are priced by determining a bullet (non-call) spread scale for each issuer for maturities going out to fortyyears. These spreads represent credit risk and are obtained from the new issue market, secondary trading, and dealerquotes. An option adjusted spread model is incorporated to adjust spreads of issues that have early redemptionfeatures. The final spread is then added to the U.S. Treasury curve.
• Obligations of states and political subdivisions are priced by tracking and analyzing actively quoted issues andreported trades, material event notices and benchmark yields. Municipal bonds with similar characteristics aregrouped together into market sectors, and internal yield curves are constructed daily for these sectors. Individualbond evaluations are extrapolated from these sectors, with the ability to make individual spread adjustments forattributes such as discounts, premiums, alternative minimum tax, and/or whether or not the bond is callable.
• Mortgage-backed and asset-backed securities are first reviewed for the appropriate pricing speed (if prepayable),spread, yield and volatility. The securities are priced with models using spreads and other information solicitedfrom Wall Street buy- and sell-side sources, including primary and secondary dealers, portfolio managers, andresearch analysts. To determine a tranche’s price, first the benchmark yield is determined and adjusted for collateralperformance, tranche level attributes and market conditions. Then the cash flow for each tranche is generated (usingconsensus prepayment speed assumptions including, as appropriate, a prepayment projection based on historicalstatistics of the underlying collateral). The tranche-level yield is used to discount the cash flows and generate theprice. Depending on the characteristics of the tranche, a volatility-driven, multi-dimensional single cash flowstream model or an option-adjusted spread model may be used. When cash flows or other security structure ormarket information is not available, broker quotes may be used.
79
On a quarterly basis, the Company receives from its independent pricing service a list of fixed maturity securities, if any, that were priced solely from broker quotes. For these securities, fair value may be determined using the broker quotes, or by the Company using similar pricing techniques as the Company’s independent pricing service. Depending on the level of observable inputs, these securities would be classified as Level 2 or Level 3 fair value measurements. At December 31, 2015 and 2014, the Company had no securities priced solely from broker quotes.
Essentially all securities in the Company’s investment portfolios have transparent pricing. All equity securities (with one exception) are traded on national exchanges with observable prices. Fixed maturity securities are typically high quality, liquid issues with daily pricing from the Company’s independent pricing source. Prices are validated through a variety of techniques. When performing these validations, the Company uses graduated tolerance levels for determining exceptions. Equity securities and U.S. treasury and government-sponsored agency fixed maturity securities have the highest transparency in pricing, and therefore have the smallest tolerance levels for variance. These are followed by (in order of decreasing transparency/increasing tolerance levels) mortgage-backed, corporate, municipal, and finally high-yield fixed maturity securities. The validations performed include:
1. Comparisons of the prices reported by the independent pricing source to daily runs of offerings and bids fromseveral brokers for a sample of securities.
2. Comparison of the prices reported by the independent pricing source to prices realized from the Company’s ownpurchase and sale transactions.
3. Comparison of the prices reported by the independent pricing source to prices from the Company’s investmentcustodian. It should be noted that the independent pricing source used by the Company is often the same sourceused by the Company’s investment custodian, thus limiting the confidence gained from this validation technique.
Rarely are the independent pricing source’s prices outside of tolerance levels. This is most likely to occur in less frequently traded municipal fixed maturity securities, where the price reported by the independent pricing source may have become stale due to a lack of recent trading activity. If it is believed that the price reported by the independent pricing source does not reflect the quality, maturity, optionality and liquidity characteristics of the fixed maturity security, alternative pricing sources are examined, including Bloomberg matrix pricing, regression pricing, and broker runs for offering prices of similar securities. A judgment is then made as to what price best reflects the characteristics of the security, and if the result is materially different than the fair value reported by the independent pricing source for that security, then management’s judgment of the fair value is used in the financial statements.
Investment Impairments
The Company regularly monitors its investments which have a fair value that is less than the amortized cost for indications of “other-than-temporary” impairment. Several factors are used to determine whether the amortized cost of an individual security has been “other-than-temporarily” impaired. Such factors include, but are not limited to (1) the security’s value and performance in the context of the overall markets, (2) length of time and extent the security’s fair value has been below amortized cost, (3) key corporate events, and (4) for equity securities, the ability and intent to hold the security until recovery to its cost basis.
The evaluation of an impaired fixed maturity security includes an assessment of whether the Company has the intent to sell the security, and whether it is more likely than not that the Company will be required to sell the security before recovery of its amortized cost basis. In addition, if the present value of cash flows expected to be collected is less than the amortized cost of the security, a credit loss is deemed to exist and the security is considered “other-than-temporarily” impaired. The portion of the impairment related to credit loss is recognized through earnings, and the portion of the impairment related to other factors, if any, is recognized through “other comprehensive income”.
When an equity security is deemed to be “other-than-temporarily” impaired, the amortized cost is reduced to fair value and a realized loss is recognized through earnings.
80
Deferred policy acquisition costs and related amortization
Acquisition costs, consisting of commissions, premium taxes, and salary and benefit expenses of employees directly involved in the underwriting of insurance policies that are successfully issued, are deferred and amortized to expense as premium revenue is recognized. Deferred policy acquisition costs and related amortization are calculated separately for the property and casualty insurance segment and the reinsurance segment. The methodology followed in computing deferred policy acquisition costs limits the amount of such deferred costs to the estimated realizable value. In determining estimated realizable value, the computation gives effect to the premium to be earned, related investment income, anticipated losses and settlement expenses, anticipated policyholder dividends, and certain other costs expected to be incurred to administer the insurance policies as the premium is earned. The anticipated losses and settlement expenses are based on the segment’s projected loss and settlement expense ratios for the next twelve months, which include provisions for anticipated catastrophe and storm losses based on historical results adjusted for recent trends. Utilizing these projections, deferred policy acquisition costs for the property and casualty insurance segment and the reinsurance segment were not subject to limitation at December 31, 2015. Based on an analysis performed by management, the actuarial projections of the expected loss and settlement expense ratios for the next twelve months would have needed to increase 19.1 percentage points in the property and casualty insurance segment and 8.1 percentage points in the reinsurance segment before deferred policy acquisition costs would have been subject to limitation. Such increases in the expected loss and settlement expense ratios would likely be driven by many factors, including higher provisions for anticipated catastrophe and storm losses.
Deferred income taxes
The realization of the deferred income tax asset is based upon projections indicating that a sufficient amount of future taxable income will be earned to utilize the tax deductions that will reverse in the future. These projections are based on the Company’s history of producing significant amounts of taxable income, the current premium rate environment for both the property and casualty insurance segment and the reinsurance segment, and expense control initiatives that have been implemented in recent years. In addition, management has formulated tax-planning strategies that could be implemented to generate taxable income if needed. Should the projected taxable income and tax planning strategies not provide sufficient taxable income to recover the deferred tax asset, a valuation allowance would be required.
Benefit Plans
Employers Mutual sponsors two defined benefit pension plans (a qualified plan and a non-qualified supplemental plan) and two postretirement benefit plans that provide retiree healthcare and life insurance coverage. Although the Company has no employees of its own, it is responsible for its share of the expenses and related prepaid assets and liabilities of these plans, as determined under the terms of the pooling agreement and the cost allocation methodologies applicable to its subsidiaries that do not participate in the pooling agreement.
The net periodic pension and postretirement benefit costs, as well as the prepaid assets and liabilities of these plans, are determined by actuarial valuations. Inherent in these valuations are key assumptions regarding the discount rate, the expected long-term rate of return on plan assets, and the rate of future compensation increases (pension plans only). Due to the conversion of the postretirement health care plan to an Employers Mutual-funded Health Reimbursement Arrangement (HRA) effective January 1, 2015, an assumption for the health care cost trend rate is no longer necessary. The assumptions used in the actuarial valuations are updated annually. Material changes in the net periodic pension and postretirement benefit costs may occur in the future due to changes in these assumptions or changes in other factors, such as the number of plan participants, the level of benefits provided, asset values and applicable legislation or regulations.
The discount rate utilized in the valuations is based on an analysis of the total rate of return that could be generated by a hypothetical portfolio of high-quality bonds created to generate cash flows that match the plans’ expected benefit payments. No callable bonds are used in this analysis and the discount rate produced by this analysis is compared to interest rates of applicable published indices for reasonableness. The discount rates used in the pension benefit obligation valuations at December 31, 2015, 2014 and 2013 were 3.90 percent, 3.57 percent and 4.17 percent, respectively. The discount rates used in the postretirement benefit obligation valuations at December 31, 2015, 2014 and 2013 were 4.42 percent, 4.04 percent and 4.71 percent, respectively. The discount rates used in the pension and postretirement benefit obligation valuations are also used in the calculation of the net periodic benefit costs for the subsequent year. A 0.25 percentage point decrease in the discount rates used in the 2015 valuations would increase the Company’s net periodic pension and postretirement benefit costs for 2016 by approximately $97,000. Conversely, a 0.25 percentage point increase in the 2015 discount rates would decrease the Company’s net periodic pension and postretirement benefit costs for 2016 by approximately $93,000.
81
The expected long-term rate of return on plan assets is developed considering actual historical results, current and expected market conditions, the mix of plan assets and investment strategy. The expected long-term rate of return on plan assets produced by this analysis and used in the calculation of the net periodic pension benefit costs for the years ended December 31, 2015 and 2014 was 7.00 percent and 7.25 percent, respectively. The expected long-term rate of return on plan assets used in the calculation of the net periodic postretirement benefit costs for the years ended December 31, 2015 and 2014 was 6.50 percent and 6.75 percent, respectively. The expected rate of return on plan assets to be used in the calculation of the 2016 net periodic benefit costs for the pension and postretirement benefit plans will be 7.00 percent and 6.50 percent, respectively. The actual rate of return earned on plan assets during 2015 was approximately zero for the pension plan (very slight negative return) and negative 1 percent for the postretirement benefit plans. The expected long-term rate of return assumption is subject to the general movement of the economy, but is generally less volatile than the discount rate assumption. A decrease in the expected long-term rate of return assumption increases future expenses, whereas an increase in the assumption reduces future expenses. A 0.25 percentage point change in the expected long-term rate of return assumption for 2016 would change the Company’s net periodic pension and postretirement benefit costs by approximately $256,000. For detailed information regarding the current allocation of assets within the pension and postretirement benefit plans, see note 12 of Notes to Consolidated Financial Statements under Part II, Item 8 of this Form 10-K.
In accordance with GAAP, actuarial gains/losses contained in the valuations that result from (1) actual experience that differs from that assumed, or (2) a change in actuarial assumptions, is accumulated and, if in excess of a specified corridor, amortized to expense over future periods. As of December 31, 2015, all of the benefit plans had accumulated actuarial losses in excess of the corridor that will be partially amortized into expense in 2016. The Company’s share of the accumulated actuarial losses that will be amortized into expense during 2016 amounts to $1.7 million. Prior service costs/credits for plan amendments are also contained in the valuations, and are amortized into expense/income over the future service periods of the participants. As of December 31, 2015, the postretirement benefit plans have prior service credits that are being amortized into income in future periods, while the qualified defined benefit pension plan has prior service costs that are being amortized into expense in future periods. The net amount of prior service credit being amortized into income during 2016 is $3.3 million.
In accordance with GAAP, the funded status of defined benefit pension and other postretirement plans is recognized as an asset or liability on the balance sheet. Changes in the funded status of the plans are recognized through other comprehensive income.
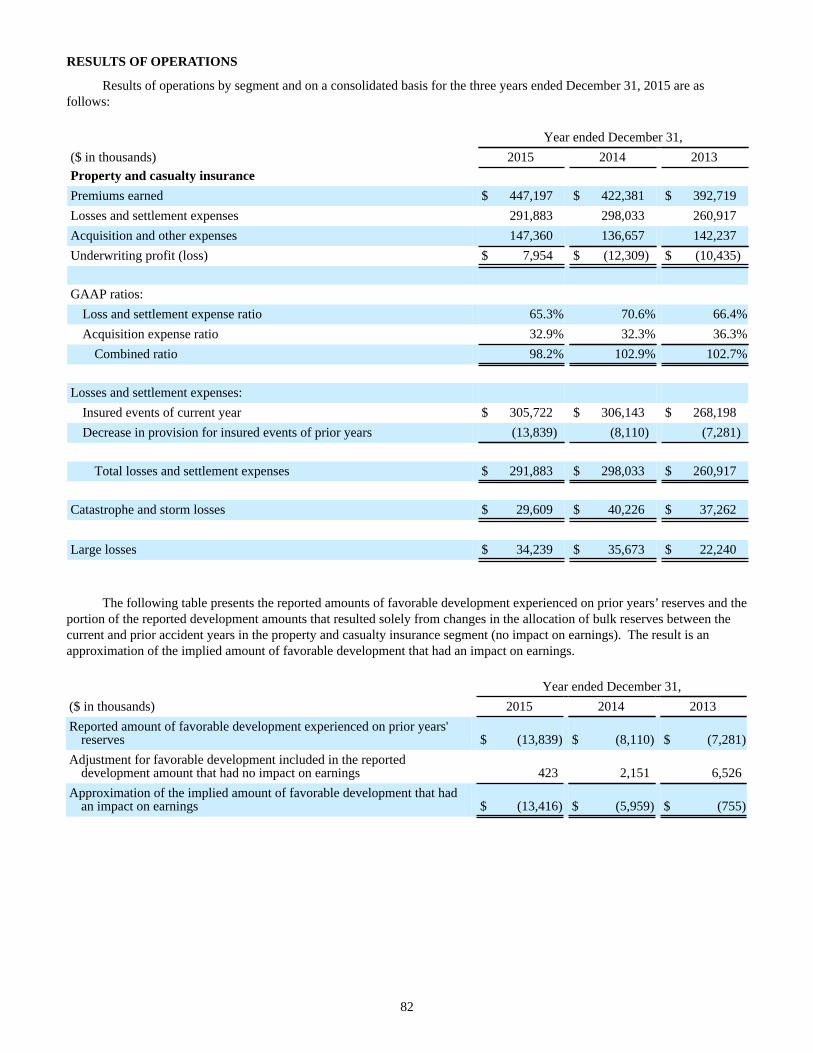
82
RESULTS OF OPERATIONS
Results of operations by segment and on a consolidated basis for the three years ended December 31, 2015 are as follows:
Year ended December 31,($ in thousands) 2015 2014 2013Property and casualty insurancePremiums earned $ 447,197 $ 422,381 $ 392,719Losses and settlement expenses 291,883 298,033 260,917Acquisition and other expenses 147,360 136,657 142,237Underwriting profit (loss) $ 7,954 $ (12,309) $ (10,435)
GAAP ratios:Loss and settlement expense ratio 65.3% 70.6% 66.4%Acquisition expense ratio 32.9% 32.3% 36.3%
Combined ratio 98.2% 102.9% 102.7%
Losses and settlement expenses:Insured events of current year $ 305,722 $ 306,143 $ 268,198Decrease in provision for insured events of prior years (13,839) (8,110) (7,281)
Total losses and settlement expenses $ 291,883 $ 298,033 $ 260,917
Catastrophe and storm losses $ 29,609 $ 40,226 $ 37,262
Large losses $ 34,239 $ 35,673 $ 22,240
The following table presents the reported amounts of favorable development experienced on prior years’ reserves and the portion of the reported development amounts that resulted solely from changes in the allocation of bulk reserves between the current and prior accident years in the property and casualty insurance segment (no impact on earnings). The result is an approximation of the implied amount of favorable development that had an impact on earnings.
Year ended December 31,($ in thousands) 2015 2014 2013Reported amount of favorable development experienced on prior years'
reserves $ (13,839) $ (8,110) $ (7,281)Adjustment for favorable development included in the reported
development amount that had no impact on earnings 423 2,151 6,526Approximation of the implied amount of favorable development that had
an impact on earnings $ (13,416) $ (5,959) $ (755)
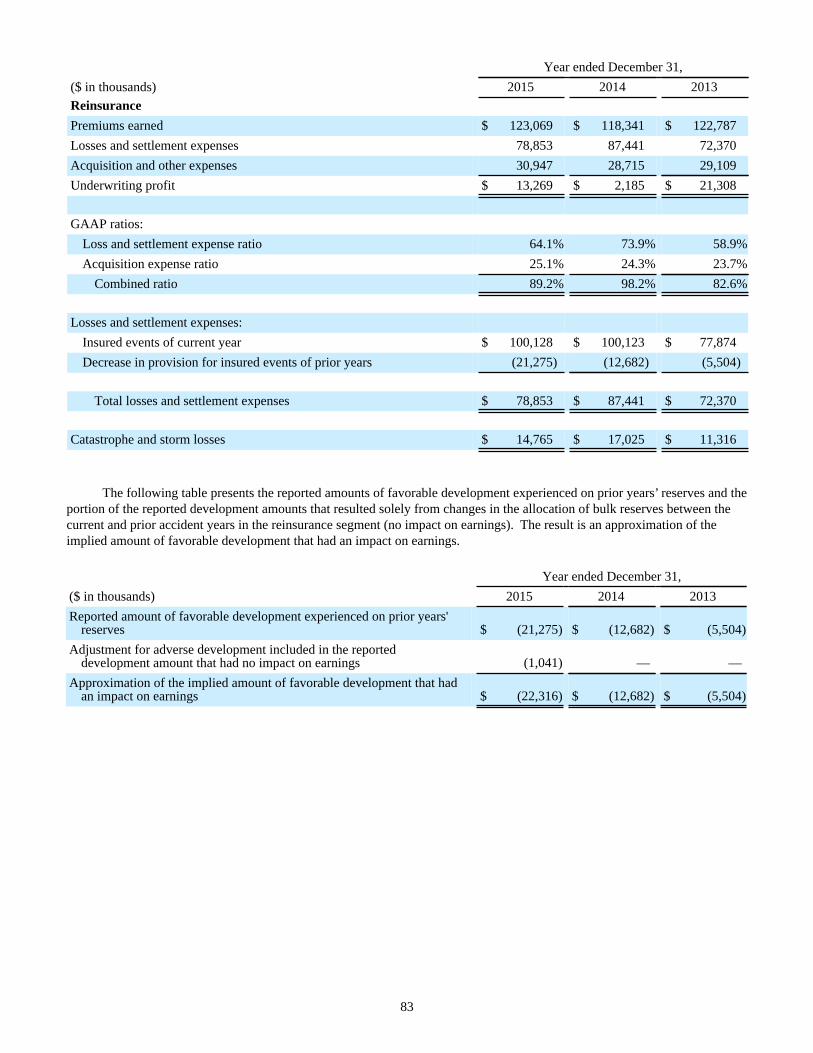
83
Year ended December 31,($ in thousands) 2015 2014 2013ReinsurancePremiums earned $ 123,069 $ 118,341 $ 122,787Losses and settlement expenses 78,853 87,441 72,370Acquisition and other expenses 30,947 28,715 29,109Underwriting profit $ 13,269 $ 2,185 $ 21,308
GAAP ratios:Loss and settlement expense ratio 64.1% 73.9% 58.9%Acquisition expense ratio 25.1% 24.3% 23.7%
Combined ratio 89.2% 98.2% 82.6%
Losses and settlement expenses:Insured events of current year $ 100,128 $ 100,123 $ 77,874Decrease in provision for insured events of prior years (21,275) (12,682) (5,504)
Total losses and settlement expenses $ 78,853 $ 87,441 $ 72,370
Catastrophe and storm losses $ 14,765 $ 17,025 $ 11,316
The following table presents the reported amounts of favorable development experienced on prior years’ reserves and the portion of the reported development amounts that resulted solely from changes in the allocation of bulk reserves between the current and prior accident years in the reinsurance segment (no impact on earnings). The result is an approximation of the implied amount of favorable development that had an impact on earnings.
Year ended December 31,($ in thousands) 2015 2014 2013Reported amount of favorable development experienced on prior years'
reserves $ (21,275) $ (12,682) $ (5,504)Adjustment for adverse development included in the reported
development amount that had no impact on earnings (1,041) — —Approximation of the implied amount of favorable development that had
an impact on earnings $ (22,316) $ (12,682) $ (5,504)
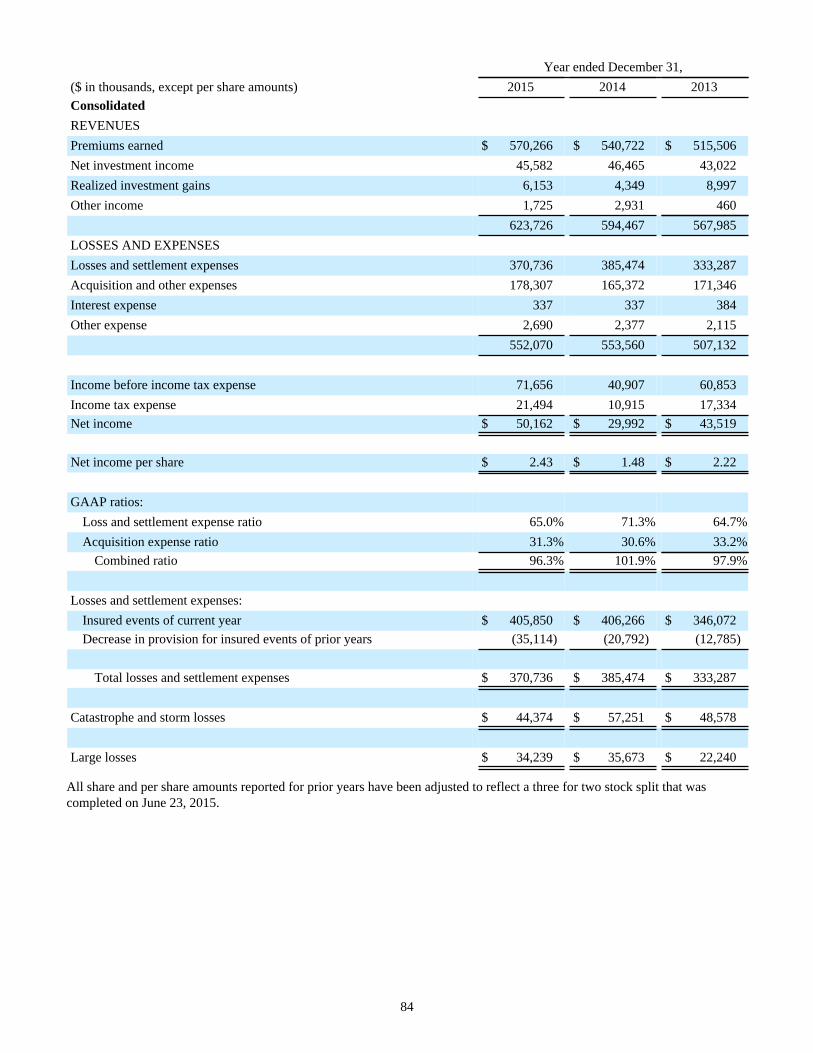
84
Year ended December 31,($ in thousands, except per share amounts) 2015 2014 2013ConsolidatedREVENUESPremiums earned $ 570,266 $ 540,722 $ 515,506Net investment income 45,582 46,465 43,022Realized investment gains 6,153 4,349 8,997Other income 1,725 2,931 460
623,726 594,467 567,985LOSSES AND EXPENSESLosses and settlement expenses 370,736 385,474 333,287Acquisition and other expenses 178,307 165,372 171,346Interest expense 337 337 384Other expense 2,690 2,377 2,115
552,070 553,560 507,132
Income before income tax expense 71,656 40,907 60,853Income tax expense 21,494 10,915 17,334Net income $ 50,162 $ 29,992 $ 43,519
Net income per share $ 2.43 $ 1.48 $ 2.22
GAAP ratios:Loss and settlement expense ratio 65.0% 71.3% 64.7%Acquisition expense ratio 31.3% 30.6% 33.2%
Combined ratio 96.3% 101.9% 97.9%
Losses and settlement expenses:Insured events of current year $ 405,850 $ 406,266 $ 346,072Decrease in provision for insured events of prior years (35,114) (20,792) (12,785)
Total losses and settlement expenses $ 370,736 $ 385,474 $ 333,287
Catastrophe and storm losses $ 44,374 $ 57,251 $ 48,578
Large losses $ 34,239 $ 35,673 $ 22,240
All share and per share amounts reported for prior years have been adjusted to reflect a three for two stock split that was completed on June 23, 2015.
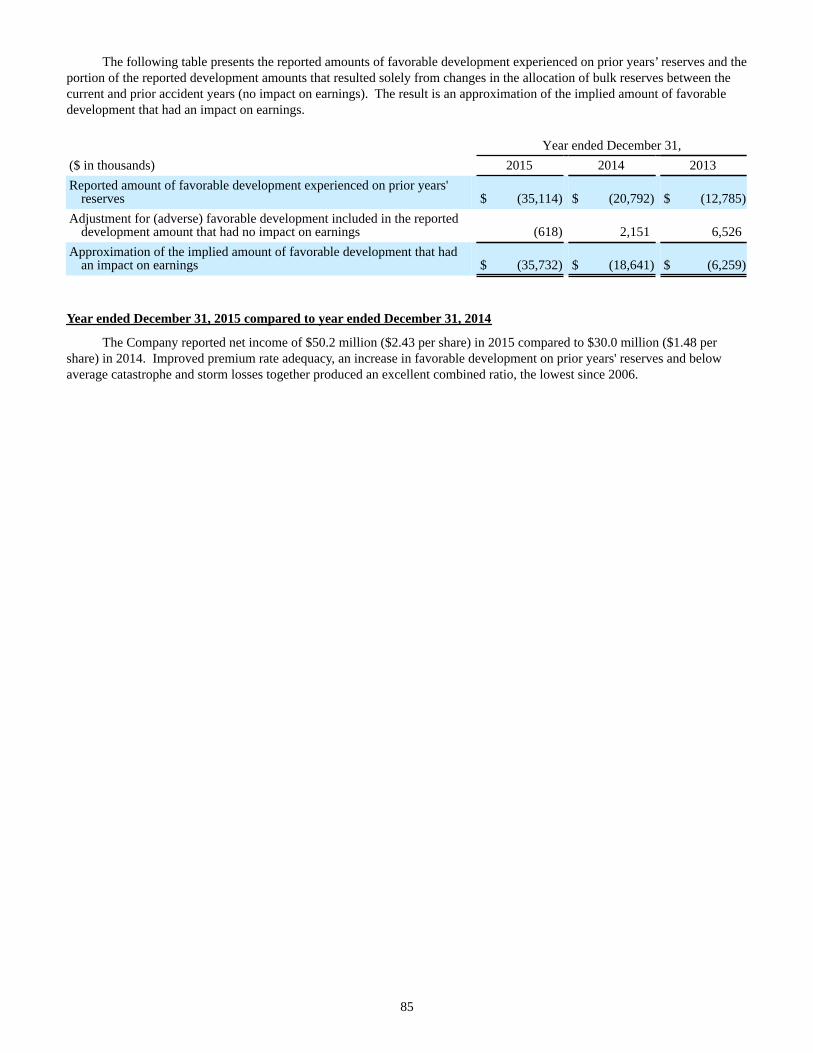
85
The following table presents the reported amounts of favorable development experienced on prior years’ reserves and the portion of the reported development amounts that resulted solely from changes in the allocation of bulk reserves between the current and prior accident years (no impact on earnings). The result is an approximation of the implied amount of favorable development that had an impact on earnings.
Year ended December 31,($ in thousands) 2015 2014 2013Reported amount of favorable development experienced on prior years'
reserves $ (35,114) $ (20,792) $ (12,785)Adjustment for (adverse) favorable development included in the reported
development amount that had no impact on earnings (618) 2,151 6,526Approximation of the implied amount of favorable development that had
an impact on earnings $ (35,732) $ (18,641) $ (6,259)
Year ended December 31, 2015 compared to year ended December 31, 2014
The Company reported net income of $50.2 million ($2.43 per share) in 2015 compared to $30.0 million ($1.48 per share) in 2014. Improved premium rate adequacy, an increase in favorable development on prior years' reserves and below average catastrophe and storm losses together produced an excellent combined ratio, the lowest since 2006.
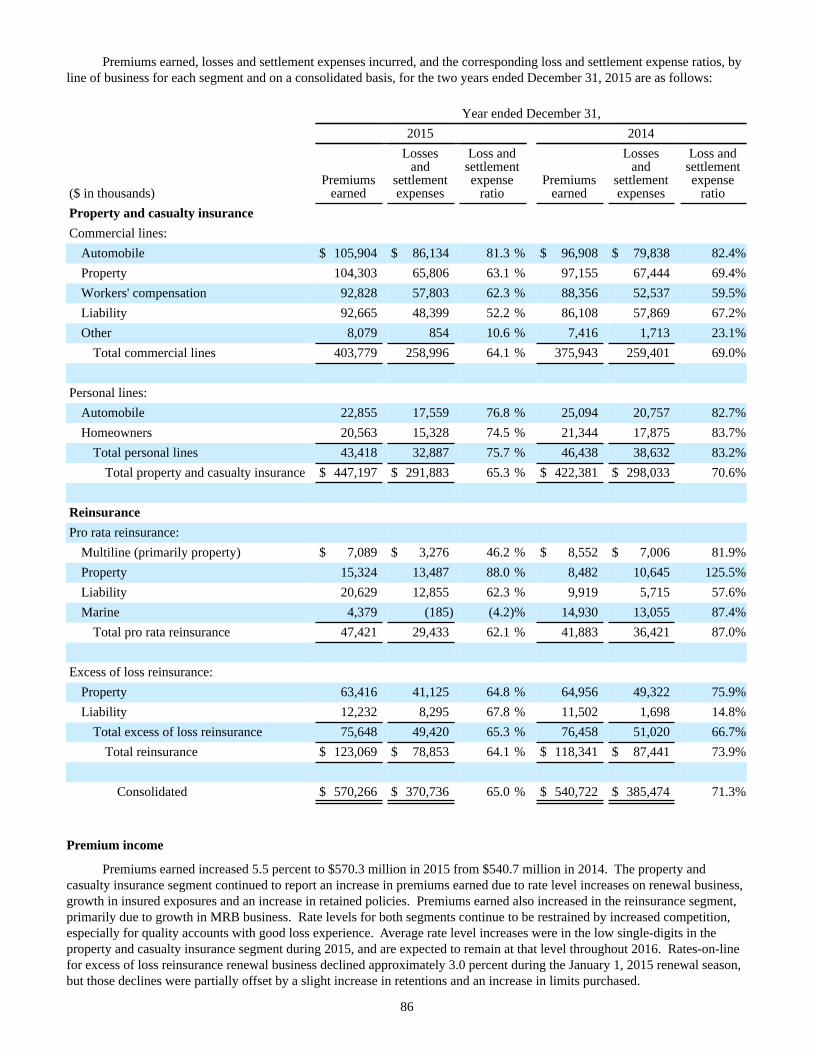
86
Premiums earned, losses and settlement expenses incurred, and the corresponding loss and settlement expense ratios, by line of business for each segment and on a consolidated basis, for the two years ended December 31, 2015 are as follows:
Year ended December 31,2015 2014
($ in thousands)Premiums
earned
Lossesand
settlementexpenses
Loss andsettlementexpense
ratioPremiums
earned
Lossesand
settlementexpenses
Loss andsettlementexpense
ratioProperty and casualty insuranceCommercial lines:
Automobile $ 105,904 $ 86,134 81.3 % $ 96,908 $ 79,838 82.4%Property 104,303 65,806 63.1 % 97,155 67,444 69.4%Workers' compensation 92,828 57,803 62.3 % 88,356 52,537 59.5%Liability 92,665 48,399 52.2 % 86,108 57,869 67.2%Other 8,079 854 10.6 % 7,416 1,713 23.1%
Total commercial lines 403,779 258,996 64.1 % 375,943 259,401 69.0%
Personal lines:Automobile 22,855 17,559 76.8 % 25,094 20,757 82.7%Homeowners 20,563 15,328 74.5 % 21,344 17,875 83.7%
Total personal lines 43,418 32,887 75.7 % 46,438 38,632 83.2%Total property and casualty insurance $ 447,197 $ 291,883 65.3 % $ 422,381 $ 298,033 70.6%
ReinsurancePro rata reinsurance:
Multiline (primarily property) $ 7,089 $ 3,276 46.2 % $ 8,552 $ 7,006 81.9%Property 15,324 13,487 88.0 % 8,482 10,645 125.5%Liability 20,629 12,855 62.3 % 9,919 5,715 57.6%Marine 4,379 (185) (4.2)% 14,930 13,055 87.4%
Total pro rata reinsurance 47,421 29,433 62.1 % 41,883 36,421 87.0%
Excess of loss reinsurance:Property 63,416 41,125 64.8 % 64,956 49,322 75.9%Liability 12,232 8,295 67.8 % 11,502 1,698 14.8%
Total excess of loss reinsurance 75,648 49,420 65.3 % 76,458 51,020 66.7%Total reinsurance $ 123,069 $ 78,853 64.1 % $ 118,341 $ 87,441 73.9%
Consolidated $ 570,266 $ 370,736 65.0 % $ 540,722 $ 385,474 71.3%
Premium income
Premiums earned increased 5.5 percent to $570.3 million in 2015 from $540.7 million in 2014. The property and casualty insurance segment continued to report an increase in premiums earned due to rate level increases on renewal business, growth in insured exposures and an increase in retained policies. Premiums earned also increased in the reinsurance segment, primarily due to growth in MRB business. Rate levels for both segments continue to be restrained by increased competition, especially for quality accounts with good loss experience. Average rate level increases were in the low single-digits in the property and casualty insurance segment during 2015, and are expected to remain at that level throughout 2016. Rates-on-line for excess of loss reinsurance renewal business declined approximately 3.0 percent during the January 1, 2015 renewal season, but those declines were partially offset by a slight increase in retentions and an increase in limits purchased.
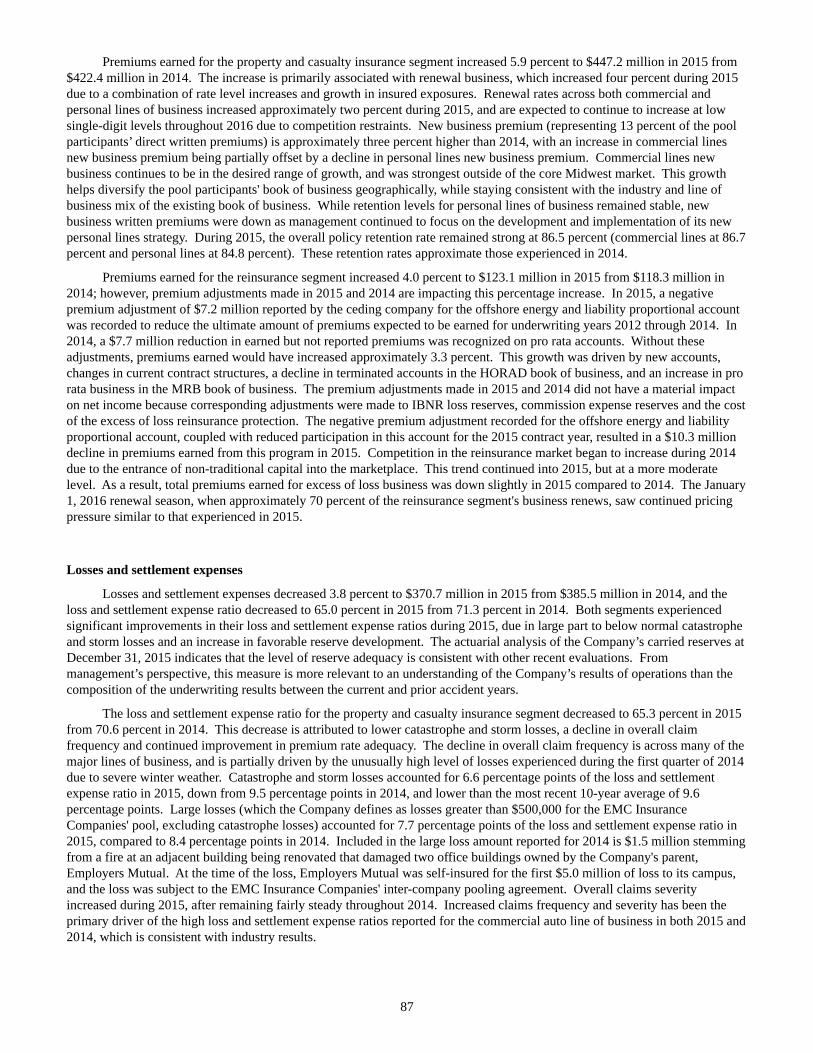
87
Premiums earned for the property and casualty insurance segment increased 5.9 percent to $447.2 million in 2015 from $422.4 million in 2014. The increase is primarily associated with renewal business, which increased four percent during 2015 due to a combination of rate level increases and growth in insured exposures. Renewal rates across both commercial and personal lines of business increased approximately two percent during 2015, and are expected to continue to increase at low single-digit levels throughout 2016 due to competition restraints. New business premium (representing 13 percent of the pool participants’ direct written premiums) is approximately three percent higher than 2014, with an increase in commercial lines new business premium being partially offset by a decline in personal lines new business premium. Commercial lines new business continues to be in the desired range of growth, and was strongest outside of the core Midwest market. This growth helps diversify the pool participants' book of business geographically, while staying consistent with the industry and line of business mix of the existing book of business. While retention levels for personal lines of business remained stable, new business written premiums were down as management continued to focus on the development and implementation of its new personal lines strategy. During 2015, the overall policy retention rate remained strong at 86.5 percent (commercial lines at 86.7 percent and personal lines at 84.8 percent). These retention rates approximate those experienced in 2014.
Premiums earned for the reinsurance segment increased 4.0 percent to $123.1 million in 2015 from $118.3 million in 2014; however, premium adjustments made in 2015 and 2014 are impacting this percentage increase. In 2015, a negative premium adjustment of $7.2 million reported by the ceding company for the offshore energy and liability proportional account was recorded to reduce the ultimate amount of premiums expected to be earned for underwriting years 2012 through 2014. In 2014, a $7.7 million reduction in earned but not reported premiums was recognized on pro rata accounts. Without these adjustments, premiums earned would have increased approximately 3.3 percent. This growth was driven by new accounts, changes in current contract structures, a decline in terminated accounts in the HORAD book of business, and an increase in pro rata business in the MRB book of business. The premium adjustments made in 2015 and 2014 did not have a material impact on net income because corresponding adjustments were made to IBNR loss reserves, commission expense reserves and the cost of the excess of loss reinsurance protection. The negative premium adjustment recorded for the offshore energy and liability proportional account, coupled with reduced participation in this account for the 2015 contract year, resulted in a $10.3 million decline in premiums earned from this program in 2015. Competition in the reinsurance market began to increase during 2014 due to the entrance of non-traditional capital into the marketplace. This trend continued into 2015, but at a more moderate level. As a result, total premiums earned for excess of loss business was down slightly in 2015 compared to 2014. The January 1, 2016 renewal season, when approximately 70 percent of the reinsurance segment's business renews, saw continued pricing pressure similar to that experienced in 2015.
Losses and settlement expenses
Losses and settlement expenses decreased 3.8 percent to $370.7 million in 2015 from $385.5 million in 2014, and the loss and settlement expense ratio decreased to 65.0 percent in 2015 from 71.3 percent in 2014. Both segments experienced significant improvements in their loss and settlement expense ratios during 2015, due in large part to below normal catastrophe and storm losses and an increase in favorable reserve development. The actuarial analysis of the Company’s carried reserves at December 31, 2015 indicates that the level of reserve adequacy is consistent with other recent evaluations. From management’s perspective, this measure is more relevant to an understanding of the Company’s results of operations than the composition of the underwriting results between the current and prior accident years.
The loss and settlement expense ratio for the property and casualty insurance segment decreased to 65.3 percent in 2015 from 70.6 percent in 2014. This decrease is attributed to lower catastrophe and storm losses, a decline in overall claim frequency and continued improvement in premium rate adequacy. The decline in overall claim frequency is across many of the major lines of business, and is partially driven by the unusually high level of losses experienced during the first quarter of 2014 due to severe winter weather. Catastrophe and storm losses accounted for 6.6 percentage points of the loss and settlement expense ratio in 2015, down from 9.5 percentage points in 2014, and lower than the most recent 10-year average of 9.6 percentage points. Large losses (which the Company defines as losses greater than $500,000 for the EMC Insurance Companies' pool, excluding catastrophe losses) accounted for 7.7 percentage points of the loss and settlement expense ratio in 2015, compared to 8.4 percentage points in 2014. Included in the large loss amount reported for 2014 is $1.5 million stemming from a fire at an adjacent building being renovated that damaged two office buildings owned by the Company's parent, Employers Mutual. At the time of the loss, Employers Mutual was self-insured for the first $5.0 million of loss to its campus, and the loss was subject to the EMC Insurance Companies' inter-company pooling agreement. Overall claims severity increased during 2015, after remaining fairly steady throughout 2014. Increased claims frequency and severity has been the primary driver of the high loss and settlement expense ratios reported for the commercial auto line of business in both 2015 and 2014, which is consistent with industry results.
88
The property and casualty insurance segment's loss and settlement expense ratios for 2015 and 2014 reflect $13.8 million (3.1 percent of earned premiums) and $8.1 million (1.9 percent of earned premiums), respectively, of reported favorable development on prior years' reserves; however, these amounts include $423,000 and $2.2 million, respectively, of favorable development that resulted solely from changes in the allocation of bulk reserves between the current and prior accident years, and therefore had no impact on net income. Net income is only impacted by changes in the total amount of carried reserves.
The loss and settlement expense ratio for the reinsurance segment decreased to 64.1 percent in 2015 from 73.9 percent in 2014. This decrease reflects a decline in both reported large losses (losses greater than $100,000) and catastrophe and storm losses, as well as a significant increase in the amount of favorable reserve development experienced on prior years' reserves. Results for 2015 include $4.1 million of catastrophe and storm losses from the Tianjin, China explosion, which is net of $400,000 of reinsurance recovery under the excess of loss reinsurance protection provided by Employers Mutual. Approximately $500,000 of this loss was from the MRB book of business and is reflected in the pro rata property line of business, while the remaining $3.6 million of this loss is reflected in the excess of loss property line of business (accounts for approximately 3.5 and 5.6 percentage points of the loss and settlement expense ratios reported for the pro rata property and excess of loss property lines of business, respectively). The elevated loss and settlement expense ratio reported for the excess of loss liability line of business is attributed to an increase in reported losses for contract years 2010 through 2014, and a corresponding increase in the amount of bulk IBNR loss reserves allocated to these relatively immature years of this long-tailed coverage. Two large reductions in carried reserves implemented during 2015 had an impact on the loss and settlement expense ratios reported for two lines of business. First, revised ultimate loss ratio information was received for several contract years from the ceding company for the offshore energy and liability proportional account, which reduced the carried amount of IBNR loss reserves. This reduction in IBNR loss reserves, coupled with the decrease in IBNR loss reserves resulting from the downward adjustment in expected ultimate premiums on this account (see discussion above), produced a small negative amount of incurred losses and settlement expenses in the pro rata marine line of business, and a corresponding negative loss and settlement expense ratio. Second, a large estimated loss reserve that was established on a German account in the fourth quarter of 2014 was taken down because of favorable development contained in an account statement received in 2015. This resulted in a lower than normal loss and settlement expense ratio in the multiline line of business. In addition to the two large reductions in carried reserves noted above, the favorable development experienced on prior years’ reserves reflects a reduction in IBNR loss reserves established for the 2014 contract year that could no longer be justified. Catastrophe and storm losses accounted for 12.0 percentage points of the loss and settlement expense ratio in 2015, which is lower than both the 14.4 percentage points reported in 2014 and the most recent 10-year average of 13.0 percentage points.
The reinsurance segment's loss and settlement expense ratio for 2015 reflects $21.3 million (17.3 percent of earned premiums) of reported favorable development on prior years' reserves; however, this amount includes $1.0 million of adverse development that resulted solely from changes in the allocation of bulk reserves between the current and prior accident years, and therefore had no impact on net income. Net income is only impacted by changes in the total amount of carried reserves.
Acquisition and other expenses
Acquisition and other expenses increased 7.8 percent to $178.3 million in 2015 from $165.4 million in 2014. The acquisition expense ratio increased to 31.3 percent in 2015 from 30.6 percent in 2014. Acquisition and other expenses reported for both years include net periodic postretirement benefit income resulting from the amortization of a large prior service credit that resulted from an amendment of Employers Mutual's postretirement medical plan in the fourth quarter of 2013. This prior service credit was recognized in accumulated other comprehensive income in the fourth quarter of 2013, and is being amortized out of accumulated other comprehensive income and into net income over a period of 10 years. The increase in the 2015 ratio is attributed to a combination of higher technology costs, increased pension expense, and an increase in variable expenses such as contingent commissions and bonus accruals that are based on the improved underwriting results reported in 2015.
For the property and casualty insurance segment, the acquisition expense ratio increased to 32.9 percent in 2015 from 32.3 percent in 2014. The higher acquisition expense ratio in 2015 is primarily attributed to higher technology costs, increased pension expense, and an increase in the variable expense categories of contingent commissions and bonus accruals. Policyholders' dividend expense, another variable expense based on the underwriting results of some individual policies and the safety dividend groups, declined significantly and thus limited the increase in the acquisition expense ratio.
For the reinsurance segment, the acquisition expense ratio increased to 25.1 percent in 2015 from 24.3 percent in 2014. This increase is primarily attributed to higher contingent commission expense on the offshore energy and liability proportional account. Growth in pro rata business, which carries higher commission rates than excess of loss business, also contributed to the increase in the ratio.
89
Investment results
Net investment income decreased 1.9 percent to $45.6 million in 2015 from $46.5 million in 2014. Net investment income for 2014 included approximately $442,000 that resulted from the early payoff of a commercial mortgage-backed security that was purchased at a significant discount to par value, which accelerated the accretion of the discount to par value and therefore increased investment income. Excluding this amount, net investment income declined approximately 1.0 percent. Current interest rate levels remain below the average book yield of the fixed maturity portfolio, and will therefore likely continue to limit future growth in net investment income. The average coupon rate on the fixed maturity portfolio, excluding interest-only securities, has remained relatively steady at 3.9 percent since December 31, 2014, but is down slightly from 4.0 percent at December 31, 2013. The effective duration of the fixed maturity portfolio, excluding interest-only securities, also remained steady at 4.6 at December 31, 2015 and 2014. The Company’s equity portfolio produced dividend income of $5.6 million and $6.0 million in 2015 and 2014, respectively.
The Company reported net realized investment gains of $6.2 million in 2015 compared to $4.3 million in 2014. Included in these amounts are $1.5 million and $2.8 million in 2015 and 2014, respectively, of realized losses attributed to declines in the carrying value of a limited partnership that the Company first invested in during 2014 to help protect it from a sudden and significant decline in the value of its equity portfolio (an equity tail-risk hedging strategy). The Company recognized "other-than-temporary" impairment losses of $1.5 million and $878,000 during 2015 and 2014, respectively. The vast majority of these impairment losses were recognized on securities held in the Company's equity portfolio.
Other income
Included in other income is foreign currency exchange gains and losses recognized on the reinsurance segment’s foreign currency denominated reinsurance business. The reinsurance segment had foreign currency exchange gains of $898,000 and $2.2 million in 2015 and 2014, respectively.
Income tax
Income tax expense increased 96.9 percent to $21.5 million in 2015 from $10.9 million in 2014. The effective tax rate for 2015 was 30.0 percent, compared to 26.7 percent in 2014. The primary contributor to the differences between these effective tax rates and the United States federal corporate tax rate of 35 percent is tax-exempt interest income earned.
Year ended December 31, 2014 compared to year ended December 31, 2013
The Company reported net income of $30.0 million ($1.48 per share) in 2014 compared to $43.5 million ($2.22 per share) in 2013. Both the property and casualty insurance segment and the reinsurance segment produced underwriting profits in the fourth quarter of 2014, providing a strong finish to a somewhat challenging year. Although net income was down in 2014, the Company benefited from improved premium rate adequacy in the property and casualty insurance segment, an increase in investment income stemming from a larger invested asset base and a significant increase in dividend income, as well as a significant reduction in the amount of net periodic pension and postretirement benefit costs allocated to the Company. These favorable conditions were expected to continue to benefit the Company in 2015.
90
Premiums earned, losses and settlement expenses incurred, and the corresponding loss and settlement expense ratios, by line of business for each segment and on a consolidated basis, for the two years ended December 31, 2014 are as follows:
Year ended December 31,2014 2013
($ in thousands)Premiums
earned
Lossesand
settlementexpenses
Loss andsettlementexpense
ratioPremiums
earned
Lossesand
settlementexpenses
Loss andsettlementexpense
ratioProperty and casualty insuranceCommercial lines:
Automobile $ 96,908 $ 79,838 82.4% $ 86,230 $ 59,310 68.8%Property 97,155 67,444 69.4% 87,446 55,937 64.0%Workers' compensation 88,356 52,537 59.5% 83,172 54,779 65.9%Liability 86,108 57,869 67.2% 77,983 50,366 64.6%Other 7,416 1,713 23.1% 7,487 2,044 27.3%
Total commercial lines 375,943 259,401 69.0% 342,318 222,436 65.0%
Personal lines:Automobile 25,094 20,757 82.7% 27,408 20,204 73.7%Homeowners 21,344 17,875 83.7% 22,993 18,277 79.5%
Total personal lines 46,438 38,632 83.2% 50,401 38,481 76.4%Total property and casualty insurance $ 422,381 $ 298,033 70.6% $ 392,719 $ 260,917 66.4%
ReinsurancePro rata reinsurance:
Multiline (primarily property) $ 8,552 $ 7,006 81.9% $ 7,489 $ 3,950 52.7%Property 8,482 10,645 125.5% 20,239 11,423 56.4%Liability 9,919 5,715 57.6% 5,172 1,628 31.5%Marine 14,930 13,055 87.4% 14,748 4,879 33.1%
Total pro rata reinsurance 41,883 36,421 87.0% 47,648 21,880 45.9%
Excess of loss reinsurance:Property 64,956 49,322 75.9% 64,069 33,627 52.5%Liability 11,502 1,698 14.8% 11,070 16,863 152.3%
Total excess of loss reinsurance 76,458 51,020 66.7% 75,139 50,490 67.2%Total reinsurance $ 118,341 $ 87,441 73.9% $ 122,787 $ 72,370 58.9%
Consolidated $ 540,722 $ 385,474 71.3% $ 515,506 $ 333,287 64.7%
Premium income
Premiums earned increased 4.9 percent to $540.7 million in 2014 from $515.5 million in 2014. The increase was attributed to the property and casualty insurance segment, as the reinsurance segment experienced a decline in premium income due to a reduction in the amount of earned but not reported (EBNR) premiums recognized on pro rata contracts at December 31, 2014. The majority of the increase in the property and casualty insurance segment's premiums was from rate level increases on renewal business and growth in insured exposures. Management continued to implement premium rate increases in the property and casualty insurance segment, but the level of rate increases had declined steadily during 2014. Premium rate levels in the reinsurance market declined during 2014, but those declines did not have a significant impact on the reinsurance segment's operations since the majority of its reinsurance contracts renewed in the beginning of the year.
91
Premiums earned for the property and casualty insurance segment increased 7.6 percent to $422.4 million in 2014 from $392.7 million in 2013. The increase was primarily associated with renewal business, which increased seven percent during 2014 due to a combination of rate level increases, and to a lesser extent, growth in insured exposures. Renewal rates increased approximately 4.5 percent in commercial lines of business and 3.5 percent in personal lines during 2014, though it should be noted that the level of rate increases slowed as the year progressed, and this trend was expected to continue through 2015. The pool participants did not implement broad-based rate level increases across the entire book of business, but instead implemented rate level increases based on the loss history and risk exposures associated with each renewing policy, in order to achieve a more adequate overall rate level. This approach allowed the property and casualty insurance segment to retain its core book of business, while working to improve underwriting margins. While renewal rates for personal lines of business increased, written premiums were down due to an intentional reduction in policy count to lessen exposure concentrations. During 2014, the overall policy retention rate continued to be strong at 85.9 percent (commercial lines at 86.7 percent and personal lines at 84.8 percent), which was slightly higher than the retention rate at the end of 2013. Although new business continued to account for a relatively small portion (just 14 percent) of the pool participants’ direct written premiums, the pool participants were able to capitalize on some new business opportunities outside of the core Midwest market to further diversify into areas less prone to weather-related events, while at the same time staying consistent with the industry and line of business mix of the existing book of business. New business in the Northwest, Southwest and Southeast parts of the United States grew, and was generally expected to continue to grow, at a slightly faster pace than other regions. New business premium increased six percent in the commercial lines of business (corresponding policy count was down), while personal lines new business premium was down six percent.
Premiums earned for the reinsurance segment declined 3.6 percent to $118.3 million in 2014 from $122.8 million in 2013. This decline was not caused by rate level decreases or a loss of business, but rather was generally attributed to a $7.7 million reduction in the amount of EBNR premiums recognized on pro rata contracts in 2014, as discussed below. Without this reduction, earned premiums would have increased approximately 2.7 percent in 2014 due to growth in existing accounts and the addition of some new business. As previously reported, the premium recognition period of two large facility contracts in the property line of business was changed during the third quarter after it was determined that the vast majority of the underlying risks did not attach until January 1, 2015, or later. During the fourth quarter, the premium recognition period of all remaining pro rata contracts was reviewed on a contract-by-contract basis, and it was determined that the total amount of EBNR premiums established for those contracts, also primarily in the property line of business, should be reduced. The total of these corrections, which was partially offset by an increase in EBNR premiums in the marine line of business due to a difference in the timing of reports received from a ceding company, resulted in the reduction in EBNR premiums noted above. The reduction in EBNR premiums did not have a material impact on 2014 net income because corresponding corrections were made to IBNR loss reserves, commission expense reserves and the cost of the excess of loss reinsurance protection. These corrections did not impact the ultimate amount of premiums that would be earned.
The growth in existing accounts noted above primarily occurred in a pro rata casualty account first written in 2013. Premium growth was limited by a decline in rate levels for catastrophe excess of loss business (which comprised approximately 20 percent of the reinsurance segment's book of business). Rates-on-line for catastrophe excess of loss business declined approximately seven to eight percent during the January 1, 2014 renewal season, but those declines were partially offset by a slight increase in retentions and an increase in limits purchased by ceding companies. Other trends noted during the January 1, 2014 renewal season included the liberalization of contract terms generally favorable to the buyer, including, but not limited to, an expansion of the hours clause (which provided a longer time period for losses to be attributed to a named catastrophic event); expansion of terrorism coverage to include, in many contracts, all acts other than nuclear, biological, chemical and radiation; and multi-year commitments on pricing. Premiums earned for 2014 reflected a reduction in the cost of the excess of loss reinsurance protection provided by Employers Mutual, from 9.0 percent of total assumed reinsurance premiums written in 2013 to 8.0 percent in 2014.
Effective January 1, 2013, Church Mutual became a member of the MRB underwriting association. As a result, Employers Mutual became a one-fifth participant in MRB, down from its previous one-fourth participation. In connection with Employers Mutual’s decreased participation in MRB, the reinsurance segment recorded a $585,000 portfolio adjustment decrease in premiums written in the first quarter of 2013. This portfolio adjustment did not affect earned premium since there was a corresponding decrease in unearned premiums. Nine percent of this amount ($53,000) was recorded as a reduction in the cost of the excess of loss coverage provided by Employers Mutual, and the reinsurance segment recognized $223,000 of negative commission allowance (commission income) to compensate for the acquisition costs incurred to generate the business ceded to Church Mutual.
92
Losses and settlement expenses
Losses and settlement expenses increased 15.7 percent to $385.5 million in 2014 from $333.3 million in 2013, and the loss and settlement expense ratio increased to 71.3 percent in 2014 from 64.7 percent in 2013. Both segments experienced increases in their loss and settlement expense ratios during 2014, but the increase was especially large in the reinsurance segment due to increases in both loss severity and catastrophe and storm losses, and the unusually low loss and settlement expense ratio reported for 2013. The improved premium rate adequacy achieved over the past several years helped reduce the impact that the elevated level of losses would have otherwise had on the loss and settlement expense ratios. The actuarial analysis of the Company’s carried reserves at December 31, 2014 indicated that the level of reserve adequacy was consistent with other recent evaluations. From management’s perspective, this measure was more relevant to an understanding of the Company’s results of operations than the composition of underwriting results between the current and prior accident years.
The loss and settlement expense ratio for the property and casualty insurance segment increased to 70.6 percent in 2014 from 66.4 percent in 2013. The primary reasons for the higher ratio in 2014 included an increase in large losses, which the Company defined as losses greater than $500,000 for the EMC Insurance Companies’ pool, excluding catastrophe and storm losses, and a decline in the performance of the core book of business (excluding catastrophe and storm losses, large losses and development on prior years' reserves). Large losses accounted for 8.4 percentage points of the loss and settlement expense ratio in 2014, compared to 5.7 percentage points in 2013. The increase in large losses was primarily attributed to liability losses in the commercial auto line of business, and to a lesser extent, fire-related losses in the commercial property line of business. There were several factors contributing to the decline in the performance of the core book of business, including the severe winter weather losses experienced in the first quarter, and increases in loss severity in the commercial auto, commercial property and homeowners' lines of business. Many of the first quarter severe winter weather losses were not classified as catastrophe and storm losses because cold weather events are generally not assigned an occurrence code by the Property & Liability Resource Bureau (PLRB); however, losses attributed to the polar vortex that impacted the eastern United States in early January were classified as catastrophe and storm losses because the PLRB assigned an occurrence code to that event. Catastrophe and storm losses accounted for 9.5 percentage points of the loss and settlement expense ratios in both 2014 and 2013, which approximated the most recent 10-year average of 9.7 percentage points. The large losses amount reported for 2014 included $1.5 million of damages to two home office buildings owned by the Company's parent, Employers Mutual, that resulted from a fire at an adjacent building under renovation. At the time of the loss, Employers Mutual was self-insured for the first $5.0 million of loss to its campus, and the loss was subject to the EMC Insurance Companies' inter-company pooling agreement.
The property and casualty insurance segment's loss and settlement expense ratios for 2014 and 2013 reflected $6.0 million (1.4 percent of earned premiums) and $755,000 (0.2 percent of earned premiums), respectively, of implied favorable development on prior years' reserves that had an impact on earnings (implied favorable development). The implied favorable development amounts excluded $2.2 million and $6.5 million, respectively, of favorable development included in the reported amounts of favorable development for 2014 and 2013 that resulted solely from changes in the allocation of bulk reserves between the current and prior accident years, and therefore had no impact on net income. Net income is only impacted by changes in the total amount of carried reserves.
The loss and settlement expense ratio for the reinsurance segment increased to 73.9 percent in 2014 from 58.9 percent in 2013. While this increase was significant, it is important to note that the 2013 ratio was unusually low. The increase was primarily attributed to an increase in catastrophe and storm losses, as well as loss severity. Catastrophe and storm losses contributed 14.4 percentage points to the 2014 loss and settlement expense ratio, compared to 9.2 percentage points in 2013. The most significant loss event was a severe Midwest storm that slightly exceeded the $4.0 million retention amount under the excess of loss agreement. The increase in loss severity was attributed to a number of fire losses, as well as some snow and ice collapse incidents. Favorable development on prior years’ reserves increased substantially during 2014, primarily due to a reduction in the amount of IBNR loss reserves carried for accident years 2010 and prior because the amount previously carried was no longer indicated in the actuarial analysis. The total amount of IBNR loss reserves carried at December 31, 2014 declined in conjunction with the decline in EBNR premiums noted above, however, this did not produce any meaningful impact on the loss and settlement expense ratio.
93
Acquisition and other expenses
Acquisition and other expenses decreased 3.5 percent to $165.4 million in 2014 from $171.3 million in 2013. The acquisition expense ratio decreased to 30.6 percent in 2014 from 33.2 percent in 2013. The decrease in the acquisition expense ratio was primarily attributed to large declines in the amount of net periodic pension and postretirement benefit costs allocated to the Company, as well as declines in contingent commission and policyholder dividend expenses, and an overall improvement in premium rate adequacy. Net periodic pension benefit cost declined to $680,000 in 2014, from $3.0 million in 2013. This decrease reflected an increase in the expected return on plan assets, due to an increase in plan assets, and a decline in the amount of net actuarial loss amortized into expense. Net periodic postretirement benefit cost changed significantly as a result of the plan amendment that was announced in the fourth quarter of 2013. The Company recognized net periodic postretirement benefit income of $3.1 million in 2014, compared to net periodic postretirement benefit expense of $2.9 million in 2013. The Company would be allocated approximately $1.7 million of net periodic pension benefit cost and $3.0 million of net periodic postretirement benefit income in 2015. The plan amendment created a large prior service credit that was being amortized into benefit expense over a period of 10 years. In addition, the service cost and interest cost components of the revised plan's net periodic benefit cost were significantly lower than those of the prior plan.
For the property and casualty insurance segment, the acquisition expense ratio decreased to 32.3 percent in 2014 from 36.3 percent in 2013. As mentioned above, this decrease was primarily attributed to the large decline in retirement benefit expenses and, to a lesser extent, declines in policyholder dividend and contingent commission expenses and an increase in premium income. During 2014, the property and casualty insurance segment was allocated $2.3 million of net periodic benefit income for the pension and postretirement benefit plans, compared to $5.7 million of net periodic benefit expense during the same period in 2013.
For the reinsurance segment, the acquisition expense ratio increased to 24.3 percent in 2014 from 23.7 percent in 2013. During the first quarter of 2013, the reinsurance segment recognized a $223,000 negative commission allowance in conjunction with the addition of Church Mutual to the MRB underwriting association. A portion of this negative commission allowance was offset by the amortization of the related deferred policy acquisition cost asset, resulting in an immediate expense reduction of approximately $105,000 during the first quarter of 2013. The total amount of commission expense reserves carried at December 31, 2014 declined in conjunction with the decline in EBNR premiums noted above, however, this did not produce any meaningful impact on the acquisition expense ratio.
Investment results
Net investment income increased 8.0 percent to $46.5 million in 2014 from $43.0 million in 2013. The increase reflected a higher average invested balance in fixed maturity securities and an increase in dividend income; however, the early payoff of a commercial mortgage-backed security during the first quarter of 2014 that was purchased at a significant discount to par value, which accelerated the accretion of the discount to par value and therefore increased investment income, also added to the increase. Current interest rate levels remained below the average coupon rate of the fixed maturity portfolio, and would therefore likely continue to limit future growth in net investment income. The average coupon rate on the fixed maturity portfolio, excluding interest-only securities, declined slightly to 3.9 percent at December 31, 2014 from 4.0 percent at December 31, 2013. The effective duration of the fixed maturity portfolio, excluding interest-only securities, decreased to 4.6 at December 31, 2014 from 5.7 at December 31, 2013, reflecting the decline in interest rates that occurred during 2014. The Company’s equity security holdings produced dividend income of $6.0 million in 2014 compared to $4.6 million in 2013.
The Company reported net realized investment gains of $4.3 million in 2014 compared to $9.0 million in 2013. Included in the 2014 amount was $2.8 million of realized losses attributed to the decline in the carrying value of a limited partnership that the Company invested in during the first quarter of 2014 to help protect it from a sudden and significant decline in the value of its equity portfolio (an equity tail-risk hedging strategy). Also contributing to the decline in net realized investment gains was the fact that during the fourth quarter of 2013 the Company took advantage of the outsized equity returns that occurred during the year by selling some stocks. The Company recognized "other-than-temporary" impairment losses of $878,000 and $63,000 during 2014 and 2013, respectively.
94
Other income and interest expense
Included in other income was foreign currency exchange gains and losses recognized on the reinsurance segment’s foreign currency denominated reinsurance business. The reinsurance segment had a foreign currency exchange gain of $2.2 million in 2014 compared to a foreign currency exchange loss of $366,000 in 2013. The decline in interest expense during 2014 was due to a reduction in the interest rate on the property and casualty insurance segment's outstanding surplus notes from 3.60 percent to 1.35 percent that became effective February 1, 2013.
Income tax
Income tax expense decreased 37.0 percent to $10.9 million in 2014 from $17.3 million in 2013. The effective tax rate for 2014 was 26.7 percent, compared to 28.5 percent in 2013. The primary contributor to the differences between these effective tax rates and the United States federal corporate tax rate of 35 percent was tax-exempt interest income earned.
LIQUIDITY AND CAPITAL RESOURCES
Liquidity
Liquidity is a measure of a company’s ability to generate sufficient cash flows to meet cash obligations. The Company had positive cash flows from operations of $85.6 million in 2015, $91.8 million in 2014 and $86.8 million in 2013. The Company typically generates substantial positive cash flows from operations because cash from premium payments is generally received in advance of cash payments made to settle claims. These positive cash flows provide the foundation of the Company’s asset/liability management program and are the primary driver of the Company’s liquidity. The Company invests in high quality, liquid securities to match the anticipated payments of losses and settlement expenses of the underlying insurance policies. Because the timing of the losses is uncertain, the majority of the portfolio is maintained in short to intermediate maturity securities that can be easily liquidated or that generate adequate cash flow to meet liabilities.
The Company is a holding company whose principal asset is its investment in its property and casualty insurance subsidiaries and its reinsurance subsidiary (“insurance subsidiaries”). As a holding company, the Company is dependent upon cash dividends from its insurance subsidiaries to meet all its obligations, including cash dividends to stockholders and the funding of the Company’s stock repurchase programs. State insurance regulations restrict the maximum amount of dividends insurance companies can pay without prior regulatory approval. The maximum amount of dividends that the insurance subsidiaries can pay to the Company in 2016 without prior regulatory approval is approximately $49.8 million. The Company received $9.2 million, $378,000 and $10.0 million of dividends from its insurance subsidiaries and paid cash dividends to its stockholders totaling $14.2 million, $12.6 million and $11.3 million in 2015, 2014 and 2013, respectively.
The Company’s insurance subsidiaries must maintain adequate liquidity to ensure that their cash obligations are met; however, because of the property and casualty insurance subsidiaries’ participation in the pooling agreement and the reinsurance subsidiary’s participation in the quota share agreement, they do not have the daily liquidity concerns normally associated with an insurance company. This is because under the terms of the pooling and quota share agreements, Employers Mutual receives all premiums and pays all losses and expenses associated with the insurance business produced by the pool participants and the assumed reinsurance business ceded to the Company’s reinsurance subsidiary, and then settles inter-company balances generated by these transactions with the participating companies on a monthly (pool participants) or quarterly (reinsurance subsidiary) basis.
At the insurance subsidiary level, the primary sources of cash are premium income, investment income and proceeds from called or matured investments. The principal outflows of cash are payments of claims, commissions, premium taxes, operating expenses, income taxes, dividends, interest and principal payments on debt, and investment purchases. Cash outflows vary because of uncertainties regarding settlement dates for unpaid losses and the potential for large losses, either individually or in the aggregate. Accordingly, the insurance subsidiaries maintain investment and reinsurance programs intended to provide adequate funds to pay claims without forced sales of investments. The insurance subsidiaries also have the ability to borrow funds on a short-term basis (180 days) from Employers Mutual and its subsidiaries and affiliate under an Inter-Company Loan Agreement. In addition, Employers Mutual maintains access to a line of credit with the Federal Home Loan Bank that could be used to provide the insurance subsidiaries additional liquidity if needed.
The Company maintains a portion of its investment portfolio in relatively short-term and highly liquid investments to ensure the availability of funds to pay claims and expenses. A variety of maturities are maintained in the Company’s investment portfolio to assure adequate liquidity. The maturity structure of the fixed maturity portfolio is also established by the relative attractiveness of yields on short, intermediate and long-term securities. The Company does not invest in non-investment grade debt securities. Any non-investment grade securities held by the Company are the result of rating downgrades subsequent to their purchase.
95
The Company invests for the long term and generally purchases fixed maturity securities with the intent to hold them to maturity. Despite this intent, the Company currently classifies fixed maturity securities as available-for-sale to provide flexibility in the management of its investment portfolio. At December 31, 2015 and 2014, the Company had net unrealized holding gains, net of deferred taxes, on its fixed maturity securities available-for-sale of $20.0 million and $30.9 million, respectively. The fluctuation in the fair value of these investments is primarily due to changes in the interest rate environment during this time period, but also reflects fluctuations in risk premium spreads over U.S. Treasuries. Since the Company intends to hold fixed maturity securities to maturity, such fluctuations in the fair value of these investments are not expected to have a material impact on the operations of the Company, as forced liquidations of investments are not anticipated. The Company closely monitors the bond market and makes appropriate adjustments in its portfolio as conditions warrant.
The majority of the Company’s assets are invested in fixed maturity securities. These investments provide a substantial amount of investment income that supplements underwriting results and contributes to net earnings. As these investments mature, or are called, the proceeds are reinvested at current interest rates, which may be higher or lower than those now being earned; therefore, more or less investment income may be available to contribute to net earnings. Due to the prolonged low interest rate environment, proceeds from calls and maturities in recent years have been reinvested at lower yields, which has had a negative impact on investment income.
The Company held $9.9 million and $6.2 million in minority ownership interests in limited partnerships and limited liability companies at December 31, 2015 and 2014, respectively. During the first quarters of 2015 and 2014, the Company invested $4.0 million and $4.4 million, respectively, in a limited partnership that is designed to help protect the Company from a sudden and significant decline in the value of its equity portfolio. This investment is included in "other long-term investments" in the Company's financial statements and is carried under the equity method of accounting.
During 2015, the Company began participating in a reverse repurchase arrangement, involving the purchase of investment securities from third-party sellers with the agreement that the purchased securities be sold back to the third-party sellers for agreed-upon prices at specified future dates. The third-party sellers are required to pledge collateral with a value greater than the amount of cash received in the transactions. In accordance with GAAP, the investment securities purchased under the reverse repurchase agreements are not reflected in the Company's consolidated balance sheets, but instead a receivable is recorded for the principal amount lent. The Company's receivable under reverse repurchase agreements was $16.9 million at December 31, 2015.
The Company’s cash balance was $224,000 and $383,000 at December 31, 2015 and 2014, respectively.
Employers Mutual contributed $4.0 million, $7.0 million and $14.0 million to its qualified pension plan in 2015, 2014 and 2013, respectively, and plans to contribute approximately $8.2 million to the qualified pension plan in 2016. The Company reimbursed Employers Mutual $1.2 million, $2.2 million and $4.3 million for its share of the pension contributions in 2015, 2014 and 2013, respectively. Employers Mutual contributed $500,000 to its postretirement benefit plans in 2013, but did not make any contributions during 2015 or 2014, and does not expect to make any contributions in 2016 due to the plan amendment that was announced during 2013. The Company reimbursed Employers Mutual $144,000 for its share of the postretirement benefit plan contribution in 2013.
Capital Resources
Capital resources consist of stockholders’ equity and debt, representing funds deployed or available to be deployed to support business operations. For the Company’s insurance subsidiaries, capital resources are required to support premium writings. Regulatory guidelines suggest that the ratio of a property and casualty insurer’s annual net premiums written to its statutory surplus should not exceed three to one. All of the Company’s property and casualty insurance subsidiaries were well under this guideline at December 31, 2015.
The Company’s insurance subsidiaries are required to maintain a certain minimum level of surplus on a statutory basis, and are subject to regulations under which the payment of dividends from statutory surplus is restricted and may require prior approval of their domiciliary insurance regulatory authorities. The Company’s insurance subsidiaries are also subject to annual Risk Based Capital (RBC) requirements that may further impact their ability to pay dividends. RBC requirements attempt to measure minimum statutory capital needs based upon the risks in a company’s mix of products and investment portfolio. At December 31, 2015, the Company’s insurance subsidiaries had total adjusted statutory capital of $485.2 million, which is well in excess of the minimum risk-based capital requirement of $77.4 million.
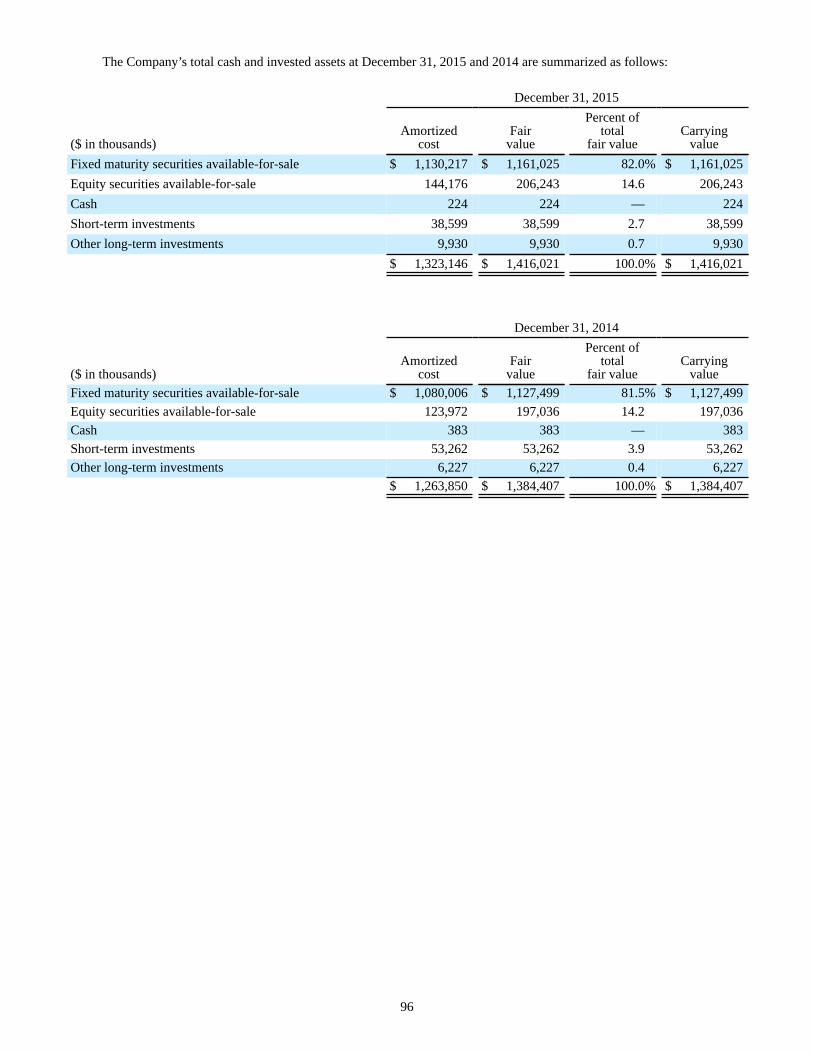
96
The Company’s total cash and invested assets at December 31, 2015 and 2014 are summarized as follows:
December 31, 2015
($ in thousands)Amortized
costFair
value
Percent oftotal
fair valueCarrying
valueFixed maturity securities available-for-sale $ 1,130,217 $ 1,161,025 82.0% $ 1,161,025Equity securities available-for-sale 144,176 206,243 14.6 206,243Cash 224 224 — 224Short-term investments 38,599 38,599 2.7 38,599Other long-term investments 9,930 9,930 0.7 9,930
$ 1,323,146 $ 1,416,021 100.0% $ 1,416,021
December 31, 2014
($ in thousands)Amortized
costFair
value
Percent oftotal
fair valueCarrying
valueFixed maturity securities available-for-sale $ 1,080,006 $ 1,127,499 81.5% $ 1,127,499Equity securities available-for-sale 123,972 197,036 14.2 197,036Cash 383 383 — 383Short-term investments 53,262 53,262 3.9 53,262Other long-term investments 6,227 6,227 0.4 6,227
$ 1,263,850 $ 1,384,407 100.0% $ 1,384,407
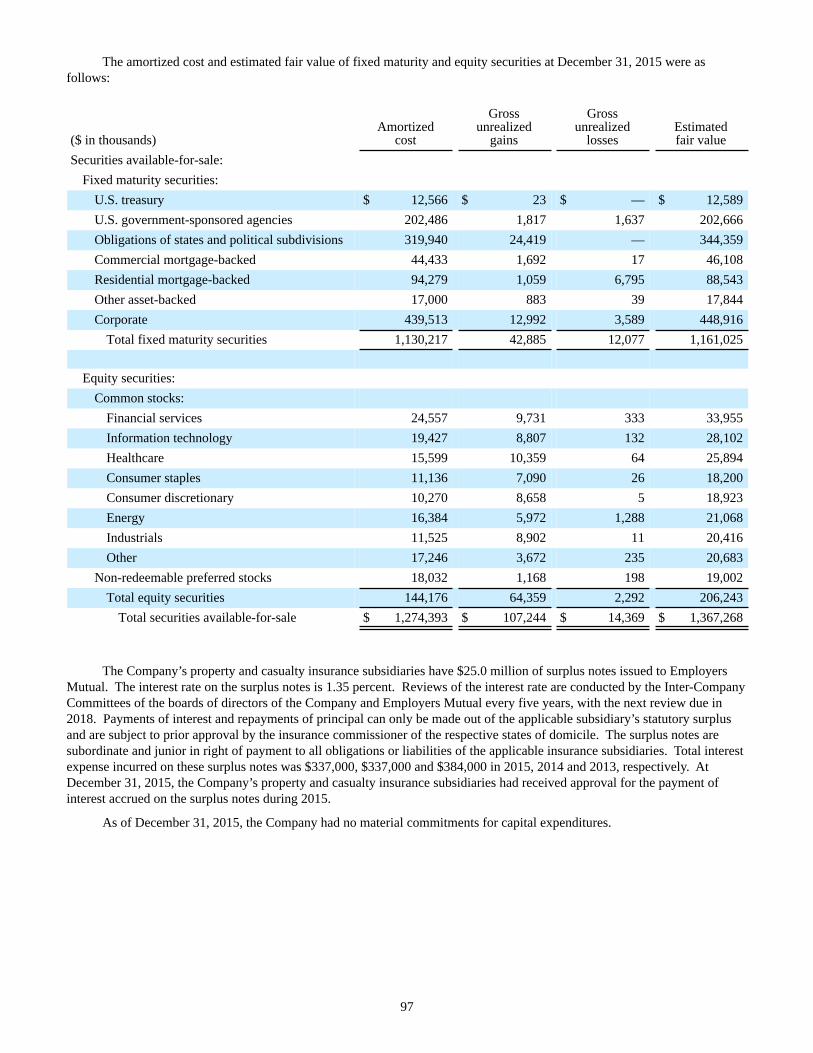
97
The amortized cost and estimated fair value of fixed maturity and equity securities at December 31, 2015 were as follows:
($ in thousands)Amortized
cost
Grossunrealized
gains
Grossunrealized
lossesEstimatedfair value
Securities available-for-sale:Fixed maturity securities:
U.S. treasury $ 12,566 $ 23 $ — $ 12,589U.S. government-sponsored agencies 202,486 1,817 1,637 202,666Obligations of states and political subdivisions 319,940 24,419 — 344,359Commercial mortgage-backed 44,433 1,692 17 46,108Residential mortgage-backed 94,279 1,059 6,795 88,543Other asset-backed 17,000 883 39 17,844Corporate 439,513 12,992 3,589 448,916
Total fixed maturity securities 1,130,217 42,885 12,077 1,161,025
Equity securities:Common stocks:
Financial services 24,557 9,731 333 33,955Information technology 19,427 8,807 132 28,102Healthcare 15,599 10,359 64 25,894Consumer staples 11,136 7,090 26 18,200Consumer discretionary 10,270 8,658 5 18,923Energy 16,384 5,972 1,288 21,068Industrials 11,525 8,902 11 20,416Other 17,246 3,672 235 20,683
Non-redeemable preferred stocks 18,032 1,168 198 19,002Total equity securities 144,176 64,359 2,292 206,243
Total securities available-for-sale $ 1,274,393 $ 107,244 $ 14,369 $ 1,367,268
The Company’s property and casualty insurance subsidiaries have $25.0 million of surplus notes issued to Employers Mutual. The interest rate on the surplus notes is 1.35 percent. Reviews of the interest rate are conducted by the Inter-Company Committees of the boards of directors of the Company and Employers Mutual every five years, with the next review due in 2018. Payments of interest and repayments of principal can only be made out of the applicable subsidiary’s statutory surplus and are subject to prior approval by the insurance commissioner of the respective states of domicile. The surplus notes are subordinate and junior in right of payment to all obligations or liabilities of the applicable insurance subsidiaries. Total interest expense incurred on these surplus notes was $337,000, $337,000 and $384,000 in 2015, 2014 and 2013, respectively. At December 31, 2015, the Company’s property and casualty insurance subsidiaries had received approval for the payment of interest accrued on the surplus notes during 2015.
As of December 31, 2015, the Company had no material commitments for capital expenditures.
98
Off-Balance Sheet Arrangements
Employers Mutual collects from agents, policyholders and ceding companies all written premiums associated with the insurance business produced by the pool participants and the assumed reinsurance business ceded to the reinsurance subsidiary. Employers Mutual also collects from external reinsurers all losses and settlement expenses recoverable under the reinsurance contracts protecting the pool participants and the fronting business ceded to the reinsurance subsidiary. Employers Mutual settles with the pool participants (monthly) and the reinsurance subsidiary (quarterly) the premiums written from these insurance policies and the paid losses and settlement expenses recoverable under the external reinsurance contracts, providing full credit for the premiums written and the paid losses and settlement expenses recoverable under the external reinsurance contracts generated during the period (not just the collected portion). Due to this arrangement, and since a significant portion of the premium balances are collected over the course of the underlying coverage periods, Employers Mutual carries a substantial receivable balance for insurance and reinsurance premiums in process of collection and, to a lesser extent, paid losses and settlement expenses recoverable from the external reinsurance companies. Any of these receivable amounts that are ultimately deemed to be uncollectible are charged-off by Employers Mutual and the expense is charged to the reinsurance subsidiary or allocated to the pool members on the basis of pool participation. As a result, the Company has off-balance sheet arrangements with an unconsolidated entity that results in credit-risk exposures (Employers Mutual’s insurance and reinsurance premium receivable balances, and paid loss and settlement expense recoverable amounts) that are not reflected in the Company’s financial statements. The average annual expense for such charge-offs allocated to the Company over the past ten years is $366,000. Based on this historical data, this credit-risk exposure is not considered to be material to the Company’s results of operations or financial position and, accordingly, no loss contingency liability has been recorded.
Investment Impairments and Considerations
The Company recorded $1.5 million of “other-than-temporary” investment impairment losses during 2015, compared to $878,000 during 2014. The impairment losses were recognized primarily on securities held in the Company's equity portfolio, though the impairment losses in 2014 also include an impairment on one fixed maturity security.
At December 31, 2015, the Company had unrealized losses on available-for-sale securities as presented in the following table. The estimated fair value is based on quoted market prices, where available. In cases where quoted market prices are not available, fair values are based on a variety of valuation techniques depending on the type of security. None of these securities are considered to be in concentrations by either security type or industry. The Company uses several factors to determine whether the carrying value of an individual security has been “other-than-temporarily” impaired. Such factors include, but are not limited to, the security’s value and performance in the context of the overall markets, length of time and extent the security’s fair value has been below carrying value, key corporate events and, for fixed maturity securities, the amount of collateral available. Based on these factors, the absence of management’s intent to sell these securities prior to recovery or maturity, and the fact that management does not anticipate that it will be forced to sell these securities prior to recovery or maturity, it was determined that the carrying value of these securities were not “other-than-temporarily” impaired at December 31, 2015. Risks and uncertainties inherent in the methodology utilized in this evaluation process include interest rate risk, equity price risk, and the overall performance of the economy, all of which have the potential to adversely affect the value of the Company’s investments. Should a determination be made at some point in the future that these unrealized losses are “other-than-temporary”, the Company’s earnings would be reduced by approximately $9.3 million, net of tax; however, the Company’s financial position would not be affected because unrealized losses on available-for-sale securities are reflected in the Company’s financial statements as a component of stockholders’ equity, net of deferred taxes.
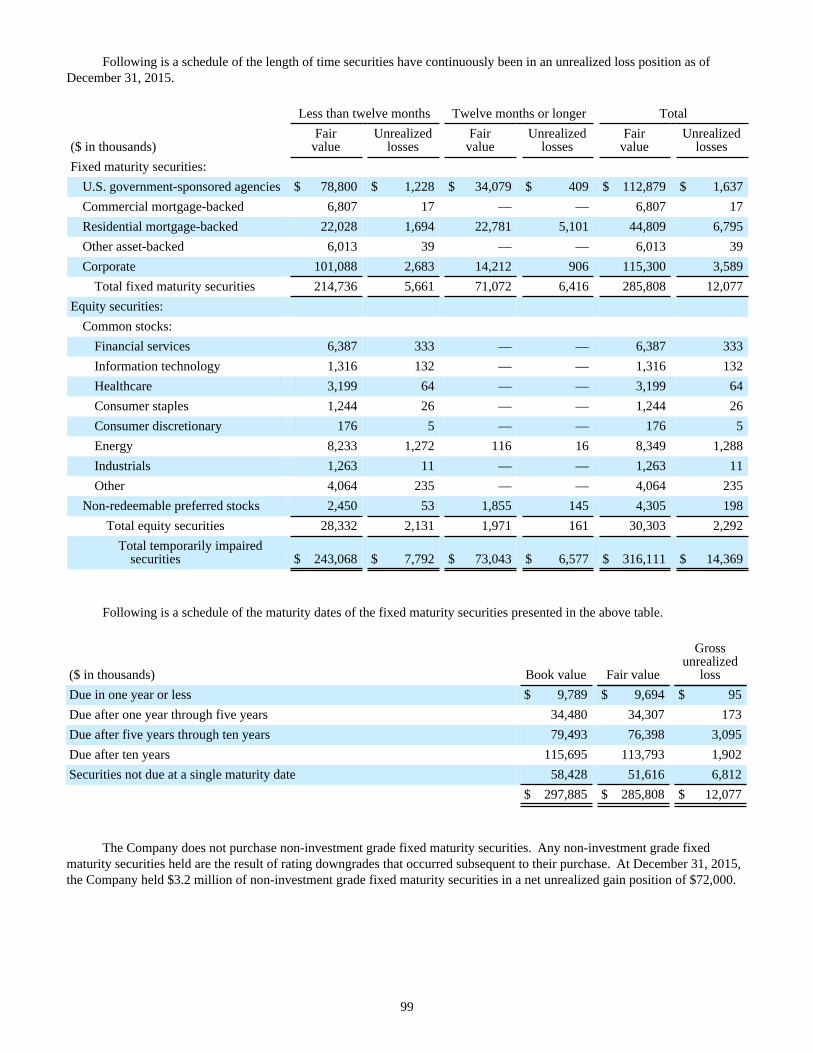
99
Following is a schedule of the length of time securities have continuously been in an unrealized loss position as of December 31, 2015.
Less than twelve months Twelve months or longer Total
($ in thousands)Fair
valueUnrealized
lossesFair
valueUnrealized
lossesFair
valueUnrealized
lossesFixed maturity securities:
U.S. government-sponsored agencies $ 78,800 $ 1,228 $ 34,079 $ 409 $ 112,879 $ 1,637Commercial mortgage-backed 6,807 17 — — 6,807 17Residential mortgage-backed 22,028 1,694 22,781 5,101 44,809 6,795Other asset-backed 6,013 39 — — 6,013 39Corporate 101,088 2,683 14,212 906 115,300 3,589
Total fixed maturity securities 214,736 5,661 71,072 6,416 285,808 12,077Equity securities:
Common stocks:Financial services 6,387 333 — — 6,387 333Information technology 1,316 132 — — 1,316 132Healthcare 3,199 64 — — 3,199 64Consumer staples 1,244 26 — — 1,244 26Consumer discretionary 176 5 — — 176 5Energy 8,233 1,272 116 16 8,349 1,288Industrials 1,263 11 — — 1,263 11Other 4,064 235 — — 4,064 235
Non-redeemable preferred stocks 2,450 53 1,855 145 4,305 198Total equity securities 28,332 2,131 1,971 161 30,303 2,292
Total temporarily impairedsecurities $ 243,068 $ 7,792 $ 73,043 $ 6,577 $ 316,111 $ 14,369
Following is a schedule of the maturity dates of the fixed maturity securities presented in the above table.
($ in thousands) Book value Fair value
Grossunrealized
lossDue in one year or less $ 9,789 $ 9,694 $ 95Due after one year through five years 34,480 34,307 173Due after five years through ten years 79,493 76,398 3,095Due after ten years 115,695 113,793 1,902Securities not due at a single maturity date 58,428 51,616 6,812
$ 297,885 $ 285,808 $ 12,077
The Company does not purchase non-investment grade fixed maturity securities. Any non-investment grade fixed maturity securities held are the result of rating downgrades that occurred subsequent to their purchase. At December 31, 2015, the Company held $3.2 million of non-investment grade fixed maturity securities in a net unrealized gain position of $72,000.
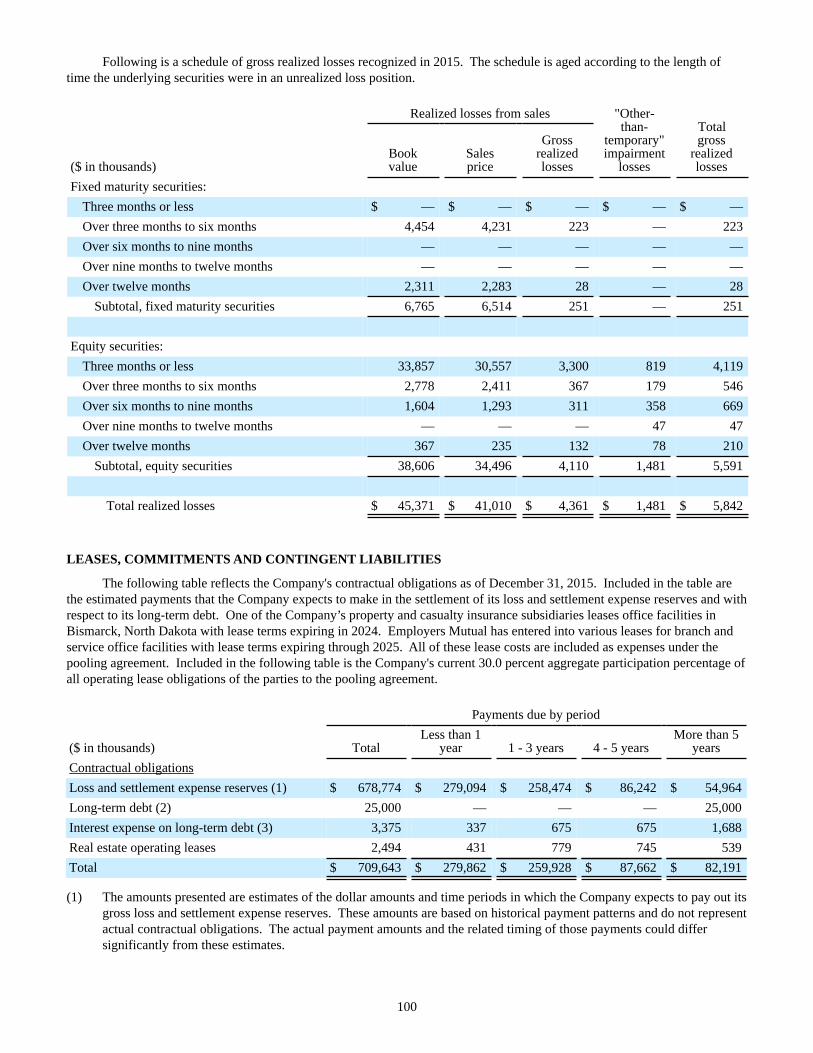
100
Following is a schedule of gross realized losses recognized in 2015. The schedule is aged according to the length of time the underlying securities were in an unrealized loss position.
Realized losses from sales "Other-than-
temporary"impairment
losses
Totalgross
realizedlosses($ in thousands)
Bookvalue
Salesprice
Grossrealizedlosses
Fixed maturity securities:Three months or less $ — $ — $ — $ — $ —Over three months to six months 4,454 4,231 223 — 223Over six months to nine months — — — — —Over nine months to twelve months — — — — —Over twelve months 2,311 2,283 28 — 28
Subtotal, fixed maturity securities 6,765 6,514 251 — 251
Equity securities:Three months or less 33,857 30,557 3,300 819 4,119Over three months to six months 2,778 2,411 367 179 546Over six months to nine months 1,604 1,293 311 358 669Over nine months to twelve months — — — 47 47Over twelve months 367 235 132 78 210
Subtotal, equity securities 38,606 34,496 4,110 1,481 5,591
Total realized losses $ 45,371 $ 41,010 $ 4,361 $ 1,481 $ 5,842
LEASES, COMMITMENTS AND CONTINGENT LIABILITIES
The following table reflects the Company's contractual obligations as of December 31, 2015. Included in the table are the estimated payments that the Company expects to make in the settlement of its loss and settlement expense reserves and with respect to its long-term debt. One of the Company’s property and casualty insurance subsidiaries leases office facilities in Bismarck, North Dakota with lease terms expiring in 2024. Employers Mutual has entered into various leases for branch and service office facilities with lease terms expiring through 2025. All of these lease costs are included as expenses under the pooling agreement. Included in the following table is the Company's current 30.0 percent aggregate participation percentage of all operating lease obligations of the parties to the pooling agreement.
Payments due by period
($ in thousands) TotalLess than 1
year 1 - 3 years 4 - 5 yearsMore than 5
yearsContractual obligationsLoss and settlement expense reserves (1) $ 678,774 $ 279,094 $ 258,474 $ 86,242 $ 54,964Long-term debt (2) 25,000 — — — 25,000Interest expense on long-term debt (3) 3,375 337 675 675 1,688Real estate operating leases 2,494 431 779 745 539Total $ 709,643 $ 279,862 $ 259,928 $ 87,662 $ 82,191
(1) The amounts presented are estimates of the dollar amounts and time periods in which the Company expects to pay out itsgross loss and settlement expense reserves. These amounts are based on historical payment patterns and do not representactual contractual obligations. The actual payment amounts and the related timing of those payments could differsignificantly from these estimates.
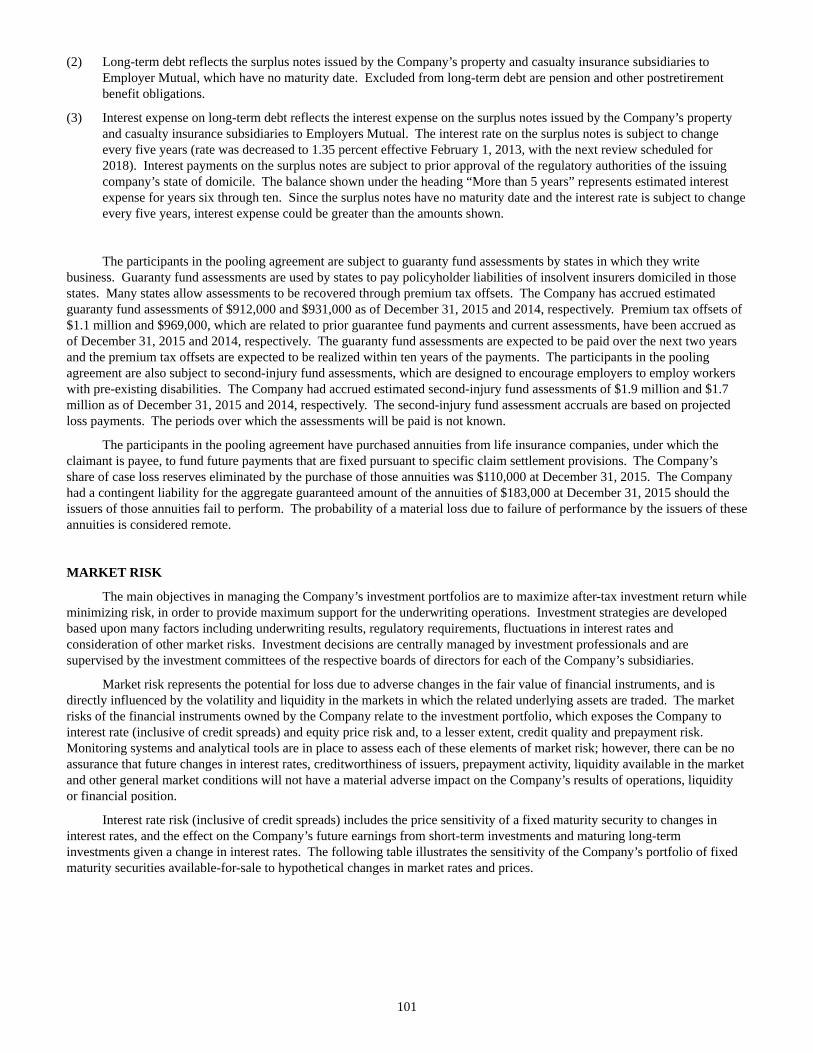
101
(2) Long-term debt reflects the surplus notes issued by the Company’s property and casualty insurance subsidiaries toEmployer Mutual, which have no maturity date. Excluded from long-term debt are pension and other postretirementbenefit obligations.
(3) Interest expense on long-term debt reflects the interest expense on the surplus notes issued by the Company’s propertyand casualty insurance subsidiaries to Employers Mutual. The interest rate on the surplus notes is subject to changeevery five years (rate was decreased to 1.35 percent effective February 1, 2013, with the next review scheduled for2018). Interest payments on the surplus notes are subject to prior approval of the regulatory authorities of the issuingcompany’s state of domicile. The balance shown under the heading “More than 5 years” represents estimated interestexpense for years six through ten. Since the surplus notes have no maturity date and the interest rate is subject to changeevery five years, interest expense could be greater than the amounts shown.
The participants in the pooling agreement are subject to guaranty fund assessments by states in which they write business. Guaranty fund assessments are used by states to pay policyholder liabilities of insolvent insurers domiciled in those states. Many states allow assessments to be recovered through premium tax offsets. The Company has accrued estimated guaranty fund assessments of $912,000 and $931,000 as of December 31, 2015 and 2014, respectively. Premium tax offsets of $1.1 million and $969,000, which are related to prior guarantee fund payments and current assessments, have been accrued as of December 31, 2015 and 2014, respectively. The guaranty fund assessments are expected to be paid over the next two years and the premium tax offsets are expected to be realized within ten years of the payments. The participants in the pooling agreement are also subject to second-injury fund assessments, which are designed to encourage employers to employ workers with pre-existing disabilities. The Company had accrued estimated second-injury fund assessments of $1.9 million and $1.7 million as of December 31, 2015 and 2014, respectively. The second-injury fund assessment accruals are based on projected loss payments. The periods over which the assessments will be paid is not known.
The participants in the pooling agreement have purchased annuities from life insurance companies, under which the claimant is payee, to fund future payments that are fixed pursuant to specific claim settlement provisions. The Company’s share of case loss reserves eliminated by the purchase of those annuities was $110,000 at December 31, 2015. The Company had a contingent liability for the aggregate guaranteed amount of the annuities of $183,000 at December 31, 2015 should the issuers of those annuities fail to perform. The probability of a material loss due to failure of performance by the issuers of these annuities is considered remote.
MARKET RISK
The main objectives in managing the Company’s investment portfolios are to maximize after-tax investment return while minimizing risk, in order to provide maximum support for the underwriting operations. Investment strategies are developed based upon many factors including underwriting results, regulatory requirements, fluctuations in interest rates and consideration of other market risks. Investment decisions are centrally managed by investment professionals and are supervised by the investment committees of the respective boards of directors for each of the Company’s subsidiaries.
Market risk represents the potential for loss due to adverse changes in the fair value of financial instruments, and is directly influenced by the volatility and liquidity in the markets in which the related underlying assets are traded. The market risks of the financial instruments owned by the Company relate to the investment portfolio, which exposes the Company to interest rate (inclusive of credit spreads) and equity price risk and, to a lesser extent, credit quality and prepayment risk. Monitoring systems and analytical tools are in place to assess each of these elements of market risk; however, there can be no assurance that future changes in interest rates, creditworthiness of issuers, prepayment activity, liquidity available in the market and other general market conditions will not have a material adverse impact on the Company’s results of operations, liquidity or financial position.
Interest rate risk (inclusive of credit spreads) includes the price sensitivity of a fixed maturity security to changes in interest rates, and the effect on the Company’s future earnings from short-term investments and maturing long-term investments given a change in interest rates. The following table illustrates the sensitivity of the Company’s portfolio of fixed maturity securities available-for-sale to hypothetical changes in market rates and prices.
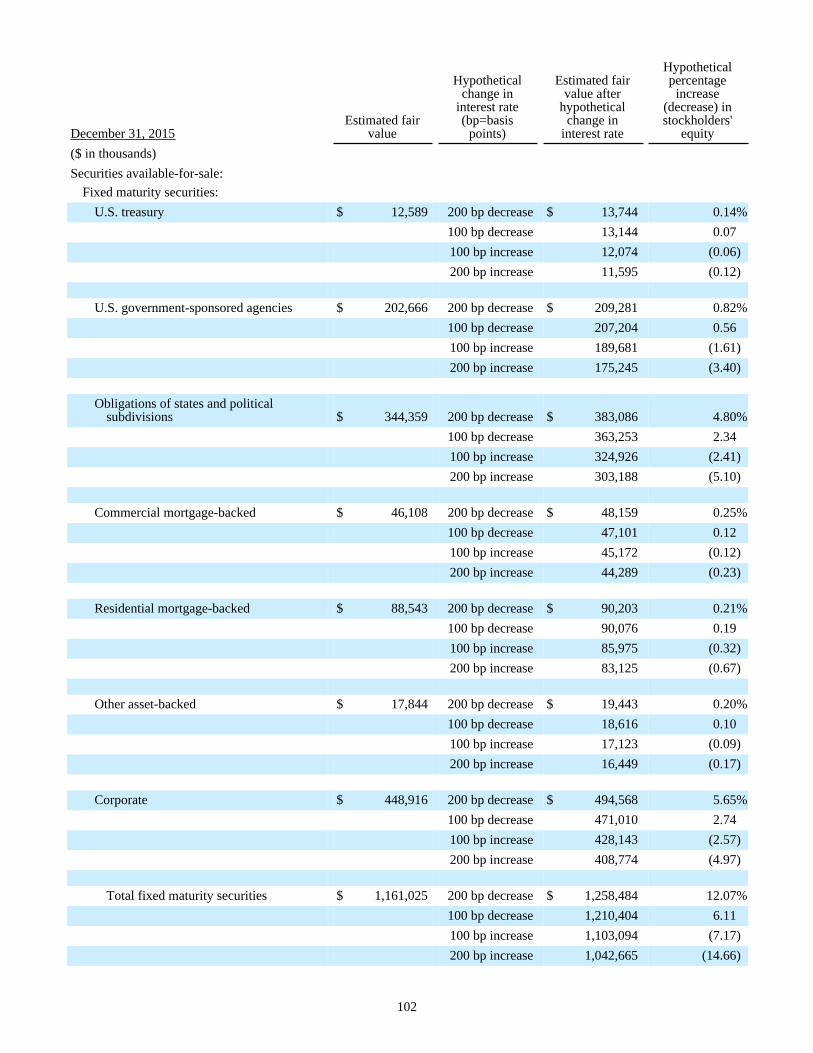
102
December 31, 2015Estimated fair
value
Hypotheticalchange in
interest rate(bp=basis
points)
Estimated fairvalue after
hypotheticalchange in
interest rate
Hypotheticalpercentage
increase(decrease) instockholders'
equity($ in thousands)Securities available-for-sale:
Fixed maturity securities:U.S. treasury $ 12,589 200 bp decrease $ 13,744 0.14%
100 bp decrease 13,144 0.07100 bp increase 12,074 (0.06)200 bp increase 11,595 (0.12)
U.S. government-sponsored agencies $ 202,666 200 bp decrease $ 209,281 0.82%100 bp decrease 207,204 0.56100 bp increase 189,681 (1.61)200 bp increase 175,245 (3.40)
Obligations of states and politicalsubdivisions $ 344,359 200 bp decrease $ 383,086 4.80%
100 bp decrease 363,253 2.34100 bp increase 324,926 (2.41)200 bp increase 303,188 (5.10)
Commercial mortgage-backed $ 46,108 200 bp decrease $ 48,159 0.25%100 bp decrease 47,101 0.12100 bp increase 45,172 (0.12)200 bp increase 44,289 (0.23)
Residential mortgage-backed $ 88,543 200 bp decrease $ 90,203 0.21%100 bp decrease 90,076 0.19100 bp increase 85,975 (0.32)200 bp increase 83,125 (0.67)
Other asset-backed $ 17,844 200 bp decrease $ 19,443 0.20%100 bp decrease 18,616 0.10100 bp increase 17,123 (0.09)200 bp increase 16,449 (0.17)
Corporate $ 448,916 200 bp decrease $ 494,568 5.65%100 bp decrease 471,010 2.74100 bp increase 428,143 (2.57)200 bp increase 408,774 (4.97)
Total fixed maturity securities $ 1,161,025 200 bp decrease $ 1,258,484 12.07%100 bp decrease 1,210,404 6.11100 bp increase 1,103,094 (7.17)200 bp increase 1,042,665 (14.66)
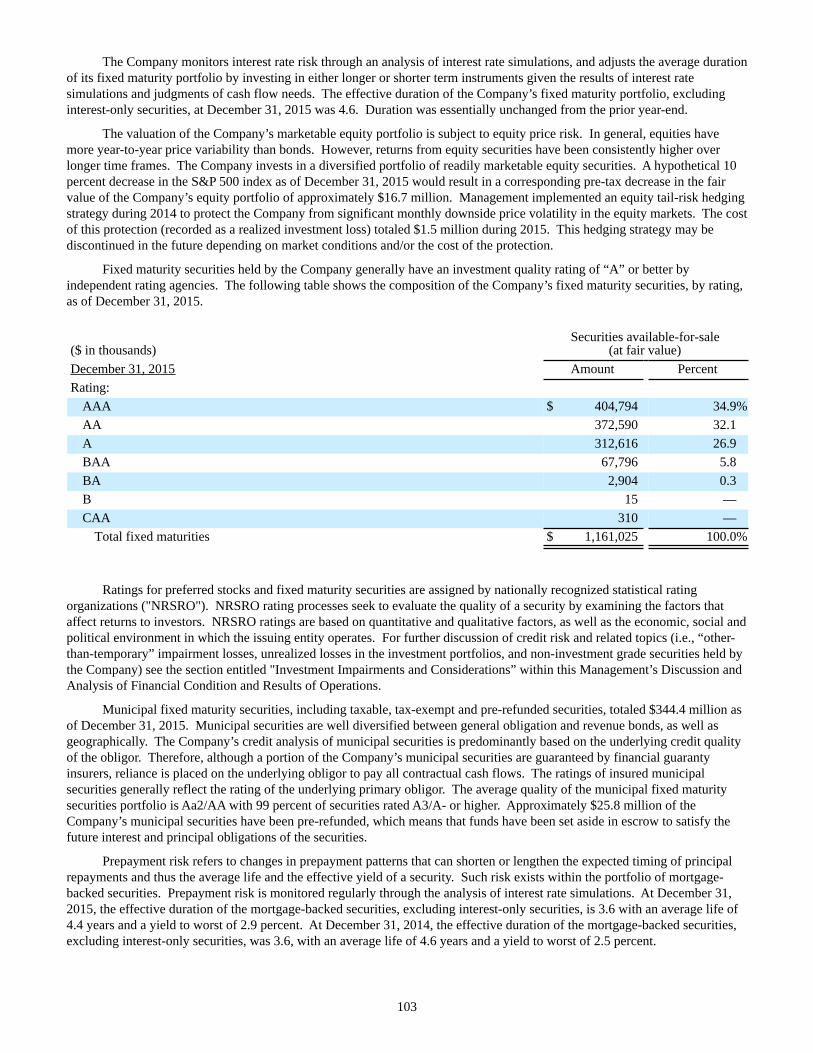
103
The Company monitors interest rate risk through an analysis of interest rate simulations, and adjusts the average duration of its fixed maturity portfolio by investing in either longer or shorter term instruments given the results of interest rate simulations and judgments of cash flow needs. The effective duration of the Company’s fixed maturity portfolio, excluding interest-only securities, at December 31, 2015 was 4.6. Duration was essentially unchanged from the prior year-end.
The valuation of the Company’s marketable equity portfolio is subject to equity price risk. In general, equities have more year-to-year price variability than bonds. However, returns from equity securities have been consistently higher over longer time frames. The Company invests in a diversified portfolio of readily marketable equity securities. A hypothetical 10 percent decrease in the S&P 500 index as of December 31, 2015 would result in a corresponding pre-tax decrease in the fair value of the Company’s equity portfolio of approximately $16.7 million. Management implemented an equity tail-risk hedging strategy during 2014 to protect the Company from significant monthly downside price volatility in the equity markets. The cost of this protection (recorded as a realized investment loss) totaled $1.5 million during 2015. This hedging strategy may be discontinued in the future depending on market conditions and/or the cost of the protection.
Fixed maturity securities held by the Company generally have an investment quality rating of “A” or better by independent rating agencies. The following table shows the composition of the Company’s fixed maturity securities, by rating, as of December 31, 2015.
($ in thousands)Securities available-for-sale
(at fair value)December 31, 2015 Amount PercentRating:
AAA $ 404,794 34.9%AA 372,590 32.1A 312,616 26.9BAA 67,796 5.8BA 2,904 0.3B 15 —CAA 310 —
Total fixed maturities $ 1,161,025 100.0%
Ratings for preferred stocks and fixed maturity securities are assigned by nationally recognized statistical rating organizations ("NRSRO"). NRSRO rating processes seek to evaluate the quality of a security by examining the factors that affect returns to investors. NRSRO ratings are based on quantitative and qualitative factors, as well as the economic, social and political environment in which the issuing entity operates. For further discussion of credit risk and related topics (i.e., “other-than-temporary” impairment losses, unrealized losses in the investment portfolios, and non-investment grade securities held by the Company) see the section entitled "Investment Impairments and Considerations” within this Management’s Discussion and Analysis of Financial Condition and Results of Operations.
Municipal fixed maturity securities, including taxable, tax-exempt and pre-refunded securities, totaled $344.4 million as of December 31, 2015. Municipal securities are well diversified between general obligation and revenue bonds, as well as geographically. The Company’s credit analysis of municipal securities is predominantly based on the underlying credit quality of the obligor. Therefore, although a portion of the Company’s municipal securities are guaranteed by financial guaranty insurers, reliance is placed on the underlying obligor to pay all contractual cash flows. The ratings of insured municipal securities generally reflect the rating of the underlying primary obligor. The average quality of the municipal fixed maturity securities portfolio is Aa2/AA with 99 percent of securities rated A3/A- or higher. Approximately $25.8 million of the Company’s municipal securities have been pre-refunded, which means that funds have been set aside in escrow to satisfy the future interest and principal obligations of the securities.
Prepayment risk refers to changes in prepayment patterns that can shorten or lengthen the expected timing of principal repayments and thus the average life and the effective yield of a security. Such risk exists within the portfolio of mortgage-backed securities. Prepayment risk is monitored regularly through the analysis of interest rate simulations. At December 31, 2015, the effective duration of the mortgage-backed securities, excluding interest-only securities, is 3.6 with an average life of 4.4 years and a yield to worst of 2.9 percent. At December 31, 2014, the effective duration of the mortgage-backed securities, excluding interest-only securities, was 3.6, with an average life of 4.6 years and a yield to worst of 2.5 percent.
104
IMPACT OF INFLATION
Inflation has a widespread effect on the Company’s results of operations, primarily through increased losses and settlement expenses. The Company considers inflation, including social inflation that reflects an increasingly litigious society and increasing jury awards, when setting loss and settlement expense reserve amounts. Premiums are also affected by inflation, although they are often restricted or delayed by competition and the regulatory rate-setting environment.
NEW ACCOUNTING PRONOUNCEMENTS
See note 1 of Notes to Consolidated Financial Statements under Part II, Item 8 of this Form 10-K for a description of new accounting pronouncements not yet adopted by the Company.
ITEM 7A. QUANTITATIVE AND QUALITATIVE DISCLOSURES ABOUT MARKET RISK
The information under the caption “Market Risk” in “Management’s Discussion and Analysis of Financial Condition and Results of Operations”, which is included in Part II, Item 7 of this Form 10-K, is incorporated herein by reference.
105
ITEM 8. FINANCIAL STATEMENTS AND SUPPLEMENTARY DATA
Management’s Report on Internal Control Over Financial Reporting
Management of EMC Insurance Group Inc. and Subsidiaries is responsible for the preparation, integrity and objectivity of the accompanying Consolidated Financial Statements, as well as all other financial information in this report. The Consolidated Financial Statements and the accompanying notes have been prepared in accordance with U.S. generally accepted accounting principles and include amounts that are based on management’s estimates and judgments where necessary.
Management is responsible for establishing and maintaining adequate internal control over financial reporting, including safeguarding of assets and reliability of financial records. The Company’s internal control over financial reporting, designed by or under the supervision of management, includes those policies and procedures that (1) pertain to the maintenance of records that, in reasonable detail, accurately and fairly reflect the transactions and dispositions of the assets of the Company; (2) provide reasonable assurance that transactions are recorded as necessary to permit preparation of financial statements in accordance with U.S. generally accepted accounting principles, and that receipts and expenditures of the Company are being made only in accordance with authorizations of management and directors of the Company; and (3) provide reasonable assurance regarding prevention or timely detection of unauthorized acquisition, use, or disposition of the Company’s assets that could have a material effect on the financial statements. This control structure is further reinforced by a program of internal audits, including audits of the Company’s decentralized branch locations, which requires responsive management action.
There are inherent limitations in the effectiveness of any internal control, including the possibility of human error and the circumvention or overriding of controls. Accordingly, adequate internal controls can provide only reasonable assurance with respect to financial statement preparation. Further, because of changes in conditions, the effectiveness of internal control may vary over time.
Management assessed the effectiveness of the Company’s internal control over financial reporting based on criteria established in Internal Control – Integrated Framework issued by the Committee of Sponsoring Organizations of the Treadway Commission (2013 Framework) (the COSO criteria). Based on this assessment, management believes that, as of December 31, 2015, the Company maintained effective internal control over financial reporting.
The Audit Committee of the Board of Directors is comprised of three directors who are independent of the Company’s management. The Audit Committee is responsible for the selection of the independent registered public accounting firm. It meets periodically with management, the independent registered public accounting firm, and the internal auditors to ensure that they are carrying out their responsibilities. In addition to reviewing the Company’s financial reports, the Audit Committee is also responsible for performing an oversight role by reviewing and monitoring the financial, accounting and auditing procedures of the Company. The independent registered public accounting firm and the internal auditors have full and free access to the Audit Committee, with or without the presence of management, to discuss the adequacy of internal control over financial reporting and any other matters which they believe should be brought to the attention of the Audit Committee.
The Company’s financial statements and internal control over financial reporting have been audited by Ernst & Young LLP, an independent registered public accounting firm. Management has made available to Ernst & Young LLP all of the Company’s financial records and related data, as well as the minutes of the stockholders’ and directors’ meetings. Furthermore, management believes that all representations made to Ernst & Young LLP during its audit were valid and appropriate. Their reports with respect to the fairness of presentation of the Company’s financial statements and the effectiveness of the Company’s internal control over financial reporting appear elsewhere in this annual report.
/s/ Bruce G. Kelley /s/ Mark E. ReeseBruce G. Kelley Mark E. ReesePresident, Chief Executive Officer and Treasurer Senior Vice President and Chief Financial Officer(Principal Executive Officer) (Principal Financial and Accounting Officer)
106
Report of Independent Registered Public Accounting Firmon Internal Control Over Financial Reporting
The Board of Directors and StockholdersEMC Insurance Group Inc.
We have audited EMC Insurance Group Inc. and Subsidiaries’ internal control over financial reporting as of December 31, 2015, based on criteria established in Internal Control - Integrated Framework issued by the Committee of Sponsoring Organizations of the Treadway Commission (2013 framework) (the COSO criteria). EMC Insurance Group Inc. and Subsidiaries’ management is responsible for maintaining effective internal control over financial reporting, and for its assessment of the effectiveness of internal control over financial reporting included in the accompanying Management’s Report on Internal Control Over Financial Reporting. Our responsibility is to express an opinion on the Company’s internal control over financial reporting based on our audit.
We conducted our audit in accordance with the standards of the Public Company Accounting Oversight Board (United States). Those standards require that we plan and perform the audit to obtain reasonable assurance about whether effective internal control over financial reporting was maintained in all material respects. Our audit included obtaining an understanding of internal control over financial reporting, assessing the risk that a material weakness exists, testing and evaluating the design and operating effectiveness of internal control based on the assessed risk, and performing such other procedures as we considered necessary in the circumstances. We believe that our audit provides a reasonable basis for our opinion.
A company’s internal control over financial reporting is a process designed to provide reasonable assurance regarding the reliability of financial reporting and the preparation of financial statements for external purposes in accordance with generally accepted accounting principles. A company’s internal control over financial reporting includes those policies and procedures that (1) pertain to the maintenance of records that, in reasonable detail, accurately and fairly reflect the transactions and dispositions of the assets of the company; (2) provide reasonable assurance that transactions are recorded as necessary to permit preparation of financial statements in accordance with generally accepted accounting principles, and that receipts and expenditures of the company are being made only in accordance with authorizations of management and directors of the company; and (3) provide reasonable assurance regarding prevention or timely detection of unauthorized acquisition, use, or disposition of the company’s assets that could have a material effect on the financial statements.
Because of its inherent limitations, internal control over financial reporting may not prevent or detect misstatements. Also, projections of any evaluation of effectiveness to future periods are subject to the risk that controls may become inadequate because of changes in conditions, or that the degree of compliance with the policies or procedures may deteriorate.
In our opinion, EMC Insurance Group Inc. and Subsidiaries maintained, in all material respects, effective internal control over financial reporting as of December 31, 2015, based on the COSO criteria.
We also have audited, in accordance with the standards of the Public Company Accounting Oversight Board (United States), the consolidated balance sheets of EMC Insurance Group Inc. and Subsidiaries as of December 31, 2015 and 2014, and the related consolidated statements of income, comprehensive income, stockholders’ equity and cash flows for each of the three years in the period ended December 31, 2015 of EMC Insurance Group Inc. and Subsidiaries and our report dated March 8, 2016 expressed an unqualified opinion thereon.
/s/ Ernst & Young LLPDes Moines, IowaMarch 8, 2016
107
Report of Independent Registered Public Accounting Firm
The Board of Directors and StockholdersEMC Insurance Group Inc.
We have audited the accompanying consolidated balance sheets of EMC Insurance Group Inc. and Subsidiaries (the Company) as of December 31, 2015 and 2014, and the related consolidated statements of income, comprehensive income, stockholders’ equity and cash flows for each of the three years in the period ended December 31, 2015. These financial statements are the responsibility of the Company’s management. Our responsibility is to express an opinion on these financial statements based on our audits.
We conducted our audits in accordance with the standards of the Public Company Accounting Oversight Board (United States). Those standards require that we plan and perform the audit to obtain reasonable assurance about whether the financial statements are free of material misstatement. An audit includes examining, on a test basis, evidence supporting the amounts and disclosures in the financial statements. An audit also includes assessing the accounting principles used and significant estimates made by management, as well as evaluating the overall financial statement presentation. We believe that our audits provide a reasonable basis for our opinion.
In our opinion, the financial statements referred to above present fairly, in all material respects, the consolidated financial position of EMC Insurance Group Inc. and Subsidiaries at December 31, 2015 and 2014, and the consolidated results of their operations and their cash flows for each of the three years in the period ended December 31, 2015, in conformity with U.S. generally accepted accounting principles.
We also have audited, in accordance with standards of the Public Company Accounting Oversight Board (United States), EMC Insurance Group Inc. and Subsidiaries’ internal control over financial reporting as of December 31, 2015, based on criteria established in Internal Control - Integrated Framework issued by the Committee of Sponsoring Organizations of the Treadway Commission (2013 framework) and our report dated March 8, 2016 expressed an unqualified opinion thereon.
/s/ Ernst & Young LLPDes Moines, IowaMarch 8, 2016

108
EMC INSURANCE GROUP INC. AND SUBSIDIARIESCONSOLIDATED BALANCE SHEETS
December 31,($ in thousands, except share and per share amounts) 2015 2014ASSETSInvestments:
Fixed maturity securities available-for-sale, at fair value (amortized cost $1,130,217and $1,080,006) $ 1,161,025 $ 1,127,499
Equity securities available-for-sale, at fair value (cost $144,176 and $123,972) 206,243 197,036Other long-term investments 9,930 6,227Short-term investments 38,599 53,262
Total investments 1,415,797 1,384,024
Cash 224 383Reinsurance receivables due from affiliate 24,236 28,603Prepaid reinsurance premiums due from affiliate 6,563 8,865Deferred policy acquisition costs (affiliated $40,535 and $38,930) 40,720 39,343Prepaid pension and postretirement benefits due from affiliate 12,133 17,360Accrued investment income 10,789 10,295Amounts receivable under reverse repurchase agreements 16,850 —Accounts receivable 804 1,767Income taxes recoverable 1,735 —Goodwill 942 942Other assets (affiliated $4,595 and $4,900) 5,162 6,238
Total assets $ 1,535,955 $ 1,497,820
All affiliated balances presented above are the result of related party transactions with Employers Mutual.
See accompanying Notes to Consolidated Financial Statements.
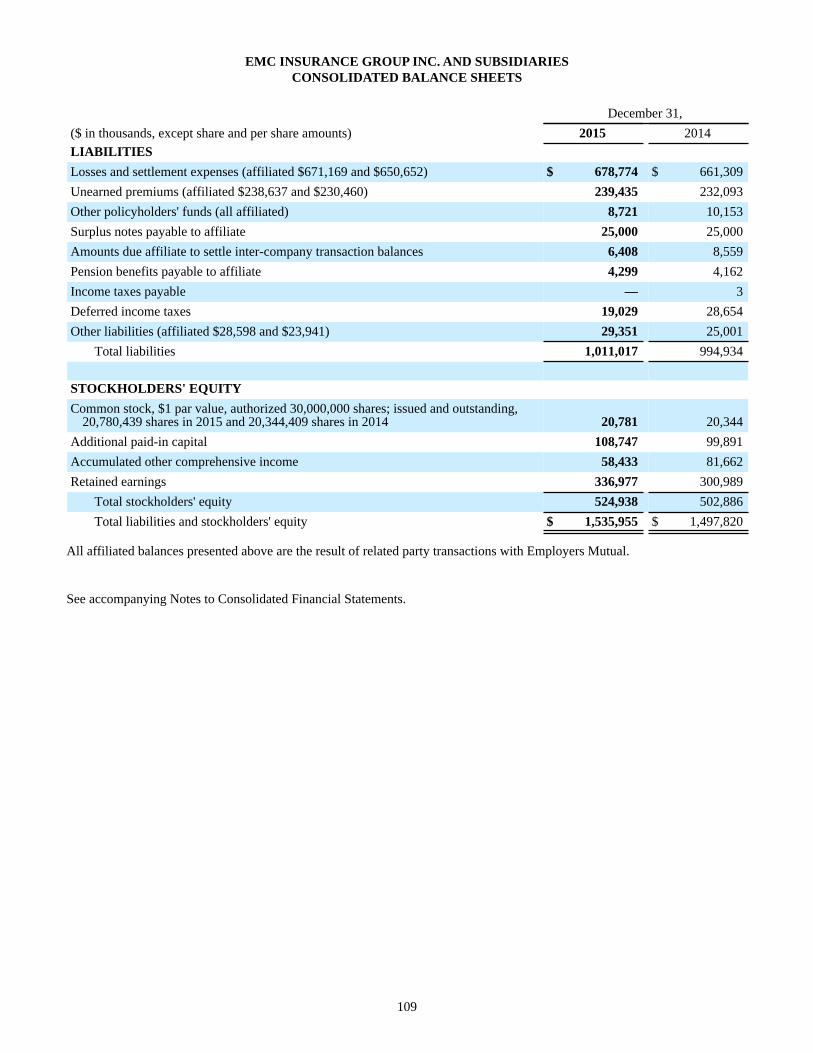
109
EMC INSURANCE GROUP INC. AND SUBSIDIARIESCONSOLIDATED BALANCE SHEETS
December 31,($ in thousands, except share and per share amounts) 2015 2014LIABILITIESLosses and settlement expenses (affiliated $671,169 and $650,652) $ 678,774 $ 661,309Unearned premiums (affiliated $238,637 and $230,460) 239,435 232,093Other policyholders' funds (all affiliated) 8,721 10,153Surplus notes payable to affiliate 25,000 25,000Amounts due affiliate to settle inter-company transaction balances 6,408 8,559Pension benefits payable to affiliate 4,299 4,162Income taxes payable — 3Deferred income taxes 19,029 28,654Other liabilities (affiliated $28,598 and $23,941) 29,351 25,001
Total liabilities 1,011,017 994,934
STOCKHOLDERS' EQUITYCommon stock, $1 par value, authorized 30,000,000 shares; issued and outstanding,
20,780,439 shares in 2015 and 20,344,409 shares in 2014 20,781 20,344Additional paid-in capital 108,747 99,891Accumulated other comprehensive income 58,433 81,662Retained earnings 336,977 300,989
Total stockholders' equity 524,938 502,886Total liabilities and stockholders' equity $ 1,535,955 $ 1,497,820
All affiliated balances presented above are the result of related party transactions with Employers Mutual.
See accompanying Notes to Consolidated Financial Statements.
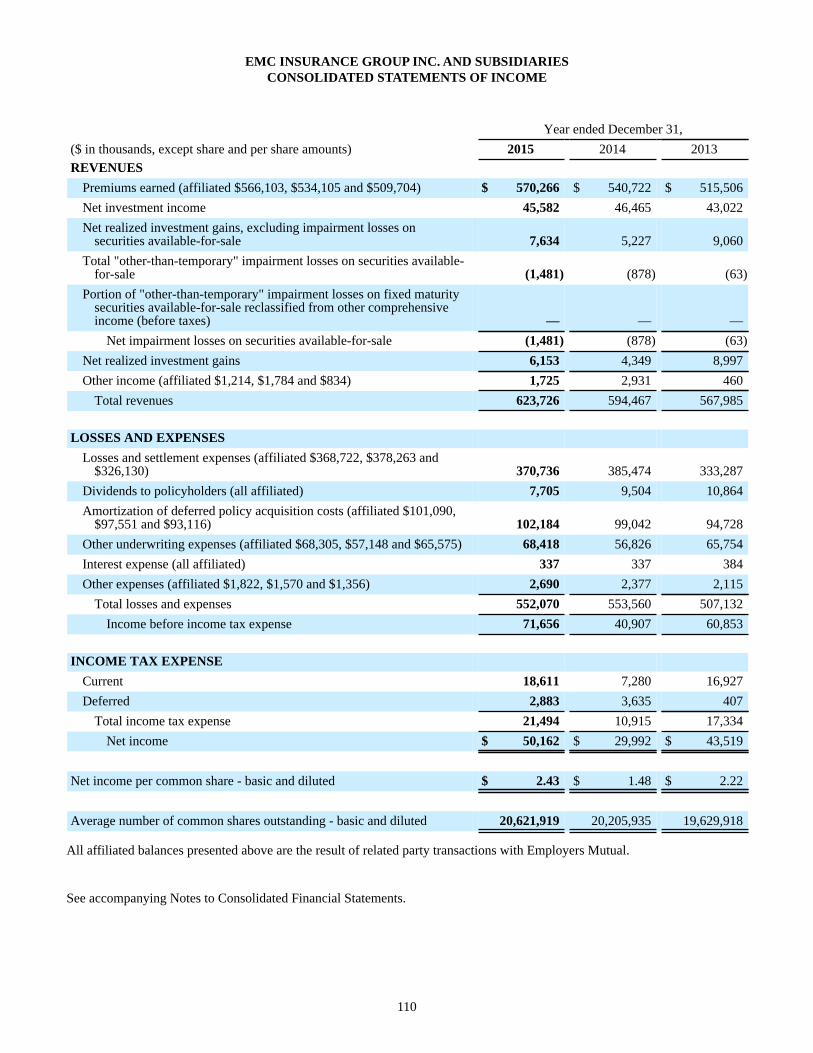
110
EMC INSURANCE GROUP INC. AND SUBSIDIARIESCONSOLIDATED STATEMENTS OF INCOME
Year ended December 31,($ in thousands, except share and per share amounts) 2015 2014 2013REVENUES
Premiums earned (affiliated $566,103, $534,105 and $509,704) $ 570,266 $ 540,722 $ 515,506Net investment income 45,582 46,465 43,022Net realized investment gains, excluding impairment losses on
securities available-for-sale 7,634 5,227 9,060Total "other-than-temporary" impairment losses on securities available-
for-sale (1,481) (878) (63)Portion of "other-than-temporary" impairment losses on fixed maturity
securities available-for-sale reclassified from other comprehensiveincome (before taxes) — — —
Net impairment losses on securities available-for-sale (1,481) (878) (63)Net realized investment gains 6,153 4,349 8,997Other income (affiliated $1,214, $1,784 and $834) 1,725 2,931 460
Total revenues 623,726 594,467 567,985
LOSSES AND EXPENSESLosses and settlement expenses (affiliated $368,722, $378,263 and
$326,130) 370,736 385,474 333,287Dividends to policyholders (all affiliated) 7,705 9,504 10,864Amortization of deferred policy acquisition costs (affiliated $101,090,
$97,551 and $93,116) 102,184 99,042 94,728Other underwriting expenses (affiliated $68,305, $57,148 and $65,575) 68,418 56,826 65,754Interest expense (all affiliated) 337 337 384Other expenses (affiliated $1,822, $1,570 and $1,356) 2,690 2,377 2,115
Total losses and expenses 552,070 553,560 507,132Income before income tax expense 71,656 40,907 60,853
INCOME TAX EXPENSECurrent 18,611 7,280 16,927Deferred 2,883 3,635 407
Total income tax expense 21,494 10,915 17,334Net income $ 50,162 $ 29,992 $ 43,519
Net income per common share - basic and diluted $ 2.43 $ 1.48 $ 2.22
Average number of common shares outstanding - basic and diluted 20,621,919 20,205,935 19,629,918
All affiliated balances presented above are the result of related party transactions with Employers Mutual.
See accompanying Notes to Consolidated Financial Statements.
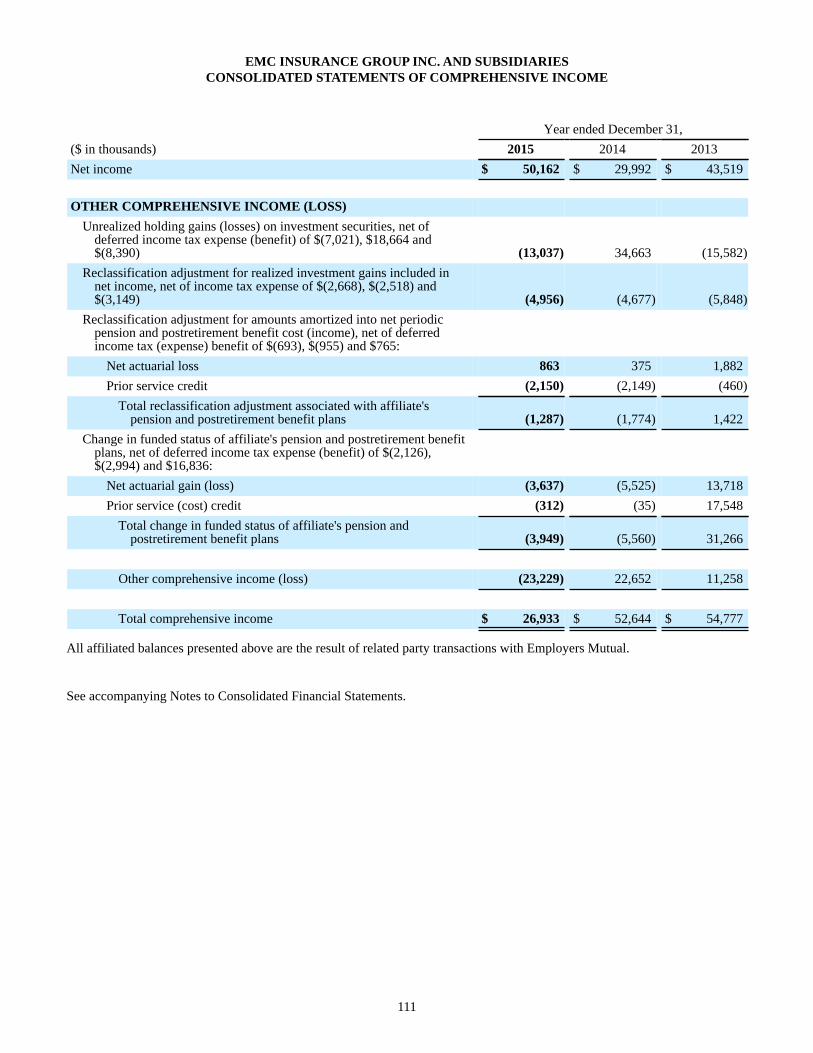
111
EMC INSURANCE GROUP INC. AND SUBSIDIARIESCONSOLIDATED STATEMENTS OF COMPREHENSIVE INCOME
Year ended December 31,($ in thousands) 2015 2014 2013Net income $ 50,162 $ 29,992 $ 43,519
OTHER COMPREHENSIVE INCOME (LOSS)Unrealized holding gains (losses) on investment securities, net of
deferred income tax expense (benefit) of $(7,021), $18,664 and$(8,390) (13,037) 34,663 (15,582)
Reclassification adjustment for realized investment gains included innet income, net of income tax expense of $(2,668), $(2,518) and$(3,149) (4,956) (4,677) (5,848)
Reclassification adjustment for amounts amortized into net periodicpension and postretirement benefit cost (income), net of deferredincome tax (expense) benefit of $(693), $(955) and $765:
Net actuarial loss 863 375 1,882Prior service credit (2,150) (2,149) (460)
Total reclassification adjustment associated with affiliate'spension and postretirement benefit plans (1,287) (1,774) 1,422
Change in funded status of affiliate's pension and postretirement benefitplans, net of deferred income tax expense (benefit) of $(2,126),$(2,994) and $16,836:
Net actuarial gain (loss) (3,637) (5,525) 13,718Prior service (cost) credit (312) (35) 17,548
Total change in funded status of affiliate's pension andpostretirement benefit plans (3,949) (5,560) 31,266
Other comprehensive income (loss) (23,229) 22,652 11,258
Total comprehensive income $ 26,933 $ 52,644 $ 54,777
All affiliated balances presented above are the result of related party transactions with Employers Mutual.
See accompanying Notes to Consolidated Financial Statements.
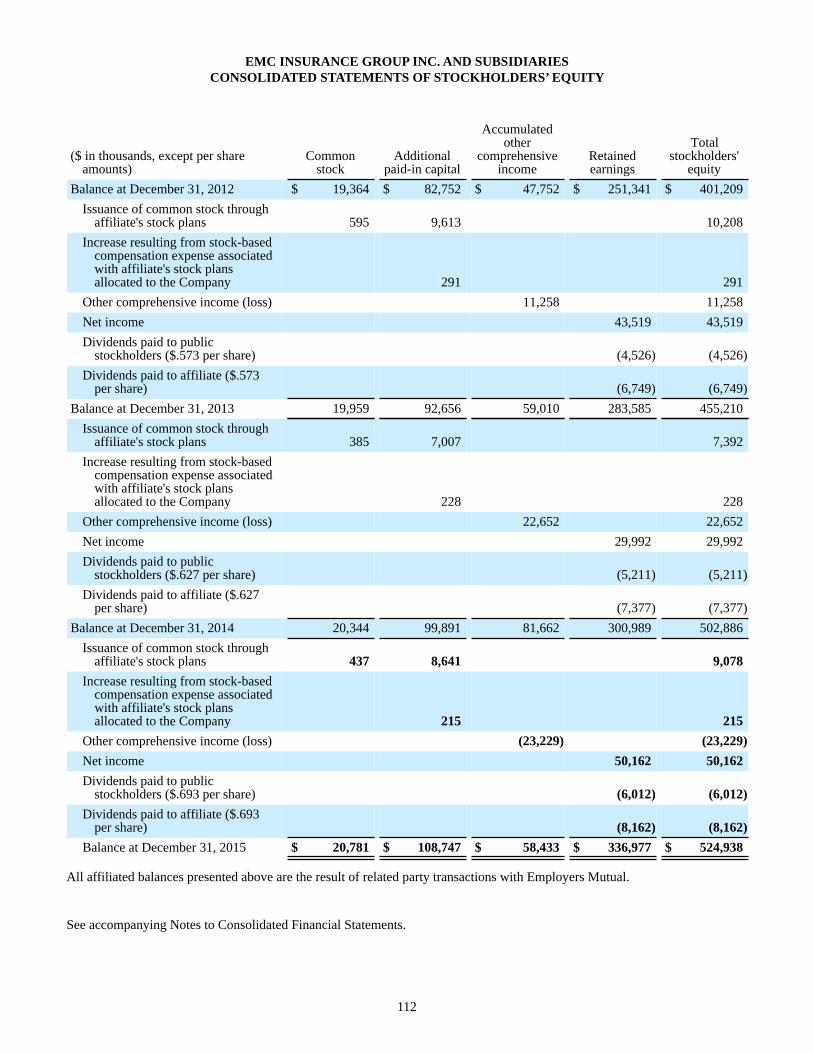
112
EMC INSURANCE GROUP INC. AND SUBSIDIARIESCONSOLIDATED STATEMENTS OF STOCKHOLDERS’ EQUITY
($ in thousands, except per shareamounts)
Commonstock
Additionalpaid-in capital
Accumulatedother
comprehensiveincome
Retainedearnings
Totalstockholders'
equityBalance at December 31, 2012 $ 19,364 $ 82,752 $ 47,752 $ 251,341 $ 401,209
Issuance of common stock throughaffiliate's stock plans 595 9,613 10,208
Increase resulting from stock-basedcompensation expense associatedwith affiliate's stock plansallocated to the Company 291 291
Other comprehensive income (loss) 11,258 11,258Net income 43,519 43,519Dividends paid to public
stockholders ($.573 per share) (4,526) (4,526)Dividends paid to affiliate ($.573
per share) (6,749) (6,749)Balance at December 31, 2013 19,959 92,656 59,010 283,585 455,210
Issuance of common stock throughaffiliate's stock plans 385 7,007 7,392
Increase resulting from stock-basedcompensation expense associatedwith affiliate's stock plansallocated to the Company 228 228
Other comprehensive income (loss) 22,652 22,652Net income 29,992 29,992Dividends paid to public
stockholders ($.627 per share) (5,211) (5,211)Dividends paid to affiliate ($.627
per share) (7,377) (7,377)Balance at December 31, 2014 20,344 99,891 81,662 300,989 502,886
Issuance of common stock throughaffiliate's stock plans 437 8,641 9,078
Increase resulting from stock-basedcompensation expense associatedwith affiliate's stock plansallocated to the Company 215 215
Other comprehensive income (loss) (23,229) (23,229)Net income 50,162 50,162Dividends paid to public
stockholders ($.693 per share) (6,012) (6,012)Dividends paid to affiliate ($.693
per share) (8,162) (8,162)Balance at December 31, 2015 $ 20,781 $ 108,747 $ 58,433 $ 336,977 $ 524,938
All affiliated balances presented above are the result of related party transactions with Employers Mutual.
See accompanying Notes to Consolidated Financial Statements.
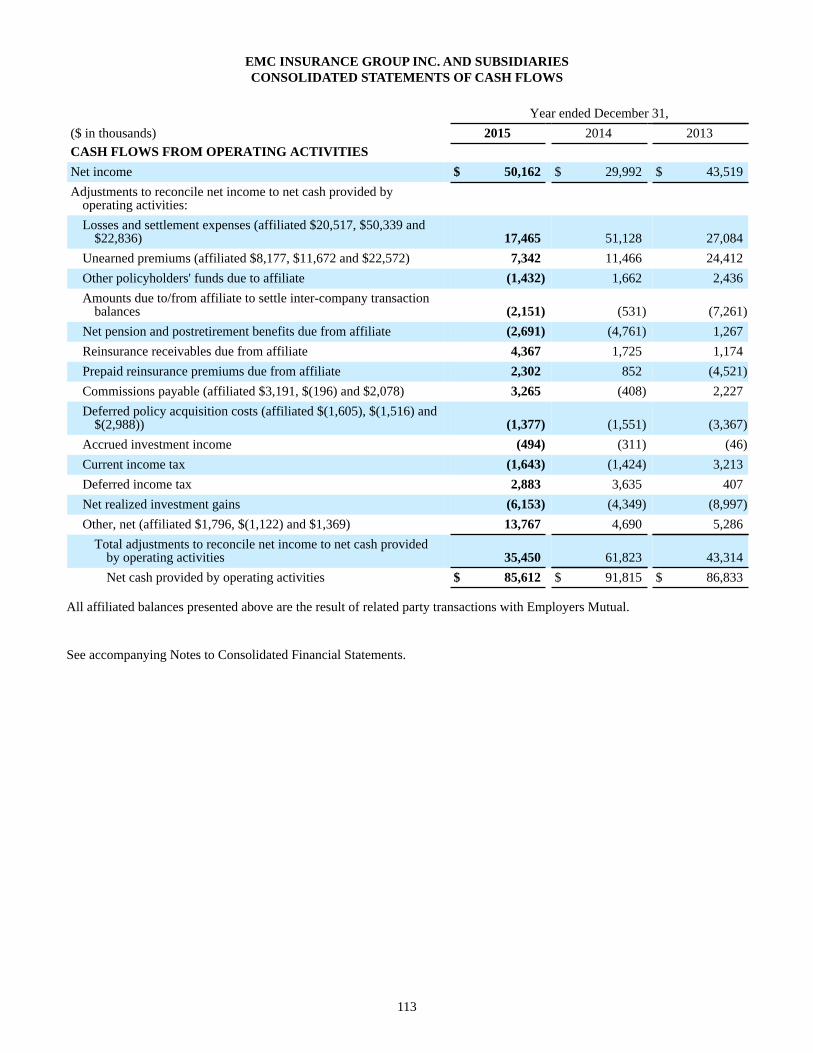
113
EMC INSURANCE GROUP INC. AND SUBSIDIARIESCONSOLIDATED STATEMENTS OF CASH FLOWS
Year ended December 31,($ in thousands) 2015 2014 2013CASH FLOWS FROM OPERATING ACTIVITIESNet income $ 50,162 $ 29,992 $ 43,519Adjustments to reconcile net income to net cash provided by
operating activities:Losses and settlement expenses (affiliated $20,517, $50,339 and
$22,836) 17,465 51,128 27,084Unearned premiums (affiliated $8,177, $11,672 and $22,572) 7,342 11,466 24,412Other policyholders' funds due to affiliate (1,432) 1,662 2,436Amounts due to/from affiliate to settle inter-company transaction
balances (2,151) (531) (7,261)Net pension and postretirement benefits due from affiliate (2,691) (4,761) 1,267Reinsurance receivables due from affiliate 4,367 1,725 1,174Prepaid reinsurance premiums due from affiliate 2,302 852 (4,521)Commissions payable (affiliated $3,191, $(196) and $2,078) 3,265 (408) 2,227Deferred policy acquisition costs (affiliated $(1,605), $(1,516) and
$(2,988)) (1,377) (1,551) (3,367)Accrued investment income (494) (311) (46)Current income tax (1,643) (1,424) 3,213Deferred income tax 2,883 3,635 407Net realized investment gains (6,153) (4,349) (8,997)Other, net (affiliated $1,796, $(1,122) and $1,369) 13,767 4,690 5,286
Total adjustments to reconcile net income to net cash providedby operating activities 35,450 61,823 43,314Net cash provided by operating activities $ 85,612 $ 91,815 $ 86,833
All affiliated balances presented above are the result of related party transactions with Employers Mutual.
See accompanying Notes to Consolidated Financial Statements.
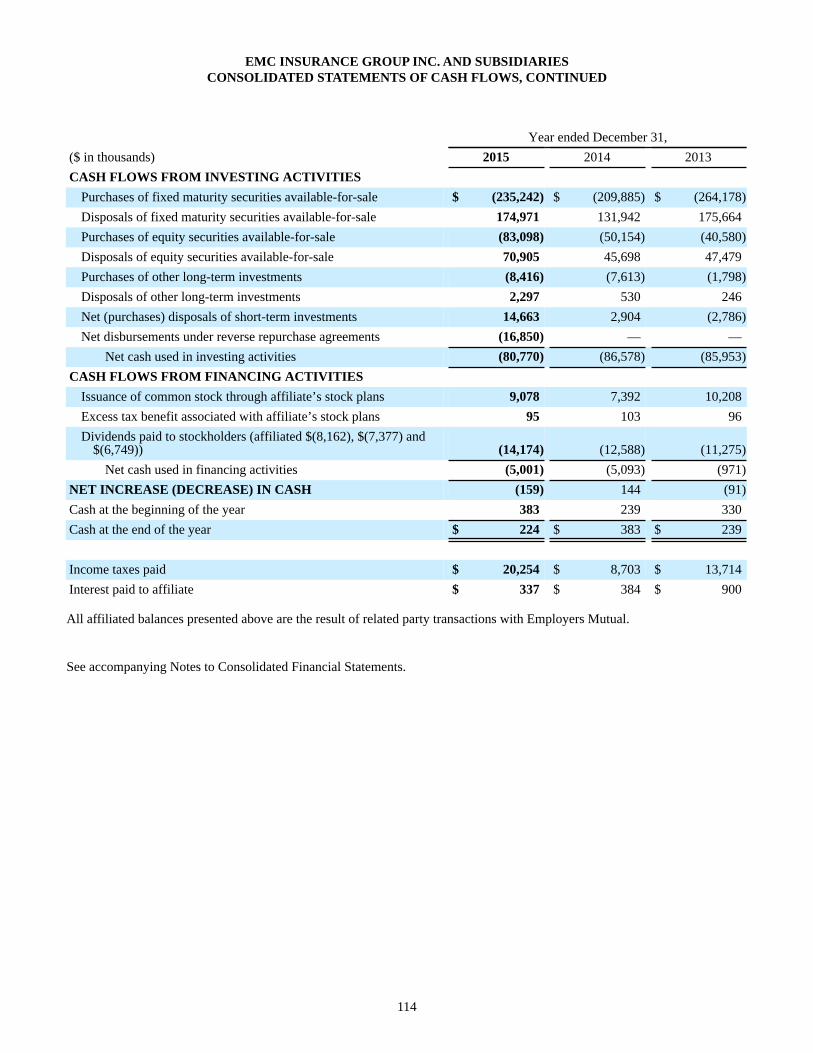
114
EMC INSURANCE GROUP INC. AND SUBSIDIARIESCONSOLIDATED STATEMENTS OF CASH FLOWS, CONTINUED
Year ended December 31,($ in thousands) 2015 2014 2013CASH FLOWS FROM INVESTING ACTIVITIES
Purchases of fixed maturity securities available-for-sale $ (235,242) $ (209,885) $ (264,178)Disposals of fixed maturity securities available-for-sale 174,971 131,942 175,664Purchases of equity securities available-for-sale (83,098) (50,154) (40,580)Disposals of equity securities available-for-sale 70,905 45,698 47,479Purchases of other long-term investments (8,416) (7,613) (1,798)Disposals of other long-term investments 2,297 530 246Net (purchases) disposals of short-term investments 14,663 2,904 (2,786)Net disbursements under reverse repurchase agreements (16,850) — —
Net cash used in investing activities (80,770) (86,578) (85,953)CASH FLOWS FROM FINANCING ACTIVITIES
Issuance of common stock through affiliate’s stock plans 9,078 7,392 10,208Excess tax benefit associated with affiliate’s stock plans 95 103 96Dividends paid to stockholders (affiliated $(8,162), $(7,377) and
$(6,749)) (14,174) (12,588) (11,275)Net cash used in financing activities (5,001) (5,093) (971)
NET INCREASE (DECREASE) IN CASH (159) 144 (91)Cash at the beginning of the year 383 239 330Cash at the end of the year $ 224 $ 383 $ 239
Income taxes paid $ 20,254 $ 8,703 $ 13,714Interest paid to affiliate $ 337 $ 384 $ 900
All affiliated balances presented above are the result of related party transactions with Employers Mutual.
See accompanying Notes to Consolidated Financial Statements.
115
EMC INSURANCE GROUP INC. AND SUBSIDIARIESNOTES TO CONSOLIDATED FINANCIAL STATEMENTS
1. SUMMARY OF SIGNIFICANT ACCOUNTING POLICIES
Description of Business
EMC Insurance Group Inc., a majority owned subsidiary of Employers Mutual Casualty Company (Employers Mutual), is an insurance holding company with operations in property and casualty insurance and reinsurance. The Company conducts its property and casualty insurance operations through the following subsidiaries: EMCASCO Insurance Company, Illinois EMCASCO Insurance Company and Dakota Fire Insurance Company, and its reinsurance operations through its subsidiary, EMC Reinsurance Company. The Company also has an excess and surplus lines insurance agency subsidiary, EMC Underwriters, LLC. The term “Company” is used interchangeably to describe EMC Insurance Group Inc. (Parent Company only) and EMC Insurance Group Inc. and its subsidiaries.
The Company writes property and casualty insurance in both commercial and personal lines of insurance, with a focus on medium-sized commercial accounts. Approximately 37 percent of the premiums written are in Iowa and contiguous states. The Company’s reinsurance business is primarily written through a quota share reinsurance agreement with Employers Mutual. A small portion of the assumed reinsurance business is written on a direct basis, outside the quota share reinsurance agreement.
Principles of Consolidation and Basis of Presentation
The consolidated financial statements have been prepared on the basis of U.S. generally accepted accounting principles (GAAP), which differ in some respects from those followed in reports to insurance regulatory authorities. All significant inter-company balances and transactions have been eliminated.
The preparation of financial statements in conformity with GAAP requires management to make estimates and assumptions that affect the reported amounts of assets and liabilities and the disclosure of contingent assets and liabilities at the date of the financial statements, as well as the reported amounts of revenues and expenses during the reporting periods. Actual results could differ from those estimates. The Company has evaluated all subsequent events through the date the financial statements were issued.
Property and Casualty Insurance and Reinsurance Operations
Property and casualty insurance premiums are recognized as revenue ratably over the terms of the respective policies. Unearned premiums are calculated on the daily pro rata method. Both domestic and foreign assumed reinsurance premiums are recognized as revenues ratably over the terms of the related contracts and underlying policies. Amounts paid as ceded reinsurance premiums are reported as prepaid reinsurance premiums and are amortized over the remaining contract period in proportion to the amount of reinsurance protection provided. Reinsurance reinstatement premiums are recognized in the same period as the loss event that gave rise to the reinstatement premiums.
Costs related to the acquisition of insurance contracts are deferred and amortized to expense as the associated premium revenue is recognized. Only incremental costs or costs directly related to the successful acquisition of new or renewal insurance contracts are to be capitalized. Accordingly, acquisition costs consist of commissions, premium taxes, and salary and benefit expenses of employees directly involved in the underwriting of insurance policies that are successfully issued.
The method followed in computing deferred policy acquisition costs limits the amount of such deferred costs to the estimated realizable value. In determining estimated realizable value, the computation gives effect to the premium to be earned, related investment income, anticipated losses and settlement expenses, anticipated policyholder dividends, and certain other costs expected to be incurred to administer the insurance policies as the premium is earned. The anticipated losses and settlement expenses are not discounted and are based on the Company’s projected loss and settlement expense ratios for the next twelve months, which include catastrophe loads based on historical results adjusted for recent trends. The occurrence of a significant catastrophic event, and/or the accumulation of catastrophes losses would not have a direct impact on the determination of premium deficiencies; however, such occurrences would be included in the historical results that are used to establish the catastrophe loads. A premium deficiency is first recognized by expensing the amount of unamortized deferred policy acquisition costs necessary to eliminate the deficiency. If the premium deficiency is greater than the unamortized deferred policy acquisition costs, a liability is accrued for the excess deficiency. The Company did not record a premium deficiency for the years ended December 31, 2015, 2014 or 2013.
116
Certain commercial lines of business written by the property and casualty insurance subsidiaries, including workers’ compensation, are eligible for policyholder dividends in accordance with provisions of the underlying insurance policies. Net premiums written subject to policyholder dividends represented approximately 25 percent of the property and casualty insurance subsidiaries’ total net commercial line premiums written in 2015. Policyholder dividends are accrued over the terms of the underlying policy periods.
Liabilities for losses reflect losses incurred through the balance sheet date and are based upon case-basis estimates of reported losses supplemented with bulk case loss reserves, estimates of unreported losses based upon prior experience adjusted for current trends, and estimates of losses expected to be paid under assumed reinsurance contracts. Liabilities for settlement expenses are provided by estimating expenses expected to be incurred in settling the claims provided for in the loss reserves. Changes in reserves estimates are reflected in net income in the year such changes are recorded (see note 4).
Ceded reinsurance amounts with nonaffiliated reinsurers relating to reinsurance receivables for unpaid losses and settlement expenses and prepaid reinsurance premiums are reported on the balance sheet on a gross basis. Amounts ceded to Employers Mutual relating to the affiliated reinsurance pooling and excess of loss agreements (see note 2) have not been grossed up because the contracts provide that receivables and payables may be offset upon settlement.
Based on current information, the liabilities for losses and settlement expenses are considered to be adequate. Since the provisions are necessarily based on estimates, the ultimate liabilities may be more or less than such provisions.
Investments
Currently, all securities are classified as available-for-sale and are carried at fair value, with unrealized holding gains and losses reported as a component of accumulated other comprehensive income in stockholders’ equity, net of deferred income taxes. Other long-term investments consist of holdings in limited partnerships that are carried under the equity method of accounting, and holdings in limited partnerships and limited liability companies designed for the distribution of tax credits that are carried at amortized cost. The Company has an investment in a limited partnership that is designed to help protect the Company from a sudden and significant decline in the value of its equity portfolio. This limited partnership is carried under the equity method of accounting. Because of the nature of this investment, which is used solely to support the equity tail-risk hedging strategy, changes in the carrying value of the limited partnership are recorded as realized investment gains (losses), rather than as a component of investment income. Short-term investments generally include money market funds, U.S. Treasury bills and commercial paper that are carried at fair value, which approximates cost.
During 2015, the Company began participating in a reverse repurchase arrangement, involving the purchase of investment securities from third-party sellers with the agreement that the purchased securities be sold back to the third-party sellers for agreed-upon prices at specified future dates. The third-party sellers are required to pledge collateral with a value greater than the amount of cash received in the transactions. In accordance with GAAP, the investment securities purchased under the reverse repurchase agreements are not reflected in the Company's consolidated balance sheets, but instead a receivable is recorded for the principal amount lent. Net proceeds/disbursements related to the reverse repurchase transactions are reported as a component of investing activities in the consolidated statements of cash flows, and the income as a component of operating activities.
The Company uses independent pricing sources to obtain the estimated fair value of securities. The fair value is based on quoted market prices, where available. In cases where quoted market prices are not available, the fair value is based on a variety of valuation techniques depending on the type of investment. The fair values obtained from independent pricing sources are reviewed for reasonableness and any discrepancies are investigated for final valuation (see note 8).
Premiums and discounts on fixed maturity securities are amortized over the life of the security as an adjustment to yield using the effective interest method. Amortization of premiums and discounts on mortgage-backed securities incorporates prepayment assumptions to estimate expected lives. Gains and losses realized on the disposition of investments are included in net income. The cost of investments sold is determined on the specific identification method using the highest cost basis first. Included in investments at December 31, 2015 and 2014 are securities on deposit with various regulatory authorities as required by law amounting to $11.2 million and $11.7 million, respectively.
117
The Company regularly monitors its investment portfolio for securities whose fair value is less than the carrying value for indications of “other-than-temporary” impairment. Several factors are used to determine whether the carrying value of an individual security has been “other-than-temporarily” impaired. Such factors include, but are not limited to (1) the security’s value and performance in the context of the overall markets, (2) length of time and extent the security’s fair value has been below carrying value, (3) key corporate events, and (4) for equity securities, the ability and intent to hold the security until recovery to its cost basis. When an equity security is deemed to be “other-than-temporarily” impaired, the carrying value is reduced to fair value and a realized loss is recognized and charged to income. For fixed maturity securities, if the present value of cash flows expected to be collected is less than the amortized cost of the security, a credit loss is deemed to exist and the security is considered “other-than-temporarily” impaired. The portion of the impairment related to a credit loss is recognized through earnings and the portion of the impairment related to other factors, if any, is recognized through “other comprehensive income”. Alternatively, if the Company has the intent to sell a fixed maturity security that is in an unrealized loss position, or determines that it will "more likely than not" be required to sell a fixed maturity security that is in an unrealized loss position before recovery of its amortized cost basis, then the carrying value is reduced to fair value and the entire amount of the impairment is recognized through earnings.
During 2015, the Company early adopted the updated accounting guidance issued by the Financial Accounting Standards Board (FASB) in Accounting Standards Update (ASU) 2015-07 related to the Fair Value Measurement Topic 820 of the Accounting Standards Codification™ (Codification or ASC). This new accounting guidance allowed the Company to continue to avail itself of a practical expedient to measure the pooled separate account investments in Employers Mutual's qualified pension plan at the net asset value per share, but removed the requirement to categorize these investments within the fair value hierarchy.
Income Taxes
The Company files a consolidated Federal income tax return with its subsidiaries. Consolidated income taxes/benefits are allocated among the entities based upon separate tax liabilities.
Deferred income taxes are provided for temporary differences between the tax basis of assets and liabilities and the reported amounts of those assets and liabilities for financial reporting purposes. Deferred tax assets and liabilities are measured using enacted tax rates expected to apply to taxable income in the years in which those temporary differences are expected to be recovered or settled. Income tax expense provisions increase or decrease in the same period in which a change in tax rates is enacted. A valuation allowance is established to reduce deferred tax assets to their net realizable value if it is “more likely than not” that a tax benefit will not be realized.
An assessment of the Company’s current tax positions indicated no uncertainties that would warrant different recognition and valuation from that applied in the Company’s tax returns.
Stock-Based Compensation
The Company has no stock-based compensation plans of its own; however, Employers Mutual has several stock plans that utilize the common stock of the Company. The Company receives the current fair value for all shares issued under these plans. Employers Mutual also has a stock appreciation rights (SAR) agreement in effect with a former executive officer of the Company. The SAR agreement is based upon the market price of the Company’s common stock and is considered to be a liability-classified award because it will be settled in cash. A portion of the compensation expense recognized by Employers Mutual (as the requisite service period for granted options and restricted stock awards is rendered, or the fair value of the SAR agreement changes) is allocated to the Company’s property and casualty insurance subsidiaries though their participation in the pooling agreement (see note 2). Because a portion of Employers Mutual’s stock compensation expense is reflected in the Company’s financial statements and issuances of the Company’s stock under Employers Mutual’s stock plans have an impact on the Company’s capital accounts, the disclosures required by the Compensation – Stock Compensation Topic 718 of the FASB ASC are included in the Company’s consolidated financial statements.
118
Employee Retirement Plans
Employers Mutual has various employee benefit plans, including two defined benefit pension plans, and two postretirement benefit plans that provide retiree healthcare and life insurance benefits. Although the Company has no employees of its own, it is responsible for its share of the expenses and related prepaid assets and liabilities of these plans as determined under the terms of the pooling agreement, and the costs allocated by Employers Mutual to subsidiaries that do not participate in the pooling agreement (see note 2). Accordingly, the Company recognizes its share of the funded status of Employers Mutual’s pension and postretirement benefit plans on its balance sheet, with changes in the funded status of the plans recognized through “other comprehensive income.”
Accounts Receivable
The accounts receivable balance consists of assumed reinsurance premiums receivable (net of any commissions) on business written directly by the reinsurance subsidiary, and commission income receivable on excess and surplus lines business marketed by EMC Underwriters, LLC. These receivables are carried at their initial recognition amounts. It is the Company’s policy to reflect the impairment of receivables through a valuation allowance until ultimately collected or charged-off. No valuation allowance is currently carried, as no amounts are deemed impaired. No interest income, other fees, or deferred costs related to these receivables are assessed or recognized.
Off-Balance-Sheet Credit Exposure
Employers Mutual collects from agents, policyholders and ceding companies all written premiums associated with the insurance business produced by the pool participants and the assumed reinsurance business ceded to the reinsurance subsidiary. Employers Mutual also collects from external reinsurers all losses and settlement expenses recoverable under the reinsurance contracts protecting the pool participants and the fronting business ceded to the reinsurance subsidiary. Employers Mutual settles with the pool participants (monthly) and the reinsurance subsidiary (quarterly) the premiums written from these insurance policies and the paid losses and settlement expenses recoverable under the external reinsurance contracts, providing full credit for the premiums written and the paid losses and settlement expenses recoverable under the external reinsurance contracts generated during the period (not just the collected portion). Due to this arrangement, and since a significant portion of the premium balances are collected over the course of the underlying coverage periods, Employers Mutual carries a substantial receivable balance for insurance and reinsurance premiums in process of collection and, to a lesser extent, paid losses and settlement expenses recoverable from the external reinsurance companies. Any of these receivable amounts that are ultimately deemed to be uncollectible are charged-off by Employers Mutual and the expense is charged to the reinsurance subsidiary or allocated to the pool members on the basis of pool participation. As a result, the Company has off-balance sheet arrangements with an unconsolidated entity that results in credit-risk exposures (Employers Mutual’s insurance and reinsurance premium receivable balances, and paid loss and settlement expense recoverable amounts) that are not reflected in the Company’s financial statements. The average annual expense for such charge-offs allocated to the Company over the past ten years is $366,000. Based on this historical data, this credit-risk exposure is not considered to be material to the Company’s results of operations or financial position and, accordingly, no loss contingency liability has been recorded.
Foreign Currency Transactions
Included in the underlying reinsurance business assumed by the reinsurance subsidiary are reinsurance transactions conducted with foreign cedants denominated in their local functional currencies. In accordance with the terms of the quota share agreement (see note 2), the reinsurance subsidiary assumes all foreign currency exchange gains/losses associated with contracts incepting on January 1, 2006 and thereafter that are subject to the quota share agreement. The reinsurance subsidiary also has foreign currency exchange gains/losses associated with the business assumed outside the quota share agreement. The assets and liabilities resulting from these foreign reinsurance transactions are reported in U.S. dollars based on the foreign currency exchange rates that existed at the balance sheet dates. The foreign currency exchange rate gains/losses reported in the consolidated statements of income that resulted from these foreign reinsurance transactions are reported in U.S. dollars re-measured from the foreign currency exchange rates that existed at the inception of each reinsurance contract. The foreign currency exchange rate gains/losses resulting from these re-measurements to U.S. dollars are reported as a component of other income in the consolidated statements of income.
119
Net Income Per Share - Basic and Diluted
The Company’s basic and diluted net income per share is computed by dividing net income by the weighted average number of common shares outstanding during each period. As previously noted, the Company receives the current fair value for all shares issued under Employers Mutual’s stock plans. As a result, the Company had no potential common shares outstanding during 2015, 2014 or 2013 that would have been dilutive to the calculation of net income per share.
Goodwill
Goodwill represents the excess of cost over the fair value of net assets of acquired subsidiaries. Goodwill is not amortized, but is subject to impairment if the carrying value of the goodwill exceeds the estimated fair value of net assets. If the carrying amount of the subsidiary (including goodwill) exceeds the computed fair value, an impairment loss is recognized through the income statement equal to the excess amount, but not greater than the balance of the goodwill. Goodwill was not deemed to be impaired in 2015, 2014 or 2013.
Common Stock Split
On June 23, 2015, the Company completed a three for two stock split of its outstanding shares of common stock, effected in the form of a 50 percent stock dividend. The stock split entitled all shareholders of record at the close of business on June 16, 2015, to receive one additional share of common stock for every two shares of common stock held. In connection with the stock split, the Company's Restated Articles of Incorporation were amended to increase the number of shares of common stock the Company is authorized to issue to 30 million shares. All share and per share information has been retroactively adjusted to reflect the stock split, including the reclassification of the total par value of the additional shares issued to effect the stock split (par value was not changed for the stock split) from "Additional Paid-In Capital" to "Common Stock".
New Accounting Pronouncements
In May 2014, the FASB updated its guidance related to the Revenue from Contracts with Customers Topic 606 of the ASC. The objective of this update is to improve the reporting of revenue by providing a more robust framework for addressing revenue issues, and improved disclosure requirements. Current revenue recognition guidance in U.S. GAAP is comprised of broad revenue recognition concepts together with numerous revenue requirements for particular industries or transactions, which sometimes result in different accounting for economically similar transactions. This guidance is to be applied retrospectively to annual and interim reporting periods beginning after December 15, 2017, with early adoption permitted as of the original effective date (annual and interim reporting periods beginning after December 15, 2016). The Company will adopt this guidance during the first quarter of 2018. Since premium revenue from insurance contracts is excluded from the scope of this updated guidance, adoption is expected to have little or no impact on the consolidated financial condition or operating results of the Company. The Company's largest non-premium revenue items are service charges related to the billing of the pool participants' direct written premiums to policyholders, and commission income on excess and surplus lines business marketed by EMC Underwriters, LLC, both of which are included in "Other income" in the consolidated statements of income.
In February 2015, the FASB updated its guidance related to the Consolidation Topic 810 of the ASC. The objective of this update is to improve consolidation guidance through changes in the analysis that a reporting entity must perform to determine whether it should consolidate certain types of legal entities. The guidance modifies the evaluation of whether limited partnerships and similar legal entities are variable interest entities or voting interest entities, while also eliminating the presumption that a general partner should consolidate a limited partnership. This guidance is effective for interim and annual periods beginning after December 15, 2015, and is to be applied either retrospectively or through a modified retrospective approach by recording a cumulative-effect adjustment to equity as of the beginning of the fiscal year of adoption. Early adoption is permitted. The Company will adopt this guidance in the first quarter of 2016, but it is not expected to have an impact on the consolidated financial condition or operating results of the Company.
120
In May 2015, the FASB updated its guidance related to the Financial Services-Insurance Topic 944 of the ASC. The objective of this update is to add disclosures which provide transparency of significant estimates made in measuring the liability for losses and settlement expenses, thus providing more insight into an insurance entity's ability to underwrite and anticipate costs associated with claims. The new disclosures primarily include incurred and paid claims development tables prepared net of reinsurance (not to exceed ten years), and a reconciliation of the carrying amount of the liability for losses and settlement expenses. Also required (for each accident year of incurred claims development disclosed), is disclosure of incurred but not reported (IBNR) loss reserves, claim frequency information, and the average annual percentage payout of incurred claims by age. This guidance is to be applied retrospectively to annual reporting periods beginning after December 15, 2015, and certain disclosures to interim reporting periods beginning after December 15, 2016. The Company will adopt this guidance during the fourth quarter of 2016. Since the guidance only affects disclosure, adoption will have no impact on the consolidated financial condition or operating results of the Company.
In January 2016, the FASB updated its guidance related to the Financial Instruments-Overall Subtopic 825-10 of the ASC. The objective of this update is to enhance the reporting model for financial instruments to provide financial statement users with more decision-useful information. The major change in reporting from this update that will impact the Company is a requirement that equity investments (excluding those accounted for under the equity method of accounting or those that are consolidated) be measured at fair value with changes in fair value recognized in net income. While all of the Company's equity investments are already measured at fair value (with the exception of those that are consolidated and those that are accounted for under the equity method of accounting), the Company currently classifies all of its investments in equity securities as available-for-sale, and as such, the changes in fair value are currently recognized in other comprehensive income rather than net income. This guidance is to be applied to annual and interim reporting periods beginning after December 15, 2017, with recognition of a cumulative-effect adjustment to the balance sheet as of the beginning of the fiscal year of adoption. Early adoption is not permitted. The Company will adopt this guidance during the first quarter of 2018. Adoption is not expected to impact consolidated stockholders' equity, but is expected to introduce a material amount of volatility to the Company's consolidated net income.
In February 2016, the FASB issued updated guidance in Leases Topic 842 of the ASC, which supersedes the guidance in Leases Topic 840 of the ASC. The objective of this update is to increase transparency and comparability among organizations by requiring recognition of lease assets and lease liabilities on the balance sheet, and disclosure of key information about leasing arrangements. This guidance is effective for interim and annual periods beginning after December 15, 2018, and is to be applied using a modified retrospective approach. Early adoption is permitted. The Company will adopt this guidance during the first quarter of 2019. The Company is currently evaluating the impact this guidance will have on the Company's consolidated financial condition and operating results.
2. AFFILIATION AND TRANSACTIONS WITH AFFILIATES
The operations of the Company are highly integrated with those of Employers Mutual through participation in a propertyand casualty reinsurance pooling agreement (the "pooling agreement"), a reinsurance retrocessional quota share agreement (the "quota share agreement") and an excess of loss reinsurance agreement (the “excess of loss agreement”). All transactions occurring under the pooling agreement, quota share agreement and excess of loss agreement are based on statutory accounting principles. Certain adjustments are made to the statutory-basis amounts assumed by the property and casualty insurance subsidiaries and the reinsurance subsidiary to bring the amounts into compliance with GAAP.
Property and Casualty Insurance Subsidiaries
The Company’s three property and casualty insurance subsidiaries and two subsidiaries and an affiliate of Employers Mutual (Union Insurance Company of Providence, EMC Property & Casualty Company and Hamilton Mutual Insurance Company) are parties to a pooling agreement with Employers Mutual. Under the terms of the pooling agreement, each company cedes to Employers Mutual all of its insurance business, and assumes from Employers Mutual an amount equal to its participation in the pool. All premiums, losses, settlement expenses, and other underwriting and administrative expenses, excluding the voluntary reinsurance business assumed by Employers Mutual from nonaffiliated insurance companies, are prorated among the parties on the basis of participation in the pool. Employers Mutual negotiates reinsurance agreements that provide protection to the pool and each of its participants, including protection against losses arising from catastrophic events. The aggregate participation of the Company’s property and casualty insurance subsidiaries in the pool is 30 percent.
121
The Inter-Company Committees of the boards of directors of the Company and Employers Mutual approved a new inter-company reinsurance program between the Company's insurance subsidiaries in the property and casualty insurance segment and Employers Mutual for calendar year 2016. This reinsurance program is intended to reduce the volatility of the Company's quarterly results caused by excessive catastrophe and storm losses, and will provide protection from both the frequency and severity of such losses. The reinsurance program for 2016 will consist of two semi-annual aggregate catastrophe excess of loss treaties. The first treaty will be effective from January 1, 2016 through June 30, 2016, and will have a retention of $20.0 million and a limit of $24.0 million. The cost of this treaty will be approximately $6.3 million. The second treaty will be effective from July 1, 2016 through December 31, 2016, and will have a retention of $15.0 million and a limit of $12.0 million. The cost of this treaty will be approximately $1.5 million. All catastrophe and storm losses assumed by the property and casualty insurance subsidiaries (net of applicable reinsurance recoveries from external reinsurance protections purchased by the pool participants) will be subject to the terms of these treaties, and there is no co-participation provision.
Operations of the pool give rise to inter-company balances with Employers Mutual, which are generally settled during the subsequent month. The investment and income tax activities of the pool participants are not subject to the pooling agreement. The pooling agreement provides that Employers Mutual will make up any shortfall or difference resulting from an error in its systems and/or computation processes that would otherwise result in the required restatement of the pool participants’ financial statements.
The purpose of the pooling agreement is to spread the risk of an exposure insured by any of the pool participants among all the companies. The pooling agreement produces a more uniform and stable underwriting result from year to year for all companies in the pool than might be experienced individually. In addition, each company benefits from the capacity of the entire pool, rather than being limited to policy exposures of a size commensurate with its own surplus, and from the wide range of policy forms, lines of insurance written, rate filings and commission plans offered by each of the companies.
Reinsurance Subsidiary
The Company’s reinsurance subsidiary is party to a quota share agreement and an excess of loss agreement with Employers Mutual. Under the terms of the quota share agreement, the reinsurance subsidiary assumes 100 percent of Employers Mutual’s assumed reinsurance business, subject to certain exceptions. Under the terms of the excess of loss agreement (covering both business assumed from Employers Mutual through the quota share agreement, as well as business obtained outside the quota share agreement), the reinsurance subsidiary retains the first $4.0 million of losses per event, and also retains 20.0 percent of any losses between $4.0 million and $10.0 million and 10.0 percent of any losses between $10.0 million and $50.0 million. The cost of the excess of loss reinsurance protection, which includes reimbursement for the cost of reinsurance protection purchased by Employers Mutual to protect itself from the assumption of excessive losses in the event of a major catastrophe, is 8.0 percent (9.0 percent in 2013) of the reinsurance subsidiary’s total assumed reinsurance premiums written.
The Inter-Company Committees of the boards of directors of the Company and Employers Mutual approved a change in the inter-company reinsurance program between the Company's reinsurance subsidiary and Employers Mutual for calendar year 2016. The reinsurance program for 2016 will consist of two treaties. The first is a per occurrence catastrophe excess of loss treaty with a retention of $10.0 million, a limit of $10.0 million, 20 percent co-participation, and no reinstatement. The cost of this treaty will be approximately $2.0 million. The second is an annual aggregate catastrophe excess of loss treaty with a retention of $20.0 million, a limit of $100.0 million, and 20 percent co-participation. The cost of this treaty will be approximately $3.1 million. Any losses recovered under the per occurrence treaty will inure to the benefit of the aggregate treaty. Only catastrophic events with total losses greater than $500,000 will be subject to the terms of the aggregate treaty. The reinsurance subsidiary will also purchase additional reinsurance protection (Industry Loss Warranties) in peak exposure territories from external parties in which coverage is triggered when losses experienced by the insurance industry from a catastrophic event exceed a specified threshold. Any reinsurance recoveries received from external parties will reduce the amount of losses ceded to Employers Mutual under the excess of loss agreement. The net cost of the external reinsurance protection is estimated to be approximately $4.0 million.
122
The reinsurance subsidiary does not directly reinsure any of the insurance business written by Employers Mutual or the other pool participants; however, Employers Mutual assumes reinsurance business from the Mutual Reinsurance Bureau underwriting association (MRB), which provides a small amount of reinsurance protection to the members of the EMC Insurance Companies pooling agreement. As a result, the reinsurance subsidiary’s assumed exposures include a small portion of the EMC Insurance Companies’ direct business, after ceded reinsurance protections purchased by MRB are applied. In addition, the reinsurance subsidiary does not reinsure any “involuntary” facility or pool business that Employers Mutual assumes pursuant to state law. The reinsurance subsidiary assumes all foreign currency exchange gain/loss associated with contracts incepting on January 1, 2006 and thereafter that are subject to the quota share agreement. Operations of the quota share and excess of loss agreements give rise to inter-company balances with Employers Mutual, which are generally settled during the month following the end of each quarter. The investment and income tax activities of the reinsurance subsidiary are not subject to the quota share agreement.
Under the terms of the quota share agreement, the reinsurance subsidiary receives reinstatement premium income that is collected by Employers Mutual from the ceding companies when reinsurance coverage is reinstated after a loss event; however, the cap on losses assumed per event contained in the excess of loss agreement is automatically reinstated without cost. The reinsurance subsidiary recognized $1.8 million, $2.3 million and $2.5 million of reinstatement premium in 2015, 2014 and 2013, respectively.
Premiums earned assumed by the reinsurance subsidiary from Employers Mutual, including reinstatement premiums, amounted to $129.6 million, $122.1 million and $129.7 million in 2015, 2014 and 2013, respectively. The reinsurance subsidiary ceded 8.0 percent (9.0 percent in 2013) of its total assumed reinsurance premiums written to Employers Mutual as payment for the excess of loss protection, which totaled $10.8 million, $10.3 million and $12.8 million in 2015, 2014 and 2013, respectively. Losses and settlement expenses assumed by the reinsurance subsidiary from Employers Mutual amounted to $77.5 million, $79.5 million and $66.1 million in 2015, 2014 and 2013, respectively. Losses and settlement expenses ceded to Employers Mutual under the excess of loss agreement totaled $622,000, ($720,000) and $823,000 in 2015, 2014 and 2013, respectively.
It is customary in the reinsurance business for the assuming company to compensate the ceding company for the acquisition expenses incurred in the generation of the business. Commissions incurred by the reinsurance subsidiary under the quota share agreement with Employers Mutual amounted to $27.3 million, $25.6 million and $26.1 million in 2015, 2014 and 2013, respectively.
The net foreign currency exchange gain/(loss) assumed by the reinsurance subsidiary from Employers Mutual was $386,000 in 2015, $1.0 million in 2014 and $8,000 in 2013. The total amount of net foreign currency exchange gain/(loss) assumed by the reinsurance subsidiary, including the business written on a direct basis outside the quota share agreement, was $898,000 in 2015, $2.2 million in 2014 and $(366,000) in 2013.
Services Provided by Employers Mutual
The Company does not have any employees of its own. Employers Mutual performs all operations for all of its subsidiaries and affiliate. Such services include data processing, claims, financial, actuarial, legal, auditing, marketing and underwriting. Employers Mutual allocates a portion of the cost of these services to its subsidiaries that do not participate in the pooling agreement based upon a number of criteria, including usage of the services and the number of transactions. The remaining costs are charged to the pooling agreement and each pool participant shares in the total cost in accordance with its pool participation percentage. Costs allocated to the Company by Employers Mutual for services provided to the holding company and its subsidiary that does not participate in the pooling agreement amounted to $3.4 million, $3.5 million and $3.6 million in 2015, 2014 and 2013, respectively. Costs allocated to the Company through the operation of the pooling agreement amounted to $87.4 million, $76.0 million and $83.3 million in 2015, 2014 and 2013, respectively.
Investment expenses are based on actual expenses incurred by the Company plus an allocation of other investment expenses incurred by Employers Mutual, which is based on a weighted-average of total invested assets and number of investment transactions. Investment expenses allocated to the Company by Employers Mutual amounted to $1.4 million, $1.3 million and $1.6 million in 2015, 2014 and 2013, respectively.
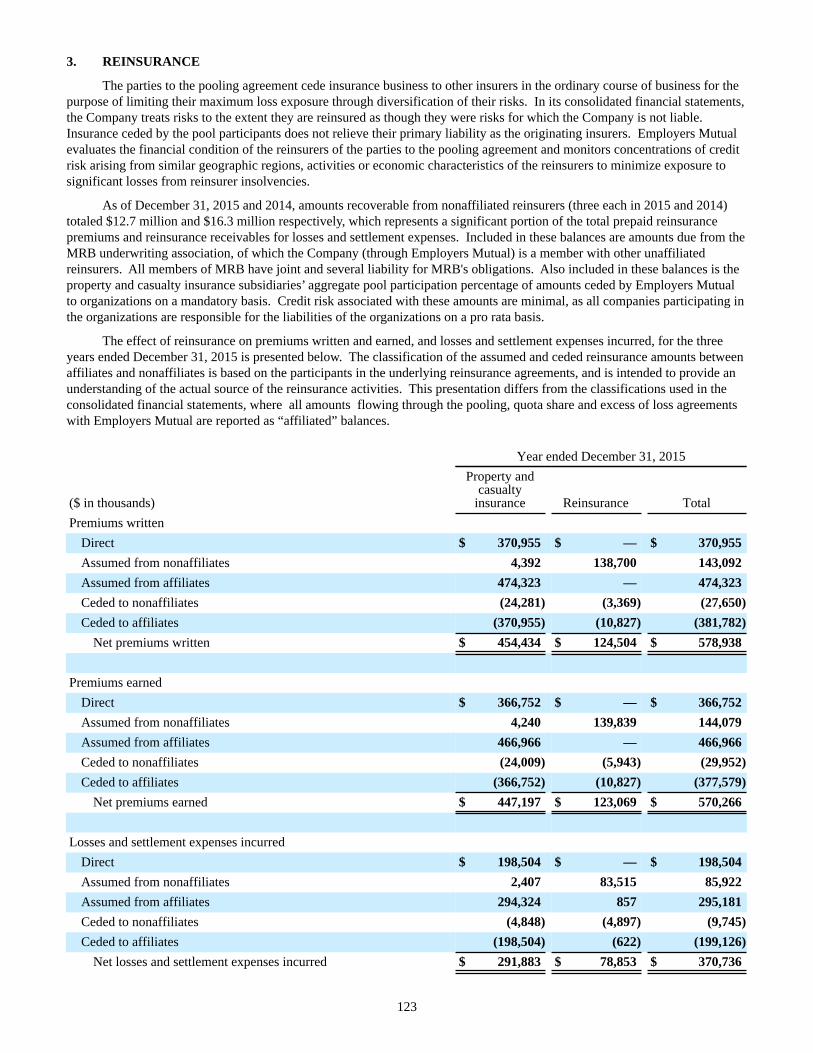
123
3. REINSURANCE
The parties to the pooling agreement cede insurance business to other insurers in the ordinary course of business for thepurpose of limiting their maximum loss exposure through diversification of their risks. In its consolidated financial statements, the Company treats risks to the extent they are reinsured as though they were risks for which the Company is not liable. Insurance ceded by the pool participants does not relieve their primary liability as the originating insurers. Employers Mutual evaluates the financial condition of the reinsurers of the parties to the pooling agreement and monitors concentrations of credit risk arising from similar geographic regions, activities or economic characteristics of the reinsurers to minimize exposure to significant losses from reinsurer insolvencies.
As of December 31, 2015 and 2014, amounts recoverable from nonaffiliated reinsurers (three each in 2015 and 2014) totaled $12.7 million and $16.3 million respectively, which represents a significant portion of the total prepaid reinsurance premiums and reinsurance receivables for losses and settlement expenses. Included in these balances are amounts due from the MRB underwriting association, of which the Company (through Employers Mutual) is a member with other unaffiliated reinsurers. All members of MRB have joint and several liability for MRB's obligations. Also included in these balances is the property and casualty insurance subsidiaries’ aggregate pool participation percentage of amounts ceded by Employers Mutual to organizations on a mandatory basis. Credit risk associated with these amounts are minimal, as all companies participating in the organizations are responsible for the liabilities of the organizations on a pro rata basis.
The effect of reinsurance on premiums written and earned, and losses and settlement expenses incurred, for the three years ended December 31, 2015 is presented below. The classification of the assumed and ceded reinsurance amounts between affiliates and nonaffiliates is based on the participants in the underlying reinsurance agreements, and is intended to provide an understanding of the actual source of the reinsurance activities. This presentation differs from the classifications used in the consolidated financial statements, where all amounts flowing through the pooling, quota share and excess of loss agreements with Employers Mutual are reported as “affiliated” balances.
Year ended December 31, 2015
($ in thousands)
Property andcasualty
insurance Reinsurance TotalPremiums written
Direct $ 370,955 $ — $ 370,955Assumed from nonaffiliates 4,392 138,700 143,092Assumed from affiliates 474,323 — 474,323Ceded to nonaffiliates (24,281) (3,369) (27,650)Ceded to affiliates (370,955) (10,827) (381,782)
Net premiums written $ 454,434 $ 124,504 $ 578,938
Premiums earnedDirect $ 366,752 $ — $ 366,752Assumed from nonaffiliates 4,240 139,839 144,079Assumed from affiliates 466,966 — 466,966Ceded to nonaffiliates (24,009) (5,943) (29,952)Ceded to affiliates (366,752) (10,827) (377,579)
Net premiums earned $ 447,197 $ 123,069 $ 570,266
Losses and settlement expenses incurredDirect $ 198,504 $ — $ 198,504Assumed from nonaffiliates 2,407 83,515 85,922Assumed from affiliates 294,324 857 295,181Ceded to nonaffiliates (4,848) (4,897) (9,745)Ceded to affiliates (198,504) (622) (199,126)
Net losses and settlement expenses incurred $ 291,883 $ 78,853 $ 370,736
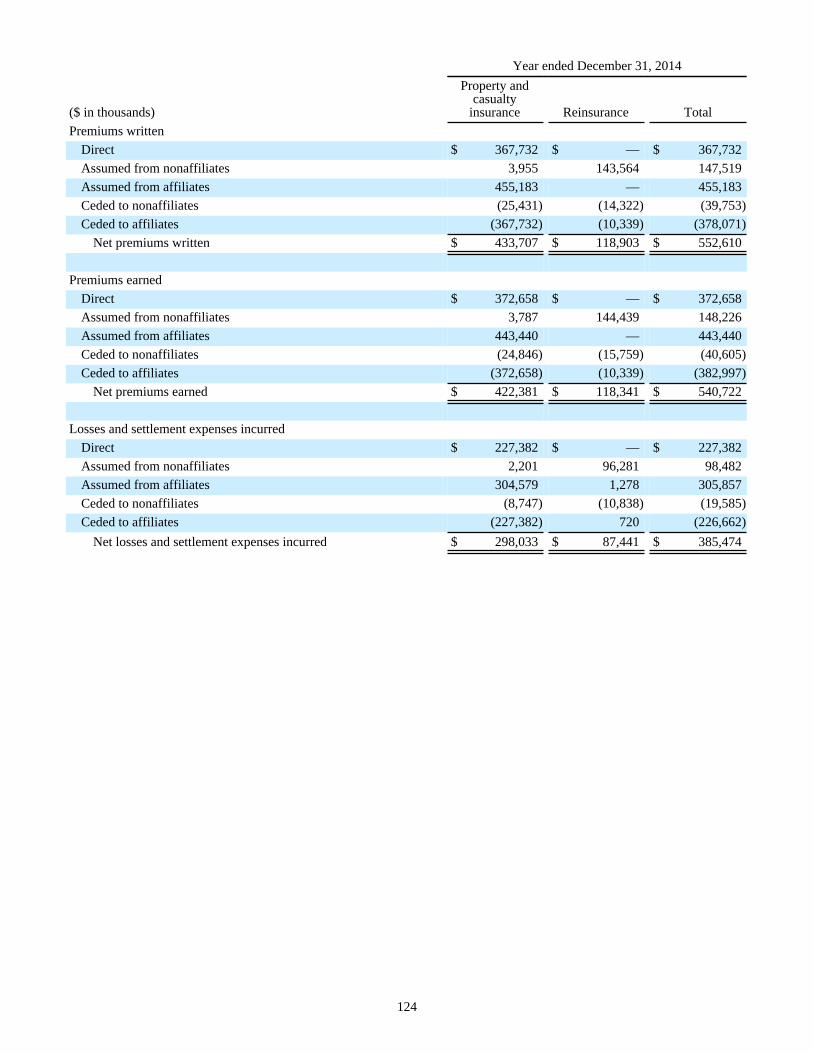
124
Year ended December 31, 2014
($ in thousands)
Property andcasualty
insurance Reinsurance TotalPremiums written
Direct $ 367,732 $ — $ 367,732Assumed from nonaffiliates 3,955 143,564 147,519Assumed from affiliates 455,183 — 455,183Ceded to nonaffiliates (25,431) (14,322) (39,753)Ceded to affiliates (367,732) (10,339) (378,071)
Net premiums written $ 433,707 $ 118,903 $ 552,610
Premiums earnedDirect $ 372,658 $ — $ 372,658Assumed from nonaffiliates 3,787 144,439 148,226Assumed from affiliates 443,440 — 443,440Ceded to nonaffiliates (24,846) (15,759) (40,605)Ceded to affiliates (372,658) (10,339) (382,997)
Net premiums earned $ 422,381 $ 118,341 $ 540,722
Losses and settlement expenses incurredDirect $ 227,382 $ — $ 227,382Assumed from nonaffiliates 2,201 96,281 98,482Assumed from affiliates 304,579 1,278 305,857Ceded to nonaffiliates (8,747) (10,838) (19,585)Ceded to affiliates (227,382) 720 (226,662)
Net losses and settlement expenses incurred $ 298,033 $ 87,441 $ 385,474
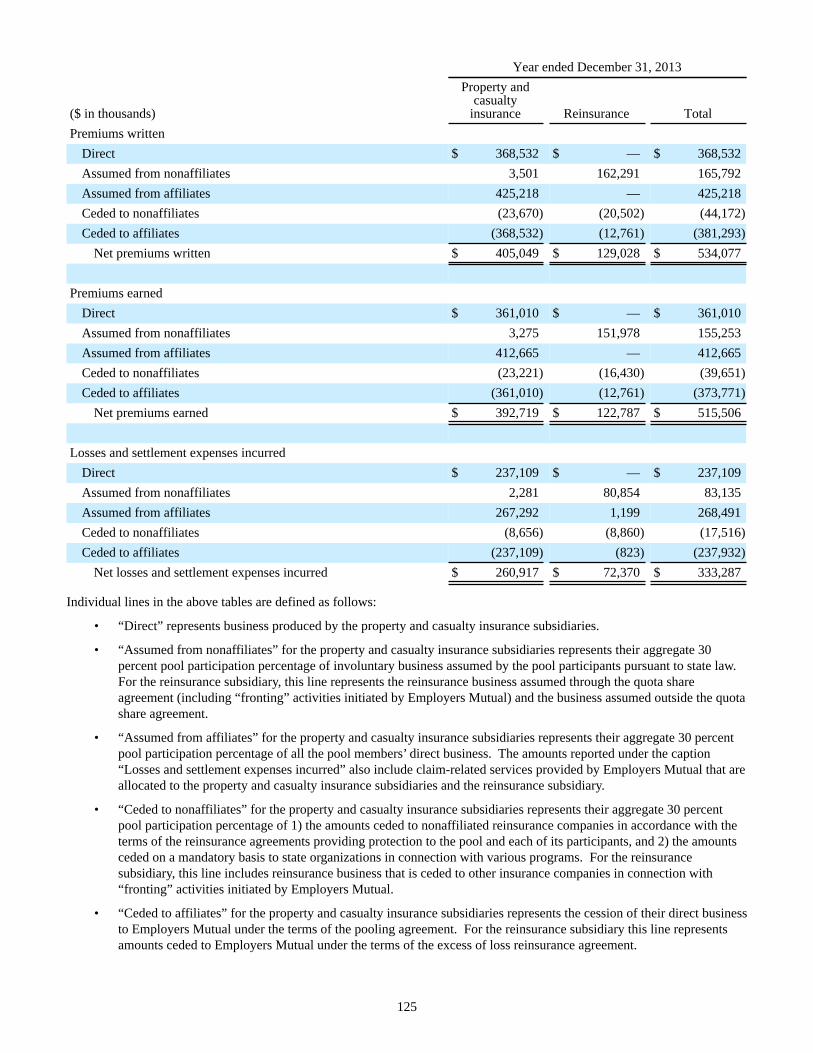
125
Year ended December 31, 2013
($ in thousands)
Property andcasualty
insurance Reinsurance TotalPremiums written
Direct $ 368,532 $ — $ 368,532Assumed from nonaffiliates 3,501 162,291 165,792Assumed from affiliates 425,218 — 425,218Ceded to nonaffiliates (23,670) (20,502) (44,172)Ceded to affiliates (368,532) (12,761) (381,293)
Net premiums written $ 405,049 $ 129,028 $ 534,077
Premiums earnedDirect $ 361,010 $ — $ 361,010Assumed from nonaffiliates 3,275 151,978 155,253Assumed from affiliates 412,665 — 412,665Ceded to nonaffiliates (23,221) (16,430) (39,651)Ceded to affiliates (361,010) (12,761) (373,771)
Net premiums earned $ 392,719 $ 122,787 $ 515,506
Losses and settlement expenses incurredDirect $ 237,109 $ — $ 237,109Assumed from nonaffiliates 2,281 80,854 83,135Assumed from affiliates 267,292 1,199 268,491Ceded to nonaffiliates (8,656) (8,860) (17,516)Ceded to affiliates (237,109) (823) (237,932)
Net losses and settlement expenses incurred $ 260,917 $ 72,370 $ 333,287
Individual lines in the above tables are defined as follows:
• “Direct” represents business produced by the property and casualty insurance subsidiaries.
• “Assumed from nonaffiliates” for the property and casualty insurance subsidiaries represents their aggregate 30percent pool participation percentage of involuntary business assumed by the pool participants pursuant to state law.For the reinsurance subsidiary, this line represents the reinsurance business assumed through the quota shareagreement (including “fronting” activities initiated by Employers Mutual) and the business assumed outside the quotashare agreement.
• “Assumed from affiliates” for the property and casualty insurance subsidiaries represents their aggregate 30 percentpool participation percentage of all the pool members’ direct business. The amounts reported under the caption“Losses and settlement expenses incurred” also include claim-related services provided by Employers Mutual that areallocated to the property and casualty insurance subsidiaries and the reinsurance subsidiary.
• “Ceded to nonaffiliates” for the property and casualty insurance subsidiaries represents their aggregate 30 percentpool participation percentage of 1) the amounts ceded to nonaffiliated reinsurance companies in accordance with theterms of the reinsurance agreements providing protection to the pool and each of its participants, and 2) the amountsceded on a mandatory basis to state organizations in connection with various programs. For the reinsurancesubsidiary, this line includes reinsurance business that is ceded to other insurance companies in connection with“fronting” activities initiated by Employers Mutual.
• “Ceded to affiliates” for the property and casualty insurance subsidiaries represents the cession of their direct businessto Employers Mutual under the terms of the pooling agreement. For the reinsurance subsidiary this line representsamounts ceded to Employers Mutual under the terms of the excess of loss reinsurance agreement.
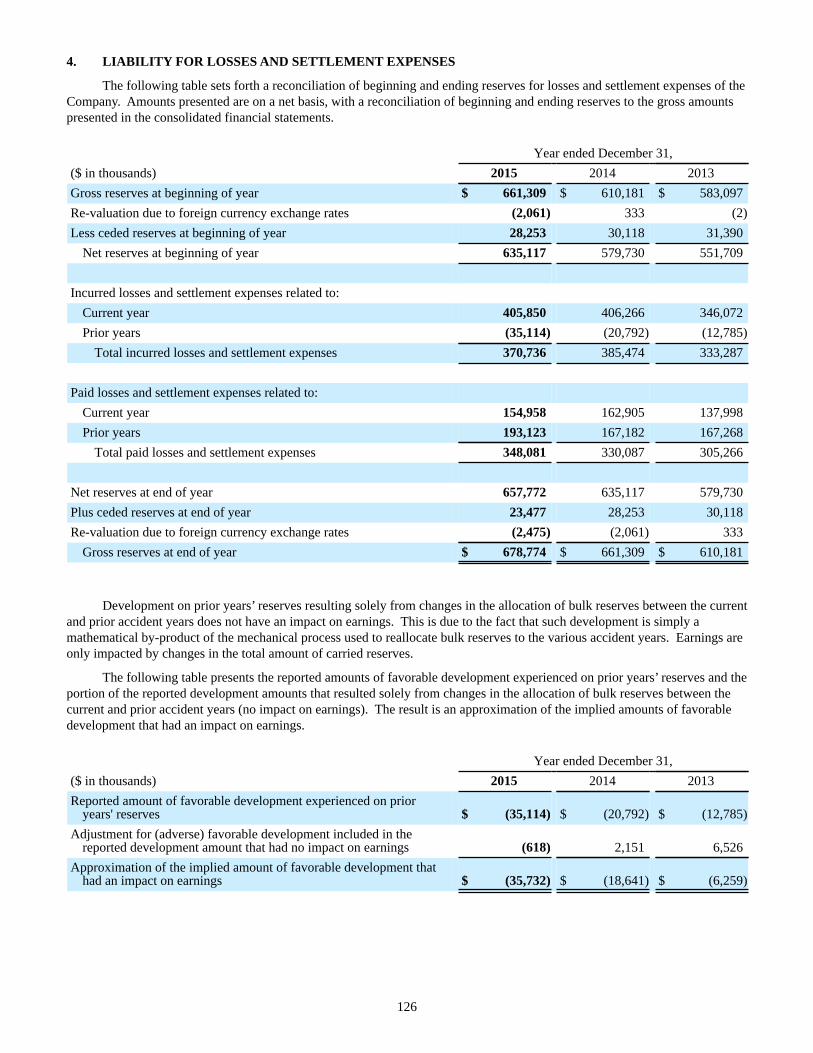
126
4. LIABILITY FOR LOSSES AND SETTLEMENT EXPENSES
The following table sets forth a reconciliation of beginning and ending reserves for losses and settlement expenses of theCompany. Amounts presented are on a net basis, with a reconciliation of beginning and ending reserves to the gross amounts presented in the consolidated financial statements.
Year ended December 31,($ in thousands) 2015 2014 2013Gross reserves at beginning of year $ 661,309 $ 610,181 $ 583,097Re-valuation due to foreign currency exchange rates (2,061) 333 (2)Less ceded reserves at beginning of year 28,253 30,118 31,390
Net reserves at beginning of year 635,117 579,730 551,709
Incurred losses and settlement expenses related to:Current year 405,850 406,266 346,072Prior years (35,114) (20,792) (12,785)
Total incurred losses and settlement expenses 370,736 385,474 333,287
Paid losses and settlement expenses related to:Current year 154,958 162,905 137,998Prior years 193,123 167,182 167,268
Total paid losses and settlement expenses 348,081 330,087 305,266
Net reserves at end of year 657,772 635,117 579,730Plus ceded reserves at end of year 23,477 28,253 30,118Re-valuation due to foreign currency exchange rates (2,475) (2,061) 333
Gross reserves at end of year $ 678,774 $ 661,309 $ 610,181
Development on prior years’ reserves resulting solely from changes in the allocation of bulk reserves between the current and prior accident years does not have an impact on earnings. This is due to the fact that such development is simply a mathematical by-product of the mechanical process used to reallocate bulk reserves to the various accident years. Earnings are only impacted by changes in the total amount of carried reserves.
The following table presents the reported amounts of favorable development experienced on prior years’ reserves and the portion of the reported development amounts that resulted solely from changes in the allocation of bulk reserves between the current and prior accident years (no impact on earnings). The result is an approximation of the implied amounts of favorable development that had an impact on earnings.
Year ended December 31,($ in thousands) 2015 2014 2013Reported amount of favorable development experienced on prior
years' reserves $ (35,114) $ (20,792) $ (12,785)Adjustment for (adverse) favorable development included in the
reported development amount that had no impact on earnings (618) 2,151 6,526Approximation of the implied amount of favorable development that
had an impact on earnings $ (35,732) $ (18,641) $ (6,259)
127
There is an inherent amount of uncertainty involved in the establishment of insurance liabilities. This uncertainty is greatest in the current and more recent accident years because a smaller percentage of the expected ultimate claims have been reported, adjusted and settled compared to more mature accident years. For this reason, carried reserves for these accident years reflect prudently conservative assumptions. As the carried reserves for these accident years run off, the overall expectation is that, more often than not, favorable development will occur. However, there is also the possibility that the ultimate settlement of liabilities associated with these accident years will show adverse development, and such adverse development could be substantial.
Changes in reserve estimates are reflected in net income in the year such changes are recorded. Following is an analysis of the reserve development the Company has experienced during the past three years. Care should be exercised when attempting to analyze the financial impact of the reported development amounts because, as noted above, the overall expectation is that, more often than not, favorable development will occur as the prior accident years’ reserves run off.
2015 Development
For the property and casualty insurance segment, the December 31, 2015 estimate of loss and settlement expense reserves for accident years 2014 and prior decreased $13.8 million from the estimate at December 31, 2014. This decrease represents 3.0 percent of the December 31, 2014 gross carried reserves and is primarily attributed to better than expected outcomes on claims reported in prior years and favorable development on prior years' settlement expenses. No changes were made in the key actuarial assumptions utilized to estimate loss and settlement expense reserves during 2015; however, the accident year allocation factors applied to IBNR loss reserves, bulk case loss reserves and the defense and cost containment portion of settlement expense reserves were revised at December 31, 2015 as part of the annual review. This change resulted in the movement of $423,000 of reserves from prior accident years to the current accident year, and hence, was reported as favorable development on prior years' reserves. Development on prior years’ reserves resulting solely from changes in the allocation of bulk reserves between the current and prior accident years does not have an impact on earnings.
For the reinsurance segment, the December 31, 2015 estimate of loss and settlement expense reserves for accident years 2014 and prior decreased $21.3 million from the estimate at December 31, 2014. This decrease represents 10.8 percent of the December 31, 2014 gross carried reserves and is attributable to several factors, including adjustments made in the offshore energy and liability proportional account, a reduction in carried IBNR loss reserves that could no longer be justified and a negative bulk IBNR loss reserve established for the MRB book of business. No changes were made in the key actuarial assumptions utilized to estimate loss and settlement expense reserves during 2015; however, the accident year allocation factors applied to IBNR loss reserves were revised during 2015. This change resulted in the movement of $1.0 million of reserves from the current accident year to prior accident years, and hence, was reported as adverse development on prior years' reserves. Development on prior years’ reserves resulting solely from changes in the allocation of bulk reserves between the current and prior accident years does not have an impact on earnings.
2014 Development
For the property and casualty insurance segment, the December 31, 2014 estimate of loss and settlement expense reserves for accident years 2013 and prior decreased $8.1 million from the estimate at December 31, 2013. This decrease represented 1.9 percent of the December 31, 2013 gross carried reserves and was primarily attributed to better than expected outcomes on claims reported in prior years and favorable development on prior years' settlement expense reserves. No changes were made in the key actuarial assumptions utilized to estimate loss and settlement expense reserves during 2014; however, the accident year allocation factors applied to IBNR loss reserves, bulk case loss reserves and the defense and cost containment portion of settlement expense reserves were revised at December 31, 2014 as part of the annual review. This change resulted in the movement of $2.2 million of reserves from prior accident years to the current accident year, and hence, was reported as favorable development on prior years' reserves. Development on prior years’ reserves resulting solely from changes in the allocation of bulk reserves between the current and prior accident years does not have an impact on earnings.
For the reinsurance segment, the December 31, 2014 estimate of loss and settlement expense reserves for accident years 2013 and prior decreased $12.7 million from the estimate at December 31, 2013. This decrease represented 6.9 percent of the December 31, 2013 gross carried reserves and was largely attributed to reported losses being lower than what was expected as of December 31, 2014 for accident years 2012 and prior, and a take down of IBNR loss reserves on older accident years because the amount previously carried was no longer indicated in the actuarial analysis.
128
2013 Development
For the property and casualty insurance segment, the December 31, 2013 estimate of loss and settlement expense reserves for accident years 2012 and prior decreased $7.3 million from the estimate at December 31, 2012. This decrease represented 1.8 percent of the December 31, 2012 gross carried reserves and was primarily attributed to favorable development on settlement expense reserves and ceded reinsurance reserves. No changes were made in the key actuarial assumptions utilized to estimate loss and settlement expense reserves during 2013; however, the accident year allocation factors applied to IBNR loss reserves, bulk case loss reserves and the defense and cost containment portion of settlement expense reserves were revised at December 31, 2013 as part of the annual review. This change resulted in the movement of $6.5 million of reserves from the prior accident years to the current accident year, and hence, was reported as favorable development on prior years' reserves. Development on prior years’ reserves resulting solely from changes in the allocation of bulk reserves between the current and prior accident years does not have an impact on earnings.
For the reinsurance segment, the December 31, 2013 estimate of loss and settlement expense reserves for accident years 2012 and prior decreased $5.5 million from the estimate at December 31, 2012. This decrease represented 3.2 percent of the December 31, 2012 gross carried reserves and was largely attributed to reported losses that were below the December 2012 implicit projections for policy year 2012 in the Home Office Reinsurance Assumed Department ("HORAD") book of business.
5. ASBESTOS AND ENVIRONMENTAL CLAIMS
The Company has exposure to asbestos and environmental related claims associated with the insurance business writtenby the parties to the pooling agreement and the reinsurance business assumed from Employers Mutual by the reinsurance subsidiary. These exposures are not considered to be significant. Asbestos and environmental losses paid by the Company have averaged $1.8 million per year over the past five years. Reserves for asbestos and environmental related claims for direct insurance and assumed reinsurance business totaled $11.5 million and $9.4 million ($11.2 million and $9.3 million net of reinsurance) at December 31, 2015 and 2014, respectively.
Estimating loss and settlement expense reserves for asbestos and environmental claims is very difficult due to the many uncertainties surrounding these types of claims. These uncertainties exist because the assignment of responsibility varies widely by state and claims often emerge long after a policy has expired, which makes assignment of damages to the appropriate party and to the time period covered by a particular policy difficult. In establishing reserves for these types of claims, management monitors the relevant facts concerning each claim, the current status of the legal environment, social and political conditions, and claim history and trends within the Company and the industry.
At present, the pool participants are defending approximately 1,809 asbestos bodily injury lawsuits, some of which involve multiple plaintiffs. Most of the lawsuits are subject to express reservation of rights based upon the lack of an injury within the applicable policy periods, because many asbestos lawsuits do not specifically allege dates of asbestos exposure or dates of injury. The pool participants’ policyholders named as defendants in these asbestos lawsuits are typically peripheral defendants who have little or no exposure and are routinely dismissed from asbestos litigation with nominal or no payment (i.e., small contractors, supply companies, and a furnace manufacturer).
Prior to 2008, actual losses paid for asbestos-related claims had been minimal due to the plaintiffs’ failure to identify an exposure to any asbestos-containing products associated with the pool participants’ current and former policyholders. However, paid losses and settlement expenses have increased significantly since 2008 as a result of claims attributed to one former policyholder. During the period 2009 through 2015, the Company's share of paid losses and settlement expenses attributed to this former policyholder, a furnace manufacturer, was $9.4 million (primarily settlement expenses). A coverage-in-place agreement was executed with this former policyholder in 2009 and a national coordinating counsel was retained to address the multi-state litigation issues. The asbestos exposure associated with this former policyholder has increased in recent years, and this trend may possibly continue into the future with increased per plaintiff settlements. Approximately 655 asbestos exposure claims associated with this former policyholder remain open.
While the Company does not have a significant amount of exposure to asbestos claims, management has been proactive in strengthening the reserves carried for these exposures when deemed necessary. In 2015, the loss and settlement expense reserves for asbestos claims were strengthened approximately $4.1 million.
129
6. STATUTORY INFORMATION AND DIVIDEND RESTRICTIONS
The Company’s insurance subsidiaries are required to file financial statements with state regulatory authorities. Theaccounting principles used to prepare these statutory financial statements follow prescribed or permitted accounting practices that differ from GAAP. Prescribed statutory accounting principles include state laws, regulations and general administrative rules issued by the state of domicile, as well as a variety of publications and manuals of the National Association of Insurance Commissioners (NAIC). Permitted accounting practices encompass all accounting practices not prescribed, but allowed by the state of domicile. The Company’s insurance subsidiaries had no permitted accounting practices during 2015, 2014 or 2013.
Statutory surplus of the Company’s insurance subsidiaries was $485.2 million and $454.8 million at December 31, 2015 and 2014, respectively. Statutory net income of the Company’s insurance subsidiaries was $48.8 million, $32.2 million and $41.2 million for 2015, 2014 and 2013, respectively.
The NAIC utilizes a risk-based capital model to help state regulators assess the capital adequacy of insurance companies and identify insurers that are in, or are perceived as approaching, financial difficulty. This model establishes minimum capital needs based on the risks applicable to the operations of the individual insurer. The risk-based capital requirements for property and casualty insurance companies measure three major areas of risk: asset risk, credit risk and underwriting risk. Companies having less statutory surplus than required by the risk-based capital requirements are subject to varying degrees of regulatory scrutiny and intervention, depending on the severity of the inadequacy. At December 31, 2015, the Company’s insurance subsidiaries had total adjusted statutory capital of $485.2 million, which is well in excess of the minimum risk-based capital requirement of $77.4 million.
The amount of dividends available for distribution to the Company by its insurance subsidiaries is limited by law to a percentage of the statutory unassigned surplus of each of the subsidiaries as of the previous December 31, as determined in accordance with accounting practices prescribed by insurance regulatory authorities of the state of domicile of each subsidiary. Subject to this limitation, the maximum dividend that may be paid within a 12 month period without prior approval of the insurance regulatory authorities is generally restricted to the greater of 10 percent of statutory surplus as regards policyholders as of the preceding December 31, or net income of the preceding calendar year on a statutory basis, not greater than earned statutory surplus. At December 31, 2015, $49.8 million was available for distribution to the Company in 2016 without prior approval.
7. SEGMENT INFORMATION
The Company’s operations consist of a property and casualty insurance segment and a reinsurance segment. Theproperty and casualty insurance segment writes both commercial and personal lines of insurance, with a focus on medium-sized commercial accounts. The reinsurance segment provides reinsurance for other insurers and reinsurers. The segments are managed separately due to differences in the insurance products sold and the business environments in which they operate. The accounting policies of the segments are described in note 1, Summary of Significant Accounting Policies.
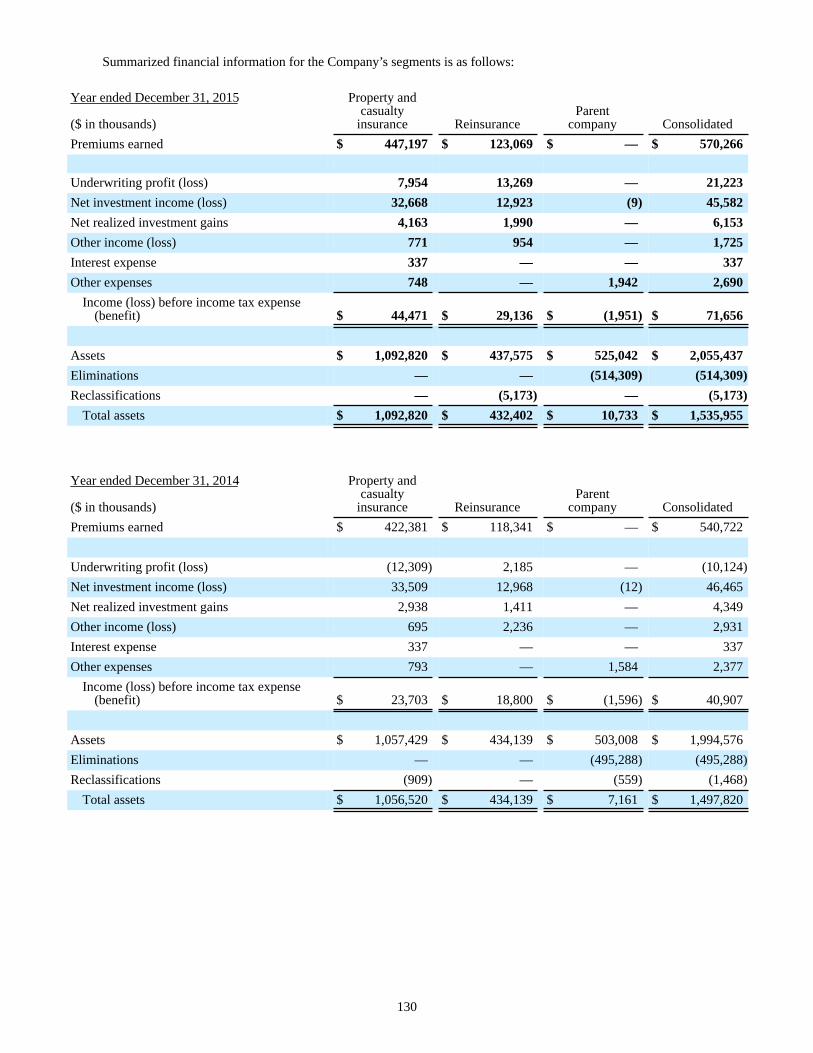
130
Summarized financial information for the Company’s segments is as follows:
Year ended December 31, 2015 Property andcasualty
insurance ReinsuranceParent
company Consolidated($ in thousands)Premiums earned $ 447,197 $ 123,069 $ — $ 570,266
Underwriting profit (loss) 7,954 13,269 — 21,223Net investment income (loss) 32,668 12,923 (9) 45,582Net realized investment gains 4,163 1,990 — 6,153Other income (loss) 771 954 — 1,725Interest expense 337 — — 337Other expenses 748 — 1,942 2,690
Income (loss) before income tax expense(benefit) $ 44,471 $ 29,136 $ (1,951) $ 71,656
Assets $ 1,092,820 $ 437,575 $ 525,042 $ 2,055,437Eliminations — — (514,309) (514,309)Reclassifications — (5,173) — (5,173)
Total assets $ 1,092,820 $ 432,402 $ 10,733 $ 1,535,955
Year ended December 31, 2014 Property andcasualty
insurance ReinsuranceParent
company Consolidated($ in thousands)Premiums earned $ 422,381 $ 118,341 $ — $ 540,722
Underwriting profit (loss) (12,309) 2,185 — (10,124)Net investment income (loss) 33,509 12,968 (12) 46,465Net realized investment gains 2,938 1,411 — 4,349Other income (loss) 695 2,236 — 2,931Interest expense 337 — — 337Other expenses 793 — 1,584 2,377
Income (loss) before income tax expense(benefit) $ 23,703 $ 18,800 $ (1,596) $ 40,907
Assets $ 1,057,429 $ 434,139 $ 503,008 $ 1,994,576Eliminations — — (495,288) (495,288)Reclassifications (909) — (559) (1,468)
Total assets $ 1,056,520 $ 434,139 $ 7,161 $ 1,497,820
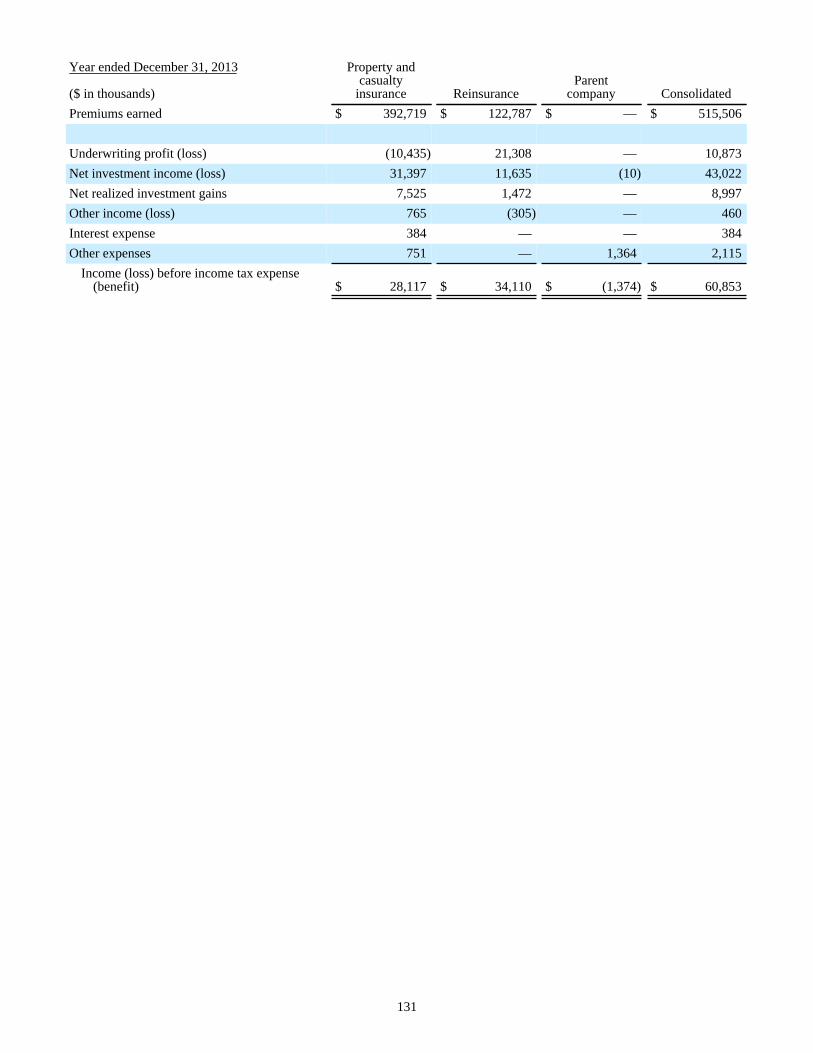
131
Year ended December 31, 2013 Property andcasualty
insurance ReinsuranceParent
company Consolidated($ in thousands)Premiums earned $ 392,719 $ 122,787 $ — $ 515,506
Underwriting profit (loss) (10,435) 21,308 — 10,873Net investment income (loss) 31,397 11,635 (10) 43,022Net realized investment gains 7,525 1,472 — 8,997Other income (loss) 765 (305) — 460Interest expense 384 — — 384Other expenses 751 — 1,364 2,115
Income (loss) before income tax expense(benefit) $ 28,117 $ 34,110 $ (1,374) $ 60,853
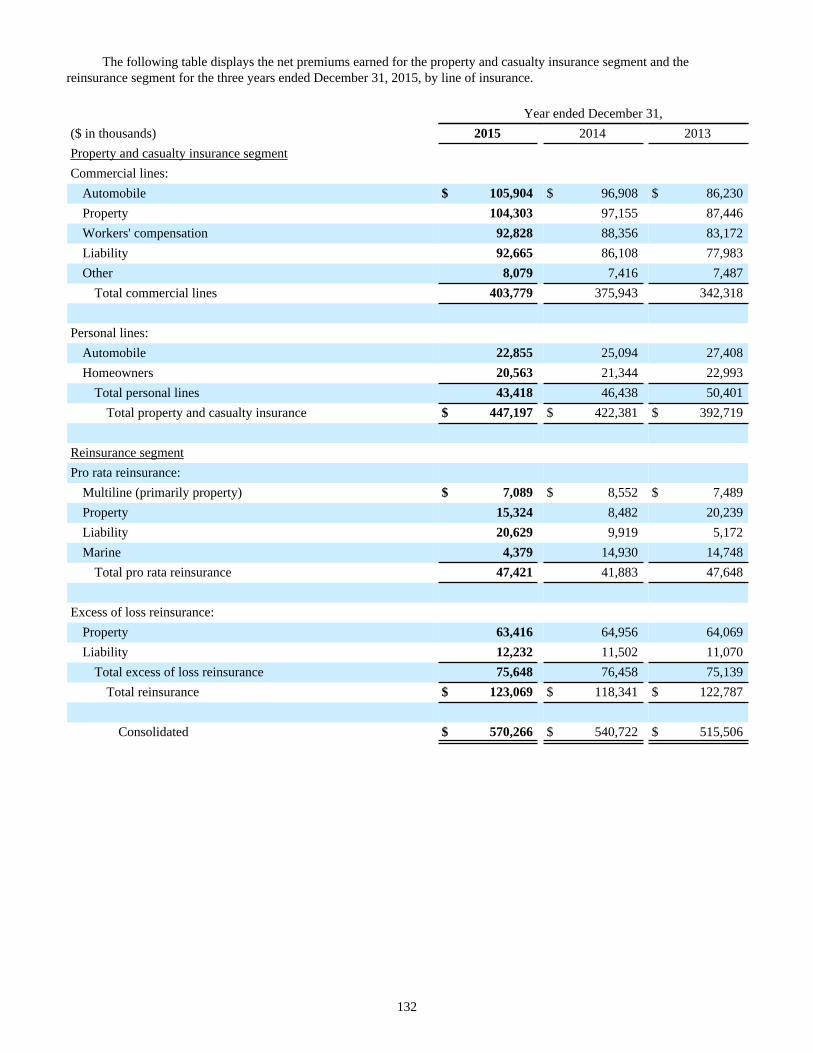
132
The following table displays the net premiums earned for the property and casualty insurance segment and the reinsurance segment for the three years ended December 31, 2015, by line of insurance.
Year ended December 31,($ in thousands) 2015 2014 2013Property and casualty insurance segmentCommercial lines:
Automobile $ 105,904 $ 96,908 $ 86,230Property 104,303 97,155 87,446Workers' compensation 92,828 88,356 83,172Liability 92,665 86,108 77,983Other 8,079 7,416 7,487
Total commercial lines 403,779 375,943 342,318
Personal lines:Automobile 22,855 25,094 27,408Homeowners 20,563 21,344 22,993
Total personal lines 43,418 46,438 50,401Total property and casualty insurance $ 447,197 $ 422,381 $ 392,719
Reinsurance segmentPro rata reinsurance:
Multiline (primarily property) $ 7,089 $ 8,552 $ 7,489Property 15,324 8,482 20,239Liability 20,629 9,919 5,172Marine 4,379 14,930 14,748
Total pro rata reinsurance 47,421 41,883 47,648
Excess of loss reinsurance:Property 63,416 64,956 64,069Liability 12,232 11,502 11,070
Total excess of loss reinsurance 75,648 76,458 75,139Total reinsurance $ 123,069 $ 118,341 $ 122,787
Consolidated $ 570,266 $ 540,722 $ 515,506
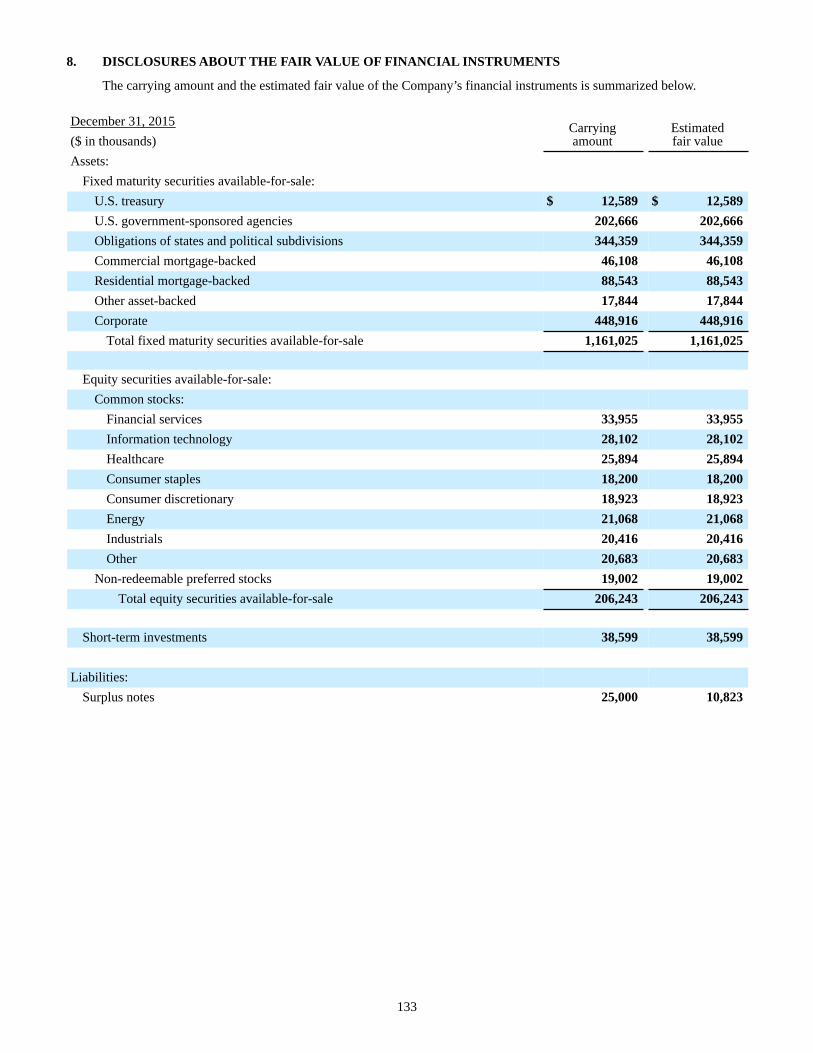
133
8. DISCLOSURES ABOUT THE FAIR VALUE OF FINANCIAL INSTRUMENTS
The carrying amount and the estimated fair value of the Company’s financial instruments is summarized below.
December 31, 2015 Carryingamount
Estimatedfair value($ in thousands)
Assets:Fixed maturity securities available-for-sale:
U.S. treasury $ 12,589 $ 12,589U.S. government-sponsored agencies 202,666 202,666Obligations of states and political subdivisions 344,359 344,359Commercial mortgage-backed 46,108 46,108Residential mortgage-backed 88,543 88,543Other asset-backed 17,844 17,844Corporate 448,916 448,916
Total fixed maturity securities available-for-sale 1,161,025 1,161,025
Equity securities available-for-sale:Common stocks:
Financial services 33,955 33,955Information technology 28,102 28,102Healthcare 25,894 25,894Consumer staples 18,200 18,200Consumer discretionary 18,923 18,923Energy 21,068 21,068Industrials 20,416 20,416Other 20,683 20,683
Non-redeemable preferred stocks 19,002 19,002Total equity securities available-for-sale 206,243 206,243
Short-term investments 38,599 38,599
Liabilities:Surplus notes 25,000 10,823
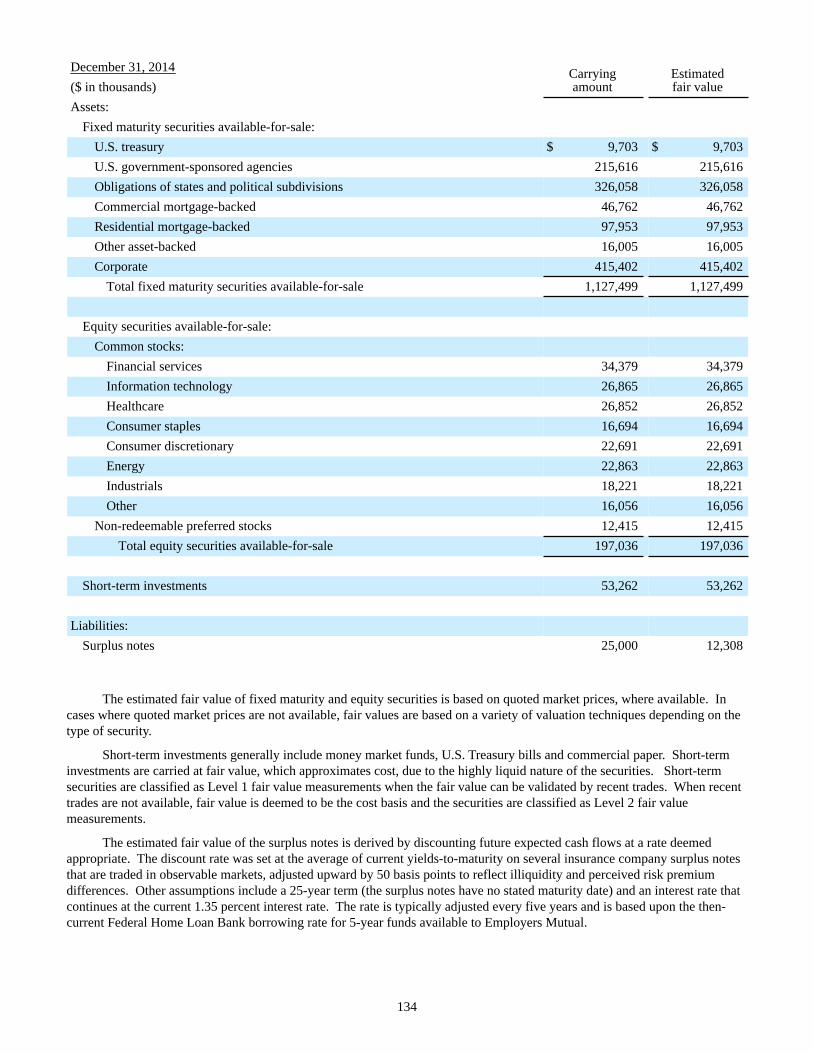
134
December 31, 2014 Carryingamount
Estimatedfair value($ in thousands)
Assets:Fixed maturity securities available-for-sale:
U.S. treasury $ 9,703 $ 9,703U.S. government-sponsored agencies 215,616 215,616Obligations of states and political subdivisions 326,058 326,058Commercial mortgage-backed 46,762 46,762Residential mortgage-backed 97,953 97,953Other asset-backed 16,005 16,005Corporate 415,402 415,402
Total fixed maturity securities available-for-sale 1,127,499 1,127,499
Equity securities available-for-sale:Common stocks:
Financial services 34,379 34,379Information technology 26,865 26,865Healthcare 26,852 26,852Consumer staples 16,694 16,694Consumer discretionary 22,691 22,691Energy 22,863 22,863Industrials 18,221 18,221Other 16,056 16,056
Non-redeemable preferred stocks 12,415 12,415Total equity securities available-for-sale 197,036 197,036
Short-term investments 53,262 53,262
Liabilities:Surplus notes 25,000 12,308
The estimated fair value of fixed maturity and equity securities is based on quoted market prices, where available. In cases where quoted market prices are not available, fair values are based on a variety of valuation techniques depending on the type of security.
Short-term investments generally include money market funds, U.S. Treasury bills and commercial paper. Short-term investments are carried at fair value, which approximates cost, due to the highly liquid nature of the securities. Short-term securities are classified as Level 1 fair value measurements when the fair value can be validated by recent trades. When recent trades are not available, fair value is deemed to be the cost basis and the securities are classified as Level 2 fair value measurements.
The estimated fair value of the surplus notes is derived by discounting future expected cash flows at a rate deemed appropriate. The discount rate was set at the average of current yields-to-maturity on several insurance company surplus notes that are traded in observable markets, adjusted upward by 50 basis points to reflect illiquidity and perceived risk premium differences. Other assumptions include a 25-year term (the surplus notes have no stated maturity date) and an interest rate that continues at the current 1.35 percent interest rate. The rate is typically adjusted every five years and is based upon the then-current Federal Home Loan Bank borrowing rate for 5-year funds available to Employers Mutual.
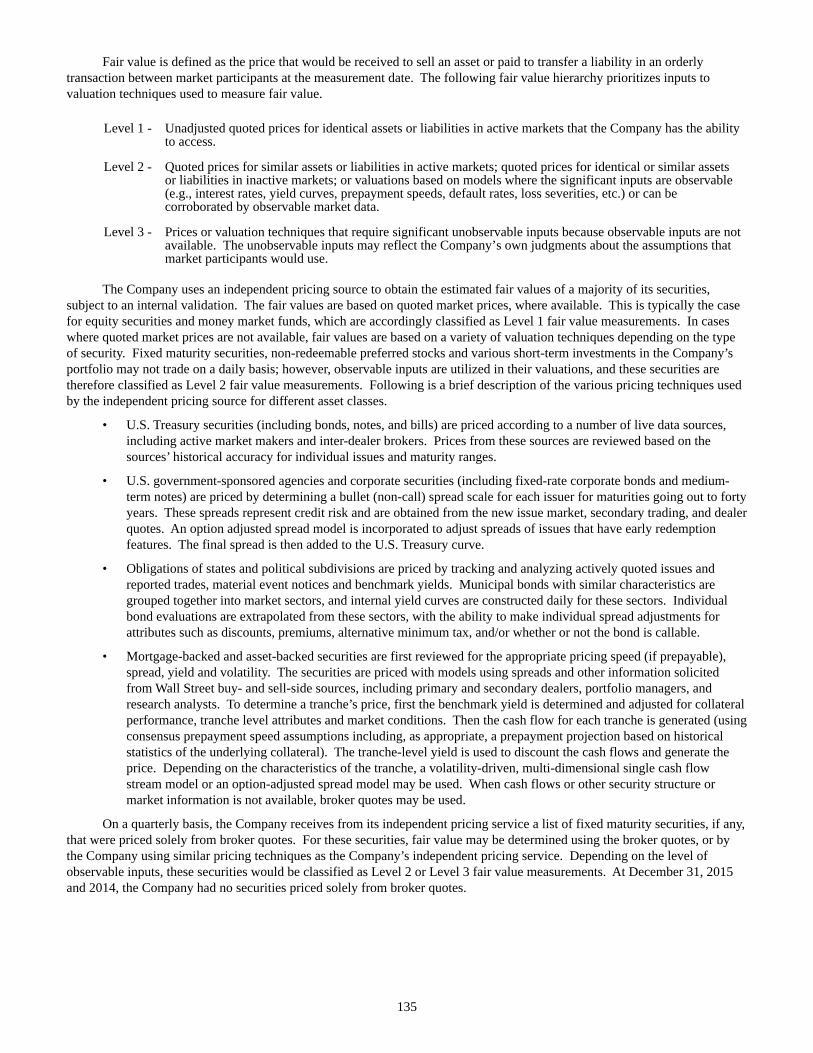
135
Fair value is defined as the price that would be received to sell an asset or paid to transfer a liability in an orderly transaction between market participants at the measurement date. The following fair value hierarchy prioritizes inputs to valuation techniques used to measure fair value.
Level 1 - Unadjusted quoted prices for identical assets or liabilities in active markets that the Company has the abilityto access.
Level 2 - Quoted prices for similar assets or liabilities in active markets; quoted prices for identical or similar assetsor liabilities in inactive markets; or valuations based on models where the significant inputs are observable(e.g., interest rates, yield curves, prepayment speeds, default rates, loss severities, etc.) or can becorroborated by observable market data.
Level 3 - Prices or valuation techniques that require significant unobservable inputs because observable inputs are notavailable. The unobservable inputs may reflect the Company’s own judgments about the assumptions thatmarket participants would use.
The Company uses an independent pricing source to obtain the estimated fair values of a majority of its securities, subject to an internal validation. The fair values are based on quoted market prices, where available. This is typically the case for equity securities and money market funds, which are accordingly classified as Level 1 fair value measurements. In cases where quoted market prices are not available, fair values are based on a variety of valuation techniques depending on the type of security. Fixed maturity securities, non-redeemable preferred stocks and various short-term investments in the Company’s portfolio may not trade on a daily basis; however, observable inputs are utilized in their valuations, and these securities are therefore classified as Level 2 fair value measurements. Following is a brief description of the various pricing techniques used by the independent pricing source for different asset classes.
• U.S. Treasury securities (including bonds, notes, and bills) are priced according to a number of live data sources,including active market makers and inter-dealer brokers. Prices from these sources are reviewed based on thesources’ historical accuracy for individual issues and maturity ranges.
• U.S. government-sponsored agencies and corporate securities (including fixed-rate corporate bonds and medium-term notes) are priced by determining a bullet (non-call) spread scale for each issuer for maturities going out to fortyyears. These spreads represent credit risk and are obtained from the new issue market, secondary trading, and dealerquotes. An option adjusted spread model is incorporated to adjust spreads of issues that have early redemptionfeatures. The final spread is then added to the U.S. Treasury curve.
• Obligations of states and political subdivisions are priced by tracking and analyzing actively quoted issues andreported trades, material event notices and benchmark yields. Municipal bonds with similar characteristics aregrouped together into market sectors, and internal yield curves are constructed daily for these sectors. Individualbond evaluations are extrapolated from these sectors, with the ability to make individual spread adjustments forattributes such as discounts, premiums, alternative minimum tax, and/or whether or not the bond is callable.
• Mortgage-backed and asset-backed securities are first reviewed for the appropriate pricing speed (if prepayable),spread, yield and volatility. The securities are priced with models using spreads and other information solicitedfrom Wall Street buy- and sell-side sources, including primary and secondary dealers, portfolio managers, andresearch analysts. To determine a tranche’s price, first the benchmark yield is determined and adjusted for collateralperformance, tranche level attributes and market conditions. Then the cash flow for each tranche is generated (usingconsensus prepayment speed assumptions including, as appropriate, a prepayment projection based on historicalstatistics of the underlying collateral). The tranche-level yield is used to discount the cash flows and generate theprice. Depending on the characteristics of the tranche, a volatility-driven, multi-dimensional single cash flowstream model or an option-adjusted spread model may be used. When cash flows or other security structure ormarket information is not available, broker quotes may be used.
On a quarterly basis, the Company receives from its independent pricing service a list of fixed maturity securities, if any, that were priced solely from broker quotes. For these securities, fair value may be determined using the broker quotes, or by the Company using similar pricing techniques as the Company’s independent pricing service. Depending on the level of observable inputs, these securities would be classified as Level 2 or Level 3 fair value measurements. At December 31, 2015 and 2014, the Company had no securities priced solely from broker quotes.

136
A small number of the Company’s securities are not priced by the independent pricing service. One equity security is reported as a Level 3 fair value measurement at December 31, 2015 and 2014, since no reliable observable inputs are used in its valuation. This equity security continues to be reported at the fair value obtained from the Securities Valuation Office (SVO) of the NAIC. The SVO establishes a per share price for this security based on an annual review of that company’s financial statements, typically performed during the second quarter. The other securities not priced by the Company’s independent pricing service at December 31, 2015 include seven fixed maturity securities (ten at December 31, 2014). Two of these fixed maturity securities, classified as Level 3 fair value measurements, are corporate securities that convey premium tax benefits and are not publicly traded. The fair values for these securities are based on discounted cash flow analyses. The other fixed maturity securities are classified as Level 2 fair value measurements. The fair values for these fixed maturity securities were obtained from either the SVO, the Company’s investment custodian, or the Company's investment department using similar pricing techniques as the Company's independent pricing service.
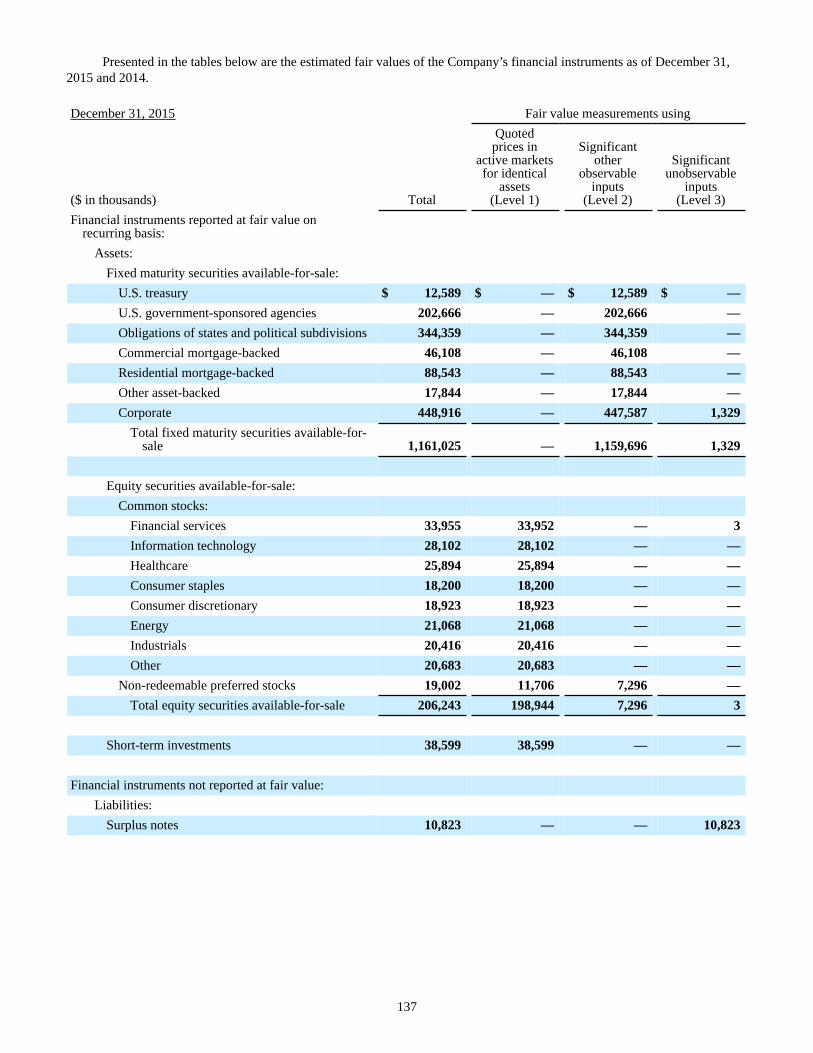
137
Presented in the tables below are the estimated fair values of the Company’s financial instruments as of December 31, 2015 and 2014.
December 31, 2015 Fair value measurements using
($ in thousands) Total
Quotedprices in
active marketsfor identical
assets(Level 1)
Significantother
observableinputs
(Level 2)
Significantunobservable
inputs(Level 3)
Financial instruments reported at fair value onrecurring basis:
Assets:Fixed maturity securities available-for-sale:
U.S. treasury $ 12,589 $ — $ 12,589 $ —U.S. government-sponsored agencies 202,666 — 202,666 —Obligations of states and political subdivisions 344,359 — 344,359 —Commercial mortgage-backed 46,108 — 46,108 —Residential mortgage-backed 88,543 — 88,543 —Other asset-backed 17,844 — 17,844 —Corporate 448,916 — 447,587 1,329
Total fixed maturity securities available-for-sale 1,161,025 — 1,159,696 1,329
Equity securities available-for-sale:Common stocks:
Financial services 33,955 33,952 — 3Information technology 28,102 28,102 — —Healthcare 25,894 25,894 — —Consumer staples 18,200 18,200 — —Consumer discretionary 18,923 18,923 — —Energy 21,068 21,068 — —Industrials 20,416 20,416 — —Other 20,683 20,683 — —
Non-redeemable preferred stocks 19,002 11,706 7,296 —Total equity securities available-for-sale 206,243 198,944 7,296 3
Short-term investments 38,599 38,599 — —
Financial instruments not reported at fair value:Liabilities:
Surplus notes 10,823 — — 10,823
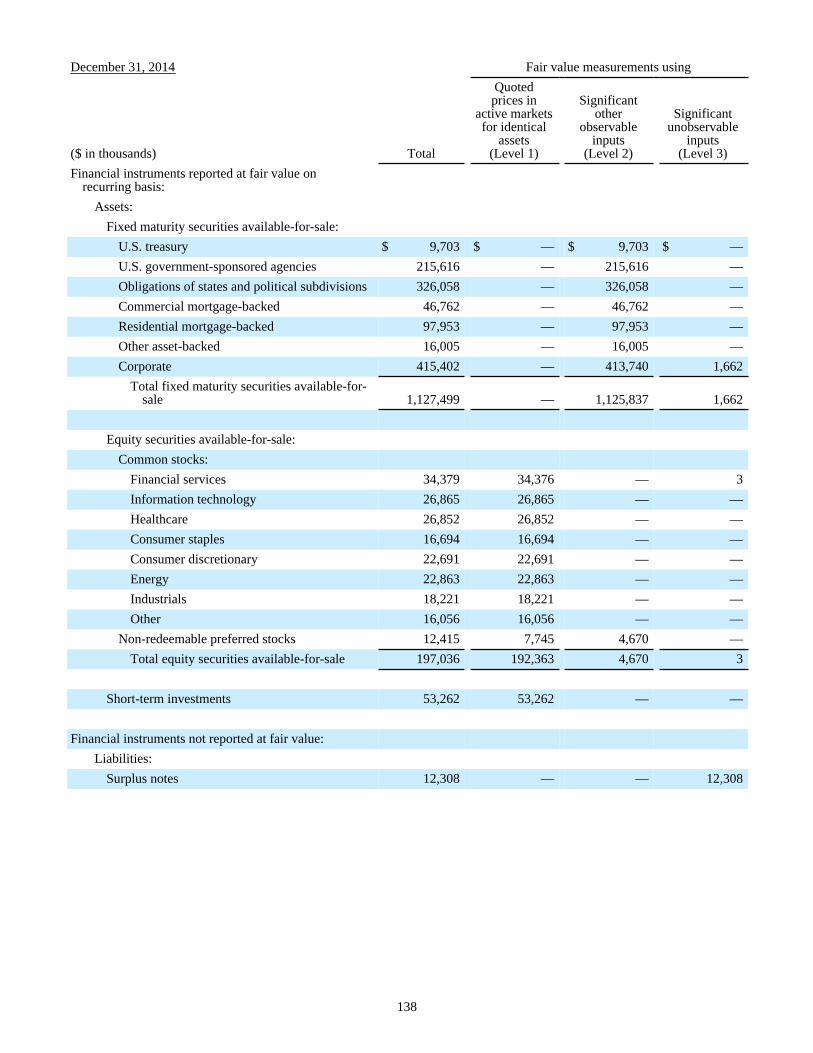
138
December 31, 2014 Fair value measurements using
($ in thousands) Total
Quotedprices in
active marketsfor identical
assets(Level 1)
Significantother
observableinputs
(Level 2)
Significantunobservable
inputs(Level 3)
Financial instruments reported at fair value onrecurring basis:
Assets:Fixed maturity securities available-for-sale:
U.S. treasury $ 9,703 $ — $ 9,703 $ —U.S. government-sponsored agencies 215,616 — 215,616 —Obligations of states and political subdivisions 326,058 — 326,058 —Commercial mortgage-backed 46,762 — 46,762 —Residential mortgage-backed 97,953 — 97,953 —Other asset-backed 16,005 — 16,005 —Corporate 415,402 — 413,740 1,662
Total fixed maturity securities available-for-sale 1,127,499 — 1,125,837 1,662
Equity securities available-for-sale:Common stocks:
Financial services 34,379 34,376 — 3Information technology 26,865 26,865 — —Healthcare 26,852 26,852 — —Consumer staples 16,694 16,694 — —Consumer discretionary 22,691 22,691 — —Energy 22,863 22,863 — —Industrials 18,221 18,221 — —Other 16,056 16,056 — —
Non-redeemable preferred stocks 12,415 7,745 4,670 —Total equity securities available-for-sale 197,036 192,363 4,670 3
Short-term investments 53,262 53,262 — —
Financial instruments not reported at fair value:Liabilities:
Surplus notes 12,308 — — 12,308
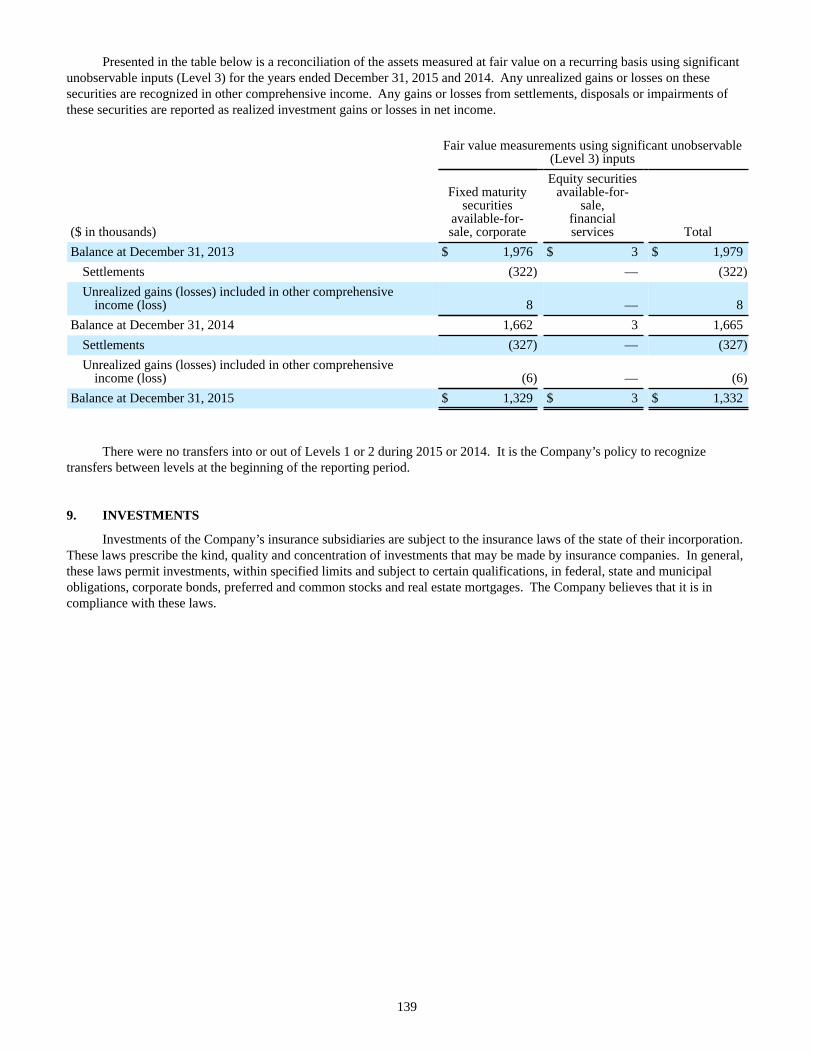
139
Presented in the table below is a reconciliation of the assets measured at fair value on a recurring basis using significant unobservable inputs (Level 3) for the years ended December 31, 2015 and 2014. Any unrealized gains or losses on these securities are recognized in other comprehensive income. Any gains or losses from settlements, disposals or impairments of these securities are reported as realized investment gains or losses in net income.
Fair value measurements using significant unobservable(Level 3) inputs
($ in thousands)
Fixed maturitysecurities
available-for-sale, corporate
Equity securitiesavailable-for-
sale,financialservices Total
Balance at December 31, 2013 $ 1,976 $ 3 $ 1,979Settlements (322) — (322)Unrealized gains (losses) included in other comprehensive
income (loss) 8 — 8Balance at December 31, 2014 1,662 3 1,665
Settlements (327) — (327)Unrealized gains (losses) included in other comprehensive
income (loss) (6) — (6)Balance at December 31, 2015 $ 1,329 $ 3 $ 1,332
There were no transfers into or out of Levels 1 or 2 during 2015 or 2014. It is the Company’s policy to recognize transfers between levels at the beginning of the reporting period.
9. INVESTMENTS
Investments of the Company’s insurance subsidiaries are subject to the insurance laws of the state of their incorporation.These laws prescribe the kind, quality and concentration of investments that may be made by insurance companies. In general, these laws permit investments, within specified limits and subject to certain qualifications, in federal, state and municipal obligations, corporate bonds, preferred and common stocks and real estate mortgages. The Company believes that it is in compliance with these laws.
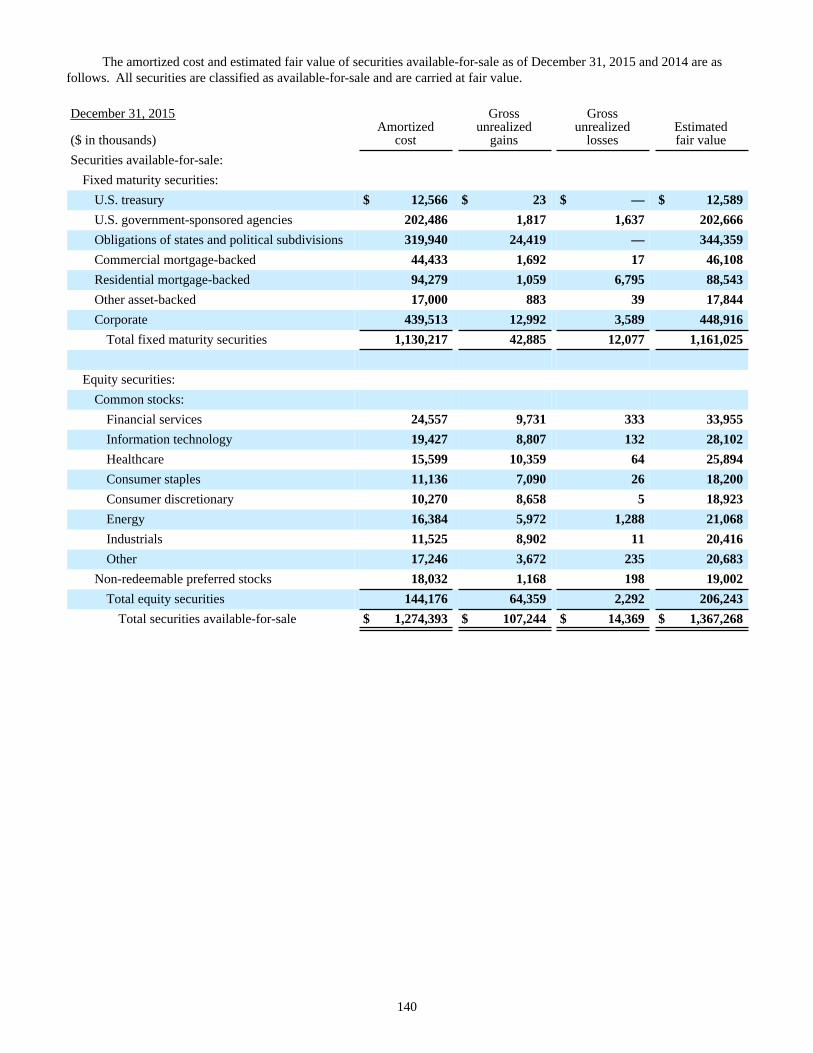
140
The amortized cost and estimated fair value of securities available-for-sale as of December 31, 2015 and 2014 are as follows. All securities are classified as available-for-sale and are carried at fair value.
December 31, 2015Amortized
cost
Grossunrealized
gains
Grossunrealized
lossesEstimatedfair value($ in thousands)
Securities available-for-sale:Fixed maturity securities:
U.S. treasury $ 12,566 $ 23 $ — $ 12,589U.S. government-sponsored agencies 202,486 1,817 1,637 202,666Obligations of states and political subdivisions 319,940 24,419 — 344,359Commercial mortgage-backed 44,433 1,692 17 46,108Residential mortgage-backed 94,279 1,059 6,795 88,543Other asset-backed 17,000 883 39 17,844Corporate 439,513 12,992 3,589 448,916
Total fixed maturity securities 1,130,217 42,885 12,077 1,161,025
Equity securities:Common stocks:
Financial services 24,557 9,731 333 33,955Information technology 19,427 8,807 132 28,102Healthcare 15,599 10,359 64 25,894Consumer staples 11,136 7,090 26 18,200Consumer discretionary 10,270 8,658 5 18,923Energy 16,384 5,972 1,288 21,068Industrials 11,525 8,902 11 20,416Other 17,246 3,672 235 20,683
Non-redeemable preferred stocks 18,032 1,168 198 19,002Total equity securities 144,176 64,359 2,292 206,243
Total securities available-for-sale $ 1,274,393 $ 107,244 $ 14,369 $ 1,367,268
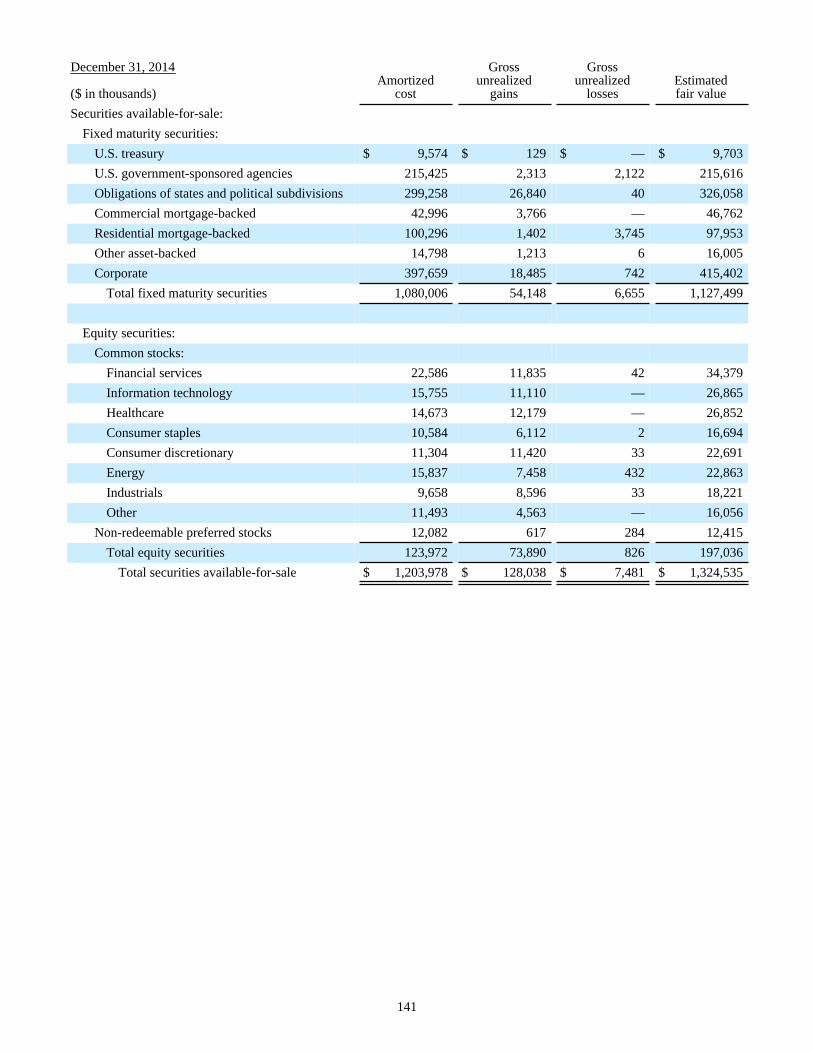
141
December 31, 2014Amortized
cost
Grossunrealized
gains
Grossunrealized
lossesEstimatedfair value($ in thousands)
Securities available-for-sale:Fixed maturity securities:
U.S. treasury $ 9,574 $ 129 $ — $ 9,703U.S. government-sponsored agencies 215,425 2,313 2,122 215,616Obligations of states and political subdivisions 299,258 26,840 40 326,058Commercial mortgage-backed 42,996 3,766 — 46,762Residential mortgage-backed 100,296 1,402 3,745 97,953Other asset-backed 14,798 1,213 6 16,005Corporate 397,659 18,485 742 415,402
Total fixed maturity securities 1,080,006 54,148 6,655 1,127,499
Equity securities:Common stocks:
Financial services 22,586 11,835 42 34,379Information technology 15,755 11,110 — 26,865Healthcare 14,673 12,179 — 26,852Consumer staples 10,584 6,112 2 16,694Consumer discretionary 11,304 11,420 33 22,691Energy 15,837 7,458 432 22,863Industrials 9,658 8,596 33 18,221Other 11,493 4,563 — 16,056
Non-redeemable preferred stocks 12,082 617 284 12,415Total equity securities 123,972 73,890 826 197,036
Total securities available-for-sale $ 1,203,978 $ 128,038 $ 7,481 $ 1,324,535
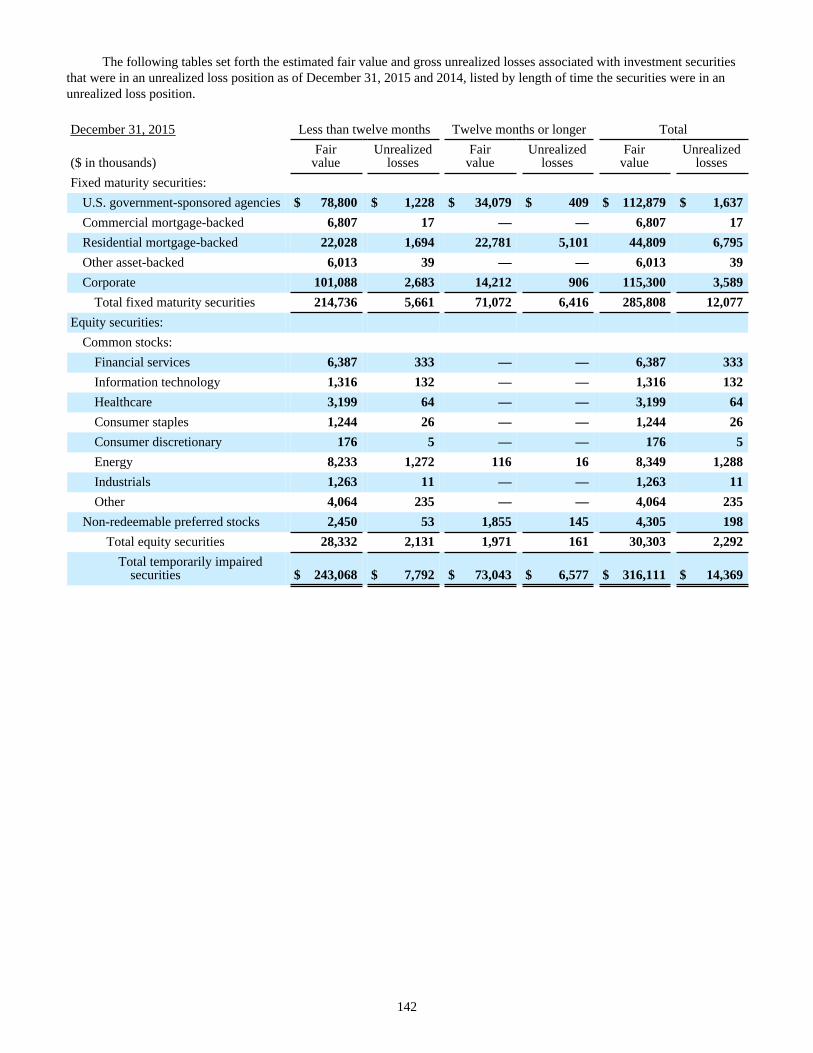
142
The following tables set forth the estimated fair value and gross unrealized losses associated with investment securities that were in an unrealized loss position as of December 31, 2015 and 2014, listed by length of time the securities were in an unrealized loss position.
December 31, 2015 Less than twelve months Twelve months or longer Total
($ in thousands)Fair
valueUnrealized
lossesFair
valueUnrealized
lossesFair
valueUnrealized
lossesFixed maturity securities:
U.S. government-sponsored agencies $ 78,800 $ 1,228 $ 34,079 $ 409 $ 112,879 $ 1,637Commercial mortgage-backed 6,807 17 — — 6,807 17Residential mortgage-backed 22,028 1,694 22,781 5,101 44,809 6,795Other asset-backed 6,013 39 — — 6,013 39Corporate 101,088 2,683 14,212 906 115,300 3,589
Total fixed maturity securities 214,736 5,661 71,072 6,416 285,808 12,077Equity securities:
Common stocks:Financial services 6,387 333 — — 6,387 333Information technology 1,316 132 — — 1,316 132Healthcare 3,199 64 — — 3,199 64Consumer staples 1,244 26 — — 1,244 26Consumer discretionary 176 5 — — 176 5Energy 8,233 1,272 116 16 8,349 1,288Industrials 1,263 11 — — 1,263 11Other 4,064 235 — — 4,064 235
Non-redeemable preferred stocks 2,450 53 1,855 145 4,305 198Total equity securities 28,332 2,131 1,971 161 30,303 2,292
Total temporarily impairedsecurities $ 243,068 $ 7,792 $ 73,043 $ 6,577 $ 316,111 $ 14,369
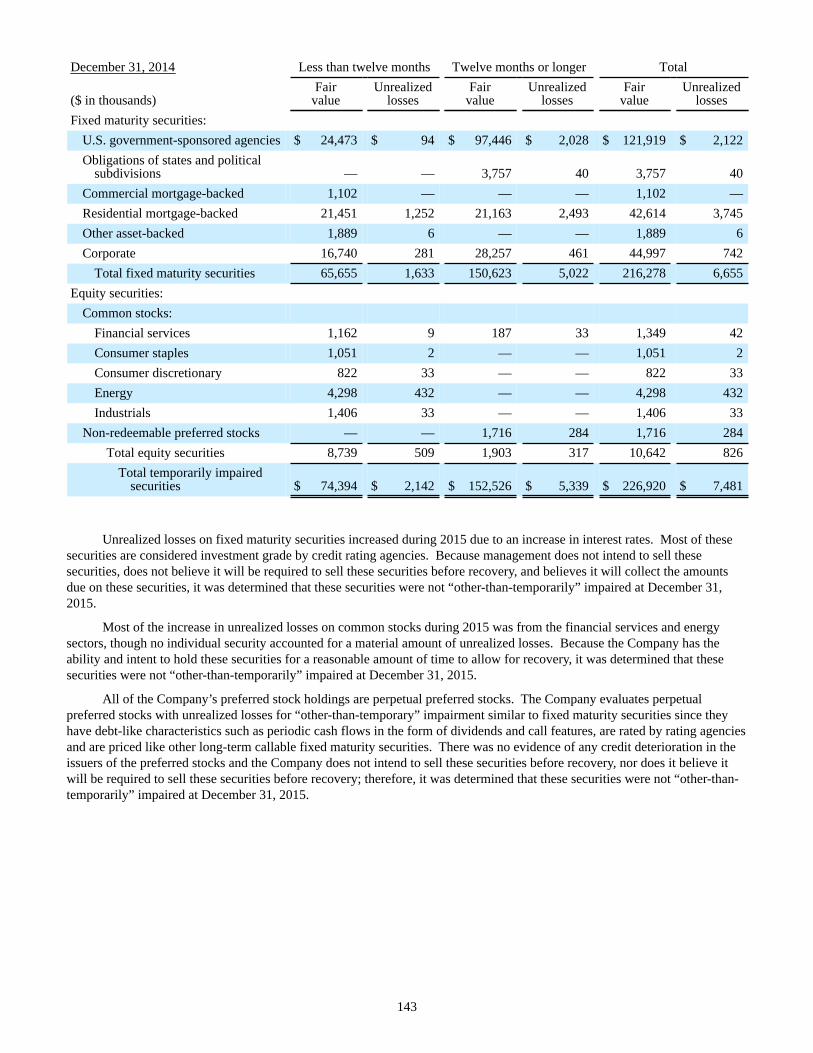
143
December 31, 2014 Less than twelve months Twelve months or longer Total
($ in thousands)Fair
valueUnrealized
lossesFair
valueUnrealized
lossesFair
valueUnrealized
lossesFixed maturity securities:
U.S. government-sponsored agencies $ 24,473 $ 94 $ 97,446 $ 2,028 $ 121,919 $ 2,122Obligations of states and political
subdivisions — — 3,757 40 3,757 40Commercial mortgage-backed 1,102 — — — 1,102 —Residential mortgage-backed 21,451 1,252 21,163 2,493 42,614 3,745Other asset-backed 1,889 6 — — 1,889 6Corporate 16,740 281 28,257 461 44,997 742
Total fixed maturity securities 65,655 1,633 150,623 5,022 216,278 6,655Equity securities:
Common stocks:Financial services 1,162 9 187 33 1,349 42Consumer staples 1,051 2 — — 1,051 2Consumer discretionary 822 33 — — 822 33Energy 4,298 432 — — 4,298 432Industrials 1,406 33 — — 1,406 33
Non-redeemable preferred stocks — — 1,716 284 1,716 284Total equity securities 8,739 509 1,903 317 10,642 826
Total temporarily impairedsecurities $ 74,394 $ 2,142 $ 152,526 $ 5,339 $ 226,920 $ 7,481
Unrealized losses on fixed maturity securities increased during 2015 due to an increase in interest rates. Most of these securities are considered investment grade by credit rating agencies. Because management does not intend to sell these securities, does not believe it will be required to sell these securities before recovery, and believes it will collect the amounts due on these securities, it was determined that these securities were not “other-than-temporarily” impaired at December 31, 2015.
Most of the increase in unrealized losses on common stocks during 2015 was from the financial services and energy sectors, though no individual security accounted for a material amount of unrealized losses. Because the Company has the ability and intent to hold these securities for a reasonable amount of time to allow for recovery, it was determined that these securities were not “other-than-temporarily” impaired at December 31, 2015.
All of the Company’s preferred stock holdings are perpetual preferred stocks. The Company evaluates perpetual preferred stocks with unrealized losses for “other-than-temporary” impairment similar to fixed maturity securities since they have debt-like characteristics such as periodic cash flows in the form of dividends and call features, are rated by rating agencies and are priced like other long-term callable fixed maturity securities. There was no evidence of any credit deterioration in the issuers of the preferred stocks and the Company does not intend to sell these securities before recovery, nor does it believe it will be required to sell these securities before recovery; therefore, it was determined that these securities were not “other-than-temporarily” impaired at December 31, 2015.
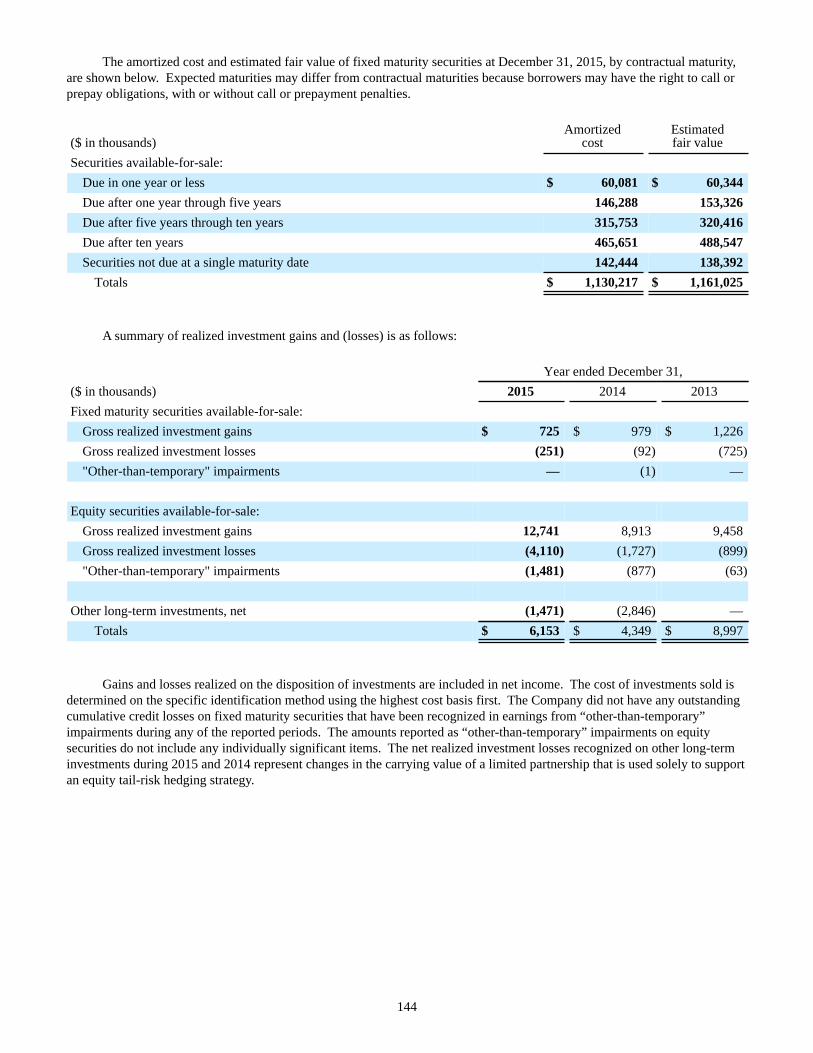
144
The amortized cost and estimated fair value of fixed maturity securities at December 31, 2015, by contractual maturity, are shown below. Expected maturities may differ from contractual maturities because borrowers may have the right to call or prepay obligations, with or without call or prepayment penalties.
($ in thousands)Amortized
costEstimatedfair value
Securities available-for-sale:Due in one year or less $ 60,081 $ 60,344Due after one year through five years 146,288 153,326Due after five years through ten years 315,753 320,416Due after ten years 465,651 488,547Securities not due at a single maturity date 142,444 138,392
Totals $ 1,130,217 $ 1,161,025
A summary of realized investment gains and (losses) is as follows:
Year ended December 31,($ in thousands) 2015 2014 2013Fixed maturity securities available-for-sale:
Gross realized investment gains $ 725 $ 979 $ 1,226Gross realized investment losses (251) (92) (725)"Other-than-temporary" impairments — (1) —
Equity securities available-for-sale:Gross realized investment gains 12,741 8,913 9,458Gross realized investment losses (4,110) (1,727) (899)"Other-than-temporary" impairments (1,481) (877) (63)
Other long-term investments, net (1,471) (2,846) —Totals $ 6,153 $ 4,349 $ 8,997
Gains and losses realized on the disposition of investments are included in net income. The cost of investments sold is determined on the specific identification method using the highest cost basis first. The Company did not have any outstanding cumulative credit losses on fixed maturity securities that have been recognized in earnings from “other-than-temporary” impairments during any of the reported periods. The amounts reported as “other-than-temporary” impairments on equity securities do not include any individually significant items. The net realized investment losses recognized on other long-term investments during 2015 and 2014 represent changes in the carrying value of a limited partnership that is used solely to support an equity tail-risk hedging strategy.
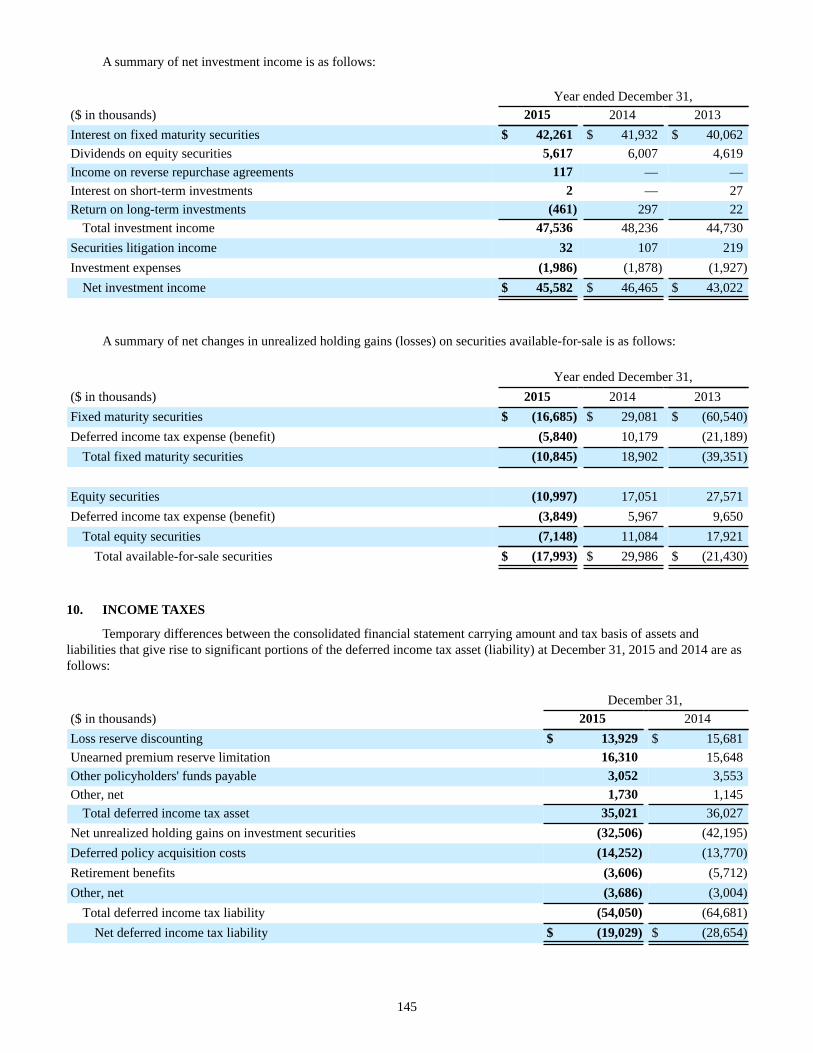
145
A summary of net investment income is as follows:
Year ended December 31,($ in thousands) 2015 2014 2013Interest on fixed maturity securities $ 42,261 $ 41,932 $ 40,062Dividends on equity securities 5,617 6,007 4,619Income on reverse repurchase agreements 117 — —Interest on short-term investments 2 — 27Return on long-term investments (461) 297 22
Total investment income 47,536 48,236 44,730Securities litigation income 32 107 219Investment expenses (1,986) (1,878) (1,927)
Net investment income $ 45,582 $ 46,465 $ 43,022
A summary of net changes in unrealized holding gains (losses) on securities available-for-sale is as follows:
Year ended December 31,($ in thousands) 2015 2014 2013Fixed maturity securities $ (16,685) $ 29,081 $ (60,540)Deferred income tax expense (benefit) (5,840) 10,179 (21,189)
Total fixed maturity securities (10,845) 18,902 (39,351)
Equity securities (10,997) 17,051 27,571Deferred income tax expense (benefit) (3,849) 5,967 9,650
Total equity securities (7,148) 11,084 17,921Total available-for-sale securities $ (17,993) $ 29,986 $ (21,430)
10. INCOME TAXES
Temporary differences between the consolidated financial statement carrying amount and tax basis of assets andliabilities that give rise to significant portions of the deferred income tax asset (liability) at December 31, 2015 and 2014 are as follows:
December 31,($ in thousands) 2015 2014Loss reserve discounting $ 13,929 $ 15,681Unearned premium reserve limitation 16,310 15,648Other policyholders' funds payable 3,052 3,553Other, net 1,730 1,145
Total deferred income tax asset 35,021 36,027Net unrealized holding gains on investment securities (32,506) (42,195)Deferred policy acquisition costs (14,252) (13,770)Retirement benefits (3,606) (5,712)Other, net (3,686) (3,004)
Total deferred income tax liability (54,050) (64,681)Net deferred income tax liability $ (19,029) $ (28,654)
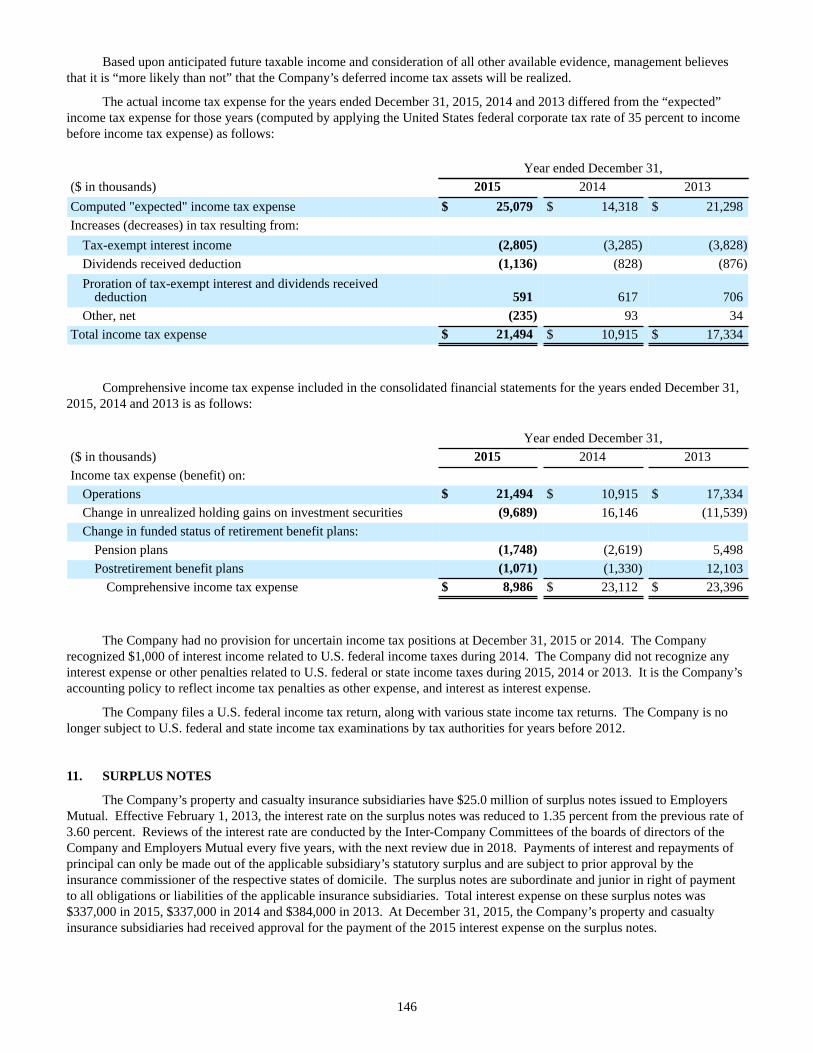
146
Based upon anticipated future taxable income and consideration of all other available evidence, management believes that it is “more likely than not” that the Company’s deferred income tax assets will be realized.
The actual income tax expense for the years ended December 31, 2015, 2014 and 2013 differed from the “expected” income tax expense for those years (computed by applying the United States federal corporate tax rate of 35 percent to income before income tax expense) as follows:
Year ended December 31,($ in thousands) 2015 2014 2013Computed "expected" income tax expense $ 25,079 $ 14,318 $ 21,298Increases (decreases) in tax resulting from:
Tax-exempt interest income (2,805) (3,285) (3,828)Dividends received deduction (1,136) (828) (876)Proration of tax-exempt interest and dividends received
deduction 591 617 706Other, net (235) 93 34
Total income tax expense $ 21,494 $ 10,915 $ 17,334
Comprehensive income tax expense included in the consolidated financial statements for the years ended December 31, 2015, 2014 and 2013 is as follows:
Year ended December 31,($ in thousands) 2015 2014 2013Income tax expense (benefit) on:
Operations $ 21,494 $ 10,915 $ 17,334Change in unrealized holding gains on investment securities (9,689) 16,146 (11,539)Change in funded status of retirement benefit plans:
Pension plans (1,748) (2,619) 5,498Postretirement benefit plans (1,071) (1,330) 12,103
Comprehensive income tax expense $ 8,986 $ 23,112 $ 23,396
The Company had no provision for uncertain income tax positions at December 31, 2015 or 2014. The Company recognized $1,000 of interest income related to U.S. federal income taxes during 2014. The Company did not recognize any interest expense or other penalties related to U.S. federal or state income taxes during 2015, 2014 or 2013. It is the Company’s accounting policy to reflect income tax penalties as other expense, and interest as interest expense.
The Company files a U.S. federal income tax return, along with various state income tax returns. The Company is no longer subject to U.S. federal and state income tax examinations by tax authorities for years before 2012.
11. SURPLUS NOTES
The Company’s property and casualty insurance subsidiaries have $25.0 million of surplus notes issued to EmployersMutual. Effective February 1, 2013, the interest rate on the surplus notes was reduced to 1.35 percent from the previous rate of 3.60 percent. Reviews of the interest rate are conducted by the Inter-Company Committees of the boards of directors of the Company and Employers Mutual every five years, with the next review due in 2018. Payments of interest and repayments of principal can only be made out of the applicable subsidiary’s statutory surplus and are subject to prior approval by the insurance commissioner of the respective states of domicile. The surplus notes are subordinate and junior in right of payment to all obligations or liabilities of the applicable insurance subsidiaries. Total interest expense on these surplus notes was $337,000 in 2015, $337,000 in 2014 and $384,000 in 2013. At December 31, 2015, the Company’s property and casualty insurance subsidiaries had received approval for the payment of the 2015 interest expense on the surplus notes.
147
12. EMPLOYEE RETIREMENT PLANS
Employers Mutual has various employee benefit plans, including two defined benefit pension plans and twopostretirement benefit plans that provide retiree healthcare and life insurance benefits.
Employers Mutual’s pension plans include a qualified defined benefit pension plan and a non-qualified defined benefit supplemental pension plan. The qualified defined benefit plan covers substantially all of its employees. This plan is funded by employer contributions and provides benefits under two different formulas, depending on an employee’s age and date of service. Benefits generally vest after three years of service or the attainment of 55 years of age. It is Employers Mutual’s funding policy to make contributions sufficient to be in compliance with minimum regulatory funding requirements plus additional amounts as determined by management.
Employers Mutual’s non-qualified defined benefit supplemental pension plan provides retirement benefits for a select group of management and highly-compensated employees. This plan enables select employees to receive retirement benefits without the limit on compensation imposed on qualified defined benefit pension plans by the Internal Revenue Service (IRS) and to recognize compensation that has been deferred in the determination of retirement benefits. The plan is unfunded and benefits generally vest after three years of service.
Employers Mutual also offers postretirement benefit plans which provide certain health care and life insurance benefits for retired employees. Substantially all of its employees may become eligible for those benefits if they reach normal retirement age and have attained the required length of service while working for Employers Mutual. Through 2014, the health care postretirement plan required contributions from participants and contained certain cost sharing provisions such as coinsurance and deductibles. Effective January 1, 2015, the health care plan was replaced with a new Employers Mutual - funded Health Reimbursement Arrangement (HRA). Under the HRA, Employers Mutual reimburses participants, up to a pre-determined maximum, for amounts expended to enroll in publicly available health care plans and/or pay for qualifying out-of-pocket health care costs. The obligations of the HRA are based on the total amount of reimbursements expected to be made by Employers Mutual over the lives of the participants, rather than the total amount of medical benefits expected to be paid over the participants’ lives. Therefore, the obligations of the HRA are not impacted by changes in the cost of health care. The life insurance plan is noncontributory. The benefits provided under both plans are subject to change.
Employers Mutual maintains a Voluntary Employee Beneficiary Association (VEBA) trust that has historically been used to accumulate funds for the payment of postretirement health care and life insurance benefits. Contributions to the VEBA trust have been used to fund the projected postretirement benefit obligation, as well as pay benefits. Given the overfunded position of the postretirement benefit plans, contributions to the VEBA trust are not anticipated for the foreseeable future.
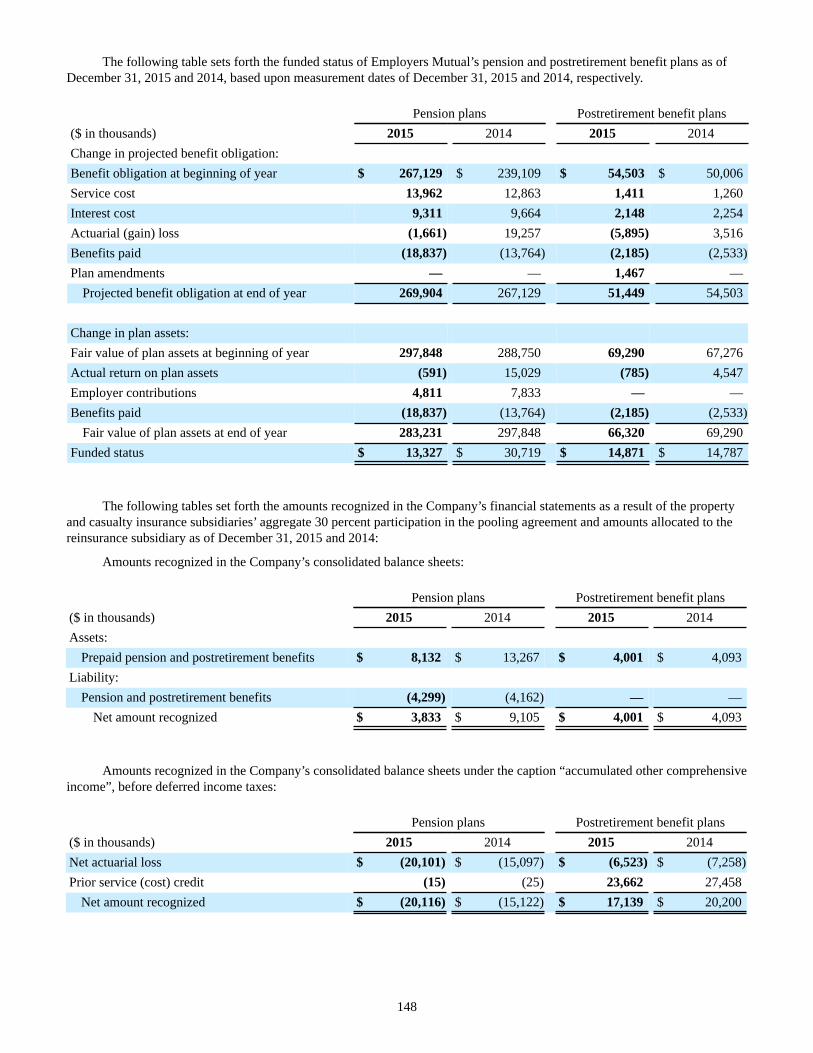
148
The following table sets forth the funded status of Employers Mutual’s pension and postretirement benefit plans as of December 31, 2015 and 2014, based upon measurement dates of December 31, 2015 and 2014, respectively.
Pension plans Postretirement benefit plans($ in thousands) 2015 2014 2015 2014Change in projected benefit obligation:Benefit obligation at beginning of year $ 267,129 $ 239,109 $ 54,503 $ 50,006Service cost 13,962 12,863 1,411 1,260Interest cost 9,311 9,664 2,148 2,254Actuarial (gain) loss (1,661) 19,257 (5,895) 3,516Benefits paid (18,837) (13,764) (2,185) (2,533)Plan amendments — — 1,467 —
Projected benefit obligation at end of year 269,904 267,129 51,449 54,503
Change in plan assets:Fair value of plan assets at beginning of year 297,848 288,750 69,290 67,276Actual return on plan assets (591) 15,029 (785) 4,547Employer contributions 4,811 7,833 — —Benefits paid (18,837) (13,764) (2,185) (2,533)
Fair value of plan assets at end of year 283,231 297,848 66,320 69,290Funded status $ 13,327 $ 30,719 $ 14,871 $ 14,787
The following tables set forth the amounts recognized in the Company’s financial statements as a result of the property and casualty insurance subsidiaries’ aggregate 30 percent participation in the pooling agreement and amounts allocated to the reinsurance subsidiary as of December 31, 2015 and 2014:
Amounts recognized in the Company’s consolidated balance sheets:
Pension plans Postretirement benefit plans($ in thousands) 2015 2014 2015 2014Assets:
Prepaid pension and postretirement benefits $ 8,132 $ 13,267 $ 4,001 $ 4,093Liability:
Pension and postretirement benefits (4,299) (4,162) — —Net amount recognized $ 3,833 $ 9,105 $ 4,001 $ 4,093
Amounts recognized in the Company’s consolidated balance sheets under the caption “accumulated other comprehensive income”, before deferred income taxes:
Pension plans Postretirement benefit plans($ in thousands) 2015 2014 2015 2014Net actuarial loss $ (20,101) $ (15,097) $ (6,523) $ (7,258)Prior service (cost) credit (15) (25) 23,662 27,458
Net amount recognized $ (20,116) $ (15,122) $ 17,139 $ 20,200
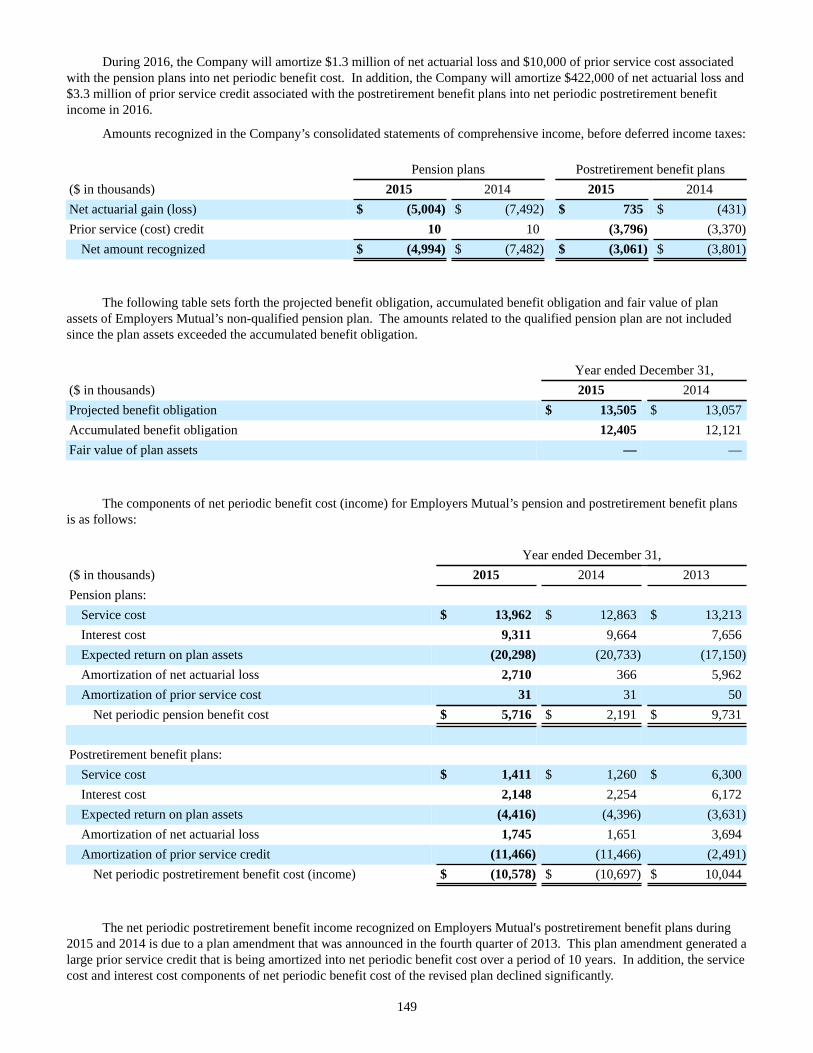
149
During 2016, the Company will amortize $1.3 million of net actuarial loss and $10,000 of prior service cost associated with the pension plans into net periodic benefit cost. In addition, the Company will amortize $422,000 of net actuarial loss and $3.3 million of prior service credit associated with the postretirement benefit plans into net periodic postretirement benefit income in 2016.
Amounts recognized in the Company’s consolidated statements of comprehensive income, before deferred income taxes:
Pension plans Postretirement benefit plans($ in thousands) 2015 2014 2015 2014Net actuarial gain (loss) $ (5,004) $ (7,492) $ 735 $ (431)Prior service (cost) credit 10 10 (3,796) (3,370)
Net amount recognized $ (4,994) $ (7,482) $ (3,061) $ (3,801)
The following table sets forth the projected benefit obligation, accumulated benefit obligation and fair value of plan assets of Employers Mutual’s non-qualified pension plan. The amounts related to the qualified pension plan are not included since the plan assets exceeded the accumulated benefit obligation.
Year ended December 31,($ in thousands) 2015 2014Projected benefit obligation $ 13,505 $ 13,057Accumulated benefit obligation 12,405 12,121Fair value of plan assets — —
The components of net periodic benefit cost (income) for Employers Mutual’s pension and postretirement benefit plans is as follows:
Year ended December 31,($ in thousands) 2015 2014 2013Pension plans:
Service cost $ 13,962 $ 12,863 $ 13,213Interest cost 9,311 9,664 7,656Expected return on plan assets (20,298) (20,733) (17,150)Amortization of net actuarial loss 2,710 366 5,962Amortization of prior service cost 31 31 50
Net periodic pension benefit cost $ 5,716 $ 2,191 $ 9,731
Postretirement benefit plans:Service cost $ 1,411 $ 1,260 $ 6,300Interest cost 2,148 2,254 6,172Expected return on plan assets (4,416) (4,396) (3,631)Amortization of net actuarial loss 1,745 1,651 3,694Amortization of prior service credit (11,466) (11,466) (2,491)
Net periodic postretirement benefit cost (income) $ (10,578) $ (10,697) $ 10,044
The net periodic postretirement benefit income recognized on Employers Mutual's postretirement benefit plans during 2015 and 2014 is due to a plan amendment that was announced in the fourth quarter of 2013. This plan amendment generated a large prior service credit that is being amortized into net periodic benefit cost over a period of 10 years. In addition, the service cost and interest cost components of net periodic benefit cost of the revised plan declined significantly.
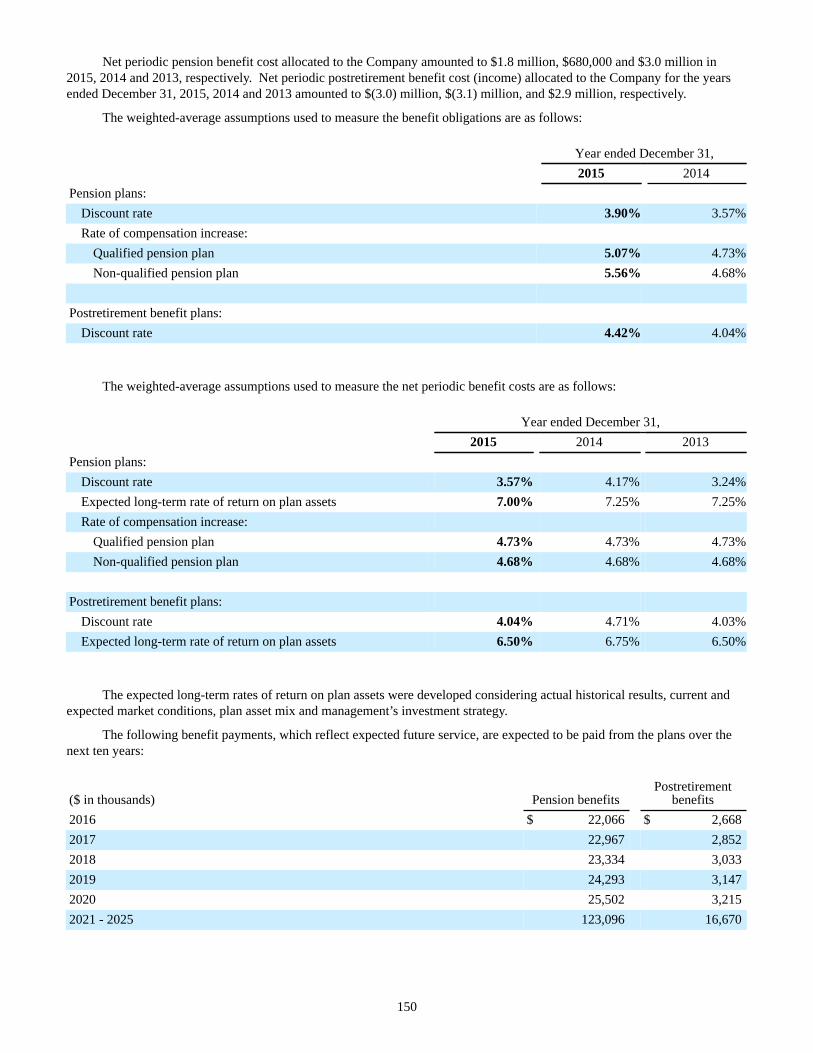
150
Net periodic pension benefit cost allocated to the Company amounted to $1.8 million, $680,000 and $3.0 million in 2015, 2014 and 2013, respectively. Net periodic postretirement benefit cost (income) allocated to the Company for the years ended December 31, 2015, 2014 and 2013 amounted to $(3.0) million, $(3.1) million, and $2.9 million, respectively.
The weighted-average assumptions used to measure the benefit obligations are as follows:
Year ended December 31,2015 2014
Pension plans:Discount rate 3.90% 3.57%Rate of compensation increase:
Qualified pension plan 5.07% 4.73%Non-qualified pension plan 5.56% 4.68%
Postretirement benefit plans:Discount rate 4.42% 4.04%
The weighted-average assumptions used to measure the net periodic benefit costs are as follows:
Year ended December 31,2015 2014 2013
Pension plans:Discount rate 3.57% 4.17% 3.24%Expected long-term rate of return on plan assets 7.00% 7.25% 7.25%Rate of compensation increase:
Qualified pension plan 4.73% 4.73% 4.73%Non-qualified pension plan 4.68% 4.68% 4.68%
Postretirement benefit plans:Discount rate 4.04% 4.71% 4.03%Expected long-term rate of return on plan assets 6.50% 6.75% 6.50%
The expected long-term rates of return on plan assets were developed considering actual historical results, current and expected market conditions, plan asset mix and management’s investment strategy.
The following benefit payments, which reflect expected future service, are expected to be paid from the plans over the next ten years:
($ in thousands) Pension benefitsPostretirement
benefits2016 $ 22,066 $ 2,6682017 22,967 2,8522018 23,334 3,0332019 24,293 3,1472020 25,502 3,2152021 - 2025 123,096 16,670
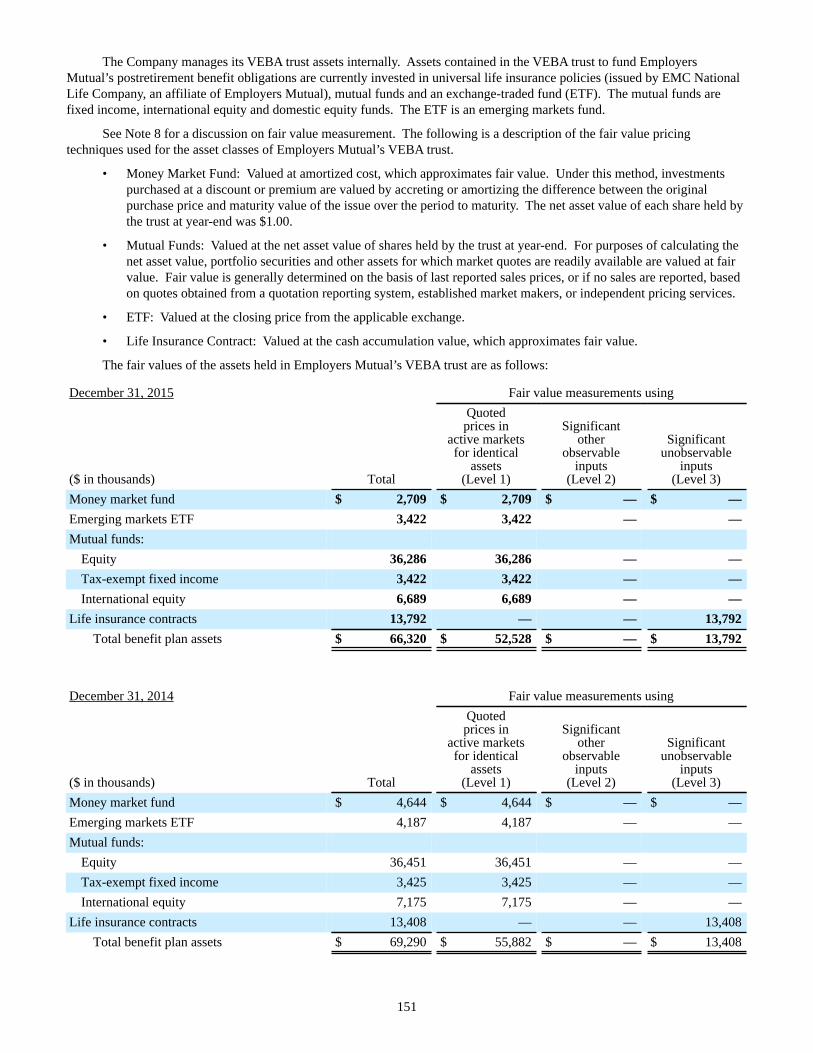
151
The Company manages its VEBA trust assets internally. Assets contained in the VEBA trust to fund Employers Mutual’s postretirement benefit obligations are currently invested in universal life insurance policies (issued by EMC National Life Company, an affiliate of Employers Mutual), mutual funds and an exchange-traded fund (ETF). The mutual funds are fixed income, international equity and domestic equity funds. The ETF is an emerging markets fund.
See Note 8 for a discussion on fair value measurement. The following is a description of the fair value pricing techniques used for the asset classes of Employers Mutual’s VEBA trust.
• Money Market Fund: Valued at amortized cost, which approximates fair value. Under this method, investmentspurchased at a discount or premium are valued by accreting or amortizing the difference between the originalpurchase price and maturity value of the issue over the period to maturity. The net asset value of each share held bythe trust at year-end was $1.00.
• Mutual Funds: Valued at the net asset value of shares held by the trust at year-end. For purposes of calculating thenet asset value, portfolio securities and other assets for which market quotes are readily available are valued at fairvalue. Fair value is generally determined on the basis of last reported sales prices, or if no sales are reported, basedon quotes obtained from a quotation reporting system, established market makers, or independent pricing services.
• ETF: Valued at the closing price from the applicable exchange.
• Life Insurance Contract: Valued at the cash accumulation value, which approximates fair value.
The fair values of the assets held in Employers Mutual’s VEBA trust are as follows:
December 31, 2015 Fair value measurements using
($ in thousands) Total
Quotedprices in
active marketsfor identical
assets(Level 1)
Significantother
observableinputs
(Level 2)
Significantunobservable
inputs(Level 3)
Money market fund $ 2,709 $ 2,709 $ — $ —Emerging markets ETF 3,422 3,422 — —Mutual funds:
Equity 36,286 36,286 — —Tax-exempt fixed income 3,422 3,422 — —International equity 6,689 6,689 — —
Life insurance contracts 13,792 — — 13,792Total benefit plan assets $ 66,320 $ 52,528 $ — $ 13,792
December 31, 2014 Fair value measurements using
($ in thousands) Total
Quotedprices in
active marketsfor identical
assets(Level 1)
Significantother
observableinputs
(Level 2)
Significantunobservable
inputs(Level 3)
Money market fund $ 4,644 $ 4,644 $ — $ —Emerging markets ETF 4,187 4,187 — —Mutual funds:
Equity 36,451 36,451 — —Tax-exempt fixed income 3,425 3,425 — —International equity 7,175 7,175 — —
Life insurance contracts 13,408 — — 13,408Total benefit plan assets $ 69,290 $ 55,882 $ — $ 13,408
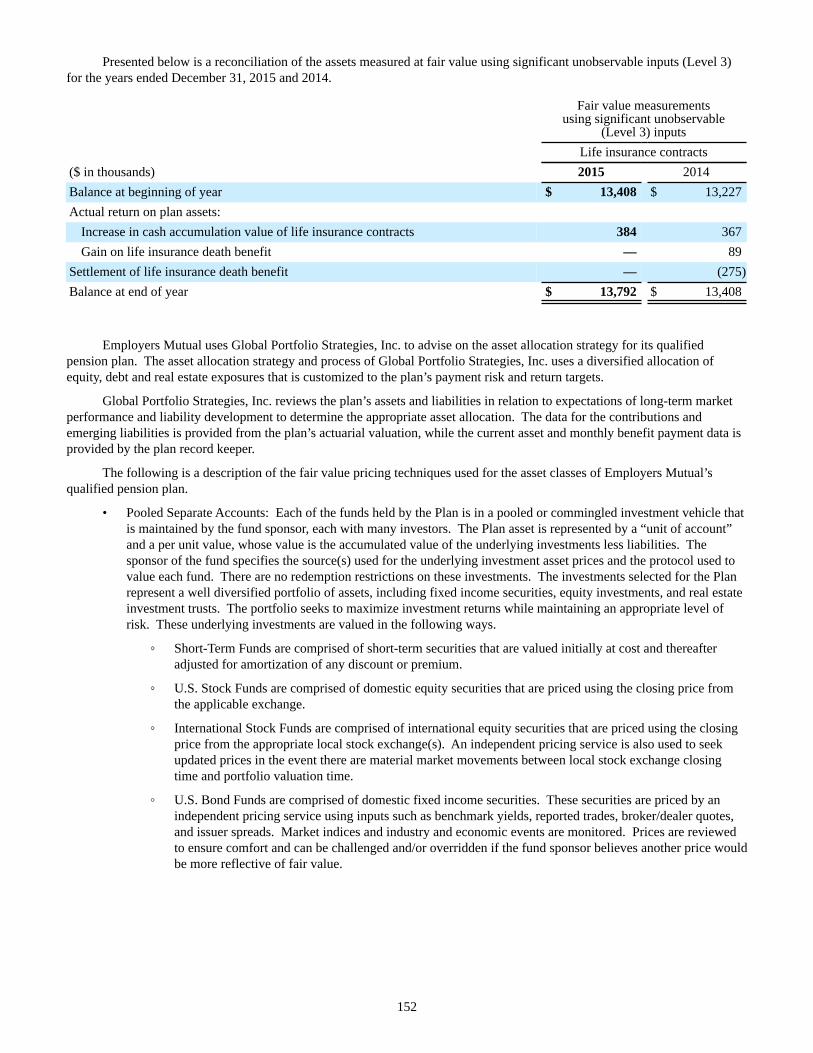
152
Presented below is a reconciliation of the assets measured at fair value using significant unobservable inputs (Level 3) for the years ended December 31, 2015 and 2014.
Fair value measurementsusing significant unobservable
(Level 3) inputsLife insurance contracts
($ in thousands) 2015 2014Balance at beginning of year $ 13,408 $ 13,227Actual return on plan assets:
Increase in cash accumulation value of life insurance contracts 384 367Gain on life insurance death benefit — 89
Settlement of life insurance death benefit — (275)Balance at end of year $ 13,792 $ 13,408
Employers Mutual uses Global Portfolio Strategies, Inc. to advise on the asset allocation strategy for its qualified pension plan. The asset allocation strategy and process of Global Portfolio Strategies, Inc. uses a diversified allocation of equity, debt and real estate exposures that is customized to the plan’s payment risk and return targets.
Global Portfolio Strategies, Inc. reviews the plan’s assets and liabilities in relation to expectations of long-term market performance and liability development to determine the appropriate asset allocation. The data for the contributions and emerging liabilities is provided from the plan’s actuarial valuation, while the current asset and monthly benefit payment data is provided by the plan record keeper.
The following is a description of the fair value pricing techniques used for the asset classes of Employers Mutual’s qualified pension plan.
• Pooled Separate Accounts: Each of the funds held by the Plan is in a pooled or commingled investment vehicle thatis maintained by the fund sponsor, each with many investors. The Plan asset is represented by a “unit of account”and a per unit value, whose value is the accumulated value of the underlying investments less liabilities. Thesponsor of the fund specifies the source(s) used for the underlying investment asset prices and the protocol used tovalue each fund. There are no redemption restrictions on these investments. The investments selected for the Planrepresent a well diversified portfolio of assets, including fixed income securities, equity investments, and real estateinvestment trusts. The portfolio seeks to maximize investment returns while maintaining an appropriate level ofrisk. These underlying investments are valued in the following ways.
Short-Term Funds are comprised of short-term securities that are valued initially at cost and thereafter adjusted for amortization of any discount or premium.
U.S. Stock Funds are comprised of domestic equity securities that are priced using the closing price from the applicable exchange.
International Stock Funds are comprised of international equity securities that are priced using the closing price from the appropriate local stock exchange(s). An independent pricing service is also used to seek updated prices in the event there are material market movements between local stock exchange closing time and portfolio valuation time.
U.S. Bond Funds are comprised of domestic fixed income securities. These securities are priced by an independent pricing service using inputs such as benchmark yields, reported trades, broker/dealer quotes, and issuer spreads. Market indices and industry and economic events are monitored. Prices are reviewed to ensure comfort and can be challenged and/or overridden if the fund sponsor believes another price would be more reflective of fair value.
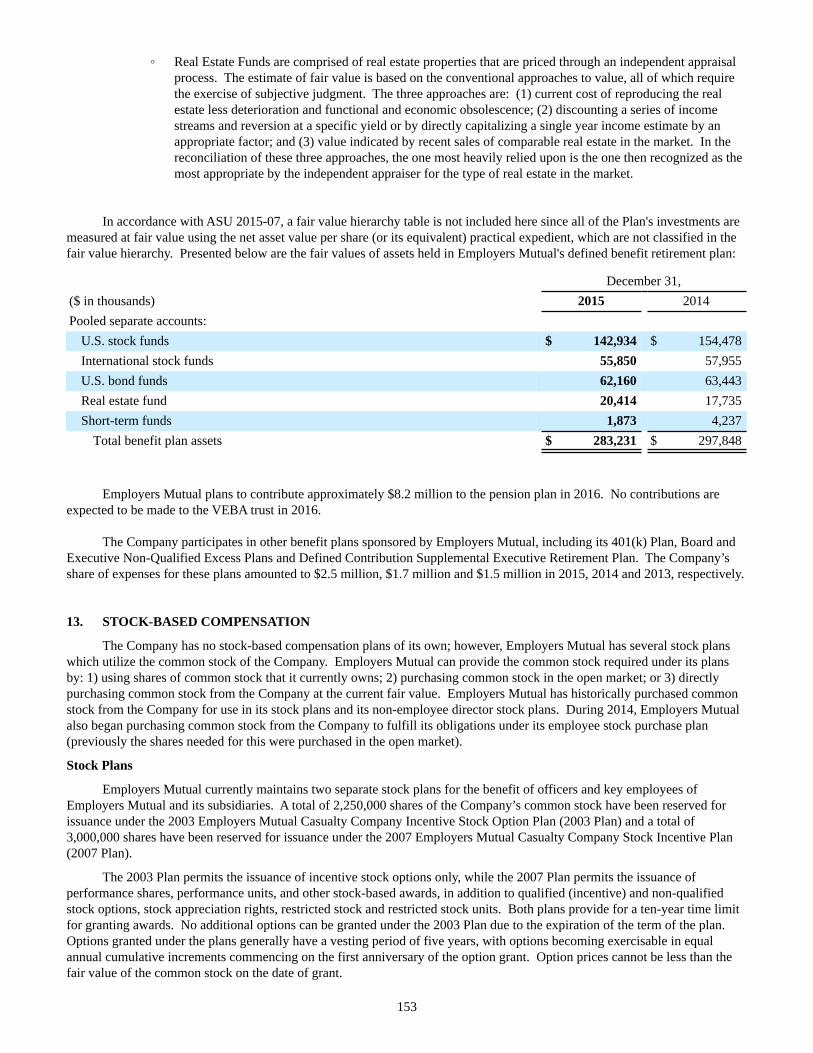
153
Real Estate Funds are comprised of real estate properties that are priced through an independent appraisal process. The estimate of fair value is based on the conventional approaches to value, all of which require the exercise of subjective judgment. The three approaches are: (1) current cost of reproducing the real estate less deterioration and functional and economic obsolescence; (2) discounting a series of income streams and reversion at a specific yield or by directly capitalizing a single year income estimate by an appropriate factor; and (3) value indicated by recent sales of comparable real estate in the market. In the reconciliation of these three approaches, the one most heavily relied upon is the one then recognized as the most appropriate by the independent appraiser for the type of real estate in the market.
In accordance with ASU 2015-07, a fair value hierarchy table is not included here since all of the Plan's investments are measured at fair value using the net asset value per share (or its equivalent) practical expedient, which are not classified in the fair value hierarchy. Presented below are the fair values of assets held in Employers Mutual's defined benefit retirement plan:
December 31,($ in thousands) 2015 2014Pooled separate accounts:
U.S. stock funds $ 142,934 $ 154,478International stock funds 55,850 57,955U.S. bond funds 62,160 63,443Real estate fund 20,414 17,735Short-term funds 1,873 4,237
Total benefit plan assets $ 283,231 $ 297,848
Employers Mutual plans to contribute approximately $8.2 million to the pension plan in 2016. No contributions are expected to be made to the VEBA trust in 2016.
The Company participates in other benefit plans sponsored by Employers Mutual, including its 401(k) Plan, Board and Executive Non-Qualified Excess Plans and Defined Contribution Supplemental Executive Retirement Plan. The Company’s share of expenses for these plans amounted to $2.5 million, $1.7 million and $1.5 million in 2015, 2014 and 2013, respectively.
13. STOCK-BASED COMPENSATION
The Company has no stock-based compensation plans of its own; however, Employers Mutual has several stock planswhich utilize the common stock of the Company. Employers Mutual can provide the common stock required under its plans by: 1) using shares of common stock that it currently owns; 2) purchasing common stock in the open market; or 3) directly purchasing common stock from the Company at the current fair value. Employers Mutual has historically purchased common stock from the Company for use in its stock plans and its non-employee director stock plans. During 2014, Employers Mutual also began purchasing common stock from the Company to fulfill its obligations under its employee stock purchase plan (previously the shares needed for this were purchased in the open market).
Stock Plans
Employers Mutual currently maintains two separate stock plans for the benefit of officers and key employees of Employers Mutual and its subsidiaries. A total of 2,250,000 shares of the Company’s common stock have been reserved for issuance under the 2003 Employers Mutual Casualty Company Incentive Stock Option Plan (2003 Plan) and a total of 3,000,000 shares have been reserved for issuance under the 2007 Employers Mutual Casualty Company Stock Incentive Plan (2007 Plan).
The 2003 Plan permits the issuance of incentive stock options only, while the 2007 Plan permits the issuance of performance shares, performance units, and other stock-based awards, in addition to qualified (incentive) and non-qualified stock options, stock appreciation rights, restricted stock and restricted stock units. Both plans provide for a ten-year time limit for granting awards. No additional options can be granted under the 2003 Plan due to the expiration of the term of the plan. Options granted under the plans generally have a vesting period of five years, with options becoming exercisable in equal annual cumulative increments commencing on the first anniversary of the option grant. Option prices cannot be less than the fair value of the common stock on the date of grant.
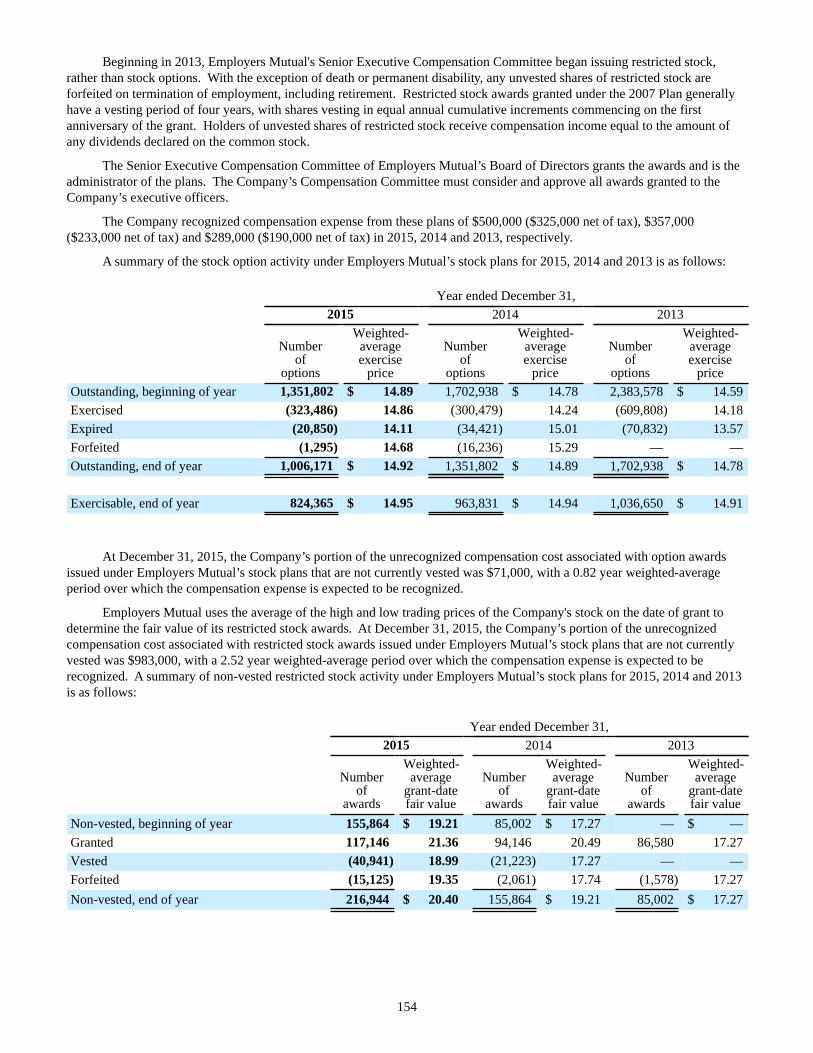
154
Beginning in 2013, Employers Mutual's Senior Executive Compensation Committee began issuing restricted stock, rather than stock options. With the exception of death or permanent disability, any unvested shares of restricted stock are forfeited on termination of employment, including retirement. Restricted stock awards granted under the 2007 Plan generally have a vesting period of four years, with shares vesting in equal annual cumulative increments commencing on the first anniversary of the grant. Holders of unvested shares of restricted stock receive compensation income equal to the amount of any dividends declared on the common stock.
The Senior Executive Compensation Committee of Employers Mutual’s Board of Directors grants the awards and is the administrator of the plans. The Company’s Compensation Committee must consider and approve all awards granted to the Company’s executive officers.
The Company recognized compensation expense from these plans of $500,000 ($325,000 net of tax), $357,000 ($233,000 net of tax) and $289,000 ($190,000 net of tax) in 2015, 2014 and 2013, respectively.
A summary of the stock option activity under Employers Mutual’s stock plans for 2015, 2014 and 2013 is as follows:
Year ended December 31,2015 2014 2013
Numberof
options
Weighted-averageexercise
price
Numberof
options
Weighted-averageexercise
price
Numberof
options
Weighted-averageexercise
priceOutstanding, beginning of year 1,351,802 $ 14.89 1,702,938 $ 14.78 2,383,578 $ 14.59Exercised (323,486) 14.86 (300,479) 14.24 (609,808) 14.18Expired (20,850) 14.11 (34,421) 15.01 (70,832) 13.57Forfeited (1,295) 14.68 (16,236) 15.29 — —Outstanding, end of year 1,006,171 $ 14.92 1,351,802 $ 14.89 1,702,938 $ 14.78
Exercisable, end of year 824,365 $ 14.95 963,831 $ 14.94 1,036,650 $ 14.91
At December 31, 2015, the Company’s portion of the unrecognized compensation cost associated with option awards issued under Employers Mutual’s stock plans that are not currently vested was $71,000, with a 0.82 year weighted-average period over which the compensation expense is expected to be recognized.
Employers Mutual uses the average of the high and low trading prices of the Company's stock on the date of grant to determine the fair value of its restricted stock awards. At December 31, 2015, the Company’s portion of the unrecognized compensation cost associated with restricted stock awards issued under Employers Mutual’s stock plans that are not currently vested was $983,000, with a 2.52 year weighted-average period over which the compensation expense is expected to be recognized. A summary of non-vested restricted stock activity under Employers Mutual’s stock plans for 2015, 2014 and 2013 is as follows:
Year ended December 31,2015 2014 2013
Numberof
awards
Weighted-average
grant-datefair value
Numberof
awards
Weighted-average
grant-datefair value
Numberof
awards
Weighted-average
grant-datefair value
Non-vested, beginning of year 155,864 $ 19.21 85,002 $ 17.27 — $ —Granted 117,146 21.36 94,146 20.49 86,580 17.27Vested (40,941) 18.99 (21,223) 17.27 — —Forfeited (15,125) 19.35 (2,061) 17.74 (1,578) 17.27Non-vested, end of year 216,944 $ 20.40 155,864 $ 19.21 85,002 $ 17.27
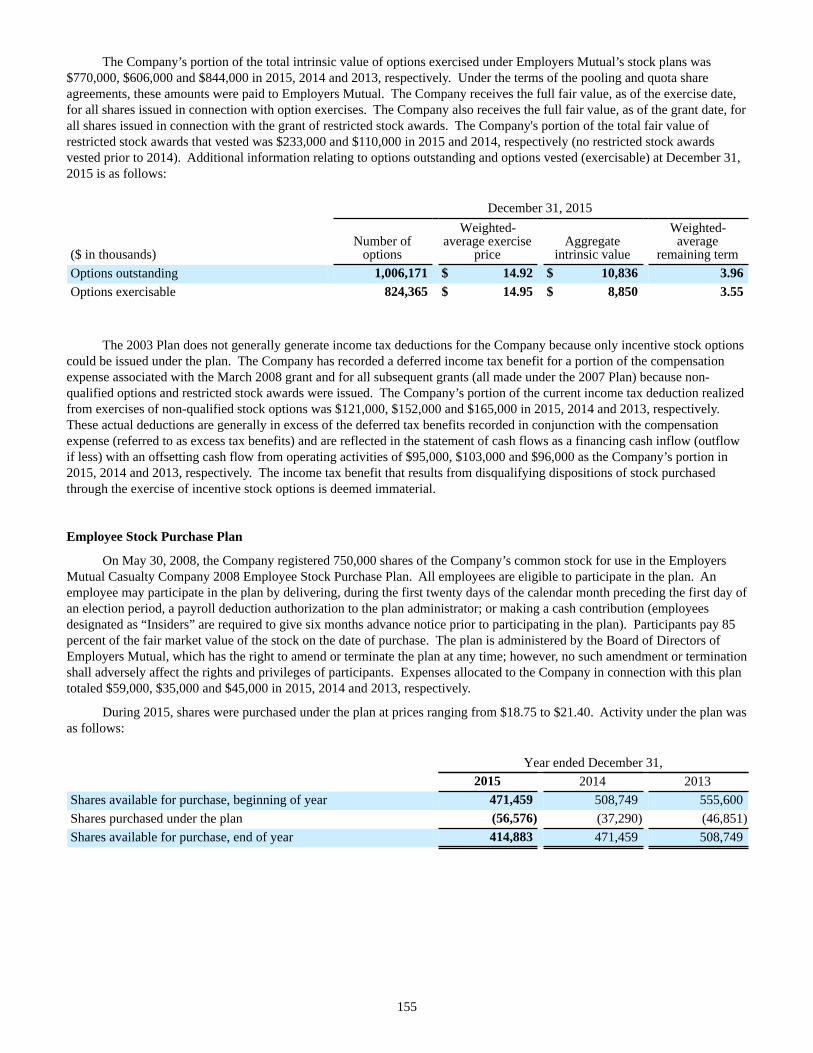
155
The Company’s portion of the total intrinsic value of options exercised under Employers Mutual’s stock plans was $770,000, $606,000 and $844,000 in 2015, 2014 and 2013, respectively. Under the terms of the pooling and quota share agreements, these amounts were paid to Employers Mutual. The Company receives the full fair value, as of the exercise date, for all shares issued in connection with option exercises. The Company also receives the full fair value, as of the grant date, for all shares issued in connection with the grant of restricted stock awards. The Company's portion of the total fair value of restricted stock awards that vested was $233,000 and $110,000 in 2015 and 2014, respectively (no restricted stock awards vested prior to 2014). Additional information relating to options outstanding and options vested (exercisable) at December 31, 2015 is as follows:
December 31, 2015
($ in thousands)Number of
options
Weighted-average exercise
priceAggregate
intrinsic value
Weighted-average
remaining termOptions outstanding 1,006,171 $ 14.92 $ 10,836 3.96Options exercisable 824,365 $ 14.95 $ 8,850 3.55
The 2003 Plan does not generally generate income tax deductions for the Company because only incentive stock options could be issued under the plan. The Company has recorded a deferred income tax benefit for a portion of the compensation expense associated with the March 2008 grant and for all subsequent grants (all made under the 2007 Plan) because non-qualified options and restricted stock awards were issued. The Company’s portion of the current income tax deduction realized from exercises of non-qualified stock options was $121,000, $152,000 and $165,000 in 2015, 2014 and 2013, respectively. These actual deductions are generally in excess of the deferred tax benefits recorded in conjunction with the compensation expense (referred to as excess tax benefits) and are reflected in the statement of cash flows as a financing cash inflow (outflow if less) with an offsetting cash flow from operating activities of $95,000, $103,000 and $96,000 as the Company’s portion in 2015, 2014 and 2013, respectively. The income tax benefit that results from disqualifying dispositions of stock purchased through the exercise of incentive stock options is deemed immaterial.
Employee Stock Purchase Plan
On May 30, 2008, the Company registered 750,000 shares of the Company’s common stock for use in the Employers Mutual Casualty Company 2008 Employee Stock Purchase Plan. All employees are eligible to participate in the plan. An employee may participate in the plan by delivering, during the first twenty days of the calendar month preceding the first day of an election period, a payroll deduction authorization to the plan administrator; or making a cash contribution (employees designated as “Insiders” are required to give six months advance notice prior to participating in the plan). Participants pay 85 percent of the fair market value of the stock on the date of purchase. The plan is administered by the Board of Directors of Employers Mutual, which has the right to amend or terminate the plan at any time; however, no such amendment or termination shall adversely affect the rights and privileges of participants. Expenses allocated to the Company in connection with this plan totaled $59,000, $35,000 and $45,000 in 2015, 2014 and 2013, respectively.
During 2015, shares were purchased under the plan at prices ranging from $18.75 to $21.40. Activity under the plan was as follows:
Year ended December 31,2015 2014 2013
Shares available for purchase, beginning of year 471,459 508,749 555,600Shares purchased under the plan (56,576) (37,290) (46,851)Shares available for purchase, end of year 414,883 471,459 508,749
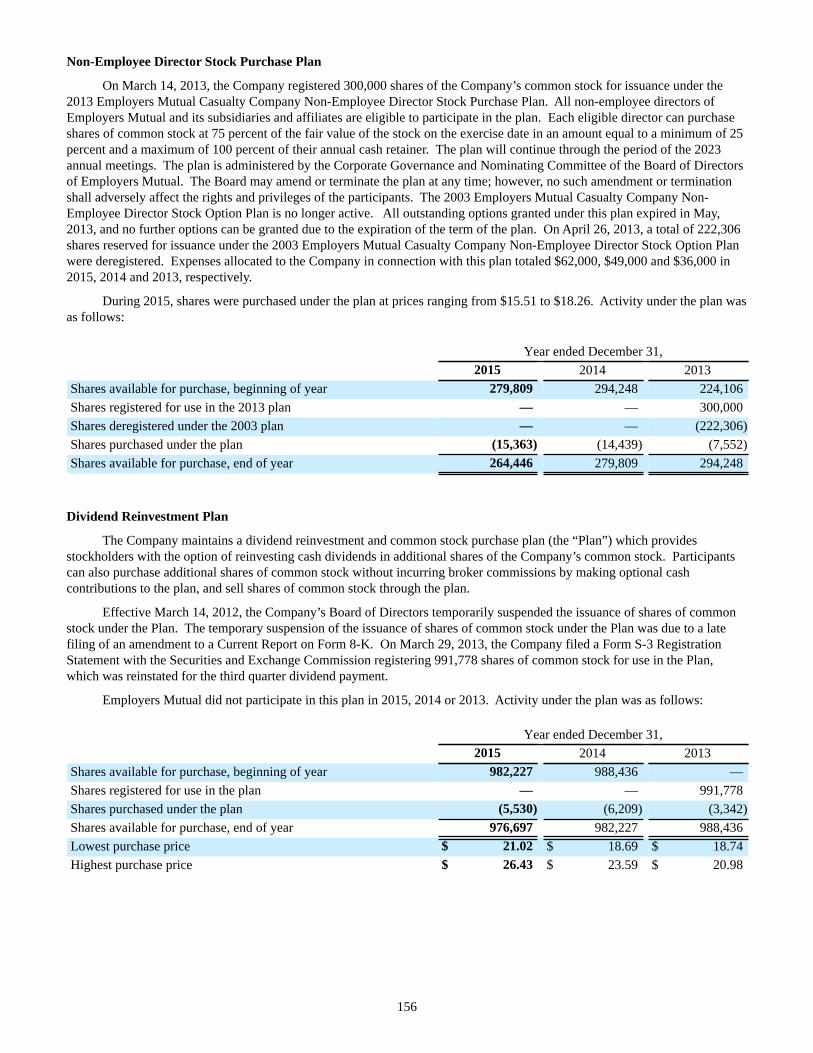
156
Non-Employee Director Stock Purchase Plan
On March 14, 2013, the Company registered 300,000 shares of the Company’s common stock for issuance under the 2013 Employers Mutual Casualty Company Non-Employee Director Stock Purchase Plan. All non-employee directors of Employers Mutual and its subsidiaries and affiliates are eligible to participate in the plan. Each eligible director can purchase shares of common stock at 75 percent of the fair value of the stock on the exercise date in an amount equal to a minimum of 25 percent and a maximum of 100 percent of their annual cash retainer. The plan will continue through the period of the 2023 annual meetings. The plan is administered by the Corporate Governance and Nominating Committee of the Board of Directors of Employers Mutual. The Board may amend or terminate the plan at any time; however, no such amendment or termination shall adversely affect the rights and privileges of the participants. The 2003 Employers Mutual Casualty Company Non-Employee Director Stock Option Plan is no longer active. All outstanding options granted under this plan expired in May, 2013, and no further options can be granted due to the expiration of the term of the plan. On April 26, 2013, a total of 222,306 shares reserved for issuance under the 2003 Employers Mutual Casualty Company Non-Employee Director Stock Option Plan were deregistered. Expenses allocated to the Company in connection with this plan totaled $62,000, $49,000 and $36,000 in 2015, 2014 and 2013, respectively.
During 2015, shares were purchased under the plan at prices ranging from $15.51 to $18.26. Activity under the plan was as follows:
Year ended December 31,2015 2014 2013
Shares available for purchase, beginning of year 279,809 294,248 224,106Shares registered for use in the 2013 plan — — 300,000Shares deregistered under the 2003 plan — — (222,306)Shares purchased under the plan (15,363) (14,439) (7,552)Shares available for purchase, end of year 264,446 279,809 294,248
Dividend Reinvestment Plan
The Company maintains a dividend reinvestment and common stock purchase plan (the “Plan”) which provides stockholders with the option of reinvesting cash dividends in additional shares of the Company’s common stock. Participants can also purchase additional shares of common stock without incurring broker commissions by making optional cash contributions to the plan, and sell shares of common stock through the plan.
Effective March 14, 2012, the Company’s Board of Directors temporarily suspended the issuance of shares of common stock under the Plan. The temporary suspension of the issuance of shares of common stock under the Plan was due to a late filing of an amendment to a Current Report on Form 8-K. On March 29, 2013, the Company filed a Form S-3 Registration Statement with the Securities and Exchange Commission registering 991,778 shares of common stock for use in the Plan, which was reinstated for the third quarter dividend payment.
Employers Mutual did not participate in this plan in 2015, 2014 or 2013. Activity under the plan was as follows:
Year ended December 31,2015 2014 2013
Shares available for purchase, beginning of year 982,227 988,436 —Shares registered for use in the plan — — 991,778Shares purchased under the plan (5,530) (6,209) (3,342)Shares available for purchase, end of year 976,697 982,227 988,436Lowest purchase price $ 21.02 $ 18.69 $ 18.74Highest purchase price $ 26.43 $ 23.59 $ 20.98
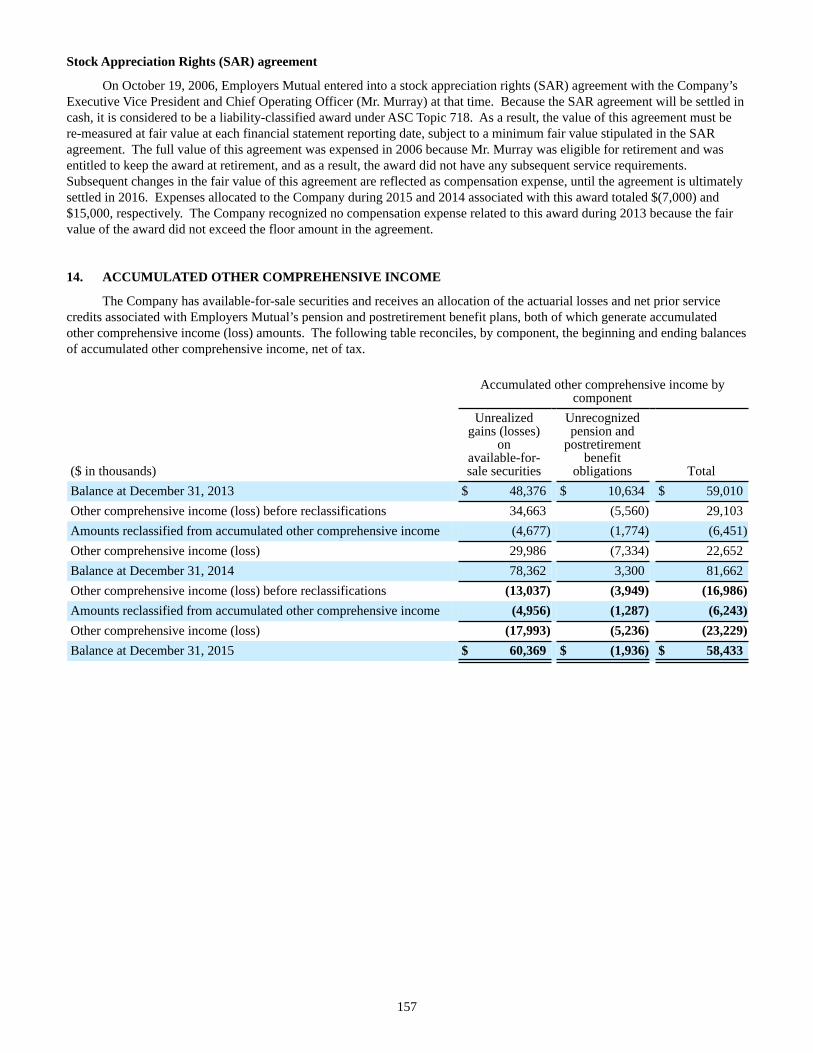
157
Stock Appreciation Rights (SAR) agreement
On October 19, 2006, Employers Mutual entered into a stock appreciation rights (SAR) agreement with the Company’s Executive Vice President and Chief Operating Officer (Mr. Murray) at that time. Because the SAR agreement will be settled in cash, it is considered to be a liability-classified award under ASC Topic 718. As a result, the value of this agreement must be re-measured at fair value at each financial statement reporting date, subject to a minimum fair value stipulated in the SAR agreement. The full value of this agreement was expensed in 2006 because Mr. Murray was eligible for retirement and was entitled to keep the award at retirement, and as a result, the award did not have any subsequent service requirements. Subsequent changes in the fair value of this agreement are reflected as compensation expense, until the agreement is ultimately settled in 2016. Expenses allocated to the Company during 2015 and 2014 associated with this award totaled $(7,000) and $15,000, respectively. The Company recognized no compensation expense related to this award during 2013 because the fair value of the award did not exceed the floor amount in the agreement.
14. ACCUMULATED OTHER COMPREHENSIVE INCOME
The Company has available-for-sale securities and receives an allocation of the actuarial losses and net prior servicecredits associated with Employers Mutual’s pension and postretirement benefit plans, both of which generate accumulated other comprehensive income (loss) amounts. The following table reconciles, by component, the beginning and ending balances of accumulated other comprehensive income, net of tax.
Accumulated other comprehensive income bycomponent
($ in thousands)
Unrealizedgains (losses)
onavailable-for-sale securities
Unrecognizedpension and
postretirementbenefit
obligations TotalBalance at December 31, 2013 $ 48,376 $ 10,634 $ 59,010Other comprehensive income (loss) before reclassifications 34,663 (5,560) 29,103Amounts reclassified from accumulated other comprehensive income (4,677) (1,774) (6,451)Other comprehensive income (loss) 29,986 (7,334) 22,652Balance at December 31, 2014 78,362 3,300 81,662Other comprehensive income (loss) before reclassifications (13,037) (3,949) (16,986)Amounts reclassified from accumulated other comprehensive income (4,956) (1,287) (6,243)Other comprehensive income (loss) (17,993) (5,236) (23,229)Balance at December 31, 2015 $ 60,369 $ (1,936) $ 58,433
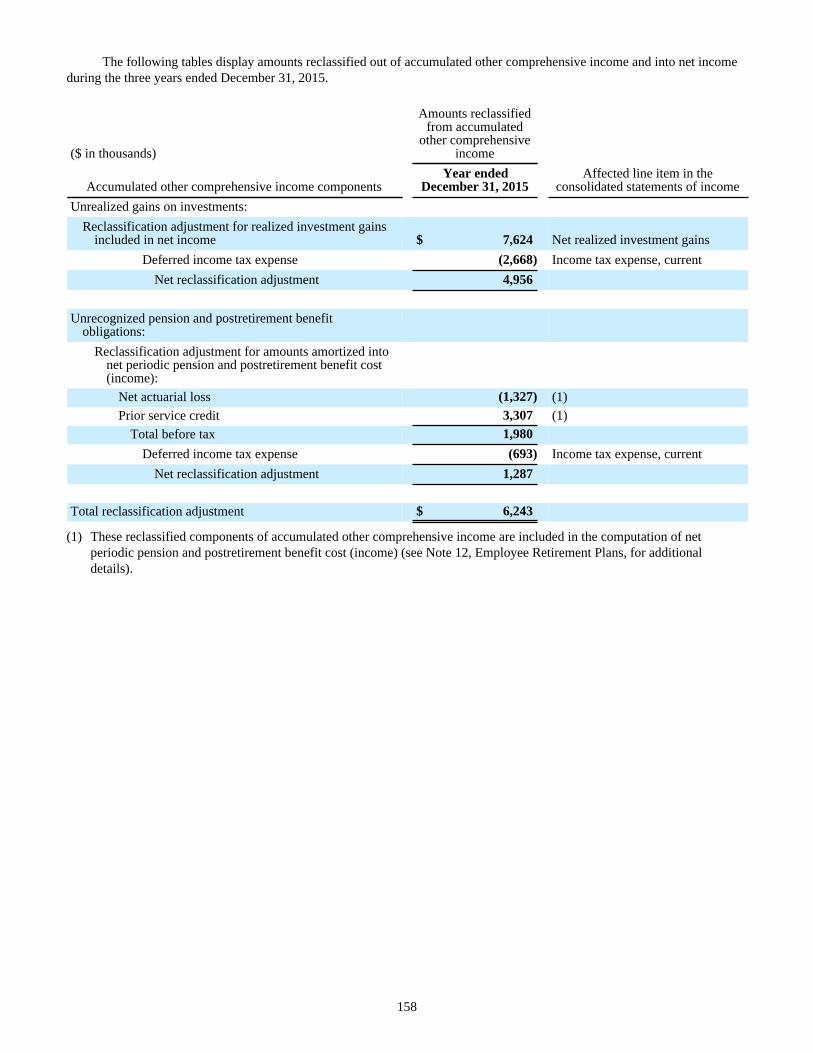
158
The following tables display amounts reclassified out of accumulated other comprehensive income and into net income during the three years ended December 31, 2015.
($ in thousands)
Amounts reclassifiedfrom accumulated
other comprehensiveincome
Accumulated other comprehensive income componentsYear ended
December 31, 2015Affected line item in the
consolidated statements of incomeUnrealized gains on investments:
Reclassification adjustment for realized investment gainsincluded in net income $ 7,624 Net realized investment gains
Deferred income tax expense (2,668) Income tax expense, currentNet reclassification adjustment 4,956
Unrecognized pension and postretirement benefitobligations:
Reclassification adjustment for amounts amortized intonet periodic pension and postretirement benefit cost(income):
Net actuarial loss (1,327) (1)Prior service credit 3,307 (1)
Total before tax 1,980Deferred income tax expense (693) Income tax expense, current
Net reclassification adjustment 1,287
Total reclassification adjustment $ 6,243
(1) These reclassified components of accumulated other comprehensive income are included in the computation of netperiodic pension and postretirement benefit cost (income) (see Note 12, Employee Retirement Plans, for additionaldetails).
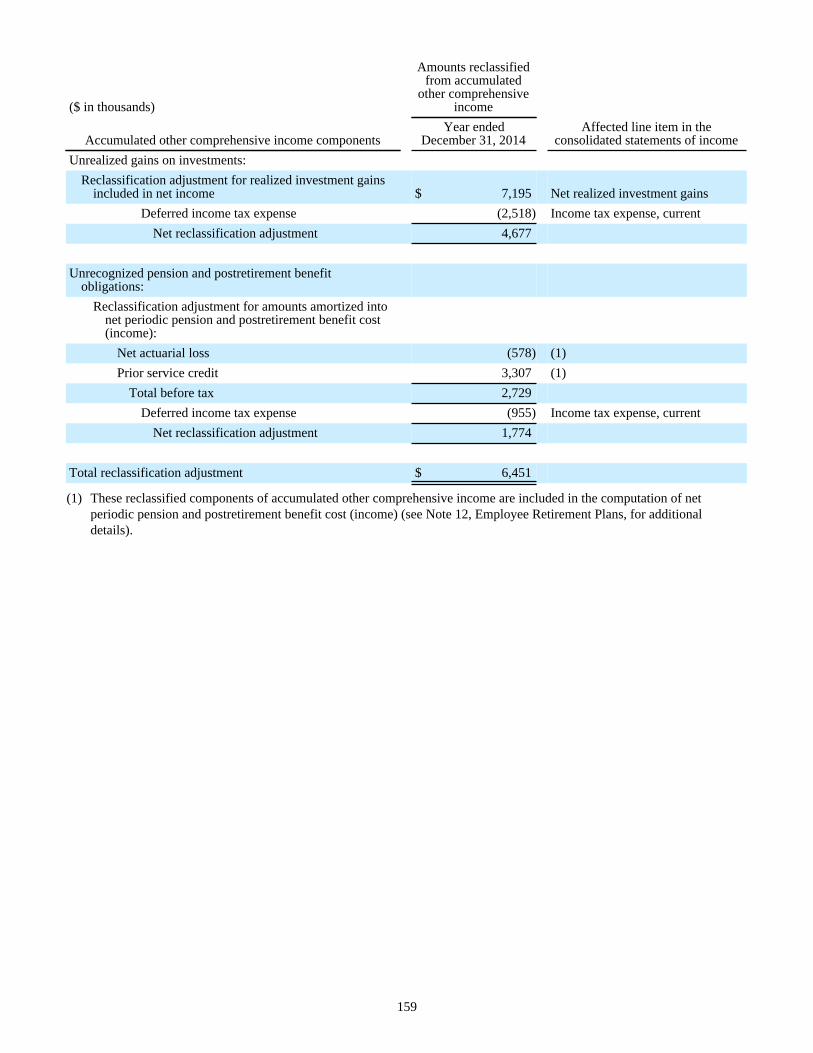
159
($ in thousands)
Amounts reclassifiedfrom accumulated
other comprehensiveincome
Accumulated other comprehensive income componentsYear ended
December 31, 2014Affected line item in the
consolidated statements of incomeUnrealized gains on investments:
Reclassification adjustment for realized investment gainsincluded in net income $ 7,195 Net realized investment gains
Deferred income tax expense (2,518) Income tax expense, currentNet reclassification adjustment 4,677
Unrecognized pension and postretirement benefitobligations:
Reclassification adjustment for amounts amortized intonet periodic pension and postretirement benefit cost(income):
Net actuarial loss (578) (1)Prior service credit 3,307 (1)
Total before tax 2,729Deferred income tax expense (955) Income tax expense, current
Net reclassification adjustment 1,774
Total reclassification adjustment $ 6,451
(1) These reclassified components of accumulated other comprehensive income are included in the computation of netperiodic pension and postretirement benefit cost (income) (see Note 12, Employee Retirement Plans, for additionaldetails).
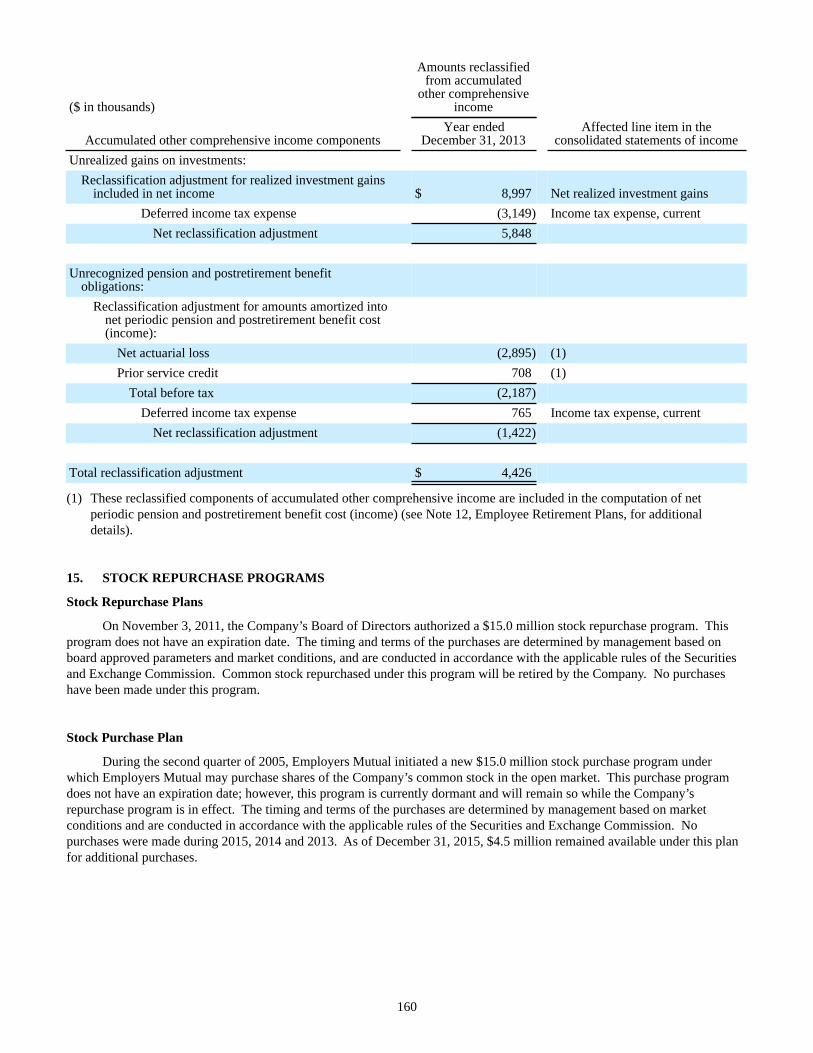
160
($ in thousands)
Amounts reclassifiedfrom accumulated
other comprehensiveincome
Accumulated other comprehensive income componentsYear ended
December 31, 2013Affected line item in the
consolidated statements of incomeUnrealized gains on investments:
Reclassification adjustment for realized investment gainsincluded in net income $ 8,997 Net realized investment gains
Deferred income tax expense (3,149) Income tax expense, currentNet reclassification adjustment 5,848
Unrecognized pension and postretirement benefitobligations:
Reclassification adjustment for amounts amortized intonet periodic pension and postretirement benefit cost(income):
Net actuarial loss (2,895) (1)Prior service credit 708 (1)
Total before tax (2,187)Deferred income tax expense 765 Income tax expense, current
Net reclassification adjustment (1,422)
Total reclassification adjustment $ 4,426
(1) These reclassified components of accumulated other comprehensive income are included in the computation of netperiodic pension and postretirement benefit cost (income) (see Note 12, Employee Retirement Plans, for additionaldetails).
15. STOCK REPURCHASE PROGRAMS
Stock Repurchase Plans
On November 3, 2011, the Company’s Board of Directors authorized a $15.0 million stock repurchase program. This program does not have an expiration date. The timing and terms of the purchases are determined by management based on board approved parameters and market conditions, and are conducted in accordance with the applicable rules of the Securities and Exchange Commission. Common stock repurchased under this program will be retired by the Company. No purchases have been made under this program.
Stock Purchase Plan
During the second quarter of 2005, Employers Mutual initiated a new $15.0 million stock purchase program under which Employers Mutual may purchase shares of the Company’s common stock in the open market. This purchase program does not have an expiration date; however, this program is currently dormant and will remain so while the Company’s repurchase program is in effect. The timing and terms of the purchases are determined by management based on market conditions and are conducted in accordance with the applicable rules of the Securities and Exchange Commission. No purchases were made during 2015, 2014 and 2013. As of December 31, 2015, $4.5 million remained available under this plan for additional purchases.
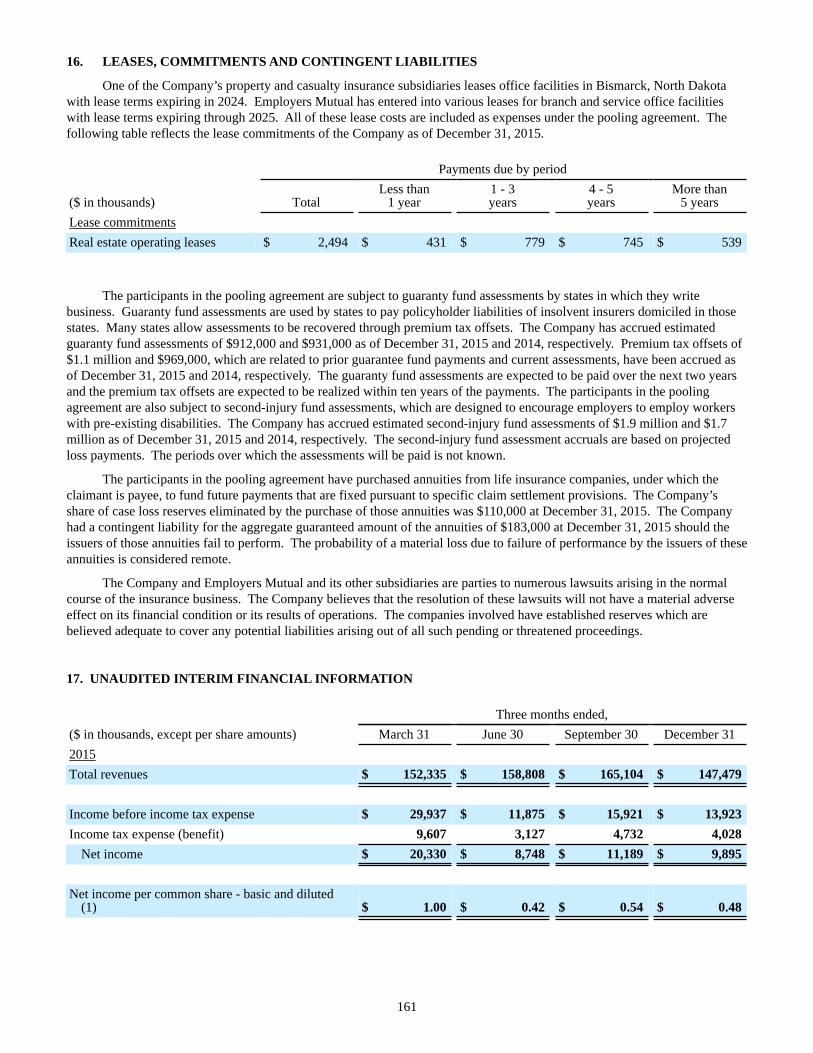
161
16. LEASES, COMMITMENTS AND CONTINGENT LIABILITIES
One of the Company’s property and casualty insurance subsidiaries leases office facilities in Bismarck, North Dakotawith lease terms expiring in 2024. Employers Mutual has entered into various leases for branch and service office facilities with lease terms expiring through 2025. All of these lease costs are included as expenses under the pooling agreement. The following table reflects the lease commitments of the Company as of December 31, 2015.
Payments due by period
($ in thousands) TotalLess than
1 year1 - 3years
4 - 5years
More than5 years
Lease commitmentsReal estate operating leases $ 2,494 $ 431 $ 779 $ 745 $ 539
The participants in the pooling agreement are subject to guaranty fund assessments by states in which they write business. Guaranty fund assessments are used by states to pay policyholder liabilities of insolvent insurers domiciled in those states. Many states allow assessments to be recovered through premium tax offsets. The Company has accrued estimated guaranty fund assessments of $912,000 and $931,000 as of December 31, 2015 and 2014, respectively. Premium tax offsets of $1.1 million and $969,000, which are related to prior guarantee fund payments and current assessments, have been accrued as of December 31, 2015 and 2014, respectively. The guaranty fund assessments are expected to be paid over the next two years and the premium tax offsets are expected to be realized within ten years of the payments. The participants in the pooling agreement are also subject to second-injury fund assessments, which are designed to encourage employers to employ workers with pre-existing disabilities. The Company has accrued estimated second-injury fund assessments of $1.9 million and $1.7 million as of December 31, 2015 and 2014, respectively. The second-injury fund assessment accruals are based on projected loss payments. The periods over which the assessments will be paid is not known.
The participants in the pooling agreement have purchased annuities from life insurance companies, under which the claimant is payee, to fund future payments that are fixed pursuant to specific claim settlement provisions. The Company’s share of case loss reserves eliminated by the purchase of those annuities was $110,000 at December 31, 2015. The Company had a contingent liability for the aggregate guaranteed amount of the annuities of $183,000 at December 31, 2015 should the issuers of those annuities fail to perform. The probability of a material loss due to failure of performance by the issuers of these annuities is considered remote.
The Company and Employers Mutual and its other subsidiaries are parties to numerous lawsuits arising in the normal course of the insurance business. The Company believes that the resolution of these lawsuits will not have a material adverse effect on its financial condition or its results of operations. The companies involved have established reserves which are believed adequate to cover any potential liabilities arising out of all such pending or threatened proceedings.
17. UNAUDITED INTERIM FINANCIAL INFORMATION
Three months ended,($ in thousands, except per share amounts) March 31 June 30 September 30 December 312015Total revenues $ 152,335 $ 158,808 $ 165,104 $ 147,479
Income before income tax expense $ 29,937 $ 11,875 $ 15,921 $ 13,923Income tax expense (benefit) 9,607 3,127 4,732 4,028
Net income $ 20,330 $ 8,748 $ 11,189 $ 9,895
Net income per common share - basic and diluted(1) $ 1.00 $ 0.42 $ 0.54 $ 0.48
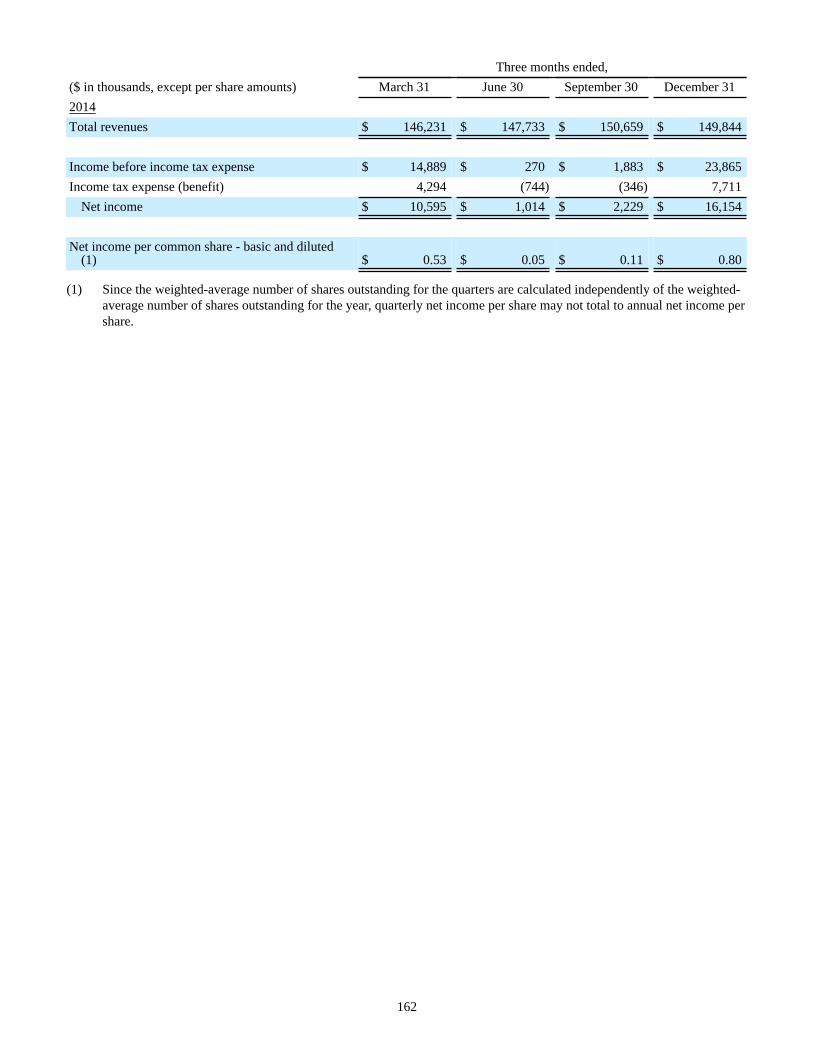
162
Three months ended,March 31 June 30 September 30 December 31
$ 146,231 $ 147,733 $ 150,659 $ 149,844
$ 14,889 $ 270 $ 1,883 $ 23,865
($ in thousands, except per share amounts) 2014Total revenues
Income before income tax expense Income tax expense (benefit) 4,294 (744) (346) 7,711
Net income $ 10,595 $ 1,014 $ 2,229 $ 16,154
Net income per common share - basic and diluted(1) $ 0.53 $ 0.05 $ 0.11 $ 0.80
(1) Since the weighted-average number of shares outstanding for the quarters are calculated independently of the weighted-average number of shares outstanding for the year, quarterly net income per share may not total to annual net income pershare.
163
REPORT OF INDEPENDENT REGISTERED PUBLIC ACCOUNTING FIRM
The Board of Directors and StockholdersEMC Insurance Group Inc.
We have audited the consolidated financial statements of EMC Insurance Group Inc. and Subsidiaries (the Company) as of December 31, 2015 and 2014, and for each of the three years in the period ended December 31, 2015, and have issued our report thereon dated March 8, 2016 (included elsewhere in this Form 10-K). Our audits also include the financial statement schedules listed in Item 15(a) 2 of this Form 10-K. These schedules are the responsibility of the Company's management. Our responsibility is to express an opinion on these schedules based on our audits.
In our opinion, the financial statement schedules referred to above, when considered in relation to the basic financial statements taken as a whole, presents fairly in all material respects the information set forth therein.
/s/ Ernst & Young LLPDes Moines, IowaMarch 8, 2016
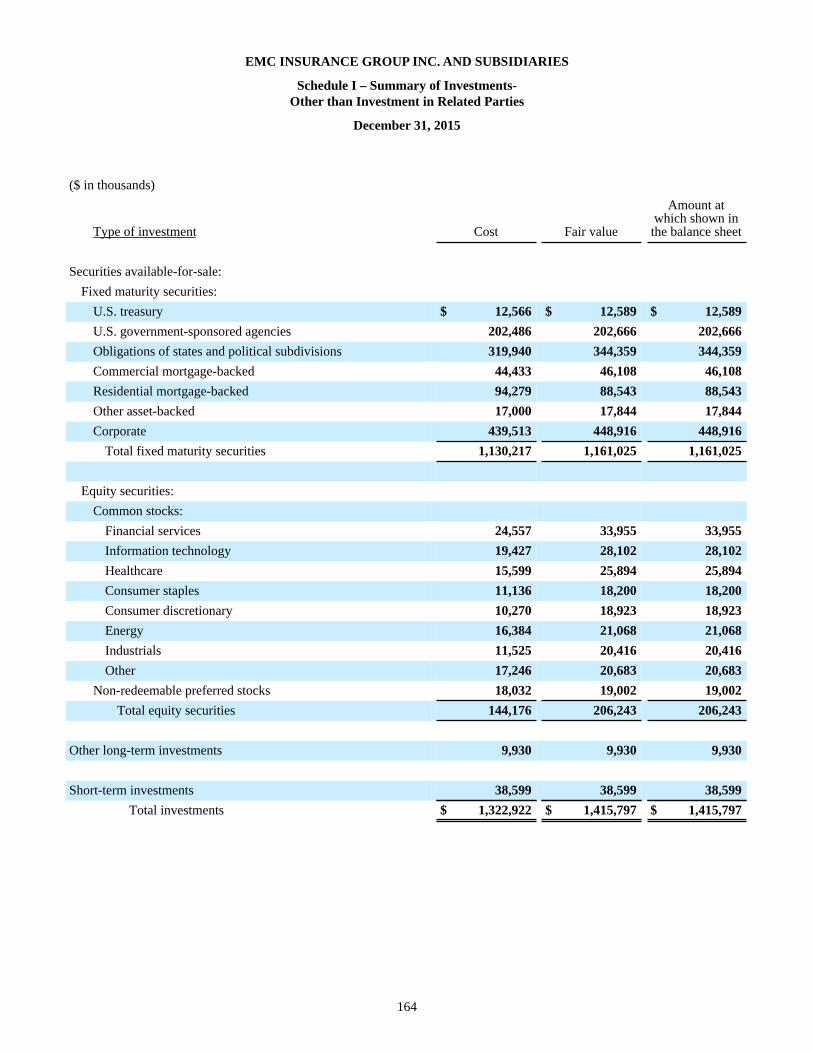
164
EMC INSURANCE GROUP INC. AND SUBSIDIARIES
Schedule I – Summary of Investments-Other than Investment in Related Parties
December 31, 2015
($ in thousands)
Type of investment Cost Fair value
Amount atwhich shown inthe balance sheet
Securities available-for-sale:Fixed maturity securities:
U.S. treasury $ 12,566 $ 12,589 $ 12,589U.S. government-sponsored agencies 202,486 202,666 202,666Obligations of states and political subdivisions 319,940 344,359 344,359Commercial mortgage-backed 44,433 46,108 46,108Residential mortgage-backed 94,279 88,543 88,543Other asset-backed 17,000 17,844 17,844Corporate 439,513 448,916 448,916
Total fixed maturity securities 1,130,217 1,161,025 1,161,025
Equity securities:Common stocks:
Financial services 24,557 33,955 33,955Information technology 19,427 28,102 28,102Healthcare 15,599 25,894 25,894Consumer staples 11,136 18,200 18,200Consumer discretionary 10,270 18,923 18,923Energy 16,384 21,068 21,068Industrials 11,525 20,416 20,416Other 17,246 20,683 20,683
Non-redeemable preferred stocks 18,032 19,002 19,002Total equity securities 144,176 206,243 206,243
Other long-term investments 9,930 9,930 9,930
Short-term investments 38,599 38,599 38,599Total investments $ 1,322,922 $ 1,415,797 $ 1,415,797
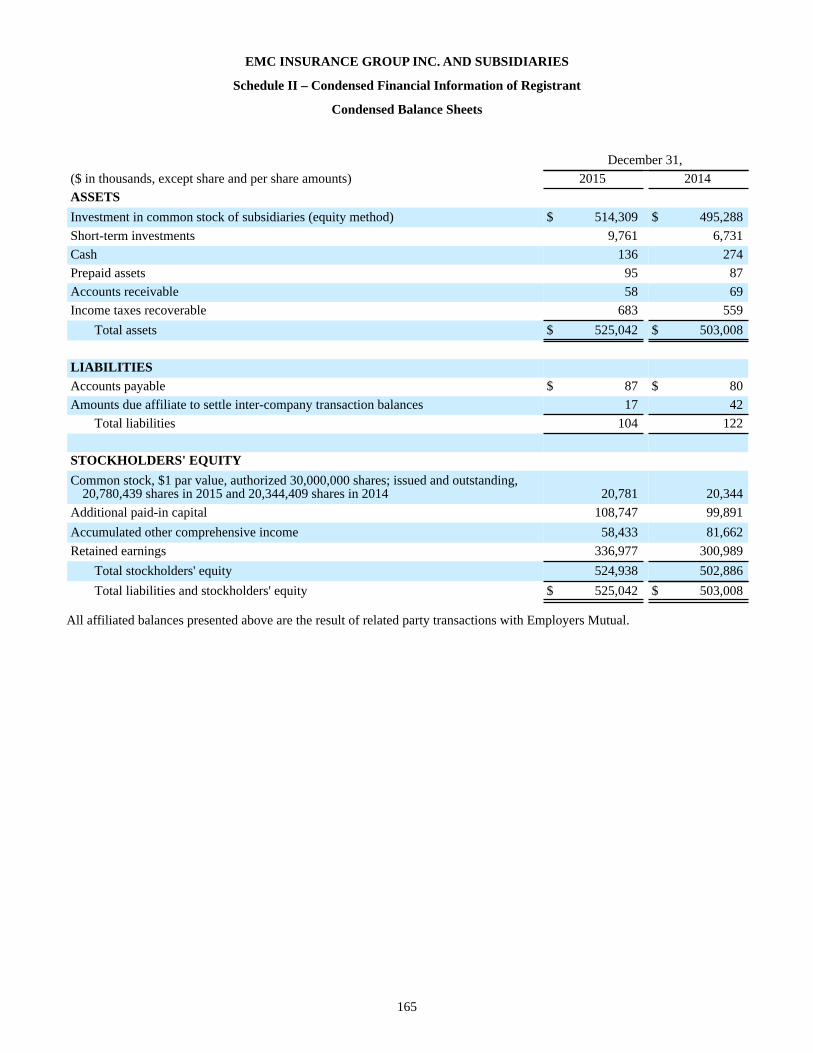
165
EMC INSURANCE GROUP INC. AND SUBSIDIARIES
Schedule II – Condensed Financial Information of Registrant
Condensed Balance Sheets
December 31,($ in thousands, except share and per share amounts) 2015 2014ASSETSInvestment in common stock of subsidiaries (equity method) $ 514,309 $ 495,288Short-term investments 9,761 6,731Cash 136 274Prepaid assets 95 87Accounts receivable 58 69Income taxes recoverable 683 559
Total assets $ 525,042 $ 503,008
LIABILITIESAccounts payable $ 87 $ 80Amounts due affiliate to settle inter-company transaction balances 17 42
Total liabilities 104 122
STOCKHOLDERS' EQUITYCommon stock, $1 par value, authorized 30,000,000 shares; issued and outstanding,
20,780,439 shares in 2015 and 20,344,409 shares in 2014 20,781 20,344Additional paid-in capital 108,747 99,891Accumulated other comprehensive income 58,433 81,662Retained earnings 336,977 300,989
Total stockholders' equity 524,938 502,886Total liabilities and stockholders' equity $ 525,042 $ 503,008
All affiliated balances presented above are the result of related party transactions with Employers Mutual.
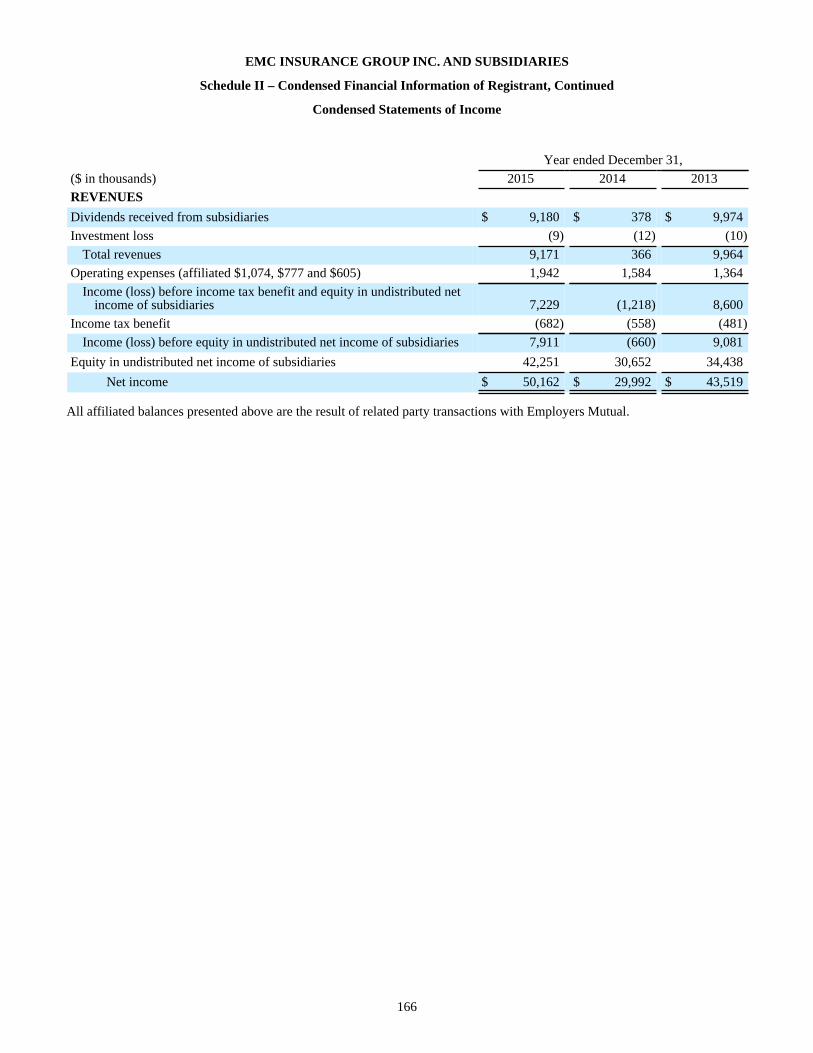
166
EMC INSURANCE GROUP INC. AND SUBSIDIARIES
Schedule II – Condensed Financial Information of Registrant, Continued
Condensed Statements of Income
Year ended December 31,($ in thousands) 2015 2014 2013REVENUESDividends received from subsidiaries $ 9,180 $ 378 $ 9,974Investment loss (9) (12) (10)
Total revenues 9,171 366 9,964Operating expenses (affiliated $1,074, $777 and $605) 1,942 1,584 1,364
Income (loss) before income tax benefit and equity in undistributed netincome of subsidiaries 7,229 (1,218) 8,600
Income tax benefit (682) (558) (481)Income (loss) before equity in undistributed net income of subsidiaries 7,911 (660) 9,081
Equity in undistributed net income of subsidiaries 42,251 30,652 34,438Net income $ 50,162 $ 29,992 $ 43,519
All affiliated balances presented above are the result of related party transactions with Employers Mutual.
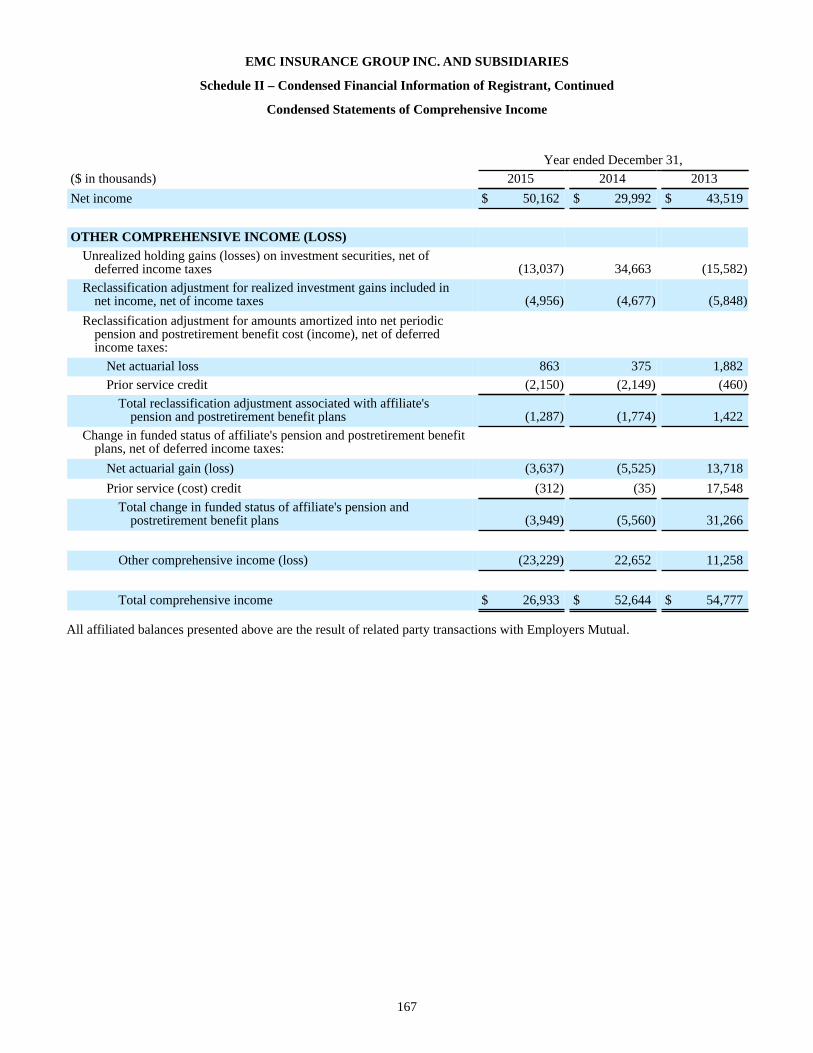
167
EMC INSURANCE GROUP INC. AND SUBSIDIARIES
Schedule II – Condensed Financial Information of Registrant, Continued
Condensed Statements of Comprehensive Income
Year ended December 31,($ in thousands) 2015 2014 2013Net income $ 50,162 $ 29,992 $ 43,519
OTHER COMPREHENSIVE INCOME (LOSS)Unrealized holding gains (losses) on investment securities, net of
deferred income taxes (13,037) 34,663 (15,582)Reclassification adjustment for realized investment gains included in
net income, net of income taxes (4,956) (4,677) (5,848)Reclassification adjustment for amounts amortized into net periodic
pension and postretirement benefit cost (income), net of deferredincome taxes:
Net actuarial loss 863 375 1,882Prior service credit (2,150) (2,149) (460)
Total reclassification adjustment associated with affiliate'spension and postretirement benefit plans (1,287) (1,774) 1,422
Change in funded status of affiliate's pension and postretirement benefitplans, net of deferred income taxes:
Net actuarial gain (loss) (3,637) (5,525) 13,718Prior service (cost) credit (312) (35) 17,548
Total change in funded status of affiliate's pension andpostretirement benefit plans (3,949) (5,560) 31,266
Other comprehensive income (loss) (23,229) 22,652 11,258
Total comprehensive income $ 26,933 $ 52,644 $ 54,777
All affiliated balances presented above are the result of related party transactions with Employers Mutual.
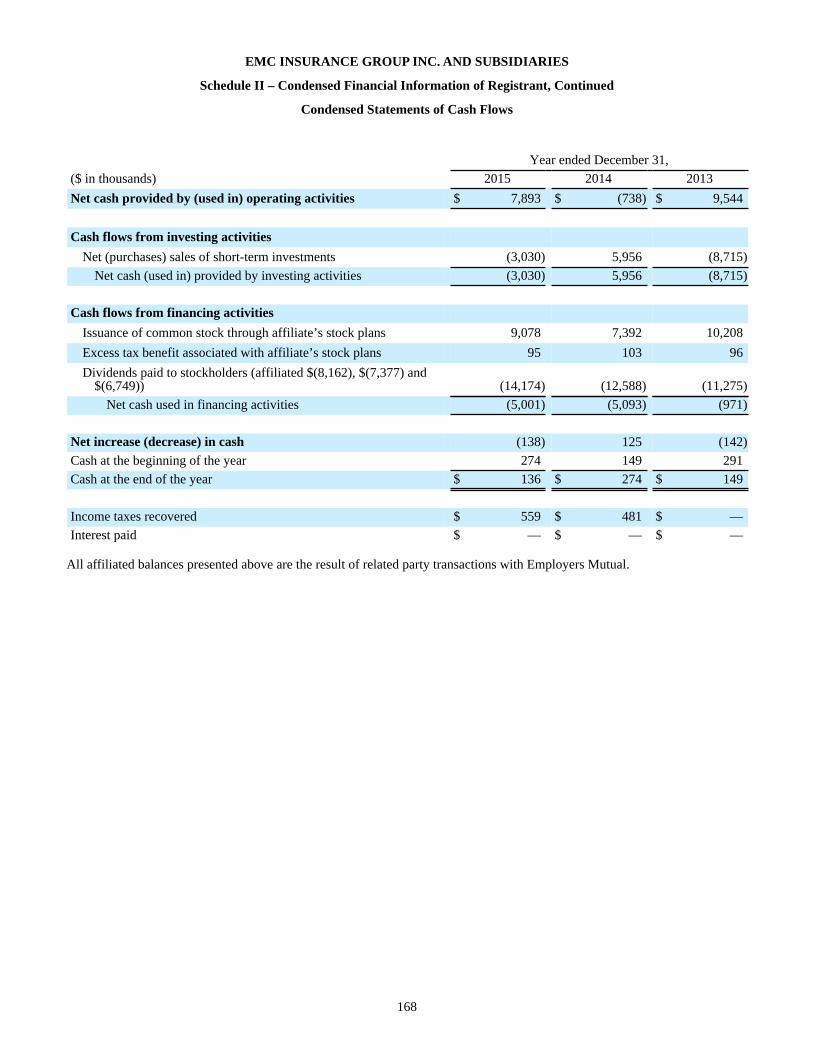
168
EMC INSURANCE GROUP INC. AND SUBSIDIARIES
Schedule II – Condensed Financial Information of Registrant, Continued
Condensed Statements of Cash Flows
Year ended December 31,($ in thousands) 2015 2014 2013Net cash provided by (used in) operating activities $ 7,893 $ (738) $ 9,544
Cash flows from investing activitiesNet (purchases) sales of short-term investments (3,030) 5,956 (8,715)
Net cash (used in) provided by investing activities (3,030) 5,956 (8,715)
Cash flows from financing activitiesIssuance of common stock through affiliate’s stock plans 9,078 7,392 10,208Excess tax benefit associated with affiliate’s stock plans 95 103 96Dividends paid to stockholders (affiliated $(8,162), $(7,377) and
$(6,749)) (14,174) (12,588) (11,275)Net cash used in financing activities (5,001) (5,093) (971)
Net increase (decrease) in cash (138) 125 (142)Cash at the beginning of the year 274 149 291Cash at the end of the year $ 136 $ 274 $ 149
Income taxes recovered $ 559 $ 481 $ —Interest paid $ — $ — $ —
All affiliated balances presented above are the result of related party transactions with Employers Mutual.
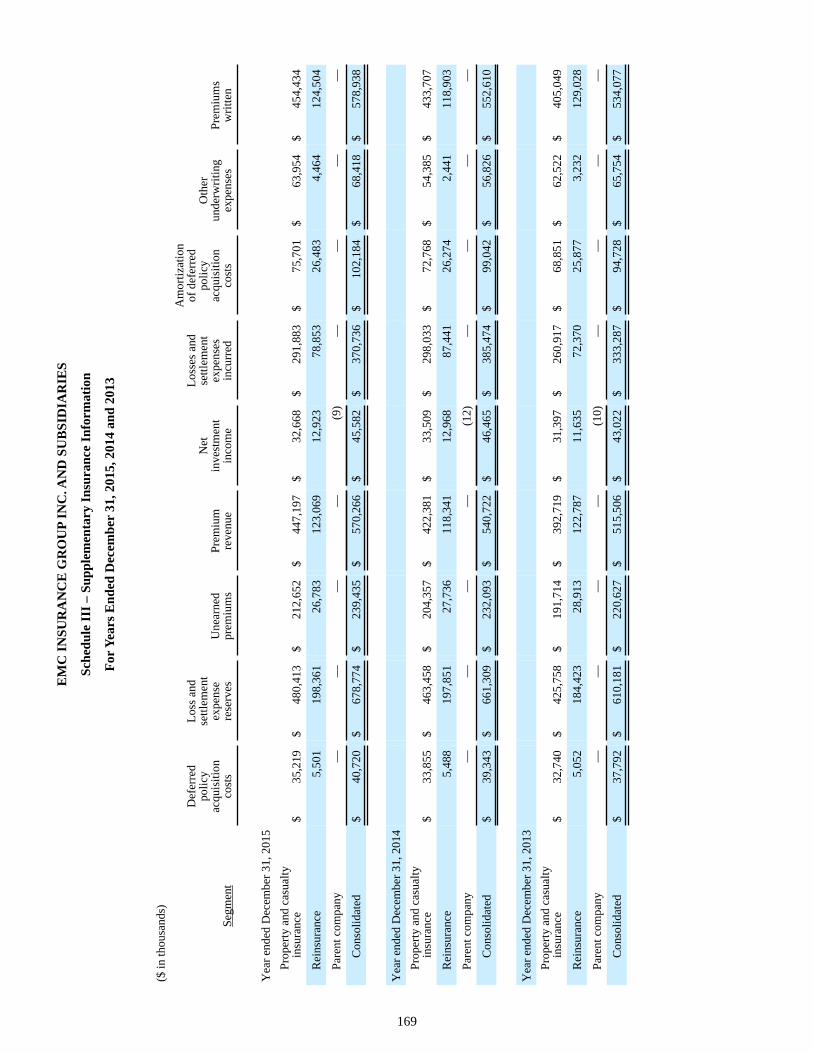
169
EM
C IN
SUR
AN
CE
GR
OU
P IN
C. A
ND
SU
BSI
DIA
RIE
S
Sche
dule
III –
Sup
plem
enta
ry In
sura
nce
Info
rmat
ion
For Y
ears
End
ed D
ecem
ber
31, 2
015,
201
4 an
d 20
13
($ in
thou
sand
s)
Segm
ent
Def
erre
dpo
licy
acqu
isiti
onco
sts
Loss
and
settl
emen
tex
pens
ere
serv
esU
near
ned
prem
ium
sPr
emiu
mre
venu
e
Net
inve
stm
ent
inco
me
Loss
es a
ndse
ttlem
ent
expe
nses
incu
rred
Am
ortiz
atio
nof
def
erre
dpo
licy
acqu
isiti
onco
sts
Oth
erun
derw
ritin
gex
pens
esPr
emiu
ms
writ
ten
Yea
r end
ed D
ecem
ber 3
1, 2
015
Prop
erty
and
cas
ualty
insu
ranc
e$
35,2
19$
480,
413
$21
2,65
2$
447,
197
$32
,668
$29
1,88
3$
75,7
01$
63,9
54$
454,
434
Rei
nsur
ance
5,50
119
8,36
126
,783
123,
069
12,9
2378
,853
26,4
834,
464
124,
504
Pare
nt c
ompa
ny—
——
—(9
)—
——
—
Con
solid
ated
$40
,720
$67
8,77
4$
239,
435
$57
0,26
6$
45,5
82$
370,
736
$10
2,18
4$
68,4
18$
578,
938
Yea
r end
ed D
ecem
ber 3
1, 2
014
Prop
erty
and
cas
ualty
insu
ranc
e$
33,8
55$
463,
458
$20
4,35
7$
422,
381
$33
,509
$29
8,03
3$
72,7
68$
54,3
85$
433,
707
Rei
nsur
ance
5,48
819
7,85
127
,736
118,
341
12,9
6887
,441
26,2
742,
441
118,
903
Pare
nt c
ompa
ny—
——
—(1
2)—
——
—
Con
solid
ated
$39
,343
$66
1,30
9$
232,
093
$54
0,72
2$
46,4
65$
385,
474
$99
,042
$56
,826
$55
2,61
0
Yea
r end
ed D
ecem
ber 3
1, 2
013
Prop
erty
and
cas
ualty
insu
ranc
e$
32,7
40$
425,
758
$19
1,71
4$
392,
719
$31
,397
$26
0,91
7$
68,8
51$
62,5
22$
405,
049
Rei
nsur
ance
5,05
218
4,42
328
,913
122,
787
11,6
3572
,370
25,8
773,
232
129,
028
Pare
nt c
ompa
ny—
——
—(1
0)—
——
—
Con
solid
ated
$37
,792
$61
0,18
1$
220,
627
$51
5,50
6$
43,0
22$
333,
287
$94
,728
$65
,754
$53
4,07
7
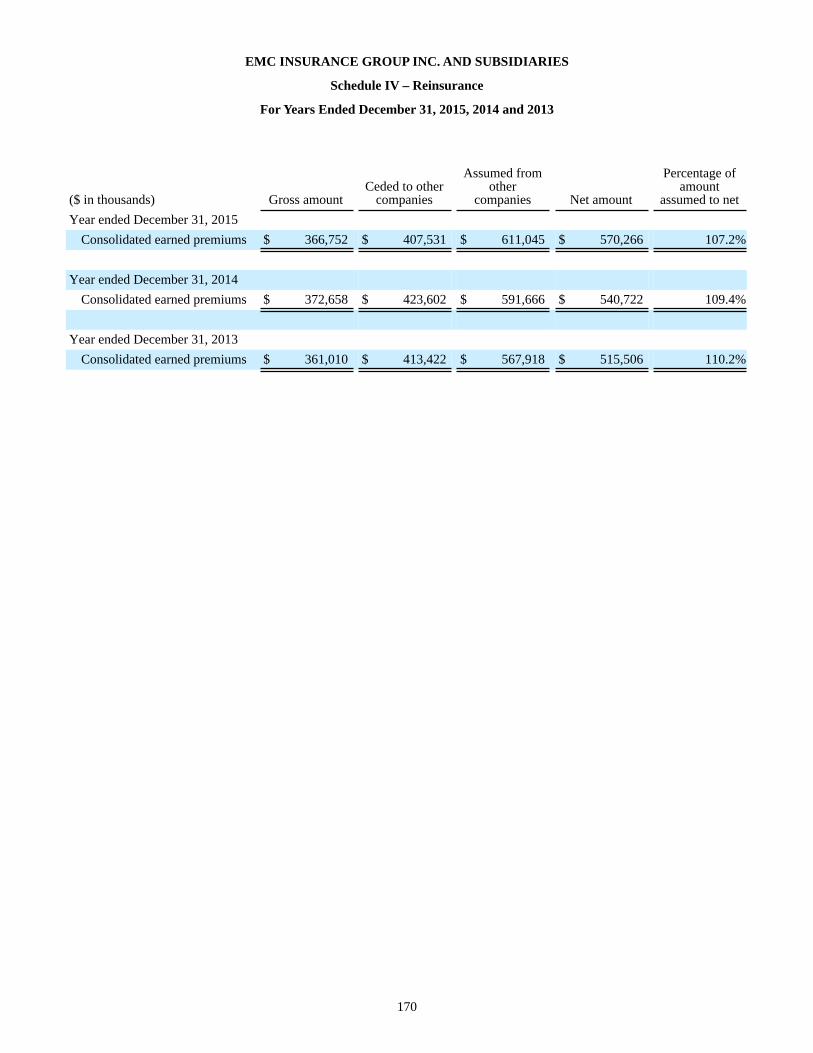
170
EMC INSURANCE GROUP INC. AND SUBSIDIARIES
Schedule IV – Reinsurance
For Years Ended December 31, 2015, 2014 and 2013
($ in thousands) Gross amountCeded to other
companies
Assumed fromother
companies Net amount
Percentage ofamount
assumed to netYear ended December 31, 2015
Consolidated earned premiums $ 366,752 $ 407,531 $ 611,045 $ 570,266 107.2%
Year ended December 31, 2014Consolidated earned premiums $ 372,658 $ 423,602 $ 591,666 $ 540,722 109.4%
Year ended December 31, 2013Consolidated earned premiums $ 361,010 $ 413,422 $ 567,918 $ 515,506 110.2%
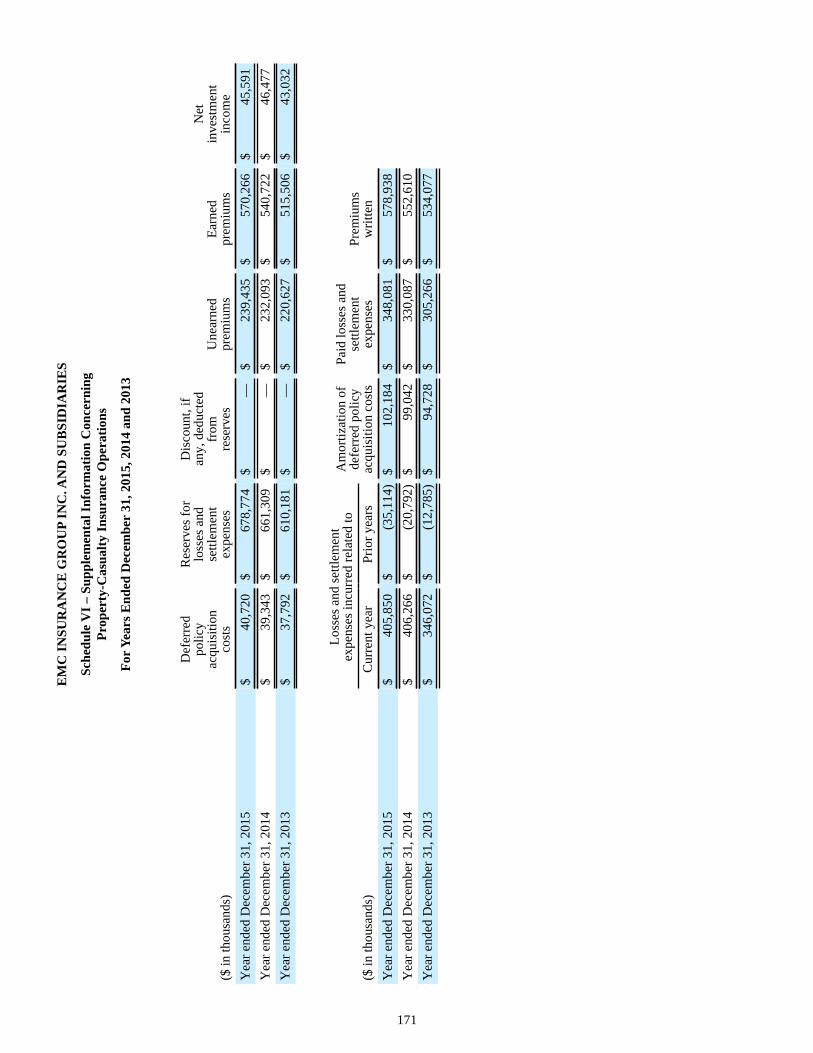
171
EM
C IN
SUR
AN
CE
GR
OU
P IN
C. A
ND
SU
BSI
DIA
RIE
S
Sche
dule
VI –
Sup
plem
enta
l Inf
orm
atio
n C
once
rnin
gPr
oper
ty-C
asua
lty In
sura
nce
Ope
ratio
ns
For Y
ears
End
ed D
ecem
ber
31, 2
015,
201
4 an
d 20
13
($ in
thou
sand
s)
Def
erre
dpo
licy
acqu
isiti
onco
sts
Res
erve
s for
loss
es a
ndse
ttlem
ent
expe
nses
Dis
coun
t, if
any,
ded
ucte
dfr
omre
serv
esU
near
ned
prem
ium
sEa
rned
prem
ium
s
Net
inve
stm
ent
inco
me
Yea
r end
ed D
ecem
ber 3
1, 2
015
$40
,720
$67
8,77
4$
—$
239,
435
$57
0,26
6$
45,5
91Y
ear e
nded
Dec
embe
r 31,
201
4$
39,3
43$
661,
309
$—
$23
2,09
3$
540,
722
$46
,477
Yea
r end
ed D
ecem
ber 3
1, 2
013
$37
,792
$61
0,18
1$
—$
220,
627
$51
5,50
6$
43,0
32
Loss
es a
nd se
ttlem
ent
expe
nses
incu
rred
rela
ted
toA
mor
tizat
ion
ofde
ferr
ed p
olic
yac
quis
ition
cos
ts
Paid
loss
es a
ndse
ttlem
ent
expe
nses
Prem
ium
sw
ritte
n($
in th
ousa
nds)
Cur
rent
yea
rPr
ior y
ears
Yea
r end
ed D
ecem
ber 3
1, 2
015
$40
5,85
0$
(35,
114 )
$10
2,18
4$
348,
081
$57
8,93
8Y
ear e
nded
Dec
embe
r 31,
201
4$
406,
266
$(2
0,79
2 )$
99,0
42$
330,
087
$55
2,61
0Y
ear e
nded
Dec
embe
r 31,
201
3$
346,
072
$(1
2,78
5 )$
94,7
28$
305,
266
$53
4,07
7
172
ITEM 9. CHANGES IN AND DISAGREEMENTS WITH ACCOUNTANTS ON ACCOUNTING ANDFINANCIAL DISCLOSURE
None.
ITEM 9A. CONTROLS AND PROCEDURES
The Company, under the supervision and with the participation of its management, including the Chief Executive Officer and the Chief Financial Officer, evaluated the effectiveness of the design and operation of the Company’s “disclosure controls and procedures” (as defined in Rule 13a-15(e) under the Exchange Act) as of the end of the period covered by this report. Based on that evaluation, the Chief Executive Officer and the Chief Financial Officer concluded that the Company’s disclosure controls and procedures are effective in timely making known to them material information relating to the Company and the Company’s consolidated subsidiaries required to be disclosed in the Company’s reports filed or submitted under the Exchange Act.
The report called for by Item 308(a) of Regulation S-K is included in “Management’s Report on Internal Control Over Financial Reporting,” under Part II, Item 8 of this report.
The attestation report called for by Item 308(b) of Regulation S-K is included in “Report of Independent Registered Public Accounting Firm on Internal Control Over Financial Reporting,” under Part II, Item 8 of this report.
There were no changes in the Company’s internal control over financial reporting that occurred during the fourth quarter ended December 31, 2015 that have materially affected, or are reasonably likely to materially affect, the Company’s internal control over financial reporting.
ITEM 9B. OTHER INFORMATION
None.
PART III
ITEM 10. DIRECTORS, EXECUTIVE OFFICERS AND CORPORATE GOVERNANCE
The information required by Item 10 regarding the Company’s executive officers is included in “Executive Officers of the Company” under Part I, Item 1 of this report.
The information required by Item 10 regarding the audit committee financial expert and the members of the Company’s Audit Committee of the Board of Directors is incorporated by reference from the information under the caption “Information about the Board of Directors and its Committees” in the Company’s Proxy Statement for the Annual Meeting of Stockholders to be held on May 19, 2016.
The information required by Item 10 regarding the Company’s directors is incorporated by reference from the information under the captions “Election of Directors” and “Information about the Board of Directors and its Committees” in the Company’s Proxy Statement for the Annual Meeting of Stockholders to be held on May 19, 2016.
The information required by Item 10 regarding compliance with Section 16(a) of the Exchange Act is incorporated by reference from the information under the caption “Section 16(a) Beneficial Ownership Reporting Compliance” in the Company’s Proxy Statement for the Annual Meeting of Stockholders to be held on May 19, 2016.
The Company has adopted a code of ethics that applies to the Company’s principal executive officer, principal financial officer, principal accounting officer or controller, or persons performing similar functions. The code of ethics is posted on the Investors section of the Company’s internet website found at www.emcins.com. In the event that the Company makes any amendments to, or grants any waivers from, a provision of the ethics policy that requires disclosure under applicable Securities and Exchange Commission rules, the Company intends to disclose such amendments or waivers and the reasons therefore on its website.
173
ITEM 11. EXECUTIVE COMPENSATION
See the information under the captions “Executive Compensation,” “Compensation Committee Report” and “Compensation Committee Interlocks and Insider Participation” in the Company’s Proxy Statement in connection with its Annual Meeting of Stockholders to be held on May 19, 2016, which information is incorporated herein by reference.
ITEM 12. SECURITY OWNERSHIP OF CERTAIN BENEFICIAL OWNERS AND MANAGEMENT ANDRELATED STOCKHOLDER MATTERS
See the information under the captions “Security Ownership of Certain Beneficial Owners” and “Security Ownership of Management and Directors” in the Company’s Proxy Statement in connection with its Annual Meeting of Stockholders to be held on May 19, 2016, which information is incorporated herein by reference.
Information regarding securities authorized for issuance under equity compensation plans appears in Part II, Item 5 of this report.
ITEM 13. CERTAIN RELATIONSHIPS AND RELATED TRANSACTIONS, AND DIRECTOR INDEPENDENCE
See the information under the captions “Certain Relationships and Related Persons Transactions” and “Election of Directors” in the Company’s Proxy Statement in connection with its Annual Meeting of Stockholders to be held on May 19, 2016, which information is incorporated herein by reference.
ITEM 14. PRINCIPAL ACCOUNTING FEES AND SERVICES
See the information under the caption “Independent Registered Public Accounting Firm’s Fees” in the Company’s Proxy Statement in connection with its Annual Meeting of Stockholders to be held on May 19, 2016, which information is incorporated herein by reference.
174
PART IV
ITEM 15. EXHIBITS, FINANCIAL STATEMENT SCHEDULES
(a) List of Financial Statements and Schedules
1. Financial StatementsPage
Management's Report on Internal Control Over Financial ReportingReport of Independent Registered Public Accounting Firm on Internal Control Over Financial
Reporting 106Report of Independent Registered Public Accounting Firm 107Consolidated Balance Sheets, December 31, 2015 and 2014Consolidated Statements of Income for the years ended December 31, 2015, 2014 and 2013Consolidated Statements of Comprehensive Income for the years ended December 31, 2015, 2014 and
2013Consolidated Statements of Stockholders' Equity for the years ended December 31, 2015, 2014 and
2013Consolidated Statements of Cash Flows for the years ended December 31, 2015, 2014 and 2013Notes to Consolidated Financial Statements
2. Schedules
Report of Independent Registered Public Accounting FirmSchedule I - Summary of Investments - Other Than Investments in Related PartiesSchedule II - Condensed Financial Information of RegistrantSchedule III - Supplementary Insurance InformationSchedule IV - ReinsuranceSchedule VI - Supplemental Information Concerning Property-Casualty Insurance Operations
All other schedules have been omitted for the reason that the items required by such schedules are notpresent in the consolidated financial statements, are covered in the notes to the consolidated financialstatements or are not significant in amount.
3. Exhibits required by Item 601
3. Articles of incorporation and by-laws:
3.1 Restated Articles of Incorporation of the Company (incorporated by reference to Exhibit 3.1 filedwith the Company's Form 8-K filed on May 7, 2015 under Item 5.03)
3.2 By-Laws of the Company, as amended (incorporated by reference to Exhibit 3.2 filed with theCompany’s Form 8-K filed on May 30, 2013 under Item 5.03)
10. Material contracts
10.1.1 EMC Insurance Companies reinsurance pooling agreements between Employers Mutual CasualtyCompany and certain of its affiliated companies, as amended
10.1.2 100% Quota Share Reinsurance Retrocessional Agreement between Employers Mutual CasualtyCompany and EMC Reinsurance Company
10.1.3 Excess of Loss Reinsurance Agreement between EMC Reinsurance Company and EmployersMutual Casualty Company, as amended (incorporated by reference to Exhibit 10.1.3 filed with theCompany’s Form 8-K filed on January 22, 2014 under Item 1.01)
105
108110
111
112113115
163164165169170171
175
10.2.1 Summary of 2015 base salary compensation for the Company’s named executive officers(incorporated by reference to the Company’s Form 8-K filed on March 12, 2015 under Item 5.02)*
10.2.2 Summary of compensation for the Company’s non-employee directors (incorporated by reference tothe Company's Form 8-K filed on March 3, 2015 under Item 1.01)*
10.2.3 Senior Executive Compensation Bonus Program (incorporated by reference to Exhibit 10.2.3 filedwith the Company's Form 8-K filed on December 29, 2014 under Item 5.02)*
10.2.4 Executive Contingent Salary Plan – EMC Reinsurance Company (incorporated by reference toExhibit 10.2.4 filed with the Company’s Form 8-K filed on December 29, 2014 under Item 5.02)*
10.2.5 Employers Mutual Casualty Company Senior Executive Long Term Incentive Plan (incorporated byreference to Exhibit 10.2.5 filed with the Company's Form 8-K filed on December 29, 2014 underItem 5.02)*
10.2.6 EMC Reinsurance Company Executive Long Term Incentive Plan (incorporated by reference toExhibit 10.2.6 filed with the Company's Form 8-K filed on December 29, 2014 under Item 5.02)*
10.3.1 Deferred Bonus Compensation Plan*
10.3.2 Employers Mutual Casualty Company Board and Executive Non-Qualified Excess Plan, as amendedand restated (incorporated by reference to Exhibit 10.3.2 filed with the Company's Form 10-K forthe calendar year ended December 31, 2013)*
10.3.3 Employers Mutual Casualty Company Board and Executive Non-Qualified Excess Plan II(incorporated by reference to Exhibit 10.3.3 filed with the Company’s Form 10-K for the calendaryear ended December 31, 2012)*
10.3.4 Employers Mutual Casualty Company Non-Employee Directors’ Post-Service Benefits Plan, asamended and restated (incorporated by reference to Exhibit 10.3.4 filed with the Company's Form 8-K filed on November 18, 2013 under Item 1.01)*
10.3.5 Employers Mutual Casualty Company Supplemental Retirement Plan (incorporated by reference toExhibit 10.3.5 filed with the Company's Form 10-K for the calendar year ended December 31, 2013)*
10.3.6 Stock Appreciation Rights Agreement for William A. Murray (incorporated by reference to Exhibit10.3.7 filed with the Company's Form 10-K for the calendar year ended December 31, 2011)*
10.3.7 Employers Mutual Casualty Company Defined Contribution Supplemental Executive RetirementPlan (incorporated by reference to Exhibit 10.3.7 filed with the Company's Form 10-K for thecalendar year ended December 31, 2014)*
10.4.1 Employers Mutual Casualty Company Amended and Restated 2008 Employee Stock Purchase Plan(incorporated by reference to Exhibit 10.4.1 filed with the Company's Form 10-K for the calendaryear ended December 31, 2014)*
10.4.2 2013 Employers Mutual Casualty Company Non-Employee Director Stock Purchase Plan(incorporated by reference to Registration No. 333-187250)*
10.4.3 2003 Employers Mutual Casualty Company Incentive Stock Option Plan (incorporated by referenceto Registration No. 333-103722 and 333-128315)*
10.4.4 2007 Employers Mutual Casualty Company Stock Incentive Plan (incorporated by reference toRegistration No. 333-143457)*
10.4.5 EMC Insurance Group Inc. Amended and Restated Dividend Reinvestment and Common StockPurchase Plan (incorporated by reference to Registration No. 333-187622)
10.5.1 Surplus Note – EMCASCO Insurance Company (incorporated by reference to Exhibit 10.5.1 filedwith the Company’s Form 10-Q for the quarterly period ended March 31, 2013)
10.5.2 Surplus Note – Illinois EMCASCO Insurance Company (incorporated by reference to Exhibit 10.5.2filed with the Company’s Form 10-Q for the quarterly period ended March 31, 2013)
10.5.3 Surplus Note – Dakota Fire Insurance Company (incorporated by reference to Exhibit 10.5.3 filedwith the Company’s Form 10-Q for the quarterly period ended March 31, 2013)
10.5.4 Inter-Company Loan Agreement (incorporated by reference to Exhibit 10.5.4 filed with theCompany's Form 8-K on January 9, 2012 under Item 1.01)
176
10.6.1 Investment Management Agreement (incorporated by reference to Exhibit 10.6.1 filed with theCompany’s Form 10-K for the calendar year ended December 31, 2012)
10.6.2 Services Agreement between Employers Mutual Casualty Company and EMC Insurance Group Inc.(incorporated by reference to Exhibit 10.6.2 filed with the Company’s Form 10-K for the calendaryear ended December 31, 2012)
10.6.3 Services Agreement between Employers Mutual Casualty Company and EMC Underwriters, LLC(incorporated by reference to Exhibit 10.6.3 filed with the Company’s Form 10-K for the calendaryear ended December 31, 2012)
10.6.4 Agreement for Payment of Taxes between Employers Mutual Casualty Company and EMCInsurance Group Inc. and its subsidiaries individually (incorporated by reference to Exhibit 10.6.4filed with the Company's Form 10-K for the calendar year ended December 31, 2011)
21. Subsidiaries of the Registrant
23. Consent of Independent Registered Public Accounting Firm, with respect to Forms S-8 (Registration Nos.333-187250, 333-103722, 333-128315, 333-143457 and 333-151299) and Form S-3 (Registration No.333-187622)
24. Power of Attorney
31.1 Certification of President, Chief Executive Officer and Treasurer as required by Section 302 of the Sarbanes-Oxley Act of 2002
31.2 Certification of Senior Vice President and Chief Financial Officer as required by Section 302 of the Sarbanes-Oxley Act of 2002
32.1 Certification of President, Chief Executive Officer and Treasurer pursuant to 18 U.S.C. Section 1350, asadopted pursuant to Section 906 of the Sarbanes-Oxley Act of 2002
32.2 Certification of Senior Vice President and Chief Financial Officer pursuant to 18 U.S.C. Section 1350, asadopted pursuant to Section 906 of the Sarbanes-Oxley Act of 2002
101.INS XBRL Instance Document
101.SCH XBRL Taxonomy Extension Schema Document
101.CAL XBRL Taxonomy Extension Calculation Linkbase Document
101.DEF XBRL Taxonomy Extension Definition Linkbase Document
101.LAB XBRL Taxonomy Extension Label Linkbase Document
101.PRE XBRL Taxonomy Extension Presentation Linkbase Document
* Indicates management contract or compensatory plan or arrangement.
177
SIGNATURESPursuant to the requirements of Section 13 or 15(d) of the Securities Exchange Act of 1934, the registrant has duly
caused this report to be signed on its behalf by the undersigned, thereunto duly authorized, on March 8, 2016.
EMC INSURANCE GROUP INC.
/s/ Bruce G. KelleyBruce G. KelleyPresident, Chief Executive Officer and Treasurer(Principal Executive Officer)
Pursuant to the requirements of the Securities Exchange Act of 1934, this report has been signed below by the following persons on behalf of the Registrant and in the capacities indicated on March 8, 2016.
/s/ Bruce G. KelleyBruce G. KelleyPresident, Chief Executive Officer, Treasurerand Director(Principal Executive Officer)
/s/ Mark E. ReeseMark E. ReeseSenior Vice President and Chief Financial Officer(Principal Financial and Accounting Officer)
/s/ Mark E. ReeseStephen A. Crane*Chairman of the Board
/s/ Mark E. ReeseJonathan R. Fletcher*Director
/s/ Mark E. ReeseRobert L. Howe*Director
/s/ Mark E. ReeseGretchen H. Tegeler*Director
* by power of attorney
GLOSSARY
Assumed Reinsurance - When one or more insurers, in exchange for a share of the premium, accepts responsibility to indemnify risk underwritten by another as reinsurance. See “Reinsurance.”
Catastrophe and Storm Losses - Losses from the occurrence of an earthquake, hurricane, explosion, flood, hail storm or other similar event which results in substantial loss.
Ceded Reinsurance - The transfer of all or part of the risk of insurance loss from an insurer to another as reinsurance. See “Reinsurance.”
Combined Ratio - A measure of property/casualty underwriting results. It is the ratio of claims, settlement and underwriting expenses to insurance premiums. When the combined ratio is under 100%, underwriting results are generally profitable; when the ratio is over 100%, underwriting results are generally unprofitable. Underwriting results do not include net investment income, which may make a significant contribution to overall profitability.
Deferred Policy Acquisition Costs - The capitalization of commissions, premium taxes and other expenses related to the production of insurance business. These costs are deferred and amortized in proportion to related premium revenue.
Excess of Loss Reinsurance - Coverage for the portion of losses which exceed predetermined retention limits.
Generally Accepted Accounting Principles (GAAP) - The set of practices and procedures that provides the framework for financial statement measurement and presentation. Financial statements in this report were prepared in accordance with U.S. GAAP.
Incurred But Not Reported (IBNR) – An estimate of liability for losses that have occurred but not yet been reported to the insurer. For reinsurance business IBNR may also include anticipated increases in reserves for claims that have previously been reported.
Incurred Losses and Settlement Expenses - Claims and settlement expenses paid or unpaid for which the Company has become liable for during a given reporting period.
Loss Reserve Development - A measure of how the latest estimate of an insurance company's claim obligations compares to an earlier projection. This is also referred to as the increase or decrease in the provision for insured events of prior years.
Net Investment Income - Dividends and interest earned during a specified period from cash and invested assets, reduced by related investment expenses.
Net Investment Yield - Net investment income divided by average invested assets.
Other-Than-Temporary Investment Impairment Loss – A realized investment loss that is recognized when an investment’s fair value declines below its carrying value and the decline is deemed to be other-than-temporary.
Pooling Agreement - A joint underwriting operation in which the participants assume a predetermined and fixed interest in the premiums, losses, expenses and profits of insurance business.
Premiums - Amounts paid by policyholders to purchase insurance coverages.
Earned Premium - The recognition of the portion of written premiums directly related to the expired portion of an insurance policy for a given reporting period.
Net Written Premiums - Premiums written during a given reporting period, net of assumed and ceded reinsurance, which correlate directly to the insurance coverage provided.
Unearned Premium - The portion of written premium which would be returned to a policyholder upon cancellation.
Written Premium - The cost of insurance coverage. Written premiums refer to premiums for all policies sold during a specified accounting period.
Quota Share Reinsurance Agreement – A form of reinsurance in which the reinsurer assumes a stated percentage of all premiums, losses and related expenses in a given class of business.
Realized Investment Gains/Losses - The amount of net gains/losses realized when an investment is sold at a price higher or lower than its original cost or carrying amount. Also the amount of loss recognized when an investment’s carrying value is reduced to fair value due to a other-than-temporary impairment in the fair value of that investment.
Reinsurance - The contractual arrangement by which one or more insurers, called reinsurers, in exchange for premium payments, agree to assume all or part of a risk originally undertaken by another insurer. Reinsurance "spreads risk" among insurance enterprises, allowing individual companies to reduce exposure to losses and provide additional capacity to write insurance.
Reserves - The provision for the estimated future cost of all unpaid claims. The total includes known claims as well as amounts for claims that have occurred but have not been reported to the insurer (IBNR).
Return on Equity (ROE) - Net income divided by average stockholders' equity.
Risk-Based Capital - A model developed by the National Association of Insurance Commissioners which attempts to measure the minimum statutory capital needs of property and casualty insurance companies based upon the risks in a company's mix of products and investment portfolio.
Settlement Expenses - Expenses incurred in the process of investigating and settling claims.
Statutory Accounting - Accounting practices used by insurance companies to prepare financial statements submitted to state regulatory authorities. Statutory accounting differs from GAAP in that it stresses insurance company solvency rather than the matching of revenues and expenses.
Underwriting Gain/Loss - Represents insurance premium income less insurance claims, settlement and underwriting expenses.
Unrealized Holding Gains/Losses on Investments - Represents the difference between the current market value of investments and the basis at the end of a reporting period.
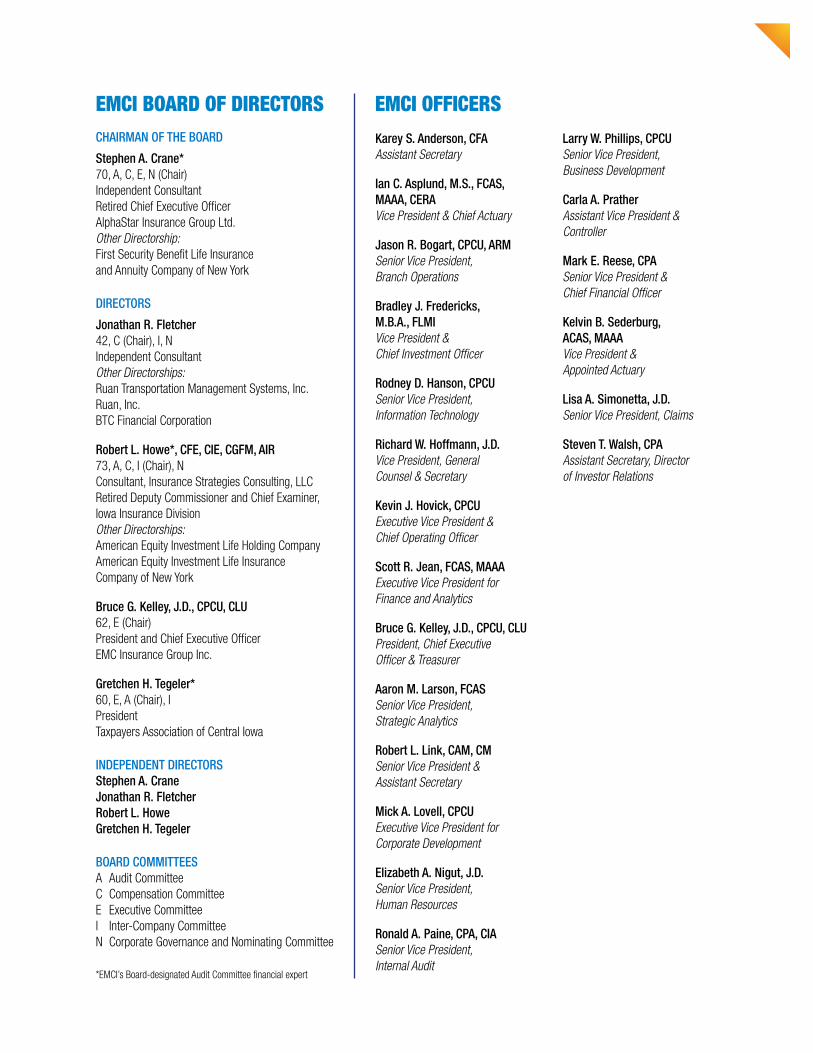
EMCI BOARD OF DIRECTORSCHAIRMAN OF THE BOARD
Stephen A. Crane*70, A, C, E, N (Chair)Independent ConsultantRetired Chief Executive Officer AlphaStar Insurance Group Ltd.Other Directorship:First Security Benefit Life Insurance and Annuity Company of New York
DIRECTORS
Jonathan R. Fletcher42, C (Chair), I, NIndependent ConsultantOther Directorships:Ruan Transportation Management Systems, Inc.Ruan, Inc.BTC Financial Corporation
Robert L. Howe*, CFE, CIE, CGFM, AIR73, A, C, I (Chair), NConsultant, Insurance Strategies Consulting, LLCRetired Deputy Commissioner and Chief Examiner, Iowa Insurance DivisionOther Directorships:American Equity Investment Life Holding CompanyAmerican Equity Investment Life Insurance Company of New York
Bruce G. Kelley, J.D., CPCU, CLU62, E (Chair)President and Chief Executive Officer EMC Insurance Group Inc.
Gretchen H. Tegeler*60, E, A (Chair), IPresidentTaxpayers Association of Central Iowa
INDEPENDENT DIRECTORSStephen A. CraneJonathan R. FletcherRobert L. HoweGretchen H. Tegeler
BOARD COMMITTEESA Audit CommitteeC Compensation CommitteeE Executive CommitteeI Inter-Company CommitteeN Corporate Governance and Nominating Committee
*EMCI’s Board-designated Audit Committee financial expert
EMCI OFFICERSKarey S. Anderson, CFAAssistant Secretary
Ian C. Asplund, M.S., FCAS, MAAA, CERAVice President & Chief Actuary
Jason R. Bogart, CPCU, ARMSenior Vice President, Branch Operations
Bradley J. Fredericks, M.B.A., FLMIVice President &Chief Investment Officer
Rodney D. Hanson, CPCUSenior Vice President, Information Technology
Richard W. Hoffmann, J.D.Vice President, General Counsel & Secretary
Kevin J. Hovick, CPCUExecutive Vice President & Chief Operating Officer
Scott R. Jean, FCAS, MAAAExecutive Vice President for Finance and Analytics
Bruce G. Kelley, J.D., CPCU, CLUPresident, Chief Executive Officer & Treasurer
Aaron M. Larson, FCASSenior Vice President, Strategic Analytics
Robert L. Link, CAM, CMSenior Vice President & Assistant Secretary
Mick A. Lovell, CPCUExecutive Vice President for Corporate Development
Elizabeth A. Nigut, J.D.Senior Vice President, Human Resources
Ronald A. Paine, CPA, CIASenior Vice President, Internal Audit
Larry W. Phillips, CPCUSenior Vice President, Business Development
Carla A. PratherAssistant Vice President & Controller
Mark E. Reese, CPASenior Vice President & Chief Financial Officer
Kelvin B. Sederburg, ACAS, MAAA Vice President & Appointed Actuary
Lisa A. Simonetta, J.D.Senior Vice President, Claims
Steven T. Walsh, CPAAssistant Secretary, Director of Investor Relations
EMC Insurance Group Inc.
Dakota Fire Insurance Company
EMC Reinsurance Company
EMCASCO Insurance Company
EMC Underwriters, LLC
Illinois EMCASCO Insurance Company
Home Office
717 Mulberry Street, Des Moines, IA 50309
515-280-2511 | 800-447-2295
www.emcins.com/ir
© Copyright Employers Mutual Casualty Company 2016. All rights reserved.
SPECIALIZING IN COMMERCIAL INSURANCE
BEST COMPANIES FOR LEADERSGIVING POLICYHOLDERS SUPERIOR SERVICE AND RESOURCE
TRUSTWORTHYRECORD SETTING FINANCIAL RESULTS LLLL
HELPING OUR AGENTS SELL MORE
LOCALEVICEINCREASING OUR KNOWLEDGE AND EXPERTISE
IMPROVING THE STRENGTH AND CULTURE OF OUR COMPANYPARTNERING WITH INDEPENDENT INSURA
BUILDING STRONG RELATIONSHIPS
LEADERSHIP COMMITMENTLLSERVICE-DRIVEN LLLL CULTURE
RIGHT PRODUCTS AND SERVICES NCE AGENTS
FINANCIAL STRENGTH LL EXCEPTIONAL LOSS CONTROL AND SAFETY SERVICES LL
CONTRIBUTING TO OUR INDUSTRY AND COMMUNITIES LLLLLLLLL
LOCALEVICEBEST COMPANIES FOR LEADERS
GIVING POLICYHOLDERS SUPERIOR SERVICE AND RESOURCES
TRUSTWORTHYRECORD SETTING FINANCIAL RESULTS LLLL
HELPING OUR AGENTS SELL MOREINCREASING OUR KNOWLEDGE AND EXPERTISE
SPECIALIZING LLLIN COMMERCIAL INSURANCE
IMPROVING THE STRENGTH AND CULTURE OF OUR COMPANYPARTNERING WITH INDEPENDENT INSURA
BUILDING STRONG RELATIONSHIPS
LEADERSHIP COMMITMENTLLSERVICE-DRIVEN LLLL CULTURE
RIGHT PRODUCTS AND SERVICES NCE AGENTS
FINANCIAL STRENGTH LLEXCEPTIONAL LOSS CONTROL AND SAFETY SERVICES LL
CONTRIBUTING TO OUR INDUSTRY AND COMMUNITIES LLLLLLLLL
LOCALEVICEBEST COMPANIES FOR L
GIVING POLICYHOLDERS SUPERIOR SERVICE AND RESOURCES
TRUSTWORTHYRECORD SETTING FINANCIAL RESULTS LLLL
HELPING OUR AGENTS SELL MOREINCREASING OUR KNOWLEDGE AND EXPERTISE
BUILDING STRONG RELATIONSHIPS
SPECIALIZING LLLIN COMMERCIAL INSURANCE
IMPROVING THE STRENGTH AND CULTURE OF OUR COMPANYPARTNERING WITH INDEPENDENT INSURANCE AGENTS
FINANCIAL STRENGTH EXCEPTIONAL LOSS CONTROL AND SAFETY SERVICES
CONTRIBUTING TO OUR INDUSTRY AND COMMUNITIES
SPECIALIZING IN