Embed Size (px)
Citation preview

1
Reduce Group RWAs by c. $290bn and re-deploy towards higher performing businesses; return GB&M to Group target profitability
Optimise global network
Rebuild NAFTA profitability
Set up UK Ring-Fenced Bank
Realise $4.5-5.0bn cost savings, deliver an exit rate in 2017 equal to 2014 operating expenses
Revenue growth above GDP from our international network
Capture growth opportunities in Asia: Pearl River Delta, ASEAN, Asset Management, Insurance
Extend leadership in RMB internationalisation
Complete Global Standards implementation
Complete Headquarters review by year end
4
5
1
2
3
10
9
7
8
6
Presentation to Investors and AnalystsHSBC Holdings plc Annual Results 2015
Value of the networkConnecting customers to opportunities

2
Our highlights
2015 Full Year
Reported PBT(2014: $18.7bn)
$18.9bn
2015 Financial Performance
Capital and dividends
Strategy execution
‒ Reported PBT up 1%: net favourable movement in significant items
‒ Adjusted PBT fell 7%:
‒ Higher revenue of $0.5bn (1%) from growth in client-facing GB&M (7%), CMB (3%) and Principal RBWM (2%)
‒ Higher costs (up $1.6bn) from increased bank levy ($0.4bn), investment in growth ($0.3bn) and regulatory programmes and compliance ($0.7bn)
‒ Higher LICs (up 17% or $0.6bn) across a number of countries and industrial sectors, most notably oil and gas
Adjusted PBT(2014: $22.0bn)
$20.4bnReported RoE(2014: 7.3%)
7.2%Adjusted Jaws
(3.7)%
CET1 ratio(2014: 11.1%)
11.9%
‒ Strong capital position with a common equity tier one ratio of 11.9% on an end point basis and a strong leverage ratio of 5.0%
‒ Progressive dividends in 2015 of $0.51 per ordinary share; total dividends in respect of the year of $10.0bn
‒ Clearly defined actions to capture value from our network and connecting our customers to opportunities
‒ Progress on reducing Group RWAs with a $124bn reduction from RWA initiatives or 45% of our rebased 2017 target achieved
‒ Signed agreement to sell operations in Brazil1
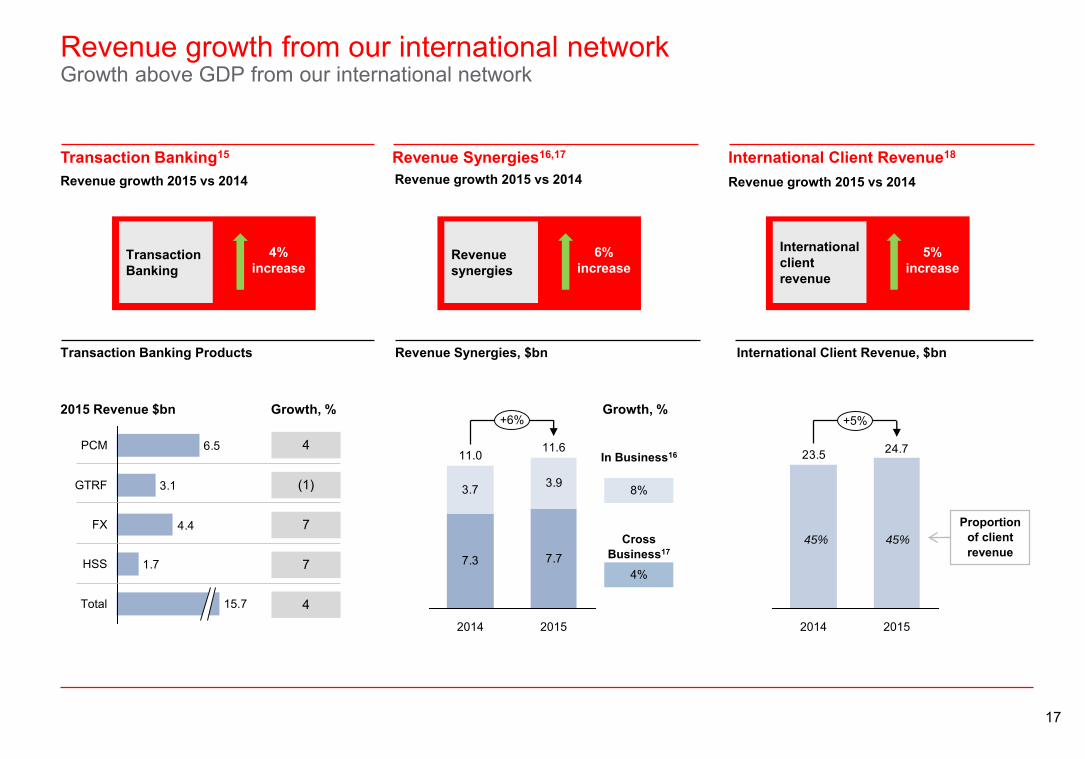
‒ Revenue from transaction banking products up 4% highlighting the value and potential of our international network
‒ Development of Asia business gaining momentum – revenue growth in excess of GDP in seven out of eight of our priority Asia markets
‒ 2H15 costs in line with 1H15 following tight cost control and the initial effect of our cost saving plans
Ordinary dividendsIn respect of the year
(2014: $0.50)
$0.51
3
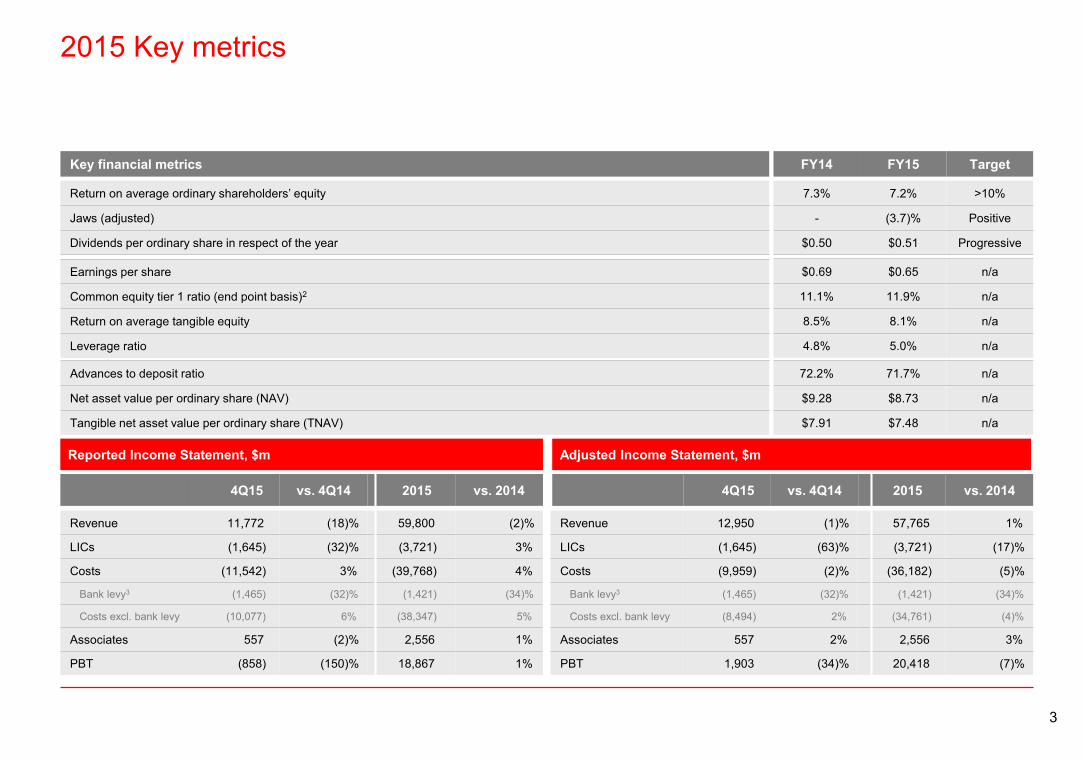
2015 Key metrics
2015 Full Year
Return on average ordinary shareholders’ equity
Jaws (adjusted)
Dividends per ordinary share in respect of the year
Key financial metrics
7.3% 7.2% >10%
- (3.7)% Positive
$0.50 $0.51 Progressive
FY14 FY15 Target
Advances to deposit ratio
Net asset value per ordinary share (NAV)
Tangible net asset value per ordinary share (TNAV)
72.2% 71.7% n/a
$9.28 $8.73 n/a
$7.91 $7.48 n/a
Revenue 12,950 (1)% 57,765 1%
LICs (1,645) (63)% (3,721) (17)%
Costs (9,959) (2)% (36,182) (5)%
Bank levy3 (1,465) (32)% (1,421) (34)%
Costs excl. bank levy (8,494) 2% (34,761) (4)%
Associates 557 2% 2,556 3%
PBT 1,903 (34)% 20,418 (7)%
Adjusted Income Statement, $m
4Q15 vs. 4Q14 2015 vs. 2014
Revenue 11,772 (18)% 59,800 (2)%
LICs (1,645) (32)% (3,721) 3%
Costs (11,542) 3% (39,768) 4%
Bank levy3 (1,465) (32)% (1,421) (34)%
Costs excl. bank levy (10,077) 6% (38,347) 5%
Associates 557 (2)% 2,556 1%
PBT (858) (150)% 18,867 1%
Reported Income Statement, $m
4Q15 vs. 4Q14 2015 vs. 2014
Earnings per share
Common equity tier 1 ratio (end point basis)2
Return on average tangible equity
Leverage ratio
$0.69 $0.65 n/a
11.1% 11.9% n/a
8.5% 8.1% n/a
4.8% 5.0% n/a

4
Financial overviewReconciliation of Reported to Adjusted PBT
2015 Full Year
Reported profit before tax 1,730 (858) (2,588) 18,680 18,867 187
Includes
Currency translation 19 - (19) 853 - (853)
Significant items:
Fair value gains / (losses) on own debt (credit spreads only) 432 (773) (1,205) 417 1,002 585
Gain on the partial sale of shareholding in Industrial Bank - - - - 1,372 1,372
Gain / (loss) on sale of several tranches of real estate secured accounts in the US 92 (214) (306) 168 (214) (382)
Other revenue-related significant items4 (332) (190) 142 (1,339) (125) 1,214
Revenue-related significant items 192 (1,177) (1,369) (754) 2,035 2,789
Settlements and provisions in connection with legal matters (809) (370) 439 (1,187) (1,649) (462)
UK customer redress programmes (340) (337) 3 (1,275) (541) 734
Costs-to-achieve - (743) (743) - (908) (908)
Other operating expenses-related significant items4 (193) (135) 58 (933) (488) 445
Operating expenses-related significant items (1,342) (1,585) (243) (3,395) (3,586) (191)
Adjusted profit before tax 2,862 1,903 (959) 21,976 20,418 (1,558)
$m 4Q14 4Q15 vs. 4Q14 2014 2015 vs. 2014
Full yearDiscrete quarter
The remainder of the presentation, unless otherwise stated, is presented on an adjusted basis

5
4Q15 Profit before tax performanceLower PBT driven by LICs and higher bank levy charge
4Q15 vs. 4Q14 PBT analysis
RBWM 1,664 1,524 (140)
CMB 1,828 1,376 (452)
GB&M 845 1,271 426
GPB 149 108 (41)
Other (1,624) (2,376) (752)
Group 2,862 1,903 (959)
Europe (1,123) (1,334) (211)
Asia 3,209 2,986 (223)
Middle East and North Africa 368 290 (78)
North America 480 77 (403)
Latin America (72) (116) (44)
Group 2,862 1,903 (959)
Revenue
LICs
Operating expenses
Share of profits in associates and joint ventures
Profit before tax
Adjusted PBT by account line
$12,950m
4Q15 vs. 4Q14
$(1,645)m
$(9,959)m
$557m
$1,903m
$(8,494)m
8
143
(959)
(634)
(214)
(357)
(120)
(34)%
(1)%
(63)%
2%
Adjusted PBT by global business, $m 4Q14 4Q15 vs. 4Q14
Adjusted PBT by geography,$m 4Q14 4Q15 vs. 4Q14
(2)%
adverse favourable
Operating expenses excl. bank levy
$(1,465)mBank levy (32)%
2%

6
4Q15 Loan impairment chargesDrivers of LICs
Adjusted LICs by type
Personal 1,492 1,833 (341)
Collective 1,456 1,740 (284)
Specific 36 93 (57)
Personal LICs / gross loans and advances 0.46% 0.49% (0.03)ppt
Wholesale 1,881 1,758 123
Collective 409 347 62
Specific 1,472 1,411 61
Wholesale LICs / gross loans and advances 0.32% 0.27% 0.05ppt
Impairment on AFS debt securities (309) (17) (292)
Other credit-risk provisions 104 147 (43)
Group 3,168 3,721 (553)
$m 2014 2015 vs. 2014
Full Year
Personal 281 512 (231)
Collective 279 495 (216)
Specific 2 17 (15)
Wholesale 718 994 (276)
Collective 137 253 (116)
Specific 581 741 (160)
Impairment on AFS debt securities (30) 28 (58)
Other credit-risk provisions 42 111 (69)
Group 1,011 1,645 (634)
$m 4Q14 4Q15 vs. 4Q14
Quarterly
4Q15 vs. 4Q14 by region
LICs increased
$634m
76
141
365
35
634
17Europe
Asia
Middle East and North Africa
North America
Latin America
Group
Loan impairment charges in our wholesale book remain low2015 vs.
2014
4Q15 vs. 4Q14
Wholesale 4Q15:‒ Increase driven by charges in the oil and gas sector, both
collective and specific (c. $0.4bn); and‒ specific impairment charges across a number of countries and
sectors, albeit at similar levels to last yearPersonal 4Q15:‒ Increase in collective impairments driven by Brazil ($0.1bn)
reflecting economic slowdown and in the US, from lower releases in the CML portfolio
Other credit-risk provisions:‒ Increased partly due to higher provisions relating to the oil and gas
sector
7
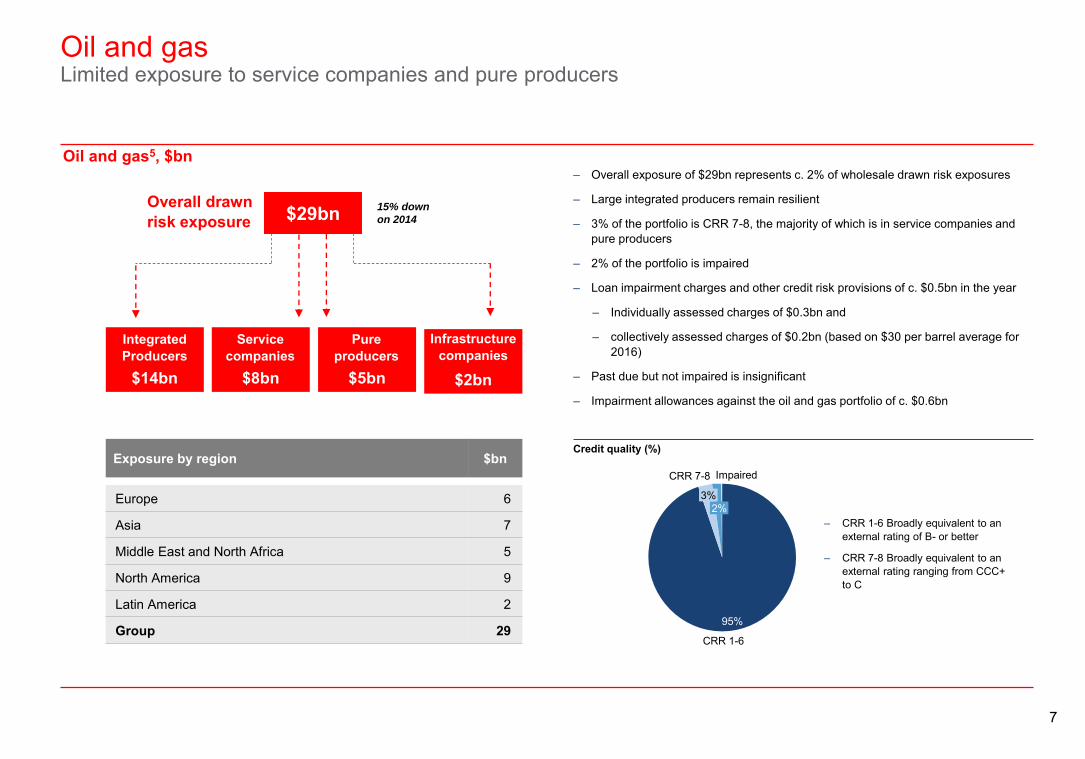
Oil and gasLimited exposure to service companies and pure producers
Oil and gas5, $bn
$29bn 15% down
on 2014
Overall drawn risk exposure
Impaired
2%
CRR 7-8
3%
CRR 1-6
95%
$8bn$14bn $5bn
Integrated Producers
Service companies
Pure producers
Credit quality (%)
$2bn
Infrastructure companies
‒ Overall exposure of $29bn represents c. 2% of wholesale drawn risk exposures
‒ Large integrated producers remain resilient
‒ 3% of the portfolio is CRR 7-8, the majority of which is in service companies and pure producers
‒ 2% of the portfolio is impaired
‒ Loan impairment charges and other credit risk provisions of c. $0.5bn in the year
‒ Individually assessed charges of $0.3bn and
‒ collectively assessed charges of $0.2bn (based on $30 per barrel average for 2016)
‒ Past due but not impaired is insignificant
‒ Impairment allowances against the oil and gas portfolio of c. $0.6bn
Europe 6
Asia 7
Middle East and North Africa 5
North America 9
Latin America 2
Group 29
Exposure by region $bn
‒ CRR 1-6 Broadly equivalent to an external rating of B- or better
‒ CRR 7-8 Broadly equivalent to an external rating ranging from CCC+ to C
8
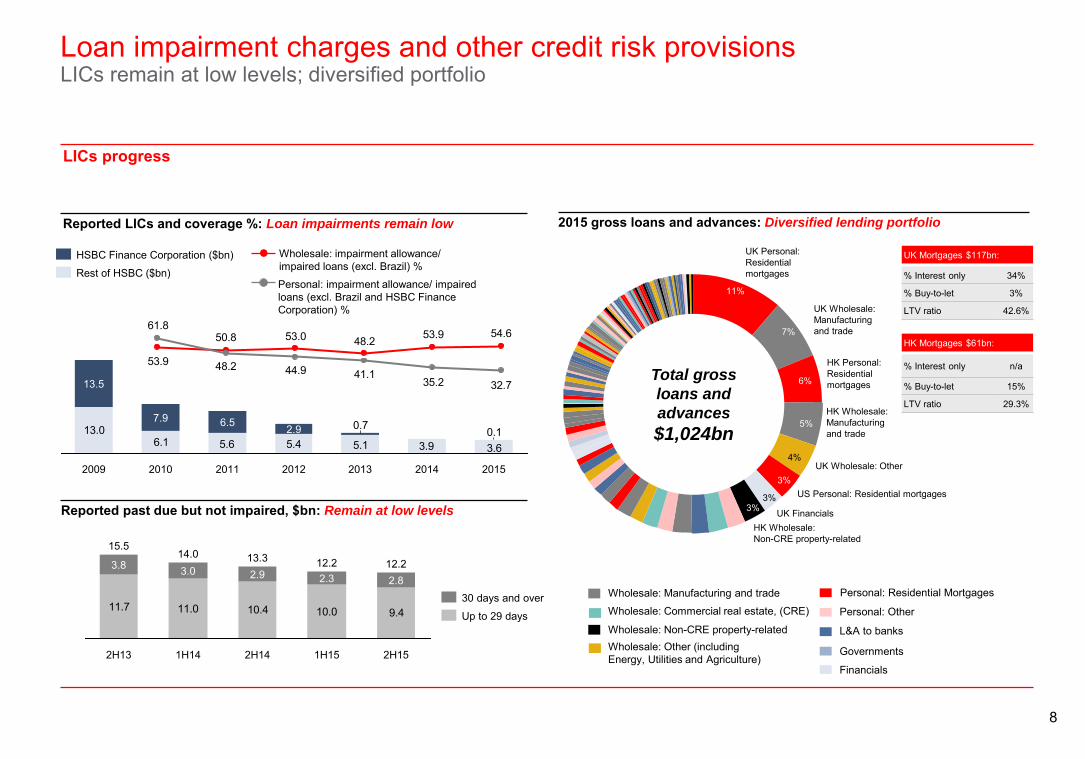
Loan impairment charges and other credit risk provisionsLICs remain at low levels; diversified portfolio
LICs progress
Reported LICs and coverage %: Loan impairments remain low
13.06.1 3.63.95.15.45.6
0.10.7
2015201420132012
2.9
2011
6.5
2010
7.9
2009
13.5
Reported past due but not impaired, $bn: Remain at low levels
54.653.948.253.050.8
53.9
32.735.241.144.948.2
61.8
11.7 11.0 10.4 10.0 9.4
2H15
12.2
1H15
12.2
2H14
13.3
1H14
14.0
2H13
15.5
2.82.33.8 3.0 2.9
Rest of HSBC ($bn)
HSBC Finance Corporation ($bn) Wholesale: impairment allowance/ impaired loans (excl. Brazil) %
Personal: impairment allowance/ impaired loans (excl. Brazil and HSBC Finance Corporation) % UK Wholesale:
Manufacturing and trade7%
UK Personal: Residential mortgages
11%
3%
HK Wholesale:Non-CRE property-related
US Personal: Residential mortgages
UK Financials
3%
3%
4%UK Wholesale: Other
5%HK Wholesale:Manufacturing and trade
6%
HK Personal:Residentialmortgages
2015 gross loans and advances: Diversified lending portfolio
Total gross
loans and
advances
$1,024bn
Wholesale: Manufacturing and trade
Wholesale: Non-CRE property-related
Wholesale: Commercial real estate, (CRE)
Wholesale: Other (including Energy, Utilities and Agriculture)
Personal: Residential Mortgages
Personal: Other
L&A to banks
Governments
Financials
30 days and over
Up to 29 days
% Interest only 34%
% Buy-to-let 3%
LTV ratio 42.6%
UK Mortgages $117bn:
% Interest only n/a
% Buy-to-let 15%
LTV ratio 29.3%
HK Mortgages $61bn:
11%
3%
3%

9
2015 Profit before tax performanceProgress on revenue and LICs remain at low levels; investments in growth, regulatory programmes and compliance and higher bank levy drive costs
Full year PBT analysis
RBWM 7,555 6,830 (725)
CMB 8,623 8,192 (431)
GB&M 7,678 8,746 1,068
GPB 703 519 (184)
Other (2,583) (3,869) (1,286)
Group 21,976 20,418 (1,558)
Europe 3,496 2,392 (1,104)
Asia 14,295 14,462 167
Middle East and North Africa 1,820 1,542 (278)
North America 1,999 1,563 (436)
Latin America 366 459 93
Group 21,976 20,418 (1,558)
PBT by global business, $m 2014 2015 vs. 2014
PBT by geography, $m 2014 2015 vs. 2014
Revenue
LICs
Operating expenses
Share of profits in associates and joint ventures
Profit before tax
Adjusted PBT by account line
$57,765m
2015 vs. 2014
$(3,721)m
$(36,182)m
$2,556m
$20,418m
$(34,761)m
63
538
(1,248)
(358)
(553)
(1,606)
(1,558) (7)%
1%
(17)%
3%
(5)%
adverse favourable
Operating expenses excl. bank levy
$(1,421)mBank levy (34)%
(4)%
10
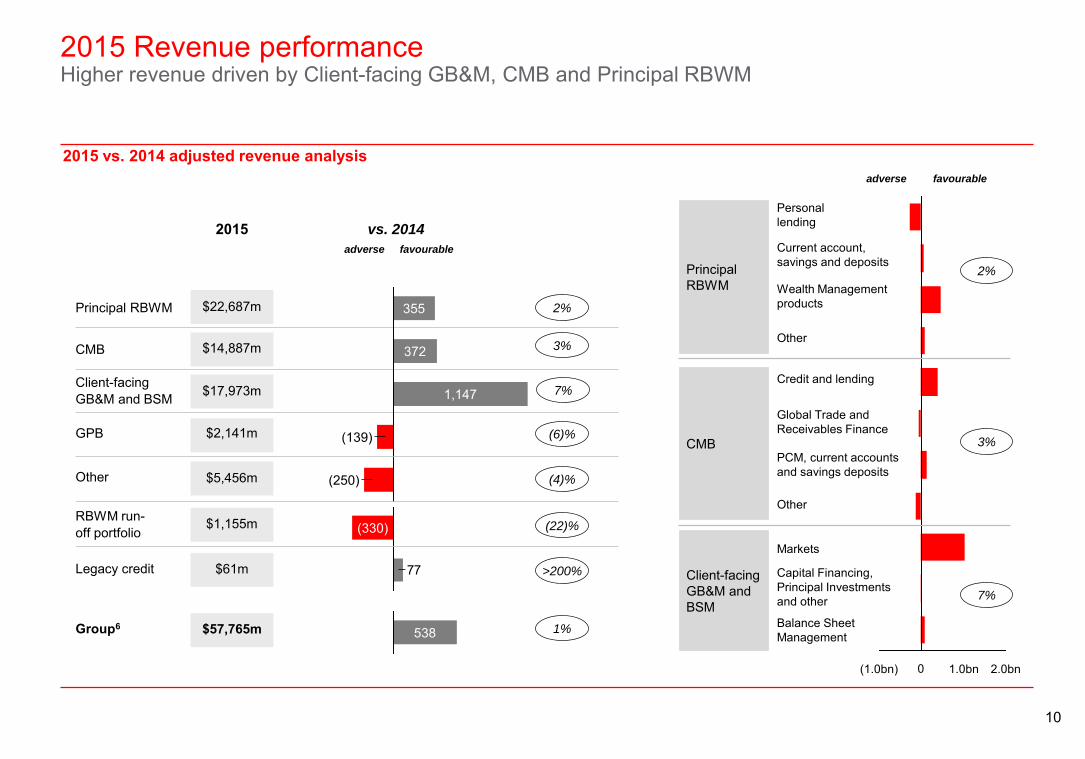
2015 Revenue performanceHigher revenue driven by Client-facing GB&M, CMB and Principal RBWM
2015 vs. 2014 adjusted revenue analysis
Principal RBWM $22,687m
2015 vs. 2014
CMB $14,887m
Client-facing GB&M and BSM $17,973m
GPB $2,141m
Other $5,456m
Legacy credit $61m
355
(250)
1,147
372
(139)
RBWM run-off portfolio
77
(330)$1,155m
Group6 $57,765m 538 1%
3%
7%
(6)%
(4)%
(22)%
>200%
2%
2.0bn1.0bn0(1.0bn)
Principal RBWM
CMB
Client-facing GB&M and BSM
Personal lending
Current account, savings and deposits
Wealth Management products
Other
Credit and lending
Global Trade and Receivables Finance
PCM, current accounts and savings deposits
Other
Markets
Balance Sheet Management
Capital Financing, Principal Investments and other
adverse favourable
2%
3%
7%
adverse favourable

11
1H15:$17.0bn
2H15:$16.9bn
excluding bank levy
2015 operating expenses2H15 costs in line with 1H15: tight cost control and initial effect of cost saving plans
UK bank levy3
Brazil operating expenses
Adjusted operating expenses ($bn)
Rebased 2017
target
7.6
4Q15
7.9
0.6
1.5
3Q15
0.5
2Q15
8.3
0.5
1Q15
7.7
0.5
(0.04)
4Q14
0.5
7.7
2Q14
8.1
0.6
3Q14
7.97.6
1.1
0.5
1Q14
7.3
0.5
(0.04)
Adjusted quarterly costs excl. bank levy vs. same quarter prior year, %
Regulatory programmes and compliance costs
$0.5bn $0.5bn $0.6bn $0.6bn $0.7bn $0.7bn $0.8bn $0.7bn
255.2 256.1 257.9 257.6 260.1 259.8 259.8 255.2FTEs, 000s
4Q15
(4)%
(2)%
3Q15
-%
3%
2Q15
7%
9%
1Q15
5%6%
4Q14
3%
8%
3Q14
5%6%
2Q14
5%6%
1Q14
(1)%
2%
Discrete quarter cost growth / (reduction) excl. regulatory programmes andcompliance
Discrete quarter cost growth / (reduction)

12
Operating expensesRebased Investor update target
Rebased Investor
Update target
30.5
2017 bank levy estimate (per Investor
Update)
(1.6)
2014 revised proforma at 2015 rates
32.1
FX translation8
(0.5)
2014 revised proforma
excl. Brazil
32.6
Turkey
0.6
2014 proforma
32.0
Brazil and FX translation
(5.9)
3.6
(2.3)
2014 Adj.
37.9
Rebased Investor Update 2015 target ($bn)
Quarterly run
rate excluding
the bank levy is
c. $7.6bn
Brazil & Turkey FX translation7
Investor Update
13
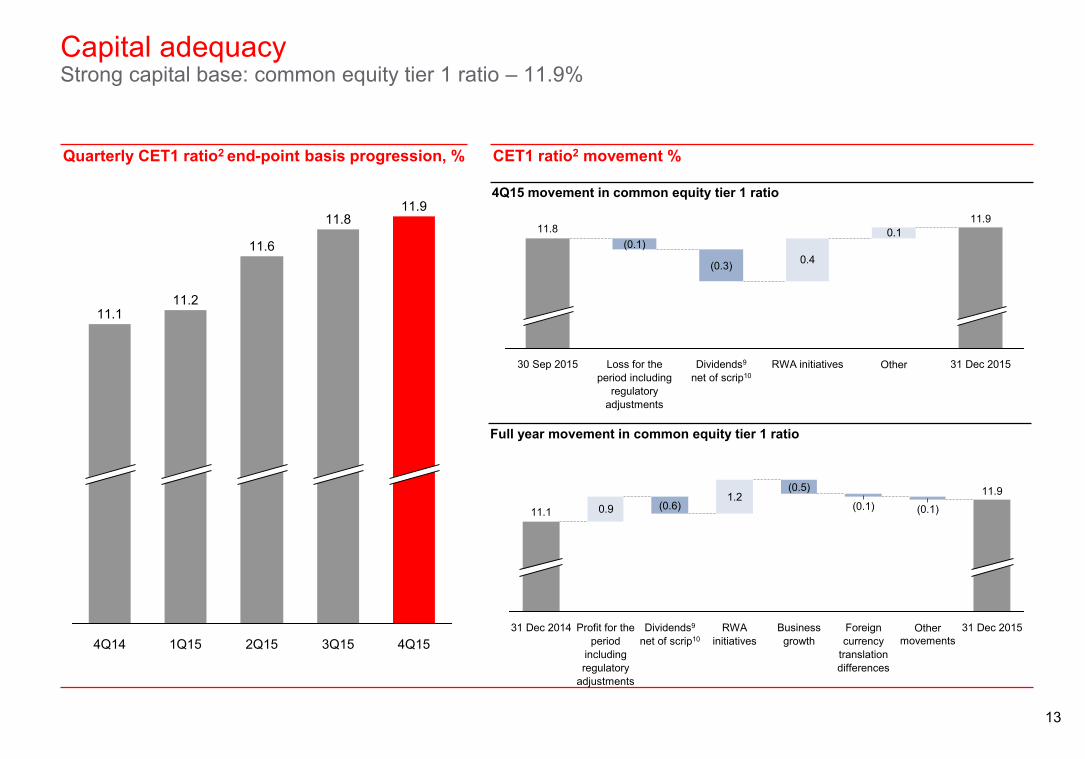
Capital adequacyStrong capital base: common equity tier 1 ratio – 11.9%
Quarterly CET1 ratio2 end-point basis progression, % CET1 ratio2 movement %
4Q15 movement in common equity tier 1 ratio
Full year movement in common equity tier 1 ratio
0.1
0.4
11.8
31 Dec 2015
11.9
OtherRWA initiativesDividends9
net of scrip10
(0.3)
Loss for the period including
regulatory adjustments
(0.1)
30 Sep 2015
4Q15
11.9
3Q15
11.8
2Q15
11.6
1Q15
11.2
4Q14
11.1
1.20.9
31 Dec 2015
11.9
Other movements
(0.1)
Foreign currency
translation differences
(0.1)
Business growth
(0.5)
RWA initiatives
Dividends9
net of scrip10
(0.6)
Profit for the period
including regulatory
adjustments
31 Dec 2014
11.1

14
Return metricsDrivers of returns
Group ROE, %
Adjusted RoRWA by global business (ex associates)
Principal RBWM 5.0% 4.5% 6.3%
CMB 2.4% 2.0% 2.7%
Client-facing GB&M & BSM 1.7% 2.0% 2.7%
GPB13 3.3% 2.5% 4.3%
Group RoRWA
Reported 1.5% 1.6%
Adjusted11 1.9% 1.7%
Adjusted excl. associates and run-off portfolios12 2.1% 1.9%
0.6
0.2
LICsIncrease
(0.2)
Operating expenses
excl. bank levy
(0.6)
Revenue Increase
9.6
Bank Levy 2015 excl. significant items and bank
levy
9.1
Additional Tier 1 and Lower Equity & Tax
0.1
(1.1)
Significant items
(0.8)
Bank Levy
7.2
2014 excl. significant items and bank
levy
2015Reported
7.3
2014 Reported
1.7
Significant Items & currency translation
2014 2015 2014 2015 2017 Target

15
Progress on our actions to capture value
Reduce Group RWAs by c.$290bn‒ Group RWA reduction: $290bn‒ GB&M <1/3 of Group RWAs
‒ 45% of our rebased target achieved; $124bn reduction through management initiatives
Optimise global network ‒ Reduced footprint‒ Signed agreement to sell operations in Brazil1 subject to regulatory approval ‒ Presence reduced to 71 countries and territories
Rebuild NAFTA profitability‒ US PBT c. $2bn‒ Mexico PBT c. $0.6bn
‒ US Principal: PBT of $0.5bn (up 6% on 2014); Revenue: $4.8bn (up 4% on 2014)‒ Mexico: PBT of $0.1bn (down 1% on 2014); Revenue: $2.0bn (up 2% on 2014)
Set up UK ring-fenced bank ‒ Completed by 2018 ‒ Confirmed Birmingham as head office location for HSBC UK
Deliver $4.5-5.0bn cost savings ‒ 2017 exit rate to equal 2014 operating expenses‒ 2H15 costs in line with 1H15 costs following tight cost control and the initial impact of our
cost saving plans‒ 4.6k reduction in FTE since June 2015
Strategic actions Progress during 2015
Actions to re-size and simplify
Actions to redeploy capital and invest
Deliver growth above GDP from international network ‒ Revenue growth of international network above GDP
‒ Transaction banking revenue: $15.7bn (up 4% on 2014 driven by FX, PCM and HSS)‒ Revenue synergies: $11.6bn (up 6% on 2014)
Pivot to Asia – prioritise and accelerate investments
‒ Market share gains‒ c. 10% growth p.a. in assets under management
‒ Pearl River Delta: applied to establish a majority-owned joint venture securities company, allowing us to engage in the full spectrum of securities business in mainland China
‒ Insurance manufacturing new business premiums: $2.0bn (up 7% on 2014)‒ Development of Asia business gaining momentum: revenue growth in excess of GDP in
seven out of eight priority markets ‒ ASEAN revenue: $3.2bn (up 5% on 2014); ‒ Asset Mgt. AUM distributed in Asia: $129bn (up 13% on 2014)
RMB internationalisation ‒ $2.0-2.5bn revenue ‒ Renminbi internationalisation revenue: $1.7bn (up 3% on 2014)
Global standards ‒ Completed implementation‒ Updated procedures across all markets to comply with new AML and sanctions policies‒ Enhanced infrastructure, transaction monitoring and screening
Domicile
Targeted outcome by 2017
Headquarters review ‒ Completed review by end of 2015 ‒ Review completed: decision announced to remain headquartered in the UK

16
Reduce RWAs by $290bn45% of our rebased target achieved
Key movements in Group RWAs ($bn)
9
15
52
1,103
35
124
1,220Dec-14(Actual)
Business growth
RWA initiatives
Regulatory and other movements
Movement in associates
Dec-15
2015 RWA initiatives14
RWA initiatives YTD vs. Investor Update target
FX translation
15290
Re-baselined target
275
FX translationInvestor Update target
45% of 2017 target achieved
10% reduction
14
1416
29
2823
CMB GB&M US run-off portfolio Other
Markets
Capital Financing and GTRF
Legacy
17
Revenue growth from our international networkGrowth above GDP from our international network
Revenue growth 2015 vs 2014
1.7
4.4
3.1
6.5
Total 15.7
HSS
FX
GTRF
PCM
Transaction Banking15
Transaction Banking Products
2015 Revenue $bn
4
(1)
7
7
Revenue Synergies, $bn International Client Revenue, $bn
7.3 7.7
3.7 3.9
2015
+6%
2014
11.011.6
4%
8%
Cross Business17
In Business16
Growth, %
4
Revenue growth 2015 vs 2014
International Client Revenue18
Revenue growth 2015 vs 2014Revenue Synergies16,17
Growth, %
24.723.5
+5%
20152014
45%45%
Proportion of client revenue
Transaction Banking
4% increase
International client revenue
5% increase
Revenue synergies
6% increase
18
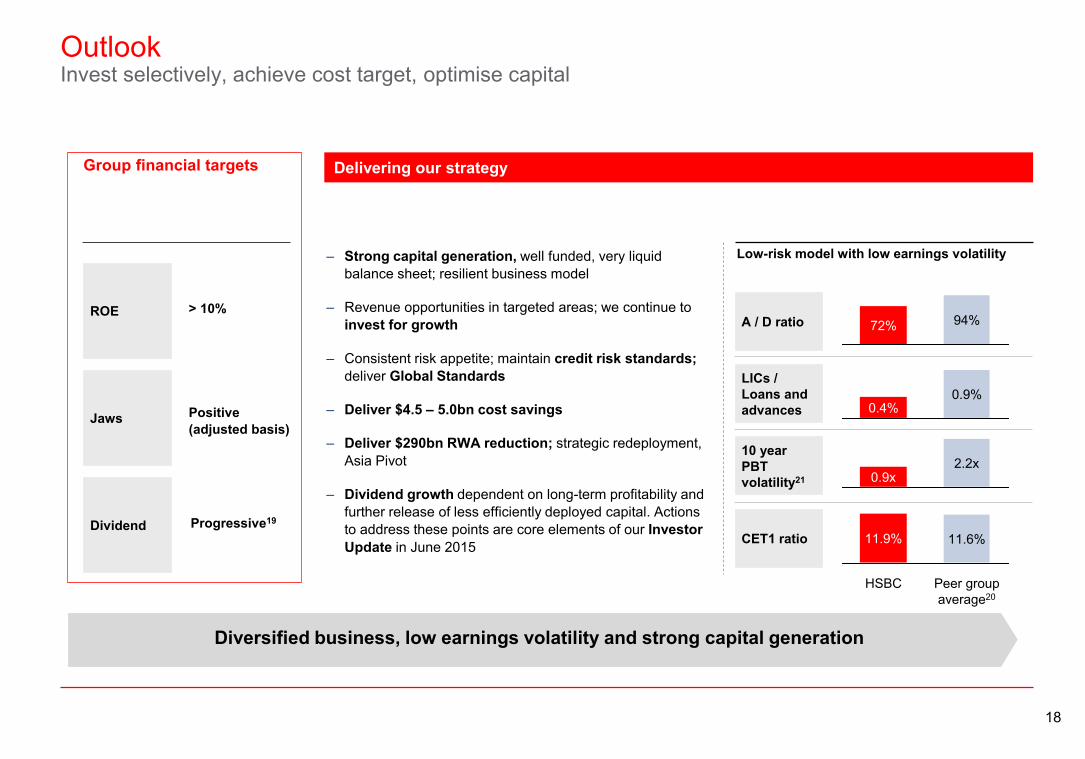
OutlookInvest selectively, achieve cost target, optimise capital
Group financial targets
ROE
Jaws
Dividend
> 10%
Positive (adjusted basis)
Progressive19
Delivering our strategy
Low-risk model with low earnings volatility
A / D ratio
LICs / Loans and advances
10 year PBT volatility21
CET1 ratio
Diversified business, low earnings volatility and strong capital generation
94%72%
0.4%0.9%
2.2x0.9x
HSBC Peer group average20
11.6%11.9%
‒ Strong capital generation, well funded, very liquid balance sheet; resilient business model
‒ Revenue opportunities in targeted areas; we continue to invest for growth
‒ Consistent risk appetite; maintain credit risk standards; deliver Global Standards
‒ Deliver $4.5 – 5.0bn cost savings
‒ Deliver $290bn RWA reduction; strategic redeployment, Asia Pivot
‒ Dividend growth dependent on long-term profitability and further release of less efficiently deployed capital. Actions to address these points are core elements of our Investor Update in June 2015

19
Appendix

20
AppendixCurrency translation and significant items
$m 4Q14 4Q15 2014 2015Currency translation 19 - 853 -
Significant items:Revenue
Gain / (Loss) on sale of several tranches of real estate secured accounts in the US 92 (214) 168 (214)Gain on the partial sale of shareholding in Industrial Bank - - - 1,372(Adverse) / Favourable debit valuation adjustment on derivative contracts (53) (186) (332) 230(Adverse) / Favourable fair value movements on non-qualifying hedges (200) 26 (541) (327)Provisions arising from the ongoing review of compliance with the Consumer Credit Act in the UK (51) (12) (632) (10)Favourable / (Adverse) movements on own credit spread 432 (774) 417 1,002Gain on sale of shareholding in Bank of Shanghai - - 428 -Impairment of our investment in Industrial Bank - - (271) -Brazil disposal costs - (18) - (18)Acquisition, disposals and dilutions (28) - 9 -
191 (1,177) (754) 2,035
Operating expensesCharge in relation to settlement agreement with Federal Housing Finance Authority - - (550) -Regulatory provisions in GPB (65) (18) (65) (172)Settlements and provisions in connection with legal matters (809) (370) (1,187) (1,649)UK customer redress programmes (340) (337) (1,275) (541)Restructuring and other related costs (128) - (278) (117)Costs-to-achieve - (743) - (908)Costs to establish UK ring-fenced bank - (61) - (89)Brazil disposal costs - (55) - (110)Acquisition, disposals and dilutions - - (40) -
(1,342) (1,585) (3,395) (3,586)
Currency translation and significant items (1,132) (2,762) (3,296) (1,551)

21
AppendixReported Consolidated Income statement
$m 4Q14 4Q15 2014 2015
Net interest income 8,547 8,059 34,705 32,531
Net fee income 3,718 3,471 15,957 14,705
Net trading income 1,190 1,408 6,760 8,723
Net income from financial instruments designated at fair value 557 (250) 2,473 1,532
Gains less losses from financial investments 420 20 1,335 2,068
Dividend income 22 27 311 123
Net insurance premium income 2,605 2,255 11,921 10,355
Other operating income 270 (52) 1,131 1,055
Total operating income 17,329 14,938 74,593 71,092
Net insurance claims and benefits paid and movements in liabilities to policyholders (3,023) (3,166) (13,345) (11,292)
Net operating income before loan impairment charges and other credit risk provisions 14,306 11,772 61,248 59,800
Loan impairment charges and other credit risk provisions (1,250) (1,645) (3,851) (3,721)
Net operating income 13,056 10,127 57,397 56,079
Total operating expenses (11,892) (11,542) (41,249) (39,768)
Operating profit 1,164 (1,415) 16,148 16,311
Share of profit in associates and joint ventures 567 557 2,532 2,556
Profit before tax 1,731 (858) 18,680 18,867
Cost efficiency ratio % 83.1 98.0 67.3 66.5

22
AppendixReported Consolidated Income statement by global business
$mRBWM CMB GB&M GPB Other Total22
2014 2015 2014 2015 2014 2015 2014 2015 2014 2015 2014 2015
Net interest income 17,130 15,926 10,158 9,859 7,022 6,931 994 870 (501) (710) 34,705 32,531
Net fee income 6,836 6,218 4,570 4,190 3,560 3,375 1,056 959 (65) (37) 15,957 14,705
Net trading income (17) 521 616 555 5,861 7,169 294 325 (92) (192) 6,760 8,723
Other income 1,200 851 404 266 1,335 758 33 18 7,023 8,543 3,826 3,841
Net operating income before loan impairment charges and other credit risk provisions 25,149 23,516 15,748 14,870 17,778 18,233 2,377 2,172 6,365 7,604 61,248 59,800
Loan impairment charges and other credit risk provisions (1,936) (1,939) (1,558) (1,770) (365) - 8 (12) - - (3,851) (3,721)
Net operating income 23,213 21,577 14,190 13,100 17,413 18,233 2,385 2,160 6,365 7,604 57,397 56,079
Total operating expenses (18,030) (17,020) (6,981) (6,744) (12,028) (10,834) (1,778) (1,832) (8,601) (9,933) (41,249) (39,768)
Operating profit 5,183 4,557 7,209 6,356 5,385 7,399 607 328 (2,236) (2,329) 16,148 16,311
Share of profit in associates and joint ventures 398 410 1,605 1,617 504 511 19 16 6 2 2,532 2,556
Profit before tax 5,581 4,967 8,814 7,973 5,889 7,910 626 344 (2,230) (2,327) 18,680 18,867

23
AppendixReported Consolidated Balance Sheet
$m At 31 Dec 2014 At 30 Jun 2015 At 31 Dec 2015Assets
Cash and balances at central banks 129,957 144,324 98,934Trading assets 304,193 283,138 224,837Financial assets designated at fair value 29,037 25,168 23,852Derivatives 345,008 296,942 288,476Loans and advances to banks 112,149 109,405 90,401Loans and advances to customers 974,660 953,985 924,454Reverse repurchase agreements – non trading 161,713 149,384 146,255Financial investments 415,467 404,682 428,955Assets held for sale 7,647 60,929 43,900Other assets 154,308 143,756 139,592
Total assets 2,634,139 2,571,713 2,409,656
LiabilitiesDeposits by banks 77,426 71,140 54,371Customer accounts 1,350,642 1,335,800 1,289,586Repurchase agreements – non trading 107,432 81,506 80,400Trading liabilities 190,572 181,435 141,614Financial liabilities designated at fair value 76,153 69,485 66,408Derivatives 340,669 289,984 281,071Debt securities in issue 95,947 102,656 88,949 Liabilities under insurance contracts 73,861 69,494 69,938Liabilities of disposal groups held for sale 6,934 53,226 36,840Other liabilities 114,525 115,605 102,961
Total liabilities 2,434,161 2,370,331 2,212,138
EquityTotal shareholders’ equity 190,447 192,427 188,460Non-controlling interests 9,531 8,955 9,058
Total equity 199,978 201,382 197,518Total equity and liabilities 2,634,139 2,571,713 2,409,656
Net assets value per ordinary share (NAV) - $ 9.28 9.11 8.73Tangible assets value per ordinary share (TNAV) - $ 7.91 7.81 7.48

24
Where the profit goes
Pre-tax variable pay
Pro-forma post-tax profits allocation
$m Group GB&M
2014 2015 2014 2015
Total variable pay pool 3,660 3,462 1,120 1,086
Variable compensation incentive pool as a % of pre-tax profit (pre-variable pay)
16% 16% 15% 12%
Proportion of variable pay pool deferred (%) 14% 15% 25% 26%
Variable pay24Dividends net of scrip23Retained earnings / capital
2014 2015
Growing ordinary dividends (in respect of the year), $bn
2013
5.4
3.8
201525
8.0
2.0
2014
6.7
2.9
10.0
9.29.6
Ordinary dividend, cashOrdinary dividend, shares in lieu
15%
46%
39%
16%
59%
25%

25
Metals and mining sector
Metals and mining, $bn
$18bnOverall drawn risk exposure
Impaired
1%
CRR 7-8
2%
CRR 1-6
97%
$3bn$4bn $2bn
Base / diversified
Bulk Precious metals
Credit quality (%)
$9bn
Steel / Aluminium
Europe 3
Asia 9
Middle East and North Africa 1
North America 5
Latin America -
Group 18
Exposure by region $bn
‒ CRR 1-6 Broadly equivalent to an external rating of B- or better
‒ CRR 7-8 Broadly equivalent to an external rating ranging from CCC+ to C
‒ $18bn represents c.1.5% of wholesale drawn risk exposure
‒ Precious metals, copper, nickel and zinc prices are generally forecast to improve slightly in 2016
‒ The outlook for steel, aluminium and bulk metals is more negative due to a combination of oversupply and reduction in demand
‒ 3% of the portfolio is CRR 7 or worse
‒ Loan impairment charges of c. $0.1bn during 2015
Copper, Zinc and Nickel
Iron ore and metallurgical coal
Gold and Silver

26
Mainland ChinaPortfolio continues to perform well
Mainland China drawn risk exposure26
46%Offshore
Onshore54%$143bn
Wholesale lending type (%)
26%
1%
51%
22%
Non-bankingfinancialinstitutions
Corporates
Banks
Sovereign
Corporate quality (%)
1%
99%
Impaired
CRR 7 - 8
CRR 1 - 6
‒ Wholesale: $135bn; Retail: $8bn
‒ HSBC’s market share is 0.2% which allows us to be selective in our lending
‒ Losses remain low (onshore loan impairment charges of c $0.1bn)
‒ Impaired loans and days past due trends are also stable
1%
99%
Dec-14 Dec-15
Key characteristics
Corporate real estate credit quality (%)
22%
1%
77%
Substandard
Satisfactory
Strong and good
Wholesale lending
‒ CRR 1-6 Broadly equivalent to an external rating of B- or better
‒ CRR 7-8 Broadly equivalent to an external rating ranging from CCC+ to C
‒ 99% of the banks are investment grade‒ Our Corporate lending is diversified with real
estate the largest sector comprising just over 20% of the portfolio ($15bn)
27
Group capital structureProgressing to end state capital structure
Evolution of Group capital structure in % of RWA27
2.0%
2.6%
TLAC debt>8.0%
End point TLAC requirements
1st January 2019
5.2%
1.3%
4.5%
Transitional requirements
1st January 2016
4.5%
1.3%
2.0%
2.6%
1.3%
Transitional capital & senior debt
31st December 2015
11.9%
2.0%
3.3%
6.1%Senior debt28
TLAC ratio + buffers> 23.6%23.3%
17.2% total
capital ratio
Loss Absorption
(Pillar 1 + Pillar 2A)
Recapitalisation
Combined buffer29
End point requirements 2019 - assumptions
‒ Loss absorption Pillar 1 and capital buffer requirements per CRD IV; Pillar 2A requirements as currently communicated by the PRA (held constant for illustration)
‒ BoE expected to align MREL with TLAC, with recapitalisation amount to be confirmed upon assessment of our resolution strategy
‒ MPE resolution groups local requirements expected to be no higher than group consolidated (SPE) requirement
TLAC issuance
‒ HSBC plans to raise USD60 - 80bn27 of TLAC debt over the period 2016-18 to meet these requirements. Total senior debt redemptions from the HSBC Group entities during that period will amount to c.USD51bn28
‒ Per the TLAC finalised principles27 HSBC will be required to accumulate additional TLAC debt of 2% of RWAs by 1 January 2022
‒ In 2016 HSBC Holdings plc will be the sole issuer of external TLAC debt for the Group
‒ TLAC debt will be downstreamed in a form compliant with local regulations
Additional tier 1CET1 Tier 2 TLAC debt > 1 year

28
AppendixFootnotes
1. We plan to maintain a corporate presence in Brazil to serve our international clients
2. From 1 January 2015 the CRD IV transitional CET1 and end-point CET1 capital ratios became aligned for HSBC Holdings plc due to recognition of unrealised gains on investment property and available-for-sale securities
3. Net bank levy charge was $1,421m in 2015 and $1,063m in 2014; 1Q14 and 1Q15 included credits relating to the prior year’s bank levy charge of $45m and $44m respectively
4. Other revenue and operating expenses-related significant items include:
For a complete list, refer to slide 20
5. Excludes Brazil
6. Group also includes $6.6bn of intersegment elimination
$m 4Q14 4Q15 2014 2015Revenue
(Adverse) / favourable debit valuation adjustment on derivative contracts (53) (186) (332) 230(Adverse) / favourable fair value movements on non-qualifying hedges (200) 26 (541) (327)Provisions arising from the ongoing review of compliance with the Consumer Credit Act in the UK (51) (12) (632) (10)Gain on sale of shareholding in Bank of Shanghai - - 428 -Impairment of our investment in Industrial Bank - - (271) -Brazil disposal costs - (18) - (18)Acquisition, disposals and dilutions (28) - 9 -
(332) (190) (1,339) (125)
Operating expensesCharge in relation to settlement agreement with Federal Housing Finance Authority - - (550) -Regulatory provisions in GPB (65) (18) (65) (172)Restructuring and other related costs (128) - (278) (117)Costs to establish UK ring-fenced bank - (61) - (89)Brazil disposal costs - (55) - (110)Acquisition, disposals and dilutions - - (40) -
(193) (135) (933) (488)
29
AppendixFootnotes
7. Effect of translating the 2014 adjusted operating expenses to 1Q15 foreign exchange rates as per Investor Update 2015
8. Effect of translating the Investor Update target to 2015 foreign exchange rates
9. This includes dividends on ordinary shares, quarterly dividends on preference shares and coupons on capital securities, classified as equity
10. Dividends net of scrip includes fourth interim dividends net of planned 20% scrip take-up
11. Adjusted RoRWAs are calculated using annualised adjusted PBT and reported RWAs at constant currency, adjusted for significant items
12. Run-off portfolios mainly comprise GB&M Legacy Credit and RBWM US run-off portfolios
13. Due to the nature of its business, GPB measures the performance of its business through other measures including Net New Money and Return on Assets
14. Enhanced processes during Q4 resulted in the retrospective recognition of $6.7bn of RWA initiatives and $4.8bn Business growth from prior quarters
15. Includes revenue from our Payments and Cash Management, Global Trade and Receivables Finance, Foreign Exchange and Securities Services businesses across all global businesses
16. In business synergies include separately managed operations (Securities Services, Asset Management and Life Insurance (manufacturing)) that are reported within a global business line. Revenue from Asset management products to GB&M, CMB and GPB customers that are included in cross-business synergies are excluded from manufacturing revenues in in-business synergies
17. Cross-business synergies are presented as gross revenue and do not reflect any revenue sharing arrangement between Global Businesses. The principal components of cross-business synergies are (i) in GB&M: PCM and GTRF solutions from CMB, and Asset management products from RBWM; (ii) in CMB: FX, derivatives, and capital financing from GB&M, Investment and insurance, and Asset management products from RBWM; (iii) in RBWM: Global Markets products for retail and business banking customers and (iv) in GPB: referrals from other global businesses, Global Markets products to private clients and Insurance and Asset Management products from RBWM
18. Revenue from International Clients is an estimate based on information held in our client system applied to adjusted revenue. Client Revenue is defined as Group adjusted revenue excluding Other Global Business / Inter-segment, BSM, Principal Investments, Legacy Credit and US CML Run Off. International clients are businesses and individuals with an international presence
19. Progression of dividends should be consistent with the growth of the overall profitability of the Group, and is predicated on the ability to meet all capital requirements in a timely manner
20. Peer group average calculated using latest available reported financials for sample set of 5 global banks (JP Morgan, BNP Paribas, Citigroup, Deutsche Bank, Standard Chartered) and 5 regional banks (DBS, Santander, Itau, ICBC and Barclays)
21. Calculated as average of the PBT range divided by average PBT for the last 10 years for the peers defined
22. Amounts are non-additive across global businesses due to intercompany transactions within the Group
23. Inclusive of dividends to holders of other equity instruments and net of scrip issuance based on an assumption of scrip take up for the fourth quarter of 2015 of 20%. Dividends per ordinary share declared in respect of 2015 were $0.51, an increase of 2% compared with 2014. The post-tax profits allocation figures shown in the Annual Report and Accounts 2014 in respect of that year assumed a scrip take up of 20%. The figures shown above in relation to 2014 have been calculated based on an actual scrip take up of 52%
24. Total variable pay pool net of tax and portion to be delivered by the award of HSBC shares
25. Includes fourth interim dividend with scrip estimated at 20%
26. Retail drawn exposures represent retail lending booked in mainland China; wholesale drawn exposures represents wholesale lending where the ultimate parent or beneficial owner is Chinese
30
AppendixFootnotes
27. Based on our interpretation of the Financial Stability Board’s (‘FSB’) ‘Principles on Loss-absorbing and Recapitalisation Capacity of G-SIBs in Resolution’ (published in November 2015). Estimate is based on the higher of 16% of Group consolidated third party RWAs (excluding associates) and twice the Basel III Tier 1 leverage ratio of 3% (these increase to 18% and 6.75%, respectively, by 1 January 2022). HSBC is subject to BRRD firm-specific MREL requirements; the BoE is currently consulting on its implementation in the UK. Final implementation of the rules could differ from FSB. Further, prospective regulatory RWA changes may increase the TLAC requirement
28. Senior debt includes senior unsecured and structured notes issued to external investors with size above $250m equivalent and with more than 18 months maturity at the time of issue
29. The combined buffer is comprised of a Capital Conservation Buffer (CCB) of 2.5%; a G-SII buffer currently set at 2.5%; and a Countercyclical Capital Buffer (CCyB) dependent on the buffer rates set by regulators – the Group CCyB rate on 1 January 2016 is approximately nil; the 2019 CCyB estimate of approximately 0.2% is based on announced and confirmed rates as of 31 December 2015 (future increases in the CCyB rate, where not formally confirmed, have not been included in our numbers). The G-SII and CCB are phased-in from 1 January 2016 to 1 January 2019. The G-SII buffer, CCyB buffer and Pillar 2A requirements are subject to change over time

31
AppendixImportant notice and forward-looking statements
Important notice
The information set out in this presentation and subsequent discussion does not constitute a public offer for the purposes of any applicable law or an offer to sell or solicitation of any offer to purchase any securities or other financial instruments or any recommendation in respect of such securities or instruments.
Forward-looking statements
This presentation and subsequent discussion may contain projections, estimates, forecasts, targets, opinions, prospects, results, returns and forward-looking statements with respect to the financial condition, results of operations, capital position and business of the Group (together, “forward-looking statements”). Any such forward-looking statements are not a reliable indicator of future performance, as they may involve significant assumptions and subjective judgements which may or may not prove to be correct and there can be no assurance that any of the matters set out in forward-looking statements are attainable, will actually occur or will be realised or are complete or accurate. Forward-looking statements are statements about the future and are inherently uncertain and generally based on stated or implied assumptions. The assumptions may prove to be incorrect and involve known and unknown risks, uncertainties, contingencies and other important factors, many of which are outside the control of the Group. Actual achievements, results, performance or other future events or conditions may differ materially from those stated, implied and/or reflected in any forward-looking statements due to a variety of risks, uncertainties and other factors (including without limitation those which are referable to general market conditions or regulatory changes). Any such forward-looking statements are based on the beliefs, expectations and opinions of the Group at the date the statements are made, and the Group does not assume, and hereby disclaims, any obligation or duty to update them if circumstances or management’s beliefs, expectations or opinions should change. For these reasons, recipients should not place reliance on, and are cautioned about relying on, any forward-looking statements. Additional detailed information concerning important factors that could cause actual results to differ materially is available in our 2015 Annual Report and Accounts.
This presentation contains non-GAAP financial information. The primary non-GAAP financial measure we use is ‘adjusted performance’ which is computed by adjusting reported results for the period-on-period effects of foreign currency translation differences and significant items which distort period-on-period comparisons. Significant items are those items which management and investors would ordinarily identify and consider separately when assessing performance in order to better understand the underlying trends in the business. Reconciliations between non-GAAP financial measurements and the most directly comparable measures under GAAP are provided in the 2015 Annual Report and Accounts and the Reconciliations of Non-GAAP Financial Measures document which are both available at www.hsbc.com.

Issued by HSBC Holdings plcGroup Investor Relations8 Canada SquareLondon E14 5HQUnited KingdomTelephone: 44 020 7991 3643www.hsbc.com
Cover image: Tsing Ma Bridge carries road and rail traffic to Hong Kong International Airport and accommodates large container ships. At HSBC, we help customers across the world to trade and invest internationally.
Photography: Getty Images