Embed Size (px)
Citation preview

2015 Annual Report

Restaurant Brands New Zealand Limited is a corporate franchisee that operates the New Zealand outlets of KFC, Pizza Hut, Starbucks Coffee and Carl’s Jr. These brands – four of the world’s most famous – are distinguished for their product, look, style and ambience, service and for the total experience they deliver to their customers in New Zealand and around the world.
RESTAURANT BRANDS MOVES FORWARD WITH PACE & PURPOSEPerforming beyond expectations and getting stronger every day. Applying knowledge and expertise across the business. Delivering the goods.
1 1
Contents
02 Financial highlights
03 Year in review
04 Chairman’s and Chief Executive’s report to shareholders
10 Pace & purpose
14 Introducing our senior leadership team
18 KFC operations
20 Pizza Hut operations
22 Carl’s Jr. operations
24 Starbucks Coffee operations
26 Board of directors
28 Community spirited, sustainably principled
31 Consolidated income statement
32 Non-GAAP financial measures
34 Financial statements
68 Independent auditors’ report
69 Shareholder information
71 Statutory information
74 Statement of corporate governance
78 Corporate directory
79 Financial calendar
2
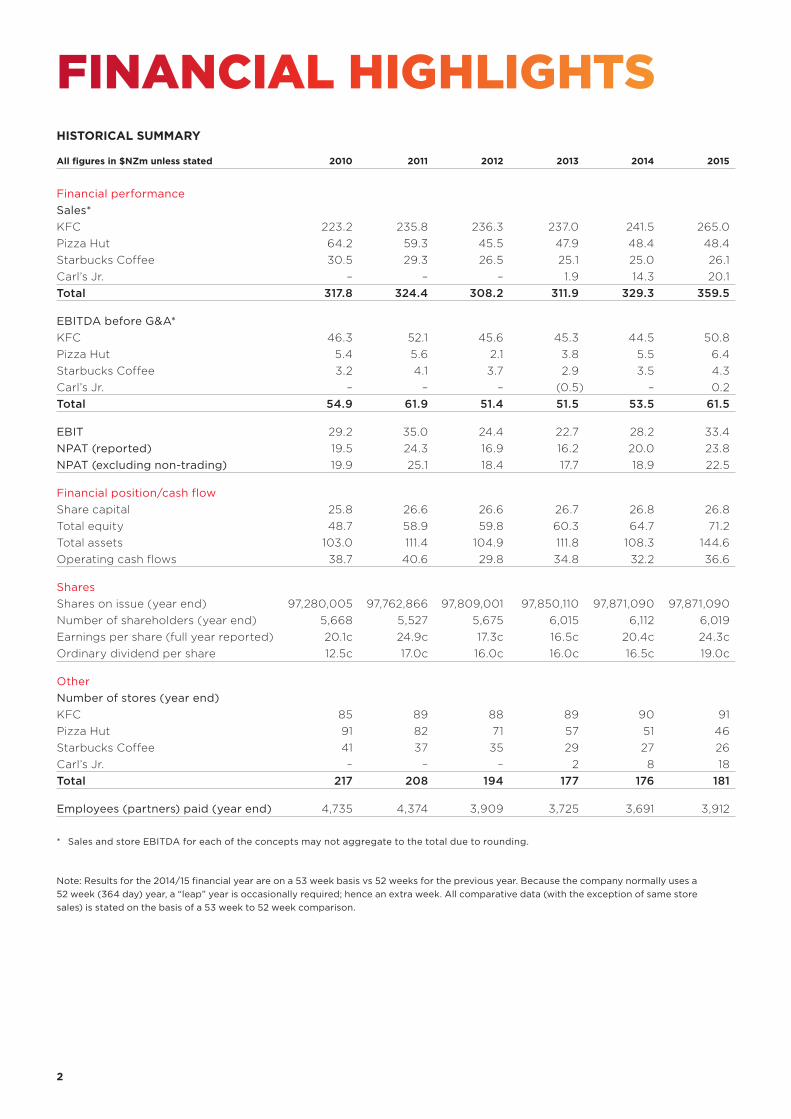
All figures in $NZm unless stated 2010 2011 2012 2013 2014 2015
Financial performance Sales*KFC 223.2 235.8 236.3 237.0 241.5 265.0Pizza Hut 64.2 59.3 45.5 47.9 48.4 48.4Starbucks Coffee 30.5 29.3 26.5 25.1 25.0 26.1Carl’s Jr. – – – 1.9 14.3 20.1Total 317.8 324.4 308.2 311.9 329.3 359.5
EBITDA before G&A*KFC 46.3 52.1 45.6 45.3 44.5 50.8Pizza Hut 5.4 5.6 2.1 3.8 5.5 6.4Starbucks Coffee 3.2 4.1 3.7 2.9 3.5 4.3Carl’s Jr. – – – (0.5) – 0.2Total 54.9 61.9 51.4 51.5 53.5 61.5
EBIT 29.2 35.0 24.4 22.7 28.2 33.4NPAT (reported) 19.5 24.3 16.9 16.2 20.0 23.8NPAT (excluding non-trading) 19.9 25.1 18.4 17.7 18.9 22.5
Financial position/cash flowShare capital 25.8 26.6 26.6 26.7 26.8 26.8Total equity 48.7 58.9 59.8 60.3 64.7 71.2Total assets 103.0 111.4 104.9 111.8 108.3 144.6Operating cash flows 38.7 40.6 29.8 34.8 32.2 36.6
SharesShares on issue (year end) 97,280,005 97,762,866 97,809,001 97,850,110 97,871,090 97,871,090Number of shareholders (year end) 5,668 5,527 5,675 6,015 6,112 6,019Earnings per share (full year reported) 20.1c 24.9c 17.3c 16.5c 20.4c 24.3cOrdinary dividend per share 12.5c 17.0c 16.0c 16.0c 16.5c 19.0c
OtherNumber of stores (year end)KFC 85 89 88 89 90 91Pizza Hut 91 82 71 57 51 46Starbucks Coffee 41 37 35 29 27 26Carl’s Jr. – – – 2 8 18Total 217 208 194 177 176 181
Employees (partners) paid (year end) 4,735 4,374 3,909 3,725 3,691 3,912
* Sales and store EBITDA for each of the concepts may not aggregate to the total due to rounding.
HISTORICAL SUMMARY
FINANCIAL HIGHLIGHTS
Note: Results for the 2014/15 financial year are on a 53 week basis vs 52 weeks for the previous year. Because the company normally uses a 52 week (364 day) year, a “leap” year is occasionally required; hence an extra week. All comparative data (with the exception of same store sales) is stated on the basis of a 53 week to 52 week comparison.
3
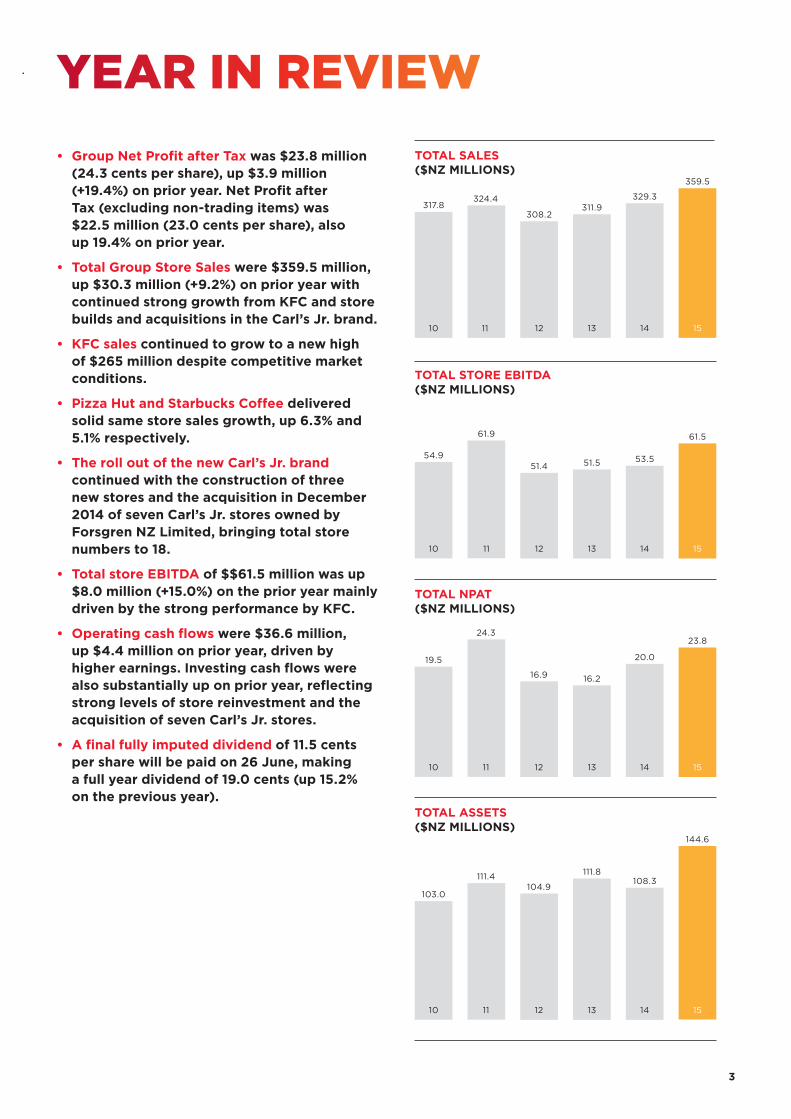
• Group Net Profit after Tax was $23.8 million (24.3 cents per share), up $3.9 million (+19.4%) on prior year. Net Profit after Tax (excluding non-trading items) was $22.5 million (23.0 cents per share), also up 19.4% on prior year.
• Total Group Store Sales were $359.5 million, up $30.3 million (+9.2%) on prior year with continued strong growth from KFC and store builds and acquisitions in the Carl’s Jr. brand.
• KFC sales continued to grow to a new high of $265 million despite competitive market conditions.
• Pizza Hut and Starbucks Coffee delivered solid same store sales growth, up 6.3% and 5.1% respectively.
• The roll out of the new Carl’s Jr. brand continued with the construction of three new stores and the acquisition in December 2014 of seven Carl’s Jr. stores owned by Forsgren NZ Limited, bringing total store numbers to 18.
• Total store EBITDA of $$61.5 million was up $8.0 million (+15.0%) on the prior year mainly driven by the strong performance by KFC.
• Operating cash flows were $36.6 million, up $4.4 million on prior year, driven by higher earnings. Investing cash flows were also substantially up on prior year, reflecting strong levels of store reinvestment and the acquisition of seven Carl’s Jr. stores.
• A final fully imputed dividend of 11.5 cents per share will be paid on 26 June, making a full year dividend of 19.0 cents (up 15.2% on the previous year).
10
317.8
11
324.4
12
308.2
13
311.9329.3
14
359.5
15
TOTAL SALES($NZ MILLIONS)
10
103.0
11
111.4
12
104.9
13
111.8
14
108.3
TOTAL ASSETS($NZ MILLIONS)
TOTAL STORE EBITDA($NZ MILLIONS)
10
54.9
11
61.9
12
51.4
13
51.5
14 15
53.5
61.5
10
19.5
11
24.3
12
16.9
13
16.2
14 15
20.0
23.8
TOTAL NPAT($NZ MILLIONS)
YEAR IN REVIEW
15
144.6
Note: Results for the 2014/15 financial year are on a 53 week basis vs 52 weeks for the previous year. Because the company normally uses a 52 week (364 day) year, a “leap” year is occasionally required; hence an extra week. All comparative data (with the exception of same store sales) is stated on the basis of a 53 week to 52 week comparison.
4
2015 $m
2014 $m
Change %
Total Group Store Sales 359.5 329.3 +9.2
Group Net Profit after Tax 23.8 20.0 +19.4
Dividend (cps) 19.0 16.5 +15.2
Group Operating ResultsRestaurant Brands Net Profit after Tax for the 53 weeks to 2 March 2015 (FY15) was $23.8 million (24.3 cents per share), up 19.4% on last year’s profit of $20.0 million (20.4 cents per share).
Net Profit after Tax (excluding non-trading items) was $22.5 million (23.0 cps) also up 19.4% on the $18.9 million (19.3 cps) result in FY14.
Non-trading items primarily comprised gains on Pizza Hut store sales and the sale and leaseback of a KFC store. In total non-trading items contributed $1.3 million (pre-tax) compared with $1.5 million in the prior year.
Chairman’s and Chief Executive’s
REPORT TO SHAREHOLDERS
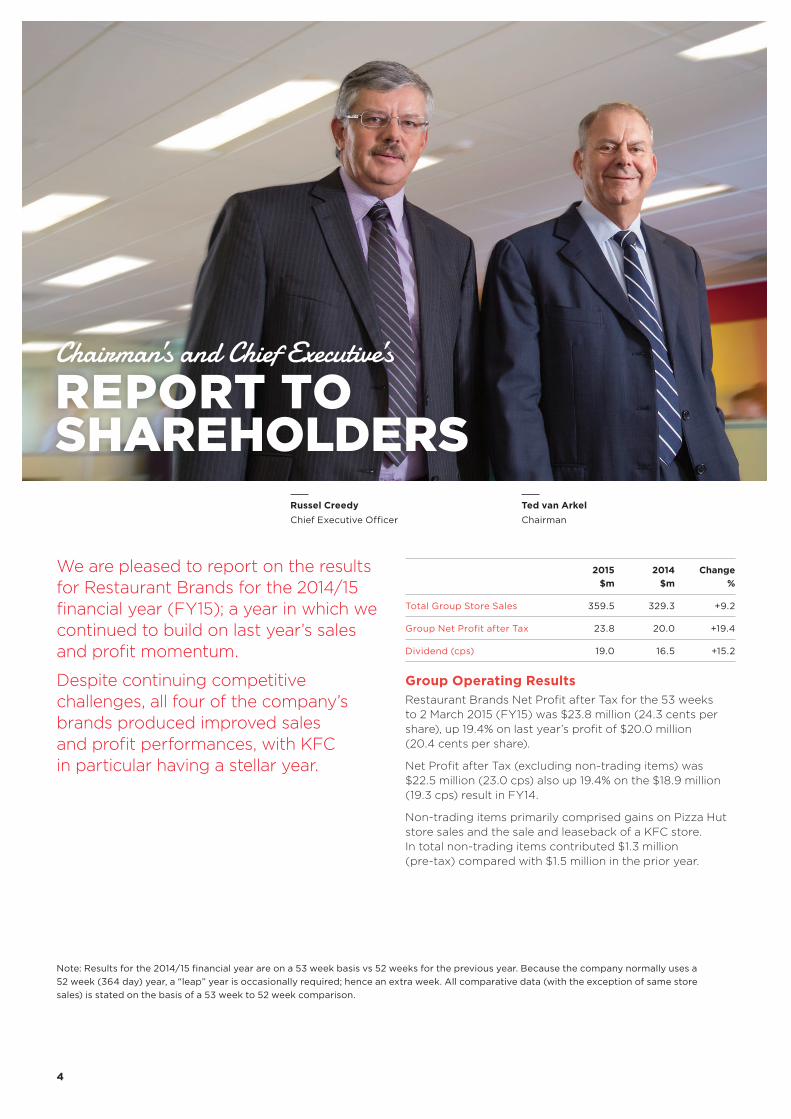
Ted van Arkel Chairman
Russel Creedy Chief Executive Officer
We are pleased to report on the results for Restaurant Brands for the 2014/15 financial year (FY15); a year in which we continued to build on last year’s sales and profit momentum.
Despite continuing competitive challenges, all four of the company’s brands produced improved sales and profit performances, with KFC in particular having a stellar year.
5
Total store sales of $359.5 million were up $30.3 million (+9.2%) on the previous year’s sales. The extra trading week accounted for $6.9 million of the increase with the majority of the balance coming from KFC and Carl’s Jr.
Same store sales for the group were up 5.7% (up 2.4% in FY14).
Group revenues for the year were $372.6 million with the inclusion of sales of ingredients and packaging materials to independent franchisees. This produced an increase in other revenues of $11.9 million on prior year.
Store EBITDA (before G&A costs) was up by $8.0 million (+15.0%) to $61.5 million, with KFC contributing $6.3 million of the improved earnings. All four brands delivered improved results on last year.
Year end store numbers at 181 were five up on February 2014 with continuing sales of regional Pizza Hut stores to independent franchisees, offset by the Forsgren acquisition and new builds for Carl’s Jr.
KFC
2015 $m
2014 $m
Change $m
Change %
Sales 265.0 241.5 +23.5 +9.7
EBITDA 50.8 44.5 +6.3 +14.0
EBITDA as % of Sales
19.2 18.4 – +0.8
KFC, the company’s biggest brand, continued its strong run, producing record annual sales of $265.0 million, an increase of $23.5 million or 9.7% on the prior year (noting that $5 million of this was derived from the extra week’s trading). Same store sales were strong throughout the year with the first half delivering same store sales growth of +6.4% and finishing the full year at +7.7% (compared with +0.2% last year).
KFC continued to roll out a range of new products throughout the year. These included a new burger range – the Colonel’s Stack burger, the Kiwi Onion Dip burger and the Moroccan burger. Other successful KFC promotional activity included the release of new Double Down
variants and a re-launch of the popular Hot ‘n Spicy range. Continued store transformation investment, in-store operational enhancements (including extended opening hours) and an increase in marketing and promotional spend also reinforced the strong same store sales momentum.
Margins were up on prior year with the brand producing an EBITDA of $50.8 million, +14.0% ($6.3 million) up on prior year. As a % of sales, brand EBITDA improved from 18.4% in FY14 to 19.2% this year.
Store transformations picked up momentum in FY15 with ten major transformations undertaken and twelve minor upgrades. The major transformation process is now nearly complete with 82 out of the company’s 91 stores now either new or fully transformed.
Store numbers increased to 91 with the acquisition of two stores from independent franchisees in Mt Maunganui and Oamaru and the closure of the Taihape store at end of lease.
Net profit
UP 19.4%Same store sales
UP 5.7%
Chairman’s and Chief Executive’s report to shareholders (continued)
6
Pizza Hut
2015 $m
2014 $m
Change $m
Change %
Sales 48.4 48.4 – –0.1
EBITDA 6.4 5.5 +0.9 +15.8
EBITDA as % of Sales
13.2 11.4 – +1.8
Pizza Hut continued to enhance both sales and profit despite continuing strong competition. Total sales were held flat to prior year at $48.4 million, with five fewer stores operating as a result of continued sell downs to independent franchisees. Same store sales continued to perform strongly at +6.3% (+15.3% in FY14). The brand undertook a number of promotions such as the Mexican range and innovative Stuffed Crust variants that were also particularly well received by customers.
Despite the lower store numbers Pizza Hut improved total earnings on prior year, with all stores operating profitably. The continued improvements in sales volumes, cost-effective menu changes and limited ingredient cost pressures, increased earnings by $0.9 million (+15.8%) on prior year. Resulting EBITDA was $6.4 million or 13.2% of sales (11.4% in FY14).
The sale of stores to independent franchisees continued, with five being sold, leaving Restaurant Brands with a total of 46 stores out of a total of 88 in the market. Favourable trading conditions have underpinned the strong demand from potential purchasers of the company’s Pizza Hut stores.
Starbucks Coffee
2015 $m
2014 $m
Change $m
Change %
Sales 26.1 25.0 +1.0 +4.1
EBITDA 4.3 3.5 +0.8 +21.6
EBITDA as % of Sales
16.3 14.0 – +2.3
The Starbucks Coffee brand continued with consistent improvements in its business performance to where this year’s earnings were at an all-time high. Improved operational standards in conjunction with a rationalised network of stores assisted the brand in delivering total sales of $26.1 million, a growth rate of +4.1% and same store growth of +5.1% for the year (+5.7% for FY14).
Improved sales and continuing operating efficiencies (with some assistance from a stronger exchange rate) saw Starbucks Coffee EBITDA climb to a new high of $4.3 million (or 16.3% of sales), an increase of 21.6% on the prior year result.
Carl’s Jr.
2015 $m
2014 $m
Change $m
Change %
Sales 20.1 14.3 +5.7 +40.1
EBITDA 0.2 0.0 +0.2 n/m*
EBITDA as % of Sales
0.8 – – +0.8
*not meaningful
Our commitment to the development of the Carl’s Jr. brand was reinforced by the acquisition of the seven stores operated by Forsgren NZ Limited, and the opening of three new stores in Gisborne, Albany and Manukau, increasing the number of stores to 18. Total sales were up by over 40% to $20.1 million, while same store sales remained negative as the brand rolled over very high volumes due to new store openings in comparative prior year periods.
The Carl’s Jr. brand experienced margin pressures from a variety of sources over the year. New store openings continued to incur training and set up expenditure and there were a number of incremental costs incurred in integrating the Forsgren stores into the Restaurant Brands’ network. Food costs were adversely impacted by major industrial action at the West Coast US ports, necessitating an urgent search for alternative sources of supply at often significant cost premiums. The industrial action has now been settled and normal shipments will be under way again by the middle of the current year. The company is prioritising local sourcing where possible. Heavy competitive discounting also meant that the brand was limited in its ability to recover cost increases, further impacting margins.
Operating cash flows up $4.4 million to
$36.6 MILLION
MARGINS IMPROVED ACROSS ALL FOUR BRANDS
7
Despite this the brand managed to deliver a small improvement in EBITDA from break-even to $0.2 million for the year. The company is focused on developing the brand and improving the profitability of the business in the coming year now that Carl’s Jr. has sufficient scale and presence in the market.
Corporate and Other CostsG&A (above store overheads) at $15.1 million were $2.0 million up on prior year. Most of this increase arose from variable remuneration costs (self-funding) that were incurred as the business improved profitability. As a result G&A costs were slightly above the targeted 4.0% of operating revenue at 4.1% (4.0% in FY14).
A $0.3 million pre-tax charge was taken up to G&A costs in the year to recognise the fair value of the liability that directors believe will arise as a result of eligibility conditions being met under the Chief Executive’s Long Term Incentive Scheme.
Group non-trading gains of $1.3 million arose primarily from gains on sale following the successful sale and leaseback of a KFC store ($0.9 million) and Pizza Hut store disposals ($0.8 million). This compares with a $1.5 million non-trading profit in FY14.
Depreciation charges of $15.0 million were up $0.9 million on the prior year largely as a result of the Carl’s Jr. new store roll out and Forsgren purchase (an additional $1.0 million). Reduced depreciation charges in Pizza Hut with store disposals amounted to $0.3 million and the KFC depreciation charge at $10.5 million was flat compared with the prior year.
Interest and funding costs at $1.0 million were up slightly on prior year with a small increase in borrowings to fund the Forsgren acquisition. Bank interest rates (inclusive of margins) for the year averaged 5.1% compared with 4.9% in FY14.
Cash Flow and Balance SheetOperating cash flows increased to $36.6 million, $4.4 million up on the prior year, reflecting improved sales and profitability. Bringing inventory ownership in-house had an effect on working capital movements, although the increase in inventories of $7.9 million was partly offset by a corresponding increase in creditors.
Net investing cash outflows were significantly up on prior year to $33.0 million from $10.1 million in FY14. Expenditure on plant and equipment and intangibles increased from $22.5 million to $31.0 million, largely from KFC transformation and the purchase of two independent KFC franchisees. A significant additional investment in the current year was from the acquisition of the Carl’s Jr. business from Forsgren NZ Limited for $10.3 million. FY15 also saw a reduction in investing cash inflows from $12.4 million to $8.4 million as there was only one sale and leaseback of a KFC store (versus two in the prior year).
The high level of investing cash flows saw resultant free cash flows down to $3.6 million for the year. With dividend payments taking $17.1 million, borrowings increased by $14.5 million. Resulting bank debt was up to $22.6 million at year end, well within the company’s $35 million facility limit.
Total assets at year end were $144.6 million, up $36.3 million. Non-current assets made up $24.4 million of the increase with $10.4 million attributable to KFC store transformations and $4.9 million arising from the Carl’s Jr. store roll out, together with $10.3 million from the acquisition of the seven stores from Forsgren NZ Limited. The bulk of the additional $11.9 million increase in current assets was in inventories (with the transfer of inventory ownership in-house) and debtors with the company now charging independent franchisees directly for raw material and ingredient supplies.
Total liabilities were up by $29.7 million, with $13.0 million attributable to creditors (again largely as a result of increased levels of bulk stock ownership) and $14.5 million in increased borrowings.
Year-end shareholders’ funds of $71.2 million were $6.6 million up on prior year because of increases in retained earnings.
The balance sheet remains conservative with a gearing ratio of 23% (FY14: 11%).
8
DividendDirectors have declared a final fully imputed dividend of 11.5 cents per share. This, together with the interim dividend of 7.5 cents per share, makes a full year dividend of 19.0 cents per share (16.5 cents for FY14).
Restaurant Brands continues to enjoy strong cash flows and dividend levels will continue to increase as the company continues to enhance its profit performance.
The 11.5 cents final dividend will be paid on 26 June 2015 to all shareholders on the register as at 12 June 2015. A supplementary dividend of 2.0294 cents per share will also be paid to overseas shareholders on that date.
The dividend re-investment plan remains suspended for this dividend.
BoardThe Restaurant Brands board continues to work as a small tightly knit team. Hamish Stevens joined us as a director last year, bringing our number to five. Hamish has provided strong financial input and has assumed the Chairmanship of the Audit Committee.
Unfortunately the board also saw the resignation of David Pilkington as a director this year. As with all our board members, David was with us for some time, giving in excess of ten years’ service to Restaurant Brands and we are grateful for his considerable input. We are actively looking for a replacement.
StaffWe acknowledge the continued efforts of our employees at all levels of the organisation in producing the kind of results we achieved this year. Working in sometimes challenging conditions, the people in our stores continue to deliver the product and experience that keeps our customers coming back for more.
Elsewhere in this report we introduce the senior management of Restaurant Brands who work closely with chief executive and board to continue to drive the performance of Restaurant Brands.
We continue to enhance our recruitment and training capabilities to increase our attractiveness as an employer and it is pleasing to see a continued reduction in turnover of our staff.
Our CommunityRestaurant Brands is a company that is very much a part of the community it operates in. With stores covering the country from Kaitaia to Invercargill, the company's brands have a strong presence and are known to all. Our employees too are part of that community and we as a responsible employer are very conscious of this. Workplace safety and diversity of our workforce are two areas of constant focus which, together with our staff turnover, give us and our shareholders real measures of inherent staff satisfaction.
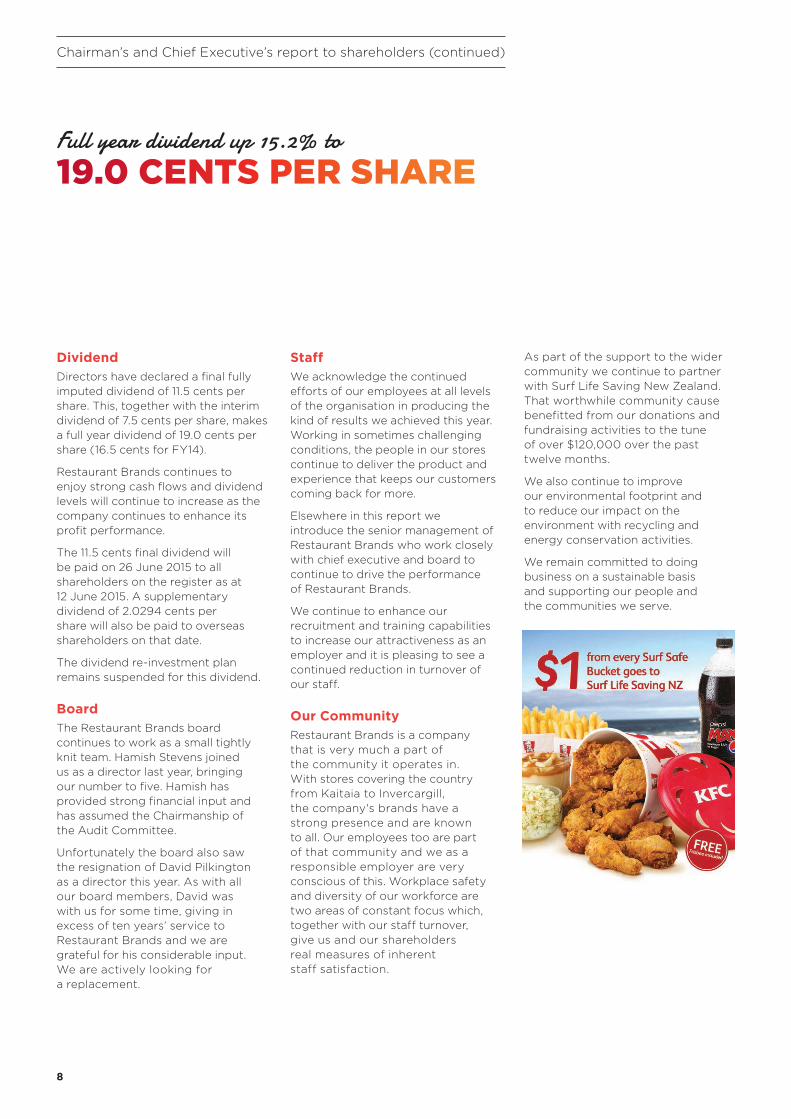
As part of the support to the wider community we continue to partner with Surf Life Saving New Zealand. That worthwhile community cause benefitted from our donations and fundraising activities to the tune of over $120,000 over the past twelve months.
We also continue to improve our environmental footprint and to reduce our impact on the environment with recycling and energy conservation activities.
We remain committed to doing business on a sustainable basis and supporting our people and the communities we serve.
Full year dividend up 15.2% to
19.0 CENTS PER SHARE
Chairman’s and Chief Executive’s report to shareholders (continued)
9
OutlookWe are pleased with the trading results for the FY15 year. The $22.5 million NPAT (excluding non-trading items) is the second best result in the company's history. However despite the benign retail environment, continued competitive pressures mean that the margin improvements achieved across all our brands have been hard-won.
The new financial year has started well with continuing strong sales across all four brands and the company is very focused on maintaining this momentum. Ingredient input prices are expected to remain stable; however there is an expectation of higher levels of labour cost.
KFC will see continued high levels of investment in store transformation as the brand comes closer to its target of having all 91 stores at the new high standard. This, together with a strong promotional calendar will see continued same store sales growth for the coming year (albeit at lower levels than the FY15 year), with margins at similar levels.
Pizza Hut will also see same store sales growth in its company stores. The store sell down programme will see company stores at less than 50% of the network by year end, but the residual stores will remain profitable as the brand continues to thrive.
Starbucks Coffee will again see similar levels of same store sales growth. Margins will remain strong, but there will be some pressure from exchange rate movements.
Building sales momentum and profitability in the Carl’s Jr. operations will be a major focus for the company over the next 12 months. Expanding the brand footprint will continue with the intention of reaching into previously unpenetrated markets. Addressing the current supply chain issues, the continued move to local sourcing, more efficiency in new store openings and leverage from sales growth will all help to significantly improve margins in the FY16 year.
Subject to any significant changes in the economic and competitive environment or unusual costs, with increased contributions from both KFC and Carl’s Jr. we expect that the company will deliver a further improved profit result in the new financial year.
ConclusionRestaurant Brands’ board and management continue to work closely together. We would jointly like to thank both the board of directors and the management team for their efforts in producing the strong result in the FY15 year and acknowledge their continuing support as we move into a new financial year.
Ted van Arkel Chairman
Russel Creedy Chief Executive Officer
Past annual reports have offered some insight into the complexity of our business. Multi-faceted and multi-disciplinary, the company’s organisation might at times seem unwieldy and difficult to manage. To the uninitiated perhaps. But to the people who drive this business every day, it is an exciting challenge
– one that exacts the best from everybody involved, and one requiring total commitment, focus and personal energy to maintain a competitive pace. Those drivers are the company's leaders, the people that make up the Senior Leadership Team (SLT).
Driven ‘A’ typesEach member of the SLT is a focused multi-tasker and leader in their field of expertise. You might recognise them as classic 'type A' personalities, driven by big picture thinking while constantly tuned to the everyday detail of restaurant operations. The pace of smoothly
running nearly 200 restaurants covering the length and breadth of the country demands nothing less.
Geraldine Oldham, GM Sales and Marketing, believes the SLT comprises a group of very strong personalities.
“We’re all leaders with more than five years of experience at this level – and that brings a lot of substance, stature and innovative horsepower.”
Deidre Gourlay, GM Development and Property, describes the leadership team as a very potent forum of ‘subject matter experts’ that feeds into the entire operation. “There are so many different perspectives,” she says.
Yet despite the different viewpoints, steering a successful business like Restaurant Brands relies on each leader having an understanding and respect for all aspects of the operation, not just their own. Well-rounded experience and collective maturity ensures a healthy supportive approach to
decision-making and meeting the day-to-day challenges.
”As a team of people who know each other it starts to work intuitively,” says Geoff Holton, GM Information Systems. “People rise up to tackle the issues, prioritising and focusing on what’s really important.”
Adds Deidre, “Initiatives are taken with a holistic view and complete sensitivity about which functions are likely to be affected by the necessary decisions.”
Leonie Reyneke, GM Supply and Quality, comments that the SLT is almost ‘rhythmic’ and like a well-oiled engine that enables change to happen and decisions to be carried out efficiently and effectively.
Culture of change and innovation A strength of Restaurant Brands that all its SLT members applaud is a culture of willingness to embrace change and explore different ways of doing things.
PACE & PURPOSE
10
From the minute we open our restaurant doors early in the morning, there’s a belief that the day will be a good day – full on, with plenty of challenges, opportunities to delight our customers and, of course, grow. We’re often asked how it all works, how a company our size managing four brands across nearly 200 stores can consistently deliver in a constantly changing retail environment. Yes it’s the infrastructure, the systems and the disciplines. But it’s the energy and pace of a strong and focused management team that makes the difference.
“EACH OF US (IN THE LEADERSHIP TEAM) THRIVES ON CHANGE AND INNOVATION. IT IS HUGELY EXCITING WHAT WE CAN ACHIEVE TOGETHER.” Geraldine Oldham, GM Sales and Marketing
It’s an innovative energy in a leadership team that constantly challenges and pushes itself to go further.
“Hitting a target is not good enough,” says Geraldine Oldham, “the bar can always be higher. We’re always looking for opportunities to develop the business – breakfast menus, digital communications, new delivery models – there’s enormous scope to explore many different avenues and inject some real innovation.”
“There’s never a dull moment,” says Leonie Reyneke, describing the daily ebb and flow of energy in the organisation. “And nor should there be. We work in an atmosphere of change and innovation which is wonderfully inspiring, but also fundamental to the company's continued competitiveness and growth.”
Of course, innovation is critical in any business, but it’s the pace of change in Restaurant Brands that would frustrate many companies. Yet Restaurant Brands thrives on it. The goal is always to improve, keep looking ahead and to move on.
The Quick Service Restaurant (QSR) market that Restaurant Brands operates in sets its own pace and the SLT is acutely aware that change
needs to keep in step; if it does not happen quickly enough, opportunities for growth may be missed.
“Innovation may arise out of a specific need or it may be in anticipation of a need.” explains Jennifer Blight, GM People and Performance, “It may be fuelled by the business or by the market. Either way we embrace it and implement it as quickly as possible.”
The consumer is ever-demanding of quality in service, food, environment, and overall brand experience, be that in-store or online. The market is intensely competitive and our consumers are presented daily with a vast array of QSR brands and their respective takeaway, delivery, drive-thu or dine-in offerings.
“It’s our business to know our customers very well,” says Geraldine Oldham. “We are constantly talking to them in focus groups, out in the stores where the action happens, as well as across a range of online and social media channels.”
Integrated, supportive and collaborativeIt’s typically when the market responds overwhelmingly to the company’s marketing and promotional initiatives, for example,
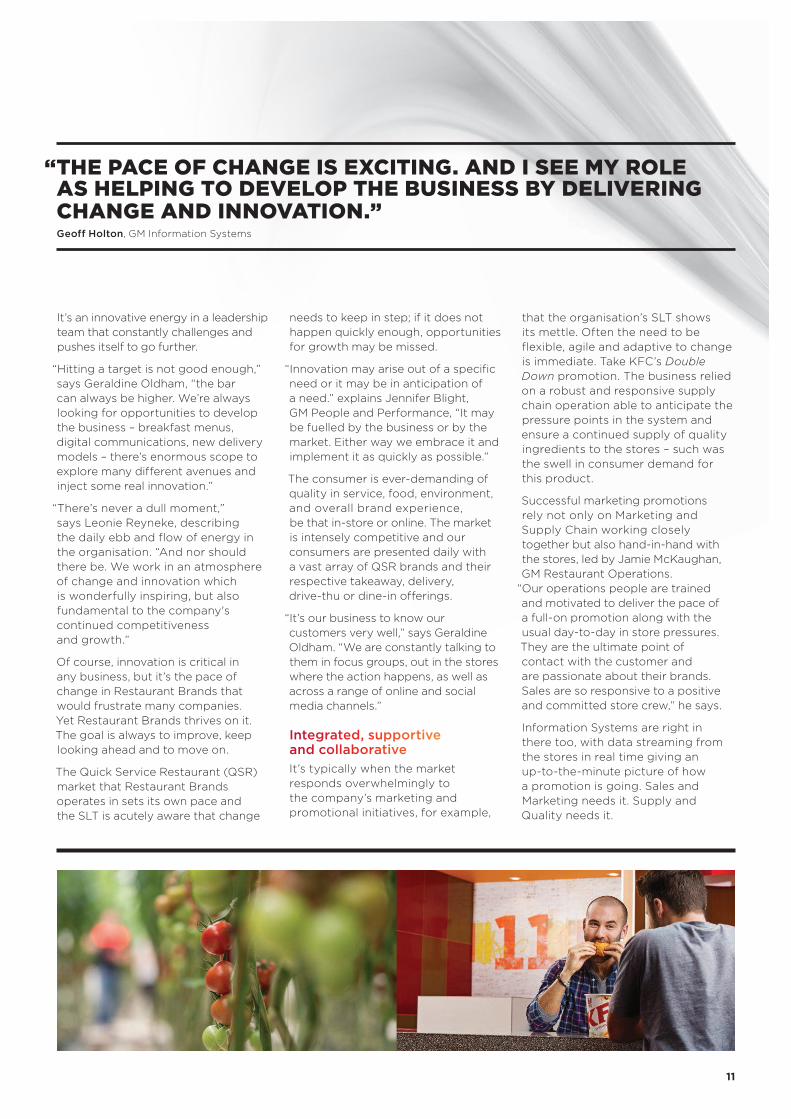
that the organisation’s SLT shows its mettle. Often the need to be flexible, agile and adaptive to change is immediate. Take KFC’s Double Down promotion. The business relied on a robust and responsive supply chain operation able to anticipate the pressure points in the system and ensure a continued supply of quality ingredients to the stores – such was the swell in consumer demand for this product.
Successful marketing promotions rely not only on Marketing and Supply Chain working closely together but also hand-in-hand with the stores, led by Jamie McKaughan, GM Restaurant Operations.
“Our operations people are trained and motivated to deliver the pace of a full-on promotion along with the usual day-to-day in store pressures. They are the ultimate point of contact with the customer and are passionate about their brands. Sales are so responsive to a positive and committed store crew,” he says.
Information Systems are right in there too, with data streaming from the stores in real time giving an up-to-the-minute picture of how a promotion is going. Sales and Marketing needs it. Supply and Quality needs it.
11
“THE PACE OF CHANGE IS EXCITING. AND I SEE MY ROLE AS HELPING TO DEVELOP THE BUSINESS BY DELIVERING CHANGE AND INNOVATION.” Geoff Holton, GM Information Systems
“In the SLT, we’re talking to each other all of the time,” says Jennifer Blight.
“We’re in constant communication, because each of us on the team realises that nothing can be done alone in isolation without the support of our colleagues.”
Besides ramping up the organisation behind a promotion, examples of this cross-functional collaboration include how Property and Marketing worked closely together throughout the successful KFC store transformation process. And Restaurant Operations constantly look to HR for consistent levels of competent staff to maintain the highest service standards and dependable brand experience in store. Meanwhile HR and Operations engage with the talents of the Information Systems team to help consider new opportunities in managing staff rosters or health and safety initiatives.
Finance is an integral and critical part of the business. Led by Chief Financial Officer Grant Ellis, the Finance team keeps an eye on individual store performance working with Restaurant Operations to keep on top of things that matter at store level. Grant Ellis also draws attention to his team’s in-depth analysis and forecasting on trends that impact on the planning and input of all SLT members and their respective teams. “The operation of all aspects of the SLT functions has financial implications,” says Grant.
“Every SLT member has to have an eye for the detail and an ability to understand the facts that lie beneath the numbers.”
Decisions, decisions, always decisionsGrant acknowledges the challenge of balancing big picture visionary initiatives with the detail of daily retailing at the store level.
“The company is made up of 181 individual stores, each with its own unique business patterns, revenue streams and cost structures. Long term initiatives are very important for continued growth and competitiveness, but so too is the need to keep the tills ringing today,” says Grant.
It’s an observation on which all SLT members agree can present tensions in the company. But in a positive way because it makes decision-making much sharper, and acutely accountable.
Such tensions are normal in the QSR business. Maintaining a balance between corporate disciplines and entrepreneurial agility, promotional exuberance and precise demand-led supply management, and between autonomy and accountability is a constant challenge.
“We need structure of course, but we can’t allow structural layers to constrain innovation and empowerment.
We’re in a retail business that requires the utmost flexibility and agility,” says Geoff Holton.
Yet amidst the competing perspectives, decisions must be made, and quickly.
“You can’t be afraid of making decisions at Restaurant Brands,” says Leonie Reyneke, “pick up the phone, make the call and make it happen – you might only have ten minutes.”
Naturally, the path of innovation and change is not always smooth and lessons are constantly being learnt. “But if the goal is always to improve and keep moving forward, obstacles are easier to overcome,” adds Deidre Gourlay, “just as we make decisions quickly, we have to get over our stumbles quickly too, learn from them and move on. We have to be resilient.”
It’s fair to say that this environment does not suit everyone. Where some companies may find the pace and responsibility of change a little daunting, here people are energised by it. Why? Quite simply - because they are in their element, the right people have been chosen for the job.
It is all very well to find people with the right set of skills but, says Jennifer Blight, “it is the challenge of HR to find people who will do well in this environment. It is so satisfying when we find the right fit because all our people are so passionate about their brands.”
12
Pace & Purpose (continued)
“THE SLT HOLDS EVERYTHING TOGETHER IN THE BUSINESS. I BELIEVE THE EXPERIENCE EACH OF US BRINGS MEANS THE COMPANY’S LEADERSHIP IS THE STRONGEST IT’S EVER BEEN.” Jennifer Blight, GM People and Performance
Structure and systems are the foundationThe requirement for constant assessments keeps the organisation on its toes every day; yet for all the immediacy that the business demands, decisions are based on concrete data. Restaurant Brands’ robust, nimble information systems are to thank for that. Free flow of real time information supplements training, knowledge, and expertise so that sound and deliberate decisions can be made in the shortest time possible.
The systems, processes, procedures and networks in the business are all in place and fully operational but they are simple, efficient and adaptable; they support the company's culture and character.
“We are a corporate with the agility of a small business," says Leonie Reyneke, and it is up to the SLT to facilitate that entrepreneurial spirit.
Jamie McKaughan remarks that it is the company’s structures and disciplines that allowed the business to recently take over, so effectively, the Carl’s Jr. stores it didn’t already own. “It was an overnight change and we were able to absorb their operations and their people without a hiccup or any impact on the stores’ day-to-day running.”
Leadership provides focus on strategyWith each member being a leader in their own right and passionate about their function, creating unity in a team is easier said than done. But, hiring ambitious, dynamic experts in their fields has resulted in a SLT of people who are confident in themselves and in each other – and who are quite simply, too busy focusing on the company to worry about ego.
“Robust discussions are commonplace but result in sound decisions without unnecessarily protracted discussions. If any tension arises, we get back to strategy, there is less frustration when decision-makers are clear on the strategy,” comments Deidre Gourlay.
Without a doubt, the pace of change and all of its attendant opportunities calls for focus and leadership – on clear vision and direction. The strategic focus comes from Restaurant Brands’ Chief Executive Officer, Russel Creedy.
“We’re all leaders in the SLT, but it’s Russel who maintains the overarching strategic focus to keep us on the straight and narrow. Our strategy allows us to prioritise, maintain focus and make the right decisions with authority and confidence,” says Leonie Reyneke.
And once again, it becomes clear that when the whole leadership team is unified in moving forward, embracing change and looking to improve, any competing side issues quickly dissipate and fall into line.
…and when the day is doneIt takes a special set of qualities to be able to respond effectively to challenges as they arise, and to look for ways to make a well-tuned engine purr even better. The supportive interdependency between the different functions of the SLT is crucial as is visionary leadership to ensure focus is maintained on the priorities.
There’s a confidence in Restaurant Brands’ SLT, and an expectation of success born of a can-do spirit. Never complacent; “there’s no time for that,” says Geoff Holton,
“every dollar is hard earned. That’s the constant competitive nature of our industry and business.”
And so, at the end of each day’s trading, the SLT can be content knowing that they led a high performance business to perform even higher, that their teams once again gave their best and met their challenges, and that ultimately, each in their own way, contributed to a customer brand experience to keep this company one of the most admired operators of Quick Service Restaurants in the world.
13
“WE CHALLENGE EACH OTHER. BUT THEN AGAIN WE HAVE TO DO THAT BECAUSE THIS IS A COMPANY THAT ONLY SETTLES FOR BETTER OR BEST.” Jamie McKaughan, GM Restaurant Operations

14
From left to right: Russel Creedy, Jennifer Blight, Leonie Reyneke (standing), Grant Ellis (standing), Jamie McKaughan, Geraldine Oldham (standing), Deidre Gourlay, Geoff Holton
15
DEIDRE GOURLAY BPlan(Hons)
General Manager Development and Property
13 years with Restaurant Brands.
Key areas of responsibility New store development, refurbishment, property management of lease portfolio, facilities maintenance.
Previous experienceVarious property roles in major QSR operators in New Zealand, UK retailers and airlines.
InterestsKayaking, cycling, photography.
GEOFF HOLTON CA
General Manager Information Systems
6 years with Restaurant Brands.
Key areas of responsibility IT infrastructure, software systems, helpdesk, business information reporting, system and process development.
Previous experience Senior IT, finance and business development roles in a number of New Zealand companies.
InterestsSnowboarding, fishing, travel.
JAMIE MCKAUGHAN Dip Adv Retail Mgt, Exec Mgt Devpt Programme MGSM
General Manager Restaurant Operations
2 years with Restaurant Brands.
Key areas of responsibility Store operations, staff training and people development, motivation, customer service with focus on policies, procedures and standards.
Previous experience Senior leadership and operations roles for over 30 years in QSR corporate and franchise systems in Australia, Asia and the USA.
Interests Golf, horse racing and breeding, volunteer fireman.
GERALDINE OLDHAM BMS
General Manager Sales and Marketing
4 years with Restaurant Brands.
Key areas of responsibility Sales, marketing, customer care.
Previous experience Senior marketing roles in retail and media sectors.
Interests Fitness, cycling, gym, dance.
LEONIE REYNEKE BM, HED
General Manager Supply and Quality
4 years with Restaurant Brands.
Key areas of responsibility Forecasting and demand planning, sourcing and purchasing, supplier and inventory management, quality assurance, food safety and compliance.
Previous experience Over 22 years’ experience in senior roles across various business disciplines: finance, logistics, supply chain and quality assurance positions held with various high profile New Zealand companies.
Interests Netball (umpiring, coaching), cooking, reading.
GRANT ELLIS MBA, B Com, FCA, ACIS
Chief Financial Officer
17 years with Restaurant Brands.
Key areas of responsibility Financial reporting, planning and forecasting, company secretarial, legal, treasury, insurance, internal audit, administration, investor relations.
Previous experienceSenior finance roles in a number of New Zealand corporates in food, construction and retail sectors.
InterestsMilitary history, cycling, tramping.
RUSSEL CREEDY MBA, BSc, HED
Chief Executive Officer
14 years with Restaurant Brands, including 3 years as Supply Chain Manager and 3 years as GM Pizza Hut.
Key areas of responsibility Oversees all aspects of the company's operations.
Previous experience Sales and manufacturing roles in chemical companies, food supply chain and logistics operations in South Africa and New Zealand.
Interests Golf, travel.
JENNIFER BLIGHT BBS, Dip HSM
General Manager People and Performance
7 years with Restaurant Brands.
Key areas of responsibility Learning and development, recruitment, OHS&E and industrial relations.
Previous experienceSenior HR roles in recruitment, utilities and healthcare sectors.
InterestsCycling, catching up with friends.
Introducing our
SENIOR LEADERSHIP TEAMEach member of the Senior Leadership Team (SLT) is an expert in his or her own field, as well as a committed engineer of Restaurant Brands' vision. Each one is undaunted and passionate. Here are the drivers of our business.
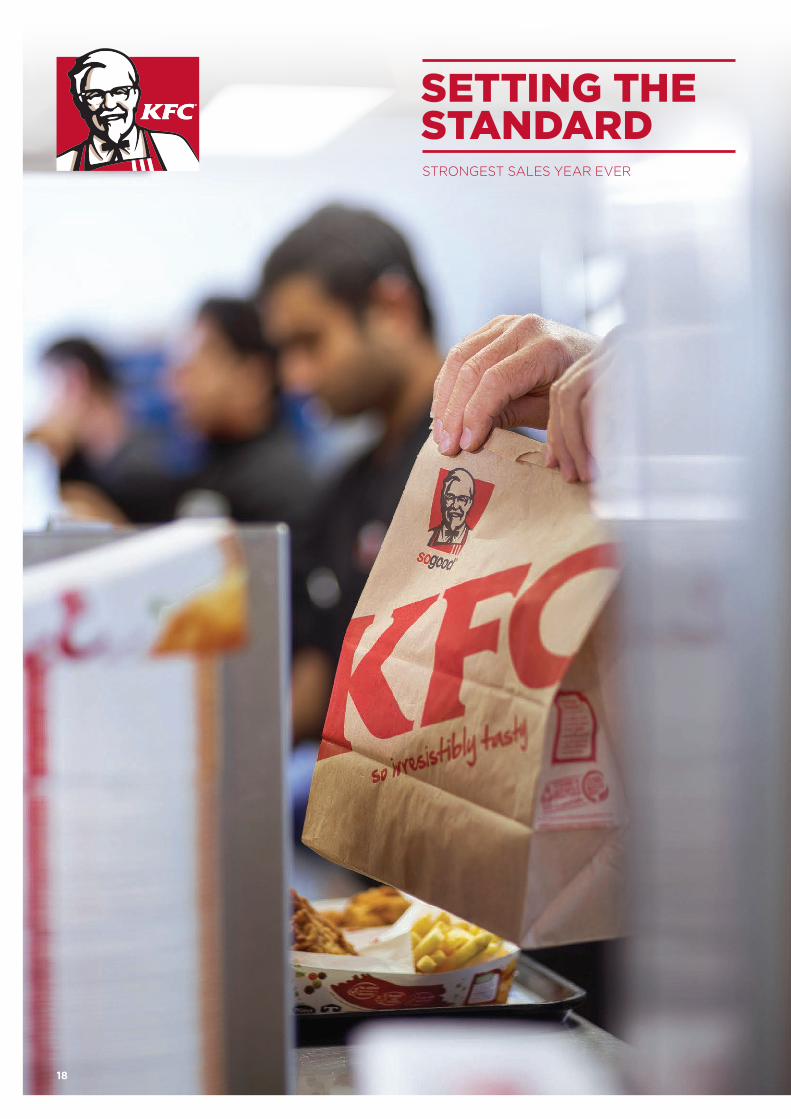
SETTING THE STANDARDSTRONGEST SALES YEAR EVER
18
19
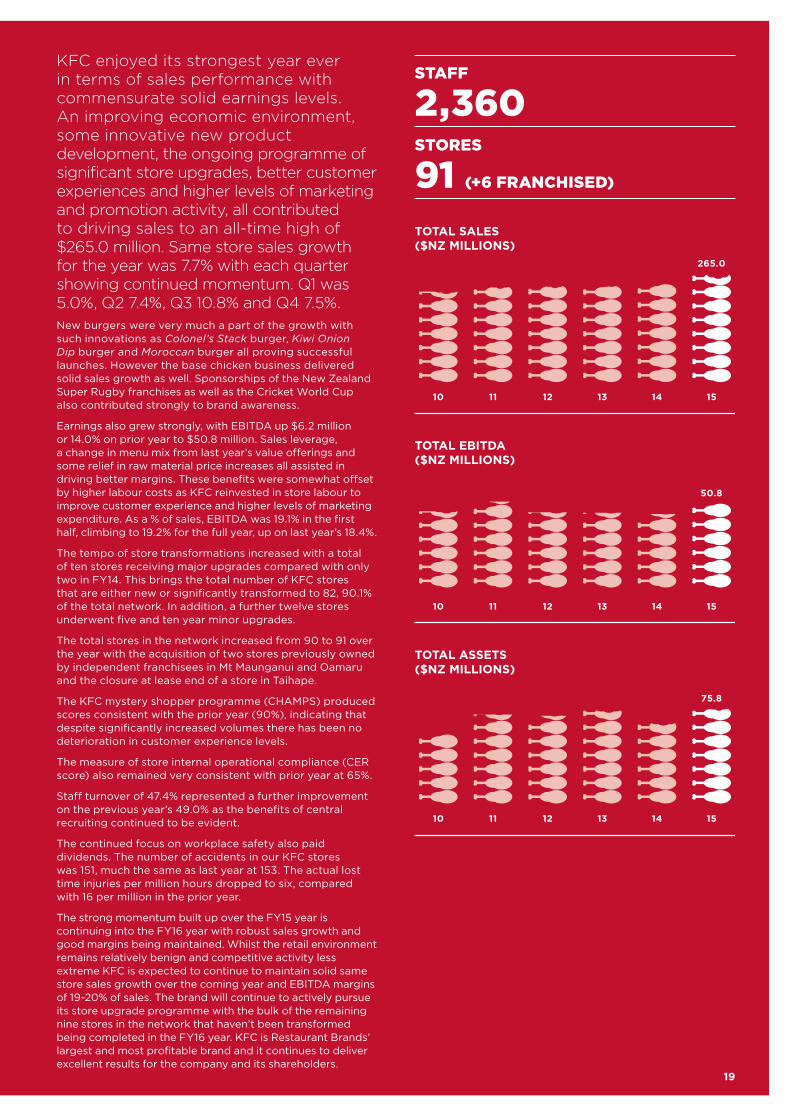
KFC enjoyed its strongest year ever in terms of sales performance with commensurate solid earnings levels. An improving economic environment, some innovative new product development, the ongoing programme of significant store upgrades, better customer experiences and higher levels of marketing and promotion activity, all contributed to driving sales to an all-time high of $265.0 million. Same store sales growth for the year was 7.7% with each quarter showing continued momentum. Q1 was 5.0%, Q2 7.4%, Q3 10.8% and Q4 7.5%.New burgers were very much a part of the growth with such innovations as Colonel’s Stack burger, Kiwi Onion Dip burger and Moroccan burger all proving successful launches. However the base chicken business delivered solid sales growth as well. Sponsorships of the New Zealand Super Rugby franchises as well as the Cricket World Cup also contributed strongly to brand awareness.
Earnings also grew strongly, with EBITDA up $6.2 million or 14.0% on prior year to $50.8 million. Sales leverage, a change in menu mix from last year’s value offerings and some relief in raw material price increases all assisted in driving better margins. These benefits were somewhat offset by higher labour costs as KFC reinvested in store labour to improve customer experience and higher levels of marketing expenditure. As a % of sales, EBITDA was 19.1% in the first half, climbing to 19.2% for the full year, up on last year’s 18.4%.
The tempo of store transformations increased with a total of ten stores receiving major upgrades compared with only two in FY14. This brings the total number of KFC stores that are either new or significantly transformed to 82, 90.1% of the total network. In addition, a further twelve stores underwent five and ten year minor upgrades.
The total stores in the network increased from 90 to 91 over the year with the acquisition of two stores previously owned by independent franchisees in Mt Maunganui and Oamaru and the closure at lease end of a store in Taihape.
The KFC mystery shopper programme (CHAMPS) produced scores consistent with the prior year (90%), indicating that despite significantly increased volumes there has been no deterioration in customer experience levels.
The measure of store internal operational compliance (CER score) also remained very consistent with prior year at 65%.
Staff turnover of 47.4% represented a further improvement on the previous year’s 49.0% as the benefits of central recruiting continued to be evident.
The continued focus on workplace safety also paid dividends. The number of accidents in our KFC stores was 151, much the same as last year at 153. The actual lost time injuries per million hours dropped to six, compared with 16 per million in the prior year.
The strong momentum built up over the FY15 year is continuing into the FY16 year with robust sales growth and good margins being maintained. Whilst the retail environment remains relatively benign and competitive activity less extreme KFC is expected to continue to maintain solid same store sales growth over the coming year and EBITDA margins of 19-20% of sales. The brand will continue to actively pursue its store upgrade programme with the bulk of the remaining nine stores in the network that haven’t been transformed being completed in the FY16 year. KFC is Restaurant Brands’ largest and most profitable brand and it continues to deliver excellent results for the company and its shareholders.
STAFF
2,360STORES
91 (+6 FRANCHISED)
TOTAL SALES($NZ MILLIONS)
TOTAL ASSETS($NZ MILLIONS)
TOTAL EBITDA($NZ MILLIONS)
1510 11 12 13 14
1510 11 12 13 14
1510 11 12 13 14
265.0
50.8
75.8

20
DELIVERING ON THE STRATEGYFEWER STORES AND HIGHER PROFIT
21
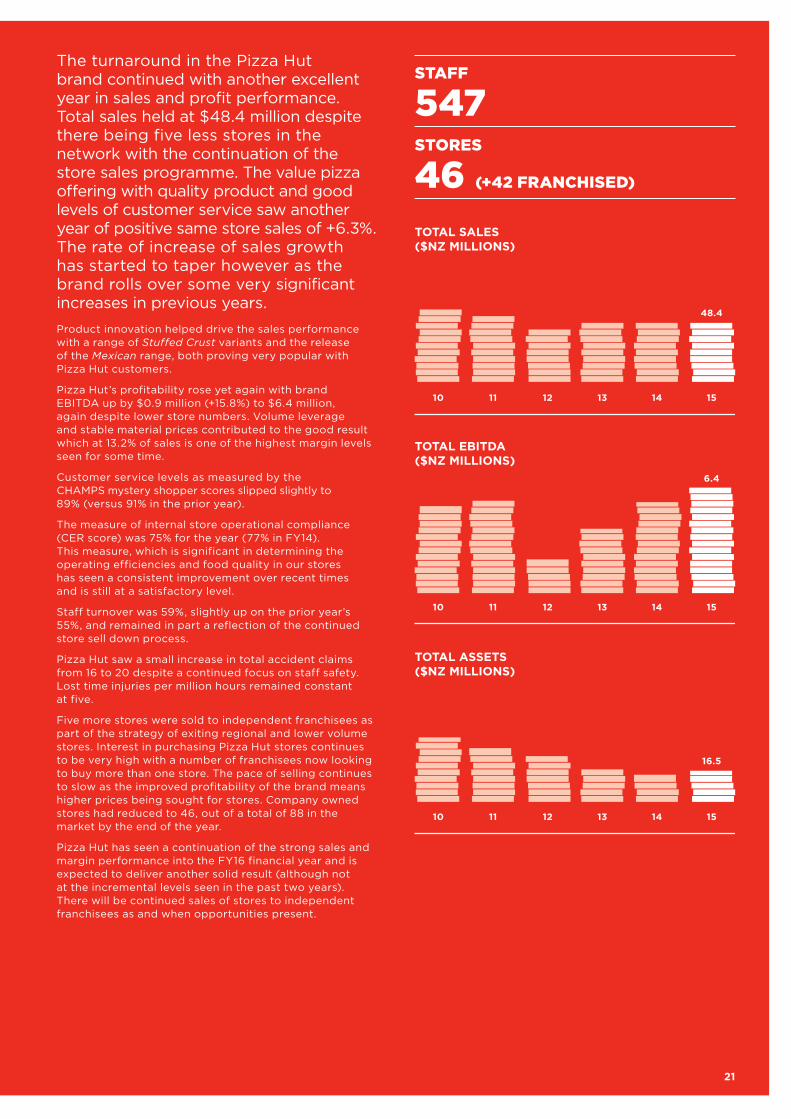
The turnaround in the Pizza Hut brand continued with another excellent year in sales and profit performance. Total sales held at $48.4 million despite there being five less stores in the network with the continuation of the store sales programme. The value pizza offering with quality product and good levels of customer service saw another year of positive same store sales of +6.3%. The rate of increase of sales growth has started to taper however as the brand rolls over some very significant increases in previous years.Product innovation helped drive the sales performance with a range of Stuffed Crust variants and the release of the Mexican range, both proving very popular with Pizza Hut customers.
Pizza Hut’s profitability rose yet again with brand EBITDA up by $0.9 million (+15.8%) to $6.4 million, again despite lower store numbers. Volume leverage and stable material prices contributed to the good result which at 13.2% of sales is one of the highest margin levels seen for some time.
Customer service levels as measured by the CHAMPS mystery shopper scores slipped slightly to 89% (versus 91% in the prior year).
The measure of internal store operational compliance (CER score) was 75% for the year (77% in FY14). This measure, which is significant in determining the operating efficiencies and food quality in our stores has seen a consistent improvement over recent times and is still at a satisfactory level.
Staff turnover was 59%, slightly up on the prior year’s 55%, and remained in part a reflection of the continued store sell down process.
Pizza Hut saw a small increase in total accident claims from 16 to 20 despite a continued focus on staff safety. Lost time injuries per million hours remained constant at five.
Five more stores were sold to independent franchisees as part of the strategy of exiting regional and lower volume stores. Interest in purchasing Pizza Hut stores continues to be very high with a number of franchisees now looking to buy more than one store. The pace of selling continues to slow as the improved profitability of the brand means higher prices being sought for stores. Company owned stores had reduced to 46, out of a total of 88 in the market by the end of the year.
Pizza Hut has seen a continuation of the strong sales and margin performance into the FY16 financial year and is expected to deliver another solid result (although not at the incremental levels seen in the past two years). There will be continued sales of stores to independent franchisees as and when opportunities present.
TOTAL SALES($NZ MILLIONS)
TOTAL ASSETS($NZ MILLIONS)
TOTAL EBITDA($NZ MILLIONS)
1510 11 12 13 14
1510 11 12 13 14
1510 11 12 13 14
48.4
6.4
16.5
STAFF
547STORES
46 (+42 FRANCHISED)

STORE NUMBERS UP BY TEN
22
ACHIEVING CRITICAL MASS
23
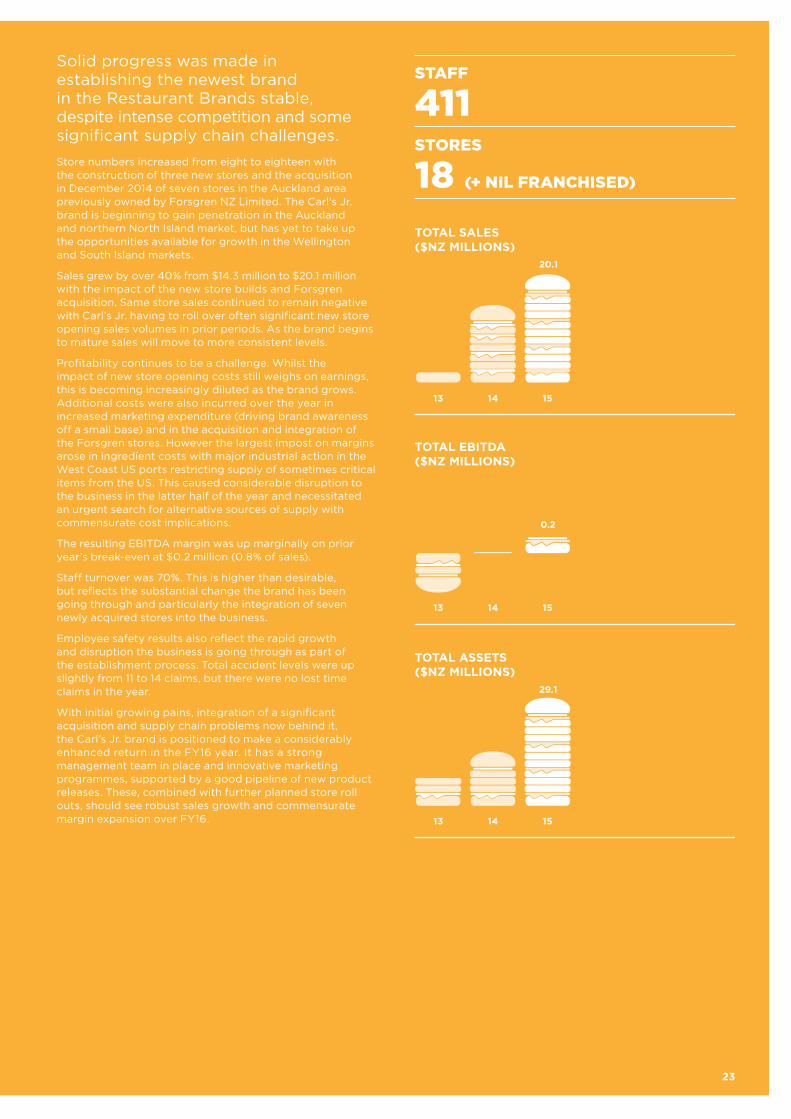
Solid progress was made in establishing the newest brand in the Restaurant Brands stable, despite intense competition and some significant supply chain challenges.Store numbers increased from eight to eighteen with the construction of three new stores and the acquisition in December 2014 of seven stores in the Auckland area previously owned by Forsgren NZ Limited. The Carl's Jr. brand is beginning to gain penetration in the Auckland and northern North Island market, but has yet to take up the opportunities available for growth in the Wellington and South Island markets.
Sales grew by over 40% from $14.3 million to $20.1 million with the impact of the new store builds and Forsgren acquisition. Same store sales continued to remain negative with Carl’s Jr. having to roll over often significant new store opening sales volumes in prior periods. As the brand begins to mature sales will move to more consistent levels.
Profitability continues to be a challenge. Whilst the impact of new store opening costs still weighs on earnings, this is becoming increasingly diluted as the brand grows. Additional costs were also incurred over the year in increased marketing expenditure (driving brand awareness off a small base) and in the acquisition and integration of the Forsgren stores. However the largest impost on margins arose in ingredient costs with major industrial action in the West Coast US ports restricting supply of sometimes critical items from the US. This caused considerable disruption to the business in the latter half of the year and necessitated an urgent search for alternative sources of supply with commensurate cost implications.
The resulting EBITDA margin was up marginally on prior year’s break-even at $0.2 million (0.8% of sales).
Staff turnover was 70%. This is higher than desirable, but reflects the substantial change the brand has been going through and particularly the integration of seven newly acquired stores into the business.
Employee safety results also reflect the rapid growth and disruption the business is going through as part of the establishment process. Total accident levels were up slightly from 11 to 14 claims, but there were no lost time claims in the year.
With initial growing pains, integration of a significant acquisition and supply chain problems now behind it, the Carl’s Jr. brand is positioned to make a considerably enhanced return in the FY16 year. It has a strong management team in place and innovative marketing programmes, supported by a good pipeline of new product releases. These, combined with further planned store roll outs, should see robust sales growth and commensurate margin expansion over FY16.
TOTAL SALES($NZ MILLIONS)
TOTAL ASSETS($NZ MILLIONS)
TOTAL EBITDA($NZ MILLIONS)
13 14 15
13 14 15
13 14 15
20.1
0.2
29.1
STAFF
411STORES
18 (+ NIL FRANCHISED)
PROFIT MARGINS UP
24
IT'S FULL STEAM AHEAD
25
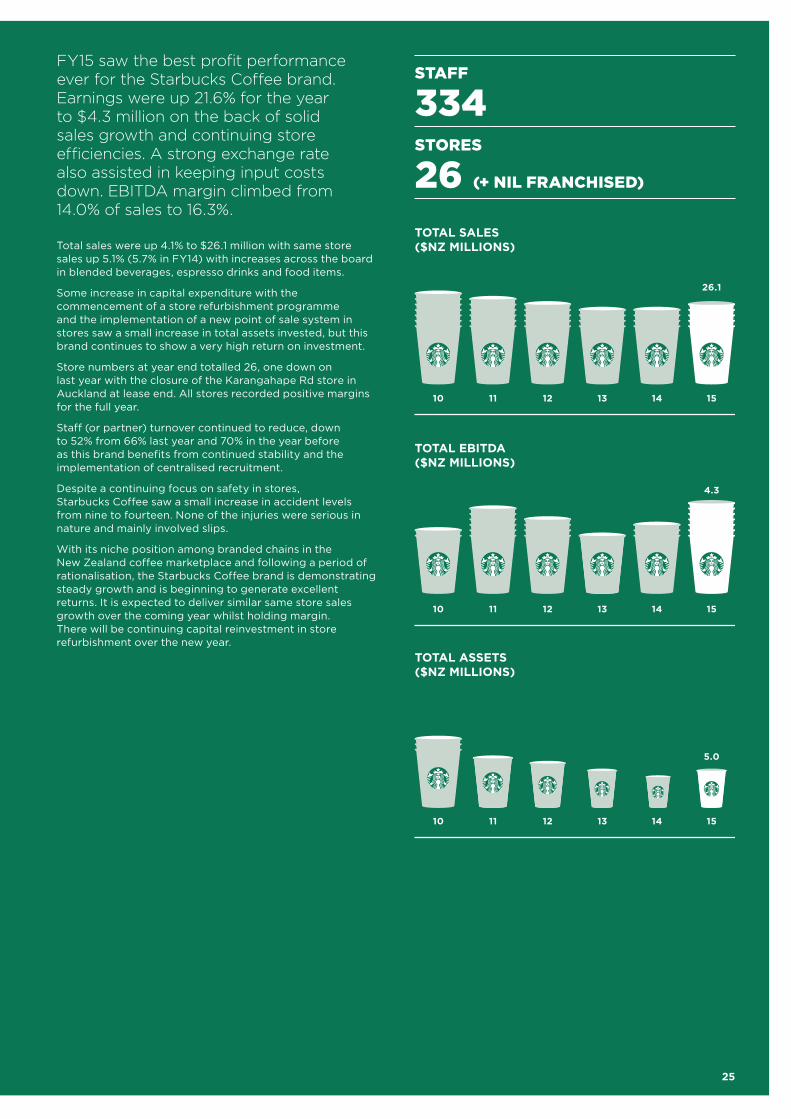
FY15 saw the best profit performance ever for the Starbucks Coffee brand. Earnings were up 21.6% for the year to $4.3 million on the back of solid sales growth and continuing store efficiencies. A strong exchange rate also assisted in keeping input costs down. EBITDA margin climbed from 14.0% of sales to 16.3%.
Total sales were up 4.1% to $26.1 million with same store sales up 5.1% (5.7% in FY14) with increases across the board in blended beverages, espresso drinks and food items.
Some increase in capital expenditure with the commencement of a store refurbishment programme and the implementation of a new point of sale system in stores saw a small increase in total assets invested, but this brand continues to show a very high return on investment.
Store numbers at year end totalled 26, one down on last year with the closure of the Karangahape Rd store in Auckland at lease end. All stores recorded positive margins for the full year.
Staff (or partner) turnover continued to reduce, down to 52% from 66% last year and 70% in the year before as this brand benefits from continued stability and the implementation of centralised recruitment.
Despite a continuing focus on safety in stores, Starbucks Coffee saw a small increase in accident levels from nine to fourteen. None of the injuries were serious in nature and mainly involved slips.
With its niche position among branded chains in the New Zealand coffee marketplace and following a period of rationalisation, the Starbucks Coffee brand is demonstrating steady growth and is beginning to generate excellent returns. It is expected to deliver similar same store sales growth over the coming year whilst holding margin. There will be continuing capital reinvestment in store refurbishment over the new year.
TOTAL SALES($NZ MILLIONS)
TOTAL ASSETS($NZ MILLIONS)
TOTAL EBITDA($NZ MILLIONS)
1510 11 12 13 14
1510 11 12 13 14
1510 11 12 13 14
26.1
13
4.3
5.0
STAFF
334STORES
26 (+ NIL FRANCHISED)

26
Ted van Arkel fnzim Chairman and Independent Non-Executive Director
Term of Office: Appointed Director 24 September 2004 and appointed Chairman 21 July 2006, last re-elected 2011 Annual Meeting
Board Committees: Member of the Audit and Risk Committee and Appointments and Remuneration Committee
Mr van Arkel has been a professional director since retiring from the position of Managing Director of Progressive Enterprises Limited in November 2004. Mr van Arkel currently serves as Chairman of Health Benefits Limited and The Warehouse Group Limited. Other NZX listed company directorships are AWF Group Limited and Abano Healthcare Group Limited. He is also a director of the Auckland Regional Chamber of Commerce & Industry Limited. Mr van Arkel also serves as a director of a number of private companies including Philip Yates Securities Limited, Danske Mobler Limited and his family-owned companies Lang Properties Limited and Van Arkel & Co Limited.
Board of
DIRECTORS
Sue Suckling b.tech (hons), m.tech (hons), obe Independent Non-Executive Director
Term of Office: Appointed Director 9 June 2006, last re-elected 2010 Annual Meeting
Board Committees: Chairman of the Appointments and Remuneration Committee and Member of Audit and Risk Committee
Ms Suckling is a professional director with over 20 years governance experience with public and private companies. She is currently Chairman of the New Zealand Qualifications Authority, Barker Fruit Processors Limited, ECL Group Limited, Jacobsen Holdings Limited and Callaghan Innovation Research Limited and its subsidiaries and also chairs Health Benefits Limited Transition Interim Governance Group. She is a director of Oxford Health Group Limited, Oxford Clinic Hospital Limited, SKYCITY Entertainment Group Limited and Acemark Holdings Limited. She also serves as a member of the Takeovers Panel.

Danny Diab faicd, dip cd, dip cm, ficm Non-Executive Director
Term of Office: Appointed Director 17 October 2002, last re-elected 2012 Annual Meeting
Board Committees: Member of the Audit and Risk Committee and Appointments and Remuneration Committee
Mr Diab is based in Australia where he owns and operates a number of Pizza Hut restaurants in Sydney in addition to other business interests. He has more than 27 years’ experience in the food industry and is regarded as one of the leading Pizza Hut franchisees in Australia. He has worked as a consultant specialising in the areas of business improvement and restructure, mergers and acquisitions. He is Vice President of the Australian Pizza Association.
Hamish Stevens mba, b com, ca Independent Non-Executive Director
Term of Office: Appointed Director 8 May 2014, last re-elected 2014 Annual Meeting
Board Committees: Chairman of the Audit and Risk Committee and Member of Appointments and Remuneration Committee
After considerable experience in a number of senior corporate roles including both operational and financial management in such large companies as DB Breweries Limited and Heinz-Watties Limited, Mr Stevens became a professional director in 2010. He is currently chairman of Counties Power Limited and is a director of AsureQuality Limited, Smart Environmental Limited, Dairy Technical Services Limited and Botany Health Hub Limited. He also chairs East Health Services Limited and The Kennedys Limited and is a director and shareholder of Governance & Advisory Limited. A qualified chartered accountant, he also chairs the audit committees for a number of these companies as well as an independent chairman of Audit and Risk Committee of the Waikato Regional Council.
27
Our vision is to be the leading operator of enduring and innovative QSR brands in New Zealand. That’s why we’re committed to doing business guided by principles of sustainability. These principles help form our menus and management practices; our people and the way we contribute to the communities we serve.Four interdependent elements; People, Food, Planet and Progress, comprise the core aspects of our Corporate Social Responsibility ethos and sustain the health and vitality of our company. We set out below our Corporate Social Responsibility KPIs and progress for the new financial year in relation to each of these elements.
PeopleRestaurant Brands depends on the support of Kiwi consumers and partnerships with employees, suppliers, franchisees and investors. We employ 3,912 people aged from 16-70 nationwide and serve over 60,000 customers every day. We:
• Offer competitive remuneration to attract and retain skilled skilled employees. We maintain our position not to reintroduce youth rates. We also do not offer zero hours employment contracts to our people and guarantee minimum hours of work.
• Invest in our people through training and education programmes across all our brands and provide a clear career path for talented employees. We have rolled out an e-learning programme for a large proportion of our staff to build their competencies and skills in the field.
• Are an equal opportunity employer and embrace the diversity of the communities that we operate in. We provide employment for many new New Zealanders and opportunities to make a first start in the workforce. With more than half of our workforce being female (together with a significant proportion of senior management) we are committed to true gender balance.
• Continue our involvement with charitable and community organisations and review our efforts on an ongoing basis to ensure they remain relevant and valuable to the communities we serve.
COMMUNITY SPIRITED, SUSTAINABLY PRINCIPLED
28
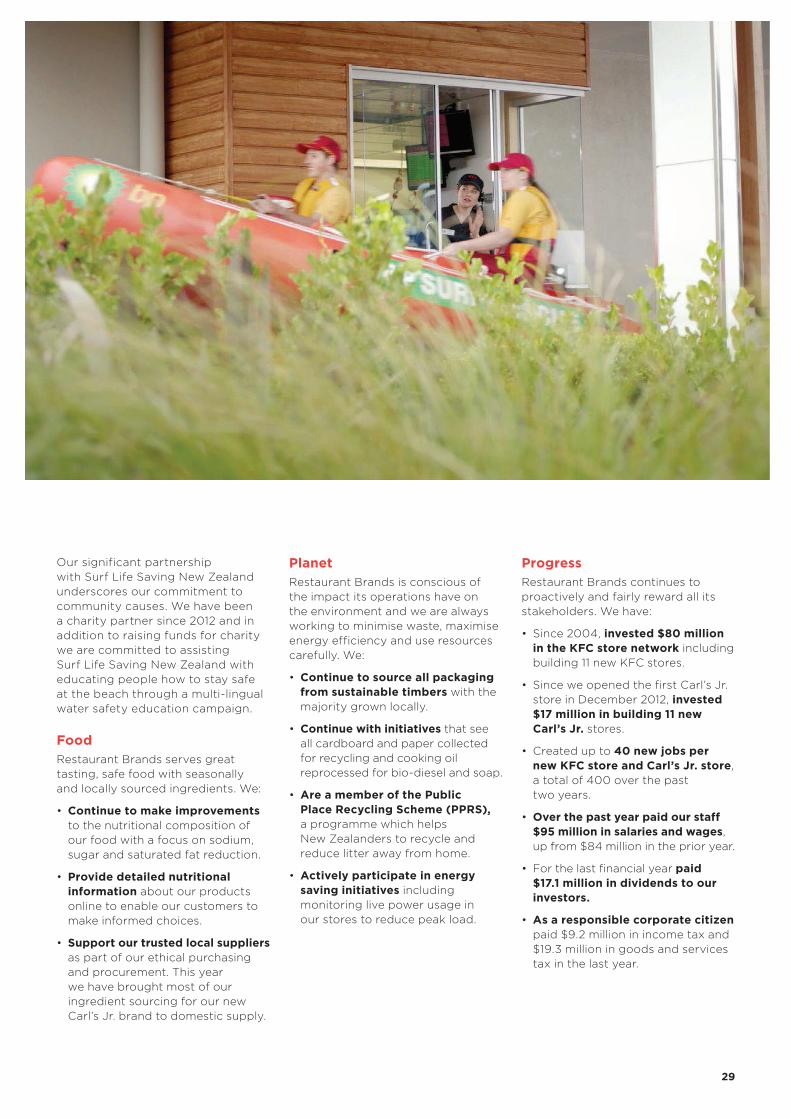
Our significant partnership with Surf Life Saving New Zealand underscores our commitment to community causes. We have been a charity partner since 2012 and in addition to raising funds for charity we are committed to assisting Surf Life Saving New Zealand with educating people how to stay safe at the beach through a multi-lingual water safety education campaign.
FoodRestaurant Brands serves great tasting, safe food with seasonally and locally sourced ingredients. We:
• Continue to make improvements to the nutritional composition of our food with a focus on sodium, sugar and saturated fat reduction.
• Provide detailed nutritional information about our products online to enable our customers to make informed choices.
• Support our trusted local suppliers as part of our ethical purchasing and procurement. This year we have brought most of our ingredient sourcing for our new Carl’s Jr. brand to domestic supply.
PlanetRestaurant Brands is conscious of the impact its operations have on the environment and we are always working to minimise waste, maximise energy efficiency and use resources carefully. We:
• Continue to source all packaging from sustainable timbers with the majority grown locally.
• Continue with initiatives that see all cardboard and paper collected for recycling and cooking oil reprocessed for bio-diesel and soap.
• Are a member of the Public Place Recycling Scheme (PPRS), a programme which helps New Zealanders to recycle and reduce litter away from home.
• Actively participate in energy saving initiatives including monitoring live power usage in our stores to reduce peak load.
ProgressRestaurant Brands continues to proactively and fairly reward all its stakeholders. We have:
• Since 2004, invested $80 million in the KFC store network including building 11 new KFC stores.
• Since we opened the first Carl’s Jr. store in December 2012, invested $17 million in building 11 new Carl’s Jr. stores.
• Created up to 40 new jobs per new KFC store and Carl’s Jr. store, a total of 400 over the past two years.
• Over the past year paid our staff $95 million in salaries and wages, up from $84 million in the prior year.
• For the last financial year paid $17.1 million in dividends to our investors.
• As a responsible corporate citizen paid $9.2 million in income tax and $19.3 million in goods and services tax in the last year.
29
30
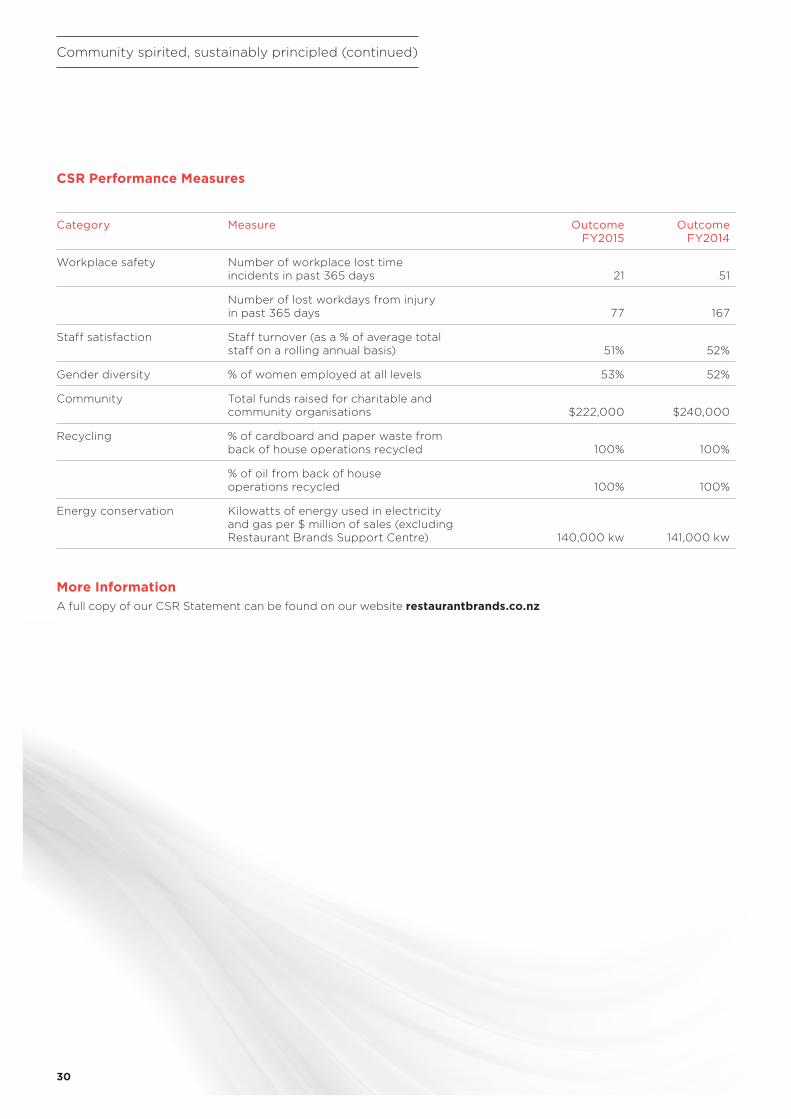
CSR Performance Measures
Category Measure Outcome FY2015
Outcome FY2014
Workplace safety Number of workplace lost time incidents in past 365 days 21 51
Number of lost workdays from injury in past 365 days 77 167
Staff satisfaction Staff turnover (as a % of average total staff on a rolling annual basis) 51% 52%
Gender diversity % of women employed at all levels 53% 52%
Community Total funds raised for charitable and community organisations $222,000 $240,000
Recycling % of cardboard and paper waste from back of house operations recycled 100% 100%
% of oil from back of house operations recycled 100% 100%
Energy conservation Kilowatts of energy used in electricity and gas per $ million of sales (excluding Restaurant Brands Support Centre) 140,000 kw 141,000 kw
More InformationA full copy of our CSR Statement can be found on our website restaurantbrands.co.nz
Community spirited, sustainably principled (continued)
31 31
$NZ000's 2 March 2015
53 weeksvs prior
%24 February 2014
52 weeks
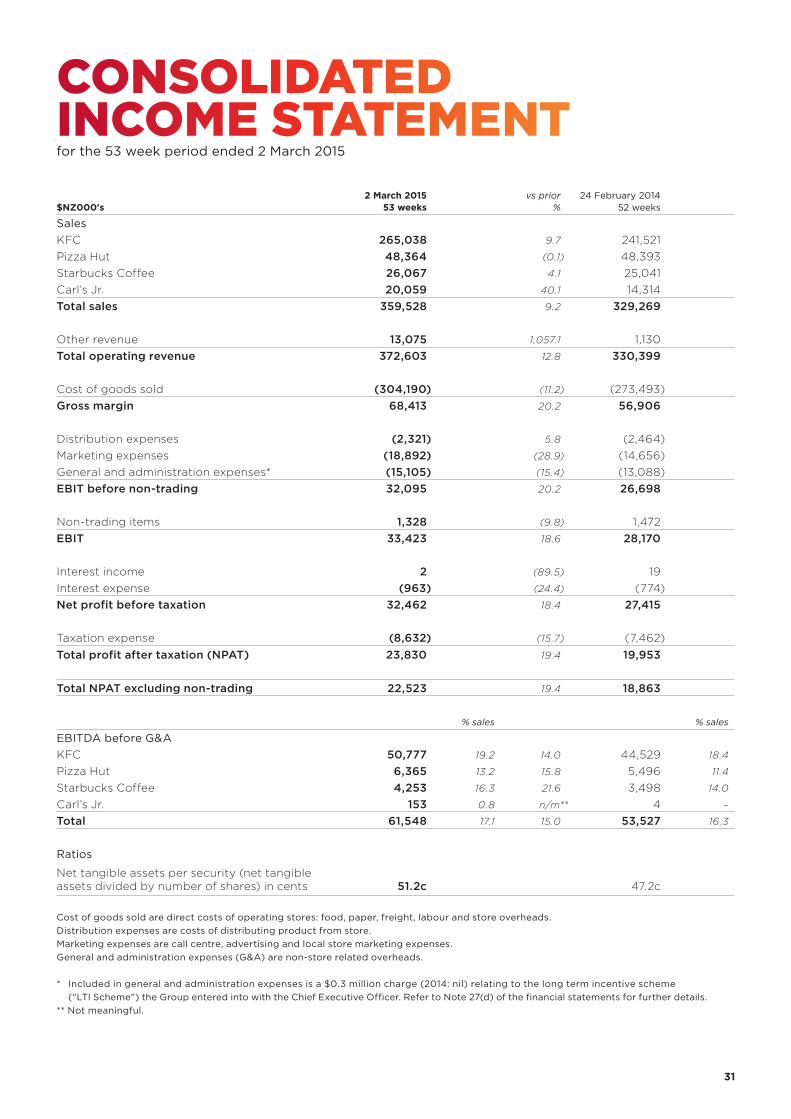
SalesKFC 265,038 9.7 241,521Pizza Hut 48,364 (0.1) 48,393Starbucks Coffee 26,067 4.1 25,041Carl’s Jr. 20,059 40.1 14,314Total sales 359,528 9.2 329,269
Other revenue 13,075 1,057.1 1,130Total operating revenue 372,603 12.8 330,399
Cost of goods sold (304,190) (11.2) (273,493)Gross margin 68,413 20.2 56,906
Distribution expenses (2,321) 5.8 (2,464)Marketing expenses (18,892) (28.9) (14,656)General and administration expenses* (15,105) (15.4) (13,088)EBIT before non-trading 32,095 20.2 26,698
Non-trading items 1,328 (9.8) 1,472EBIT 33,423 18.6 28,170
Interest income 2 (89.5) 19Interest expense (963) (24.4) (774)Net profit before taxation 32,462 18.4 27,415
Taxation expense (8,632) (15.7) (7,462)Total profit after taxation (NPAT) 23,830 19.4 19,953
Total NPAT excluding non-trading 22,523 19.4 18,863
% sales % sales
EBITDA before G&AKFC 50,777 19.2 14.0 44,529 18.4
Pizza Hut 6,365 13.2 15.8 5,496 11.4
Starbucks Coffee 4,253 16.3 21.6 3,498 14.0
Carl’s Jr. 153 0.8 n/m** 4 –
Total 61,548 17.1 15.0 53,527 16.3
Ratios
Net tangible assets per security (net tangible assets divided by number of shares) in cents 51.2c 47.2c
Cost of goods sold are direct costs of operating stores: food, paper, freight, labour and store overheads.Distribution expenses are costs of distributing product from store.Marketing expenses are call centre, advertising and local store marketing expenses.General and administration expenses (G&A) are non-store related overheads.
* Included in general and administration expenses is a $0.3 million charge (2014: nil) relating to the long term incentive scheme ("LTI Scheme") the Group entered into with the Chief Executive Officer. Refer to Note 27(d) of the financial statements for further details.
** Not meaningful.
CONSOLIDATED INCOME STATEMENT for the 53 week period ended 2 March 2015
3232
* Refers to the list of non-GAAP measures as listed above.** Refer to Note 5 of the financial statements for an analysis of non-trading items.
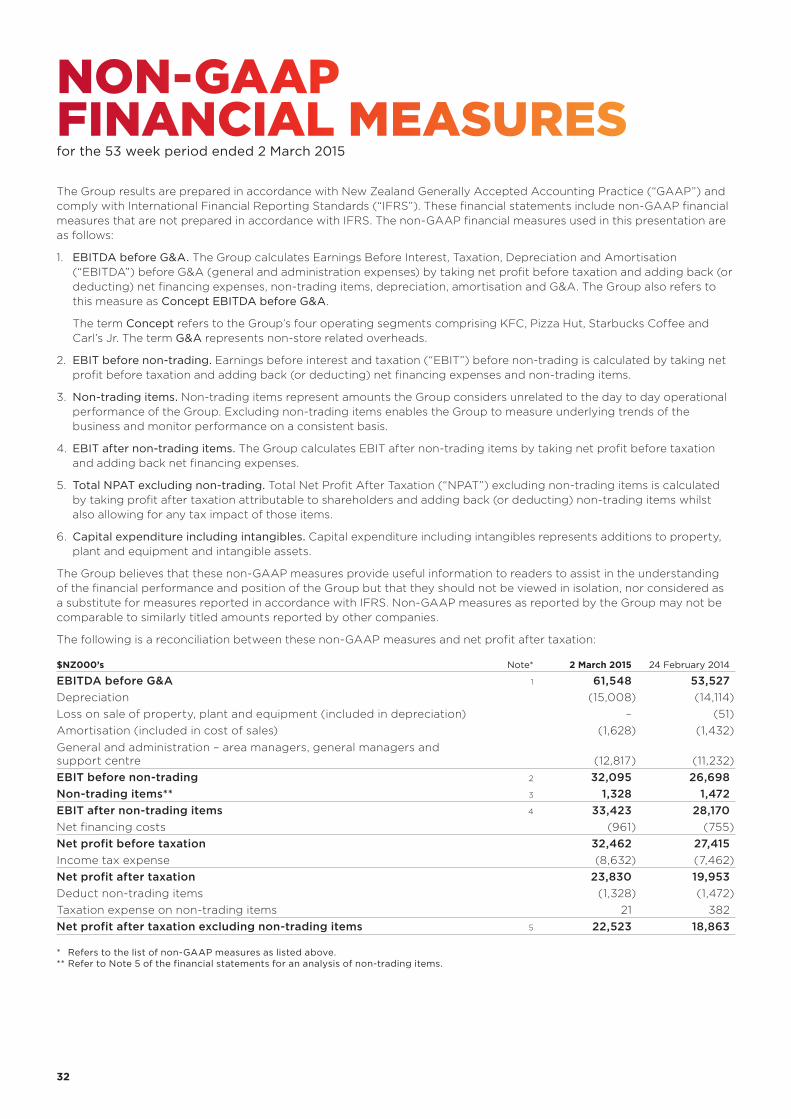
The Group results are prepared in accordance with New Zealand Generally Accepted Accounting Practice (“GAAP”) and comply with International Financial Reporting Standards (“IFRS”). These financial statements include non-GAAP financial measures that are not prepared in accordance with IFRS. The non-GAAP financial measures used in this presentation are as follows:
1. EBITDA before G&A. The Group calculates Earnings Before Interest, Taxation, Depreciation and Amortisation (“EBITDA”) before G&A (general and administration expenses) by taking net profit before taxation and adding back (or deducting) net financing expenses, non-trading items, depreciation, amortisation and G&A. The Group also refers to this measure as Concept EBITDA before G&A.
The term Concept refers to the Group’s four operating segments comprising KFC, Pizza Hut, Starbucks Coffee and Carl’s Jr. The term G&A represents non-store related overheads.
2. EBIT before non-trading. Earnings before interest and taxation (“EBIT”) before non-trading is calculated by taking net profit before taxation and adding back (or deducting) net financing expenses and non-trading items.
3. Non-trading items. Non-trading items represent amounts the Group considers unrelated to the day to day operational performance of the Group. Excluding non-trading items enables the Group to measure underlying trends of the business and monitor performance on a consistent basis.
4. EBIT after non-trading items. The Group calculates EBIT after non-trading items by taking net profit before taxation and adding back net financing expenses.
5. Total NPAT excluding non-trading. Total Net Profit After Taxation (“NPAT”) excluding non-trading items is calculated by taking profit after taxation attributable to shareholders and adding back (or deducting) non-trading items whilst also allowing for any tax impact of those items.
6. Capital expenditure including intangibles. Capital expenditure including intangibles represents additions to property, plant and equipment and intangible assets.
The Group believes that these non-GAAP measures provide useful information to readers to assist in the understanding of the financial performance and position of the Group but that they should not be viewed in isolation, nor considered as a substitute for measures reported in accordance with IFRS. Non-GAAP measures as reported by the Group may not be comparable to similarly titled amounts reported by other companies.
The following is a reconciliation between these non-GAAP measures and net profit after taxation:
$NZ000’s Note* 2 March 2015 24 February 2014
EBITDA before G&A 1 61,548 53,527Depreciation (15,008) (14,114)Loss on sale of property, plant and equipment (included in depreciation) – (51)Amortisation (included in cost of sales) (1,628) (1,432)General and administration – area managers, general managers and support centre (12,817) (11,232)EBIT before non-trading 2 32,095 26,698Non-trading items** 3 1,328 1,472EBIT after non-trading items 4 33,423 28,170Net financing costs (961) (755)Net profit before taxation 32,462 27,415Income tax expense (8,632) (7,462)Net profit after taxation 23,830 19,953Deduct non-trading items (1,328) (1,472)Taxation expense on non-trading items 21 382Net profit after taxation excluding non-trading items 5 22,523 18,863
NON-GAAP FINANCIAL MEASURES for the 53 week period ended 2 March 2015
For and on behalf of the Board of Directors:
E K van ArkelChairman
16 April 2015
H W Stevens Director
16 April 2015
THE DIRECTORS ARE PLEASED TO PRESENT THE FINANCIAL STATEMENTS OF RESTAURANT BRANDS NEW ZEALAND LIMITED FOR THE 53 WEEK PERIOD ENDED 2 MARCH 2015 CONTAINED ON PAGES 34 TO 67.
33
3434
Group Company
$NZ000’s Note 2015 2014 2015 2014
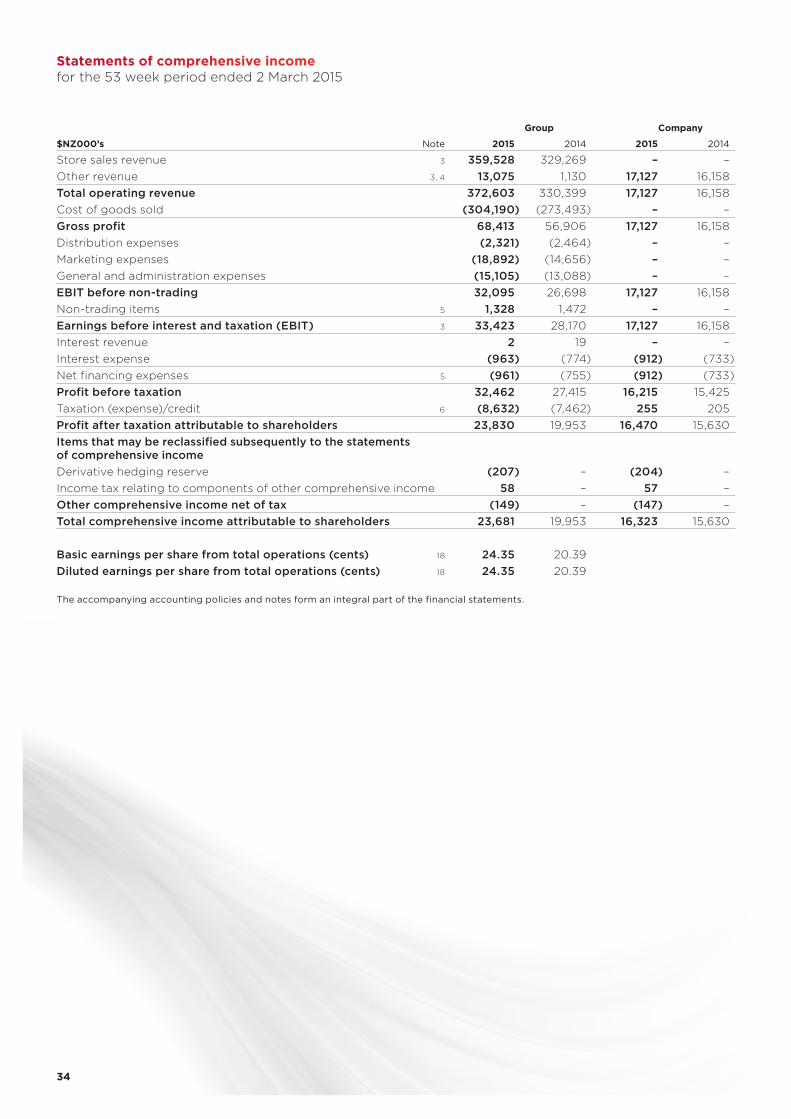
Store sales revenue 3 359,528 329,269 – –Other revenue 3, 4 13,075 1,130 17,127 16,158Total operating revenue 372,603 330,399 17,127 16,158Cost of goods sold (304,190) (273,493) – –Gross profit 68,413 56,906 17,127 16,158Distribution expenses (2,321) (2,464) – –Marketing expenses (18,892) (14,656) – –General and administration expenses (15,105) (13,088) – –EBIT before non-trading 32,095 26,698 17,127 16,158Non-trading items 5 1,328 1,472 – –Earnings before interest and taxation (EBIT) 3 33,423 28,170 17,127 16,158Interest revenue 2 19 – –Interest expense (963) (774) (912) (733)Net financing expenses 5 (961) (755) (912) (733)Profit before taxation 32,462 27,415 16,215 15,425Taxation (expense)/credit 6 (8,632) (7,462) 255 205Profit after taxation attributable to shareholders 23,830 19,953 16,470 15,630Items that may be reclassified subsequently to the statements of comprehensive incomeDerivative hedging reserve (207) – (204) –Income tax relating to components of other comprehensive income 58 – 57 –Other comprehensive income net of tax (149) – (147) –Total comprehensive income attributable to shareholders 23,681 19,953 16,323 15,630
Basic earnings per share from total operations (cents) 18 24.35 20.39Diluted earnings per share from total operations (cents) 18 24.35 20.39
The accompanying accounting policies and notes form an integral part of the financial statements.
Statements of comprehensive income for the 53 week period ended 2 March 2015
35 35
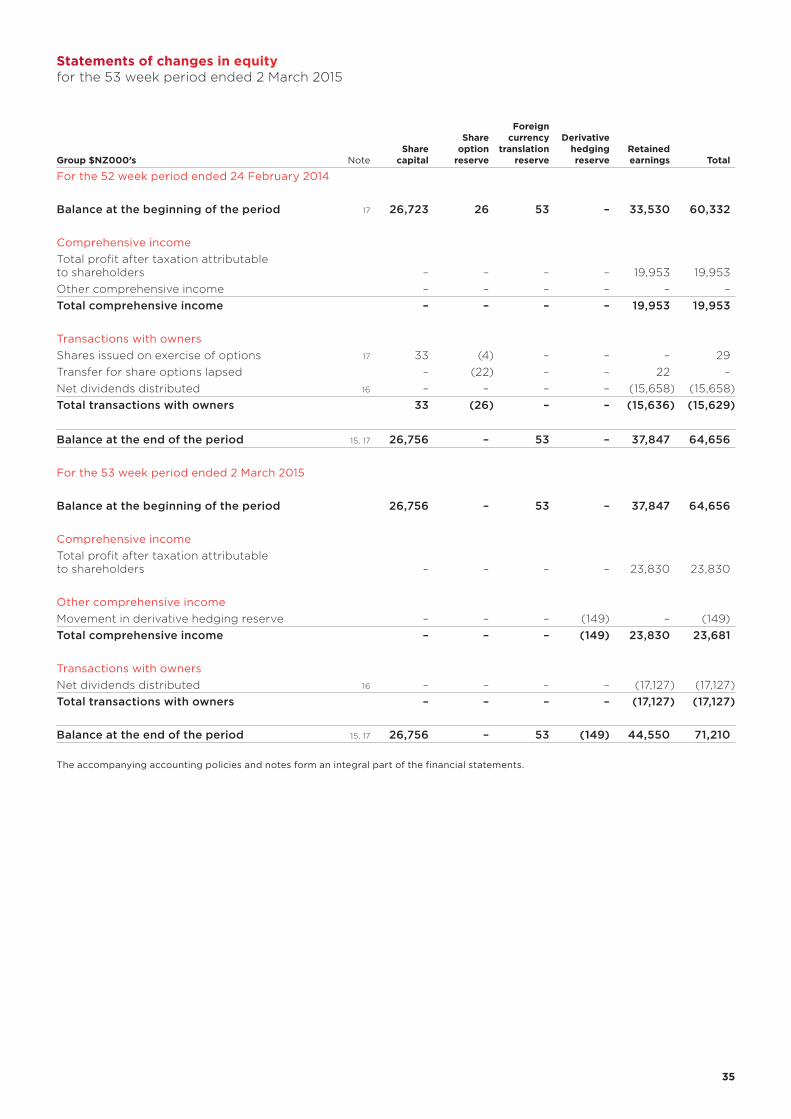
The accompanying accounting policies and notes form an integral part of the financial statements.
Group $NZ000’s NoteShare
capital
Share option
reserve
Foreign currency
translation reserve
Derivative hedging reserve
Retained earnings Total
For the 52 week period ended 24 February 2014
Balance at the beginning of the period 17 26,723 26 53 – 33,530 60,332
Comprehensive incomeTotal profit after taxation attributable to shareholders – – – – 19,953 19,953 Other comprehensive income – – – – – –Total comprehensive income – – – – 19,953 19,953
Transactions with ownersShares issued on exercise of options 17 33 (4) – – – 29 Transfer for share options lapsed – (22) – – 22 –Net dividends distributed 16 – – – – (15,658) (15,658)Total transactions with owners 33 (26) – – (15,636) (15,629)
Balance at the end of the period 15, 17 26,756 – 53 – 37,847 64,656
For the 53 week period ended 2 March 2015
Balance at the beginning of the period 26,756 – 53 – 37,847 64,656
Comprehensive incomeTotal profit after taxation attributable to shareholders – – – – 23,830 23,830
Other comprehensive incomeMovement in derivative hedging reserve – – – (149) – (149)Total comprehensive income – – – (149) 23,830 23,681
Transactions with ownersNet dividends distributed 16 – – – – (17,127) (17,127)Total transactions with owners – – – – (17,127) (17,127)
Balance at the end of the period 15, 17 26,756 – 53 (149) 44,550 71,210
Statements of changes in equityfor the 53 week period ended 2 March 2015
3636
The accompanying accounting policies and notes form an integral part of the financial statements.
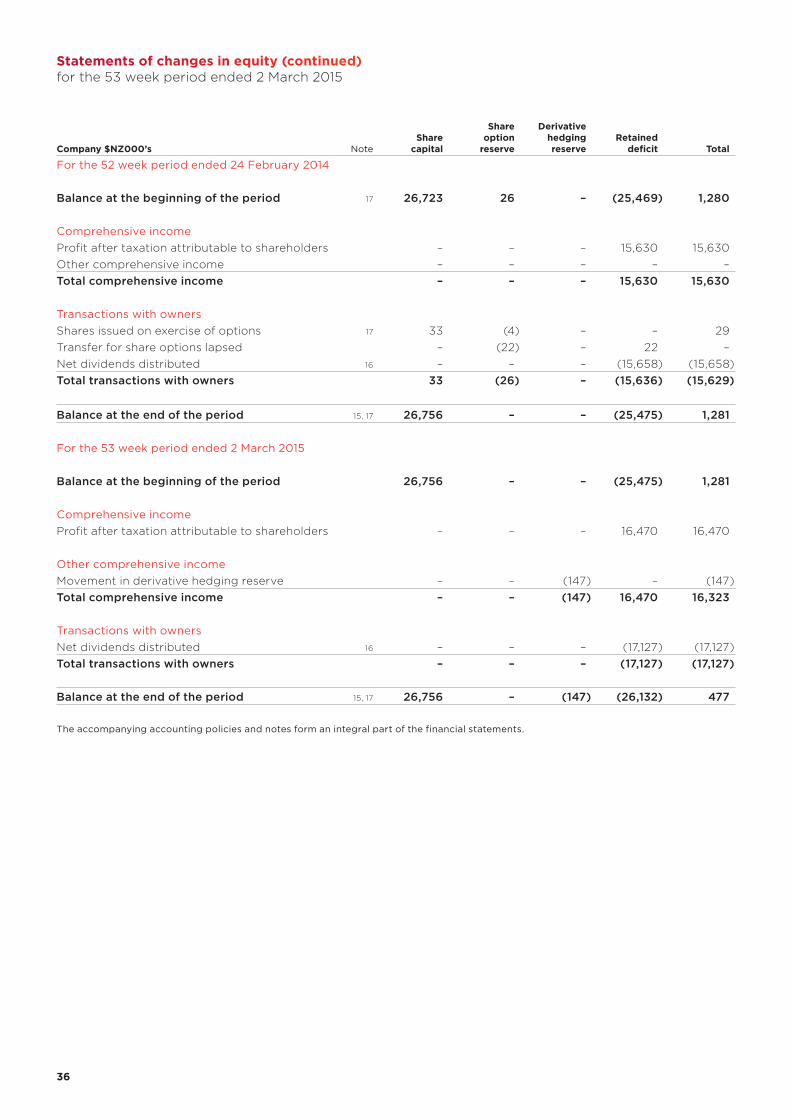
Company $NZ000’s NoteShare
capital
Share option
reserve
Derivative hedging reserve
Retained deficit Total
For the 52 week period ended 24 February 2014
Balance at the beginning of the period 17 26,723 26 – (25,469) 1,280
Comprehensive incomeProfit after taxation attributable to shareholders – – – 15,630 15,630 Other comprehensive income – – – – –Total comprehensive income – – – 15,630 15,630
Transactions with ownersShares issued on exercise of options 17 33 (4) – – 29 Transfer for share options lapsed – (22) – 22 –Net dividends distributed 16 – – – (15,658) (15,658)Total transactions with owners 33 (26) – (15,636) (15,629)
Balance at the end of the period 15, 17 26,756 – – (25,475) 1,281
For the 53 week period ended 2 March 2015
Balance at the beginning of the period 26,756 – – (25,475) 1,281
Comprehensive incomeProfit after taxation attributable to shareholders – – – 16,470 16,470
Other comprehensive incomeMovement in derivative hedging reserve – – (147) – (147)Total comprehensive income – – (147) 16,470 16,323
Transactions with ownersNet dividends distributed 16 – – – (17,127) (17,127)Total transactions with owners – – – (17,127) (17,127)
Balance at the end of the period 15, 17 26,756 – (147) (26,132) 477
Statements of changes in equity (continued)for the 53 week period ended 2 March 2015
37 37
The accompanying accounting policies and notes form an integral part of the financial statements.
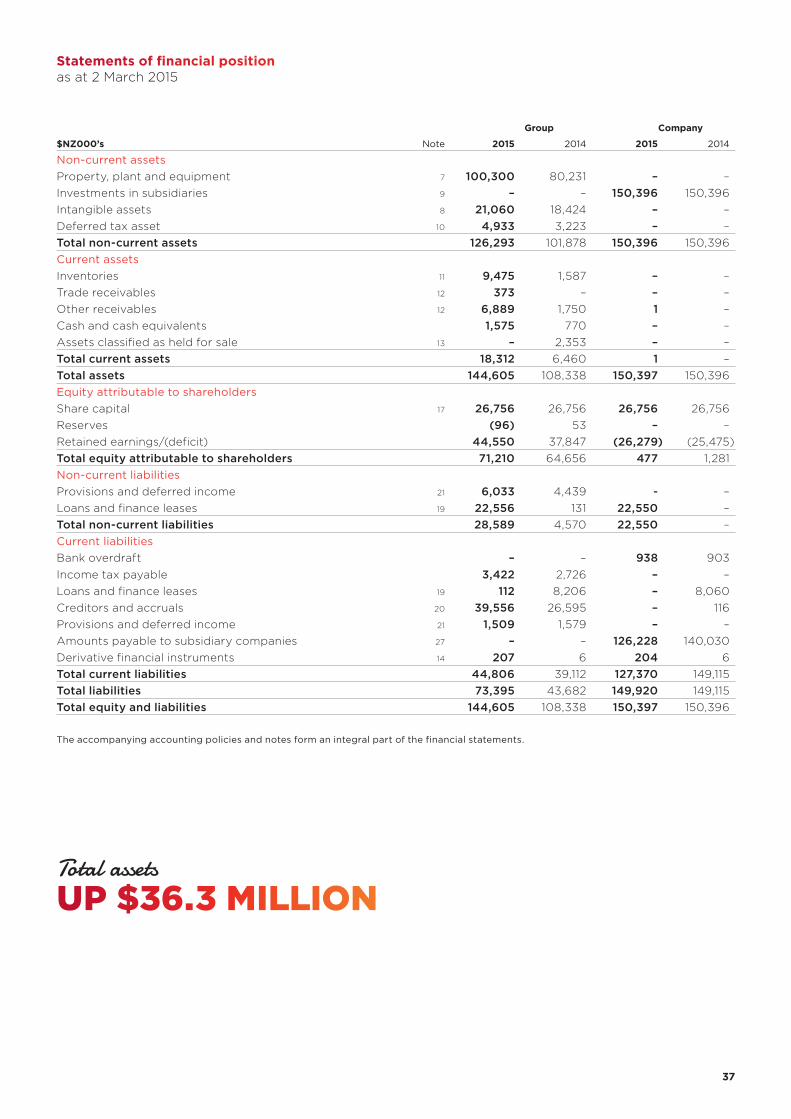
Statements of financial positionas at 2 March 2015
Group Company
$NZ000’s Note 2015 2014 2015 2014
Non-current assetsProperty, plant and equipment 7 100,300 80,231 – –Investments in subsidiaries 9 – – 150,396 150,396Intangible assets 8 21,060 18,424 – –Deferred tax asset 10 4,933 3,223 – –Total non-current assets 126,293 101,878 150,396 150,396Current assetsInventories 11 9,475 1,587 – –Trade receivables 12 373 – – –Other receivables 12 6,889 1,750 1 –Cash and cash equivalents 1,575 770 – –Assets classified as held for sale 13 – 2,353 – –Total current assets 18,312 6,460 1 –Total assets 144,605 108,338 150,397 150,396Equity attributable to shareholdersShare capital 17 26,756 26,756 26,756 26,756Reserves (96) 53 – –Retained earnings/(deficit) 44,550 37,847 (26,279) (25,475)Total equity attributable to shareholders 71,210 64,656 477 1,281 Non-current liabilitiesProvisions and deferred income 21 6,033 4,439 - –Loans and finance leases 19 22,556 131 22,550 –Total non-current liabilities 28,589 4,570 22,550 –Current liabilitiesBank overdraft – – 938 903Income tax payable 3,422 2,726 – –Loans and finance leases 19 112 8,206 – 8,060Creditors and accruals 20 39,556 26,595 – 116Provisions and deferred income 21 1,509 1,579 – –Amounts payable to subsidiary companies 27 – – 126,228 140,030Derivative financial instruments 14 207 6 204 6Total current liabilities 44,806 39,112 127,370 149,115Total liabilities 73,395 43,682 149,920 149,115Total equity and liabilities 144,605 108,338 150,397 150,396
Total assets
UP $36.3 MILLION
3838
The accompanying accounting policies and notes form an integral part of the financial statements.
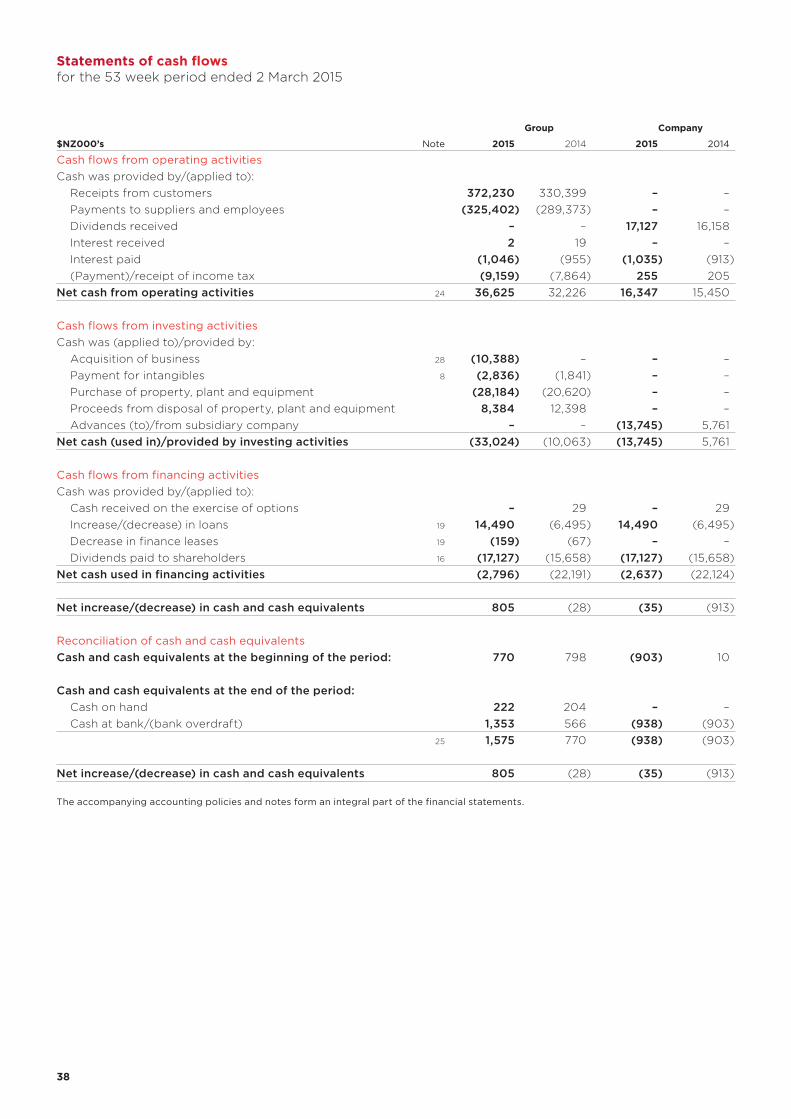
Statements of cash flowsfor the 53 week period ended 2 March 2015
Group Company
$NZ000’s Note 2015 2014 2015 2014
Cash flows from operating activitiesCash was provided by/(applied to): Receipts from customers 372,230 330,399 – – Payments to suppliers and employees (325,402) (289,373) – – Dividends received – – 17,127 16,158 Interest received 2 19 – – Interest paid (1,046) (955) (1,035) (913) (Payment)/receipt of income tax (9,159) (7,864) 255 205Net cash from operating activities 24 36,625 32,226 16,347 15,450
Cash flows from investing activitiesCash was (applied to)/provided by: Acquisition of business 28 (10,388) – – – Payment for intangibles 8 (2,836) (1,841) – – Purchase of property, plant and equipment (28,184) (20,620) – – Proceeds from disposal of property, plant and equipment 8,384 12,398 – – Advances (to)/from subsidiary company – – (13,745) 5,761Net cash (used in)/provided by investing activities (33,024) (10,063) (13,745) 5,761
Cash flows from financing activitiesCash was provided by/(applied to): Cash received on the exercise of options – 29 – 29 Increase/(decrease) in loans 19 14,490 (6,495) 14,490 (6,495) Decrease in finance leases 19 (159) (67) – – Dividends paid to shareholders 16 (17,127) (15,658) (17,127) (15,658)Net cash used in financing activities (2,796) (22,191) (2,637) (22,124)
Net increase/(decrease) in cash and cash equivalents 805 (28) (35) (913)
Reconciliation of cash and cash equivalentsCash and cash equivalents at the beginning of the period: 770 798 (903) 10
Cash and cash equivalents at the end of the period: Cash on hand 222 204 – – Cash at bank/(bank overdraft) 1,353 566 (938) (903)
25 1,575 770 (938) (903)
Net increase/(decrease) in cash and cash equivalents 805 (28) (35) (913)
39 39
Notes to and forming part of the financial statementsfor the 53 week period ended 2 March 2015
1. General informationRestaurant Brands New Zealand Limited (“Company” or “Parent”) together with its subsidiaries (the “Group”) operate quick service and takeaway restaurant concepts.
The Company is a limited liability company incorporated and domiciled in New Zealand. The address of its registered office is Level 3, Building 7, Central Park, 666 Great South Road, Penrose, Auckland.
The Group and Company financial statements (“financial statements”) were authorised for issue on 16 April 2015 by the Board of Directors who do not have the power to amend after issue.
2. Summary of significant accounting policiesThe principal accounting policies adopted in the preparation of the financial statements are set out below. These policies have been consistently applied to all the years presented, unless otherwise stated.
Basis of preparation and statutory baseRestaurant Brands New Zealand Limited is a company registered under the Companies Act 1993 and is a FMC reporting entity however it is not required to prepare financial statements under Part 7 of the Financial Markets Conduct Act 2013 until 29 February 2016 (2016 year end). The Company is listed on the New Zealand Stock Exchange (“NZX”) and is an issuer in terms of the Financial Reporting Act 1993. The financial statements of the Group have been prepared in accordance with the NZX Main Board Listing Rules, the Financial Reporting Act 1993 and the Companies Act 1993.
The financial statements have been prepared in accordance with New Zealand Generally Accepted Accounting Practice (“NZ GAAP”). They comply with New Zealand equivalents to International Financial Reporting Standards (“NZ IFRS”), NZ IFRIC interpretations, and other applicable Financial Reporting Standards, as appropriate for profit oriented entities. The financial statements comply with International Financial Reporting Standards (“IFRS”) as issued by IASB.
The financial statements are presented in New Zealand dollars, rounded where necessary to the nearest thousand dollars. The Group divides its financial year into 13 four-week periods. The 2015 full year results are however for 53 weeks with one five-week period (2014: 52 weeks).
Entities reportingThe financial statements for the Group are the financial statements comprising the economic entity Restaurant Brands New Zealand Limited and its subsidiaries. The financial statements of the Parent are for the Company as a separate legal entity.
The Parent and the Group are designated as profit oriented entities for financial reporting purposes.
Historical cost conventionThe financial statements have been prepared on the historical cost convention, unless otherwise stated.
Critical accounting estimates and judgmentsThe preparation of financial statements requires management to make judgments, estimates and assumptions that affect the application of accounting policies and the reported amounts of assets, liabilities, income and expenses. Actual results may differ from these estimates.
The estimates and assumptions that have a significant risk of causing material adjustment to the carrying value of assets and liabilities within the next financial year are addressed below.
(i) Goodwill impairment
As disclosed in Note 8, the Group undertook impairment testing of its operating divisions. Note 8 sets out the key assumptions used to determine the recoverable amount along with a sensitivity analysis.
4040
Notes to and forming part of the financial statements (continued)for the 53 week period ended 2 March 2015
2. Summary of significant accounting policies (continued)
(a) Basis of consolidation Subsidiaries are all entities (including structured entities) over which the Group has control. The Group controls an entity when the Group is exposed to, or has rights to, variable returns from its involvement with the entity and has the ability to affect those returns through its power over the entity. Subsidiaries are fully consolidated from the date on which control is transferred to the Group. They are deconsolidated from the date that control ceases.
The acquisition method of accounting is used to account for the acquisition of subsidiaries by the Group. The cost of an acquisition is measured as the fair value of the assets given, equity instruments issued and liabilities incurred or assumed at the date of exchange. Acquisition related costs are expensed as incurred. Identifiable assets acquired and liabilities and contingent liabilities assumed in a business combination are measured initially at their fair values at the acquisition date, irrespective of the extent of any minority interest. The excess of the cost of acquisition over the fair value of the Group’s share of the identifiable net assets acquired is recorded as goodwill. If the cost of acquisition is less than the fair value of the net assets of the subsidiary acquired, the difference is recognised directly in the statements of comprehensive income.
Intra-group balances and profits resulting from intra-group transactions are eliminated in preparing the financial statements.
(b) Foreign currency translationItems included in the financial statements are measured using the currency of the primary economic environment in which the entity operates (“the functional currency”). The financial statements are presented in NZD, which is the Group’s presentation currency.
Foreign currency transactions are translated into the functional currency using the exchange rates prevailing at the dates of the transactions or valuation where items are remeasured. Foreign exchange gains and losses resulting from the settlement of such transactions and from the translation at year end exchange rates of monetary assets and liabilities denominated in foreign currencies are recognised in the profit or loss. Amounts qualifying as cash flow hedges and qualifying net investment hedges are also recognised in the statements of comprehensive income.
The assets and liabilities of foreign operations, including goodwill and fair value adjustments arising on acquisition, are translated to New Zealand dollars at exchange rates at the reporting date. The income and expenses of foreign operations are translated to New Zealand dollars at exchange rates at the dates of the transactions.
Exchange differences arising from the translation of the net investment in foreign operations are recognised in the foreign currency translation reserve and are released to the statements of comprehensive income upon disposal.
(c) Financial instrumentsA financial instrument is recognised when the Group becomes a party to the contractual provisions of the instrument. Financial assets are derecognised when the Group’s contractual rights to the cash flows from the financial assets expire or when the Group transfers the financial asset to another party without retaining control or substantially all risks and rewards of the asset. Regular way purchases and sales of financial assets are accounted for at trade date, i.e. the date that the Group commits itself to purchase or sell the asset. Financial liabilities are derecognised when the Group’s obligations specified in the contract expire or are discharged or cancelled.
Non-derivative financial instrumentsNon-derivative financial instruments comprise trade and other receivables, which are initially recognised at fair value plus transaction costs and subsequently measured at amortised cost, cash and cash equivalents, loans and borrowings (initially recognised at fair value plus transaction costs and subsequently measured at amortised cost), and creditors and accruals which are initially recognised at fair value and subsequently measured at amortised cost.
Derivative financial instrumentsThe Group has various derivative financial instruments to manage the exposures that arise due to movements in foreign currency exchange rates and interest rates arising from operational, financing and investment activities. The Group does not hold derivative financial instruments for trading purposes. However, derivatives that do not qualify for hedge accounting are accounted for at fair value through profit or loss. Embedded derivatives are separated from the host contract and accounted for separately if the economic characteristics and risks of the host contract and the embedded derivative are not closely related. A separate instrument with the same terms as the embedded derivative would meet the definition of a derivative, and the combined instrument is not measured at fair value through profit or loss.
41 41
Notes to and forming part of the financial statements (continued)for the 53 week period ended 2 March 2015
2. Summary of significant accounting policies (continued)
(c) Financial instruments (continued)
Derivative financial instruments (continued)Derivatives are recognised initially at fair value and attributable transaction costs are recognised in profit or loss when incurred. Subsequent to initial recognition, derivatives are measured at fair value, and changes therein are accounted for as described below.
The fair value of forward exchange contracts is estimated by discounting the difference between the contractual forward price and the current forward price for the residual maturity of the contract using a risk-free interest rate (based on government bonds). The fair value of interest rate swaps is based on broker quotes. Those quotes are tested for reasonableness by discounting estimated future cash flows based on the terms and maturity of each contract and using market interest rates for a similar instrument at the measurement date.
Fair value hierarchyThe Group uses the following hierarchy for determining and disclosing the fair value of financial instruments by valuation technique:
Level 1: quoted (unadjusted) prices in active markets for identical assets or liabilities;
Level 2: other techniques for which all inputs which have a significant effect on the recorded fair value are observable, either directly or indirectly;
Level 3: techniques which use inputs which have a significant effect on the recorded fair value that are not based on observable market data.
Cash flow hedgesChanges in the fair value of the derivative hedging instrument designated as a cash flow hedge are recognised directly in equity to the extent that the hedge is effective. To the extent that the hedge is ineffective, changes in fair value are recognised in profit or loss.
If the hedging instrument no longer meets the criteria for hedge accounting, expires or is sold, terminated or exercised, then hedge accounting is discontinued prospectively. The cumulative gain or loss previously recognised in equity remains there until the forecast transaction occurs. When a forecast transaction is no longer expected to occur, the cumulative gain or loss that was reported in equity is immediately transferred to profit or loss. When the hedged item is a non-financial asset, the amount recognised in equity is transferred to the carrying amount of the asset when it is recognised. In other cases the amount recognised in equity is transferred to profit or loss in the same period that the hedged item affects profit or loss.
(d) Revenue recognition
Store sales revenueRevenue from store sales of goods is measured at the fair value of the consideration received or receivable, net of returns and allowances, discounts and volume rebates. Revenue is recognised when the significant risks and rewards of ownership have been transferred to the buyer, recovery of the consideration is probable, the associated costs of possible return of goods can be estimated reliably and there is no continuing management involvement with the goods.
Other revenueOther revenue represents sales of goods and services to independent franchisees. Services revenue is recognised in the accounting period in which the services are rendered, by reference to completion of the specific transaction assessed on the basis of the actual service provided as a proportion of the total services to be provided. Sales of goods are measured and recognised on a consistent basis with store sales revenue as already noted.
Dividend incomeDividend income is recognised when the right to receive payment is established.
Interest revenueInterest revenue is recognised on a time proportion basis using the effective interest method.
4242
Notes to and forming part of the financial statements (continued)for the 53 week period ended 2 March 2015
2. Summary of significant accounting policies (continued)
(e) Net financing costsNet financing costs comprise: interest payable on borrowings calculated using the effective interest rate method; interest received on funds invested calculated using the effective interest rate method; foreign exchange gains and losses; gains and losses on certain financial instruments that are recognised in the statements of comprehensive income; unwinding of the discount on provisions and impairment losses on financial assets.
(f) Lease payments
Finance leasesMinimum lease payments under finance leases are apportioned between the finance charge and the reduction of the outstanding liability. The finance expense is allocated to each period during the lease term so as to produce a constant periodic rate of interest on the remaining balance of the liability. Contingent lease payments are accounted for by revising the minimum lease payments over the remaining term of the lease when the lease adjustment is confirmed.
Operating leasesPayments made under operating leases are recognised in the statements of comprehensive income on a straight line basis over the term of the lease. Lease incentives received are recognised as an integral part of the total lease expense over the term of the lease.
(g) Income tax expenseIncome tax expense comprises current and deferred tax. Income tax expense is recognised in the statements of comprehensive income. Current tax is the expected tax payable on the taxable income for the year, using tax rates enacted or substantively enacted at the reporting date, and any adjustment to tax payable in respect of previous years. Deferred tax is recognised using the balance sheet method, providing for temporary differences between the carrying amounts of assets and liabilities for financial reporting purposes and the amounts used for taxation purposes. Deferred tax is not recognised for the following temporary differences: the initial recognition of goodwill, the initial recognition of assets or liabilities in a transaction that is not a business combination and that affects neither accounting nor taxable profit, and differences relating to investments in subsidiaries and jointly controlled entities to the extent that they probably will not reverse in the foreseeable future.
Deferred tax is measured at the tax rates that are expected to be applied to the temporary differences when they reverse, based on the laws that have been enacted or substantively enacted by the reporting date. A deferred tax asset is recognised to the extent that it is probable that future taxable profits will be available against which temporary differences can be utilised. Deferred tax assets are reviewed at each reporting date and are reduced to the extent that it is no longer probable that the related tax benefit will be realised. Additional income taxes that arise from the distribution of dividends are recognised at the same time as the liability to pay the related dividend is recognised.
Deferred tax assets and liabilities are set off only if there is a legal right of set off and they relate to income taxes levied by the same taxation authorities.
(h) Advertising and promotion costsExpenditure on advertising and promotional activities is recognised as an expense when the Group has the right to access the goods or has received the service.
(i) Royalties paidRoyalties are recognised as an expense as revenue is earned.
(j) Financial assetsThe Group classifies its financial assets in the following categories: at fair value through profit or loss or loans and receivables. The classification depends on the purpose for which the financial assets were acquired. Management determines the classification of its financial assets at initial recognition.
Financial assets at fair value through profit or lossFinancial assets at fair value through profit or loss are financial assets held for trading. A financial asset is classified in this category if acquired principally for the purpose of selling in the short-term. Derivatives are also categorised as held for trading unless they are designated as hedges. Assets in this category are classified as current assets.
43 43
Notes to and forming part of the financial statements (continued)for the 53 week period ended 2 March 2015
2. Summary of significant accounting policies (continued)
(j) Financial assets (continued)
Loans and receivablesLoans and receivables are non-derivative financial assets with fixed or determinable payments that are not quoted in an active market. They are included in current assets, except for maturities greater than 12 months after the balance sheet date. These are classified as non-current assets. The Group’s loans and receivables comprise “other receivables” and “cash and cash equivalents” in the statements of financial position.
Financial assets that are stated at cost or amortised cost are reviewed individually at balance date to determine whether there is objective evidence of impairment. If any such evidence exists, the asset’s recoverable amount is calculated using the present value of future cash flows discounted at the original effective interest rate. An impairment loss is recognised in the statements of comprehensive income for the difference between the carrying amount and the recoverable amount. An impairment loss is reversed if the subsequent increase in the recoverable amount can be related objectively to an event occurring after the impairment was recognised. The impairment loss is reversed only to the extent that the financial asset’s carrying value does not exceed the carrying value that would have been determined if no impairment loss had been recognised.
(k) Cash and cash equivalentsCash and cash equivalents comprise cash balances and call deposits. Bank overdrafts that are repayable on demand and form an integral part of the Group’s cash management are included as a component of cash and cash equivalents for the purpose of the statement of cash flows.
(l) Creditors and accrualsTrade payables are recognised initially at fair value and subsequently measured at amortised cost using the effective interest method.
(m) BorrowingsBorrowings are recognised initially at fair value, net of transaction costs incurred. Borrowings are subsequently stated at amortised cost; any difference between the proceeds (net of transaction costs) and the redemption value is recognised in the statements of comprehensive income over the period of the borrowings using the effective interest method.
(n) Intangible assets
GoodwillGoodwill arises on the acquisition of subsidiaries and business combinations. Goodwill is measured at cost less accumulated impairment losses. Goodwill is allocated to cash generating units and is tested annually for impairment. Where the Group disposes of an operation within a cash generating unit, the goodwill associated with the operation disposed of is part of the gain or loss on disposal. Goodwill disposed of in this manner is measured based on the relative values of the operation disposed of and the portion of the cash generating unit retained.
Franchise costsFranchise costs are those incurred in obtaining franchise rights or licences to operate quick service and take-away restaurant concepts. They include for example, the initial fee paid to a system franchisor when a new store is opened. These are measured at cost less accumulated amortisation and accumulated impairment costs. Amortisation is on a straight line basis over the life of the applicable franchise or licence agreement.
Concept development costs and fees Concept development costs and fees include certain costs, other than the direct cost of obtaining the franchise, associated with the establishment of quick service and takeaway restaurant concepts. These include, for example, professional fees and consulting costs associated with the establishment of a new brand or business acquisition.
These costs are capitalised where the concept is proven to be commercially feasible and the related future economic benefits are expected to exceed those costs with reasonable certainty. These are subsequently measured at cost less accumulated amortisation and accumulated impairment losses. Amortisation is recognised on a straight line basis over the period which future economic benefits are reasonably expected to be derived.
Acquired software costsSoftware costs have a finite useful life. Software costs are capitalised and amortised on a straight line basis over the estimated economic life of 3–8 years.
4444
Notes to and forming part of the financial statements (continued)for the 53 week period ended 2 March 2015
2. Summary of significant accounting policies (continued)
(o) Property, plant and equipment
Owned assetsProperty, plant and equipment are measured at cost less accumulated depreciation and impairment losses. Where appropriate, the cost of property, plant and equipment includes site preparation costs, installation costs and the cost of obtaining resource consents required to bring the asset ready for use. Borrowing costs associated with non-qualified property, plant and equipment are expensed as incurred.
When parts of an item of property, plant and equipment have different useful lives, they are accounted for as separate items (major components) of property, plant and equipment.
The cost of replacing part of an item of property, plant and equipment is recognised in the carrying amount of the item if it is probable that the future economic benefits embodied within the part will flow to the Group and its cost can be measured reliably. The costs of the day-to-day servicing of property, plant and equipment are recognised in the statements of comprehensive income as incurred.
Leased assetsLeases in terms of which the Group assumes substantially all the risks and rewards of ownership are classified as finance leases. Assets acquired by way of finance leases are stated initially at an amount equal to the lower of its fair value and present value of the future minimum lease payments. Subsequent to initial recognition the asset is accounted for in accordance with the accounting policy applicable to that asset.
Other leases are operating leases and are not recognised on the Group’s statements of financial position. The Group also leases certain plant and equipment and land and buildings by way of operating lease. The cost of improvements to leasehold assets is capitalised as buildings or leasehold improvements and then depreciated as outlined below.
Capital work in progressAll costs relating to an asset are first recorded in capital work in progress. Once all associated costs for an asset are established with relative certainty, the asset is then transferred from work in progress and capitalised into property, plant and equipment.
Store start up costsCosts incurred in connection with assessing the feasibility of new sites are expensed as incurred with the exception of franchise costs and certain development costs and fees as discussed above.
DepreciationLand is not depreciated. Depreciation is recognised in the statements of comprehensive income and is calculated on a straight line basis to allocate the cost of an asset, less any residual value, over its estimated useful life. Leased assets are depreciated over the shorter of the lease term and their useful lives. The estimated useful lives of fixed assets are as follows:
Leasehold improvements 5–20 yearsPlant and equipment 3–12.5 yearsMotor vehicles 4 yearsFurniture and fittings 3–10 yearsComputer equipment 3–5 years
Depreciation methods, useful lives and residual values are reassessed at the reporting date.
(p) InventoriesInventories are measured at the lower of cost and net realisable value. Net realisable value is the estimated selling price less the estimated costs of marketing, selling and distribution. The cost of inventories is based on the first-in first-out method and includes expenditure incurred in acquiring the inventories and bringing them to their existing condition and location.
(q) DividendsDividends are accrued in the period in which they are authorised.
45 45
Notes to and forming part of the financial statements (continued)for the 53 week period ended 2 March 2015
2. Summary of significant accounting policies (continued)
(r) Impairment on non-financial assetsThe carrying amounts of the Group’s assets except for inventories and deferred tax assets are reviewed at each balance date to determine whether there is any indication of impairment. If any such indication exists then the asset’s or Cash Generating Unit’s (CGU’s) recoverable amount is estimated. For goodwill and intangible assets that have indefinite lives or that are not yet available for use, the recoverable amount is estimated at each reporting date. An impairment loss is recognised whenever the carrying amount of an asset or CGU exceeds its recoverable amount. A CGU is the smallest identifiable asset group that generates cash flows that are largely independent from other assets and groups.
The recoverable amount of an asset or CGU is the greater of its value in use and its fair value less costs to sell. In assessing value in use, the estimated future cash flows are discounted to their present value using a discount rate that reflects current market assessments of the time value of money and the risks specific to the asset. Impairment losses directly reduce the carrying amount of assets and are recognised in the statements of comprehensive income. Impairment losses recognised in respect of CGUs are allocated first to reduce the carrying amount of any goodwill allocated to the units and then to reduce the carrying amount of the other assets in the unit (group of units) on a pro rata basis.
Except for impairment losses on goodwill, impairment losses recognised in prior periods are assessed at each reporting date for any indications that the loss has decreased or no longer exists. An impairment loss is reversed if there has been a change in the estimates used to determine the recoverable amount. An impairment loss is reversed only to the extent that the asset’s carrying amount does not exceed the carrying amount that would have been determined, net of depreciation or amortisation, if no impairment loss had been recognised. An impairment loss in respect of goodwill is not reversed.
(s) Share capitalIncremental costs directly attributable to the issue of ordinary shares and share options are recognised as a deduction from equity.
(t) Earnings per shareThe Group presents basic and diluted earnings per share (EPS) data for its ordinary shares. Basic EPS is calculated by dividing the profit or loss attributable to ordinary shareholders of the Company by the weighted average number of ordinary shares outstanding during the period. Diluted EPS is determined by adjusting the profit or loss attributable to ordinary shareholders and the weighted average number of ordinary shares outstanding for the effects of all dilutive potential ordinary shares, which comprise share options granted to employees.
(u) Employee benefits
Other long-term employee benefitsThe Group’s net obligation in respect of long-term employee benefits is the amount of future benefit that employees have earned in return for their service in the current and prior periods. The benefit is discounted to determine its present value.
Share-based payment transactionsThe grant date fair value of options granted to employees is recognised as an employee expense, with a corresponding increase in equity, over the period in which the employees become unconditionally entitled to the options. The amount recognised as an expense is adjusted to reflect the actual number of share options that vest. The fair value of the options granted is measured using an options pricing model, taking into account the terms and conditions upon which the options were granted. The amount recognised as an expense is adjusted to reflect the actual number of share options that vest except where forfeiture is only due to share prices not achieving the threshold for vesting.
Short-term benefitsShort-term employee benefit obligations are measured on an undiscounted basis and are expensed as the related service is provided. A provision is recognised for the amount expected to be paid under short-term cash bonus if the Group has a present legal or constructive obligation to pay this amount as a result of past service provided by the employee and the obligation can be estimated reliably.
(v) Segment reportingOperating segments are reported in a manner consistent with the internal reporting provided to the chief operating decision maker. The chief operating decision maker, responsible for allocating resources and assessing performance of the operating segments, has been identified as the Senior Leadership Team. The Senior Leadership Team reviews the Group’s internal reporting in order to assess performance and allocate resources.
4646
Notes to and forming part of the financial statements (continued)for the 53 week period ended 2 March 2015
2. Summary of significant accounting policies (continued)
(w) Goods and services taxThe statements of comprehensive income and statements of cash flows have been prepared exclusive of Goods and Services Taxation (GST). All items in the statements of financial position are stated net of GST, with the exception of receivables and payables, which include GST invoiced.
(x) Non-current assets held for saleNon-current assets (or disposal groups comprising assets and liabilities) that are expected to be recovered primarily through sale rather than through continuing use are classified as held for sale. Immediately before classification as held for sale, the assets (or components of a disposal group) are remeasured in accordance with the Group’s accounting policies. Thereafter generally the assets (or disposal group) are measured at the lower of their carrying amount and fair value less costs to sell. Impairment losses on initial classification as held for sale and subsequent gains or losses on re-measurement are recognised in the statements of comprehensive income. Gains are not recognised in excess of any cumulative impairment loss.
(y) ProvisionsA provision is recognised if, as a result of a past event, the Group has a present legal or constructive obligation that can be estimated reliably, and it is probable that an outflow of economic benefits will be required to settle the obligation. Provisions are determined by discounting the expected future cash flows at a pre-tax rate that reflects current market assessments of the time value of money and the risks specific to the liability.
Onerous contractsA provision for onerous contracts is recognised when the expected benefits to be derived by the Group from a contract are lower than the unavoidable cost of meeting its obligations under the contract. The provision is measured at the present value of the lower of the expected cost of terminating the contract and the expected net cost of continuing with the contract. Before a provision is established, the Group recognises any impairment loss on the assets associated with that contract.
(z) Non-trading itemsThe Group seeks to present a measure of comparable underlying performance on a consistent basis. In order to do so, the Group separately discloses items considered to be unrelated to the day to day operational performance of the Group. Such items are classified as non-trading items and are separately disclosed in the statements of comprehensive income and notes to the financial statements.
47 47
Notes to and forming part of the financial statements (continued)for the 53 week period ended 2 March 2015
2. Summary of significant accounting policies (continued)
(aa) New standards and interpretations
Relevant standards, amendments and interpretations to existing standards that are not yet effective and have not been early adopted by the Group• NZ IFRS 15 Revenue from contracts with customers (effective for periods beginning on or after 1 January 2017) deals
with revenue recognition and establishes principles for reporting useful information to users of financial statements about the nature, amount, timing and uncertainty of revenue and cash flows arising from an entity’s contracts with customers. Revenue is recognised when a customer obtains control of a good or service and thus has the ability to direct the use and obtain the benefits from the good or service. The standard replaces NZ IAS 18 “Revenue” and NZ IAS 11 “Construction contracts” and related interpretations. The Group intends to adopt NZ IFRS 15 on its effective date and is currently assessing its full impact.
• NZ IFRS 9 Financial Instruments (effective for periods beginning on or after 1 January 2018) addresses the classification, measurement and recognition of financial assets and financial liabilities. The complete version of NZ IFRS 9 was issued in September 2014. It replaces the guidance in NZ IAS 39 that relates to the classification and measurement of financial instruments. NZ IFRS 9 retains but simplifies the mixed measurement model and establishes three primary measurement categories for financial assets; amortised cost, fair value through other comprehensive income and fair value through profit or loss. The basis of classification depends on the entity’s business model and the contractual cash flow characteristics of the financial asset. Investments in equity instruments are required to be measured at fair value through profit or loss with the irrevocable option at inception to present changes in fair value in other comprehensive income not recycling. There is now a new expected credit losses model that replaces the incurred loss impairment model used in NZ IAS 39. For financial liabilities there were no changes to classification and measurement except for the recognition of changes in own credit risk in other comprehensive income, for liabilities designated at fair value through profit or loss. NZ IFRS 9 relaxes the requirements for hedge effectiveness by replacing the bright line hedge effectiveness tests. It requires an economic relationship between the hedged item and hedging instrument and for the “hedged ratio” to be the same as the one management actually use for risk management purposes. Contemporaneous documentation is still required but is different to that currently prepared under NZ IAS 39. The Group intends to adopt NZ IFRS 9 on its effective date and has yet to assess its full impact.
There are various other standards, amendments and interpretations which were assessed as having an immaterial impact on the Group. There are no NZ IFRS, NZ IFRIC interpretations or other applicable IFRS that are effective for the first time for the financial year beginning on or after 25 February 2014 that had a material impact on the financial statements.
(ab) Comparative informationWhere necessary, comparative information has been reclassified in order to provide a more appropriate basis for comparison.
3. Segmental reportingThe Group has four operating segments: KFC, Pizza Hut, Starbucks Coffee and Carl’s Jr. All segments operate quick service and takeaway restaurant concepts. No operating segments have been aggregated.
The segments were determined primarily because the Group manages each business separately and reports each business separately to the chief operating decision maker (the Senior Leadership Team). The reportable segments are each managed separately as they operate in four distinct markets, sell distinct products, have distinct production processes and have distinct operating and gross margin characteristics. The Group operates in New Zealand.
All other segments represents general and administration support centre costs (“G&A”). G&A support centre costs are not an operating segment as the costs incurred are incidental to the Group’s activities.
The Group evaluates performance and allocates resources to its operating segments on the basis of segment assets, segment revenues, concept EBITDA before general and administration expenses and EBIT before non-trading.
EBITDA refers to earnings before interest, taxation, depreciation and amortisation. EBIT refers to earnings before interest and taxation.
The accounting policies of the Group’s segments are the same as those described in the notes to the Group’s financial statements. Segment assets include items directly attributable to the segment (i.e. property, plant and equipment, intangible assets and inventories). Unallocated items comprise other receivables, cash and cash equivalents, deferred tax and derivative financial instruments as they are all managed on a central basis. These are part of the reconciliation to total assets in the statements of financial position. Segment capital expenditure is the total cost incurred during the period to acquire property, plant and equipment and intangible assets other than goodwill.
The Group has not disclosed segment liabilities as the chief operating decision maker evaluates performance and allocates resources purely on the basis of aggregated Group liabilities.
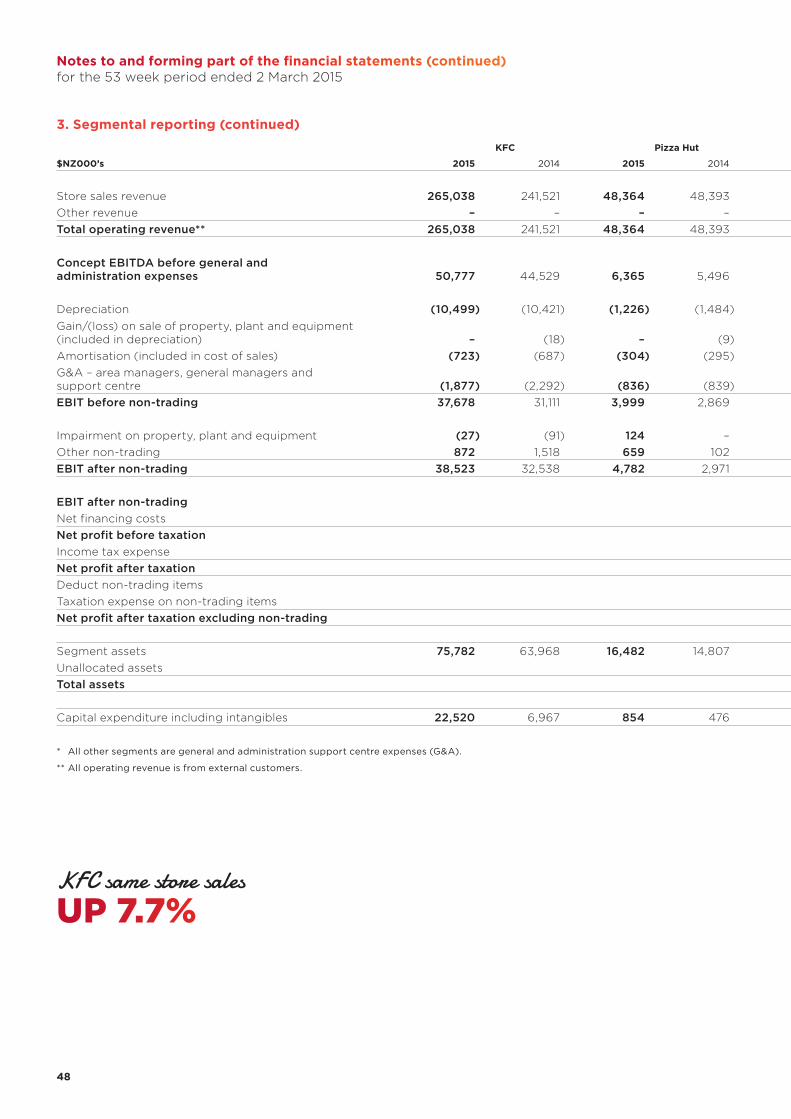
4848
Notes to and forming part of the financial statements (continued)for the 53 week period ended 2 March 2015
3. Segmental reporting (continued)
KFC Pizza Hut Starbucks Coffee Carl’s Jr. All other segments* Consolidated full year
$NZ000’s 2015 2014 2015 2014 2015 2014 2015 2014 2015 2014 2015 2014
Store sales revenue 265,038 241,521 48,364 48,393 26,067 25,041 20,059 14,314 – – 359,528 329,269Other revenue – – – – – – – – 13,075 1,130 13,075 1,130Total operating revenue** 265,038 241,521 48,364 48,393 26,067 25,041 20,059 14,314 13,075 1,130 372,603 330,399
Concept EBITDA before general and administration expenses 50,777 44,529 6,365 5,496 4,253 3,498 153 4 – – 61,548 53,527
Depreciation (10,499) (10,421) (1,226) (1,484) (887) (974) (1,797) (769) (599) (466) (15,008) (14,114)Gain/(loss) on sale of property, plant and equipment (included in depreciation) – (18) – (9) – (29) – – – 5 – (51)Amortisation (included in cost of sales) (723) (687) (304) (295) (66) (87) (155) (98) (380) (265) (1,628) (1,432)G&A – area managers, general managers and support centre (1,877) (2,292) (836) (839) (239) (431) (450) (491) (9,415) (7,179) (12,817) (11,232)EBIT before non-trading 37,678 31,111 3,999 2,869 3,061 1,977 (2,249) (1,354) (10,394) (7,905) 32,095 26,698
Impairment on property, plant and equipment (27) (91) 124 – 3 – (194) – – – (94) (91)Other non-trading 872 1,518 659 102 (96) (197) (13) 269 – (129) 1,422 1,563 EBIT after non-trading 38,523 32,538 4,782 2,971 2,968 1,780 (2,456) (1,085) (10,394) (8,034) 33,423 28,170
EBIT after non-trading 33,423 28,170Net financing costs (961) (755)Net profit before taxation 32,462 27,415Income tax expense (8,632) (7,462)Net profit after taxation 23,830 19,953Deduct non-trading items (1,328) (1,472)Taxation expense on non-trading items 21 382 Net profit after taxation excluding non-trading 22,523 18,863
Segment assets 75,782 63,968 16,482 14,807 4,955 4,004 29,139 14,421 4,477 2,924 130,835 100,124Unallocated assets 13,770 8,214Total assets 144,605 108,338
Capital expenditure including intangibles 22,520 6,967 854 476 583 412 16,724 12,176 2,631 2,143 43,312 22,174
* All other segments are general and administration support centre expenses (G&A).
** All operating revenue is from external customers.
KFC same store sales
UP 7.7%
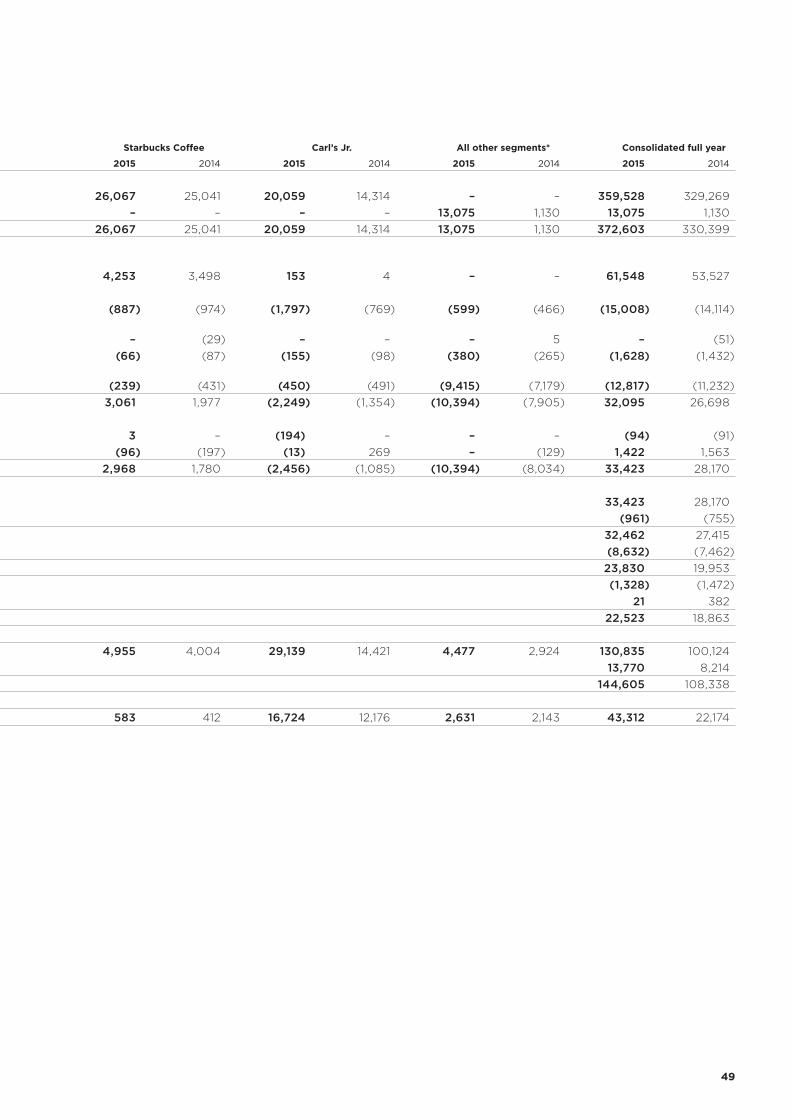
49 49
3. Segmental reporting (continued)
KFC Pizza Hut Starbucks Coffee Carl’s Jr. All other segments* Consolidated full year
$NZ000’s 2015 2014 2015 2014 2015 2014 2015 2014 2015 2014 2015 2014
Store sales revenue 265,038 241,521 48,364 48,393 26,067 25,041 20,059 14,314 – – 359,528 329,269Other revenue – – – – – – – – 13,075 1,130 13,075 1,130Total operating revenue** 265,038 241,521 48,364 48,393 26,067 25,041 20,059 14,314 13,075 1,130 372,603 330,399
Concept EBITDA before general and administration expenses 50,777 44,529 6,365 5,496 4,253 3,498 153 4 – – 61,548 53,527
Depreciation (10,499) (10,421) (1,226) (1,484) (887) (974) (1,797) (769) (599) (466) (15,008) (14,114)Gain/(loss) on sale of property, plant and equipment (included in depreciation) – (18) – (9) – (29) – – – 5 – (51)Amortisation (included in cost of sales) (723) (687) (304) (295) (66) (87) (155) (98) (380) (265) (1,628) (1,432)G&A – area managers, general managers and support centre (1,877) (2,292) (836) (839) (239) (431) (450) (491) (9,415) (7,179) (12,817) (11,232)EBIT before non-trading 37,678 31,111 3,999 2,869 3,061 1,977 (2,249) (1,354) (10,394) (7,905) 32,095 26,698
Impairment on property, plant and equipment (27) (91) 124 – 3 – (194) – – – (94) (91)Other non-trading 872 1,518 659 102 (96) (197) (13) 269 – (129) 1,422 1,563 EBIT after non-trading 38,523 32,538 4,782 2,971 2,968 1,780 (2,456) (1,085) (10,394) (8,034) 33,423 28,170
EBIT after non-trading 33,423 28,170Net financing costs (961) (755)Net profit before taxation 32,462 27,415Income tax expense (8,632) (7,462)Net profit after taxation 23,830 19,953Deduct non-trading items (1,328) (1,472)Taxation expense on non-trading items 21 382 Net profit after taxation excluding non-trading 22,523 18,863
Segment assets 75,782 63,968 16,482 14,807 4,955 4,004 29,139 14,421 4,477 2,924 130,835 100,124Unallocated assets 13,770 8,214Total assets 144,605 108,338
Capital expenditure including intangibles 22,520 6,967 854 476 583 412 16,724 12,176 2,631 2,143 43,312 22,174
* All other segments are general and administration support centre expenses (G&A).
** All operating revenue is from external customers.
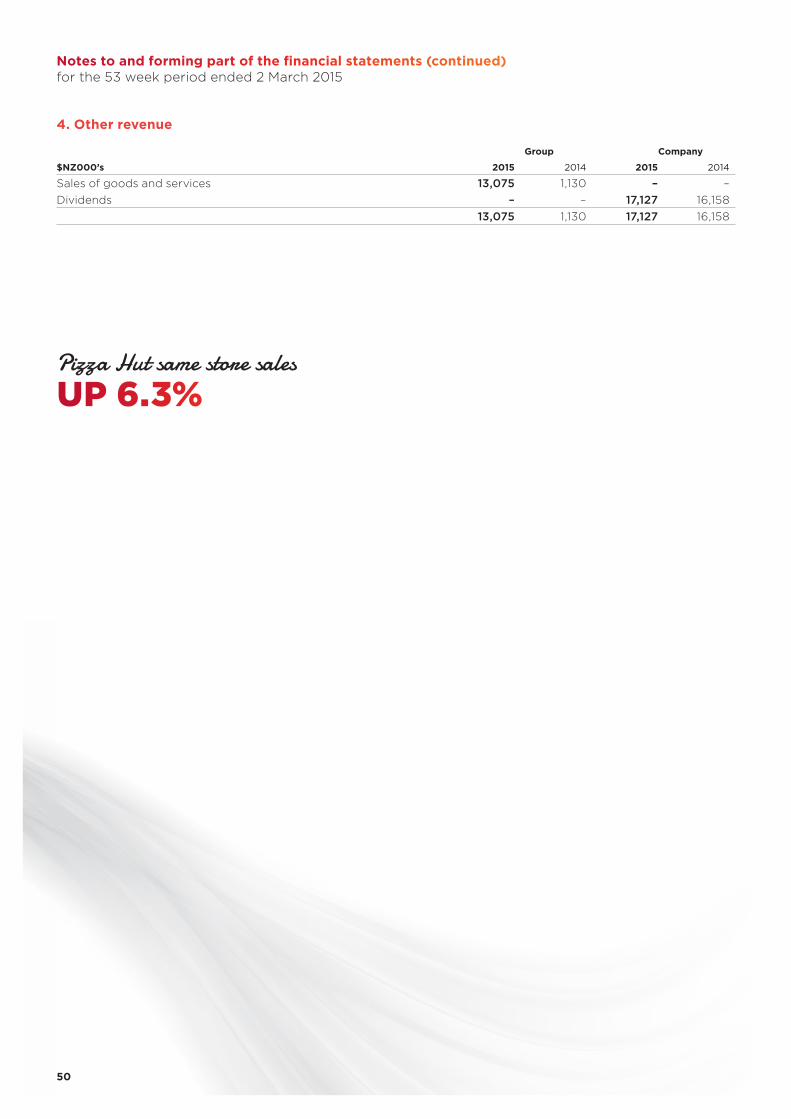
5050
Notes to and forming part of the financial statements (continued)for the 53 week period ended 2 March 2015
4. Other revenue
Group Company
$NZ000’s 2015 2014 2015 2014
Sales of goods and services 13,075 1,130 – –Dividends – – 17,127 16,158
13,075 1,130 17,127 16,158
Pizza Hut same store sales
UP 6.3%
51 51
Notes to and forming part of the financial statements (continued)for the 53 week period ended 2 March 2015
5. Analysis of expensesThe profit before taxation is calculated after charging/(crediting) the following items:
Group Company
$NZ000’s 2015 2014 2015 2014
Fees paid to auditor To PwC for audit of annual financial statements 97 78 – – To PwC for other services Review of interim financial statements 23 19 – – Assurance services* 12 9 – –
Other services** 30 8 – –Total fees paid to auditor 162 114 – –Amortisation of intangibles 1,628 1,432 – –Royalties paid 21,156 19,416 – –Depreciation expense 15,008 14,114 – –Operating rental expenses 19,476 17,646 – –Net loss on disposal of property, plant and equipment (included in depreciation expense) – 51 – –Net gain on disposal of property, plant and equipment (included in non-trading costs) (2,598) (2,581) – –Donations 120 74 – –Directors' fees 314 250 – –Interest expense (net) 943 909 912 733Interest income – interest rate swap fair value changes – (180) – –Finance lease interest 18 26 – –
* Assurance services comprise audit of Company share registry and certain compliance certificates for third parties.
** Other services in 2015 comprise executive benchmarking assistance (2014: executive reward services review and tax compliance advice).
Non-trading items(Gain)/loss on sale of stores Net sale proceeds (1,155) (1,057) – – Property, plant and equipment disposed of 156 385 – – Goodwill disposed of 283 699 – –
(716) 27 – –Gain on sale and leaseback of stores (916) (1,754) – –Other store closure costs 306 325 – –Other store closure costs – franchise fees written off 23 47 – –Other store closure costs – insurance proceeds – (31) – –Other store relocation and refurbishment costs 332 11 – –Other store relocation and refurbishment – insurance proceeds (563) (6) – –Impairment on property, plant and equipment 94 (91) – –Other 112 – – –Total non-trading items (1,328) (1,472) – –
Group
$NZ000’s 2015 2014
Personnel expensesWages and salaries 94,907 83,697Increase in liability for long service leave 81 60
94,988 83,757
The Parent has no personnel expenses (2014: nil).
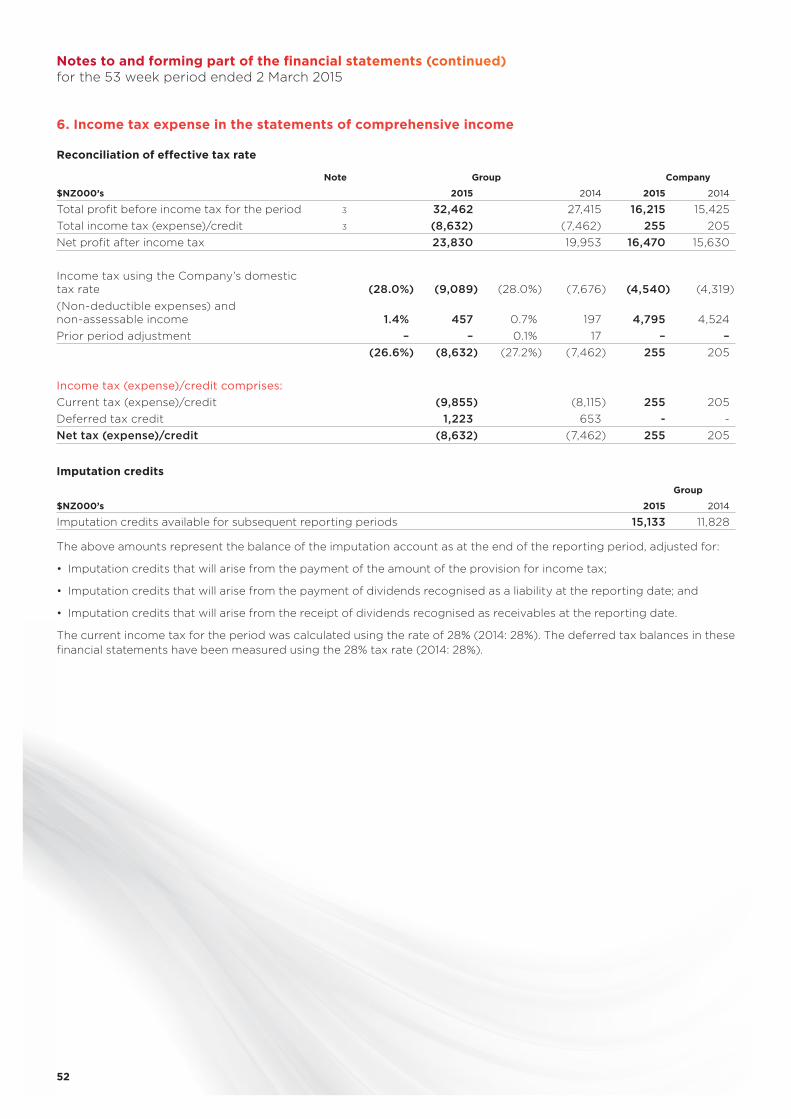
5252
Notes to and forming part of the financial statements (continued)for the 53 week period ended 2 March 2015
6. Income tax expense in the statements of comprehensive income
Reconciliation of effective tax rate
Note Group Company
$NZ000’s 2015 2014 2015 2014
Total profit before income tax for the period 3 32,462 27,415 16,215 15,425Total income tax (expense)/credit 3 (8,632) (7,462) 255 205Net profit after income tax 23,830 19,953 16,470 15,630
Income tax using the Company’s domestic tax rate (28.0%) (9,089) (28.0%) (7,676) (4,540) (4,319)(Non-deductible expenses) and non-assessable income 1.4% 457 0.7% 197 4,795 4,524Prior period adjustment – – 0.1% 17 – –
(26.6%) (8,632) (27.2%) (7,462) 255 205
Income tax (expense)/credit comprises:Current tax (expense)/credit (9,855) (8,115) 255 205Deferred tax credit 1,223 653 - -Net tax (expense)/credit (8,632) (7,462) 255 205
Imputation creditsGroup
$NZ000’s 2015 2014
Imputation credits available for subsequent reporting periods 15,133 11,828
The above amounts represent the balance of the imputation account as at the end of the reporting period, adjusted for:
• Imputation credits that will arise from the payment of the amount of the provision for income tax;
• Imputation credits that will arise from the payment of dividends recognised as a liability at the reporting date; and
• Imputation credits that will arise from the receipt of dividends recognised as receivables at the reporting date.
The current income tax for the period was calculated using the rate of 28% (2014: 28%). The deferred tax balances in these financial statements have been measured using the 28% tax rate (2014: 28%).
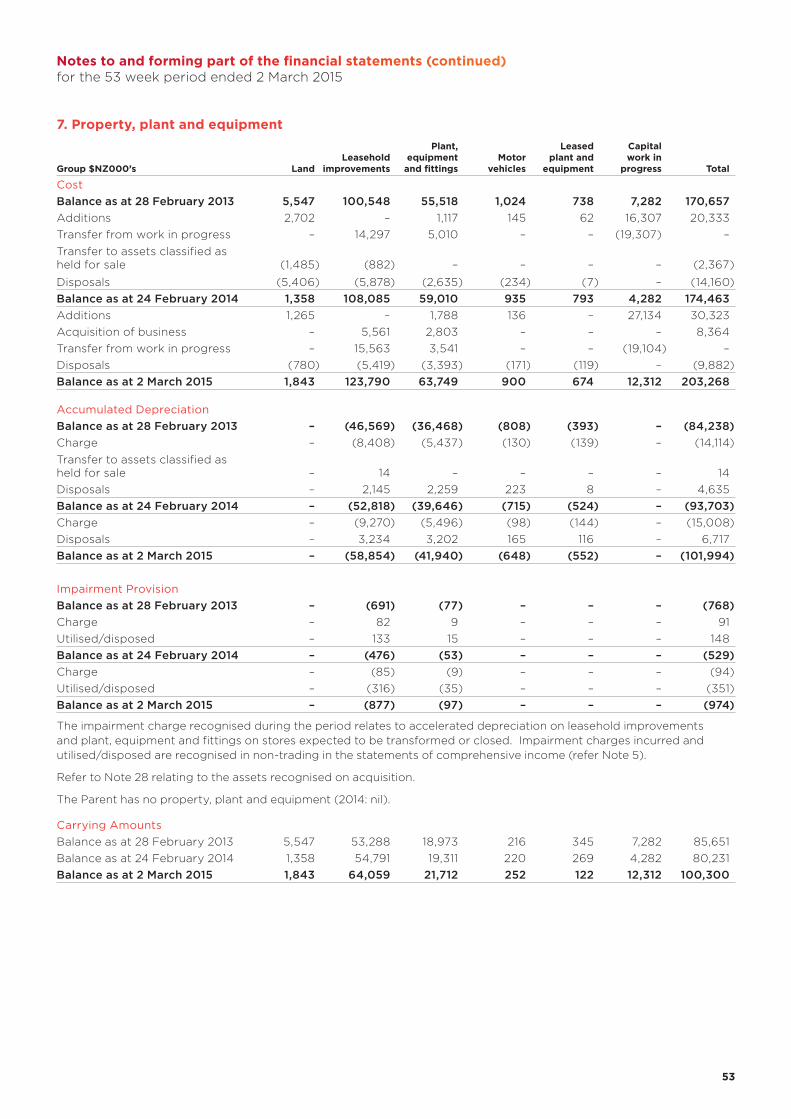
53 53
Notes to and forming part of the financial statements (continued)for the 53 week period ended 2 March 2015
7. Property, plant and equipment
Group $NZ000’s LandLeasehold
improvements
Plant, equipment
and fittingsMotor
vehicles
Leasedplant and
equipment
Capitalwork in
progress Total
CostBalance as at 28 February 2013 5,547 100,548 55,518 1,024 738 7,282 170,657Additions 2,702 – 1,117 145 62 16,307 20,333Transfer from work in progress – 14,297 5,010 – – (19,307) –Transfer to assets classified as held for sale (1,485) (882) – – – – (2,367)
Disposals (5,406) (5,878) (2,635) (234) (7) – (14,160)Balance as at 24 February 2014 1,358 108,085 59,010 935 793 4,282 174,463Additions 1,265 – 1,788 136 – 27,134 30,323Acquisition of business – 5,561 2,803 – – – 8,364Transfer from work in progress – 15,563 3,541 – – (19,104) –Disposals (780) (5,419) (3,393) (171) (119) – (9,882)Balance as at 2 March 2015 1,843 123,790 63,749 900 674 12,312 203,268
Accumulated DepreciationBalance as at 28 February 2013 – (46,569) (36,468) (808) (393) – (84,238)Charge – (8,408) (5,437) (130) (139) – (14,114)Transfer to assets classified as held for sale – 14 – – – – 14 Disposals – 2,145 2,259 223 8 – 4,635Balance as at 24 February 2014 – (52,818) (39,646) (715) (524) – (93,703)Charge – (9,270) (5,496) (98) (144) – (15,008)Disposals – 3,234 3,202 165 116 – 6,717Balance as at 2 March 2015 – (58,854) (41,940) (648) (552) – (101,994)
Impairment ProvisionBalance as at 28 February 2013 – (691) (77) – – – (768)Charge – 82 9 – – – 91 Utilised/disposed – 133 15 – – – 148Balance as at 24 February 2014 – (476) (53) – – – (529)Charge – (85) (9) – – – (94)Utilised/disposed – (316) (35) – – – (351)Balance as at 2 March 2015 – (877) (97) – – – (974)
The impairment charge recognised during the period relates to accelerated depreciation on leasehold improvements and plant, equipment and fittings on stores expected to be transformed or closed. Impairment charges incurred and utilised/disposed are recognised in non-trading in the statements of comprehensive income (refer Note 5).
Refer to Note 28 relating to the assets recognised on acquisition.
The Parent has no property, plant and equipment (2014: nil).
Carrying AmountsBalance as at 28 February 2013 5,547 53,288 18,973 216 345 7,282 85,651Balance as at 24 February 2014 1,358 54,791 19,311 220 269 4,282 80,231Balance as at 2 March 2015 1,843 64,059 21,712 252 122 12,312 100,300
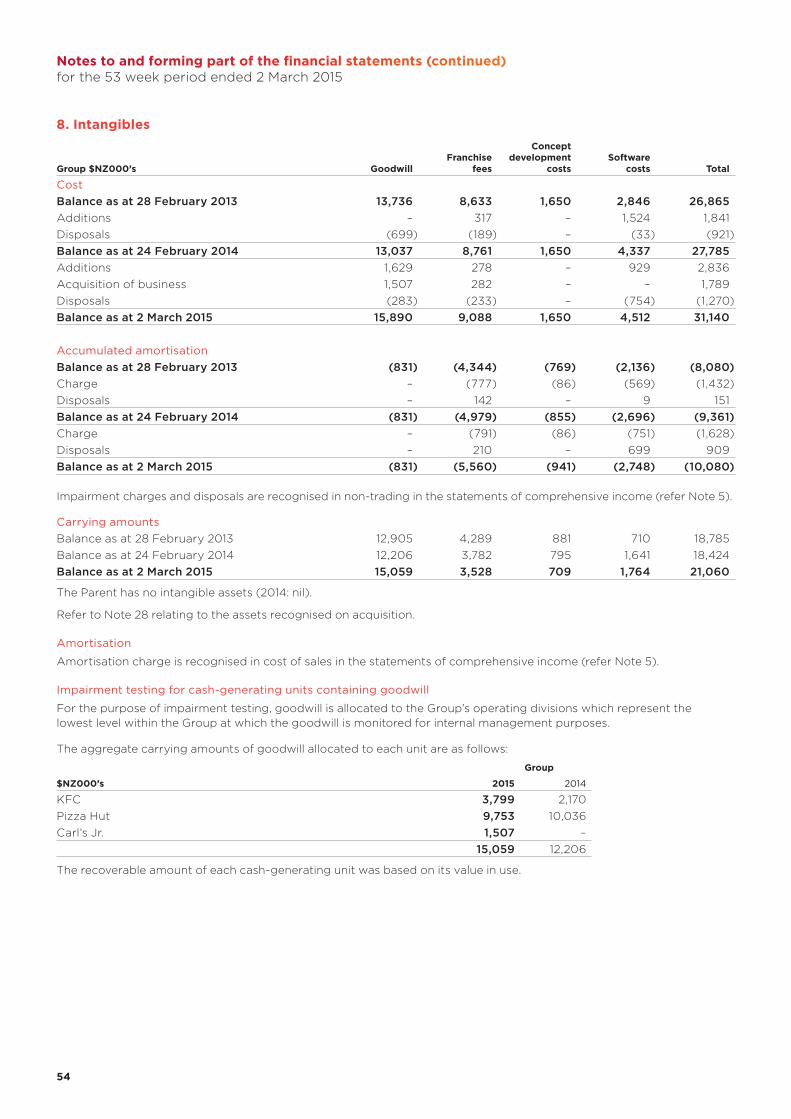
5454
Notes to and forming part of the financial statements (continued)for the 53 week period ended 2 March 2015
8. Intangibles
Group $NZ000’s GoodwillFranchise
fees
Concept development
costsSoftware
costs Total
CostBalance as at 28 February 2013 13,736 8,633 1,650 2,846 26,865Additions – 317 – 1,524 1,841Disposals (699) (189) – (33) (921)Balance as at 24 February 2014 13,037 8,761 1,650 4,337 27,785Additions 1,629 278 – 929 2,836Acquisition of business 1,507 282 – – 1,789Disposals (283) (233) – (754) (1,270)Balance as at 2 March 2015 15,890 9,088 1,650 4,512 31,140
Accumulated amortisationBalance as at 28 February 2013 (831) (4,344) (769) (2,136) (8,080)Charge – (777) (86) (569) (1,432)Disposals – 142 – 9 151 Balance as at 24 February 2014 (831) (4,979) (855) (2,696) (9,361)Charge – (791) (86) (751) (1,628)Disposals – 210 – 699 909 Balance as at 2 March 2015 (831) (5,560) (941) (2,748) (10,080)
Impairment charges and disposals are recognised in non-trading in the statements of comprehensive income (refer Note 5).
Carrying amountsBalance as at 28 February 2013 12,905 4,289 881 710 18,785Balance as at 24 February 2014 12,206 3,782 795 1,641 18,424Balance as at 2 March 2015 15,059 3,528 709 1,764 21,060
The Parent has no intangible assets (2014: nil).
Refer to Note 28 relating to the assets recognised on acquisition.
Amortisation
Amortisation charge is recognised in cost of sales in the statements of comprehensive income (refer Note 5).
Impairment testing for cash-generating units containing goodwill
For the purpose of impairment testing, goodwill is allocated to the Group’s operating divisions which represent the lowest level within the Group at which the goodwill is monitored for internal management purposes.
The aggregate carrying amounts of goodwill allocated to each unit are as follows:
Group
$NZ000’s 2015 2014
KFC 3,799 2,170Pizza Hut 9,753 10,036Carl’s Jr. 1,507 –
15,059 12,206
The recoverable amount of each cash-generating unit was based on its value in use.
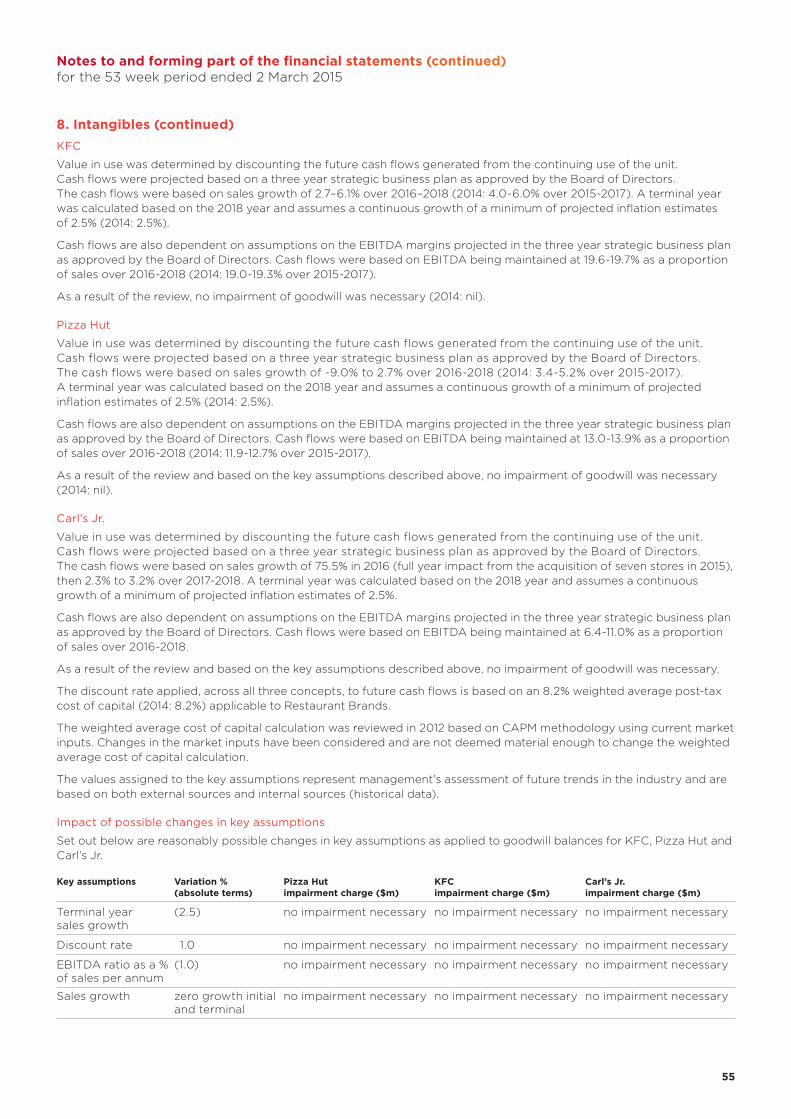
55 55
Notes to and forming part of the financial statements (continued)for the 53 week period ended 2 March 2015
8. Intangibles (continued)KFC
Value in use was determined by discounting the future cash flows generated from the continuing use of the unit. Cash flows were projected based on a three year strategic business plan as approved by the Board of Directors. The cash flows were based on sales growth of 2.7–6.1% over 2016–2018 (2014: 4.0-6.0% over 2015-2017). A terminal year was calculated based on the 2018 year and assumes a continuous growth of a minimum of projected inflation estimates of 2.5% (2014: 2.5%).
Cash flows are also dependent on assumptions on the EBITDA margins projected in the three year strategic business plan as approved by the Board of Directors. Cash flows were based on EBITDA being maintained at 19.6-19.7% as a proportion of sales over 2016-2018 (2014: 19.0-19.3% over 2015-2017).
As a result of the review, no impairment of goodwill was necessary (2014: nil).
Pizza Hut
Value in use was determined by discounting the future cash flows generated from the continuing use of the unit. Cash flows were projected based on a three year strategic business plan as approved by the Board of Directors. The cash flows were based on sales growth of -9.0% to 2.7% over 2016-2018 (2014: 3.4-5.2% over 2015-2017). A terminal year was calculated based on the 2018 year and assumes a continuous growth of a minimum of projected inflation estimates of 2.5% (2014: 2.5%).
Cash flows are also dependent on assumptions on the EBITDA margins projected in the three year strategic business plan as approved by the Board of Directors. Cash flows were based on EBITDA being maintained at 13.0-13.9% as a proportion of sales over 2016-2018 (2014: 11.9-12.7% over 2015-2017).
As a result of the review and based on the key assumptions described above, no impairment of goodwill was necessary (2014: nil).
Carl’s Jr.
Value in use was determined by discounting the future cash flows generated from the continuing use of the unit. Cash flows were projected based on a three year strategic business plan as approved by the Board of Directors. The cash flows were based on sales growth of 75.5% in 2016 (full year impact from the acquisition of seven stores in 2015), then 2.3% to 3.2% over 2017-2018. A terminal year was calculated based on the 2018 year and assumes a continuous growth of a minimum of projected inflation estimates of 2.5%.
Cash flows are also dependent on assumptions on the EBITDA margins projected in the three year strategic business plan as approved by the Board of Directors. Cash flows were based on EBITDA being maintained at 6.4-11.0% as a proportion of sales over 2016-2018.
As a result of the review and based on the key assumptions described above, no impairment of goodwill was necessary.
The discount rate applied, across all three concepts, to future cash flows is based on an 8.2% weighted average post-tax cost of capital (2014: 8.2%) applicable to Restaurant Brands.
The weighted average cost of capital calculation was reviewed in 2012 based on CAPM methodology using current market inputs. Changes in the market inputs have been considered and are not deemed material enough to change the weighted average cost of capital calculation.
The values assigned to the key assumptions represent management’s assessment of future trends in the industry and are based on both external sources and internal sources (historical data).
Impact of possible changes in key assumptions
Set out below are reasonably possible changes in key assumptions as applied to goodwill balances for KFC, Pizza Hut and Carl’s Jr.
Key assumptions Variation % (absolute terms)
Pizza Hut impairment charge ($m)
KFC impairment charge ($m)
Carl’s Jr. impairment charge ($m)
Terminal year sales growth
(2.5) no impairment necessary no impairment necessary no impairment necessary
Discount rate 1.0 no impairment necessary no impairment necessary no impairment necessary
EBITDA ratio as a % of sales per annum
(1.0) no impairment necessary no impairment necessary no impairment necessary
Sales growth zero growth initial and terminal
no impairment necessary no impairment necessary no impairment necessary
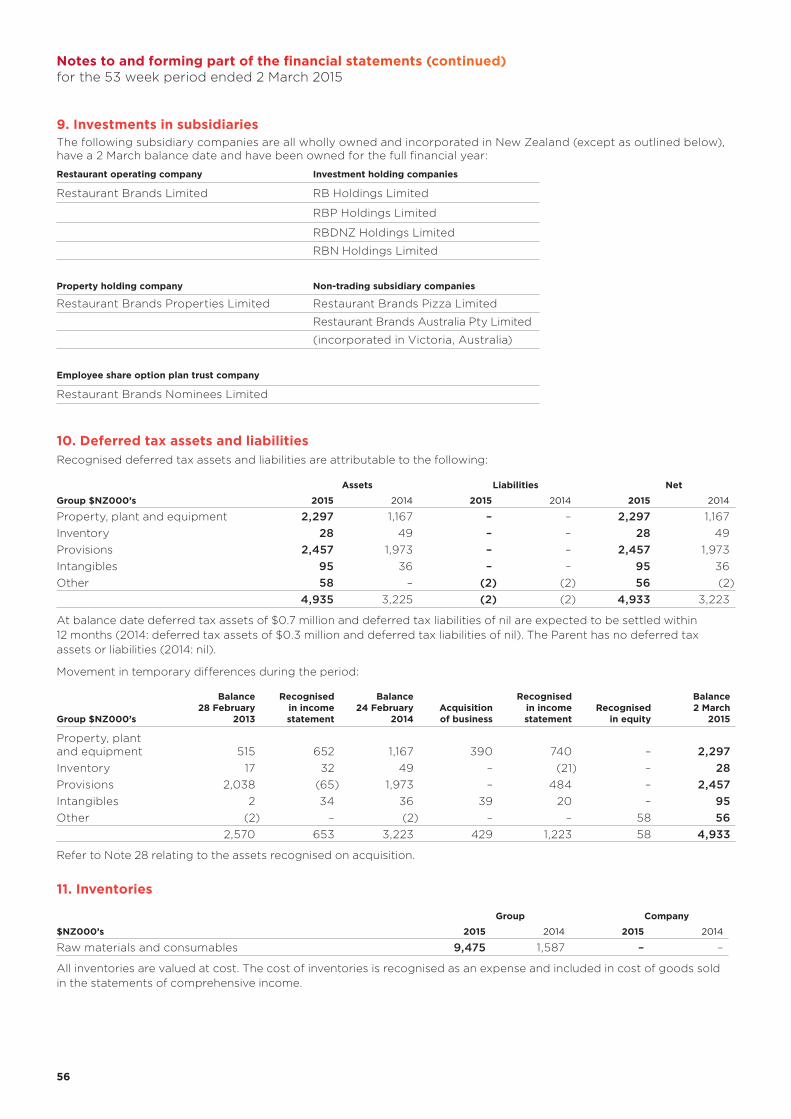
5656
Notes to and forming part of the financial statements (continued)for the 53 week period ended 2 March 2015
9. Investments in subsidiariesThe following subsidiary companies are all wholly owned and incorporated in New Zealand (except as outlined below), have a 2 March balance date and have been owned for the full financial year:
Restaurant operating company Investment holding companies
Restaurant Brands Limited RB Holdings Limited
RBP Holdings Limited
RBDNZ Holdings Limited
RBN Holdings Limited
Property holding company Non-trading subsidiary companies
Restaurant Brands Properties Limited Restaurant Brands Pizza Limited
Restaurant Brands Australia Pty Limited
(incorporated in Victoria, Australia)
Employee share option plan trust company
Restaurant Brands Nominees Limited
10. Deferred tax assets and liabilitiesRecognised deferred tax assets and liabilities are attributable to the following:
Assets Liabilities Net
Group $NZ000’s 2015 2014 2015 2014 2015 2014
Property, plant and equipment 2,297 1,167 – – 2,297 1,167Inventory 28 49 – – 28 49Provisions 2,457 1,973 – – 2,457 1,973Intangibles 95 36 – – 95 36Other 58 – (2) (2) 56 (2)
4,935 3,225 (2) (2) 4,933 3,223
At balance date deferred tax assets of $0.7 million and deferred tax liabilities of nil are expected to be settled within 12 months (2014: deferred tax assets of $0.3 million and deferred tax liabilities of nil). The Parent has no deferred tax assets or liabilities (2014: nil).
Movement in temporary differences during the period:
Group $NZ000’s
Balance28 February
2013
Recognised in income statement
Balance24 February
2014Acquisition of business
Recognised in income statement
Recognised in equity
Balance2 March
2015
Property, plant and equipment 515 652 1,167 390 740 – 2,297Inventory 17 32 49 – (21) – 28Provisions 2,038 (65) 1,973 – 484 – 2,457Intangibles 2 34 36 39 20 – 95Other (2) – (2) – – 58 56
2,570 653 3,223 429 1,223 58 4,933
Refer to Note 28 relating to the assets recognised on acquisition.
11. Inventories
Group Company
$NZ000’s 2015 2014 2015 2014
Raw materials and consumables 9,475 1,587 – –
All inventories are valued at cost. The cost of inventories is recognised as an expense and included in cost of goods sold in the statements of comprehensive income.
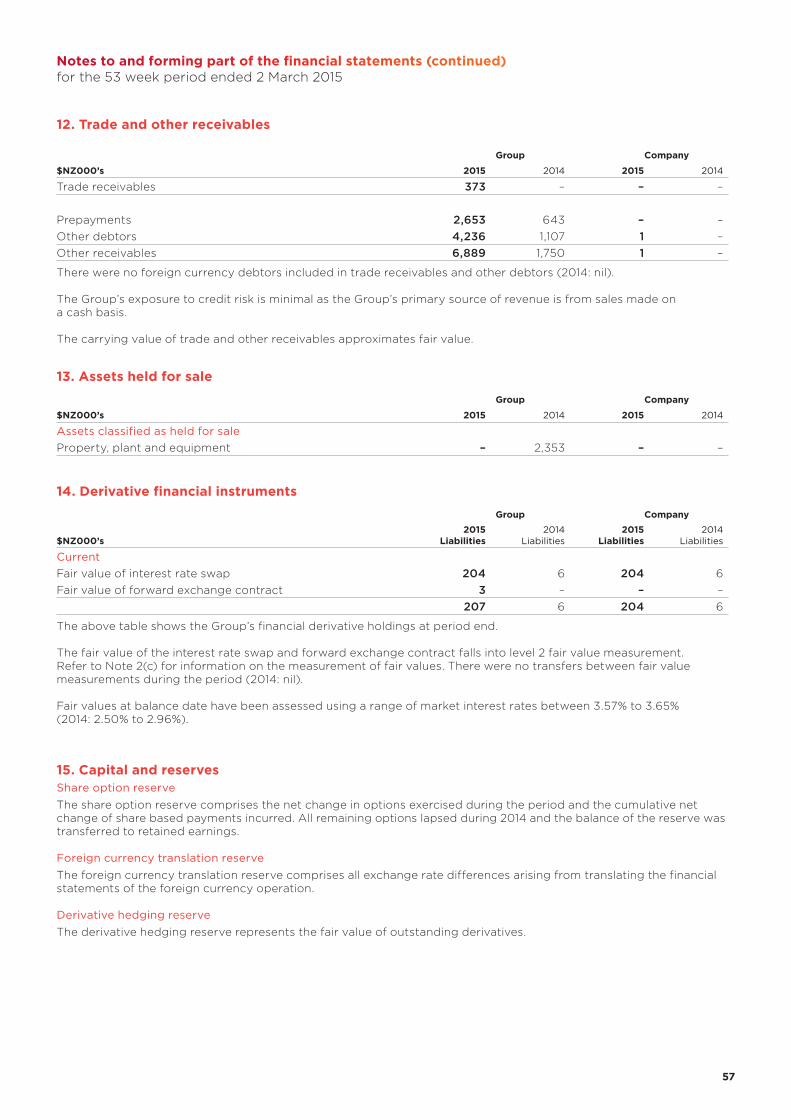
57 57
Notes to and forming part of the financial statements (continued)for the 53 week period ended 2 March 2015
12. Trade and other receivables
Group Company
$NZ000’s 2015 2014 2015 2014
Trade receivables 373 – – –
Prepayments 2,653 643 – –Other debtors 4,236 1,107 1 –Other receivables 6,889 1,750 1 –
There were no foreign currency debtors included in trade receivables and other debtors (2014: nil).
The Group’s exposure to credit risk is minimal as the Group’s primary source of revenue is from sales made on a cash basis.
The carrying value of trade and other receivables approximates fair value.
13. Assets held for sale
Group Company
$NZ000’s 2015 2014 2015 2014
Assets classified as held for saleProperty, plant and equipment – 2,353 – –
14. Derivative financial instruments
Group Company
$NZ000’s 2015
Liabilities2014
Liabilities2015
Liabilities2014
Liabilities
CurrentFair value of interest rate swap 204 6 204 6Fair value of forward exchange contract 3 – – –
207 6 204 6
The above table shows the Group’s financial derivative holdings at period end.
The fair value of the interest rate swap and forward exchange contract falls into level 2 fair value measurement. Refer to Note 2(c) for information on the measurement of fair values. There were no transfers between fair value measurements during the period (2014: nil).
Fair values at balance date have been assessed using a range of market interest rates between 3.57% to 3.65% (2014: 2.50% to 2.96%).
15. Capital and reservesShare option reserveThe share option reserve comprises the net change in options exercised during the period and the cumulative net change of share based payments incurred. All remaining options lapsed during 2014 and the balance of the reserve was transferred to retained earnings.
Foreign currency translation reserveThe foreign currency translation reserve comprises all exchange rate differences arising from translating the financial statements of the foreign currency operation.
Derivative hedging reserveThe derivative hedging reserve represents the fair value of outstanding derivatives.
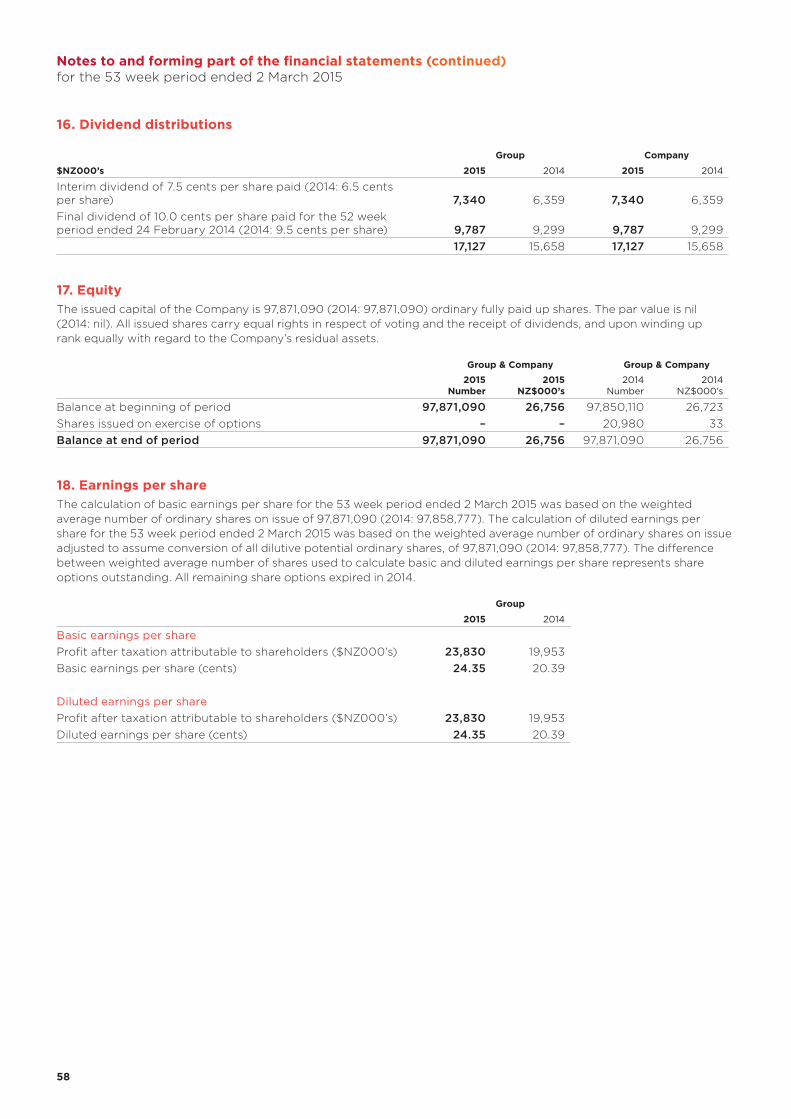
5858
Notes to and forming part of the financial statements (continued)for the 53 week period ended 2 March 2015
16. Dividend distributions
Group Company
$NZ000’s 2015 2014 2015 2014
Interim dividend of 7.5 cents per share paid (2014: 6.5 cents per share) 7,340 6,359 7,340 6,359Final dividend of 10.0 cents per share paid for the 52 week period ended 24 February 2014 (2014: 9.5 cents per share) 9,787 9,299 9,787 9,299
17,127 15,658 17,127 15,658
17. EquityThe issued capital of the Company is 97,871,090 (2014: 97,871,090) ordinary fully paid up shares. The par value is nil (2014: nil). All issued shares carry equal rights in respect of voting and the receipt of dividends, and upon winding up rank equally with regard to the Company’s residual assets.
Group & Company Group & Company 2015
Number2015
NZ$000’s2014
Number2014
NZ$000’s
Balance at beginning of period 97,871,090 26,756 97,850,110 26,723Shares issued on exercise of options – – 20,980 33Balance at end of period 97,871,090 26,756 97,871,090 26,756
18. Earnings per shareThe calculation of basic earnings per share for the 53 week period ended 2 March 2015 was based on the weighted average number of ordinary shares on issue of 97,871,090 (2014: 97,858,777). The calculation of diluted earnings per share for the 53 week period ended 2 March 2015 was based on the weighted average number of ordinary shares on issue adjusted to assume conversion of all dilutive potential ordinary shares, of 97,871,090 (2014: 97,858,777). The difference between weighted average number of shares used to calculate basic and diluted earnings per share represents share options outstanding. All remaining share options expired in 2014.
Group
2015 2014
Basic earnings per shareProfit after taxation attributable to shareholders ($NZ000’s) 23,830 19,953Basic earnings per share (cents) 24.35 20.39
Diluted earnings per shareProfit after taxation attributable to shareholders ($NZ000’s) 23,830 19,953Diluted earnings per share (cents) 24.35 20.39
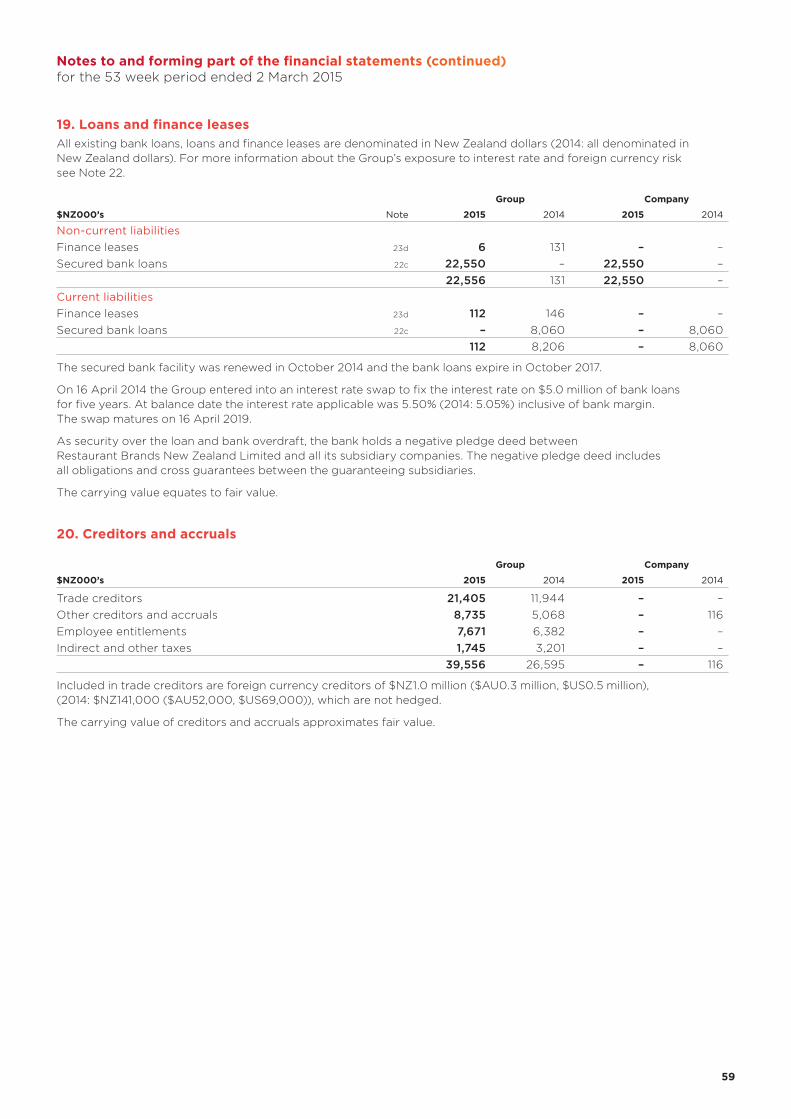
59 59
Notes to and forming part of the financial statements (continued)for the 53 week period ended 2 March 2015
19. Loans and finance leasesAll existing bank loans, loans and finance leases are denominated in New Zealand dollars (2014: all denominated in New Zealand dollars). For more information about the Group’s exposure to interest rate and foreign currency risk see Note 22.
Group Company
$NZ000’s Note 2015 2014 2015 2014
Non-current liabilitiesFinance leases 23d 6 131 – –Secured bank loans 22c 22,550 – 22,550 –
22,556 131 22,550 –Current liabilitiesFinance leases 23d 112 146 – –Secured bank loans 22c – 8,060 – 8,060
112 8,206 – 8,060
The secured bank facility was renewed in October 2014 and the bank loans expire in October 2017.
On 16 April 2014 the Group entered into an interest rate swap to fix the interest rate on $5.0 million of bank loans for five years. At balance date the interest rate applicable was 5.50% (2014: 5.05%) inclusive of bank margin. The swap matures on 16 April 2019.
As security over the loan and bank overdraft, the bank holds a negative pledge deed between Restaurant Brands New Zealand Limited and all its subsidiary companies. The negative pledge deed includes all obligations and cross guarantees between the guaranteeing subsidiaries.
The carrying value equates to fair value.
20. Creditors and accruals
Group Company
$NZ000’s 2015 2014 2015 2014
Trade creditors 21,405 11,944 – –Other creditors and accruals 8,735 5,068 – 116Employee entitlements 7,671 6,382 – –Indirect and other taxes 1,745 3,201 – –
39,556 26,595 – 116
Included in trade creditors are foreign currency creditors of $NZ1.0 million ($AU0.3 million, $US0.5 million), (2014: $NZ141,000 ($AU52,000, $US69,000)), which are not hedged.
The carrying value of creditors and accruals approximates fair value.
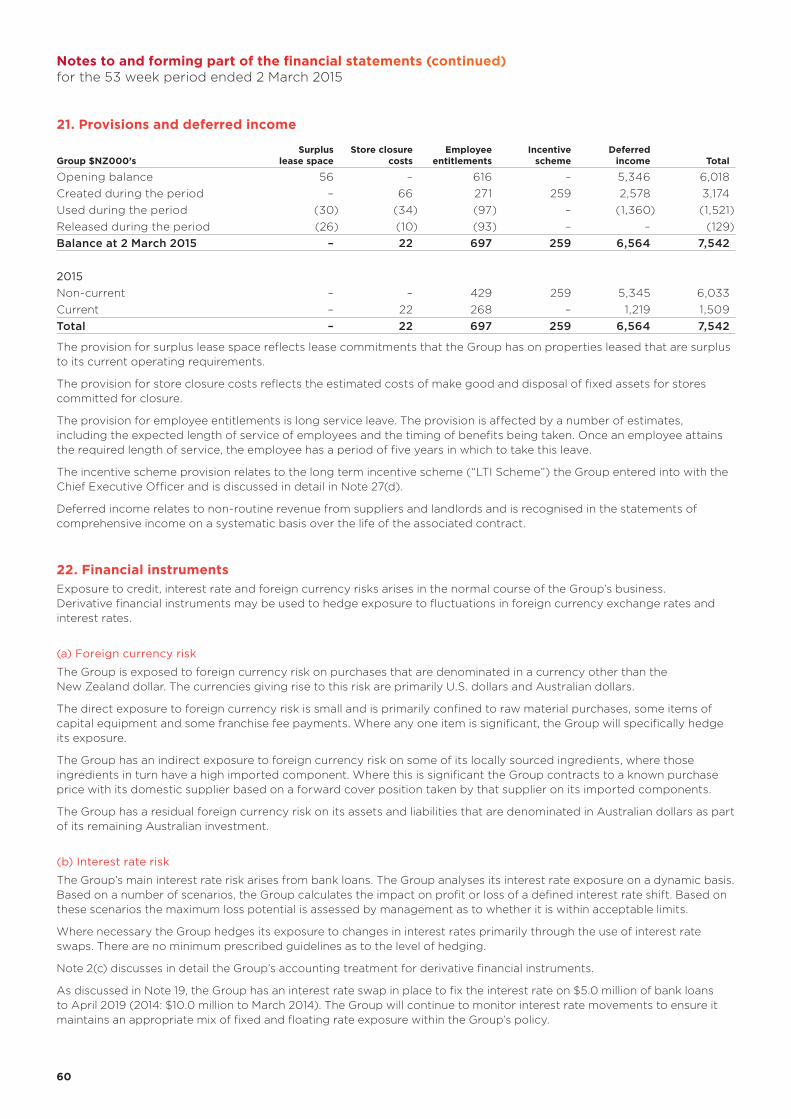
6060
Notes to and forming part of the financial statements (continued)for the 53 week period ended 2 March 2015
21. Provisions and deferred income
Group $NZ000’s Surplus
lease spaceStore closure
costsEmployee
entitlementsIncentive
schemeDeferred
income Total
Opening balance 56 – 616 – 5,346 6,018Created during the period – 66 271 259 2,578 3,174Used during the period (30) (34) (97) – (1,360) (1,521)Released during the period (26) (10) (93) – – (129)Balance at 2 March 2015 – 22 697 259 6,564 7,542
2015Non-current – – 429 259 5,345 6,033Current – 22 268 – 1,219 1,509Total – 22 697 259 6,564 7,542
The provision for surplus lease space reflects lease commitments that the Group has on properties leased that are surplus to its current operating requirements.
The provision for store closure costs reflects the estimated costs of make good and disposal of fixed assets for stores committed for closure.
The provision for employee entitlements is long service leave. The provision is affected by a number of estimates, including the expected length of service of employees and the timing of benefits being taken. Once an employee attains the required length of service, the employee has a period of five years in which to take this leave.
The incentive scheme provision relates to the long term incentive scheme (“LTI Scheme”) the Group entered into with the Chief Executive Officer and is discussed in detail in Note 27(d).
Deferred income relates to non-routine revenue from suppliers and landlords and is recognised in the statements of comprehensive income on a systematic basis over the life of the associated contract.
22. Financial instrumentsExposure to credit, interest rate and foreign currency risks arises in the normal course of the Group’s business. Derivative financial instruments may be used to hedge exposure to fluctuations in foreign currency exchange rates and interest rates.
(a) Foreign currency risk
The Group is exposed to foreign currency risk on purchases that are denominated in a currency other than the New Zealand dollar. The currencies giving rise to this risk are primarily U.S. dollars and Australian dollars.
The direct exposure to foreign currency risk is small and is primarily confined to raw material purchases, some items of capital equipment and some franchise fee payments. Where any one item is significant, the Group will specifically hedge its exposure.
The Group has an indirect exposure to foreign currency risk on some of its locally sourced ingredients, where those ingredients in turn have a high imported component. Where this is significant the Group contracts to a known purchase price with its domestic supplier based on a forward cover position taken by that supplier on its imported components.
The Group has a residual foreign currency risk on its assets and liabilities that are denominated in Australian dollars as part of its remaining Australian investment.
(b) Interest rate risk
The Group’s main interest rate risk arises from bank loans. The Group analyses its interest rate exposure on a dynamic basis. Based on a number of scenarios, the Group calculates the impact on profit or loss of a defined interest rate shift. Based on these scenarios the maximum loss potential is assessed by management as to whether it is within acceptable limits.
Where necessary the Group hedges its exposure to changes in interest rates primarily through the use of interest rate swaps. There are no minimum prescribed guidelines as to the level of hedging.
Note 2(c) discusses in detail the Group’s accounting treatment for derivative financial instruments.
As discussed in Note 19, the Group has an interest rate swap in place to fix the interest rate on $5.0 million of bank loans to April 2019 (2014: $10.0 million to March 2014). The Group will continue to monitor interest rate movements to ensure it maintains an appropriate mix of fixed and floating rate exposure within the Group’s policy.
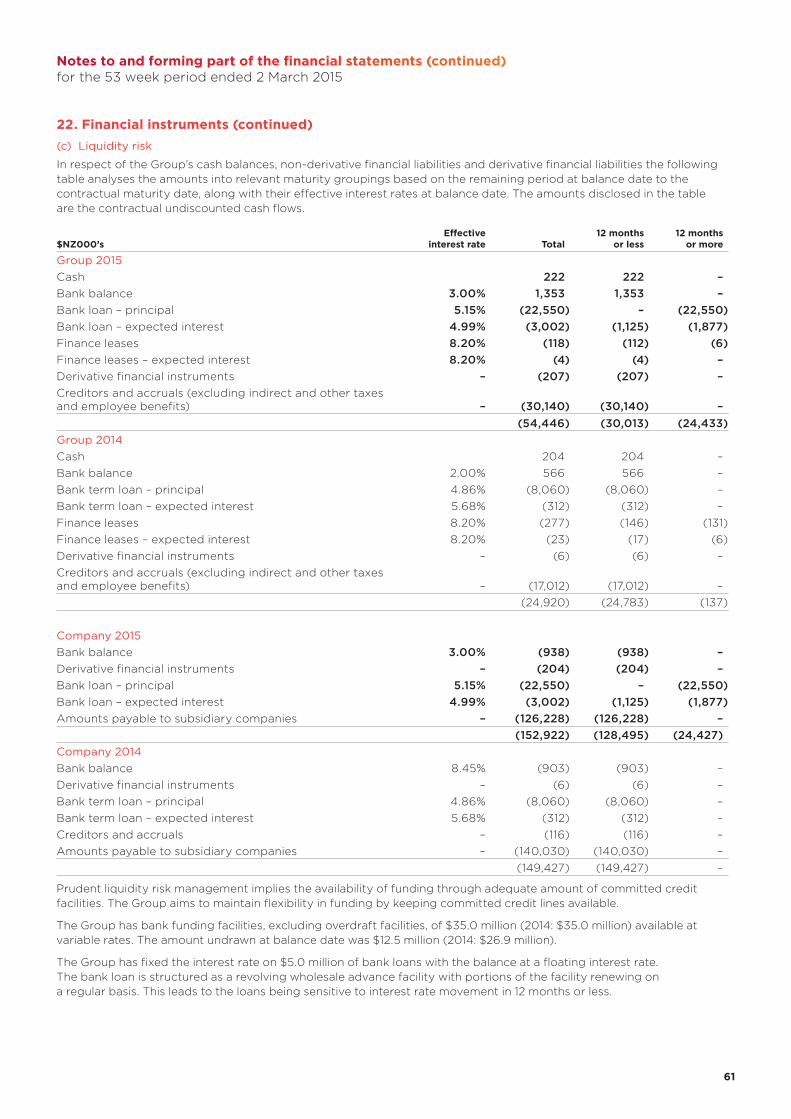
61 61
Notes to and forming part of the financial statements (continued)for the 53 week period ended 2 March 2015
22. Financial instruments (continued)(c) Liquidity risk
In respect of the Group’s cash balances, non-derivative financial liabilities and derivative financial liabilities the following table analyses the amounts into relevant maturity groupings based on the remaining period at balance date to the contractual maturity date, along with their effective interest rates at balance date. The amounts disclosed in the table are the contractual undiscounted cash flows.
$NZ000’s Effective
interest rate Total12 months
or less12 months
or more
Group 2015Cash 222 222 –Bank balance 3.00% 1,353 1,353 –Bank loan – principal 5.15% (22,550) – (22,550)Bank loan – expected interest 4.99% (3,002) (1,125) (1,877)Finance leases 8.20% (118) (112) (6)Finance leases – expected interest 8.20% (4) (4) –Derivative financial instruments – (207) (207) –Creditors and accruals (excluding indirect and other taxes and employee benefits) – (30,140) (30,140) –
(54,446) (30,013) (24,433)Group 2014Cash 204 204 –Bank balance 2.00% 566 566 –Bank term loan – principal 4.86% (8,060) (8,060) –Bank term loan – expected interest 5.68% (312) (312) –Finance leases 8.20% (277) (146) (131)Finance leases – expected interest 8.20% (23) (17) (6)Derivative financial instruments – (6) (6) –Creditors and accruals (excluding indirect and other taxes and employee benefits) – (17,012) (17,012) –
(24,920) (24,783) (137)
Company 2015Bank balance 3.00% (938) (938) –Derivative financial instruments – (204) (204) –Bank loan – principal 5.15% (22,550) – (22,550)Bank loan – expected interest 4.99% (3,002) (1,125) (1,877)Amounts payable to subsidiary companies – (126,228) (126,228) –
(152,922) (128,495) (24,427)Company 2014Bank balance 8.45% (903) (903) –Derivative financial instruments – (6) (6) –Bank term loan – principal 4.86% (8,060) (8,060) –Bank term loan – expected interest 5.68% (312) (312) –Creditors and accruals – (116) (116) –Amounts payable to subsidiary companies – (140,030) (140,030) –
(149,427) (149,427) –
Prudent liquidity risk management implies the availability of funding through adequate amount of committed credit facilities. The Group aims to maintain flexibility in funding by keeping committed credit lines available.
The Group has bank funding facilities, excluding overdraft facilities, of $35.0 million (2014: $35.0 million) available at variable rates. The amount undrawn at balance date was $12.5 million (2014: $26.9 million).
The Group has fixed the interest rate on $5.0 million of bank loans with the balance at a floating interest rate. The bank loan is structured as a revolving wholesale advance facility with portions of the facility renewing on a regular basis. This leads to the loans being sensitive to interest rate movement in 12 months or less.
6262
Notes to and forming part of the financial statements (continued)for the 53 week period ended 2 March 2015
22. Financial instruments (continued)(d) Credit risk
Credit risk arises from cash deposits with banks and financial institutions and outstanding receivables.
No collateral is required in respect of financial assets. Management has a credit policy in place and the exposure to credit risk is monitored on an ongoing basis. The nature of the business results in most sales being conducted on a cash basis that significantly reduces the risk that the Group is exposed to. Reputable financial institutions are used for investing and cash handling purposes.
There were no financial assets neither past due nor impaired at balance date (2014: nil).
At balance date there were no significant concentrations of credit risk and the maximum exposure to credit risk is represented by the carrying value of each financial asset in the statements of financial position.
(e) Fair values
The carrying values of bank loans and finance leases are the fair value of these liabilities. A Group set-off arrangement is in place between certain bank accounts operated by the Group.
Sensitivity analysis In managing interest rate and currency risks the Group aims to reduce the impact of short-term fluctuations on the Group’s earnings. Over the longer term, however, permanent changes in foreign exchange and interest rates on a weighted average balance will have an impact on profit.
At 2 March 2015 it is estimated that a general increase of one percentage point in interest rates would decrease the Group and Parent’s profit before income tax and equity by approximately $0.2 million (2014: $0.1 million). A one percentage point decrease in interest rates would increase the Group and Parent’s profit before income tax and equity by approximately $0.2 million (2014: $0.1 million).
A general increase of one percentage point in the value of the New Zealand dollar against other foreign currencies would have minimal impact on the cost of the Group’s directly imported ingredients denominated in foreign currencies (Parent: nil).
Capital risk managementThe Group’s capital comprises share capital, reserves, retained earnings and debt.
The Group’s objectives when managing capital are to safeguard the Group’s ability to continue to operate as a going concern, to maintain an optimal capital structure commensurate with risk and return and reduce the cost of capital.
In order to maintain or adjust the capital structure, the Group may adjust the amount of dividends paid to shareholders, return capital to shareholders, issue new shares or sell assets to reduce debt or draw down more debt.
The Group is subject to a number of externally imposed bank covenants as part of the terms of its secured bank loan facility.
The most significant covenants relating directly to capital management are the ratio of total debt to earnings before interest, tax and amortisation (EBITA) and restrictions relating to acquiring its own shares.
The specific covenants relating to financial ratios the Group is required to meet are:
• debt coverage ratio (i.e. net borrowings to EBITA); and
• fixed charges coverage ratio (i.e. EBITL to total fixed charges), with EBITL being EBIT before lease costs. Fixed charges comprise interest and lease costs.
The covenants are monitored and reported to the bank on a six monthly basis. These are reviewed by the Board on a monthly basis.
There have been no breaches of the covenants during the period (2014: no breaches).
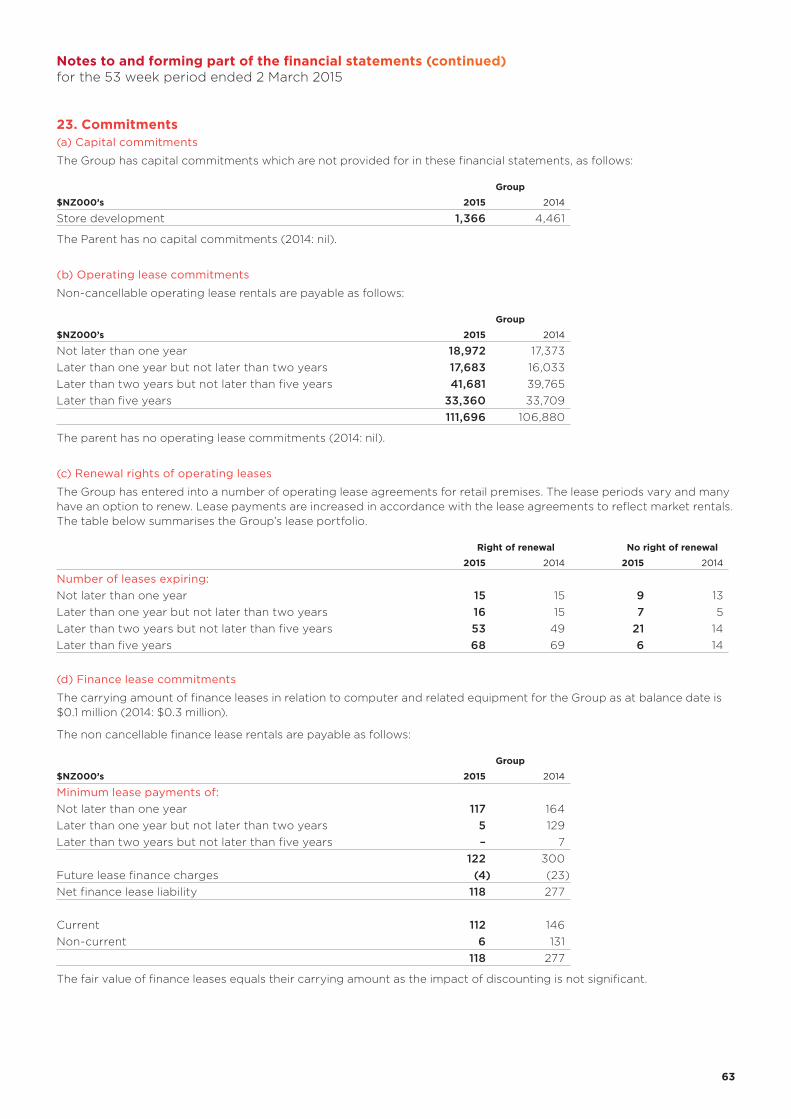
63 63
Notes to and forming part of the financial statements (continued)for the 53 week period ended 2 March 2015
23. Commitments(a) Capital commitments
The Group has capital commitments which are not provided for in these financial statements, as follows:
Group
$NZ000’s 2015 2014
Store development 1,366 4,461
The Parent has no capital commitments (2014: nil).
(b) Operating lease commitments
Non-cancellable operating lease rentals are payable as follows:
Group
$NZ000’s 2015 2014
Not later than one year 18,972 17,373Later than one year but not later than two years 17,683 16,033Later than two years but not later than five years 41,681 39,765Later than five years 33,360 33,709
111,696 106,880
The parent has no operating lease commitments (2014: nil).
(c) Renewal rights of operating leases
The Group has entered into a number of operating lease agreements for retail premises. The lease periods vary and many have an option to renew. Lease payments are increased in accordance with the lease agreements to reflect market rentals. The table below summarises the Group’s lease portfolio.
Right of renewal No right of renewal
2015 2014 2015 2014
Number of leases expiring:Not later than one year 15 15 9 13Later than one year but not later than two years 16 15 7 5Later than two years but not later than five years 53 49 21 14Later than five years 68 69 6 14
(d) Finance lease commitments
The carrying amount of finance leases in relation to computer and related equipment for the Group as at balance date is $0.1 million (2014: $0.3 million).
The non cancellable finance lease rentals are payable as follows:
Group
$NZ000’s 2015 2014
Minimum lease payments of:Not later than one year 117 164Later than one year but not later than two years 5 129Later than two years but not later than five years – 7
122 300Future lease finance charges (4) (23)Net finance lease liability 118 277
Current 112 146Non-current 6 131
118 277
The fair value of finance leases equals their carrying amount as the impact of discounting is not significant.
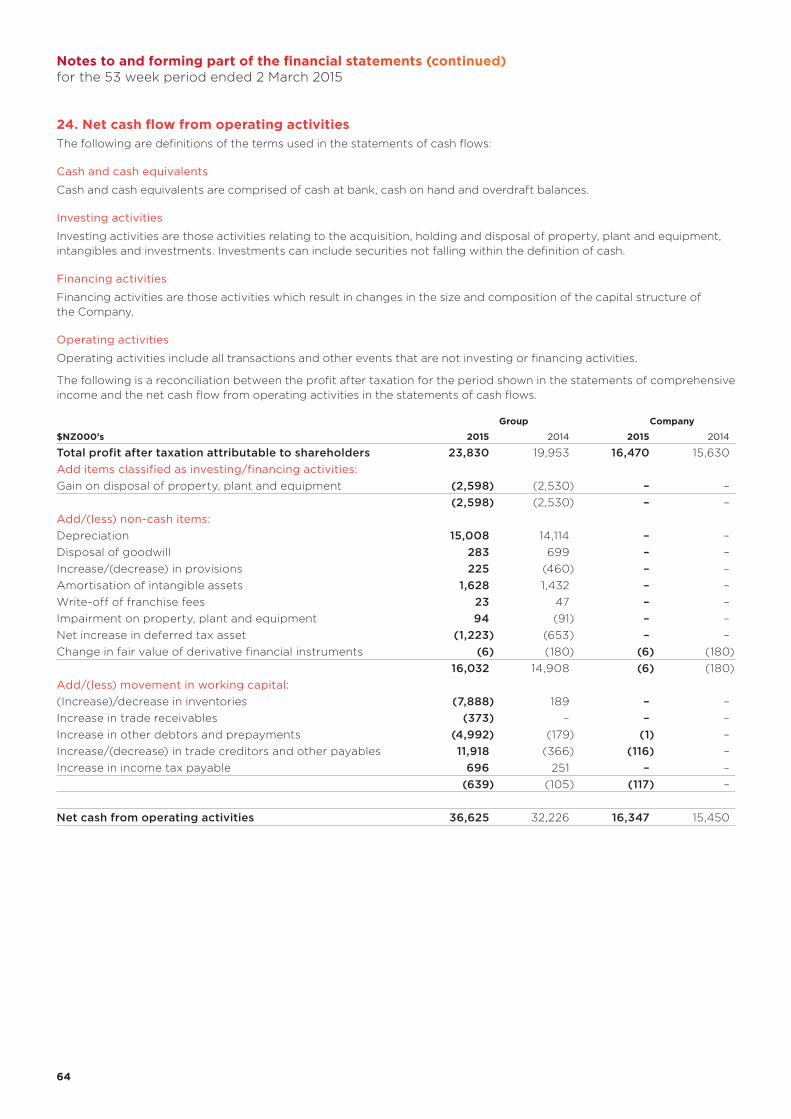
6464
Notes to and forming part of the financial statements (continued)for the 53 week period ended 2 March 2015
24. Net cash flow from operating activitiesThe following are definitions of the terms used in the statements of cash flows:
Cash and cash equivalents
Cash and cash equivalents are comprised of cash at bank, cash on hand and overdraft balances.
Investing activities
Investing activities are those activities relating to the acquisition, holding and disposal of property, plant and equipment, intangibles and investments. Investments can include securities not falling within the definition of cash.
Financing activities
Financing activities are those activities which result in changes in the size and composition of the capital structure of the Company.
Operating activities
Operating activities include all transactions and other events that are not investing or financing activities.
The following is a reconciliation between the profit after taxation for the period shown in the statements of comprehensive income and the net cash flow from operating activities in the statements of cash flows.
Group Company
$NZ000’s 2015 2014 2015 2014
Total profit after taxation attributable to shareholders 23,830 19,953 16,470 15,630Add items classified as investing/financing activities:Gain on disposal of property, plant and equipment (2,598) (2,530) – –
(2,598) (2,530) – –Add/(less) non-cash items:Depreciation 15,008 14,114 – –Disposal of goodwill 283 699 – –Increase/(decrease) in provisions 225 (460) – –Amortisation of intangible assets 1,628 1,432 – –Write-off of franchise fees 23 47 – –Impairment on property, plant and equipment 94 (91) – –Net increase in deferred tax asset (1,223) (653) – –Change in fair value of derivative financial instruments (6) (180) (6) (180)
16,032 14,908 (6) (180)Add/(less) movement in working capital:(Increase)/decrease in inventories (7,888) 189 – –Increase in trade receivables (373) – – –Increase in other debtors and prepayments (4,992) (179) (1) –Increase/(decrease) in trade creditors and other payables 11,918 (366) (116) –Increase in income tax payable 696 251 – –
(639) (105) (117) –
Net cash from operating activities 36,625 32,226 16,347 15,450
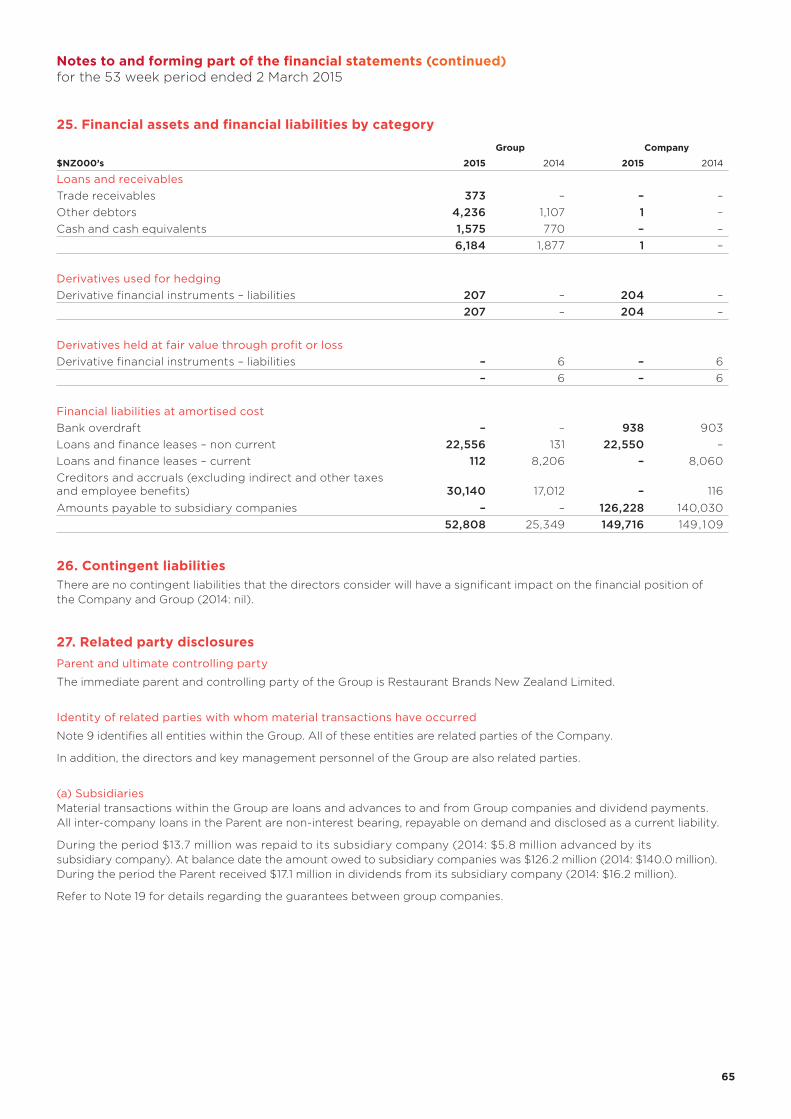
65 65
Notes to and forming part of the financial statements (continued)for the 53 week period ended 2 March 2015
25. Financial assets and financial liabilities by category
Group Company
$NZ000’s 2015 2014 2015 2014
Loans and receivablesTrade receivables 373 – – –Other debtors 4,236 1,107 1 –Cash and cash equivalents 1,575 770 – –
6,184 1,877 1 –
Derivatives used for hedgingDerivative financial instruments – liabilities 207 – 204 –
207 – 204 –
Derivatives held at fair value through profit or lossDerivative financial instruments – liabilities – 6 – 6
– 6 – 6
Financial liabilities at amortised costBank overdraft – – 938 903Loans and finance leases – non current 22,556 131 22,550 –Loans and finance leases – current 112 8,206 – 8,060Creditors and accruals (excluding indirect and other taxes and employee benefits) 30,140 17,012 – 116Amounts payable to subsidiary companies – – 126,228 140,030
52,808 25,349 149,716 149,109
26. Contingent liabilitiesThere are no contingent liabilities that the directors consider will have a significant impact on the financial position of the Company and Group (2014: nil).
27. Related party disclosures Parent and ultimate controlling party
The immediate parent and controlling party of the Group is Restaurant Brands New Zealand Limited.
Identity of related parties with whom material transactions have occurred
Note 9 identifies all entities within the Group. All of these entities are related parties of the Company.
In addition, the directors and key management personnel of the Group are also related parties.
(a) SubsidiariesMaterial transactions within the Group are loans and advances to and from Group companies and dividend payments. All inter-company loans in the Parent are non-interest bearing, repayable on demand and disclosed as a current liability.
During the period $13.7 million was repaid to its subsidiary company (2014: $5.8 million advanced by its subsidiary company). At balance date the amount owed to subsidiary companies was $126.2 million (2014: $140.0 million). During the period the Parent received $17.1 million in dividends from its subsidiary company (2014: $16.2 million).
Refer to Note 19 for details regarding the guarantees between group companies.
6666
Notes to and forming part of the financial statements (continued)for the 53 week period ended 2 March 2015
27. Related party disclosures (continued)(b) Other transactions with entities with key management or entities related to them
During the period the Group made the following:
• Stock purchases of $0.4 million (2014: $0.3 million) from Barker Fruit Processors Limited, a company of which Company director Sue Helen Suckling is chairman. There was nil owing at balance date (2014: nil).
• Stock purchases of $3.0 million (2014: $2.7 million) from Hellers Limited, a company of which Company director David Alan Pilkington is chairman. There was nil owing at balance date (2014: nil). David Alan Pilkington resigned as director of the Restaurant Brands Group on 11 December 2014.
• Acquired services totalling $22,000 (2014: nil) from AsureQuality Limited, a company of which Company director Hamish William Stevens is a director. There was $1,000 owing at balance date (2014: nil).
These transactions were at arm’s length and performed on normal commercial terms.
(c) Key management and director compensation
Key management personnel comprises members of the Senior Leadership Team. Key management personnel compensation comprised short-term benefits for the period of $2.1 million (2014: $2.4 million) and other long-term benefits of $18,000 (2014: $23,000). Directors’ fees were $0.3 million (2014: $0.3 million).
(d) Long term incentive scheme
On 28 July 2014 the Group entered into a long term incentive scheme (“LTI Scheme”) with the Chief Executive Officer (“CEO”). The scheme provides that if in the two year period starting 25 July 2015:
1. the Group’s share price is at $4 or above for a continuous period of 40 trading days or;
2. the Group is subject to a successful takeover at or above $4 share price
then the CEO will be paid a one-off $1 million bonus net of tax. A condition of the payment is that the CEO must remain employed for a period of at least 6 months immediately following the eligibility criteria being met.
The directors believe it is likely that the conditions will be met during the eligibility period. The fair value of the liability (refer Note 21) at balance date was assessed at $0.3 million and has been taken up as a charge to general and administration expenses in the statements of comprehensive income.
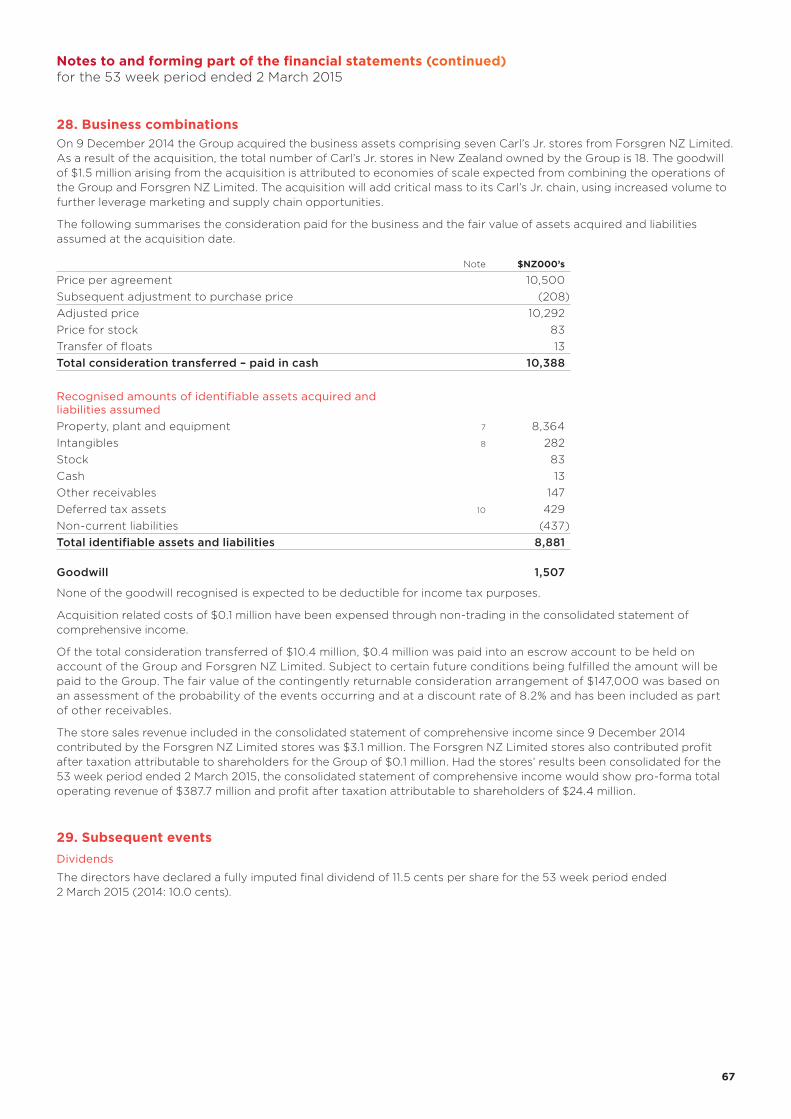
67 67
Notes to and forming part of the financial statements (continued)for the 53 week period ended 2 March 2015
28. Business combinationsOn 9 December 2014 the Group acquired the business assets comprising seven Carl’s Jr. stores from Forsgren NZ Limited. As a result of the acquisition, the total number of Carl’s Jr. stores in New Zealand owned by the Group is 18. The goodwill of $1.5 million arising from the acquisition is attributed to economies of scale expected from combining the operations of the Group and Forsgren NZ Limited. The acquisition will add critical mass to its Carl’s Jr. chain, using increased volume to further leverage marketing and supply chain opportunities.
The following summarises the consideration paid for the business and the fair value of assets acquired and liabilities assumed at the acquisition date.
Note $NZ000’s
Price per agreement 10,500Subsequent adjustment to purchase price (208)Adjusted price 10,292Price for stock 83Transfer of floats 13Total consideration transferred – paid in cash 10,388
Recognised amounts of identifiable assets acquired and liabilities assumedProperty, plant and equipment 7 8,364Intangibles 8 282Stock 83Cash 13Other receivables 147Deferred tax assets 10 429Non-current liabilities (437)Total identifiable assets and liabilities 8,881
Goodwill 1,507
None of the goodwill recognised is expected to be deductible for income tax purposes.
Acquisition related costs of $0.1 million have been expensed through non-trading in the consolidated statement of comprehensive income.
Of the total consideration transferred of $10.4 million, $0.4 million was paid into an escrow account to be held on account of the Group and Forsgren NZ Limited. Subject to certain future conditions being fulfilled the amount will be paid to the Group. The fair value of the contingently returnable consideration arrangement of $147,000 was based on an assessment of the probability of the events occurring and at a discount rate of 8.2% and has been included as part of other receivables.
The store sales revenue included in the consolidated statement of comprehensive income since 9 December 2014 contributed by the Forsgren NZ Limited stores was $3.1 million. The Forsgren NZ Limited stores also contributed profit after taxation attributable to shareholders for the Group of $0.1 million. Had the stores’ results been consolidated for the 53 week period ended 2 March 2015, the consolidated statement of comprehensive income would show pro-forma total operating revenue of $387.7 million and profit after taxation attributable to shareholders of $24.4 million.
29. Subsequent eventsDividends
The directors have declared a fully imputed final dividend of 11.5 cents per share for the 53 week period ended 2 March 2015 (2014: 10.0 cents).
6868
INDEPENDENT AUDITORS’ REPORTto the shareholders of Restaurant Brands New Zealand Limited
Report on the Financial StatementsWe have audited the financial statements of Restaurant Brands New Zealand Limited (“the Company”) on pages 34 to 67, which comprise the statements of financial position as at 2 March 2015, the statements of comprehensive income, statements of changes in equity and statements of cash flows for the period then ended, and the notes to the financial statements that include a summary of significant accounting policies and other explanatory information for both the Company and the Group. The Group comprises the Company and the entities it controlled at 2 March 2015 or from time to time during the financial year.
Directors’ Responsibility for the Financial StatementsThe Directors are responsible for the preparation of these financial statements in accordance with generally accepted accounting practice in New Zealand and that give a true and fair view of the matters to which they relate and for such internal controls as the Directors determine are necessary to enable the preparation of financial statements that are free from material misstatement, whether due to fraud or error.
Auditors’ ResponsibilityOur responsibility is to express an opinion on these financial statements based on our audit. We conducted our audit in accordance with International Standards on Auditing (New Zealand) and International Standards on Auditing. These standards require that we comply with relevant ethical requirements and plan and perform the audit to obtain reasonable assurance about whether the financial statements are free from material misstatement.
An audit involves performing procedures to obtain audit evidence about the amounts and disclosures in the financial statements. The procedures selected depend on the auditors’ judgement, including the assessment of the risks of material misstatement of the financial statements, whether due to fraud or error. In making those risk assessments, the auditors consider the internal controls relevant to the Company and the Group’s preparation of financial statements that give a true and fair view of the matters to which they relate, in order to design audit procedures that are appropriate in the circumstances, but not for the purpose of expressing an opinion on the effectiveness of the Company and the Group’s internal control. An audit also includes evaluating the appropriateness of accounting policies used and the reasonableness of accounting estimates, as well as evaluating the overall presentation of the financial statements.
We believe that the audit evidence we have obtained is sufficient and appropriate to provide a basis for our audit opinion.
We are independent of the Group. Our firm carries out other services for the Group in the areas of other assurance and advisory services. The provision of these services has not impaired our independence.
OpinionIn our opinion, the financial statements on pages 34 to 67:
(i) comply with generally accepted accounting practice in New Zealand; and(ii) comply with International Financial Reporting Standards; and(iii) give a true and fair view of the financial position of the Company and the Group as at 2 March 2015, and their financial
performance and cash flows for the period then ended.
Report on Other Legal and Regulatory RequirementsWe also report in accordance with Sections 16(1)(d) and 16(1)(e) of the Financial Reporting Act 1993. In relation to our audit of the financial statements for the period ended 2 March 2015:
(i) we have obtained all the information and explanations that we have required; and(ii) in our opinion, proper accounting records have been kept by the Company as far as appears from an examination
of those records.
Restriction on Use of our ReportThis report is made solely to the Company’s shareholders, as a body, in accordance with Section 205(1) of the Companies Act 1993. Our audit work has been undertaken so that we might state to the Company’s shareholders those matters which we are required to state to them in an auditors’ report and for no other purpose. To the fullest extent permitted by law, we do not accept or assume responsibility to anyone other than the Company and the Company’s shareholders, as a body, for our audit work, for this report or for the opinions we have formed.
Chartered Accountants 16 April 2015 Auckland
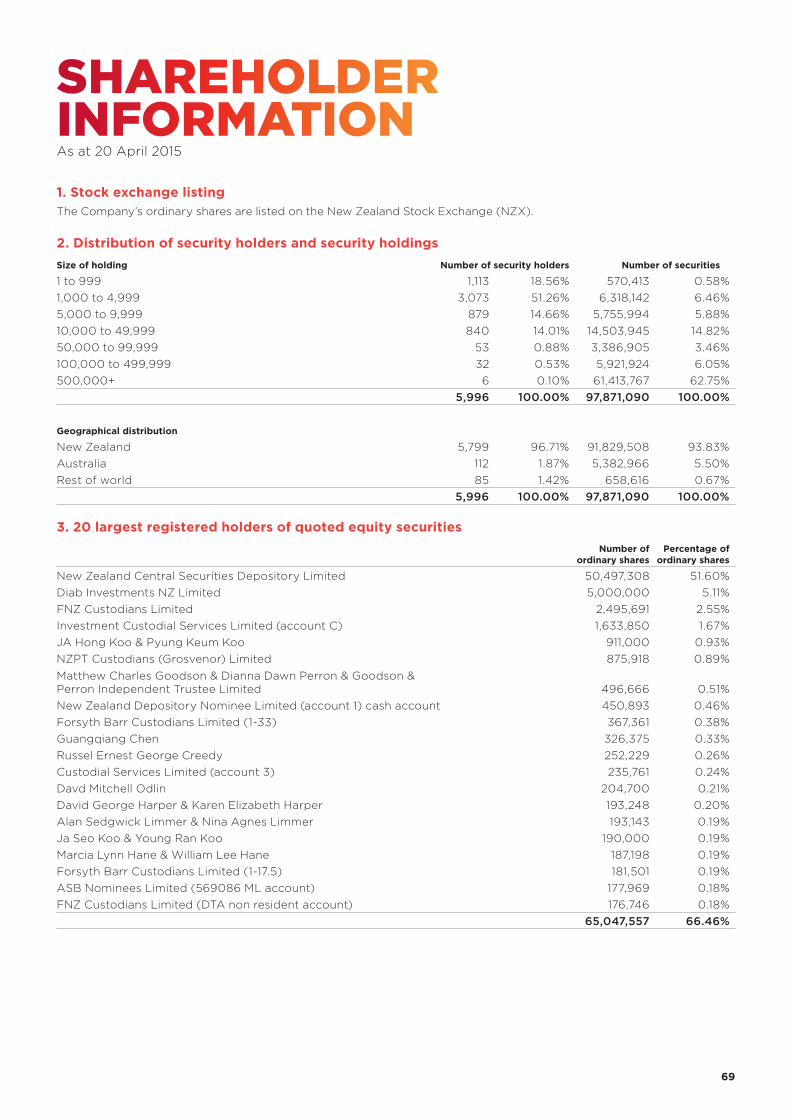
69 69
SHAREHOLDER INFORMATIONAs at 20 April 2015
1. Stock exchange listingThe Company’s ordinary shares are listed on the New Zealand Stock Exchange (NZX).
2. Distribution of security holders and security holdingsSize of holding Number of security holders Number of securities
1 to 999 1,113 18.56% 570,413 0.58%1,000 to 4,999 3,073 51.26% 6,318,142 6.46%5,000 to 9,999 879 14.66% 5,755,994 5.88%10,000 to 49,999 840 14.01% 14,503,945 14.82%50,000 to 99,999 53 0.88% 3,386,905 3.46%100,000 to 499,999 32 0.53% 5,921,924 6.05%500,000+ 6 0.10% 61,413,767 62.75%
5,996 100.00% 97,871,090 100.00%
Geographical distribution
New Zealand 5,799 96.71% 91,829,508 93.83%Australia 112 1.87% 5,382,966 5.50%Rest of world 85 1.42% 658,616 0.67%
5,996 100.00% 97,871,090 100.00%
3. 20 largest registered holders of quoted equity securities
Number of
ordinary sharesPercentage of
ordinary shares
New Zealand Central Securities Depository Limited 50,497,308 51.60%Diab Investments NZ Limited 5,000,000 5.11%FNZ Custodians Limited 2,495,691 2.55%Investment Custodial Services Limited (account C) 1,633,850 1.67%JA Hong Koo & Pyung Keum Koo 911,000 0.93%NZPT Custodians (Grosvenor) Limited 875,918 0.89%Matthew Charles Goodson & Dianna Dawn Perron & Goodson & Perron Independent Trustee Limited 496,666 0.51%New Zealand Depository Nominee Limited (account 1) cash account 450,893 0.46%Forsyth Barr Custodians Limited (1-33) 367,361 0.38%Guangqiang Chen 326,375 0.33%Russel Ernest George Creedy 252,229 0.26%Custodial Services Limited (account 3) 235,761 0.24%Davd Mitchell Odlin 204,700 0.21%David George Harper & Karen Elizabeth Harper 193,248 0.20%Alan Sedgwick Limmer & Nina Agnes Limmer 193,143 0.19%Ja Seo Koo & Young Ran Koo 190,000 0.19%Marcia Lynn Hane & William Lee Hane 187,198 0.19%Forsyth Barr Custodians Limited (1-17.5) 181,501 0.19%ASB Nominees Limited (569086 ML account) 177,969 0.18%FNZ Custodians Limited (DTA non resident account) 176,746 0.18%
65,047,557 66.46%
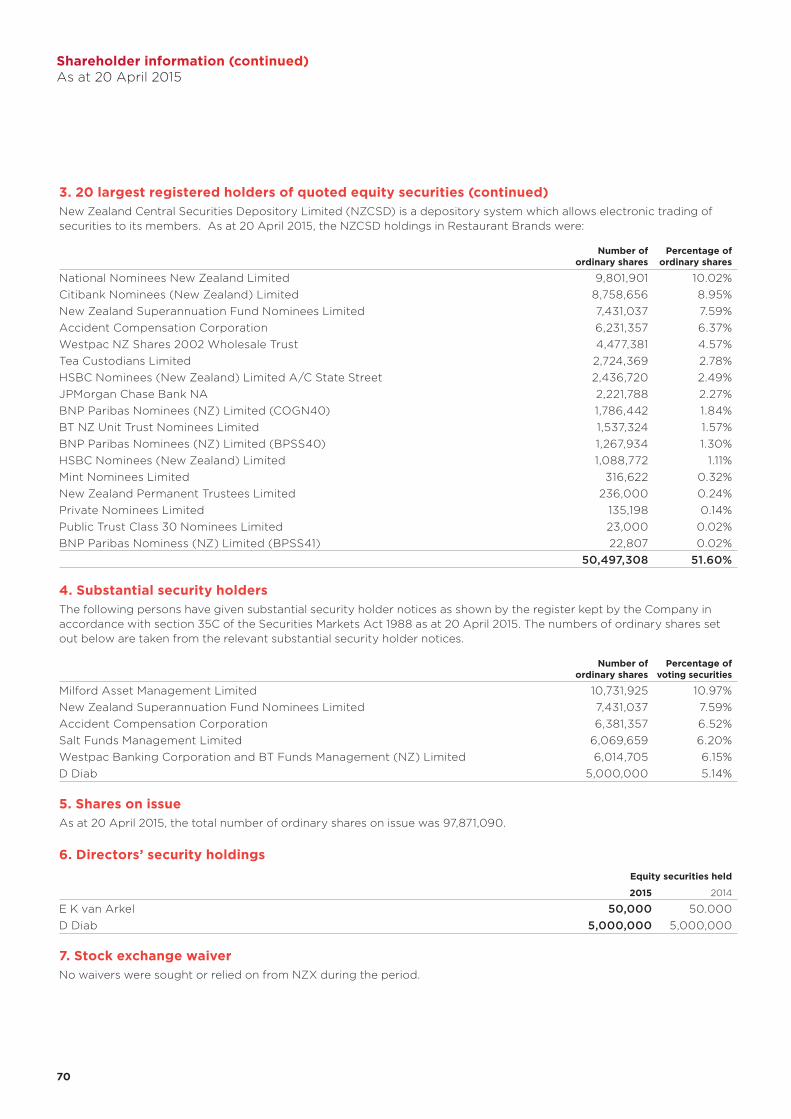
7070
3. 20 largest registered holders of quoted equity securities (continued)New Zealand Central Securities Depository Limited (NZCSD) is a depository system which allows electronic trading of securities to its members. As at 20 April 2015, the NZCSD holdings in Restaurant Brands were:
Number of
ordinary sharesPercentage of
ordinary shares
National Nominees New Zealand Limited 9,801,901 10.02%Citibank Nominees (New Zealand) Limited 8,758,656 8.95%New Zealand Superannuation Fund Nominees Limited 7,431,037 7.59%Accident Compensation Corporation 6,231,357 6.37%Westpac NZ Shares 2002 Wholesale Trust 4,477,381 4.57%Tea Custodians Limited 2,724,369 2.78%HSBC Nominees (New Zealand) Limited A/C State Street 2,436,720 2.49%JPMorgan Chase Bank NA 2,221,788 2.27%BNP Paribas Nominees (NZ) Limited (COGN40) 1,786,442 1.84%BT NZ Unit Trust Nominees Limited 1,537,324 1.57%BNP Paribas Nominees (NZ) Limited (BPSS40) 1,267,934 1.30%HSBC Nominees (New Zealand) Limited 1,088,772 1.11%Mint Nominees Limited 316,622 0.32%New Zealand Permanent Trustees Limited 236,000 0.24%Private Nominees Limited 135,198 0.14%Public Trust Class 30 Nominees Limited 23,000 0.02%BNP Paribas Nominess (NZ) Limited (BPSS41) 22,807 0.02%
50,497,308 51.60%
4. Substantial security holdersThe following persons have given substantial security holder notices as shown by the register kept by the Company in accordance with section 35C of the Securities Markets Act 1988 as at 20 April 2015. The numbers of ordinary shares set out below are taken from the relevant substantial security holder notices.
Number of
ordinary sharesPercentage of
voting securities
Milford Asset Management Limited 10,731,925 10.97%New Zealand Superannuation Fund Nominees Limited 7,431,037 7.59%Accident Compensation Corporation 6,381,357 6.52%Salt Funds Management Limited 6,069,659 6.20%Westpac Banking Corporation and BT Funds Management (NZ) Limited 6,014,705 6.15%D Diab 5,000,000 5.14%
5. Shares on issueAs at 20 April 2015, the total number of ordinary shares on issue was 97,871,090.
6. Directors’ security holdingsEquity securities held
2015 2014
E K van Arkel 50,000 50.000D Diab 5,000,000 5,000,000
7. Stock exchange waiverNo waivers were sought or relied on from NZX during the period.
Shareholder information (continued)As at 20 April 2015
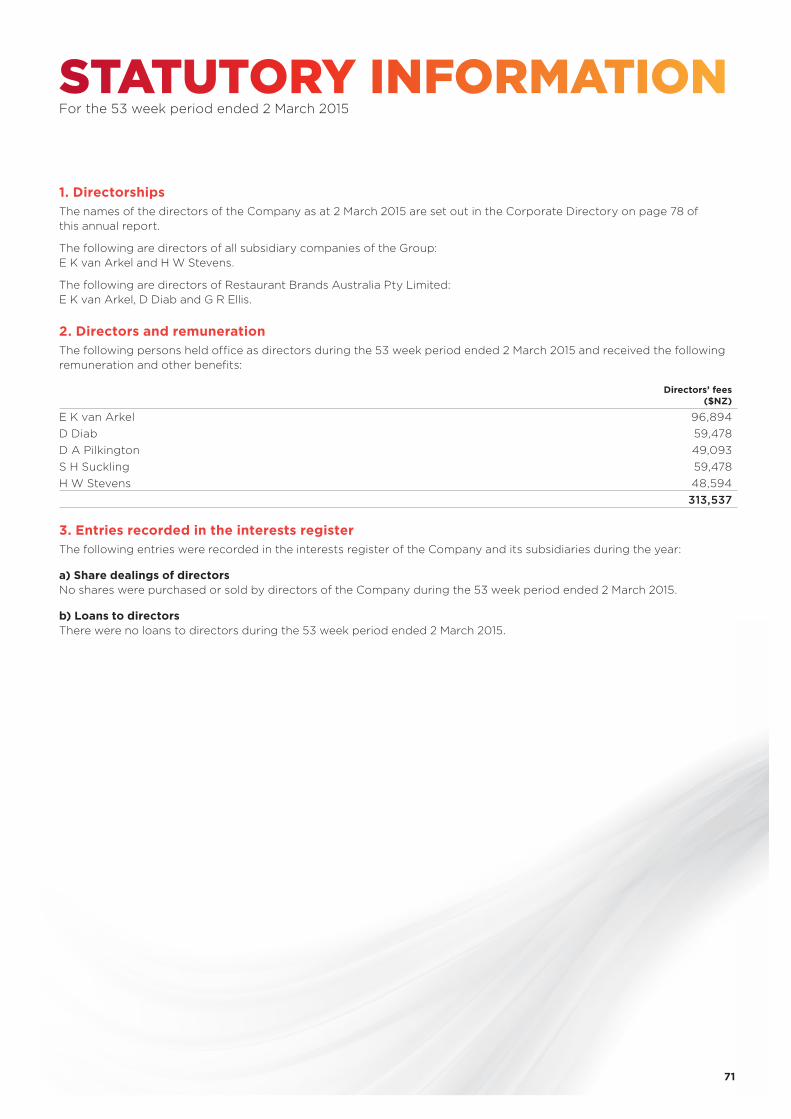
71 71
STATUTORY INFORMATIONFor the 53 week period ended 2 March 2015
1. DirectorshipsThe names of the directors of the Company as at 2 March 2015 are set out in the Corporate Directory on page 78 of this annual report.
The following are directors of all subsidiary companies of the Group: E K van Arkel and H W Stevens.
The following are directors of Restaurant Brands Australia Pty Limited: E K van Arkel, D Diab and G R Ellis.
2. Directors and remunerationThe following persons held office as directors during the 53 week period ended 2 March 2015 and received the following remuneration and other benefits:
Directors’ fees
($NZ)
E K van Arkel 96,894 D Diab 59,478 D A Pilkington 49,093 S H Suckling 59,478 H W Stevens 48,594
313,537
3. Entries recorded in the interests registerThe following entries were recorded in the interests register of the Company and its subsidiaries during the year:
a) Share dealings of directors No shares were purchased or sold by directors of the Company during the 53 week period ended 2 March 2015.
b) Loans to directors There were no loans to directors during the 53 week period ended 2 March 2015.
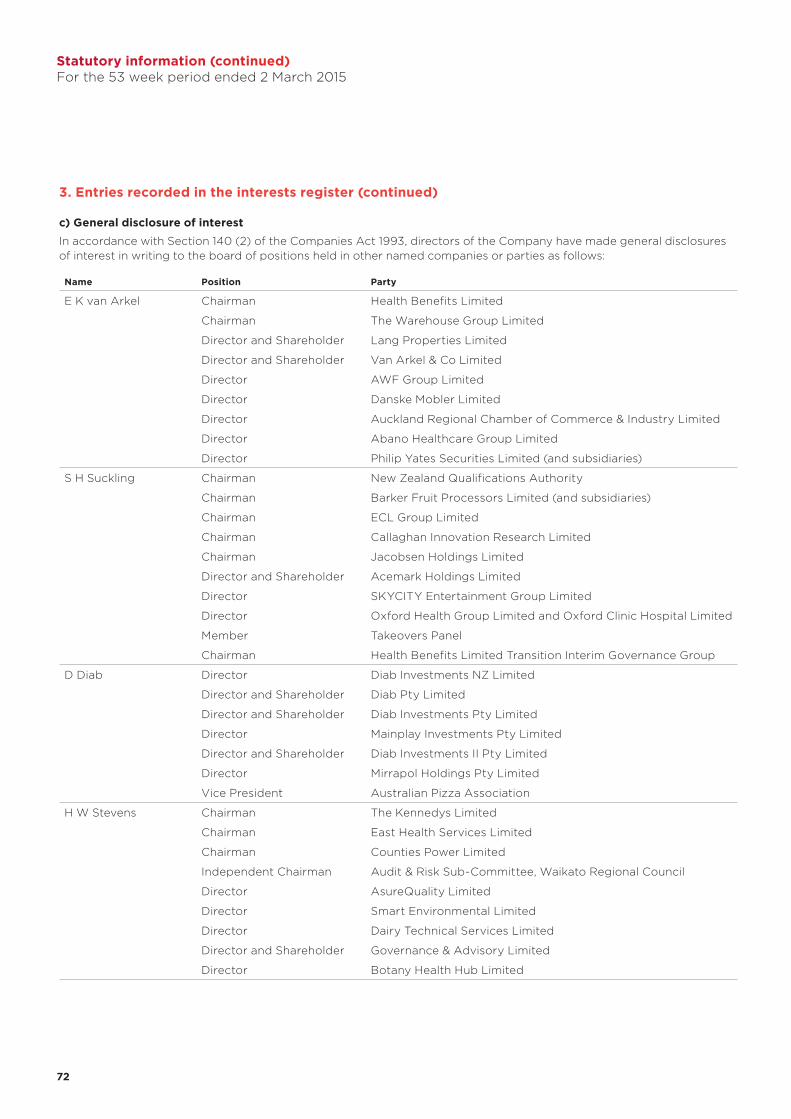
7272
3. Entries recorded in the interests register (continued)
c) General disclosure of interestIn accordance with Section 140 (2) of the Companies Act 1993, directors of the Company have made general disclosures of interest in writing to the board of positions held in other named companies or parties as follows:
Name Position Party
E K van Arkel Chairman Health Benefits Limited
Chairman The Warehouse Group Limited
Director and Shareholder Lang Properties Limited
Director and Shareholder Van Arkel & Co Limited
Director AWF Group Limited
Director Danske Mobler Limited
Director Auckland Regional Chamber of Commerce & Industry Limited
Director Abano Healthcare Group Limited
Director Philip Yates Securities Limited (and subsidiaries)
S H Suckling Chairman New Zealand Qualifications Authority
Chairman Barker Fruit Processors Limited (and subsidiaries)
Chairman ECL Group Limited
Chairman Callaghan Innovation Research Limited
Chairman Jacobsen Holdings Limited
Director and Shareholder Acemark Holdings Limited
Director SKYCITY Entertainment Group Limited
Director Oxford Health Group Limited and Oxford Clinic Hospital Limited
Member Takeovers Panel
Chairman Health Benefits Limited Transition Interim Governance Group
D Diab Director Diab Investments NZ Limited
Director and Shareholder Diab Pty Limited
Director and Shareholder Diab Investments Pty Limited
Director Mainplay Investments Pty Limited
Director and Shareholder Diab Investments II Pty Limited
Director Mirrapol Holdings Pty Limited
Vice President Australian Pizza Association
H W Stevens Chairman The Kennedys Limited
Chairman East Health Services Limited
Chairman Counties Power Limited
Independent Chairman Audit & Risk Sub-Committee, Waikato Regional Council
Director AsureQuality Limited
Director Smart Environmental Limited
Director Dairy Technical Services Limited
Director and Shareholder Governance & Advisory Limited
Director Botany Health Hub Limited
Statutory information (continued)For the 53 week period ended 2 March 2015
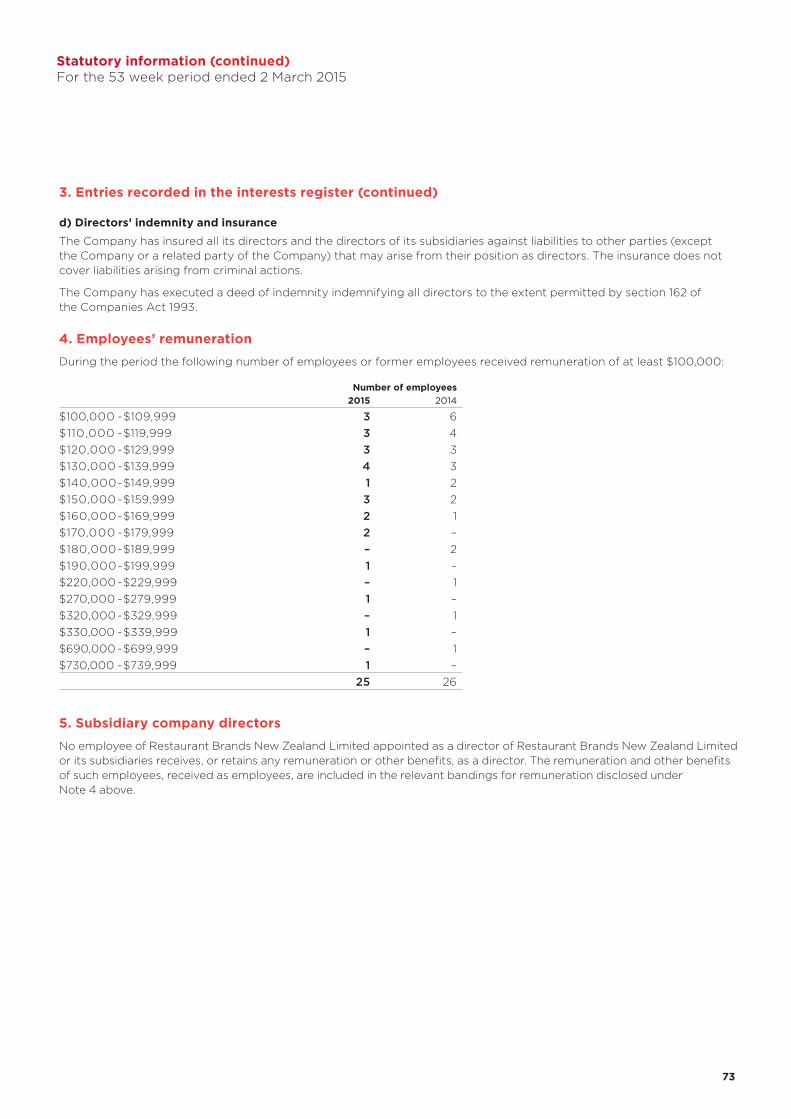
73 73
3. Entries recorded in the interests register (continued)
d) Directors’ indemnity and insuranceThe Company has insured all its directors and the directors of its subsidiaries against liabilities to other parties (except the Company or a related party of the Company) that may arise from their position as directors. The insurance does not cover liabilities arising from criminal actions.
The Company has executed a deed of indemnity indemnifying all directors to the extent permitted by section 162 of the Companies Act 1993.
4. Employees’ remuneration
During the period the following number of employees or former employees received remuneration of at least $100,000:
Number of employees2015 2014
$100,000 -$109,999 3 6$110,000 -$119,999 3 4$120,000 -$129,999 3 3$130,000 -$139,999 4 3$140,000-$149,999 1 2$150,000 -$159,999 3 2$160,000-$169,999 2 1$170,000 -$179,999 2 –$180,000-$189,999 – 2$190,000-$199,999 1 –$220,000 -$229,999 – 1$270,000 -$279,999 1 –$320,000-$329,999 – 1$330,000 -$339,999 1 –$690,000 -$699,999 – 1$730,000 -$739,999 1 –
25 26
5. Subsidiary company directors
No employee of Restaurant Brands New Zealand Limited appointed as a director of Restaurant Brands New Zealand Limited or its subsidiaries receives, or retains any remuneration or other benefits, as a director. The remuneration and other benefits of such employees, received as employees, are included in the relevant bandings for remuneration disclosed under Note 4 above.
Statutory information (continued)For the 53 week period ended 2 March 2015
7474
STATEMENT OF CORPORATE GOVERNANCEFor the 53 week period ended 2 March 2015
OverviewThe board of Restaurant Brands New Zealand Limited is committed to the guiding values of the Company: integrity, respect, continuous improvement and service. Whilst not formally constituted into a code of ethics, it expects that management and staff ultimately subscribe to these values and use them as a guide to making decisions. These values are reflected in a series of formal policies covering such matters as:
• Conflicts of interest• Use of company property• Use of company information• Compliance with applicable laws
ResponsibilityThe board is responsible for the proper direction and control of the Company’s activities and is the ultimate decision-making body of the Company. Its responsibilities include setting strategic direction, approval of significant expenditures, policy determination, stewardship of the Company’s assets, identification of significant business risks, legal compliance and monitoring management performance.
DelegationThe board has delegated responsibility for the day-to-day leadership and management of the Company to the Chief Executive Officer (CEO) who is required to do so in accordance with board direction. The CEO’s performance is reviewed each year by the board. The review includes a formal performance appraisal against measured objectives together with a qualitative review.
The board has approved a schedule of delegated authorities affecting all aspects of the Company’s operation. This is reviewed from time to time as to appropriateness and levels of delegation.
Composition and focusAs at 2 March 2015, the board comprised four non-executive directors (including the Chairman). In addition to committee responsibilities (below), individual board members work directly with management in major initiatives such as acquisitions and asset rationalisations.
Ted van Arkel, Hamish Stevens and Sue Suckling are considered by the board to be independent under the NZSX Listing Rules. Danny Diab is considered not to be independent as he represents a significant shareholding. The board does not have a policy on a minimum number of independent directors.
CommitteesFrom amongst its own members, the board has appointed the following permanent committees:
• Audit and Risk Committee. The members of the Audit and Risk Committee are Hamish Stevens (chairman), Ted van Arkel, Sue Suckling and Danny Diab. This committee is constituted to monitor the veracity of the financial data produced by the Company and ensure controls are in place to minimise the opportunities for fraud or for material error in the accounts. A majority of the committee’s members must be independent directors.
The Audit Committee meets two to three times a year, with external auditors of the Company and executives performing internal audit management from within the Company in attendance. The external auditors also meet with the committee with no Company executive present.
The committee has adopted an audit charter setting out the parameters of its relationship with internal and external audit functions. The charter which is posted on the Company’s website requires five yearly reviews of the external audit relationship and audit partner rotation.
• Appointments and Remuneration Committee. The members of the Appointments and Remuneration Committee are Sue Suckling (chairman), Ted van Arkel, Danny Diab, and Hamish Stevens. This committee is constituted to approve appointments and terms of remuneration for senior executives of the Company; principally the CEO and those reporting directly to the CEO. It also reviews any company-wide incentive and share option schemes as required and recommends remuneration packages for directors to the shareholders.
The committee has adopted a written charter which is posted on the Company’s website.
The board does not have a formal nominations committee, as all non-executive directors are involved in the appointment of new directors.
Other sub-committees may be constituted and meet for specific ad hoc purposes as required.
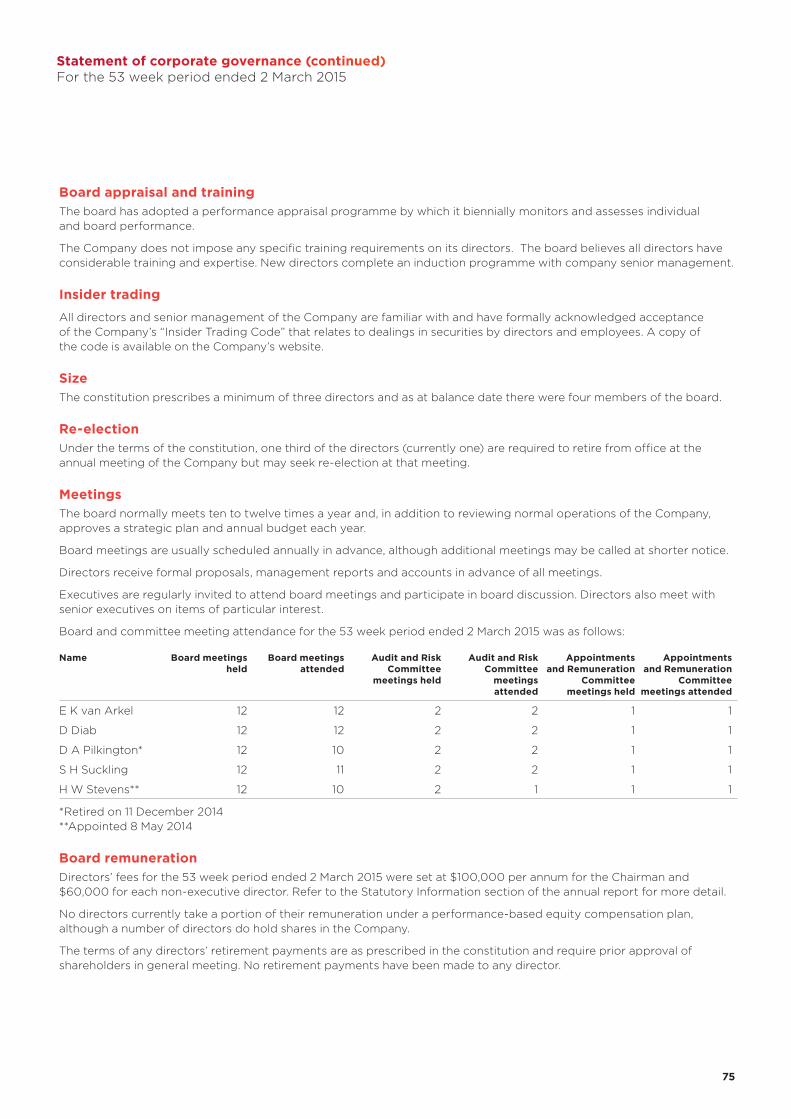
75 75
Board appraisal and trainingThe board has adopted a performance appraisal programme by which it biennially monitors and assesses individual and board performance.
The Company does not impose any specific training requirements on its directors. The board believes all directors have considerable training and expertise. New directors complete an induction programme with company senior management.
Insider trading
All directors and senior management of the Company are familiar with and have formally acknowledged acceptance of the Company’s “Insider Trading Code” that relates to dealings in securities by directors and employees. A copy of the code is available on the Company’s website.
SizeThe constitution prescribes a minimum of three directors and as at balance date there were four members of the board.
Re-electionUnder the terms of the constitution, one third of the directors (currently one) are required to retire from office at the annual meeting of the Company but may seek re-election at that meeting.
MeetingsThe board normally meets ten to twelve times a year and, in addition to reviewing normal operations of the Company, approves a strategic plan and annual budget each year.
Board meetings are usually scheduled annually in advance, although additional meetings may be called at shorter notice.
Directors receive formal proposals, management reports and accounts in advance of all meetings.
Executives are regularly invited to attend board meetings and participate in board discussion. Directors also meet with senior executives on items of particular interest.
Board and committee meeting attendance for the 53 week period ended 2 March 2015 was as follows:
Name Board meetings held
Board meetings attended
Audit and Risk Committee
meetings held
Audit and Risk Committee
meetings attended
Appointments and Remuneration
Committee meetings held
Appointments and Remuneration
Committee meetings attended
E K van Arkel 12 12 2 2 1 1
D Diab 12 12 2 2 1 1
D A Pilkington* 12 10 2 2 1 1
S H Suckling 12 11 2 2 1 1
H W Stevens** 12 10 2 1 1 1
*Retired on 11 December 2014**Appointed 8 May 2014
Board remunerationDirectors’ fees for the 53 week period ended 2 March 2015 were set at $100,000 per annum for the Chairman and $60,000 for each non-executive director. Refer to the Statutory Information section of the annual report for more detail.
No directors currently take a portion of their remuneration under a performance-based equity compensation plan, although a number of directors do hold shares in the Company.
The terms of any directors’ retirement payments are as prescribed in the constitution and require prior approval of shareholders in general meeting. No retirement payments have been made to any director.
Statement of corporate governance (continued)For the 53 week period ended 2 March 2015
7676
Directors’ indemnity and insuranceThe Company has insured all its directors and the directors of its subsidiaries against liabilities to other parties (except the Company or a related party of the Company) that may arise from their position as directors. The insurance does not cover liabilities arising from criminal actions.
The Company has executed a Deed of Indemnity, indemnifying all directors to the extent permitted by section 162 of the Companies Act 1993.
Risk management
In managing the Company’s business risks, the board approves and monitors policy and process in such areas as:
• Internal audit – Regular checks are conducted by operations and financial staff on all aspects of store operations.
• Treasury management – Exposure to interest rate and foreign exchange risks is managed in accordance with the Company’s treasury policy.
• Financial performance – Full sets of management accounts are presented to the board at every meeting. Performance is measured against an annual budget with periodic forecast updates.
• Capital expenditure – All capital expenditure is subject to relevant approval levels with significant items approved by the board. The board also monitors expenditure against approved projects and approves the capital plan.
• Insurance – The Company has insurance policies in place covering most areas of risk to its assets and business. These include material damage and business interruption cover at all of its sites. Policies are reviewed and renewed annually with reputable insurers.
External advice
Directors may seek their own independent professional advice to assist with their responsibilities. During the 2015 financial year no director sought their own independent professional advice, but the board sought advice with respect to market levels of director remuneration.
ShareholdingThere is no prescribed minimum shareholding for directors, although some do hold shares in the Company (refer to the Statutory Information section of the report for more detail).
Directors may purchase shares upon providing proper notice of their intention to do so and in compliance with the operation of the Company’s “Insider Trading Code” (see above).
Interests registerThe board maintains an interests register. In considering matters affecting the Company, directors are required to disclose any actual or potential conflicts. Where a conflict or potential conflict has been disclosed, the director takes no further part in receipt of information or participation in discussions on that matter.
Shareholder communicationThe board places importance on effective shareholder communication. Half year and annual reports are published each year and posted on the Company’s website, together with quarterly sales releases. From time to time the board may communicate with shareholders outside this regular reporting regime.
Consistent with best practice and a policy of continuous disclosure, external communications that may contain market sensitive data are released through NZX in the first instance. Further communication is encouraged with press releases through mainstream media. The board formally reviews its proceedings at the conclusion of each meeting to determine whether there may be a requirement for a disclosure announcement.
Shareholder attendance at annual meetings is encouraged and the board allows extensive shareholder debate on all matters affecting the Company.
Statement of corporate governance (continued)For the 53 week period ended 2 March 2015
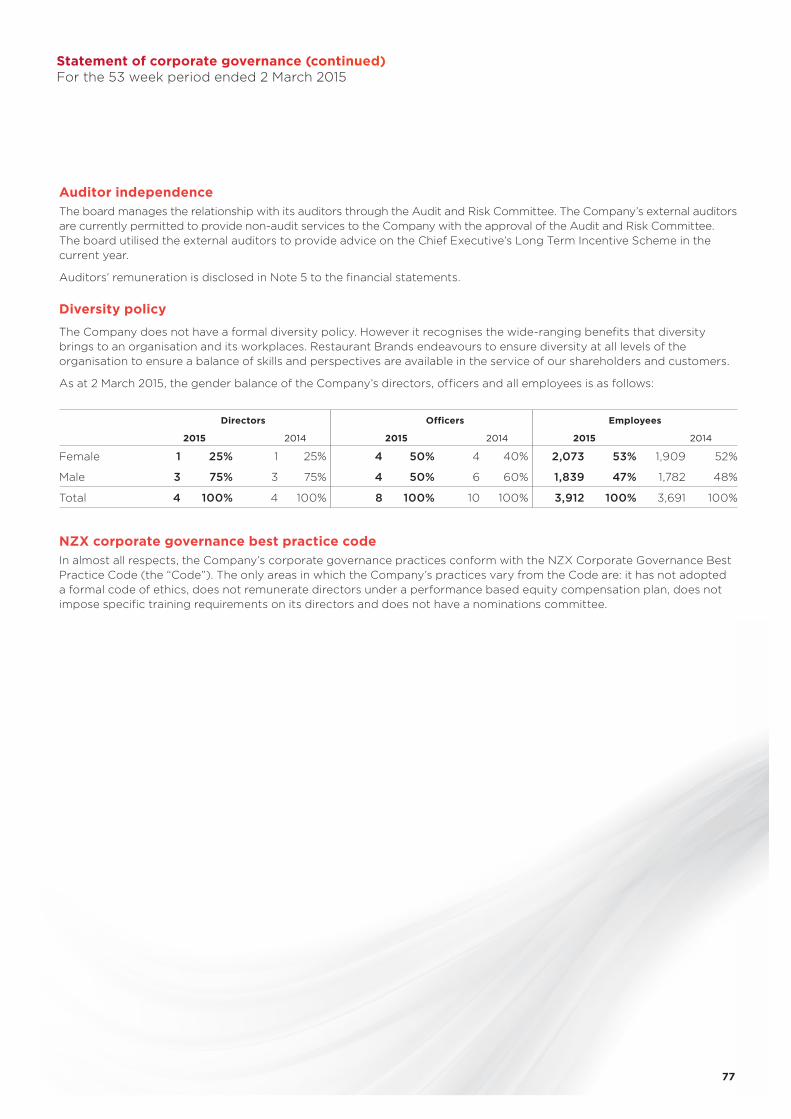
77 77
Auditor independenceThe board manages the relationship with its auditors through the Audit and Risk Committee. The Company’s external auditors are currently permitted to provide non-audit services to the Company with the approval of the Audit and Risk Committee. The board utilised the external auditors to provide advice on the Chief Executive’s Long Term Incentive Scheme in the current year.
Auditors’ remuneration is disclosed in Note 5 to the financial statements.
Diversity policy
The Company does not have a formal diversity policy. However it recognises the wide-ranging benefits that diversity brings to an organisation and its workplaces. Restaurant Brands endeavours to ensure diversity at all levels of the organisation to ensure a balance of skills and perspectives are available in the service of our shareholders and customers.
As at 2 March 2015, the gender balance of the Company’s directors, officers and all employees is as follows:
Directors Officers Employees
2015 2014 2015 2014 2015 2014
Female 1 25% 1 25% 4 50% 4 40% 2,073 53% 1,909 52%
Male 3 75% 3 75% 4 50% 6 60% 1,839 47% 1,782 48%
Total 4 100% 4 100% 8 100% 10 100% 3,912 100% 3,691 100%
NZX corporate governance best practice codeIn almost all respects, the Company’s corporate governance practices conform with the NZX Corporate Governance Best Practice Code (the “Code”). The only areas in which the Company’s practices vary from the Code are: it has not adopted a formal code of ethics, does not remunerate directors under a performance based equity compensation plan, does not impose specific training requirements on its directors and does not have a nominations committee.
Statement of corporate governance (continued)For the 53 week period ended 2 March 2015
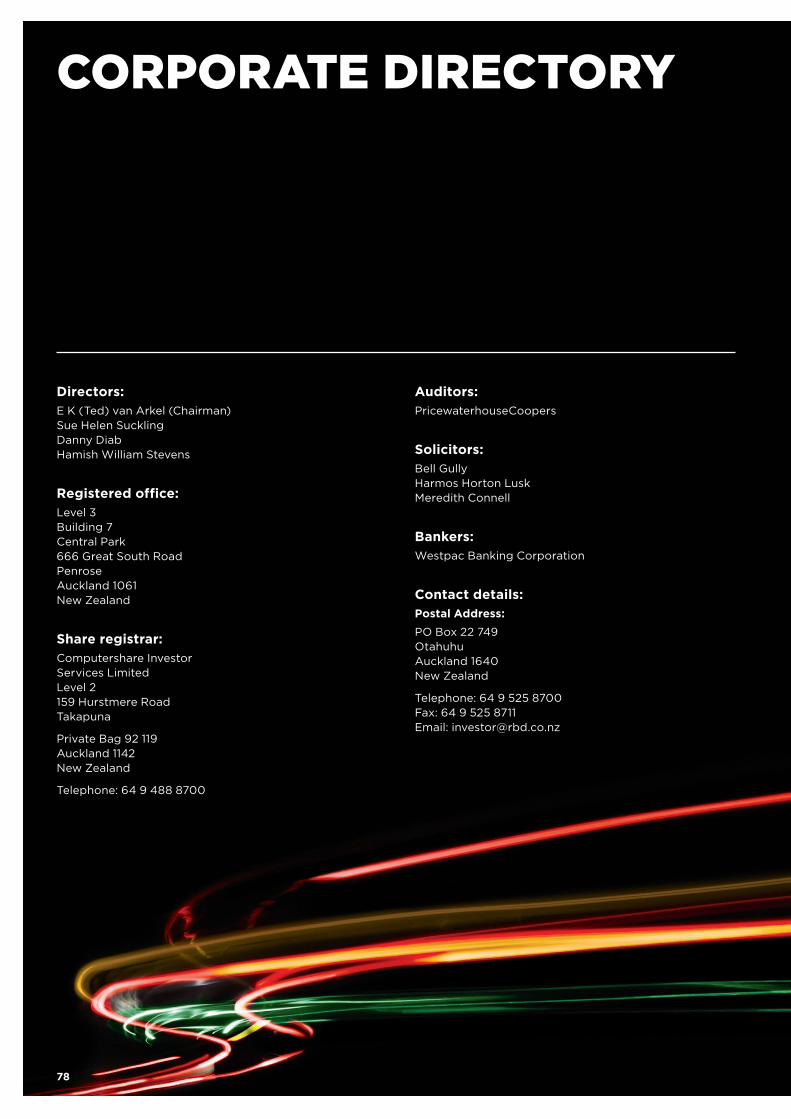
CORPORATE DIRECTORY
Directors:E K (Ted) van Arkel (Chairman)Sue Helen SucklingDanny DiabHamish William Stevens
Registered office:Level 3Building 7Central Park666 Great South RoadPenroseAuckland 1061New Zealand
Share registrar:Computershare Investor Services LimitedLevel 2159 Hurstmere RoadTakapuna
Private Bag 92 119Auckland 1142New Zealand
Telephone: 64 9 488 8700
Auditors:PricewaterhouseCoopers
Solicitors:Bell GullyHarmos Horton LuskMeredith Connell
Bankers:Westpac Banking Corporation
Contact details:Postal Address:PO Box 22 749OtahuhuAuckland 1640New Zealand
Telephone: 64 9 525 8700Fax: 64 9 525 8711Email: [email protected]
78
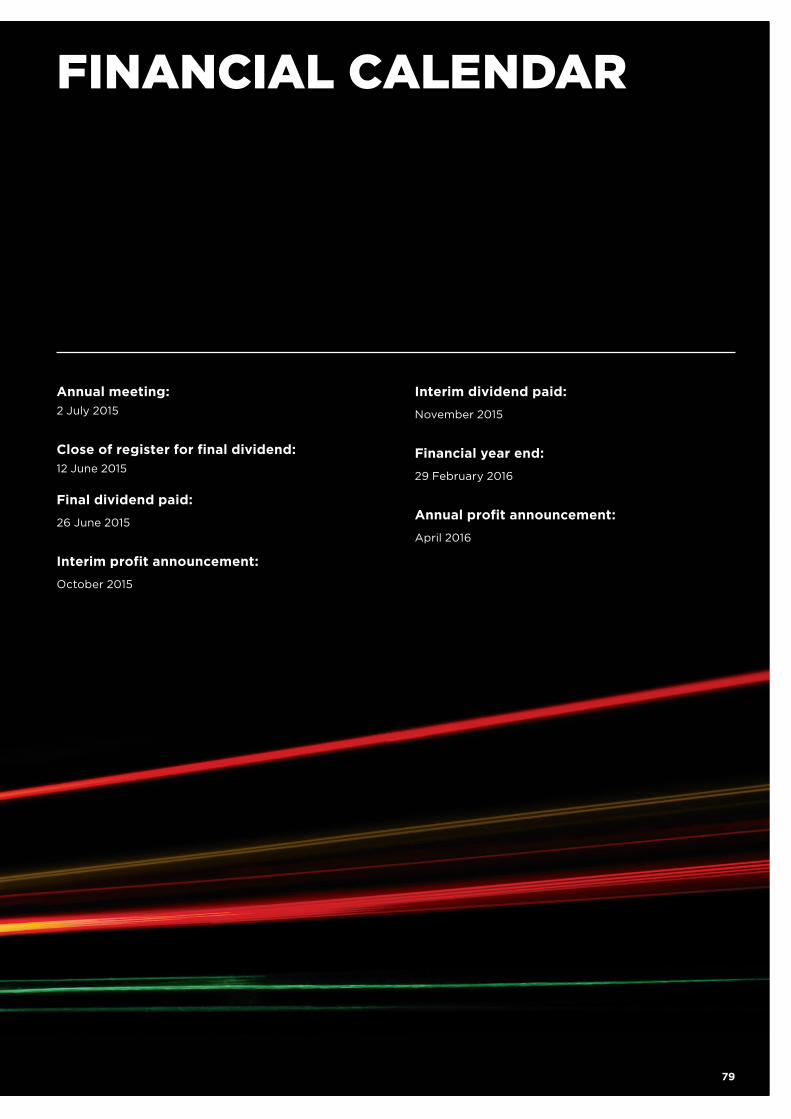
FINANCIAL CALENDAR
Annual meeting:2 July 2015
Close of register for final dividend:12 June 2015
Final dividend paid:
26 June 2015
Interim profit announcement:
October 2015
Interim dividend paid:
November 2015
Financial year end:
29 February 2016
Annual profit announcement:
April 2016
79

8080
NOTES


www.restaurantbrands.co.nz