Embed Size (px)
Citation preview

Delivering Digital Growth
Annual Report 2015
YELL
OW
PA
GES
LIM
ITED
20
15
AN
NU
AL R
EPO
RT

2015FINANCIAL & OPERATIONALHIGHLIGHTS
Table of contents
Management’s Discussion and Analysis 9
Independent Auditor’s Report 38
Consolidated Statements of Financial Position 39
Consolidated Income Statements 40
Consolidated Statements of Comprehensive Income 41
Consolidated Statements of Changes in Equity 42-43
Consolidated Statements of Cash Flows 44
Notes to the Consolidated Financial Statements 45-76
$877.5M
$442.8M
$829.8M(5.4%)
$486.3M9.8%
REVENUES(in millions of Canadian dollars)
DIGITAL REVENUES(in millions of Canadian dollars)
2014
2014
2015
2015
YELLOW PAGES LIMITED 2015 ANNUAL REPORT 1
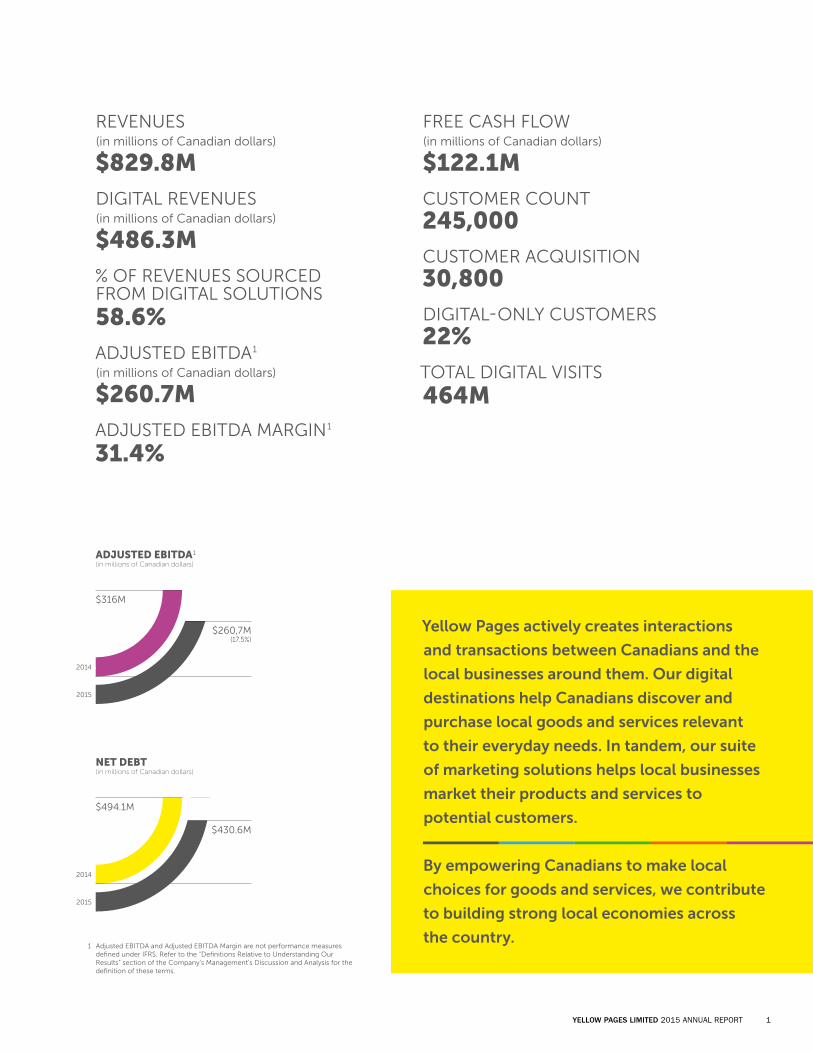
Yellow Pages actively creates interactions
and transactions between Canadians and the
local businesses around them. Our digital
destinations help Canadians discover and
purchase local goods and services relevant
to their everyday needs. In tandem, our suite
of marketing solutions helps local businesses
market their products and services to
potential customers.
By empowering Canadians to make local
choices for goods and services, we contribute
to building strong local economies across
the country.
REVENUES(in millions of Canadian dollars)
$829.8M
DIGITAL REVENUES(in millions of Canadian dollars)
$486.3M
% OF REVENUES SOURCED FROM DIGITAL SOLUTIONS
58.6%
ADJUSTED EBITDA 1
(in millions of Canadian dollars)
$260.7M
ADJUSTED EBITDA MARGIN 1
31.4%
FREE CASH FLOW(in millions of Canadian dollars)
$122.1M
CUSTOMER COUNT245,000
CUSTOMER ACQUISITION30,800
DIGITAL-ONLY CUSTOMERS22%
TOTAL DIGITAL VISITS
464M
$316M
$494.1M
$260,7M(17.5%)
$430.6M
ADJUSTED EBITDA 1(in millions of Canadian dollars)
NET DEBT(in millions of Canadian dollars)
2014
2014
2015
2015
1 Adjusted EBITDA and Adjusted EBITDA Margin are not performance measures defined under IFRS. Refer to the “Definitions Relative to Understanding Our Results” section of the Company’s Management’s Discussion and Analysis for the definition of these terms.

YELLOW PAGES LIMITED 2015 ANNUAL REPORT2
TOTAL DEBT(in millions of Canadian dollars)
“We’ve repaid more than half our debt over the past three years.”
“Our goal is to be the leading local digital company in Canada. Our digital media platforms and services provide all the essential solutions for Canadian businesses and local customers to interact and transact.”
The implementation and execution of our Return to Growth Plan is well underway and
we remain on track to returning Yellow Pages to revenue and Adjusted EBITDA growth
by 2018. Since introducing the Plan in May 2014, we’ve strengthened our digital presence
in Canada by improving the value proposition offered to Canadian consumers and
merchants alike. Highlights of these achievements are included here in this report.
One element which continues to set us apart from other media industry players is our
sustained growth in digital revenues. For the fourth quarter ended December 31, 2015,
62% of all Yellow Pages’ revenues were sourced from digital, equating to annualized
digital revenues of over $516M.
This is quite a notable achievement in Canada, as Yellow Pages currently acts as one
of the country’s leading digital media and marketing solutions providers.
Our digital revenue growth has been fuelled by our focus on the acquisition and
retention of small and medium-sized enterprises (SMEs), as well as the growing use and
adoption of our digital media properties among Canadians.
A key component of our digital transformation was the enhancement of our sales force,
culture and skillsets. In addition to growing our acquisition sales teams and creating
dedicated incentive programs rewarding the acquisition and onboarding of new SMEs,
we significantly transformed the digital tools, products and systems available to our sales
teams to help them effectively conduct conversations with our customers and provide
them with a higher level of service.
We now have in place new sales tools that rely on proprietary market and customer-
related intelligence to help our sales teams build valuable digital marketing programs for
SMEs. In conjunction, new digital marketing solutions such as Presence were launched
over the course of 2015 to help SMEs optimize the syndication of their content across
the digital marketplace.
message to shareholders
$100million of debt repaid in 2015
JULIEN BILLOT
President and Chief Executive Officer
$735.4M
2013
2014
2015
$596.9M
$497.8M

YELLOW PAGES LIMITED 2015 ANNUAL REPORT 3
over
62%digital revenues
1
These initiatives, alongside an enriched digital fulfillment and customer service process,
have enhanced the overall experience we provide to SMEs, accelerating customer
acquisition and promoting improved merchant retention and spending.
In 2015, we welcomed over 30,000 new businesses as customers of Yellow Pages,
exceeding last year’s customer acquisition levels of 22,100 new customers. With
245,000 SMEs using us for their marketing needs – which represents over 20% of all small
businesses operating in Canada – our company has built an unparalleled local customer
network within the digital marketing space.
Our customer renewal rate also grew to 85%, one of the strongest loyalty rates in
the market. This demonstrates that our efforts in creating great customer experiences
have made an impact.
Ultimately, the loyalty and trust of our customers is not something we take lightly and
every day we work to deliver them the results they expect and need. Our operations, our
systems and our workforce is transforming at a breakneck pace, driving forward digital
culture, environments, products and sales.
Our brand remains a key pillar of this transformation. We continue to work on this front
to re-shape the Yellow Pages brand to be synonymous with digital expertise to answer
everyday local search needs and marketing needs of small businesses.
Yellow Pages remains committed to differentiating its user experience from other local
digital search properties, enriching its reach and relevancy by integrating functionalities
that empower consumers and allow them to quickly and easily transact within their
local neighbourhoods. Our vertical media strategy has crystalized in 2015, with the
introduction of YP Dine marking our entry into the restaurant and dining industry vertical.
Providing search and marketing solutions for industry patrons and owners thanks to the
integration of both the Bookenda and Dine.TO acquisitions, YP Dine is now available in
nine cities across Canada. It also ranked in the Top 25 best apps of 2015, as chosen by
the App Store.
The Company also acquired the ComFree/
DuProprio Network in June 2015, growing
Yellow Pages into one of Canada’s leading
C2C digital real estate marketplaces.
Combined with the lifestyle and
neighbourhood content information of
Yellow Pages NextHome, the ComFree/
DuProprio Network empowers Canadians
by providing them with rich information,
tools and technologies to buy and sell real
estate in a proven, cost effective manner.
In light of the advancements we’ve made
to our digital media, marketing solutions
and customer value proposition, our free
cash flow remains strong.
Through efficiencies gained across our
print and digital operations, we’ve been
able to significantly deleverage our balance
sheet in a very short period of time. We’ve
repaid over $100 million in debt in 2015
alone, with over half our debt repaid in a
three-year period. Moreover, we remain on
track to being debt-free by 2018.
Our successes would not have been
possible without the tireless commitment
of our employees across the country.
Our progress to date in returning this
company to revenue and profitability
growth would not be possible without their
belief, their expertise and their hard work
which I see personally, each and every day
throughout this company.
In addition, the confidence of our
shareholders in our transformation, our
progress and our ability to succeed is
valued by management as we strive to
unlock and deliver value to each of them.
I would finish by saying that I am more
confident than ever in the success of this
company. We have set forth a plan that we
continue to effectively execute. A glance
back at the Yellow Pages of one year ago
shows we’ve become more digital, more
agile, more efficient, and more competitive
as an organization. I am looking forward to
sharing additional progress with you on all
these fronts and more in the year to come.
1 For the fourth quarter ended December 31, 2015
2013
2014
2015
DIGITAL REVENUE 1(as a percentage of total revenues)
62%
45.1%
54.3%
Julien Billot
President and Chief Executive Officer

YELLOW PAGES LIMITED 2015 ANNUAL REPORT4
Our digital media properties attract over
464million visitsper year 1
1 Total digital visits measures the number of visits made across the YP, YP Shopwise, YP Dine, RedFlagDeals, C411, Bookenda and dine.TO online and mobile properties, as well as visits made across the properties of the Company’s application syndication partners.
Key AchievementsYP Dine launch, marking expansion
into dining vertical
Acquisition of the ComFree/DuProprio Network,
a leading C2C digital real estate marketplace
Opening of a second location in Montreal
(Nordelec campus) marking our deeper focus
on digital media and technology
Provision of business data to Apple Maps for
local search in Canada
Shop The Neighbourhood campaign saw
the participation of 12,500 SMEs, in
400 neighbourhoods across the country,
with 6,300 deals exclusive to the Company’s
digital properties

YELLOW PAGES LIMITED 2015 ANNUAL REPORT 5
30,800new customers acquired in 2015
Launch of the Presence Solution
Launch of new customer relationship
management system and sales tools, increasing
productivity and lead conversion abilities for our
sales force
Enhanced fulfillment and customer
service processes
Visit our online Annual Report for additional content:
corporate.yp.ca/ar#2015
Key Achievements

YELLOW PAGES LIMITED 2015 ANNUAL REPORT6
ROBERT F. MACLELLAN
Director
& Chairman of the Board
SUSAN KUDZMAN
Director
Chair of the Human Resources
& Compensation Committee
JULIEN BILLOT
President
& Chief Executive Officer
CRAIG FORMAN
Director
Corporate Governance
& Nominating Committee
DAVID G. LEITH
Director
Chair of the Corporate Governance
& Nominating Committee
DAVID A. LAZZARATO
Director
Chair of the Audit Committee
DONALD H. MORRISON
Director
Human Resources
& Compensation Committee
JUDITH A. MCHALE
Director
Corporate Governance
& Nominating CommitteeKALPANA RAINA
Director
Audit Committee
MARTIN NISENHOLTZ
Director
Human Resources
& Compensation CommitteeMICHAEL G. SIFTON
Director
Audit Committee
Board of Directors

YELLOW PAGES LIMITED 2015 ANNUAL REPORT 7
JULIEN BILLOT
President
& Chief Executive Officer
DOUG CLARKE
Senior Vice-President
& Chief Operating Officer
GINETTE MAILLÉ
Senior Vice-President
& Chief Financial Officer
Dany Paradis François D. Ramsay Ginette Maillé Julien Billot Doug Clarke Pascal Thomas Sophie Robillard Jamie Blundell
FRANÇOIS D. RAMSAY
Senior Vice-President
Corporate Affairs
& General Counsel
PASCAL THOMAS
Senior Vice-President
& Chief Digital Officer
JAMIE BLUNDELL
Vice-President
& Chief Customer Officer
Executive Team
DANY PARADIS
Senior Vice-President
& Chief Human Resources Officer
SOPHIE ROBILLARD
Vice-President
& Chief Transformation Officer

YELLOW PAGES LIMITED 2015 ANNUAL REPORT8

MANAGEMENT’S DISCUSSION AND ANALYSIS
YELLOW PAGES LIMITED 2015 ANNUAL REPORT 1
MANAGEMENT’S DISCUSSION AND ANALYSIS February 11, 2016
This management’s discussion and analysis (MD&A) is intended to help the reader understand and assess trends and significant changes in the results of operations and financial condition of Yellow Pages Limited and its subsidiaries for the years ended December 31, 2015 and 2014 and should be read in conjunction with our Audited Consolidated Financial Statements and accompanying notes for the years ended December 31, 2015 and 2014. Quarterly reports, the annual report, Supplemental Disclosure and the annual information form (AIF) can be found on SEDAR at www.sedar.com and under the “Investor Relations - Reports & Filings” section of our corporate website: http://corporate.yp.ca.
The financial information presented herein has been prepared on the basis of International Financial Reporting Standards (IFRS) for financial statements and is expressed in Canadian dollars, unless otherwise stated. The audited IFRS-related disclosures and values in this MD&A have been prepared using the standards and interpretations currently issued and effective at the end of our reporting period, December 31, 2015.
Our reporting structure reflects how we manage our business and how we classify our operations for planning and for measuring our performance.
In this MD&A, the words “we”, “us”, “our”, the “Company”, the “Corporation”, “Yellow Pages” and “YP” refer to Yellow Pages Limited and its subsidiaries (including Yellow Pages Digital & Media Solutions Limited, 411 Local Search Corp. (411.ca), Yellow Pages Homes Limited (Yellow Pages NextHome), YPG (USA) Holdings, Inc. and Yellow Pages Digital & Media Solutions LLC (the latter two collectively YP USA), Bookenda Limited, formerly 4400348 Canada Inc. (Bookenda), YP Dine Solutions Limited (YP Dine), and 9059-2114 Québec Inc. and ByTheOwner Inc. (the latter two collectively ComFree/DuProprio)).
FORWARD-LOOKING INFORMATION This MD&A contains assertions about the objectives, strategies, financial condition, results of operations and businesses of YP. These statements are considered “forward-looking” because they are based on current expectations of our business, on the markets we operate in, and on various estimates and assumptions.
Forward-looking information and statements are based on a number of assumptions which may prove to be incorrect. In making certain forward-looking statements, we have made the following assumptions:
that general economic conditions in Canada will not materially deteriorate beyond currently anticipated levels;
that investments in branding will evolve legacy perceptions and boost awareness of our digital media platforms and marketing solutions;
that we will be able to acquire new customers at the currently anticipated rate and currently anticipated Average Revenue per Customer (ARPC);
that customer retention rates will not be materially lower than currently anticipated;
that print decline rates stabilize;
that we will be able to introduce, sell and provision new products and services that will generate the anticipated return on investment (ROI) for customers;
that investments in new content and digital experiences across our owned and operated properties will protect digital audiences;
that the revenue mix between our digital owned and operated, services and resale solutions will not materially change from currently anticipated levels;
that exposure to foreign exchange risk arising from foreign currency transactions will remain insignificant;
that we will be able to realize efficiency gains; and
that we will be able to attract and retain key personnel in key positions.
Forward-looking information and statements are also based upon the assumption that none of the identified risk factors that could cause actual results to differ materially from the anticipated or expected results described in the forward-looking information and statements will occur.
MANAGEMENT’S DISCUSSION AND ANALYSIS
YELLOW PAGES LIMITED 2015 ANNUAL REPORT 9

MANAGEMENT’S DISCUSSION AND ANALYSIS
2 YELLOW PAGES LIMITED 2015 ANNUAL REPORT
When used in this MD&A, such forward-looking statements may be identified by words such as “aim”, “anticipate”, “believe”, “could”, “estimate”, “expect”, “goal”, “intend”, “objective”, “may”, “plan”, “predict”, “seek”, “should”, “strive”, “target”, “will”, “would” and other similar terminology. These statements reflect current expectations regarding future events and operating performance and speak only as at the date of this MD&A. The Corporation assumes no obligation to update or revise them to reflect new events or circumstances, except as may be required pursuant to securities laws. Forward-looking statements involve significant risks and uncertainties, should not be read as guarantees of future results or performance, and will not necessarily be accurate indications of whether or not such results or performance will be achieved. A number of factors could cause actual results or performance to differ materially from the results or performance discussed in the forward-looking statements and could have a material adverse effect on the Corporation, its business, results from operations and financial condition, including, but not limited to, the following risk factors discussed under the “Risks and Uncertainties” section of this MD&A, and those described in the “Risk Factors” section of our AIF:
Substantial competition could reduce the market share of the Corporation;
A higher than anticipated rate of decline in print revenue resulting from changes in preferences and consumer habits;
The inability of the Corporation to attract, retain and upsell customers;
The inability of the Corporation to successfully enhance and expand its offering of digital and new media products;
A higher than anticipated proportion of revenues coming from the Corporation’s digital products with lower margin, such as services and resale;
The Corporation’s business depends on the usage of its online and mobile properties and failure to protect traffic across the Corporation’s digital properties could impair its ability to grow revenues and expand its business;
The inability of the Corporation to generate sufficient funds from operations, debt financings, equity financings or refinancing transactions;
The Corporation’s substantial indebtedness could adversely affect its efforts to refinance;
Incremental contributions by the Corporation to its pension plans;
Failure by either the Corporation or the Telco Partners (as defined herein) to fulfill the obligations set forth in the agreements between the Corporation and the Telco Partners;
Failure by the Corporation to adequately protect and maintain its brands and trademarks, as well as third party infringement of such;
Work stoppages and other labour disturbances;
The Corporation’s inability to attract and retain key personnel;
Challenge by tax authorities of the Corporation’s position on certain income tax matters;
The loss of key relationships or changes in the level or service provided by digital portals, search engines, individual websites, mobile manufacturers and Operating Systems providers;
The failure of the Corporation’s computers and communications systems;
The inability of the Corporation to develop information and technology systems and platforms required to execute the Corporation’s Return to Growth Plan;
The inability of the Corporation to realize operational efficiencies and cost savings across its operations; and
The Corporation might be required to record additional impairment charges.
YELLOW PAGES LIMITED 2015 ANNUAL REPORT
MANAGEMENT’S DISCUSSION AND ANALYSIS
10

MANAGEMENT’S DISCUSSION AND ANALYSIS
YELLOW PAGES LIMITED 2015 ANNUAL REPORT 3
DEFINITIONS RELATIVE TO UNDERSTANDING OUR RESULTS
Income from Operations before Depreciation and Amortization, and Restructuring and Special Charges (Adjusted EBITDA)
We report on our Income from operations before depreciation and amortization, and restructuring and special charges (Adjusted EBITDA). Adjusted EBITDA is not a performance measure defined under IFRS and is not considered an alternative to income from operations or net earnings in the context of measuring Yellow Pages’ performance. Adjusted EBITDA does not have a standardized meaning and is therefore not likely to be comparable with similar measures used by other publicly traded companies. Adjusted EBITDA should not be used as an exclusive measure of cash flow since it does not account for the impact of working capital changes, taxes, interest payments, capital expenditures, business acquisitions, debt principal reductions and other sources and uses of cash, which are disclosed on page 28 of this MD&A.
We define Adjusted EBITDA as revenues less operating costs, as shown in Yellow Pages Limited’s consolidated income statements. We use Adjusted EBITDA to evaluate the performance of our business as it reflects its ongoing profitability. We believe that certain investors and analysts use Adjusted EBITDA to measure a company’s ability to service debt and to meet other payment obligations or as a common measurement to value companies in the media and marketing solutions industry. We believe that certain investors and analysts also use Adjusted EBITDA to evaluate the performance of our business. Adjusted EBITDA is also one component in the determination of short-term incentive compensation for all management employees.
Free cash flow
Free cash flow is a non-IFRS measure generally used as an indicator of financial performance. It should not be seen as a substitute for cash flow from operating activities. Free cash flow is defined as cash flow from operating activities, as reported in accordance with IFRS, less an adjustment for capital expenditures. Free cash flow is not a standardized measure and is not comparable with that of other public companies.
This MD&A is divided into the following sections:
1. Our Business, Mission, Strategy and Capability to Deliver Results
2. Results
3. Liquidity and Capital Resources
4. Free Cash Flow
5. Critical Assumptions
6. Risks and Uncertainties
7. Controls and Procedures
MANAGEMENT’S DISCUSSION AND ANALYSIS
YELLOW PAGES LIMITED 2015 ANNUAL REPORT 11

MANAGEMENT’S DISCUSSION AND ANALYSIS
4 YELLOW PAGES LIMITED 2015 ANNUAL REPORT
1. OUR BUSINESS, MISSION, STRATEGY AND CAPABILITY TO DELIVER RESULTS
OUR BUSINESS Yellow Pages is a leading media and marketing solutions company in Canada, offering small and medium-sized enterprises (SMEs) services to help them connect with local consumers. The Company provides SMEs full-serve access to one of the country’s most comprehensive suites of digital and traditional marketing solutions, which include products such as online and mobile priority placement on Yellow Pages’ owned and operated media, content syndication, search engine solutions, website fulfillment, social media campaign management, digital display advertising, video production and print advertising. Through its extensive sales force, the Company acts as dedicated marketing professionals for approximately 245,000 local businesses across Canada. This large and primarily face-to-face sales force is broken down into various channels, each dedicated to offering customers a specialized level of service based on size and spend.
Via its Mediative division, Yellow Pages offers dedicated marketing and performance media services to national clients Canada-wide. Operating an extensive publisher network and one of the country’s largest pools of high-intent consumer data, Mediative provides national brands and enterprises with innovative marketing solutions that reach, engage and convert potential customers.
In addition, Yellow Pages offers digital advertising solutions to the Canadian real estate industry, helping home buyers and sellers connect and transact with one another. Through ComFree/DuProprio (CFDP) and Yellow Pages NextHome, the Company services the real estate industry, including new construction leaders, landlords and property management firms, by providing digital advertising solutions to help them connect with prospective buyers, sellers and renters. CFDP positions Yellow Pages as a leader in the Canadian consumer-to-consumer digital real estate marketplace, empowering consumers by providing them with trusted media and solutions to sell their homes in a proven and cost-effective manner.
Yellow Pages owns and operates one of Canada’s largest and richest databases of local merchant information. This content reaches audiences via a number of desktop, mobile and print properties, which continue to serve as effective advertising platforms to SMEs and national retailers. To help Canadians discover everything their neighbourhood has to offer, the Company’s network of media properties is becoming increasingly specialized across the high value search verticals of services, real estate, dining and retail. A description of the Company’s existing digital media properties is found below:
YP™ – Available both online at YP.ca and as a mobile application, YP allows users to discover their local neighbourhoods through comprehensive merchant profiles and relevant editorial content;
YP Shopwise™ – Mobile application offering geo-localized deals and flyers, as well as access to product catalogues from local and national retailers Canada-wide;
RedFlagDeals.com™ – Canada’s leading provider of online and mobile promotions, deals, coupons and shopping tools;
CFDP – Currently the fourth most-visited network of real estate digital properties in Canada and Québec’s leading real estate site, CFDP offers homeowners a proven, professional and cost effective service to market and sell their homes;
YP Dine™ – Mobile application that allows users to discover, search for and book local restaurants based on time of day, mood, purpose and expert suggestions, in addition to offering online food ordering and delivery functionalities;
Bookenda.com – Digital property offering a leading online transaction platform for users and merchants to easily interact and manage bookings;
dine.TO – Provides users in the Greater Toronto Area with an extensive database of online local restaurant listings, reviews, deals, playlists and events, as well as real-time online ordering capabilities;
Yellow Pages NextHome – Provides Canadians with valuable information to help them make the right buying, selling, and/or renting decision. Digital properties operating under the Yellow Pages NextHome umbrella include YP NextHome Rent and YP NextHome New Construction;
Canada411 (C411) – One of Canada’s most frequented and trusted online and mobile destinations for personal and local business information; and
411.ca – Digital directory service to help users find and connect with people and local businesses.
MISSION We exist to champion the local neighbourhood economy by enabling Canada’s businesses and consumers to connect, interact and build relationships in order to create local opportunities.
YELLOW PAGES LIMITED 2015 ANNUAL REPORT
MANAGEMENT’S DISCUSSION AND ANALYSIS
12

MANAGEMENT’S DISCUSSION AND ANALYSIS
YELLOW PAGES LIMITED 2015 ANNUAL REPORT 5
STRATEGY AND CAPABILITY TO DELIVER RESULTS Our objective is to become the leading local digital company in Canada by fostering strong business relationships between Canadian businesses and consumers, while also developing an unparalleled local media presence across the country.
The Return to Growth Plan (the Plan) was introduced in early 2014 to grow Yellow Pages into a leading Canadian digital company. The Plan sets out to accomplish these objectives by (1) strengthening the Company’s digital brand perception among Canadians, (2) growing adoption and usage of its network of digital media properties, and (3) enhancing its value proposition to local and national merchants as it relates to effective digital marketing. As a result of these achievements, Yellow Pages anticipates returning to a growth in its customer count by 2017, and ultimately, growth in revenues and profitability (Adjusted EBITDA) by 2018. In parallel, the Plan is expected to realize operational efficiencies across the organization and deliver the required financial liquidity to fully deleverage the balance sheet by 2018.
Yellow Pages has made significant progress in the execution of the Plan and its growth into a digital company:
Digital Revenues – Consolidated digital revenues grew 9.8% year-over-year to reach $486.3 million in 2015. For the fourth quarter ended December 31, 2015, digital revenues grew 10.5% year-over-year to $129.2 million, representing 62% of consolidated revenues;
Adjusted EBITDA – Adjusted EBITDA totalled $260.7 million or 31.4% of revenues in 2015, relative to $316 million or 36% of revenues in 2014. Fuelled by digital revenue growth and lower employee related expenses, Adjusted EBITDA for the fourth quarter ended December 31, 2015, reached $64.5 million or 30.9% of revenues, as compared to $64.8 million or 30.1% of revenues for the same period last year;
Debt Repayment – Yellow Pages repaid $100.3 million of its 9.25% senior secured notes in 2015 and $393.3 million since their issuance on December 20, 2012. As at December 31, 2015, the Company had net debt of $430.6 million;
Customer Count – The Company’s customer count reached 245,000 customers as at December 31, 2015 as compared to 256,000 customers as at December 31, 2014. Improvements to customer count metrics continue to be fuelled by accelerated customer acquisition and stable retention rates. For the twelve-month period ended December 31, 2015, the Company acquired 30,800 new customers, up from 22,100 customers in 2014 and surpassing Yellow Pages’ 2015 customer acquisition target of 30,000. Customer retention reached 85% in 2015, an improvement relative to 84% last year; and
Digital Visits – Total digital visits grew 9.4% year-over-year to reach 464 million in 2015, up from 424.1 million in 2014. Total digital visits measures the number of visits made across the YP, YP Shopwise, YP Dine, RedFlagDeals, C411, Bookenda and dine.TO online and mobile properties, as well as visits made across the properties of the Company’s application syndication partners.
These achievements were made possible by the successful and timely execution of various initiatives underlying Yellow Pages’ Return to Growth Plan, which include:
Extending its Brand Promise
Various branding initiatives were launched over the course of 2015 to grow awareness and adoption of Yellow Pages’ digital media and marketing offerings.
The Company held a number of media campaigns in 2015 to advertise its suite of mobile applications. With a focus on the YP and YP Shopwise mobile applications, these multimedia campaigns were rolled out in Vancouver, Calgary, Toronto and Montreal to showcase the applications’ unique ability to quickly and easily connect Canadians with local merchants.
In further support of local shopping and the growth of local economies, Yellow Pages hosted its third annual Shop The Neighbourhood (STN) event on Saturday, November 28, 2015 across 400 Canadian neighbourhoods. Held during a weekend when many Canadians shop at U.S. retailers to take advantage of Black Friday and Cyber Monday deals, STN garnered the participation of over 12,500 local Canadian merchants who offered 6,300 deals exclusive to the YP Shopwise mobile application. For the first time in the event’s history, STN introduced Beacon technologies in various neighbourhoods, allowing participating merchants to push deal-related notifications to YP Shopwise users while they shopped on location.
The Company will continue to strengthen its brand promise in 2016. Comprised of various forms of multimedia campaigns Canada-wide, these initiatives will serve to shift Yellow Pages’ perception among SMEs and consumers, drive additional merchants to invest in the Company’s marketing solutions, and protect usage across Yellow Pages’ verticalized suite of desktop and mobile destinations.
Strengthening its Media Assets
Total digital visits (TDV) grew to 464 million for the year ended December 31, 2015, up 9.4% from 424.1 million visits in 2014. For the fourth quarter ended December 31, 2015, TDV totaled 118.2 million, up from 117.4 million for the same period last year. TDV performance during the fourth quarter of 2015 was principally impacted by a change to the layout of Google’s mobile web search results pages, which pushed the organic results for all mobile web publishers lower on Google’s search pages. The
MANAGEMENT’S DISCUSSION AND ANALYSIS
YELLOW PAGES LIMITED 2015 ANNUAL REPORT 13

MANAGEMENT’S DISCUSSION AND ANALYSIS
6 YELLOW PAGES LIMITED 2015 ANNUAL REPORT
ranking of Yellow Pages’ listings on Google’s mobile web search results pages remained relatively unchanged despite this layout change, a reflection of the relevancy and quality of the Company’s listings.
The Company will continue to improve the quality, completeness and relevance of the user experience across its digital media properties.
The richness of Yellow Pages’ content has been recognized by Apple Maps in 2015, who has started syndicating the Company’s business information (including addresses, phone numbers, hours of operations, geo-coordinates, website URLs, photos, ratings and reviews) across its Canadian mobile search engine results pages.
Yellow Pages also introduced new mobile applications in 2015 to better address the verticalized needs of Canadian consumers. Supported by the acquisitions of Bookenda and dine.TO in December 2014, YP Dine was launched nationally in June 2015 to act as Canadians’ trusted dining application. YP Dine allows users to search from an extensive database of Canadian restaurants, filter their selections based on time of day, mood, activity, and expert reviews, and leverage Bookenda’s technologies to book a table directly from their mobile phones. Recognizing the application’s unique user proposition, YP Dine was selected by Apple as one of 2015’s best new mobile applications.
Most recently, Yellow Pages acquired CFDP on July 1, 2015, growing the Company into a leading digital real estate marketplace. Operating under the DuProprio and ComFree banners in Quebec and the rest of Canada, respectively, CFDP operates online and mobile properties that connect home buyers with home sellers without intermediation from traditional real estate brokers. CFDP is currently the fourth most visited digital network of real estate properties in Canada and Quebec’s leading real estate site, holding a 17% share of the province’s listings market. The acquisition extends Yellow Pages’ reach of Canadian home buyers and sellers, while also providing them with the platforms and technologies required to buy and sell their homes in a proven, cost effective manner.
In 2016, a deeper focus will be placed on integrating and improving transactional functionalities across the Company’s mobile applications. These enhancements will impact Yellow Pages’ existing verticals, growing the Company’s digital media network into a trusted destination for Canadians to quickly and easily solve their everyday needs. By providing Canadians with mobile technologies that help them make smarter shopping decisions and get closer to the transaction, the Company aims to create more engaged audiences, grow direct traffic, and deliver richer return on investment for merchants leveraging Yellow Pages’ mobile media as a key marketing platform.
Enhancing its Customer Value Proposition
The Company’s customer count reached 245,000 customers as at December 31, 2015 as compared to 256,000 customers as at December 31, 2014, representing a net customer count decline of 11,000 customers in 2015, down significantly from 20,000 and 33,000 net customers lost in 2014 and 2013, respectively. Growth in the customer count is critical to delivering sustainable digital revenue growth and consequently, allowing Yellow Pages to return to revenue and Adjusted EBITDA growth by 2018.
Yellow Pages acquired 30,800 new customers during the twelve-month period ended December 31, 2015, exceeding internal targets and last year’s acquisition of 22,100 new customers. New technologies, incentive programs and marketing solutions, as well as a stronger sales culture, have each played a key role in accelerating customer acquisition. Over the course of 2015, the Company deployed a new customer relationship management platform to optimize lead assignment, conversion rates, and the productivity of Yellow Pages’ sales representatives. The Company’s sales representatives are now equipped with technologies and customer-facing tools that improve the way they sell and consult, utilizing proprietary market intelligence to build value-enhancing digital marketing programs for clients. The launch of the Presence solution in April 2015 also encouraged new customer acquisition, helping SMEs syndicate their business listings across the web at entry-level pricing.
The renewal rate among customers grew to 85% for the year ended December 31, 2015. This compares to a renewal rate of 84% for year ended December 31, 2014, an improvement that exceeded internal targets and was supported by the delivery of enhanced ROI and a richer customer experience. New processes and technologies were introduced across the Company’s sales, customer service and fulfillment teams to improve the quality of the services offered to merchants. In conjunction, new self-serve features were made available to customers within the Company’s business-to-business 360º Business Centre (http://businesscentre.yp.ca/), offering merchants the ability to update their business profile and track the performance of their marketing campaigns in real time.
CUSTOMER ACQUISITION AND RENEWAL1
For the years ended December 31, 2015 2014
Customer count 245,000 256,000
New customers 30,800 22,100 Customer renewal rate 85% 84%
1 YP core only, excludes the contribution of Mediative, 411.ca, Yellow Pages NextHome and CFDP.
YELLOW PAGES LIMITED 2015 ANNUAL REPORT
MANAGEMENT’S DISCUSSION AND ANALYSIS
14

MANAGEMENT’S DISCUSSION AND ANALYSIS
YELLOW PAGES LIMITED 2015 ANNUAL REPORT 7
Increasing the size of the customer base will remain a critical component of Yellow Pages’ Return to Growth Plan. The Company anticipates returning to a growth in the customer count, at latest, by 2017, supported by initiatives that accelerate customer acquisition and protect client renewal.
New technologies, such as the adoption of strategic and fact-based selling strategies among our face-to-face and telephony sales channels, will be implemented to support higher lead conversion rates. In conjunction, processes related to sales, fulfillment and customer service will be further automated to improve the quality of merchants’ digital marketing programs.
Gaining Efficiencies
Yellow Pages seeks opportunities to gain efficiencies across its print and digital operations. The Company has reduced print manufacturing and distribution costs by eliminating systematic door-to-door distribution of the print directory and rather, having directories made available through public street boxes and retailer racks. Yellow Pages has also finalized a comprehensive organizational review (the Corporate Realignment) during the second half of 2015, building a leaner, more agile and collaborative organization. The Corporate Realignment follows suit to the progress Yellow Pages has made in the execution of its Plan, specifically from interdependencies built between Yellow Pages’ information technology, strategy and marketing functions and the decommissioning of legacy systems, platforms and processes. The Corporate Realignment reduced the Company’s workforce by approximately 300 employees during the third and fourth quarters of 2015, affecting roles that have been integrated within other functions or that are no longer aligned with Yellow Pages’ digital reality.
Operational efficiencies will continue to be realized over the course of 2016, sourced from the ongoing optimization of print operations, in addition to costs savings realized from the insourcing and automation of various fulfillment functions.
OUTLOOK
The Company affirms its long-term financial outlook relative to the Return to Growth Plan. The Plan serves to grow Yellow Pages into a leading Canadian digital company, ultimately returning the Company to consolidated revenue and Adjusted EBITDA growth by 2018. For the year ending December 31, 2016, Yellow Pages anticipates delivering:
Year-over-year organic digital revenue growth in the high single digits;
Adjusted EBITDA margins of 30%;
Capital expenditures, net of related lease incentives, of $60 million; and
Repayment of approximately $100 million of its 9.25% senior secured notes.
As part of establishing the above guidance, the Company made a number of assumptions:
Economic conditions in Canada do not materially deteriorate beyond currently anticipated levels;
Exposure to foreign exchange risk arising from foreign currency transactions remains insignificant. Annual expenditures, net of revenues, denominated in U.S. dollars, are approximately $30 million;
Canadian local digital advertising market experiences growth of 10% per year;
Print decline rates stabilize;
We will be able to introduce, sell and provision new products and services that will generate the anticipated ROI for customers;
The revenue mix between the Company’s digital owned and operated, services and resale solutions will not materially change from currently anticipated levels;
The Company will be able to further accelerate customer acquisition levels at currently anticipated ARPC and, over time, retain and upsell newly acquired customers;
Investments in branding will evolve legacy perceptions and boost awareness of our digital media platforms;
Investments in new content and digital experiences across our owned and operated properties will protect digital audiences; and
The Company will be able to realize efficiency gains.
The Company cautions that the assumptions used to prepare the Outlook provided above, although currently reasonable, may prove to be incorrect or inaccurate. Accordingly, our actual results may differ materially from our expectations as set forth in this section. The Outlook provided above should be read in conjunction with, and is qualified by, the section Forward-Looking Information beginning on page 9 of this MD&A.
MANAGEMENT’S DISCUSSION AND ANALYSIS
YELLOW PAGES LIMITED 2015 ANNUAL REPORT 15

MANAGEMENT’S DISCUSSION AND ANALYSIS
8 YELLOW PAGES LIMITED 2015 ANNUAL REPORT
2. RESULTS This section provides an overview of our financial performance in 2015 compared to 2014 and 2013. We present several metrics to help investors better understand our performance. Some of these metrics are not measures recognized by IFRS. Definitions of these financial metrics are provided on page 11 of this MD&A and are important aspects which should be considered when analyzing our performance.
OVERALL
Revenues decreased by $47.8 million or 5.4% to $829.8 million compared to the previous year.
Digital revenues grew 9.8% year-over-year to reach $486.3 million in 2015. For the year ended December 31, 2015, digital revenues represented 58.6% of consolidated revenues, up from 50.5% for the same period in 2014.
Income from operations before depreciation and amortization and restructuring and special charges (Adjusted EBITDA) decreased by $55.3 million or 17.5% to $260.7 million for the year ended December 31, 2015 compared to the same period in 2014.
HIGHLIGHTS (IN THOUSANDS OF CANADIAN DOLLARS– EXCEPT PER SHARE AND PERCENTAGE INFORMATION)
For the years ended December 31, 2015 2014
Revenues $ 829,771 $ 877,528 Income from operations before depreciation and amortization, and restructuring and special charges
(Adjusted EBITDA) $ 260,687 $ 315,976 Adjusted EBITDA margin 31.4% 36% Net earnings $ 61,055 $ 188,540 Basic earnings per share $ 2.29 $ 6.95 Cash flows from operating activities $ 197,566 $ 156,507 Free cash flow1 $ 122,145 $ 72,557
1 Please refer to Section 4 for a reconciliation of free cash flow.
$877,5
$829.8
2014
2015
REVENUES (IN MILLIONS OF DOLLARS)
(5.4%)
$316
$260.7
2014
2015
ADJUSTED EBITDA (IN MILLIONS OF DOLLARS)
(17.5%)
YELLOW PAGES LIMITED 2015 ANNUAL REPORT
MANAGEMENT’S DISCUSSION AND ANALYSIS
16
$829.8 $260.7
$877.5 $316
REVENUES(IN MILLIONS OF DOLLARS)
ADJUSTED EBITDA(IN MILLIONS OF DOLLARS)
2015
2014
(5.4%) (17.5%)
2015
2014

MANAGEMENT’S DISCUSSION AND ANALYSIS
YELLOW PAGES LIMITED 2015 ANNUAL REPORT 9
CONSOLIDATED OPERATING AND FINANCIAL RESULTS (IN THOUSANDS OF CANADIAN DOLLARS – EXCEPT PER SHARE INFORMATION)
For the years ended December 31, 2015 2014 2013
Revenues $ 829,771 $ 877,528 $ 971,761 Operating costs 569,084 561,552 555,649
Income from operations before depreciation and amortization, restructuring and special charges 260,687 315,976 416,112
Depreciation and amortization 80,837 78,076 60,164 Restructuring and special charges 30,834 18,359 23,338
Income from operations 149,016 219,541 332,610 Financial charges, net 60,922 72,116 93,357 Earnings before income taxes and earnings
from investments in associates 88,094 147,425 239,253 Provision for (recovery of) income taxes 27,039 (40,937) 63,421 Earnings from investments in associates (178) (698)
Net earnings $ 61,055 $ 188,540 $ 176,530
Basic earnings per share attributable to common shareholders $ 2.29 $ 6.95 $ 6.34 Diluted earnings per share attributable to common shareholders $ 2.05 $ 5.81 $ 5.46
As at December 31, 2015 2014 2013
Total assets $ 1,710,627 $ 1,749,560 $ 1,794,034 Long-term debt (including current portion, excluding
exchangeable debentures)
$ 407,353 $ 507,911 $ 647,468 Exchangeable debentures $ 90,478 $ 88,959 $ 87,934
ANALYSIS OF CONSOLIDATED OPERATING AND FINANCIAL RESULTS
FISCAL YEAR 2015 VERSUS 2014
Revenues
Revenues decreased by 5.4% year-over-year to reach $829.8 million in 2015. This compares to $877.5 million for the same period last year. Revenues remain adversely impacted by a lower customer count within Yellow Pages’ core business, in addition to a decrease in print spending among renewing customers.
Digital revenues are a growing contribution of the Company’s consolidated revenue base. Digital revenues grew by 9.8% year-over-year to reach $486.3 million in 2015, or 58.6% of revenues, as compared to $442.8 million, or 50.5% of revenues, for the same period last year. Growth in digital revenues was principally driven by accelerated customer acquisition and growth in digital spending among the Company’s renewing customers, as well as the acquisition of CFDP on July 1, 2015. Excluding CFDP, digital revenues for the year ended December 31, 2015 grew by approximately 6% year-over-year.
Yellow Pages’ customer count reached 245,000 as at December 31, 2015, relative to 256,000 customers as at December 31, 2014. This represents a net customer count decline of 11,000 customers in 2015, down significantly from 20,000 net customers lost in 2014. Accelerated customer acquisition as well as improved customer retention rates, have helped deliver this performance. Yellow Pages acquired 30,800 new customers during the twelve-month period ended December 31, 2015, exceeding internal targets and last year’s acquisition of 22,100 new customers. The customer renewal rate also grew to 85% for the year ended December 31, 2015, up from 84% in 2014 (for further details, see Strategy and Capability to Deliver Results: Enhancing its Customer Value Proposition).
The Company remains committed to upselling digital customers and helping them build more comprehensive marketing programs. For the year ended December 31, 2015, 44% of renewing customers experienced a year-over-year increase in annual spending, as compared to 31% of customers over the same period last year. The upselling of digital customers is a core component of Yellow Pages’ ability to deliver long-term sustainable digital revenue growth, particularly as new customers are acquired at low, entry-level ARPC.
Fuelled by customer acquisition and growth in digital spending among renewing customers, digital-only customers grew to 54,500, or 22% of the customer base, as at December 31, 2015. This compared to 37,000 digital-only customers, or 14% of the customer base, as at the same period last year. The Company’s online and mobile priority placement solutions remain the most adopted by SMEs, with penetration reaching 61% and 27%, respectively, as at December 31, 2015. This compares favourably to customer penetration of 57% and 24%, respectively, as at the same time last year.
MANAGEMENT’S DISCUSSION AND ANALYSIS
YELLOW PAGES LIMITED 2015 ANNUAL REPORT 17

MANAGEMENT’S DISCUSSION AND ANALYSIS
1 0 YELLOW PAGES LIMITED 2015 ANNUAL REPORT
Print revenues decreased 21% year-over-year to reach $343.4 million in 2015, adversely impacted by a decline in the number of print customers and the migration of print marketing spending to digital. Print revenue decline rates have, however, stabilized, in part supported by content enhancement and pricing initiatives that have protected usage of the print directory and encouraged renewal of print advertising spending among customers.
CUSTOMER PENETRATION1
As at December 31, 2015 2014
Print 78% 85% Owned and Operated Digital Media2 66% 63%
Online priority placement 61% 57% Mobile priority placement 27% 24% Legacy 1% 4%
Digital Services3 10% 10%
SPENDING DYNAMICS¹
For the years ended December 31, 2015 2014
Amongst Renewing Customers1 Increase in spending4
Customer distribution 44% 31% % of revenues 32% 30%
Stable spending5 Customer distribution 39% 51% % of revenues 27% 30%
Decrease in spending6 Customer distribution 17% 18% % of revenues 41% 40%
Average Revenue per Customer (ARPC)7 $ 2,930 $ 3,063
OPERATIONAL INDICATORS
As at December 31, 2015 2014
YP 360º Solution Penetration1 38% 36.6% Digital-only customers1 54,500 37,000 Digital revenues (in thousands of Canadian dollars) 8 $ 486,346 $ 442,830 Digital revenues as a percentage of total revenues8 58.6% 50.5%
1 YP core only, excludes the contribution of Mediative, 411.ca, Yellow Pages NextHome and CFDP. 2 Percentage of YP customers purchasing at least one Online Priority Placement, Mobile Priority Placement, PresenceEssential/PresencePro, Content, Video, and/or
Legacy product. 3 Percentage of YP customers purchasing at least one PresenceExtended, Website, Search Engine Optimization (SEO), Search Engine Marketing (SEM), Facebook
Solution, and/or Smart Digital Display product. 4 Renewing YP customers experiencing an increase in spending of over 5%, on a year-over-year basis. 5 Renewing YP customers experiencing an increase in spending between 0% and 5%, on a year-over-year basis. 6 Renewing YP customers experiencing a decrease in spending on a year-over-year basis. 7 The ARPC for the year ended December 31, 2014 was restated to exclude the contribution of Mediative.
8 For the years ended December 31.
YELLOW PAGES LIMITED 2015 ANNUAL REPORT
MANAGEMENT’S DISCUSSION AND ANALYSIS
18

MANAGEMENT’S DISCUSSION AND ANALYSIS
YELLOW PAGES LIMITED 2015 ANNUAL REPORT 1 1
Adjusted EBITDA
Adjusted EBITDA decreased by $55.3 million to $260.7 million during 2015, compared with a decline of $100.1 million to $316 million for the same period in 2014. This represents a year-over-year decline of 17.5% during 2015, as compared to a year-over-year decline of 24.1% the year prior. Our Adjusted EBITDA margin for 2015 was 31.4% compared to 36% for 2014. The decrease in Adjusted EBITDA and Adjusted EBITDA margin for the year ended December 31, 2015 is due mainly to lower print revenues and a change in product mix, partly offset by cost saving initiatives and lower employee related expenses. The Adjusted EBITDA margin was also adversely impacted by the Company’s Mediative, 411.ca and CFDP operations, which operate at lower Adjusted EBITDA margins relative to Yellow Pages’ core business.
Cost of sales increased by $12.9 million to $319.8 million in 2015, as compared to $306.9 million for the same period in 2014. The increase for the year is due primarily to the acquisitions of 411.ca and CFDP on June 1, 2014 and July 1, 2015, respectively, and a change in product mix, partly offset by cost savings generated from print optimization initiatives.
Gross profit margin decreased to 61.5% in 2015 compared to 65% in 2014. The decrease is primarily due to a change in product mix and the acquisitions of 411.ca and CFDP.
General and administrative expenses decreased by $5.4 million to $249.3 million during 2015 compared with $254.7 million for the year ended December 31, 2014. The decrease is mainly attributable to cost savings associated with the Corporate Realignment, employee related expenses and amendments to our pension and post-retirement benefit plans, partly offset by expenses associated with 411.ca and CFDP.
Depreciation and amortization
Depreciation and amortization increased to $80.8 million during 2015 compared to $78.1 million in 2014. The increase is due to higher capital expenditures in connection with the deployment of systems and platforms as the Company executes its digital transformation.
Restructuring and special charges
In 2015, we recorded restructuring and special charges of $30.8 million associated primarily with workforce reductions related to the Corporate Realignment, internal reorganizations, transaction costs associated with business acquisitions, and contract termination costs, partially offset by a curtailment gain related to workforce reductions. In 2014, we recorded restructuring and special charges of $18.4 million associated primarily with internal reorganizations and workforce reductions, partially offset by a net curtailment gain related to workforce reductions.
Financial charges
Financial charges decreased by $11.2 million to $60.9 million during 2015 compared with $72.1 million for 2014. The decrease is mainly attributable to a lower level of indebtedness. As at December 31, 2015 and 2014, the effective average interest rate on our debt portfolio was 9%.
Provision for (recovery of) income taxes
The combined statutory provincial and federal tax rates were 26.70% and 26.56% for the years ended December 31, 2015 and 2014, respectively. The Company recorded an expense of $27 million for the year compared to a recovery of $40.9 million in 2014. The Company recorded an expense of 30.69% on earnings for the year ended December 31, 2015 and a recovery of 27.77% on earnings for the year ended December 31, 2014.
The difference between the effective and the statutory rates in 2015 is due to the non-deductibility of certain expenses for tax purposes. The difference between the effective and the statutory rates in 2014 is primarily due to a recovery of income taxes of $84.8 million related to the cancellation of certain income tax liabilities in the fourth quarter of 2014 following the settlement of tax assessments with the Canada Revenue Agency.
Earnings from investments in associates
On June 1, 2014, we acquired the remaining 70% interest in 411.ca, whose results are now consolidated within YP. We recorded earnings of $0.2 million for the period from January 1, 2014 up to the acquisition date.
Net earnings
We recorded net earnings of $61.1 million during 2015 compared with $188.5 million for 2014. The decrease for the year is principally explained by lower Adjusted EBITDA and higher restructuring and special charges, in addition to a recovery of income taxes of $84.8 million during the fourth quarter of 2014 related to the cancellation of certain income tax liabilities following the settlement of tax assessments.
MANAGEMENT’S DISCUSSION AND ANALYSIS
YELLOW PAGES LIMITED 2015 ANNUAL REPORT 19
MANAGEMENT’S DISCUSSION AND ANALYSIS
1 2 YELLOW PAGES LIMITED 2015 ANNUAL REPORT
FISCAL 2014 VERSUS 2013
Revenues
Revenues decreased by 9.7% to $877.5 million during 2014 compared with $971.8 million for 2013. Revenues were mostly impacted by the overall loss of customers. To offset existing trends and return to a growth in customer count by 2017, Yellow Pages invested in accelerating the annual run-rate of customer acquisition and delivering an improved experience to current and prospective customers.
In 2014, consolidated print revenues decreased 23.1% year-over-year to reach $434.7 million. To support print revenues, the Company launched the Print Product Simplification (PPS) initiative in 2014 in select rural markets. By increasing print advertisement sizes at little to no incremental cost to the customer, PPS protects customer renewal while preserving content and promoting usage of the print directory. PPS also simplifies the selling process for our MACs by reducing the number of print offers available to customers.
Consolidated digital revenues reached $442.8 million in 2014 representing an increase of 9%. A key milestone was achieved during 2014 as consolidated digital revenues exceeded 50% of revenues. For the year ended December 31, 2014, consolidated digital revenues represented 50.5% of consolidated revenues, up from 41.8% for the same period last year. Digital revenues across the Company’s core YP operations, which exclude the impact of Mediative, 411.ca and YP Next Home, increased by 9.1% year-over-year. This growth was driven by the ongoing migration of customers’ print spend towards digital solutions, as well as accelerated customer acquisition, as the majority of new customers only purchase digital products. As at December 31, 2014, digital-only customers grew to 37,000, compared to 23,900 as at the same date last year. Digital-only customers represented 14.5% of YP’s customer base as at December 31, 2014, up from 8.7% as at the same time last year.
As at December 31, 2014, 57.3% of YP’s customers were purchasing our owned and operated online priority placement products, compared to 47.1% as at the same date last year. Adoption of our mobile priority placement products also saw growth, with customer penetration reaching 24.1% as at December 31, 2014, as compared to 14.9% for the prior year. Yellow Pages invested in growing traffic across its network of digital solutions to promote customer adoption, retention and ROI across its owned and operated priority placement products.
Adjusted EBITDA
Adjusted EBITDA decreased by $100.1 million to $316 million during 2014 compared with $416.1 million in 2013. The decrease in Adjusted EBITDA was due mainly to lower revenues combined with a lower Adjusted EBITDA margin. Our Adjusted EBITDA margin for 2014 was 36% compared to 42.8% for 2013. Lower revenues and incremental investments related to the Return to Growth Plan were the main contributors to the decrease in Adjusted EBITDA margin for 2014.
Cost of sales decreased by $10.7 million to $306.9 million during 2014 compared with $317.6 million for 2013. The decrease for the year resulted from lower sales costs associated with lower revenues, lower print manufacturing costs and workforce reductions associated with our declining legacy business. These cost savings were partly offset by an increase in provisioning and fulfillment costs of our digital products and services as well as expenses related to 411.ca.
Gross profit margin decreased to 65% for 2014 compared to 67.3% for 2013. The decrease is primarily due to a decline in print revenues.
General and administrative expenses increased by $16.6 million to $254.7 million during 2014 compared with $238.1 million for the same period in 2013. The increase was mainly attributable to investments related to the digital transformation, partially offset by lower bad debts as well as a non-recurring benefit associated with the positive outcome of a litigation.
Depreciation and amortization
Depreciation and amortization increased to $78.1 million during 2014 from $60.2 million in 2013. The increase was due to higher capital expenditures in connection with the deployment of systems and platforms as the Company executed its digital transformation.
Restructuring and special charges
In 2014, we recorded restructuring and special charges of $18.4 million associated primarily with internal reorganizations and workforce reductions, partially offset by a curtailment gain related to workforce reductions. In 2013, we recorded restructuring and special charges of $23.3 million associated with a workforce reduction of approximately 300 employees, the termination and renegotiation of certain contractual obligations and the departure of the former President and Chief Executive Officer.
Financial charges
Financial charges decreased by $21.2 million to $72.1 million during 2014 compared with $93.4 million for 2013. The decrease for the year ended December 31, 2014 was mainly attributable to a lower level of indebtedness and higher interest income on the defined benefit plan’s assets. As at December 31, 2014, the effective average interest rate on our debt portfolio was 9% compared to 9.1% for 2013.
YELLOW PAGES LIMITED 2015 ANNUAL REPORT
MANAGEMENT’S DISCUSSION AND ANALYSIS
20

MANAGEMENT’S DISCUSSION AND ANALYSIS
YELLOW PAGES LIMITED 2015 ANNUAL REPORT 1 3
(Recovery of) provision for income taxes
The combined statutory provincial and federal tax rates were 26.56% and 26.46% for the years ended December 31, 2014 and 2013, respectively. The Company recorded a recovery of $40.9 million for the year compared to an expense of $63.4 million in 2013.
The difference between the effective and the statutory rates in 2014 is primarily due to a recovery of incomes taxes of $84.8 million related to the cancellation of certain income tax liabilities in the fourth quarter of 2014 following the settlement of tax assessments with the Canada Revenue Agency.
The difference between the effective and the statutory rates in 2013 is due to the non-deductibility of certain expenses for tax purposes.
Earnings from investments in associates
On June 1, 2014, we acquired the remaining 70% interest in 411.ca. During 2014, we recorded earnings of $0.2 million for the period from January 1, 2014 up to the acquisition date as compared to $0.7 million for the year ended December 31, 2013. Our earnings from our investments in associates for the year ended December 31, 2013 included the amortization of intangible assets in connection with this equity investment.
Net earnings
We recorded net earnings of $188.5 million during 2014 compared with $176.5 million for 2013. This was principally explained by lower Adjusted EBITDA, more than offset by a recovery of income taxes of $84.8 million related to the cancellation of certain income tax liabilities in the fourth quarter of 2014 following the settlement of tax assessments.
MANAGEMENT’S DISCUSSION AND ANALYSIS
YELLOW PAGES LIMITED 2015 ANNUAL REPORT 21

MANAGEMENT’S DISCUSSION AND ANALYSIS
1 4 YELLOW PAGES LIMITED 2015 ANNUAL REPORT
SUMMARY OF CONSOLIDATED QUARTERLY RESULTS
QUARTERLY RESULTS (IN THOUSANDS OF CANADIAN DOLLARS – EXCEPT PER SHARE AND PERCENTAGE INFORMATION)
2015 2014 Q4 Q3 Q2 Q1 Q4 Q3 Q2 Q1
Revenues $ 208,505 $ 210,593 $ 204,771 $ 205,902 $ 215,319 $ 218,427 $ 220,579 $ 223,203 Operating costs 144,007 146,783 143,178 135,116 150,487 143,165 139,318 128,582 Income from
operations before depreciation and amortization, and restructuring and special charges (Adjusted EBITDA) 64,498 63,810 61,593 70,786 64,832 75,262 81,261 94,621
Adjusted EBITDA margin 30.9% 30.3% 30.1% 34.4% 30.1% 34.5% 36.8% 42.4%
Depreciation and amortization 20,792 21,161 20,212 18,672 22,003 19,723 18,146 18,204
Restructuring and special charges 17,168 9,113 2,551 2,002 5,714 2,746 6,784 3,115
Income from operations 26,538 33,536 38,830 50,112 37,115 52,793 56,331 73,302
Net earnings 5,866 13,155 16,510 25,524 95,225 26,542 27,551 39,222 Basic earnings per
share attributable to common shareholders $ 0.22 $ 0.49 $ 0.62 $ 0.95 $ 3.53 $ 0.98 $ 1.01 $ 1.43
Diluted earnings per share attributable to common shareholders $ 0.21
$ 0.44 $ 0.54 $ 0.81 $ 2.88 $ 0.84 $ 0.87 $ 1.22
Revenues decreased throughout the quarters, principally impacted by an overall loss of customers, as well as a decline in print spending among renewing customers. Revenues in the third and fourth quarters of 2015 were favourably impacted by the acquisition of CFDP on July 1, 2015.
Our Adjusted EBITDA margin decreased in 2015 relative to 2014 reflecting declining print revenues and the loss of margin from a change in product mix. Starting in the second quarter of 2014, our Adjusted EBITDA margin was also negatively impacted by an increasing level of investments related to the Plan. Our Adjusted EBITDA margin increased in the first quarter of 2015, principally related to the timing of various investments related to the execution of the Company’s digital transformation as well as a favourable impact related to amendments to our pension and post-retirement benefit plans. Adjusted EBITDA margins remained relatively stable starting in the second quarter of 2015, as print revenue declines, changes in the product mix and the acquisition of CFDP were offset by cost savings initiatives, lower employee related expenses and amendments to our pension and post-retirement benefit plans.
Operating costs in the first quarter of 2014 were favourably impacted by a non-recurring benefit associated with the positive outcome of a litigation. Operating costs in the first and third quarters of 2015 were positively impacted by amendments to our pension and post-retirement benefit plans, while operating costs in the fourth quarter of 2015 were favourably impacted by lower employee related costs. Operating costs in the third and fourth quarters of 2015 were increased by the costs associated with CFDP, acquired on July 1, 2015.
Depreciation and amortization increased quarter-over-quarter, with the exception of the first quarter of 2015, as a result of increased capital expenditures in connection with the deployment of platforms related to the Company’s digital transformation. The decrease in the first quarter of 2015 is mainly due to certain intangible assets being fully amortized.
As the Company advances in the deployment of the Plan and its transformation from a print centric to a digital centric organization, it initiated workforce reductions and cost containment initiatives resulting in restructuring and special charges over the quarters.
Our net earnings for the fourth quarter of 2015 were negatively impacted by lower Adjusted EBITDA and higher restructuring charges, whereas our net earnings for the fourth quarter of 2014 were favourably impacted by a recovery of income taxes of $84.8 million related to the cancellation of certain income tax liabilities following the settlement of tax assessments.
YELLOW PAGES LIMITED 2015 ANNUAL REPORT
MANAGEMENT’S DISCUSSION AND ANALYSIS
22

MANAGEMENT’S DISCUSSION AND ANALYSIS
YELLOW PAGES LIMITED 2015 ANNUAL REPORT 1 5
ANALYSIS OF FOURTH QUARTER 2015 RESULTS
Revenues
Revenues decreased by 3.2% to $208.5 million during the fourth quarter of 2015, as compared to $215.3 million for the same period last year. Revenues remained adversely impacted by a lower customer count within Yellow Pages’ core business, in addition to a decrease in print spending among renewing customers.
Digital revenues reached $129.2 million in the fourth quarter of 2015 representing a growth of 10.5% compared to the same period last year. For the fourth quarter ended December 31, 2015, consolidated digital revenues represented 62% of consolidated revenues, up from 54.3% for the same period last year. Digital revenue growth was favourably impacted by the acquisition of CFDP, accelerated customer acquisition, as well as continued growth in digital spending among Yellow Pages’ renewing customers. Excluding CFDP, digital revenues for the quarter ended December 31, 2015 grew by approximately 4% year-over-year. This performance was principally impacted by softer than anticipated growth in the Company’s national channel, Mediative, following a delay in the addition of new publishers to Mediative’s Advertising Network.
Print revenues decreased 19.4% year-over-year to reach $79.3 million during the fourth quarter of 2015, exhibiting stable annual declines.
Adjusted EBITDA
Adjusted EBITDA remained relatively stable, reaching $64.5 million during the fourth quarter of 2015 compared with $64.8 million for the same period in 2014. Adjusted EBITDA in the fourth quarter of 2015 was favourably impacted by the Corporate Realignment and lower employee related expenses, offset by lower revenues. Our Adjusted EBITDA margin for the fourth quarter of 2015 was 30.9% compared to 30.1% for the same period in 2014, favourably impacted by the corporate realignment and employee related expenses, offset by the acquisition of CFDP, which operates at a lower Adjusted EBITDA margin.
Cost of sales increased by $2.6 million to $82.1 million during the fourth quarter of 2015 compared with $79.5 million for the same period in 2014. The increase for the fourth quarter of 2015 results mainly from the acquisition of CFDP, partly offset by cost savings generated from print optimization initiatives.
Gross profit margin decreased to 60.6% for the fourth quarter of 2015 compared to 63.1% for the same period in 2014. The decrease is mainly due to the acquisition of CFDP.
General and administrative expenses decreased by $9 million to $61.9 million during the fourth quarter of 2015 compared with $71 million for the same period in 2014. The decrease is primarily due to the Corporate Realignment and employee related expenses, partly offset by the acquisition of CFDP.
Depreciation and amortization
Depreciation and amortization decreased to $20.8 million during the fourth quarter of 2015 from $22 million in the fourth quarter of 2014. The decrease is due to the timing of completion related to capital expenditures in connection with software development and ISIT equipment.
Restructuring and special charges
During the fourth quarter of 2015, we recorded restructuring and special charges of $17.2 million associated primarily with workforce reductions related to the Corporate Realignment and contract termination costs, partially offset by a curtailment gain related to the workforce reductions. During the fourth quarter of 2014, we recorded restructuring and special charges of $5.7 million, which was mainly comprised of internal reorganizations and workforce reductions, partially offset by a curtailment gain related to a workforce reduction.
Financial charges
Financial charges decreased by $1.9 million to $15.3 million during the fourth quarter of 2015 compared with $17.2 million for the same period in 2014. The decrease for the fourth quarter of 2015 is mainly attributable to a lower level of indebtedness.
Provision for (recovery of) income taxes
The combined statutory provincial and federal tax rates were 26.70% and 26.56% for the three-month periods ended December 31, 2015 and 2014, respectively. The Company recorded an expense of 47.8% for the fourth quarter of 2015 compared to a recovery of 379.2% for the fourth quarter of 2014.
The difference between the effective and the statutory rates for the fourth quarter of 2015 is due to the recognition of previously unrecognized tax attributes on assets of our foreign subsidiaries as well as non-taxable and non-deductible items.
The difference between the effective and the statutory rates for the fourth quarter of 2014 is primarily due to a recovery of incomes taxes of $84.8 million related to the cancellation of certain income tax liabilities in the fourth quarter of 2014 following the settlement of tax assessments with the Canada Revenue Agency.
MANAGEMENT’S DISCUSSION AND ANALYSIS
YELLOW PAGES LIMITED 2015 ANNUAL REPORT 23
MANAGEMENT’S DISCUSSION AND ANALYSIS
1 6 YELLOW PAGES LIMITED 2015 ANNUAL REPORT
1.6
1.7
Dec. 31, 2014
Dec 31, 2015
NET DEBT1 TO LATEST TWELVE MONTH ADJUSTED EBITDA RATIO 2
Net earnings
We recorded net earnings of $5.9 million during the fourth quarter of 2015 compared with $95.2 million for the same period last year. During the fourth quarter of 2014, we recorded a recovery of income taxes of $84.8 million related to the cancellation of certain income tax liabilities following the settlement of tax assessments. In addition, lower Adjusted EBITDA and higher restructuring and special charges during the fourth quarter of 2015 also contributed to the decrease year-over-year.
3. LIQUIDITY AND CAPITAL RESOURCES This section examines the Company’s capital structure, sources of liquidity and various financial instruments including its debt instruments.
FINANCIAL POSITION
CAPITAL STRUCTURE (IN THOUSANDS OF CANADIAN DOLLARS – EXCEPT PERCENTAGE INFORMATION)
As at December 31, 2015 December 31, 2014
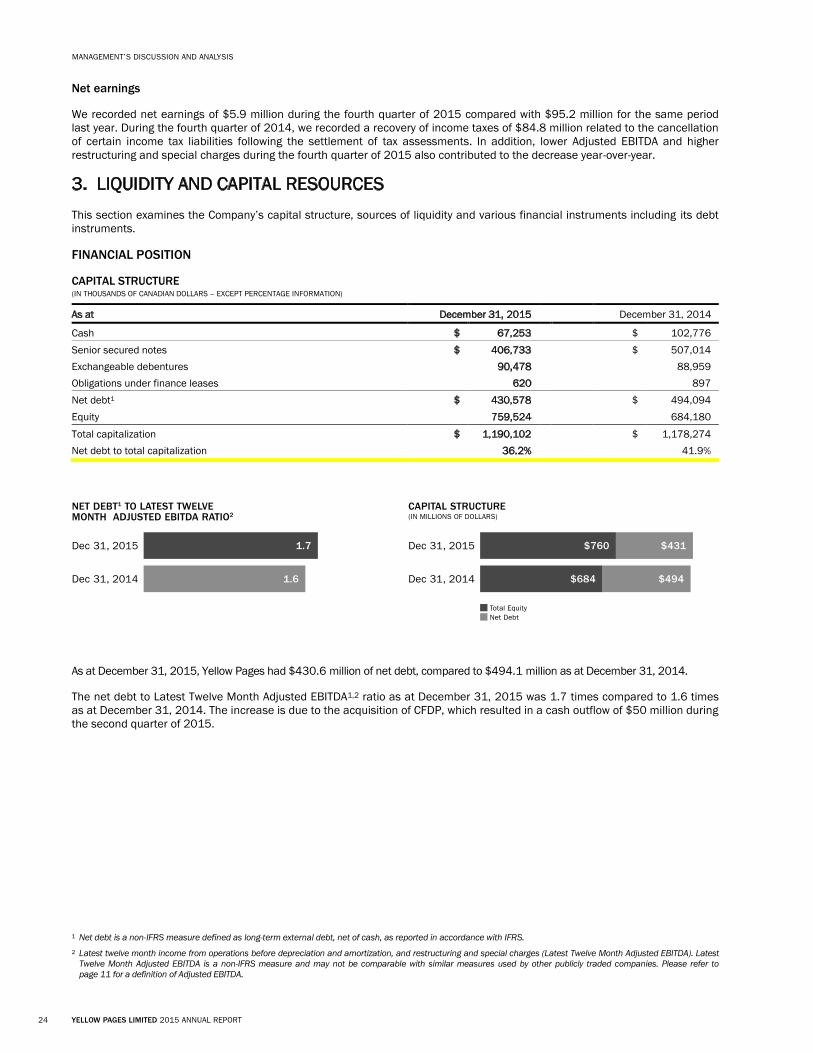
Cash $ 67,253 $ 102,776 Senior secured notes $ 406,733 $ 507,014 Exchangeable debentures 90,478 88,959 Obligations under finance leases 620 897 Net debt1 $ 430,578 $ 494,094 Equity 759,524 684,180
Total capitalization $ 1,190,102 $ 1,178,274 Net debt to total capitalization 36.2% 41.9%
As at December 31, 2015, Yellow Pages had $430.6 million of net debt, compared to $494.1 million as at December 31, 2014.
The net debt to Latest Twelve Month Adjusted EBITDA1,2 ratio as at December 31, 2015 was 1.7 times compared to 1.6 times as at December 31, 2014. The increase is due to the acquisition of CFDP, which resulted in a cash outflow of $50 million during the second quarter of 2015.
1 Net debt is a non-IFRS measure defined as long-term external debt, net of cash, as reported in accordance with IFRS. 2 Latest twelve month income from operations before depreciation and amortization, and restructuring and special charges (Latest Twelve Month Adjusted EBITDA). Latest
Twelve Month Adjusted EBITDA is a non-IFRS measure and may not be comparable with similar measures used by other publicly traded companies. Please refer to page 11 for a definition of Adjusted EBITDA.
$684
$760
$494
$431
Dec. 31, 2014
Dec. 31, 2015
CAPITAL STRUCTURE (IN MILLIONS OF DOLLARS)
Total Equity Net Debt
YELLOW PAGES LIMITED 2015 ANNUAL REPORT
MANAGEMENT’S DISCUSSION AND ANALYSIS
24
NET DEBT1 TO LATEST TWELVE MONTH ADJUSTED EBITDA RATIO2
CAPITAL STRUCTURE(IN MILLIONS OF DOLLARS)
Dec 31, 2014 Dec 31, 2014
1.7 $760 $431
$4941.6 $684
Dec 31, 2015 Dec 31, 2015
Total Equity Net Debt

MANAGEMENT’S DISCUSSION AND ANALYSIS
YELLOW PAGES LIMITED 2015 ANNUAL REPORT 1 7
Asset-Based Loan
In August 2013, the Company, through its subsidiary Yellow Pages Digital & Media Solutions Limited, entered into a five-year $50 million asset-based loan (ABL) expiring in August 2018. The ABL is being used for general corporate purposes. Through the ABL, the Company has access to the funds in the form of prime rate loans, Banker’s acceptance (BA) equivalent loans or letters of credit. The ABL is secured by a first priority lien over the receivables of the Company. The ABL is subject to an availability reserve of $5 million if the Company’s trailing twelve-month fixed charge coverage ratio is below 1.1 times. As at December 31, 2015, the Company had $4.2 million of letters of credit issued and outstanding under the ABL. As such, $45.8 million of the ABL was available as at December 31, 2015. Interest is calculated based either on the BA Rate or the Canadian Prime Rate plus an applicable margin.
As at December 31, 2015, the Company was in compliance with all covenants under the loan agreement governing the ABL.
Senior Secured Notes
On December 20, 2012, the Company, through its subsidiary Yellow Pages Digital & Media Solutions Limited, issued $800 million of 9.25% senior secured notes (the Senior Secured Notes) maturing November 30, 2018. Interest on the Senior Secured Notes is payable in cash, quarterly in arrears, in equal instalments on the last day of February, May, August and November of each year.
The Company repaid a total of $100.3 million in 2015 and $393.3 million since December 20, 2012 of its Senior Secured Notes, thereby reducing the balance from $800 million to $406.7 million as at December 31, 2015.
As at December 31, 2015, the Company was in compliance with all covenants under the indenture governing the Senior Secured Notes.
Mandatory Redemption
Pursuant to the indenture governing the Senior Secured Notes, the Company is required to use an amount equal to 75% of its consolidated Excess Cash Flow for the immediately preceding six-month period ending March 31 or September 30, as applicable, to redeem on a semi-annual basis on the last day of May and November of each year, commencing on May 31, 2013, at a redemption price equal to 100% of the principal amount thereof from holders on a pro rata basis, subject to the Company maintaining a minimum cash balance, including availability on the ABL, of $75 million immediately following the mandatory redemption payment, subject to certain conditions. The $75 million minimum cash balance condition is subject to a reduction in certain cases as provided in the indenture governing the Senior Secured Notes. Excess Cash Flow, as defined in the indenture governing the Senior Secured Notes, means the aggregate cash flow from operating activities adjusted for, among other things, payments relating to interest, taxes, long-term employee compensation plans, certain pension plan contribution payments and the acquisition of property and equipment and intangible assets. For purposes of determining the consolidated Excess Cash Flow, deductions for capital expenditures and information systems/information technology expenses are each subject to an annual deduction limit of $50 million. Under other circumstances, the Company may also have to make additional repayments on the Senior Secured Notes (refer to the indenture governing the Senior Secured Notes).
The Company was required to make minimum annual aggregate mandatory redemption payments of $125 million for 2014 and 2015 combined. The Company made mandatory redemption payments of $139.6 million in 2014, thereby exceeding the $125 million minimum aggregate mandatory redemption payment. As such, the Company has completed its minimum aggregate mandatory redemption payments and is only required to use an amount equal to 75% of its consolidated Excess Cash Flow to redeem on a semi-annual basis the Senior Secured Notes.
Optional Redemption
The Company may redeem all or part of the Senior Secured Notes at its option, upon not less than 30 nor more than 60 days prior notice, at a redemption price equal to:
In the case of a redemption occurring prior to May 31, 2017, 105% of the principal amount thereof, plus accrued and unpaid interest, if any, to the redemption date; or
In the case of a redemption occurring on or after May 31, 2017, 100% of the principal amount thereof, plus accrued and unpaid interest, if any, to the redemption date.
Exchangeable Debentures On December 20, 2012, the Company, through its subsidiary Yellow Pages Digital & Media Solutions Limited, issued $107.5 million of senior subordinated exchangeable debentures (the Exchangeable Debentures) due November 30, 2022.
Interest on the Exchangeable Debentures accrues at a rate of 8% per annum if, for the applicable interest period, it is paid in cash or 12% per annum, for the applicable interest period, if the Company makes a Payment in Kind (PIK) election to pay interest in respect of all or any part of the then outstanding Exchangeable Debentures in additional Exchangeable Debentures. Interest on the Exchangeable Debentures is payable semi-annually in arrears in equal instalments on the last day of May and November of each year.
MANAGEMENT’S DISCUSSION AND ANALYSIS
YELLOW PAGES LIMITED 2015 ANNUAL REPORT 25

MANAGEMENT’S DISCUSSION AND ANALYSIS
1 8 YELLOW PAGES LIMITED 2015 ANNUAL REPORT
As at December 31, 2015, the Company was in compliance with all covenants under the indenture governing the Exchangeable Debentures.
Exchange Option
The Exchangeable Debentures are exchangeable at the holder’s option into common shares at any time at an exchange price per common share equal to $19.04, subject to adjustment for specified transactions.
Optional Redemption
The Company may, at any time on or after the date on which all of the Senior Secured Notes have been repaid in full, redeem all or part of the Exchangeable Debentures at its option, upon not less than 30 nor more than 60 days’ prior notice, at a redemption price equal to:
In the case of a redemption occurring prior to May 31, 2021, 110% of the principal amount thereof, plus accrued and unpaid interest, if any, to the redemption date; or
In the case of a redemption occurring on or after May 31, 2021, 100% of the principal amount thereof, plus accrued and unpaid interest, if any, to the redemption date.
CREDIT RATINGS
DBRS LIMITED STANDARD AND POOR’S RATING SERVICES
B/Issuer rating – positive trend B/Corporate credit rating – stable outlook B (high)/Credit rating for Senior Secured Notes BB-/Credit rating for Senior Secured Notes CCC (high)/Credit rating for Exchangeable Debentures CCC+/Credit rating for Exchangeable Debentures
Liquidity
The Company’s principal source of liquidity is cash generated from operations and cash on hand. The Company expects to generate sufficient liquidity to fund capital expenditures, working capital requirements and current obligations, including the mandatory repayments on the Senior Secured Notes. As at February 10, 2016, the Company had approximately $64.3 million of cash and $45.8 million available under the ABL.
Options
On December 20, 2012, as part of the implementation of Yellow Pages’ recapitalization transaction, a new stock option plan (the Stock Option Plan) was adopted. The Stock Option Plan is intended to attract and retain the services of selected employees (the Participants) of Yellow Pages who are in a position to make a material contribution to the successful operation of the business, provide meaningful incentive to management to lead Yellow Pages through the transition and transformation of its business and to more closely align the interests of management with those of the shareholders of Yellow Pages Limited. A maximum of 1,290,612 stock options may be granted under the Stock Option Plan.
The stock options expire approximately seven years after the grant date and Participants are required to hold 25% of the common shares received pursuant to the exercise of the stock options until the Participants meet the ownership guidelines which apply to their respective position.
Share data
OUTSTANDING SHARE DATA
As at February 11, 2016 December 31, 2015 December 31, 2014
Common shares outstanding 28,063,919 28,063,919 27,976,661 Exchangeable Debentures outstanding1 5,624,422 5,624,422 5,624,422 Common share purchase warrants outstanding 2,995,498 2,995,498 2,995,506 Stock options outstanding² 522,950 522,950 480,200
1 As at February 11, 2016, Yellow Pages had $107.1 million principal amount of Exchangeable Debentures outstanding, which amount is exchangeable into 5,624,422 common shares of Yellow Pages Limited at an exchange price of $19.04, subject to adjustment for specified transactions pursuant to the indenture governing the Exchangeable Debentures.
2 Included in the stock options outstanding balance of 522,950 as at February 11, 2016 and December 31, 2015 are 117,000 and 78,000 stock options exercisable as at those same dates. There were no stock options exercisable as at December 31, 2014.
YELLOW PAGES LIMITED 2015 ANNUAL REPORT
MANAGEMENT’S DISCUSSION AND ANALYSIS
26

MANAGEMENT’S DISCUSSION AND ANALYSIS
YELLOW PAGES LIMITED 2015 ANNUAL REPORT 1 9
Contractual Obligations and Other Commitments
Contractual obligations (IN THOUSANDS OF CANADIAN DOLLARS)
Payments due for the years following December 31, 2015 Total 1 year 2 – 3 years 4 – 5 years After 5 years
Long-term debt1,2 $ 406,733 $ 98,268 $ 308,465 $ ― $ ― Obligations under finance leases1 620 262 272 86 ― Exchangeable Debentures1 107,089 ― ― ― 107,089 Operating leases 145,726 21,771 28,796 12,921 82,238 Other 69,462 39,881 24,699 850 4,032 Total contractual obligations $ 729,630 $ 160,182 $ 362,232 $ 13,857 $ 193,359
1 Principal amount. 2 The repayment of the Senior Secured Notes may vary subject to the Excess Cash Flow under the indenture governing the Senior Secured Notes.
Obligations under finance leases
We enter into finance lease agreements for office equipment and software. As at December 31, 2015, minimum payments under these finance leases up to 2019 totalled $0.6 million.
Operating leases
We rent our premises and office equipment under various operating leases. As at December 31, 2015, minimum payments under these operating leases up to 2034 totalled $145.7 million.
Purchase obligations
We use the services of outside suppliers to distribute and print our directories and have entered into long-term agreements with a number of these suppliers. These agreements expire between 2016 and 2038. We also have purchase obligations under service contracts for both operating and capital expenditures. As at December 31, 2015, we have an obligation to purchase services for $69.4 million over the next five years and thereafter. Cash from operations will be used to fund these purchase obligations.
Pension Obligations
YP sponsors a pension plan registered with the Canada Revenue Agency and the Financial Services Commission of Ontario with defined benefit (DB) for employees hired prior to January 1, 2006, and defined contribution (DC) components for the non-Québec based employees hired on or after January 1, 2006 (the YP Pension Plan) as well as a DC plan registered with the Régie des Rentes du Québec (the YP Québec Plan), for the Québec based employees hired on or after January 1, 2006. Both plans together cover substantially all employees of the Company.
As at December 31, 2015, the DB component of the YP Pension Plan’s assets totalled $486.4 million and were invested in a diversified portfolio of Canadian fixed income securities and Canadian and international equity securities. Its rate of return on assets was 5% for 2015, 0.7% above our benchmark portfolio.
The most recent actuarial valuation of the defined benefit component of the YP Pension Plan for funding purposes was performed as at May 31, 2015. The May 2015 valuation resulted in a solvency deficit of $100.5 million to be funded over a five-year period. The next actuarial valuation will be due no later than May 31, 2016.
In 2015, the Company made annual contributions equivalent to the current service cost (the Annual Employer Cost) of $44.6 million, including $29.3 million to fund the deficit. Total cash payments are expected to amount to $41.4 million for 2016, of which $26.5 million will be to fund the deficit.
MANAGEMENT’S DISCUSSION AND ANALYSIS
YELLOW PAGES LIMITED 2015 ANNUAL REPORT 27

MANAGEMENT’S DISCUSSION AND ANALYSIS
2 0 YELLOW PAGES LIMITED 2015 ANNUAL REPORT
SOURCES AND USES OF CASH (IN THOUSANDS OF CANADIAN DOLLARS)
For the years ended December 31, 2015 2014
Cash flows from operating activities Cash flows from operations $ 208,270 $ 163,013 Change in operating assets and liabilities (10,704) (6,506)
$ 197,566 $ 156,507
Cash flows used in investing activities Additions to intangible assets $ (69,190) $ (69,179) Acquisition of property and equipment (6,231) (14,771) Business acquisitions, net of cash acquired (51,063) (33,504) Proceeds from the settlement of a note receivable ― 14,100 Other ― (116)
$ (126,484) $ (103,470)
Cash flows used in financing activities Repayment of long-term debt $ (100,650) $ (140,098) Purchase of restricted shares (6,838) (12,450) Issuance of common shares upon exercise of stock options 883 ―
$ (106,605) $ (152,548)
Cash flows from operating activities
Cash flows from operations
Cash flows from operations increased by $45.3 million from $163 million for the year ended December 31, 2014 to $208.3 million for the same period in 2015. Cash flows generated from income taxes increased by $98.2 million, mainly due to net income taxes received of $46.7 million in 2015 as a result of a tax settlement covering prior years, compared to net income taxes paid of $51.5 million during the year ended December 31, 2014 relative to the 2013 taxation year for which no installments had been made as well as installments for 2014. This amount was offset by lower cash Adjusted EBITDA of $56.8 million.
Change in operating assets and liabilities
The change in operating assets and liabilities for the year ended December 31, 2015 generated an outflow of $10.7 million compared with $6.5 million for the same period last year. The outflow for the year ended December 31, 2015 is due principally to the increased level of payment of variable compensation, partially offset by lower deferred publication costs resulting from a new print directory distribution model implemented in 2015. During the year ended December 31, 2014, operating assets and liabilities remained relatively stable.
Cash flows used in investing activities
Cash used in investing activities amounted to $126.5 million for the year ended December 31, 2015 compared with $103.5 million for the same period last year. During the year ended December 31, 2015, we invested in software development and ISIT equipment in the amount of $69.2 million and $6.2 million, respectively, as compared to $69.2 million and $14.8 million, respectively, during the same period last year. Capital expenditures incurred in 2014 and 2015 are related to investments required to maintain the integrity of our infrastructure as well as the development and implementation of new technologies and software aimed at accelerating our transformation into Canada’s leading local digital company.
On July 1, 2015, we acquired all the shares of the CFDP network for a purchase price of $50.2 million. In 2014, we acquired the remaining interest in 411.ca for a net consideration of $22.7 million, as well as the shares of Bookenda and the assets of dine.TO for a total consideration of $10.8 million. These investing activities were partly offset by cash proceeds of $14.1 million received as a result of the settlement of a note receivable.
YELLOW PAGES LIMITED 2015 ANNUAL REPORT
MANAGEMENT’S DISCUSSION AND ANALYSIS
28
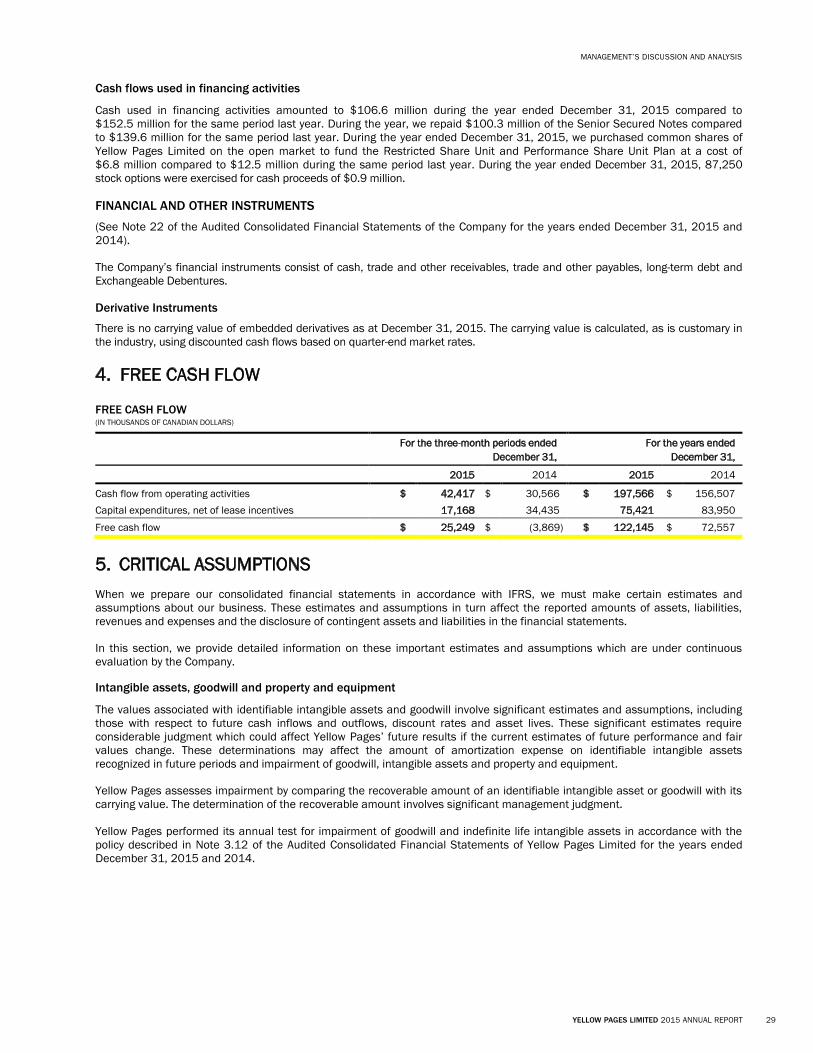
MANAGEMENT’S DISCUSSION AND ANALYSIS
YELLOW PAGES LIMITED 2015 ANNUAL REPORT 2 1
Cash flows used in financing activities
Cash used in financing activities amounted to $106.6 million during the year ended December 31, 2015 compared to $152.5 million for the same period last year. During the year, we repaid $100.3 million of the Senior Secured Notes compared to $139.6 million for the same period last year. During the year ended December 31, 2015, we purchased common shares of Yellow Pages Limited on the open market to fund the Restricted Share Unit and Performance Share Unit Plan at a cost of $6.8 million compared to $12.5 million during the same period last year. During the year ended December 31, 2015, 87,250 stock options were exercised for cash proceeds of $0.9 million.
FINANCIAL AND OTHER INSTRUMENTS (See Note 22 of the Audited Consolidated Financial Statements of the Company for the years ended December 31, 2015 and 2014).
The Company’s financial instruments consist of cash, trade and other receivables, trade and other payables, long-term debt and Exchangeable Debentures.
Derivative Instruments
There is no carrying value of embedded derivatives as at December 31, 2015. The carrying value is calculated, as is customary in the industry, using discounted cash flows based on quarter-end market rates.
4. FREE CASH FLOW
FREE CASH FLOW (IN THOUSANDS OF CANADIAN DOLLARS)
For the three-month periods ended December 31,
For the years ended December 31,
2015 2014 2015 2014
Cash flow from operating activities $ 42,417 $ 30,566 $ 197,566 $ 156,507 Capital expenditures, net of lease incentives 17,168 34,435 75,421 83,950
Free cash flow $ 25,249 $ (3,869) $ 122,145 $ 72,557
5. CRITICAL ASSUMPTIONS When we prepare our consolidated financial statements in accordance with IFRS, we must make certain estimates and assumptions about our business. These estimates and assumptions in turn affect the reported amounts of assets, liabilities, revenues and expenses and the disclosure of contingent assets and liabilities in the financial statements.
In this section, we provide detailed information on these important estimates and assumptions which are under continuous evaluation by the Company.
Intangible assets, goodwill and property and equipment
The values associated with identifiable intangible assets and goodwill involve significant estimates and assumptions, including those with respect to future cash inflows and outflows, discount rates and asset lives. These significant estimates require considerable judgment which could affect Yellow Pages’ future results if the current estimates of future performance and fair values change. These determinations may affect the amount of amortization expense on identifiable intangible assets recognized in future periods and impairment of goodwill, intangible assets and property and equipment.
Yellow Pages assesses impairment by comparing the recoverable amount of an identifiable intangible asset or goodwill with its carrying value. The determination of the recoverable amount involves significant management judgment.
Yellow Pages performed its annual test for impairment of goodwill and indefinite life intangible assets in accordance with the policy described in Note 3.12 of the Audited Consolidated Financial Statements of Yellow Pages Limited for the years ended December 31, 2015 and 2014.
MANAGEMENT’S DISCUSSION AND ANALYSIS
YELLOW PAGES LIMITED 2015 ANNUAL REPORT 29

MANAGEMENT’S DISCUSSION AND ANALYSIS
2 2 YELLOW PAGES LIMITED 2015 ANNUAL REPORT
The recoverable amount of the cash generating units (CGUs) was determined based on the value-in-use approach using a discounted cash flow model which relies on significant key assumptions, including after-tax cash flows forecasted over an extended period of time, terminal growth rates and discount rates. We use published statistics or seek advice where possible when determining the assumptions we use. Details of Yellow Pages’ impairment reviews are disclosed in Note 4 of the Audited Consolidated Financial Statements of Yellow Pages Limited for the years ended December 31, 2015 and 2014.
Employee future benefits
The present value of the defined benefit obligation is determined by discounting the estimated future cash outflows using interest rates of high-quality corporate bonds that are denominated in the currency in which the benefits will be paid and that have terms to maturity approximating the terms of the related pension liability. Determination of the benefit expense requires assumptions such as the expected return on assets available to fund pension obligations, the discount rate to measure obligations, the projected age of employees upon retirement, the expected rate of future compensation and the expected healthcare cost trend rate. For the purpose of calculating the expected return on plan assets, the assets are valued at fair value. Actual results may differ from results which are estimated based on assumptions.
Income taxes
Estimation of income taxes includes evaluating the recoverability of deferred tax assets based on an assessment of Yellow Pages’ ability to utilize the underlying future tax deductions against future taxable income before they expire. Yellow Pages’ assessment is based upon existing tax laws and estimates of future taxable income. If the assessment of Yellow Pages’ ability to utilize the underlying future tax deductions changes, Yellow Pages would be required to recognize more or fewer of the tax deductions as assets, which would decrease or increase the income tax expense in the period in which this is determined.
Yellow Pages is subject to taxation in numerous jurisdictions. Significant judgment is required in determining the consolidated provision for taxation. There are many transactions and calculations for which the ultimate tax determination is uncertain during the ordinary course of business. Yellow Pages maintains provisions for uncertain tax positions that it believes appropriately reflect its risk with respect to tax matters under active discussion, audit, dispute or appeal with tax authorities, or which are otherwise considered to involve uncertainty. These provisions for uncertain tax positions are made using the best estimate of the amount expected to be paid based on a qualitative assessment of all relevant factors. Yellow Pages reviews the adequacy of these provisions at each statement of financial position date. However, it is possible that at some future date an additional liability could result from audits by tax authorities. Where the final tax outcome of these matters is different from the amounts that were initially recorded, such differences will affect the tax provisions in the period in which such determination is made.
ACCOUNTING STANDARDS
Certain new standards, interpretations and amendments to existing standards have been published and are mandatory for Yellow Pages Limited’s accounting periods beginning on or after January 1, 2016. The new standards which are considered to be relevant to Yellow Pages Limited’s operations are as follows:
Amendments to IAS 16 — Property, Plant and Equipment, and IAS 38 — Intangible Assets: Clarification of Acceptable Methods of Depreciation and Amortization
In May 2014, the International Accounting Standards Board (IASB) issued Amendments to International Accounting Standard (IAS) 16 – Property, Plant and Equipment and IAS 38 – Intangible Assets: Clarification of Acceptable Methods of Depreciation and Amortization to clarify that the use of revenue-based methods to calculate depreciation is not appropriate as revenue generated by an activity that includes the use of an asset generally reflects factors other than the consumption of the economic benefits embodied in the related asset. The IASB also clarified that revenue is generally presumed to be an inappropriate basis for measuring the consumption of the economic benefits embodied in an intangible asset. This presumption may be rebutted in certain limited circumstances. These amendments must be applied prospectively for annual periods beginning on or after January 1, 2016.
The Amendments to IAS 16 and IAS 38 will not have a significant impact on the consolidated financial statements of Yellow Pages Limited.
IAS 1 — Presentation of financial statements In December 2014, the IASB issued amendments to IAS 1 — Presentation of financial statements as part of its initiative to improve presentation and disclosure in financial reports. The amendments to IAS 1 clarify the existing presentation and disclosure requirements as they relate to materiality, subtotals and disaggregation. The amendments also provide additional guidance on the application of professional judgment to disclosure requirements when preparing the notes to the financial statements.
These amendments are effective for annual periods beginning on or after January 1, 2016, and are not expected to have a significant impact on the consolidated financial statements of Yellow Pages Limited.
YELLOW PAGES LIMITED 2015 ANNUAL REPORT
MANAGEMENT’S DISCUSSION AND ANALYSIS
30

MANAGEMENT’S DISCUSSION AND ANALYSIS
YELLOW PAGES LIMITED 2015 ANNUAL REPORT 2 3
IFRS 15 — Revenue from Contracts with Customers
In May 2014, the IASB issued IFRS 15 — Revenue from Contracts with Customers. This new standard outlines a single comprehensive model for companies to use when accounting for revenue arising from contracts with customers. It supersedes the IASB’s current revenue recognition standards, including IAS 18 — Revenue and related interpretations. The core principle of IFRS 15 is that revenue is recognized at an amount that reflects the consideration to which the company expects to be entitled in exchange for those goods or services, applying the following five steps:
Identify the contract with a customer;
Identify the performance obligations in the contract;
Determine the transaction price;
Allocate the transaction price to the performance obligations in the contract; and
Recognize revenue when (or as) the company satisfies a performance obligation.
This new standard also provides guidance relating to the accounting for contract costs as well as for the measurement and recognition of gains and losses arising from the sale of certain non-financial assets. Additional disclosures will also be required under the new standard, which is effective for annual reporting periods beginning on or after January 1, 2018, with earlier application permitted. For comparative amounts, companies have the option of using either a full retrospective approach or a modified retrospective approach as set out in the new standard. Yellow Pages Limited continues to evaluate the impact this standard will have on its consolidated financial statements.
IFRS 9 — Financial Instruments
In July 2014, the IASB issued the final version of IFRS 9 — Financial Instruments. IFRS 9 replaces the requirements in IAS 39 — Financial Instruments: Recognition and Measurement for classification and measurement of financial assets and liabilities. The new standard introduces a single classification and measurement approach for financial instruments, which is driven by cash flow characteristics and the business model in which an asset is held. This single, principle-based approach replaces existing rule-based requirements and results in a single impairment model being applied to all financial instruments. IFRS 9 also modified the hedge accounting model to incorporate the risk management practices of an entity.
Additional disclosures will also be required under the new standard. The new standard will come into effect for annual periods beginning on or after January 1, 2018 with early adoption permitted. Yellow Pages Limited continues to evaluate the impact this standard will have on its consolidated financial statements.
IFRS 16 — Leases In January 2016, the IASB issued IFRS 16 — Leases. It supersedes the IASB’s current lease standard, IAS 17, which required lessees and lessors to classify their leases as either finance leases or operating leases and to account for those two types of leases differently. It did not require lessees to recognize assets and liabilities arising from operating leases, but it did require lessees to recognize assets and liabilities arising from finance leases.
IFRS 16 sets out the principles for the recognition, measurement, presentation and disclosure of leases. It introduces a single lessee accounting model and requires a lessee to recognize assets and liabilities for all leases with a term of more than twelve months and for which the underlying asset is not of low value. A lessee is required to recognize a right-of-use asset representing its right to use the underlying leased asset and a lease liability representing its obligation to make lease payments.
IFRS 16 contains disclosure requirements for lessees and lessors. This new standard will come into effect for annual periods beginning on or after January 1, 2019. Earlier application is permitted for companies that apply IFRS 15 — Revenue from Contracts with Customers at or before the date of initial application of IFRS 16. Yellow Pages Limited continues to assess the impact this standard will have on its consolidated financial statements.
MANAGEMENT’S DISCUSSION AND ANALYSIS
YELLOW PAGES LIMITED 2015 ANNUAL REPORT 31

MANAGEMENT’S DISCUSSION AND ANALYSIS
2 4 YELLOW PAGES LIMITED 2015 ANNUAL REPORT
6. RISKS AND UNCERTAINTIES The following section examines the major risks and uncertainties that could materially affect YP’s future business results.
Understanding and managing risks are important parts of YP’s strategic planning process. The Board requires that our senior management identify and properly manage the principal risks related to our business operations. To understand and manage risks at YP, our Board and senior management analyze risks in three major categories:
1. Strategic risks - which are primarily external to the business;
2. Financial risks - generally related to matters addressed in the Financial Risk Management Policy and in the Pension Statement of Investment Policy and Procedures; and
3. Operational risks - related principally to risks across key functional areas of the organization.
YP has put in place certain guidelines in order to seek to manage the risks to which it may be exposed. Please refer to the “Risk Factors” section of our AIF for a complete description of these risk factors. Despite these guidelines, the Company cannot provide assurances that any such efforts will be successful.
Substantial competition could reduce the market share of the Corporation and could have a material adverse effect on the Corporation, its business, results from operations and financial condition
The Corporation competes with other directory, advertising media and classified advertising businesses and across various media and platforms. This includes the internet, newspapers, television, radio, mobile telecommunication devices, magazines, billboards and direct mail advertising. In particular, the directories business faces substantial competition due to increased online penetration, through the use of online search engines and social networking organizations. The Corporation may not be able to compete effectively with these online competitors, some of which may have greater resources. The Corporation’s internet strategy and its directories business may be adversely affected if major search engines build local sales forces or otherwise begin to more effectively reach local businesses for local commercial search services. These competitors may reduce their prices to increase their market share or may be able to offer their services at lower costs than the Corporation can.
The Corporation may be forced to reduce its prices or offer and perform other services in order to remain competitive. The Corporation’s failure to compete effectively with its current or future competitors could have a number of impacts such as a reduction in its advertiser base, lower rates and increased costs. This could have a material adverse effect on the Corporation, its business, results from operations and financial condition.
We actively monitor and assess our competition and determine our competitiveness within each of our markets. We address this competition by ensuring we best meet customer needs through targeted offers and pricing.
We continuously enhance our value proposition with initiatives targeting the following objectives:
Enhancement of our product offerings and extension of our services to customers;
Improvement of user experience; and
Growth of traffic to our network of properties.
We also use multimedia campaigns to promote our brand and deliver our message to the market reinforcing the value our segments offer.
A higher than anticipated rate of decline in print revenue resulting from changes in preferences and consumer habits could have a material adverse effect on the Corporation, its business, results from operations and financial condition
The Corporation could be materially adversely affected if the usage of print telephone directories declines at a rate higher than anticipated. The development of new technologies and the widespread use of internet is causing changes in preferences and consumer habits. The usage of internet-based products providing information, formerly exclusively available in print directories, has increased rapidly. The internet has become increasingly accessible as an advertising medium for businesses of all sizes. Further, the use of the internet, including as a means to transact commerce through mobile devices, has resulted in new technologies and services that compete with traditional advertising mediums. In particular, this has a significant influence on print products, and the decrease in usage gradually leads to lower advertising revenues. References to print business directories may decline faster than expected as users increasingly turn to digital and interactive media delivery devices for local commercial search information.
YELLOW PAGES LIMITED 2015 ANNUAL REPORT
MANAGEMENT’S DISCUSSION AND ANALYSIS
32

MANAGEMENT’S DISCUSSION AND ANALYSIS
YELLOW PAGES LIMITED 2015 ANNUAL REPORT 2 5
The inability of the Corporation to successfully enhance and expand its offering of digital and new media products could have a material adverse effect on the Corporation, its business, results from operations and financial condition
The transition from print to digital causes uncertainties surrounding whether and when new product introductions will compensate for the declining trend in print revenues. If revenue from the Corporation’s digital products does not increase significantly, the Corporation’s cash flow, results of operations and financial condition will be materially adversely affected.
The Corporation expects to derive a greater portion of its total revenue from its digital and other new media products, as directory usage continues to shift from print directories to digital and other new media products. The Corporation’s transformational expansion towards digital and new media products is subject to a variety of challenges and risks, including the following:
the Corporation may not continue to grow usage on its digital properties at the same rate as other providers or may grow at a slower rate than currently anticipated;
internet usage as a source of information and a medium for advertising may not continue to grow, or may grow at a slower rate than currently anticipated, as a result of factors that the Corporation cannot predict or control;
the Corporation may incur substantial additional costs and expenses related to investments in its information technology, modifications to existing products and development of new products and this may reduce profit margins in the future;
the Corporation may be unable to develop and market new products in a timely and efficient manner, as the Corporation’s markets are characterised by rapidly changing technology, introductions and enhancements to existing products and shifting advertising customer and end-user demands, including technology preferences;
the Corporation may be unable to improve its information technology systems so as to efficiently manage increased levels of traffic on the Corporation’s digital properties and provide new services and products;
the Corporation may be unable to keep apprised of changes to search engines’ terms of service or algorithms, which could cause the Corporation’s digital properties, or its advertising customers’ digital properties, to be excluded from or ranked lower in search results or make it more difficult or more expensive for the Corporation to provide search engine marketing and search engine optimisation solutions to its advertising customers;
the Corporation’s advertising customers may be unwilling to grow their investment in digital advertising; and
the Corporation may be unable to increase the prices of its products and services in the future.
If any of the above-mentioned risks were to occur, the Corporation’s digital revenue, as well as its business, results from operations and financial condition could be materially adversely affected.
The continuing transition in the media and publishing industries towards more digital and targeted content is driving us to develop new products that leverage the demand for new media while ensuring that our print products remain a key component of our advertisers’ media mix.
The Corporation’s business depends on the usage of its online and mobile properties and failure to protect traffic across the Corporation’s digital properties could impair its ability to grow revenues and expand its business
The success of numerous of our customers’ marketing campaigns is dependent on how well they can attract valuable audiences. The Corporation will invest in order to protect digital audiences across its network of online and mobile properties by enhancing the quality, completeness and relevance of the content distributed to its properties, and by providing compelling verticalized sites and applications for local discovery. The Corporation may not be able to protect or grow traffic across its digital properties and such investments may not prove to be cost-effective. There can be no assurance that current traffic or potential growth in traffic across the Corporation’s digital properties may maintain or increase advertising customer renewal rates and/or annual spending, or lead to a measurable increase in advertising customers.
The inability of the Corporation to generate sufficient funds from operations, debt financings, equity financings or refinancing transactions could have a material adverse effect on the Corporation, its business, results from operations and financial condition
The ability of the Corporation to make scheduled payments under its indebtedness will depend on, among other things, its future operating performance. There can be no assurance that the Corporation will be able to generate sufficient cash from its operations to pay its debt obligations. The Corporation’s ability to generate sufficient funds from operations, debt financings, equity financings or refinancing transactions is, to a large extent, subject to economic, financial, competitive, operational and other factors, many of which are beyond the Corporation’s control.
There can be no assurance that the Corporation will continue to be able to obtain on a timely basis sufficient funds on terms acceptable to the Corporation to provide adequate liquidity and to finance the operating and capital expenditures necessary to overcome the challenges associated with the transformation of its business and support its business strategy if cash flows from operations and cash on hand are insufficient.
MANAGEMENT’S DISCUSSION AND ANALYSIS
YELLOW PAGES LIMITED 2015 ANNUAL REPORT 33
MANAGEMENT’S DISCUSSION AND ANALYSIS
2 6 YELLOW PAGES LIMITED 2015 ANNUAL REPORT
Failure to generate sufficient funds, whether from operations or debt or equity financings or refinancing transactions, could require the Corporation to delay or abandon some of its anticipated expenditures or to modify its business strategy and could have a material adverse effect on the Corporation, its business, results from operations and financial condition. Furthermore, competitors with greater liquidity or their ability to raise money more easily and on less onerous terms could create a competitive disadvantage for the Corporation.
The Corporation’s substantial indebtedness could adversely affect its efforts to refinance or reduce its indebtedness and cou ld have a material adverse effect on the Corporation, its business, results from operations and financial condition
The Corporation’s substantial amount of debt could have material adverse effects on the Corporation, its business, results from operations and financial condition. For example, it could:
increase the Corporation’s vulnerability to adverse economic and industry conditions;
require the Corporation to dedicate a substantial portion of its cash flows from operations to make payments on its debt, thereby reducing funds available for operations, future business opportunities or other purposes;
limit the Corporation’s flexibility in planning for, or reacting to, changes in its business and its industry;
place the Corporation at a competitive disadvantage compared to its competitors that have less debt; and
limit the Corporation’s ability to obtain additional financing, if needed, for working capital, capital expenditures, acquisitions, debt service requirements or other purposes.
In addition, the indenture governing the Senior Secured Notes, the indenture governing the Exchangeable Debentures and the ABL contain a number of financial and other restrictive covenants, including restrictions on the incurrence of additional indebtedness, the payment of dividends and other payment restrictions, the creation of liens, sale and leaseback transactions, mergers, consolidations and sales of assets and certain transactions with affiliates and its business activities. A failure to comply with such obligations could result in a default which, if not cured or waived, could permit acceleration of the relevant indebtedness. If the indebtedness under the indenture governing the Senior Secured Notes, the indenture governing the Exchangeable Debentures or the ABL, as the case may be, were to be accelerated, there can be no assurance that the Corporation would have sufficient liquidity or access to capital to repay in full that indebtedness.
Incremental contributions by the Corporation to its pension plans could have a material adverse effect on the Corporation, its business, results from operations and financial condition
The Corporation is currently and may be required to make incremental contributions to its pension plans in the future depending on various factors including future returns on pension plan assets, long-term interest rates and changes in pension regulations, which may have a materially negative effect on the Corporation’s liquidity and results from operations. The Corporation is currently making incremental contributions to its pension plans to reduce its actuarial solvency deficits.
The funding requirements of the Corporation’s pension plans, resulting from valuations of its pension plan assets and liabilities, depend on a number of factors, including actual returns on pension plan assets, long-term interest rates, plan demographic and pension regulations. Changes in these factors could cause actual future contributions to significantly differ from the Corporation’s current estimates and could require the Corporation to make incremental contributions to its pension plans in the future and, therefore, could have a materially negative effect on the Corporation’s liquidity, business, results from operations and financial condition.
There is no assurance that the Corporation’s pension plans will be able to earn their assumed rate of return. A material portion of the Corporation’s pension plans’ assets is invested in public equity securities. As a result, the ability of the Corporation’s pension plans to earn the rate of return that management has assumed depends significantly on the performance of capital markets. The market conditions also impact the discount rate used to calculate the Corporation’s solvency obligations and thereby could also significantly affect the Corporation’s cash funding requirements.
Failure by either the Corporation or the Telco Partners to fulfill the obligations set forth in the agreements between the Corporation and the Telco Partners could result in a material adverse effect on the Corporation, its business, results from operations and financial condition
We have a Billing and Collection Services Agreement with Bell Canada (up to 2017), with TELUS (up to 2031), with MTS Inc. (up to 2036) and with Bell Canada Inc. (as successor to Bell Aliant Regional Communications LP) (up to 2037). Through these agreements, our billing is included as a separate line item on the telephone bills of Bell, TELUS, MTS Inc. and Bell Canada Inc. customers who use our services. Bell Canada, TELUS, MTS Inc. and Bell Canada Inc. (the Telco Partners) contract with third parties to conduct monthly billing of customers who use them as their local telephone service providers. In addition, the Telco Partners provide collection services for the Corporation with those customers who are also their customers. Additionally, the Corporation has entered into publishing agreements with each Telco Partner. If the Corporation fails to perform its obligations under these agreements and the agreements are consequently terminated by such Telco Partner, other agreements with such Telco Partners may also be terminated, including the Bell Canada Trademark License Agreement, the TELUS Trademark License Agreement, the MTS Inc. Branding and Trademark Agreement and the Bell Canada Inc. Branding and Trademark Agreement, as well as non-competition covenants we benefit from with such Telco Partners.
YELLOW PAGES LIMITED 2015 ANNUAL REPORT
MANAGEMENT’S DISCUSSION AND ANALYSIS
34

MANAGEMENT’S DISCUSSION AND ANALYSIS
YELLOW PAGES LIMITED 2015 ANNUAL REPORT 2 7
We have agreements with outside service suppliers to print and distribute our directories and publications. These agreements are for services that are integral to our business.
The failure of the Telco Partners or any of our other suppliers to fulfill their contractual obligations under these agreements could result in a material adverse effect on our business.
Customers who do not use the Telco Partners as their local telephone provider as well as all new customers are billed directly by the Corporation. Our internal billing and collection services are cost-effective and can be grown as our customer base expands.
Failure by the Corporation to adequately protect and maintain its brands and trademarks, as well as third party infringement of such, could have a material adverse effect on the Corporation, its business, results from operations and financial condition
The Corporation relies heavily on its existing brands and trademarks for a significant portion of its revenues. Failure to adequately maintain the strength and integrity of these brands and trademarks, or to develop new brands and trademarks, could adversely affect our results from operations and our financial condition.
It is possible that third parties could infringe upon, misappropriate or challenge the validity of the Corporation’s trademarks or our other intellectual property rights. This could have a material adverse effect on our business, our financial condition or our operating results. The actions that the Corporation takes to protect its trademarks and other proprietary rights may not be adequate. Litigation may be necessary to enforce or protect the Corporation's intellectual property rights, its trade secrets or to determine the validity and scope of the proprietary rights of others. We cannot ensure that we will be able to prevent infringement of our intellectual property rights or misappropriation of our proprietary information.
Any such infringement or misappropriation could harm any competitive advantage we currently derive, or may derive, from our proprietary rights. Third parties may assert infringement claims against the Corporation. Any such claims and any resulting litigation could subject the Corporation to significant liability for damages. An adverse judgment arising from any litigation of this type could require the Corporation to design around a third party's patent or to license alternative technology from another party. In addition, litigation may be time-consuming and expensive to defend against and could result in the diversion of the Corporation's time and resources. Any claims from third parties may also result in limitations on the Corporation's ability to use the intellectual property subject to these claims.
We devote significant resources to the development and protection of our trademarks and take a proactive approach to protecting our brand exclusivity.
Work stoppages and other labour disturbances could have a material adverse effect on the Corporation, its business, results from operations and financial condition
Certain non-management employees of the Corporation are unionized. Current union agreements range between one to five years in duration and are subject to expiration at various dates in the future. Four of these agreements have expired and are being renegotiated. If the Corporation is unable to renew these agreements as they come up for renegotiation from time to time, it could result in work stoppages and other labour disturbances which could have a material adverse effect on our business. Additionally, if a greater percentage of the Corporation’s workforce becomes unionized, this could have a material adverse effect on our business, results from operations and financial condition.
We manage labour relations risk by ensuring that collective agreements’ expiration dates are strategically positioned to minimize potential disruptions on both a regional (geographic) or on a functional (sales and clerical) basis. Also, every negotiation process to renew a collective agreement includes a cross-functional team in which all business units are represented. This team has the responsibility to develop and ultimately implement an effective contingency plan that would allow the Corporation to continue its day to day operations with minimal disruptions in the event of a labour dispute.
Challenge by tax authorities of the Corporation’s position on certain income tax matters could have a material adverse effect on the Corporation, its business, results from operations and financial condition
In the normal course of the Corporation's activities, the tax authorities are carrying out ongoing reviews. In that respect, the Corporation is of the view that all expenses claimed by the different entities of the group are reasonable and deductible and that the cost amount and capital cost allowance claims of such entities' depreciable properties have been correctly determined. There is no assurance that the tax authorities may not challenge these positions. Such challenge, if successful, may have a material adverse effect on the Corporation, its business, results from operations and financial condition.
MANAGEMENT’S DISCUSSION AND ANALYSIS
YELLOW PAGES LIMITED 2015 ANNUAL REPORT 35

MANAGEMENT’S DISCUSSION AND ANALYSIS
2 8 YELLOW PAGES LIMITED 2015 ANNUAL REPORT
The loss of key relationships or changes in the level of service provided by internet portals, search engines and individual websites could have a material adverse effect on the Corporation, its business, results from operations and financial condition
The Corporation has entered into agreements with several internet portals, search engines and individual websites to promote its online directories. These agreements make the Corporation’s content and customer advertising more easily accessible by these portals, search engines and individual websites. These agreements allow the Corporation to generate a higher volume of traffic than it would on its own as well as generate business leads for its advertisers, while retaining the client relationship. In return, the portals, search engines and individual websites obtain business through the Corporation from advertisers who would not otherwise transact with them. Loss of key relationships or changes in the level of service provided by these internet portals, search engines and individual websites could impact performance of the Corporation’s internet marketing solutions. In addition, internet marketing services are provided by many other competitors within the markets the Corporation serves and its clients could choose to work with other, sometimes larger providers of these services, or with other search engines directly. The foregoing could have a material adverse effect on the Corporation, its business, results from operations and financial condition.
The failure of the Corporation’s computers and communications systems could have a material adverse effect on the Corporation, its business, results from operations and financial condition
The Corporation’s business activities rely significantly on the efficient and uninterrupted operation of computers and communications systems as well as those of third parties. The Corporation’s media properties, sales and advertising processing, data storage, production, billing, collection and day-to-day operations could be adversely impaired by the failure of such technology, which could in turn have a material adverse effect on the Corporation, its business, results from operations and financial condition.
In addition, the Corporation’s computer and ISIT systems may be vulnerable to damage or interruption from a variety of sources and its disaster recovery systems may be deemed ineffective. Any failure of these systems could impair the Corporation’s business. This could have a material adverse effect on the Corporation, its business, results from operations and financial condition.
The Corporation has in place redundant facilities as well as a disaster recovery plan designed to restore the operability of the target system, application, or computer facility infrastructure at an alternate site after an emergency.
The Corporation’s inability to attract and retain key personnel could have a material adverse effect on the Corporation, its business, results from operations and financial condition
The success of the Corporation depends on the abilities, experience and personal efforts of senior management of the Corporation, including their ability to retain and attract skilled employees. The Corporation is also dependent on the number and experience of its sales representatives and ISIT employees. The loss of the services of such key personnel could have a material adverse effect on the Corporation, its business, its results from operations and financial condition.
We continually invest in our workforce to develop a strong digital culture. We offer training programs, tools and resources to elevate digital literacy and promote change management across all facets of the organization.
The Corporation might be required to record additional impairment charges
The Corporation may be subject to impairment losses that would reduce its reported assets and earnings. Economic, legal, regulatory, competitive, contractual and other factors may affect the value of identifiable intangible assets. If any of these factors impair the value of these assets, accounting rules would require the Corporation to reduce their carrying value and recognize an additional charge, which would reduce the reported assets and earnings of the Corporation in the year the impairment charge is recognized.
YELLOW PAGES LIMITED 2015 ANNUAL REPORT
MANAGEMENT’S DISCUSSION AND ANALYSIS
36

MANAGEMENT’S DISCUSSION AND ANALYSIS
YELLOW PAGES LIMITED 2015 ANNUAL REPORT 2 9
Declines in, or changes to, the real estate industry could have a material adverse effect on the Corporation, its business, results from operations and financial condition
On July 1, 2015, Yellow Pages acquired CFDP, growing the Corporation into a leading digital real estate marketplace. As a result of the acquisition, the Corporation has a greater presence in the real estate listing business. The CFDP business and financial performance are affected by the health of, and changes to, the real estate industry. Home-buying patterns are sensitive to economic conditions and tend to decline or grow more slowly during economic downturns. A decrease in real estate activities could lead to reductions in the purchase of package offerings by home sellers. CFDP is subject to rules and regulations in the real estate industry, which may change from time to time in a way that may restrict or complicate CFDP’s ability to deliver its products and harm CFDP’s business and operating results. Declines or disruptions in the real estate market could reduce demand for CFDP’s products and could harm its business and operating results. This could have a material adverse effect on the Corporation, its business, results from operations and financial condition.
7. CONTROLS AND PROCEDURES As a public entity, we must take every step to ensure that material information regarding our reports filed or submitted under securities legislation fairly presents the financial information of YP. Responsibility for this resides with management, including the President and Chief Executive Officer and the Chief Financial Officer. Management is responsible for establishing, maintaining and evaluating disclosure controls and procedures, as well as internal control over financial reporting.
Disclosure Controls and Procedures (DC&P) The evaluation of the design and effectiveness of DC&P (as defined in National Instrument 52-109) was performed under the supervision of the President and Chief Executive Officer and the Chief Financial Officer. They concluded that the Company’s DC&P were effective, as at December 31, 2015.
Internal Control over Financial Reporting (ICFR) The design and effectiveness of ICFR (as defined in National Instruments 52-109) were evaluated under the supervision of the President and Chief Executive Officer and Chief Financial Officer. Based on the evaluations, they concluded that the Company’s ICFR was effective, as at December 31, 2015.
During the quarter beginning on October 1, 2015 and ended on December 31, 2015, no changes were made to the Company’s ICFR that has materially affected, or is reasonably likely to materially affect, the Company’s ICFR.
MANAGEMENT’S DISCUSSION AND ANALYSIS
YELLOW PAGES LIMITED 2015 ANNUAL REPORT 37

YELLOW PAGES LIMITED
2 ANNUAL REPORT 2015
Independent Auditor’s Report
To the Shareholders of Yellow Pages Limited
We have audited the accompanying consolidated financial statements of Yellow Pages Limited, which comprise the consolidated statements of financial position as at December 31, 2015 and December 31, 2014, and the consolidated income statements, consolidated statements of comprehensive income, consolidated statements of changes in equity and consolidated statements of cash flows for the years then ended, and a summary of significant accounting policies and other explanatory information.
Management’s Responsibility for the Consolidated Financial Statements Management is responsible for the preparation and fair presentation of these consolidated financial statements in accordance with International Financial Reporting Standards, and for such internal control as management determines is necessary to enable the preparation of consolidated financial statements that are free from material misstatement, whether due to fraud or error.
Auditor’s Responsibility Our responsibility is to express an opinion on these consolidated financial statements based on our audits. We conducted our audits in accordance with Canadian generally accepted auditing standards. Those standards require that we comply with ethical requirements and plan and perform the audit to obtain reasonable assurance about whether the consolidated financial statements are free from material misstatement.
An audit involves performing procedures to obtain audit evidence about the amounts and disclosures in the consolidated financial statements. The procedures selected depend on the auditor’s judgment, including the assessment of the risks of material misstatement of the consolidated financial statements, whether due to fraud or error. In making those risk assessments, the auditor considers internal control relevant to the entity’s preparation and fair presentation of the consolidated financial statements in order to design audit procedures that are appropriate in the circumstances, but not for the purpose of expressing an opinion on the effectiveness of the entity’s internal control. An audit also includes evaluating the appropriateness of accounting policies used and the reasonableness of accounting estimates made by management, as well as evaluating the overall presentation of the consolidated financial statements.
We believe that the audit evidence we have obtained in our audits is sufficient and appropriate to provide a basis for our audit opinion.
Opinion In our opinion, the consolidated financial statements present fairly, in all material respects, the financial position of Yellow Pages Limited as at December 31, 2015 and December 31, 2014, and its financial performance and its cash flows for the years then ended in accordance with International Financial Reporting Standards.
(signed) Deloitte LLP 1
February 11, 2016 Montréal, Québec ____________________ 1 CPA auditor, CA, public accountancy permit No. A120501
YELLOW PAGES LIMITED 2015 ANNUAL REPORT38

YELLOW PAGES LIMITED
ANNUAL REPORT 2015 3
CONSOLIDATED STATEMENTS OF FINANCIAL POSITION (IN THOUSANDS OF CANADIAN DOLLARS)
As at December 31, 2015 December 31, 2014
ASSETS CURRENT ASSETS Cash $ 67,253 $ 102,776 Trade and other receivables (Note 22) 123,826 132,278 Prepaid expenses 8,728 8,220 Deferred publication costs 61,216 69,852 Income taxes receivable (Note 14) 3,192 47,798 TOTAL CURRENT ASSETS 264,215 360,924 NON-CURRENT ASSETS
Deferred publication costs 7,348 8,153 Financial and other assets (Note 22) 4,162 4,366 Property and equipment (Note 7) 30,554 36,431 Intangible assets (Note 8) 1,369,781 1,334,967 Goodwill (Note 5) 26,829 – Deferred income taxes (Note 14) 7,738 4,719
TOTAL NON-CURRENT ASSETS 1,446,412 1,388,636 TOTAL ASSETS $ 1,710,627 $ 1,749,560
LIABILITIES AND EQUITY CURRENT LIABILITIES Trade and other payables (Note 9) $ 73,627 $ 82,048 Provisions (Note 10) 67,641 65,840 Deferred revenues 23,386 28,461 Current portion of long-term debt (Note 12) 98,530 103,152 TOTAL CURRENT LIABILITIES 263,184 279,501 NON-CURRENT LIABILITIES
Provisions (Note 10) 4,451 2,577 Deferred credits and other 6,538 8,936 Deferred income taxes (Note 14) 94,970 53,386 Post-employment benefits (Note 11) 182,659 227,262 Long-term debt (Note 12) 308,823 404,759 Exchangeable debentures (Note 13) 90,478 88,959
TOTAL NON-CURRENT LIABILITIES 687,919 785,879 TOTAL LIABILITIES 951,103 1,065,380 CAPITAL AND RESERVES 6,600,966 6,600,178 DEFICIT (5,841,442) (5,915,998) TOTAL EQUITY 759,524 684,180 TOTAL LIABILITIES AND EQUITY $ 1,710,627 $ 1,749,560
The accompanying notes are an integral part of these consolidated financial statements.
Approved on behalf of Yellow Pages Limited by
Robert F. MacLellan, Director David A. Lazzarato, Director
YELLOW PAGES LIMITED 2015 ANNUAL REPORT 39

YELLOW PAGES LIMITED
4 ANNUAL REPORT 2015
CONSOLIDATED INCOME STATEMENTS (IN THOUSANDS OF CANADIAN DOLLARS, EXCEPT SHARE AND PER SHARE INFORMATION)
For the years ended December 31, 2015 2014
Revenues $ 829,771 $ 877,528 Operating costs (Note 18) 569,084 561,552 Income from operations before depreciation and amortization, and restructuring
and special charges 260,687 315,976 Depreciation and amortization (Notes 7 and 8) 80,837 78,076 Restructuring and special charges (Note 10) 30,834 18,359
Income from operations 149,016 219,541 Financial charges, net (Note 19) 60,922 72,116
Earnings before income taxes and earnings from investments in associates 88,094 147,425 Provision for (recovery of) income taxes (Note 14) 27,039 (40,937) Earnings from investments in associates – (178) Net earnings $ 61,055 $ 188,540
Basic earnings per share $ 2.29 $ 6.95
Weighted average shares outstanding – basic earnings per
share (Note 16) 26,688,369 27,128,062 Diluted earnings per share $ 2.05 $ 5.81
Weighted average shares outstanding – diluted earnings per
share (Note 16) 33,466,228 33,709,338
The accompanying notes are an integral part of these consolidated financial statements.
YELLOW PAGES LIMITED 2015 ANNUAL REPORT40

YELLOW PAGES LIMITED
ANNUAL REPORT 2015 5
CONSOLIDATED STATEMENTS OF COMPREHENSIVE INCOME (IN THOUSANDS OF CANADIAN DOLLARS)
For the years ended December 31, 2015 2014
Net earnings $ 61,055 $ 188,540 Other comprehensive income (loss): Items that may be reclassified subsequently to net earnings Reclassification adjustment of accumulated foreign currency translation loss
realized upon disposal of investment in associate (Note 6) – 1,598 Items that will not be reclassified subsequently to net earnings Actuarial gains (losses) (Note 11) 18,447 (59,997) Income taxes relating to items that will not be reclassified subsequently to net
earnings (4,946) 15,935
13,501 (44,062)
Other comprehensive income (loss) 13,501 (42,464) Total comprehensive income $ 74,556 $ 146,076
The accompanying notes are an integral part of these consolidated financial statements.
YELLOW PAGES LIMITED 2015 ANNUAL REPORT 41

YELLOW PAGES LIMITED
6 ANNUAL REPORT 2015
CONSOLIDATED STATEMENTS OF CHANGES IN EQUITY (IN THOUSANDS OF CANADIAN DOLLARS)
For the years ended December 31,
Shareholders’ Capital
(Note 15) Restricted
Shares Warrants (Note 15)
Compound Financial
Instruments1
Stock-based Compensation and
Other Reserves Balance, December 31, 2014 $ 4,030,325 $ (18,981) $ 1,456 $ 3,619 $ 126,706
Other comprehensive income Net earnings
Total comprehensive income Restricted shares settled 854 (854)
Restricted shares (Note 17) (6,838) 5,915
Stock options granted (Note 17) 828
Exercise of stock options (Note 17) 1,203 (320)
Balance, December 31, 2015 $ 4,031,528 $ (24,965) $ 1,456 $ 3,619 $ 132,275
Shareholders’ Capital
(Note 15) Restricted
Shares Warrants (Note 15)
Compound Financial
Instruments1
Stock-based Compensation and
Other Reserves Balance, December 31, 2013 $ 4,029,869 $ (6,630) $ 1,456 $ 3,633 $ 121,188
Other comprehensive income (loss) Net earnings
Total comprehensive income Restricted shares settled 99 (99) Restricted shares (Note 17) (12,450) 4,443 Stock options granted (Note 17) 1,174
Exchange of exchangeable debentures (Note 13) 456 (14)
Balance, December 31, 2014 $ 4,030,325 $ (18,981) $ 1,456 $ 3,619 $ 126,706
1 The equity component of the exchangeable debentures presented above is net of income taxes of $1.3 million (2014 - $1.3 million).
The accompanying notes are an integral part of these consolidated financial statements.
YELLOW PAGES LIMITED 2015 ANNUAL REPORT42

YELLOW PAGES LIMITED
ANNUAL REPORT 2015 7
2015
Reduction of
Capital Reserve Total Capital
and Reserves Deficit Total Equity $ 2,457,053 $ 6,600,178 $ (5,915,998) $ 684,180
1 13,501 13,501
61,055 61,055
74,556 74,556
(923) (923)
828 828
883 883
$ 2,457,053 $ 6,600,966 $ (5,841,442) $ 759,524
2014
Reduction of
Capital Reserve
Foreign Currency Translation
(Notes 6 and 19) Total Capital
and Reserves Deficit Total Equity
$ 2,457,053 $ (1,598) $ 6,604,971 $ (6,060,476) $ 544,495
1,598 1,598 (44,062) (42,464)
188,540 188,540
1,598 1,598 144,478 146,076
(8,007) (8,007)
1,174 1,174
442 442
$ 2,457,053 $ $ 6,600,178 $ (5,915,998) $ 684,180
YELLOW PAGES LIMITED 2015 ANNUAL REPORT 43

YELLOW PAGES LIMITED
8 ANNUAL REPORT 2015
CONSOLIDATED STATEMENTS OF CASH FLOWS (IN THOUSANDS OF CANADIAN DOLLARS)
For the years ended December 31, 2015 2014 OPERATING ACTIVITIES
Net earnings $ 61,055 $ 188,540 Adjusting items
Depreciation and amortization 80,837 78,076 Restructuring and other special charges (Note 10) 30,834 18,359 Stock-based compensation expense 6,731 6,459 Earnings from investments in associates (178) Provision for (recovery of) income taxes recognized in net earnings 27,039 (40,937) Financial charges recognized in net earnings 60,922 72,116 Past service costs (Note 11) (6,618) Other non-cash items 8,420 3,584 Change in operating assets and liabilities (10,704) (6,506)
Funding of post-employment benefit plans in excess of costs (26,629) (18,453) Restructuring and other special charges paid (Note 10) (26,464) (28,230) Income taxes received (paid), net 46,664 (51,544) Interest paid (54,521) (64,779)
197,566 156,507 INVESTING ACTIVITIES
Additions to intangible assets (69,190) (69,179) Acquisition of property and equipment (6,231) (14,771) Business acquisitions, net of cash acquired (Note 5) (51,063) (33,504) Proceeds from the settlement of a note receivable (Note 22) 14,100 Other (116)
(126,484) (103,470) FINANCING ACTIVITIES
Repayment of long-term debt (100,650) (140,098) Purchase of restricted shares (Note 17) (6,838) (12,450) Issuance of common shares upon exercise of stock options (Note 17) 883
(106,605) (152,548) NET DECREASE IN CASH (35,523) (99,511) CASH, BEGINNING OF YEAR 102,776 202,287 CASH, END OF YEAR $ 67,253 $ 102,776
Supplemental disclosure of cash flow information (Note 20)
The accompanying notes are an integral part of these consolidated financial statements.
YELLOW PAGES LIMITED 2015 ANNUAL REPORT44

YELLOW PAGES LIMITED Notes to the Consolidated Financial Statements – December 31, 2015
(all tabular amounts are in thousands of Canadian dollars, except share information)
ANNUAL REPORT 2015 9
1. DESCRIPTION
Yellow Pages Limited, through its subsidiaries, offers local and national businesses access to digital and print media and marketing solutions to reach consumers in all the provinces and territories of Canada. References herein to Yellow Pages Limited (or the “Company”) represent the financial position, financial performance, cash flows and disclosures of Yellow Pages Limited and its subsidiaries on a consolidated basis.
Yellow Pages Limited’s registered head office is located at 16, Place du Commerce, Montreal, Québec, Canada, H3E 2A5 and the common shares of Yellow Pages Limited are listed on the Toronto Stock Exchange (“TSX”) under the symbol “Y”.
On January 1, 2015, YPG Financing Inc. and Yellow Pages Group Corp., wholly-owned subsidiaries of the Company, amalgamated through a vertical short-form amalgamation, and the amalgamated entity bears the corporate name of Yellow Pages Digital & Media Solutions Limited. Except for the name change, the by-laws and the articles of Yellow Pages Digital & Media Solutions Limited are the same as the previous by-laws and articles of YPG Financing Inc.
The Board of Directors (the “Board”) approved the consolidated financial statements for the years ended December 31, 2015 and 2014 and authorized their publication on February 11, 2016.
2. REVISED STANDARDS
STANDARDS, INTERPRETATIONS AND AMENDMENTS TO PUBLISHED STANDARDS THAT ARE ISSUED BUT NOT YET EFFECTIVE
Certain new standards, interpretations and amendments to existing standards have been published and are mandatory for Yellow Pages Limited’s accounting periods beginning on or after January 1, 2016. The new standards which are considered to be relevant to Yellow Pages Limited’s operations are as follows:
Amendments to IAS 16 — Property, Plant and Equipment, and IAS 38 — Intangible Assets: Clarification of Acceptable Methods of Depreciation and Amortization In May 2014, the International Accounting Standards Board (“IASB”) issued Amendments to IAS 16 – Property, Plant and Equipment and IAS 38 – Intangible Assets: Clarification of Acceptable Methods of Depreciation and Amortization to clarify that the use of revenue-based methods to calculate depreciation is not appropriate as revenue generated by an activity that includes the use of an asset generally reflects factors other than the consumption of the economic benefits embodied in the related asset. The IASB also clarified that revenue is generally presumed to be an inappropriate basis for measuring the consumption of the economic benefits embodied in an intangible asset. This presumption may be rebutted in certain limited circumstances. These amendments must be applied prospectively for annual periods beginning on or after January 1, 2016.
The Amendments to IAS 16 and IAS 38 will not have a significant impact on the consolidated financial statements of Yellow Pages Limited.
IAS 1 — Presentation of Financial Statements
In December 2014, the IASB issued amendments to IAS 1 — Presentation of Financial Statements as part of its initiative to improve presentation and disclosure in financial reports. The amendments to IAS 1 clarify the existing presentation and disclosure requirements as they relate to materiality, order of the notes, subtotals, accounting policies and disaggregation. The amendments also provide additional guidance on the application of professional judgment to disclosure requirements when preparing the notes to the financial statements.
These amendments are effective for annual periods beginning on or after January 1, 2016, and are not expected to have a significant impact on the consolidated financial statements of Yellow Pages Limited.
YELLOW PAGES LIMITED 2015 ANNUAL REPORT 45
NOTES TO THE CONSOLIDATED FINANCIAL STATEMENTS – DECEMBER 31, 2015(ALL TABULAR AMOUNTS ARE IN THOUSANDS OF CANADIAN DOLLARS, EXCEPT SHARE INFORMATION)

YELLOW PAGES LIMITED Notes to Consolidated Financial Statements – December 31, 2015 (all tabular amounts are in thousands of Canadian dollars, except share information)
10 ANNUAL REPORT 2015
IFRS 15 — Revenue from Contracts with Customers In May 2014, the IASB issued IFRS 15 — Revenue from Contracts with Customers. This new standard outlines a single comprehensive model for companies to use when accounting for revenue arising from contracts with customers. It supersedes the IASB’s current revenue recognition standards, including IAS 18 — Revenue and related interpretations. The core principle of IFRS 15 is that revenue is recognized at an amount that reflects the consideration to which the company expects to be entitled in exchange for those goods or services, applying the following five steps:
Identify the contract with a customer;
Identify the performance obligations in the contract;
Determine the transaction price;
Allocate the transaction price to the performance obligations in the contract; and
Recognize revenue when (or as) the company satisfies a performance obligation.
This new standard also provides guidance relating to the accounting for contract costs as well as for the measurement and recognition of gains and losses arising from the sale of certain non-financial assets. Additional disclosures will also be required under the new standard, which is effective for annual reporting periods beginning on or after January 1, 2018 with earlier adoption permitted. For comparative amounts, companies have the option of using either a full retrospective approach or a modified retrospective approach as set out in the new standard. Yellow Pages Limited continues to evaluate the impact this standard will have on its consolidated financial statements.
IFRS 9 — Financial Instruments In July 2014, the IASB issued the final version of IFRS 9 — Financial Instruments. IFRS 9 replaces the requirements in IAS 39 — Financial Instruments: Recognition and Measurement for classification and measurement of financial assets and liabilities. The new standard introduces a single classification and measurement approach for financial instruments, which is driven by cash flow characteristics and the business model in which an asset is held. This single, principle-based approach replaces existing rule-based requirements and results in a single impairment model being applied to all financial instruments. IFRS 9 also modified the hedge accounting model to incorporate the risk management practices of an entity.
Additional disclosures will also be required under the new standard. The new standard will come into effect for annual periods beginning on or after January 1, 2018 with early adoption permitted. Yellow Pages Limited continues to evaluate the impact this standard will have on its consolidated financial statements.
IFRS 16 — Leases In January 2016, the IASB issued IFRS 16 — Leases. It supersedes the IASB’s current lease standard, IAS 17, which required lessees and lessors to classify their leases as either finance leases or operating leases and to account for those two types of leases differently. It did not require lessees to recognize assets and liabilities arising from operating leases, but it did require lessees to recognize assets and liabilities arising from finance leases.
IFRS 16 sets out the principles for the recognition, measurement, presentation and disclosure of leases. It introduces a single lessee accounting model and requires a lessee to recognize assets and liabilities for all leases with a term of more than twelve months and for which the underlying asset is not of low value. A lessee is required to recognize a right-of-use asset representing its right to use the underlying leased asset and a lease liability representing its obligation to make lease payments.
IFRS 16 contains disclosure requirements for lessees and lessors. This new standard will come into effect for annual periods beginning on or after January 1, 2019. Earlier application is permitted for companies that apply IFRS 15 — Revenue from Contracts with Customers at or before the date of initial application of IFRS 16. Yellow Pages Limited continues to assess the impact this standard will have on its consolidated financial statements.
3. BASIS OF PRESENTATION AND SIGNIFICANT ACCOUNTING POLICIES 3.1 STATEMENT OF COMPLIANCE These consolidated financial statements of Yellow Pages Limited and its subsidiaries were prepared by management in accordance with IFRS. These financial statements have been prepared in accordance with the following significant accounting policies which have been applied consistently to all periods presented throughout the consolidated entities.
3.2 BASIS OF MEASUREMENT The consolidated financial statements have been prepared on the historical cost basis except for the revaluation of certain assets and liabilities (including derivative instruments) at fair value as explained in the policies below.
3.3 FUNCTIONAL AND PRESENTATION CURRENCY The consolidated financial statements are presented in Canadian dollars, which is the functional and presentation currency of Yellow Pages Limited.
YELLOW PAGES LIMITED 2015 ANNUAL REPORT46
NOTES TO THE CONSOLIDATED FINANCIAL STATEMENTS – DECEMBER 31, 2015(ALL TABULAR AMOUNTS ARE IN THOUSANDS OF CANADIAN DOLLARS, EXCEPT SHARE INFORMATION)

YELLOW PAGES LIMITED Notes to the Consolidated Financial Statements – December 31, 2015
(all tabular amounts are in thousands of Canadian dollars, except share information)
ANNUAL REPORT 2015 11
3.4 BASIS OF CONSOLIDATION
3.4.1 Subsidiaries Subsidiaries that are directly controlled by Yellow Pages Limited or indirectly controlled through other consolidated subsidiaries are fully consolidated. Subsidiaries are all entities over which Yellow Pages Limited exercises control.
Subsidiaries are fully consolidated from the effective date of acquisition up to the effective date of disposal. Intercompany assets and liabilities and transactions between fully consolidated companies are eliminated. Gains and losses on internal transactions with controlled companies are fully eliminated. Accounting policies and methods are modified where necessary to ensure consistency of accounting treatment at the Yellow Pages Limited level.
3.4.2 Associates Associates are all entities over which Yellow Pages Limited has a significant influence over the entity’s management and operating and financial policy, without exercising control, and generally implies holding 20% to 50% of the voting rights.
Investments in associates are accounted for using the equity method and are initially measured at cost. Subsequently, the share in profits or losses of the associate attributable to equity holders of Yellow Pages Limited is recognized in net earnings. Included in the recognized share of net earnings is the amortization of the amortizable assets based on their fair value at the acquisition date.
3.4.3 Business combinations Acquisitions of subsidiaries and businesses are accounted for using the acquisition method. The cost of the acquisition is measured at the aggregate of the fair values, at the date of exchange, of assets given, liabilities incurred or assumed, and equity instruments issued by Yellow Pages Limited in exchange for control of the acquiree. Transaction costs associated with business acquisitions are recognized in the income statement, as incurred.
Where a business combination is achieved in stages, Yellow Pages Limited’s previously held interests in the acquired entity are re-measured to fair value at the acquisition date (the date Yellow Pages Limited attains control) and the resulting gain or loss, if any, is recognized in the income statement.
3.5 CASH Cash consist of funds on deposit and, from time to time, highly liquid investments with a purchased maturity of three months or less.
3.6 FINANCIAL ASSETS Financial assets are classified into the following specified categories: financial assets “at fair value through profit or loss” (“FVTPL”), “held-to-maturity” investments, “available-for-sale” (“AFS”) financial assets and “loans and receivables”. The classification depends on the nature and purpose of the financial assets and is determined at the time of initial recognition.
Financial assets designated as FVTPL are carried at fair value. Changes in fair value are recorded in the income statement. Held-to-maturity investments and loans and receivables are measured at amortized cost using the effective interest method. AFS financial assets are recorded at fair value on the date of acquisition, and are adjusted to fair value at each reporting date. The corresponding unrealized gains and losses are recorded in other comprehensive income (“OCI”) and are reclassified to other income (expense) in the income statements when realized or when an impairment is determined.
A financial asset is de-recognized if the contractual rights to the cash flows from the financial asset expire or the asset is transferred and the transfer qualifies for de-recognition. Cash and trade and other receivables are included in the loans and receivables category.
3.6.1 Effective interest method The effective interest method is a method of calculating the amortized cost of a financial asset (liability) and of allocating interest (income) expense over the relevant period. The effective interest rate is the rate that exactly discounts estimated future cash flows (including all fees that form an integral part of the effective interest rate, transaction costs and other premiums or discounts) through the expected life of the financial asset (liability) or, where appropriate, a shorter period.
3.6.2 Impairment of financial assets Financial assets, other than those at FVTPL, are assessed for indicators of impairment at each statement of financial position date. Financial assets are impaired when there is objective evidence that, as a result of one or more events that occurred after the initial recognition of the financial asset, the estimated future cash flows of the investment have been impacted.
For certain categories of financial assets, such as trade and other receivables, assets that are assessed not to be impaired individually, are subsequently assessed for impairment on a collective basis.
YELLOW PAGES LIMITED 2015 ANNUAL REPORT 47
NOTES TO THE CONSOLIDATED FINANCIAL STATEMENTS – DECEMBER 31, 2015(ALL TABULAR AMOUNTS ARE IN THOUSANDS OF CANADIAN DOLLARS, EXCEPT SHARE INFORMATION)

YELLOW PAGES LIMITED Notes to Consolidated Financial Statements – December 31, 2015 (all tabular amounts are in thousands of Canadian dollars, except share information)
12 ANNUAL REPORT 2015
3.7 DEFERRED PUBLICATION COSTS An intangible asset is recognized for direct and incremental publication costs incurred during the sale, manufacturing and distribution of telephone print directories as well as the sale, provisioning and fulfillment of digital products and services. The intangible asset represents costs that will be recovered in future periods, when the related directories revenues are recognized. An intangible asset is capitalized when the following conditions are met:
Yellow Pages Limited has control over the contract for which the costs were incurred;
the control results from past events;
future economic benefits are expected to flow to Yellow Pages Limited; and
the asset is identifiable, non-monetary and without physical substance.
Deferred publication costs are initially measured at cost and are amortized over the same period in which the related revenues are recognized.
3.8 PROPERTY AND EQUIPMENT Property and equipment are recognized at cost less accumulated depreciation and impairment losses. The various components of property and equipment are depreciated separately based on their estimated useful lives and therefore, their depreciation periods are significantly different. The cost of an asset includes the expenses that are directly attributable to its acquisition. All other borrowing costs are recognized in the income statement in the period in which they are incurred. Yellow Pages Limited has not capitalized any borrowing costs during the periods presented.
Subsequent costs are included in the carrying value of the asset or recognized as a separate component, where necessary, if it is probable that future economic benefits will flow to Yellow Pages Limited and the cost of the asset can be reliably measured. All other repair and maintenance costs are expensed in the year they are incurred.
Depreciation is calculated using the straight-line method, based on the capitalized costs, less any residual value over a period corresponding to the useful life of each asset. Assets held under finance leases are depreciated over their expected useful lives on the same basis as owned assets or, when shorter, the term of the relevant lease.
As at December 31, 2015, the expected useful lives are as follows:
Office equipment 10 years Computer equipment 3 years Other equipment 3 – 12 years Leasehold improvements Shorter of term of lease or useful life
The residual value, the depreciation method and the useful life of an asset are reviewed at a minimum, annually.
Property and equipment are tested for impairment when an indication of impairment loss exists. When the asset’s recoverable amount is less than its net carrying value, an impairment loss is recognized. Where an individual asset does not generate independent cash inflows, Yellow Pages Limited determines the recoverable amount of the cash generating units (“CGUs”) or group of CGUs to which the asset belongs.
3.9 LEASING Leases are classified as finance leases whenever the terms of the lease transfer substantially all the risks and rewards of ownership to the lessee. All other leases are classified as operating leases.
Assets held under finance leases are initially recognized as assets at their fair value at the inception of the lease or, if lower, at the present value of the minimum lease payments. The corresponding liability to the lessor is included in the statement of financial position as an obligation under finance lease that is included with long-term debt.
Lease payments are apportioned between finance charges and reduction of the lease obligation so as to achieve a constant rate of interest on the remaining balance of the liability. Finance charges are charged directly to the income statement, unless they are directly attributable to qualifying assets, in which case they are capitalized in accordance with Yellow Pages Limited’s general policy on borrowing costs.
Operating lease payments are recognized as an expense on a straight-line basis over the lease term, except where another systematic basis is more representative of the time pattern in which economic benefits from the leased asset are consumed. Contingent rentals arising under operating leases are recognized as an expense in the period in which they are incurred.
In the event that incentives to enter into operating leases are received, such incentives are recognized as a deferred credit. The aggregate benefit of incentives is recognized as a reduction of rental expense on a straight-line basis.
YELLOW PAGES LIMITED 2015 ANNUAL REPORT48
NOTES TO THE CONSOLIDATED FINANCIAL STATEMENTS – DECEMBER 31, 2015(ALL TABULAR AMOUNTS ARE IN THOUSANDS OF CANADIAN DOLLARS, EXCEPT SHARE INFORMATION)

YELLOW PAGES LIMITED Notes to the Consolidated Financial Statements – December 31, 2015
(all tabular amounts are in thousands of Canadian dollars, except share information)
ANNUAL REPORT 2015 13
3.10 INTANGIBLES ASSETS Intangible assets acquired through a business combination are identified and recognized separately from goodwill where they arise from legal or contractual rights or are capable of being separated from the acquiree and sold, transferred, licensed or exchanged. The cost of such intangible assets is deemed to be their fair value at the acquisition date. Intangible assets not acquired through a business combination are reported at cost less accumulated amortization and accumulated impairment losses.
Internally-generated intangible assets, consisting of software used by the Company, are recognized to the extent the criteria in IAS 38 — Intangible Assets are met. Development costs for internally-generated intangible assets are capitalized at cost if, and only if, Yellow Pages Limited can demonstrate:
the technical feasibility of completing the asset so that it will be available for use or sale;
the intention to complete the intangible asset and use or sell it;
the ability to use or sell the intangible asset;
how the intangible asset will generate probable future economic benefits;
the availability of adequate technical, financial and other resources to complete the development and to use or sell the intangible asset; and
the ability to measure reliably the expenditure attributable to the intangible asset during its development.
The amount initially recognized for internally-generated intangible assets is the sum of the expenditures incurred from the date when the intangible asset first meets the recognition criteria listed above. Where no internally-generated intangible asset can be recognized, development expenditures are charged to the income statement in the period in which they are incurred.
Internally-generated intangible assets include the cost of software tools and licenses used in the development of Yellow Pages Limited’s systems, as well as all directly attributable payroll and consulting costs. These items are not amortized until the assets are available for use.
Following initial recognition, intangible assets are carried at cost less any accumulated amortization and any accumulated impairment loss. Intangibles assets are amortized, unless their useful lives are indefinite, as follows:
Non-competition agreements Straight-line over life of agreement Customer-related intangible assets Pro rata based on related revenues, not exceeding 24 months Trademarks Indefinite Domain names Indefinite or straight-line over 4 – 12 years Software Straight-line over 3 years
The estimated useful life and amortization method are reviewed at the end of each reporting period or annual reporting period, with the effect of any changes in estimate being accounted for on a prospective basis.
An intangible asset is de-recognized on disposal, or when no future economic benefits are expected from use or disposal. Gains or losses arising from the de-recognition of an intangible asset, measured as the difference between the net disposal proceeds or fair value, as applicable, and the carrying value of the asset, are recognized in the income statement when the asset is de-recognized.
3.11 GOODWILL Goodwill arising on the acquisition of a subsidiary is recognized as an asset at the date that control is acquired (the acquisition date). Goodwill is measured as the excess of the sum of the purchase consideration over the fair value of identifiable net assets acquired.
Goodwill is not amortized. It is reviewed for impairment at least annually or sooner if indicators of impairment exist. Any impairment loss is recognized immediately in the income statement and is not subsequently reversed.
3.12 IMPAIRMENT OF TANGIBLE AND INTANGIBLE ASSETS INCLUDING GOODWILL At each reporting date, Yellow Pages Limited determines whether there are any indications that the carrying values of its tangible and intangible assets are impaired. If any such indication exists, the recoverable amount of the asset is estimated in order to determine the extent of the impairment loss, if any. Where it is not possible to estimate the recoverable amount of an individual asset, Yellow Pages Limited estimates the recoverable amount of the CGU or group of CGUs to which the asset belongs. A CGU is the smallest identifiable group of assets that generate cash flows that are independent of those from other assets.
YELLOW PAGES LIMITED 2015 ANNUAL REPORT 49
NOTES TO THE CONSOLIDATED FINANCIAL STATEMENTS – DECEMBER 31, 2015(ALL TABULAR AMOUNTS ARE IN THOUSANDS OF CANADIAN DOLLARS, EXCEPT SHARE INFORMATION)

YELLOW PAGES LIMITED Notes to Consolidated Financial Statements – December 31, 2015 (all tabular amounts are in thousands of Canadian dollars, except share information)
14 ANNUAL REPORT 2015
Intangible assets with indefinite useful lives, intangible assets not yet available for use and goodwill are tested for impairment annually, and whenever there is an indication that the asset may be impaired. A majority of the Company’s intangible assets do not have cash inflows independent of those from other assets and as such, are tested within their respective CGUs.
The recoverable amount is the higher of fair value less costs of disposal and value in use. In assessing value in use, the estimated future cash flows are discounted to their present value using a pre-tax discount rate that reflects current market assessments of the time value of money and the risks specific to the asset (or CGU) for which the estimates of future cash flows have not been adjusted.
If the recoverable amount of an asset (or CGU) is estimated to be less than its carrying value, the carrying value of the asset (or CGU) is reduced to its recoverable amount. An impairment loss is recognized immediately in the income statement.
For the purpose of impairment testing of goodwill, goodwill is tested at the group of CGUs level which represents the lowest level where goodwill is monitored for internal management purposes. Goodwill is tested for impairment annually, or more frequently when there is an indication that the unit may be impaired.
If the recoverable amount of a CGU or group of CGUs is less than the carrying amount, the impairment loss is allocated first to reduce the carrying amount of goodwill and then to the other assets of the unit pro-rata on the basis of the carrying amount of each asset in the unit. The Company does not reduce the carrying value of an asset below the highest of its fair value less costs of disposal and its value in use.
3.13 TRADE AND OTHER PAYABLES Trade and other payables, including accruals, are recorded when Yellow Pages Limited is required to make future payments as a result of purchases of assets or services. Trade and other payables are carried at amortized cost.
3.14 FINANCIAL LIABILITIES The valuation of financial liabilities depends on their classification. Financial liabilities are classified as either financial liabilities “at FVTPL” or “other financial liabilities”.
Excluding derivative liabilities and financial liabilities accounted for at FVTPL, Yellow Pages Limited recognizes all financial liabilities, specifically long-term debt, exchangeable debentures, trade payables and other liabilities, initially at fair value less transaction costs and subsequently at amortized cost, using the effective interest method.
Financial liabilities designated as FVTPL are carried at fair value. Changes in fair value are recorded in the income statement. Transaction costs incurred in setting up these financial liabilities are recognized immediately as expenses in the income statement.
Yellow Pages Limited de-recognizes financial liabilities when, and only when, Yellow Pages Limited’s obligations are discharged, cancelled or expire.
3.15 PROVISIONS Provisions are recognized when Yellow Pages Limited has a present obligation (legal or constructive) as a result of a past event, it is probable that an outflow of resources will be required to settle the obligation, and a reliable estimate can be made of the amount of the obligation.
The amount recognized as a provision is the best estimate of the consideration required to settle the present obligation at the reporting date, taking into account the risks and uncertainties surrounding the obligation. Provisions are measured at the present value of the expenditures expected to be required to settle the obligation using a pre-tax rate that reflects current market assessments of the time value of money and the risks specific to the obligation. The increase in the provision due to passage of time is recognized as a financial charge.
3.15.1 Onerous contracts Present obligations arising under onerous contracts are recognized and measured as provisions. An onerous contract is considered to exist where Yellow Pages Limited has a contract under which the unavoidable costs of meeting the obligations under the contract exceed the economic benefits expected to be received under it.
3.15.2 Restructuring A restructuring provision is recognized when Yellow Pages Limited has developed a detailed formal plan for the restructuring and has raised a valid expectation in those affected that it will carry out the restructuring by starting to implement the plan or announcing its main features to those affected by it. The measurement of a restructuring provision includes only the direct expenditures arising from the restructuring, which are those amounts that are both necessarily entailed by the restructuring and not associated with the ongoing activities of the entity.
YELLOW PAGES LIMITED 2015 ANNUAL REPORT50
NOTES TO THE CONSOLIDATED FINANCIAL STATEMENTS – DECEMBER 31, 2015(ALL TABULAR AMOUNTS ARE IN THOUSANDS OF CANADIAN DOLLARS, EXCEPT SHARE INFORMATION)

YELLOW PAGES LIMITED Notes to the Consolidated Financial Statements – December 31, 2015
(all tabular amounts are in thousands of Canadian dollars, except share information)
ANNUAL REPORT 2015 15
3.16 LONG-TERM DEBT All long-term debt instruments are initially stated at the fair value of the consideration received after deduction of issue costs. Debt instruments are subsequently measured at amortized cost. Issue costs are charged to the income statement together with the coupon, as finance costs, on a constant-yield basis over the term of the debt instrument, or over a shorter period where the lender can require earlier repayment.
3.17 EMPLOYEE BENEFITS
3.17.1 Defined contribution plans A defined contribution plan is a post-employment benefit plan under which an entity pays fixed contributions into a separate entity and will have no legal or constructive obligation to pay further amounts. Obligations for contributions to defined contribution pension plans are recognized as an employee benefit expense in the income statement when they are due. Prepaid contributions are recognized as an asset to the extent that a cash refund or a reduction in future payments is available.
3.17.2 Defined benefit plans A defined benefit plan is a post-employment benefit plan other than a defined contribution plan. Yellow Pages Limited’s net obligation in respect of defined benefit pension plans is calculated separately for each plan by estimating the amount of future benefits that employees have earned in return for their service in the current and prior periods; that benefit is discounted to determine its present value. The fair value of any plan assets is deducted from the obligation. The discount rate is the yield at the reporting date on high-quality corporate bonds that have terms to maturity approximating to the terms of the related pension liability adjusted for a spread to reflect any additional credit risk and that are denominated in the currency in which the benefits are expected to be paid. The calculation is performed annually by a qualified actuary using the projected benefit method prorated on service.
Yellow Pages Limited recognizes all actuarial gains and losses arising subsequently from defined benefit plans in OCI. Re-measurement, comprising actuarial gains and losses, the effects of changes to the asset ceiling, if applicable, and the return on plan assets, excluding net interest on the defined benefit obligation, is reflected immediately in the statement of financial position with a charge or credit recognized in OCI. Re-measurement recognized in OCI is reflected immediately in retained earnings and will not be classified to the income statement. Past service costs are recognized in the income statement in the period a plan amendment is announced to employees. The net interest amount, which is calculated by applying the discount rate to the net defined liability or asset of defined benefit plans, is included within net financial charges while service costs are recorded in operating expenses.
3.17.3 Other long-term employee benefits Yellow Pages Limited’s net obligation in respect of long-term employee benefits other than pension plans is the amount of future benefit that employees have earned in return for their service in the current and prior periods; that benefit is discounted to determine its present value, and the fair value of any related asset is deducted. The discount rate is the yield at the reporting date on high quality corporate bonds that have terms to maturity approximating the terms of the related obligation. The calculation is performed using the projected unit credit method. Any actuarial gains or losses are recognized in the period in which they arise.
3.17.4 Termination benefits Termination benefits are recognized as an expense when Yellow Pages Limited can no longer withdraw the offer of those benefits, or if earlier, when there is no realistic possibility of withdrawal from a formal detailed plan to either terminate employment before the normal retirement date, or from providing termination benefits as a result of an offer made to encourage voluntary redundancy. Termination benefits for voluntary redundancies are recognized as an expense if Yellow Pages Limited has made an offer of voluntary redundancy, it is probable that the offer will be accepted, and the number of acceptances can be estimated reliably.
3.17.5 Short-term benefits Short-term employee benefit obligations are measured on an undiscounted basis and are expensed as the related service is provided.
A liability is recognized for the amount expected to be paid if Yellow Pages Limited has a present legal or constructive obligation to pay this amount as a result of a past service provided by the employee and the obligation can be estimated reliably.
3.17.6 Share-based payment transactions Yellow Pages Limited’s restricted share units, performance share units, deferred share units and stock options granted to employees and directors are measured at the fair value of the equity instruments at the grant date.
The restricted share units, performance share units and deferred share units granted may be settled in cash or equity at the Company’s option. If the restricted share unit and performance share unit plan is funded, eligible employees will receive, upon vesting of the instruments, common shares. The funded portion of these plans is treated as equity-settled instruments and recorded accordingly in equity. In the event these plans are unfunded, Yellow Pages Limited will pay to the eligible employees and directors,
YELLOW PAGES LIMITED 2015 ANNUAL REPORT 51
NOTES TO THE CONSOLIDATED FINANCIAL STATEMENTS – DECEMBER 31, 2015(ALL TABULAR AMOUNTS ARE IN THOUSANDS OF CANADIAN DOLLARS, EXCEPT SHARE INFORMATION)

YELLOW PAGES LIMITED Notes to Consolidated Financial Statements – December 31, 2015 (all tabular amounts are in thousands of Canadian dollars, except share information)
16 ANNUAL REPORT 2015
upon vesting of the instruments, an amount in cash. The unfunded portion of these plans is treated as cash-settled instruments and recorded as a liability. At each reporting period, the liability is re-measured at fair value with any changes recorded in operating costs.
The fair value determined at the grant date of the share-based instruments is expensed on a straight-line basis over the vesting period, based on Yellow Pages Limited’s estimate of share-based instruments that will eventually vest. At each reporting period, Yellow Pages Limited revises its estimate of the number of share-based instruments expected to vest. The impact of the revision of the original estimate, if any, is recognized in the income statement, with a corresponding adjustment to the reserve.
3.18 EQUITY INSTRUMENTS ISSUED BY YELLOW PAGES LIMITED An equity instrument is any contract that evidences a residual interest in the assets of an entity after deducting all of its liabilities. Equity instruments issued by Yellow Pages Limited are recorded at the proceeds received, net of direct issue costs.
Transaction costs incurred by Yellow Pages Limited in issuing, acquiring or reselling its own equity instruments are accounted for as a deduction from equity to the extent that they are incremental costs directly attributable to the equity transaction that otherwise would have been avoided.
3.19 OPERATING SEGMENTS Disclosure of segment information is reported in a manner consistent with the internal reports regularly reviewed by Yellow Pages Limited’s Chief Operating Decision Maker in order to assess each segment’s performance and to allocate resources to them. The Chief Operating Decision Maker, who is responsible for allocating resources and assessing performance of the operating segments, has been identified as the President and Chief Executive Officer. The Company currently operates under one segment.
3.20 REVENUES Yellow Pages Limited’s revenues are measured at the fair value of the consideration received or receivable after deduction of sales allowances and sales taxes.
Print directory advertising is sold in bundles that can include several related online advertising products. Print products are not sold separately. Revenues from print directory advertising as well as revenues from related online products are recognized in the income statement rateably on a monthly basis from the point at which service is first provided over the life of the contract.
Revenues from private and commercial classified advertisements and display advertisements are recognized at the time the advertisements are published either on a weekly or monthly basis. Revenues related to advertisements appearing on multiple occasions are recognized over the period the advertisements are displayed.
3.21 DERIVATIVE FINANCIAL INSTRUMENTS Yellow Pages Limited enters from time to time into a variety of derivative financial instruments to manage interest rate risk on its long-term debt and to manage the risk of fluctuations in the share price of its common shares affecting its stock-based compensation plans.
Derivatives are initially recognized at fair value at the date a derivative contract is entered into and are subsequently re-measured to their fair value at each statement of financial position date. The resulting gain or loss is recognized in the income statement immediately unless the derivative is designated and effective as a hedging instrument, in which event the timing of the recognition in the income statement depends on the nature of the hedge relationship.
Yellow Pages Limited designates certain derivatives as either hedges of the fair value of recognized assets or liabilities or firm commitments (fair value hedges), hedges of highly probable forecast transactions or hedges of foreign currency risk of firm commitments (cash flow hedges).
3.21.1 Embedded derivatives Derivatives embedded in other financial instruments or other host contracts are treated as separate derivatives when their risks and characteristics are not closely related to those of the host contracts and the host contracts are not measured at fair value with changes in fair value recognized in the income statement.
3.22 BORROWING COSTS Borrowing costs directly attributable to the acquisition or construction of qualifying assets, which are assets that necessarily take a substantial period of time to get ready for their intended use, are added to the cost of those assets, until such time as the assets are substantially ready for their intended use. All other borrowing costs are recognized in profit or loss in the period in which they are incurred. The Company currently has not capitalized any borrowing costs.
3.23 TAXATION Income tax expense represents the sum of the current and deferred tax.
YELLOW PAGES LIMITED 2015 ANNUAL REPORT52
NOTES TO THE CONSOLIDATED FINANCIAL STATEMENTS – DECEMBER 31, 2015(ALL TABULAR AMOUNTS ARE IN THOUSANDS OF CANADIAN DOLLARS, EXCEPT SHARE INFORMATION)

YELLOW PAGES LIMITED Notes to the Consolidated Financial Statements – December 31, 2015
(all tabular amounts are in thousands of Canadian dollars, except share information)
ANNUAL REPORT 2015 17
3.23.1 Current income tax Taxable profit differs from profit as reported in the consolidated income statement because it excludes items of income or expense that are taxable or deductible in other years and it further excludes items that are never taxable or deductible. Yellow Pages Limited’s liability for current income tax is calculated using tax rates that have been enacted or substantively enacted by the reporting date.
3.23.2 Deferred tax Deferred tax is recognized on differences between the carrying values of assets and liabilities in the consolidated financial statements and the corresponding tax basis used in the computation of taxable profit, and is accounted for using the liability method. Deferred tax liabilities are generally recognized for all taxable temporary differences, and deferred tax assets are generally recognized for all deductible temporary differences to the extent that it is probable that taxable profits will be available against which those deductible temporary differences can be utilized. Such assets and liabilities are not recognized if the temporary difference arises from goodwill or from the initial recognition (other than in a business combination) of other assets and liabilities in a transaction that affects neither the taxable profit nor the accounting profit.
Deferred tax liabilities are recognized for taxable temporary differences associated with investments in subsidiaries and associates, except where Yellow Pages Limited is able to control the reversal of the temporary difference and it is probable that the temporary difference will not reverse in the foreseeable future. Deferred tax assets arising from deductible temporary differences associated with such investments and interests are only recognized to the extent it is probable that there will be sufficient taxable profits against which to utilize the benefits of the temporary differences and they are expected to reverse in the foreseeable future.
The carrying value of deferred tax assets is reviewed at each reporting date and reduced to the extent it is no longer probable that sufficient taxable profits will be available to allow all or part of the asset to be recovered.
Deferred tax assets and liabilities are measured at the tax rates that are expected to apply in the period in which the liability is settled or the asset realized, based on tax rates (and tax laws) that have been enacted or substantively enacted by the reporting date. The measurement of deferred tax liabilities and assets reflects the tax consequences that would follow from the manner in which Yellow Pages Limited expects, at the reporting date, to recover or settle the carrying amount of its assets and liabilities.
Deferred tax assets and liabilities are offset when there is a legally enforceable right to set off tax assets against tax liabilities and when they relate to income taxes levied by the same taxation authority and Yellow Pages Limited intends to settle its tax assets and liabilities on a net basis.
3.23.3 Current and deferred tax for the period Current and deferred taxes are recognized as an expense or income in the income statement, except when they relate to items that are recognized outside net earnings (whether in OCI or directly in equity), in which case the tax is also recognized outside net earnings, or where they arise from the initial accounting for a business combination. In the case of a business combination, the applicable tax effects are taken into account in the accounting for the business combination.
3.24 SIGNIFICANT ESTIMATES AND JUDGMENTS The preparation of consolidated financial statements requires management to make estimates and assumptions that can affect the carrying value of certain assets and liabilities, income and expenses, and the information disclosed in the notes to the consolidated financial statements. Management reviews these estimates and assumptions on a regular basis to ensure their pertinence with respect to past experience and the current economic situation. Items in future financial statements could differ from current estimates as a result of changes in these assumptions. The impact of changes in accounting estimates is recognized during the period in which the change took place and all affected future periods.
The estimates and judgments made by management that are critical to the determination of the carrying value of assets and liabilities are addressed below.
Significant estimates Business acquisitions As a result of the business acquisition in July 2015 of 9059-2114 Québec Inc., a holding company which owns all of the issued and outstanding shares of ByTheOwner Inc. (collectively “ComFree/DuProprio” (“CFDP”)), Yellow Pages Limited measured the fair value of CFDP’s intangible assets, namely its trademark, using the royalty relief method (refer to Note 5 – Business acquisitions). The measurement at fair value required significant estimation and was based on a discounted cash flow model which maximized the amount of observable market inputs as well as using forecasted cash flows, projected over a five-year period.
As a result of the business acquisition of 411 Local Search Corp. (“411”) in June 2014, Yellow Pages Limited re-measured its existing financial liability as well as the fair value of 411 (refer to Note 5 – Business acquisitions). The measurement at fair value required significant estimation and was based on a discounted cash flow model which maximized the amount of observable market inputs as well as using forecasted cash flows, projected over a five-year period.
YELLOW PAGES LIMITED 2015 ANNUAL REPORT 53
NOTES TO THE CONSOLIDATED FINANCIAL STATEMENTS – DECEMBER 31, 2015(ALL TABULAR AMOUNTS ARE IN THOUSANDS OF CANADIAN DOLLARS, EXCEPT SHARE INFORMATION)

YELLOW PAGES LIMITED Notes to Consolidated Financial Statements – December 31, 2015 (all tabular amounts are in thousands of Canadian dollars, except share information)
18 ANNUAL REPORT 2015
Intangible assets and goodwill The valuations associated with measuring the recoverability of identifiable intangible assets and goodwill for impairment analysis purposes involve significant estimates and assumptions, including those with respect to future cash inflows and outflows, discount rates, terminal growth rates and asset lives. These significant estimates could affect Yellow Pages Limited’s future results if the current estimates of future performance and fair values change.
Yellow Pages Limited assesses impairment by comparing the recoverable amount of a CGU or group of CGUs to which an identifiable intangible asset and goodwill belongs, with its carrying value. The determination of the recoverable amount involves significant management estimates.
Yellow Pages Limited performs its annual test for impairment of indefinite life intangible assets and goodwill in the fourth quarter in accordance with the policy described in Note 3.12.
Useful lives of intangible assets and property and equipment Yellow Pages Limited reviews the estimated useful lives of its intangible assets and property and equipment at the end of each reporting period. At the end of the current reporting period, management determined that the useful lives of its intangible assets and property and equipment were adequate.
Employee future benefits The present value of the defined benefit obligation is determined by discounting the estimated future cash outflows using interest rates of high-quality corporate bonds that are denominated in the currency in which the benefits will be paid and that have terms to maturity approximating the terms of the related pension liability. Determination of the net benefit costs (recovery) requires assumptions such as the discount rate to measure defined benefit obligations and expected return on plan assets, the projected age of employees upon retirement, the expected rate of future compensation and the expected healthcare cost trend rate. Actual results may differ from results which are estimated based on assumptions.
Income taxes Estimation of income taxes includes evaluating the recoverability of deferred tax assets based on an assessment of Yellow Pages Limited’s ability to utilize the underlying future tax deductions against future taxable income before they expire. Yellow Pages Limited’s assessment is based upon existing tax laws and estimates of future taxable income. If the assessment of Yellow Pages Limited’s ability to utilize the underlying future tax deductions changes, Yellow Pages Limited would be required to recognize more or fewer of the tax deductions as assets, which would decrease or increase the income tax expense in the period in which this is determined.
Significant judgments Uncertain tax provisions Yellow Pages Limited is subject to taxation in numerous jurisdictions. Significant judgment is required in determining the consolidated provision for taxation. There are many transactions and calculations for which the ultimate tax determination is uncertain during the ordinary course of business. Yellow Pages Limited maintains provisions for uncertain tax positions that it believes appropriately reflect its risk with respect to tax matters under active discussion, audit, dispute or appeal with tax authorities, or which are otherwise considered to involve uncertainty. These provisions for uncertain tax positions are made using the best estimate of the amount expected to be paid based on a qualitative assessment of all relevant factors. Yellow Pages Limited reviews the adequacy of these provisions at each statement of financial position date. However, it is possible that at some future date an additional liability could result from audits by tax authorities. Where the final tax outcome of these matters is different from the amounts that were initially recorded, such differences will affect the tax provisions in the period in which such determination is made.
YELLOW PAGES LIMITED 2015 ANNUAL REPORT54
NOTES TO THE CONSOLIDATED FINANCIAL STATEMENTS – DECEMBER 31, 2015(ALL TABULAR AMOUNTS ARE IN THOUSANDS OF CANADIAN DOLLARS, EXCEPT SHARE INFORMATION)

YELLOW PAGES LIMITED Notes to the Consolidated Financial Statements – December 31, 2015
(all tabular amounts are in thousands of Canadian dollars, except share information)
ANNUAL REPORT 2015 19
4. IMPAIRMENT OF GOODWILL AND INTANGIBLE ASSETS As a majority of the intangible assets do not generate cash inflows that are largely independent of those from other assets or group of assets, the Company performs its impairment analysis of its intangible assets at the CGU level. The CGUs of the Company are as follows: Yellow Pages and Other (includes multiple CGUs for which the carrying value of its intangible assets with indefinite useful lives is not significant in comparison with the Company’s total carrying value of intangible assets with indefinite useful lives).
Goodwill was tested for impairment at the lowest level within the Company at which the goodwill is monitored for internal management purposes: the Other CGU.
During the fourth quarters of 2014 and 2015, in the context of its annual impairment testing, the Company completed its impairment analysis and assessed the recoverability of its assets allocated to its CGUs. The Company calculated the recoverable amounts of its CGUs using valuation methods which were consistent with those used in prior periods. The recoverable amounts were determined based on the value in use approach using a discounted cash flow model. The significant key assumptions included in the forecasted cash flows are based on the Company’s business plan taking into consideration growth and product mix trends.
2015
The cash flows are based on the 2016 budget approved by the Board of Directors and projected over a five-year period. Applicable terminal growth rates were applied. The forecasted cash flows also incorporated forecasted print revenue declines per annum between 16% and 22% and online revenue growth rates between 6% and 11% for the Yellow Pages and Other CGUs.
As a result of the impairment analysis, the Company determined that the recoverable amounts of if its CGUs exceeded their carrying values and accordingly, no impairment charge was recognized.
2014
The cash flows were based on the 2015 budget approved by the Board of Directors and projected over a five-year period. Applicable terminal growth rates were applied. The forecasted cash flows also incorporated forecasted print revenue declines per annum between 17% and 23% and online revenue growth rates between 7% and 12% for the Yellow Pages and Other CGUs.
As a result of the impairment analysis, the Company determined that the recoverable amounts of if its CGUs exceeded their carrying values and accordingly, no impairment charge was recognized.
Carrying values and assumptions Cash flows beyond the five-year projections of the plan were extrapolated using the terminal growth rates stated in the table below. The allocation of the carrying value of the intangible assets as at December 31, 2015 and 2014 by CGU or group of CGUs and the key assumptions used for the value in use calculations for the December 31, 2015 and December 31, 2014 impairment analyses are presented below:
December 31, 2015
Yellow Pages Other Total
Carrying value of intangible assets by CGU Trademarks and domain names $ 877,862 $ 30,374 $ 908,236 Trademarks and domain names with finite lives 2,356 6,228 8,584 Non-competition agreements 305,124 1,691 306,815 Customer-related intangible assets 2,340 645 2,985 Software 139,468 3,693 143,161 Goodwill 26,829 26,829
Total carrying value of goodwill and intangible assets by CGU $ 1,327,150 $ 69,460 $ 1,396,610
December 31, 2014
Yellow Pages Other Total
Carrying value of intangible assets by CGU Trademarks and domain names $ 877,862 $ 983 $ 878,845 Trademarks and domain names with finite lives 2,618 8,805 11,423 Non-competition agreements 323,541 16 323,557 Customer-related intangible assets 4,830 4,830 Software 114,096 2,216 116,312
Total carrying value of intangible assets by CGU $ 1,322,947 $ 12,020 $ 1,334,967
YELLOW PAGES LIMITED 2015 ANNUAL REPORT 55
NOTES TO THE CONSOLIDATED FINANCIAL STATEMENTS – DECEMBER 31, 2015(ALL TABULAR AMOUNTS ARE IN THOUSANDS OF CANADIAN DOLLARS, EXCEPT SHARE INFORMATION)

YELLOW PAGES LIMITED Notes to Consolidated Financial Statements – December 31, 2015 (all tabular amounts are in thousands of Canadian dollars, except share information)
20 ANNUAL REPORT 2015
Sensitivity to changes in assumptions
The table below shows the percentages by which each key assumption must change in isolation in order for the estimated recoverable amount to equal to its carrying value:
Yellow Pages Limited has accumulated impairment losses on goodwill, intangible assets and property and equipment in the amounts of $5,847.8 million, $309.6 million and $10.4 million, respectively. There are no impairment charges recorded for the years ended December 31, 2015 and 2014.
5. BUSINESS ACQUISITIONS 2015
In May 2015, Yellow Pages Homes Limited, a wholly-owned subsidiary of the Company, acquired the assets of Western Media Group for a purchase price of $0.9 million. The purchased assets include multi-platform brands in Western Canada, vanmag.com, westernlivingmag.com as well as Western Living Magazine and Vancouver Magazine. These properties generate local lifestyle content specific to the Western Canada region, in the restaurants, real estate and lifestyle categories. The fair value of $0.9 million is mainly comprised of intangible assets.
On July 1, 2015, Yellow Pages Limited acquired all the shares of CFDP, for a purchase price of $50.2 million. The acquisition of CFDP, a leader in connecting home sellers and buyers in Canada, provides Yellow Pages with an increased presence in the real estate vertical, access to exclusive listings and the platforms required to transact directly with Canadians. The acquisition was fully funded with cash on hand. Transaction costs of $1.3 million were incurred during the year ended December 31, 2015, and are included in Restructuring and special charges (refer to Note 10 – Provisions).
The following table summarizes the transaction and the purchase price allocation:
July 1, 2015
Fair value of business acquired Trade and other receivables $ 1,461 Other assets 851 Property and equipment 1,339 Intangible assets 32,436 Goodwill 26,829 Deferred income tax liabilities, net (6,834) Trade and other payables (2,190) Provisions (2,087) Deferred revenues (1,594)
$ 50,211
Yellow Pages Other Total
Key assumptions : Terminal growth rate
December 31, 2015 -15% to 4.5% 1.5% to 4.5% -15% to 4.5% December 31, 2014 -15% to 5% 5% -15% to 5%
Discount rate – post-tax December 31, 2015 9.9% to 15.3% 12.8% 9.9% to 15.3% December 31, 2014 10.4% to 16.8% 12.8% 10.4% to 16.8%
Discount rate – pre-tax December 31, 2015 16.3% to 23.1% 15.5% to 17.3% 15.5% to 23.1% December 31, 2014 17.1% to 24.8% 14.4% to 24.8% 14.4% to 24.8%
December 31, 2015
Yellow Pages
Key assumptions : Terminal growth rate -1% Discount rate – post-tax 1% Revenue decline per annum -2% to -6%
YELLOW PAGES LIMITED 2015 ANNUAL REPORT56
NOTES TO THE CONSOLIDATED FINANCIAL STATEMENTS – DECEMBER 31, 2015(ALL TABULAR AMOUNTS ARE IN THOUSANDS OF CANADIAN DOLLARS, EXCEPT SHARE INFORMATION)

YELLOW PAGES LIMITED Notes to the Consolidated Financial Statements – December 31, 2015
(all tabular amounts are in thousands of Canadian dollars, except share information)
ANNUAL REPORT 2015 21
CFDP’s revenues of $18.2 million and a net loss of $90 thousand are included in the consolidated income statement from the date of acquisition. Yellow Pages Limited’s consolidated revenues and net earnings for the year ended December 31, 2015 would have been $853.5 million and $61.7 million, respectively, had the CFDP acquisition occurred on January 1, 2015.
2014
On June 1, 2014, Yellow Pages Limited acquired the remaining shares of 411 as a result of the exercise of a put option by the other shareholders of 411, requiring the Company to acquire the remaining 70% interest in 411 for a purchase price of $22.7 million, net of cash acquired of $3.6 million. 411 is the operator of 411.ca, an online search engine to find people and local businesses in Canada. The acquisition was financed with cash on hand. The following table summarizes the transaction and the purchase price allocation:
June 1, 2014
Cash purchase consideration for 70% ownership $ 26,340 Previously held equity investment at fair value 4,377 Settlement of financial liability (Note 22) (16,128)
Fair value for 100% ownership $ 14,589
Fair value of business acquired Cash acquired $ 3,642 Intangible assets 10,636 Other assets 1,277 Deferred income tax assets, net 1,775 Trade and other payables (1,151) Deferred revenues (1,590)
$ 14,589
The previously held equity investment in 411, which was accounted for under the equity method up to the acquisition date, was re-measured at its fair value of $4.4 million and resulted in a gain of $1.4 million. The financial liability of $18.5 million as at December 31, 2013 was also re-measured at its fair value as at the acquisition date to $16.1 million, and resulted in a gain of $2.3 million (refer to Note 22 – Financial risk management). The aggregate gain of $3.6 million, net of transaction costs of $0.1 million, was included in financial charges (refer to Note 19 – Financial charges, net).
411’s revenues of $10.6 million and net earnings of $0.7 million are included in the consolidated income statement from the date of acquisition. Yellow Pages Limited’s consolidated revenues and net earnings for the year ended December 31, 2014 would have been $882.5 million and $187.7 million, respectively, had the 411 acquisition occurred on January 1, 2014.
On December 17, 2014, Yellow Pages Limited completed the acquisitions of the following:
All the assets of Candia Group Inc. (“dine.TO”), which owns and operates local digital restaurant guides for the Greater Toronto Area; and
All the shares of Bookenda Limited (formerly 4400348 Canada Inc.), a provider of a booking and reservation management system with a strong presence in the restaurant industry.
The combined total cash consideration for the two acquisitions of $10.8 million was financed with cash on hand and paid at closing. The fair value of $10.8 million included $12.2 million of intangible assets (refer to Note 8 – Intangible assets), $0.1 million of net other assets, and $1.5 million of net deferred income tax liabilities.
6. INVESTMENTS IN ASSOCIATES In May 2014, Yellow Pages Limited disposed of its 35% share ownership in Ziplocal for $nil consideration. The carrying value of this investment was $nil as at the date of disposal. The investment in Ziplocal was accounted for using the equity method. Upon disposal, Yellow Pages Limited reclassified an accumulated foreign currency translation loss of $1.6 million from equity to financial charges (refer to Note 19 – Financial charges, net).
YELLOW PAGES LIMITED 2015 ANNUAL REPORT 57
NOTES TO THE CONSOLIDATED FINANCIAL STATEMENTS – DECEMBER 31, 2015(ALL TABULAR AMOUNTS ARE IN THOUSANDS OF CANADIAN DOLLARS, EXCEPT SHARE INFORMATION)

YELLOW PAGES LIMITED Notes to Consolidated Financial Statements – December 31, 2015 (all tabular amounts are in thousands of Canadian dollars, except share information)
22 ANNUAL REPORT 2015
7. PROPERTY AND EQUIPMENT 2015
Office
equipment1 Computer
equipment Other
equipment Leasehold
improvements Total
Cost As at December 31, 2014 $ 31,666 $ 34,411 $ 1,908 $ 31,940 $ 99,925 Business acquisitions (Note 5) 296 239 196 698 1,429 Additions 772 2,775 72 1,273 4,892 Disposals, write-offs and transfers (34) (37) (71)
As at December 31, 2015 $ 32,700 $ 37,425 $ 2,139 $ 33,911 $ 106,175
Accumulated depreciation As at December 31, 2014 $ 22,250 $ 19,121 $ 1,138 $ 20,985 $ 63,494 Depreciation expense 1,562 6,227 283 4,126 12,198 Disposals, write-offs and transfers (34) (37) (71) As at December 31, 2015 $ 23,778 $ 25,348 $ 1,384 $ 25,111 $ 75,621
Net book value as at December 31, 2015 $ 8,922 $ 12,077 $ 755 $ 8,800 $ 30,554
2014
Office
equipment1 Computer
equipment Other
equipment Leasehold
improvements Total
Cost As at December 31, 2013 $ 30,439 $ 24,328 $ 1,669 $ 31,153 $ 87,589 Business acquisitions (Note 5) 137 349 28 43 557 Additions 3,557 9,765 211 2,678 16,211 Disposals, write-offs and transfers (2,467) (31) (1,934) (4,432)
As at December 31, 2014 $ 31,666 $ 34,411 $ 1,908 $ 31,940 $ 99,925
Accumulated depreciation As at December 31, 2013 $ 22,925 $ 15,111 $ 984 $ 19,080 $ 58,100 Depreciation expense 1,790 4,031 154 3,811 9,786 Disposals, write-offs and transfers (2,465) (21) (1,906) (4,392)
As at December 31, 2014 $ 22,250 $ 19,121 $ 1,138 $ 20,985 $ 63,494
Net book value as at December 31, 2014 $ 9,416 $ 15,290 $ 770 $ 10,955 $ 36,431
1 The net book value of office equipment includes $0.6 million of assets held under finance leases (2014 - $0.7 million).
YELLOW PAGES LIMITED 2015 ANNUAL REPORT58
NOTES TO THE CONSOLIDATED FINANCIAL STATEMENTS – DECEMBER 31, 2015(ALL TABULAR AMOUNTS ARE IN THOUSANDS OF CANADIAN DOLLARS, EXCEPT SHARE INFORMATION)

YELLOW PAGES LIMITED Notes to the Consolidated Financial Statements – December 31, 2015
(all tabular amounts are in thousands of Canadian dollars, except share information)
ANNUAL REPORT 2015 23
8. INTANGIBLE ASSETS 2015
Trademarks and domain
names1
Non-competition agreements
Customer-related
intangible assets Software2
Total Intangible
assets
Cost As at December 31, 2014 $ 906,694 $ 530,830 $ 5,667 $ 256,486 $ 1,699,677 Business acquisitions (Note 5) 29,391 1,943 910 1,102 33,346 Additions 70,107 70,107
As at December 31, 2015 $ 936,085 $ 532,773 $ 6,577 $ 327,695 $ 1,803,130
Accumulated amortization As at December 31, 2014 $ 16,426 $ 207,273 $ 837 $ 140,174 $ 364,710 Amortization expense 2,839 18,685 2,755 44,360 68,639
As at December 31, 2015 $ 19,265 $ 225,958 $ 3,592 $ 184,534 $ 433,349
Net book value as at December 31, 2015 $ 916,820 $ 306,815 $ 2,985 $ 143,161 $ 1,369,781
2014
Trademarks and domain
names1
Non-competition agreements
Customer-related
intangible assets Software2
Total Intangible
assets
Cost As at December 31, 2013 $ 951,023 $ 536,102 $ 12,113 $ 180,637 $ 1,679,875 Business acquisitions (Note 5) 10,309 4,882 7,668 22,859 Additions 69,904 69,904 Disposals, write-offs and transfers (54,638) (5,272) (11,328) (1,723) (72,961)
As at December 31, 2014 $ 906,694 $ 530,830 $ 5,667 $ 256,486 $ 1,699,677
Accumulated amortization As at December 31, 2013 $ 65,132 $ 194,081 $ 11,671 $ 98,497 $ 369,381 Amortization expense 5,932 18,464 494 43,400 68,290 Disposals, write-offs and transfers (54,638) (5,272) (11,328) (1,723) (72,961)
As at December 31, 2014 $ 16,426 $ 207,273 $ 837 $ 140,174 $ 364,710
Net book value as at December 31, 2014 $ 890,268 $ 323,557 $ 4,830 $ 116,312 $ 1,334,967
1 Trademarks and domain names with indefinite useful lives amounted to $908.2 million (2014 - $878.8 million). 2 Software assets under development amounted to $30 million (2014 - $57 million).
9. TRADE AND OTHER PAYABLES As at December 31, 2015 December 31, 2014¹
Trade $ 47,675 $ 48,618
Accrued interest on long-term debt and exchangeable debentures 3,871 5,027
Payroll related 7,440 5,994
Long-term incentive plans 2,947 8,871
Other accrued liabilities 11,694 13,538
$ 73,627 $ 82,048
1 Certain amounts in the prior period were reclassified to conform to the current year’s presentation.
YELLOW PAGES LIMITED 2015 ANNUAL REPORT 59
NOTES TO THE CONSOLIDATED FINANCIAL STATEMENTS – DECEMBER 31, 2015(ALL TABULAR AMOUNTS ARE IN THOUSANDS OF CANADIAN DOLLARS, EXCEPT SHARE INFORMATION)

YELLOW PAGES LIMITED Notes to Consolidated Financial Statements – December 31, 2015 (all tabular amounts are in thousands of Canadian dollars, except share information)
24 ANNUAL REPORT 2015
10. PROVISIONS During the year ended December 31, 2015, Yellow Pages Limited recorded restructuring and special charges of $30.8 million. The majority of these costs was associated with workforce reductions related to a corporate realignment, internal reorganizations, transaction costs associated with business acquisitions, and contract termination costs, partially offset by a curtailment gain of $1.6 million related to workforce reductions (refer to Note 11 – Post-employment benefits). During the year ended December 31, 2014, Yellow Pages Limited recorded restructuring and special charges of $18.4 million. The majority of these costs were associated with internal reorganizations and workforce reductions, partially offset by a net curtailment gain of $1.4 million related to workforce reductions (refer to Note 11 – Post-employment benefits).
The provisions for restructuring and special charges represent the present value of the best estimate of the future outflow of economic benefits that will be required to settle the provisions and may vary as a result of new events affecting the severances and charges that will need to be paid.
Other provisions include provisions primarily for vacation and short-term incentive plans.
Provisions for restructuring
Provisions for special charges
Other provisions
Total Provisions
As at December 31, 2014 $ 16,244 $ 17,365 $ 34,808 $ 68,417 Charge1 27,437 5,031 31,533 64,001 Business acquisition (Note 5) 2,212 2,212 Utilized provision (21,080) (5,384) (34,536) (61,000) Surplus provision (1,538) (1,538)
As at December 31, 2015 $ 22,601 $ 17,012 $ 32,479 $ 72,092 Less current portion 20,759 14,627 32,255 67,641
Non-current portion $ 1,842 $ 2,385 $ 224 $ 4,451
1 Included in the restructuring and special charges of $30.8 million on the income statement is a curtailment gain of $1.6 million not affecting the provision.
11. POST-EMPLOYMENT BENEFITS Yellow Pages Limited maintains pension plans with defined benefit and defined contribution components which cover substantially all of the employees of Yellow Pages Limited. Yellow Pages Limited maintains unfunded supplementary defined benefit pension plans for certain executives and also maintains other retirement and post-employment benefits (“other benefits”) plans which cover substantially all of its employees.
The defined benefit plans typically expose the Company to actuarial risks such as investment, interest rate, longevity and salary risks.
Investment risk The present value of the defined benefit plan obligation is calculated using a discount rate determined by reference to high quality corporate bond yields; if the actual return on plan assets is below the assumed rate, it will create a plan deficit. Currently, the defined benefit plan has a relatively balanced investment in equity securities and debt instruments. Due to the long-term nature of the defined benefit plan obligation, the pension committee considers it appropriate that a reasonable portion of the plan assets should be invested in equity instruments to leverage the return generated by the fund.
Interest risk A decrease in the bond interest rate will increase the defined benefit plan obligation, particularly on a solvency basis. Although this will be partially offset by an increase in the return of the defined benefit plan’s investments, the impact may be material as pension liabilities are sensitive to variations in interest rates.
Longevity risk The present value of the defined benefit plan liability is calculated based on assumptions regarding mortality rates of plan participants both during and after their employment. An increase in the life expectancy of the plan participants will increase the defined benefit obligation.
Salary risk The present value of the defined benefit plan obligation is calculated by reference to the projected salaries of plan participants. As such, a higher salary increase than projected of the plan participants will increase the defined benefit plan’s liability.
The present value of the defined benefit obligation and the related current service cost and past service costs were measured using the projected benefit method prorated on service. This was based on the actuarial valuation of the plan assets and the present value of the defined benefit obligation which was carried out by Morneau Shepell, Fellows of the Canadian Institute of Actuaries and Society of Actuaries, as at May 31, 2015 and extrapolated to December 31, 2015. For funding purposes, an actuarial valuation of the defined benefit component of the Yellow Pages pension plans was also performed as at May 31, 2015.
YELLOW PAGES LIMITED 2015 ANNUAL REPORT60
NOTES TO THE CONSOLIDATED FINANCIAL STATEMENTS – DECEMBER 31, 2015(ALL TABULAR AMOUNTS ARE IN THOUSANDS OF CANADIAN DOLLARS, EXCEPT SHARE INFORMATION)

YELLOW PAGES LIMITED Notes to the Consolidated Financial Statements – December 31, 2015
(all tabular amounts are in thousands of Canadian dollars, except share information)
ANNUAL REPORT 2015 25
The changes in the defined benefit obligations and in the fair value of assets and the reconciliation of the funded status of the defined benefit plans to the amount recorded on the consolidated statements of financial position as at December 31, 2015 and 2014 were as follows:
As at December 31, 2015 December 31, 2014
Pension Other Pension Other Benefits1 Benefits Benefits1 Benefits
Fair value of plan assets, beginning of year $ 474,854 $ – $ 438,008 $ – Employer contributions 35,224 2,014 28,212 2,029 Employee contributions 1,502 – 1,680 – Interest income 18,838 – 20,534 – Return on plan assets excluding interest income (actuarial gains) 3,089 – 31,103 – Benefit payments (44,725) (2,014) (35,011) (2,029) Assets distributed on settlement (Note 10) – – (8,195) – Administration costs (898) – (1,477) –
Fair value of plan assets, end of year $ 487,884 $ – $ 474,854 $ –
Accrued benefit obligation, beginning of year $ 660,501 $ 41,615 $ 576,664 $ 40,292 Current service cost 9,737 182 10,047 264 Employee contributions 1,502 – 1,680 – Benefit payments (44,725) (2,014) (35,011) (2,029) Defined benefit obligation extinguished on settlement (Note 10) – – (7,541) – Interest cost 25,848 1,507 26,901 1,762 Curtailment gain (1,096) (538) (312) (1,701) Past service costs (2,449) (4,169) – – Actuarial (gains) losses due to:
Experience adjustments (13,516) 1,033 – (739) Changes in demographic assumptions – (53) 19,966 306 Changes in financial assumptions (3,203) 381 68,107 3,460
Defined benefit obligation, end of year $ 632,599 $ 37,944 $ 660,501 $ 41,615
Net defined benefit obligation $ (144,715) $ (37,944) $ (185,647) $ (41,615)
1 Including unfunded supplementary defined benefit pension plans.
While all the plans are not considered fully funded for financial reporting purposes, registered plans are funded in accordance with the applicable statutory funding rules and regulations governing the particular plans.
The significant assumptions adopted in measuring Yellow Pages Limited’s pension and other benefit obligations as at December 31, 2015 and 2014 were as follows:
As at December 31, 2015 December 31, 2014
Pension Other Pension Other Benefits Benefits Benefits Benefits Post-employment benefit obligation Discount rate, end of year 4.00% 4.00% 4.00% 4.00% Rate of compensation increase 2.95% 2.95% 3.00% 3.00% Net benefit plan costs Discount rate, end of preceding year 4.00% 4.00% 4.75% 4.75% Rate of compensation increase 3.00% 3.00% 3.00% 3.00% Weighted average duration (years) 15 13 16 13
For measurement purposes, a 6.7% annual increase in the per capita cost of covered medical care benefits (the medical care cost trend rate) was assumed in 2015. The rate of increase of the cost of medical care was assumed to increase to 8.0% in 2016 and gradually decline to 5.0% by 2026 and to remain at that level thereafter. A 4.5% annual increase in per capita cost of covered dental care benefits was assumed in 2015. The rate of increase of the cost of covered dental care was assumed to increase to 6.0% in 2016 and gradually decline to 4.0% by 2026 and to remain at that level thereafter.
YELLOW PAGES LIMITED 2015 ANNUAL REPORT 61
NOTES TO THE CONSOLIDATED FINANCIAL STATEMENTS – DECEMBER 31, 2015(ALL TABULAR AMOUNTS ARE IN THOUSANDS OF CANADIAN DOLLARS, EXCEPT SHARE INFORMATION)

YELLOW PAGES LIMITED Notes to Consolidated Financial Statements – December 31, 2015 (all tabular amounts are in thousands of Canadian dollars, except share information)
26 ANNUAL REPORT 2015
The following table shows how the defined benefit obligation as at December 31, 2015 would have been affected by changes that were reasonably possible at that date in each significant actuarial assumption:
Pension Benefits
Other Benefits
Decrease of 0.25% in discount rate, end of year $ 24,605 $ 1,376 Increase of 0.25% in rate of compensation $ 2,968 $ – Increase of 1% in health care cost trend rates $ N/A $ 2,761
The net benefit plan costs included in the income statements are the following components:
For the years ended December 31,
2015 2014
Pension Benefits
Other Benefits
Pension Benefits
Other Benefits
Current service cost $ 9,737 $ 182 $ 10,047 $ 264 Administration costs 898 – 1,477 – Past service costs (2,449) (4,169) – –
Service cost1 $ 8,186 $ (3,987) $ 11,524 $ 264
Curtailment gain $ (1,096) $ (538) $ (312) $ (1,701) Loss on settlement – – 654 –
Net curtailment (gain) loss (Note 10) $ (1,096) $ (538) $ 342 $ (1,701)
Interest cost $ 25,848 $ 1,507 $ 26,901 $ 1,762 Interest income (18,838) – (20,534) –
Net interest on the net defined benefit obligation (Note 19) $ 7,010 $ 1,507 $ 6,367 $ 1,762 Net benefit costs (recovery) recognized in the income statement $ 14,100 $ (3,018) $ 18,233 $ 325 Actuarial (gains) losses recognized in other comprehensive income $ (19,808) $ 1,361 $ 56,970 $ 3,027 Total net benefit plan (recovery) costs for the Yellow Pages (“YP”)
defined benefit plans $ (5,708) $ (1,657) $ 75,203 $ 3,352 Net benefit plan costs for the YP defined contribution plans1 7,332 – 6,500 –
Total net benefit plan costs (recovery) $ 1,624 $ (1,657) $ 81,703 $ 3,352
1 Included in operating costs.
As a result of workforce reductions, the number of employees covered by the pension plans decreased, and this restructuring gave rise to a curtailment gain as at October 8, 2015 and a curtailment gain and loss on settlement as at March 1, 2014 (refer to Note 10 – Provisions).
During the year ended December 31, 2015, the Company amended the retirement and post-employment benefit plans for certain groups of employees. These amendments were made prospectively and applied only to certain groups of employees and included among other items for the affected employees, the elimination of post-retirement benefits, the elimination of post-retirement indexing for future service, the introduction of employee contributions and the reduction of short-term disability coverage. Certain of these amendments resulted in a recovery of past service costs in the amount of $6.6 million in 2015 (2014 - $nil).
YELLOW PAGES LIMITED 2015 ANNUAL REPORT62
NOTES TO THE CONSOLIDATED FINANCIAL STATEMENTS – DECEMBER 31, 2015(ALL TABULAR AMOUNTS ARE IN THOUSANDS OF CANADIAN DOLLARS, EXCEPT SHARE INFORMATION)

YELLOW PAGES LIMITED Notes to the Consolidated Financial Statements – December 31, 2015
(all tabular amounts are in thousands of Canadian dollars, except share information)
ANNUAL REPORT 2015 27
Plan assets include primarily Canadian and foreign equities, government and corporate bonds, debentures and secured mortgages. Plan assets are held in trust and the asset allocation was as follows as at December 31, 2015 and 2014:
(in percentages - %) December 31, 2015 December 31, 2014
Fair value of the plan assets: Canadian bonds and debentures 27.0 31.5 Canadian common stocks 11.0 11.0 Global common stocks – 9.5 Pooled fund units
Canadian pooled equity funds 17.5 18.0 Global pooled equity funds 31.0 21.0 Canadian pooled fixed-income funds 10.0 6.0 Pooled mortgage funds 2.0 2.0
Short-term notes and treasury bills 0.5 0.5 Cash and cash equivalents 1.0 0.5
As at December 31, 2015 and 2014, the publicly traded equity securities did not directly include any shares of Yellow Pages Limited.
The total cash payments for pension and other benefit plans made by Yellow Pages Limited amounted to $44.6 million for 2015 (2014 – $35.6 million). Total cash payments for pension and other benefit plans expected in 2016 amount to approximately $41.4 million.
Yellow Pages Limited’s funding policy is to make contributions to its pension plans based on various actuarial cost methods as permitted by pension regulatory bodies. Yellow Pages Limited is responsible to adequately fund the plans. Contributions reflect actuarial assumptions concerning future investment returns, salary projections and future service benefits.
In addition, Yellow Pages Limited recorded an expense for provincial, federal and state pension plans of $9 million for the year ended December 31, 2015 (2014 – $7.7 million).
As at December 31, 2015, Yellow Pages Limited had recognized an accumulated balance of $86.3 million, net of income taxes of $29.3 million, in actuarial losses in OCI.
12. LONG-TERM DEBT The long-term debt is comprised of the following:
As at December 31, 2015 December 31, 2014
Senior secured notes $ 406,733 $ 507,014 Obligations under finance leases 620 897
$ 407,353 $ 507,911 Less current portion1 98,530 103,152
Non-current portion $ 308,823 $ 404,759
1 The current portion of the senior secured notes may vary subject to the Excess Cash Flow clause under the indenture governing the senior secured notes.
Asset-Based Loan
In August 2013, the Company, through its subsidiary Yellow Pages Digital & Media Solutions Limited, entered into a five-year $50 million asset-based loan (“ABL”) expiring in August 2018. The ABL is used for general corporate purposes. Through the ABL, the Company has access to the funds in the form of prime rate loans, Banker’s acceptance (“BA”) equivalent loans or letters of credit. The ABL is secured by a first priority lien over the receivables of the Company. The ABL was subject to an availability reserve of $5 million if the Company’s trailing 12-month fixed charge coverage ratio is below 1.1 times. As at December 31, 2015, the Company had $4.2 million of letters of credit issued and outstanding under the ABL. As such, $45.8 million of the ABL was available as at December 31, 2015. Interest is calculated based either on the BA Rate or the Canadian Prime Rate plus an applicable margin.
The loan agreement governing the ABL contains restrictive covenants, including restrictions on the incurrence of additional indebtedness, the payment of dividends and other payment restrictions, the creation of liens, sale and leaseback transactions, mergers, consolidations and sales of assets, and certain transactions with affiliates and its business activities.
As at December 31, 2015 and 2014, the Company was in compliance with all covenants under the loan agreement governing the ABL.
YELLOW PAGES LIMITED 2015 ANNUAL REPORT 63
NOTES TO THE CONSOLIDATED FINANCIAL STATEMENTS – DECEMBER 31, 2015(ALL TABULAR AMOUNTS ARE IN THOUSANDS OF CANADIAN DOLLARS, EXCEPT SHARE INFORMATION)
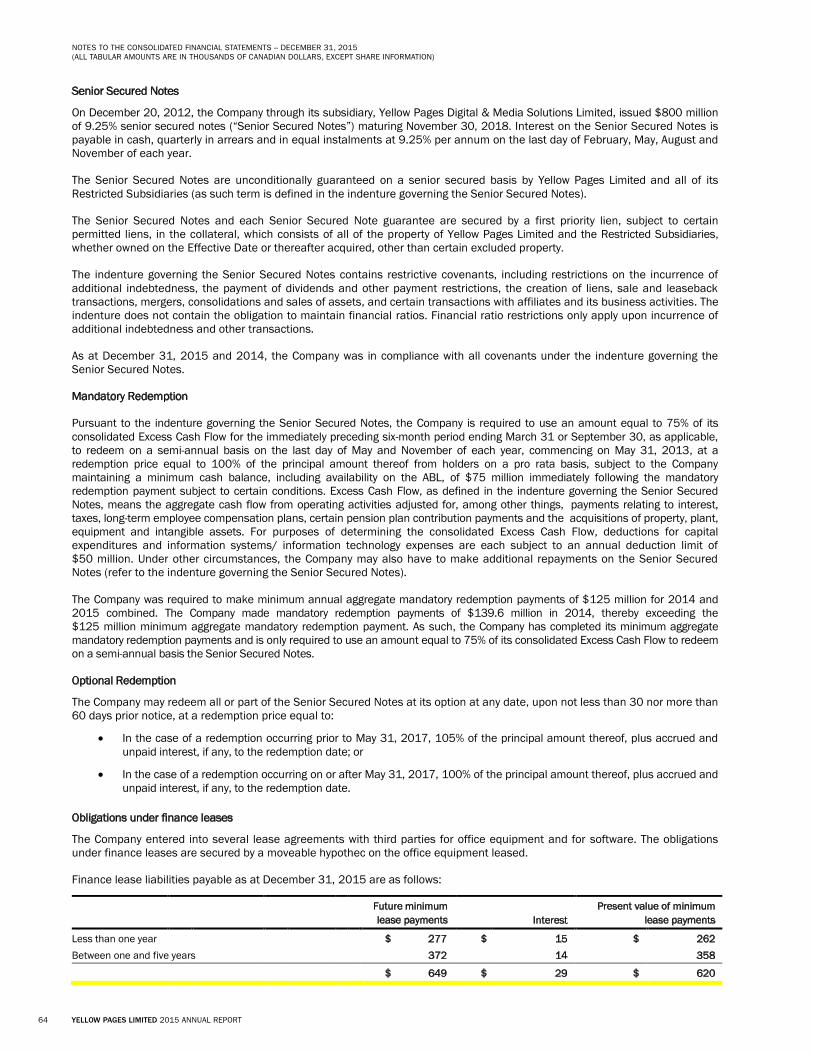
YELLOW PAGES LIMITED Notes to Consolidated Financial Statements – December 31, 2015 (all tabular amounts are in thousands of Canadian dollars, except share information)
28 ANNUAL REPORT 2015
Senior Secured Notes
On December 20, 2012, the Company through its subsidiary, Yellow Pages Digital & Media Solutions Limited, issued $800 million of 9.25% senior secured notes (“Senior Secured Notes”) maturing November 30, 2018. Interest on the Senior Secured Notes is payable in cash, quarterly in arrears and in equal instalments at 9.25% per annum on the last day of February, May, August and November of each year.
The Senior Secured Notes are unconditionally guaranteed on a senior secured basis by Yellow Pages Limited and all of its Restricted Subsidiaries (as such term is defined in the indenture governing the Senior Secured Notes).
The Senior Secured Notes and each Senior Secured Note guarantee are secured by a first priority lien, subject to certain permitted liens, in the collateral, which consists of all of the property of Yellow Pages Limited and the Restricted Subsidiaries, whether owned on the Effective Date or thereafter acquired, other than certain excluded property.
The indenture governing the Senior Secured Notes contains restrictive covenants, including restrictions on the incurrence of additional indebtedness, the payment of dividends and other payment restrictions, the creation of liens, sale and leaseback transactions, mergers, consolidations and sales of assets, and certain transactions with affiliates and its business activities. The indenture does not contain the obligation to maintain financial ratios. Financial ratio restrictions only apply upon incurrence of additional indebtedness and other transactions.
As at December 31, 2015 and 2014, the Company was in compliance with all covenants under the indenture governing the Senior Secured Notes.
Mandatory Redemption
Pursuant to the indenture governing the Senior Secured Notes, the Company is required to use an amount equal to 75% of its consolidated Excess Cash Flow for the immediately preceding six-month period ending March 31 or September 30, as applicable, to redeem on a semi-annual basis on the last day of May and November of each year, commencing on May 31, 2013, at a redemption price equal to 100% of the principal amount thereof from holders on a pro rata basis, subject to the Company maintaining a minimum cash balance, including availability on the ABL, of $75 million immediately following the mandatory redemption payment subject to certain conditions. Excess Cash Flow, as defined in the indenture governing the Senior Secured Notes, means the aggregate cash flow from operating activities adjusted for, among other things, payments relating to interest, taxes, long-term employee compensation plans, certain pension plan contribution payments and the acquisitions of property, plant, equipment and intangible assets. For purposes of determining the consolidated Excess Cash Flow, deductions for capital expenditures and information systems/ information technology expenses are each subject to an annual deduction limit of $50 million. Under other circumstances, the Company may also have to make additional repayments on the Senior Secured Notes (refer to the indenture governing the Senior Secured Notes).
The Company was required to make minimum annual aggregate mandatory redemption payments of $125 million for 2014 and 2015 combined. The Company made mandatory redemption payments of $139.6 million in 2014, thereby exceeding the $125 million minimum aggregate mandatory redemption payment. As such, the Company has completed its minimum aggregate mandatory redemption payments and is only required to use an amount equal to 75% of its consolidated Excess Cash Flow to redeem on a semi-annual basis the Senior Secured Notes.
Optional Redemption
The Company may redeem all or part of the Senior Secured Notes at its option at any date, upon not less than 30 nor more than 60 days prior notice, at a redemption price equal to:
In the case of a redemption occurring prior to May 31, 2017, 105% of the principal amount thereof, plus accrued and unpaid interest, if any, to the redemption date; or
In the case of a redemption occurring on or after May 31, 2017, 100% of the principal amount thereof, plus accrued and unpaid interest, if any, to the redemption date.
Obligations under finance leases
The Company entered into several lease agreements with third parties for office equipment and for software. The obligations under finance leases are secured by a moveable hypothec on the office equipment leased.
Finance lease liabilities payable as at December 31, 2015 are as follows:
Future minimum lease payments Interest
Present value of minimum lease payments
Less than one year $ 277 $ 15 $ 262 Between one and five years 372 14 358
$ 649 $ 29 $ 620
YELLOW PAGES LIMITED 2015 ANNUAL REPORT64
NOTES TO THE CONSOLIDATED FINANCIAL STATEMENTS – DECEMBER 31, 2015(ALL TABULAR AMOUNTS ARE IN THOUSANDS OF CANADIAN DOLLARS, EXCEPT SHARE INFORMATION)

YELLOW PAGES LIMITED Notes to the Consolidated Financial Statements – December 31, 2015
(all tabular amounts are in thousands of Canadian dollars, except share information)
ANNUAL REPORT 2015 29
13. EXCHANGEABLE DEBENTURES As at December 31, 2015 December 31, 2014
Face value of exchangeable debentures $ 107,089 $ 107,089
Less unaccreted interest 16,611 18,130
$ 90,478 $ 88,959
On December 20, 2012, the Company through its subsidiary Yellow Pages Digital & Media Solutions Limited, issued $107.5 million of senior subordinated exchangeable debentures (“Exchangeable Debentures”) due November 30, 2022. Interest on the Exchangeable Debentures accrues at a rate of 8% per annum if for the applicable interest period, it is paid in cash, or 12% per annum if the Company makes a Payment in Kind (“PIK”) election to pay interest in respect of all or any part of the then outstanding Exchangeable Debentures in additional Exchangeable Debentures. Interest on the Exchangeable Debentures is payable semi-annually in arrears, and in equal instalments on the last day of May and November of each year. The initial fair value on December 20, 2012 of the Exchangeable Debentures was $91.6 million.
The Exchangeable Debentures are senior subordinated and unsecured obligations of Yellow Pages Digital & Media Solutions Limited. The Exchangeable Debentures are unconditionally guaranteed on a subordinated unsecured basis by Yellow Pages Limited and all of its Restricted Subsidiaries (as such term is defined in the indenture governing the Exchangeable Debentures).
The indenture governing the Exchangeable Debentures contains restrictive covenants, including restrictions on the incurrence of additional indebtedness, the payment of dividends and other payment restrictions, the creation of liens, sale and leaseback transactions, mergers, consolidations and sales of assets and certain transactions with affiliates. The indenture does not contain the obligation to maintain financial ratios. Financial ratio restrictions only apply upon incurrence of indebtedness and other transactions.
As at December 31, 2015 and 2014, the Company was in compliance with all covenants under the indenture governing the Exchangeable Debentures.
Exchange Option
The Exchangeable Debentures are exchangeable at the holder’s option into common shares at any time at an exchange price per common share equal to $19.04, subject to adjustment for specified transactions.
The conversion option was valued at $3.6 million, net of income taxes of $1.3 million, at the date of issuance and is included in Equity. The liability portion is being accreted such that the liability at maturity equals the principal amount less exchanges.
During the year ended December 31, 2014, $0.4 million of Exchangeable Debentures at face value were exchanged for 21,584 common shares of Yellow Pages Limited with a fair value of $0.5 million.
Optional Redemption
The Company may, at any time on or after the date on which all of the Senior Secured Notes have been paid in full, redeem all or part of the Exchangeable Debentures at its option at a redemption price equal to:
in the case of a redemption occurring prior to May 31, 2021, 110% of the principal amount thereof, plus accrued and unpaid interest, if any, to the redemption date; or
in the case of a redemption occurring on or after May 31, 2021, 100% of the principal amount thereof, plus accrued and unpaid interest, if any, to the redemption date.
The redemption option for cash is an embedded derivative and is recorded at fair value on the consolidated statements of financial position with changes in fair value recognized in financial charges. The fair value was $0.5 million as at December 31, 2015 (2014 - $0.1 million).
YELLOW PAGES LIMITED 2015 ANNUAL REPORT 65
NOTES TO THE CONSOLIDATED FINANCIAL STATEMENTS – DECEMBER 31, 2015(ALL TABULAR AMOUNTS ARE IN THOUSANDS OF CANADIAN DOLLARS, EXCEPT SHARE INFORMATION)
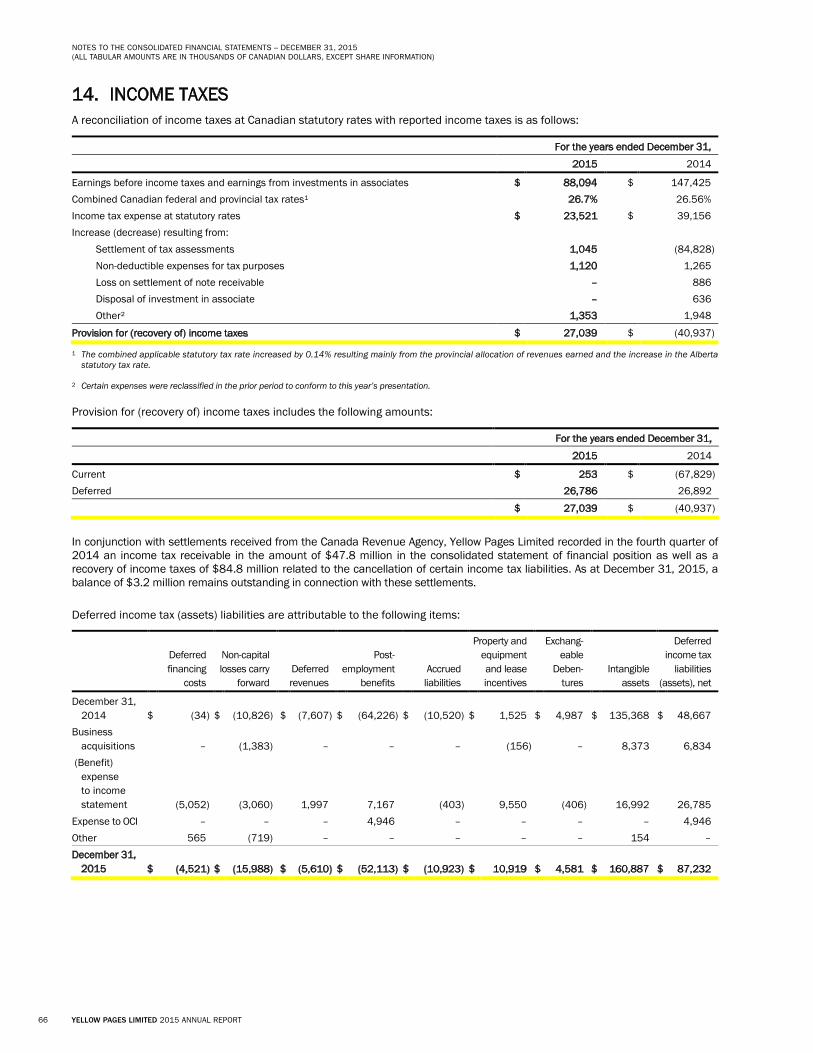
YELLOW PAGES LIMITED Notes to Consolidated Financial Statements – December 31, 2015 (all tabular amounts are in thousands of Canadian dollars, except share information)
30 ANNUAL REPORT 2015
14. INCOME TAXES A reconciliation of income taxes at Canadian statutory rates with reported income taxes is as follows:
For the years ended December 31,
2015 2014
Earnings before income taxes and earnings from investments in associates $ 88,094 $ 147,425 Combined Canadian federal and provincial tax rates1 26.7% 26.56% Income tax expense at statutory rates $ 23,521 $ 39,156 Increase (decrease) resulting from:
Settlement of tax assessments 1,045 (84,828) Non-deductible expenses for tax purposes 1,120 1,265 Loss on settlement of note receivable – 886 Disposal of investment in associate – 636 Other² 1,353 1,948
Provision for (recovery of) income taxes $ 27,039 $ (40,937)
1 The combined applicable statutory tax rate increased by 0.14% resulting mainly from the provincial allocation of revenues earned and the increase in the Alberta statutory tax rate.
2 Certain expenses were reclassified in the prior period to conform to this year’s presentation. Provision for (recovery of) income taxes includes the following amounts:
For the years ended December 31,
2015 2014
Current $ 253 $ (67,829) Deferred 26,786 26,892
$ 27,039 $ (40,937)
In conjunction with settlements received from the Canada Revenue Agency, Yellow Pages Limited recorded in the fourth quarter of 2014 an income tax receivable in the amount of $47.8 million in the consolidated statement of financial position as well as a recovery of income taxes of $84.8 million related to the cancellation of certain income tax liabilities. As at December 31, 2015, a balance of $3.2 million remains outstanding in connection with these settlements.
Deferred income tax (assets) liabilities are attributable to the following items:
Deferred financing
costs
Non-capital losses carry
forward Deferred revenues
Post-employment
benefits Accrued
liabilities
Property and equipment and lease incentives
Exchang-eable
Deben-tures
Intangible assets
Deferred income tax
liabilities (assets), net
December 31, 2014 $ (34) $ (10,826) $ (7,607) $ (64,226) $ (10,520) $ 1,525 $ 4,987 $ 135,368 $ 48,667
Business acquisitions – (1,383) – – – (156) – 8,373 6,834
(Benefit) expense to income statement (5,052) (3,060) 1,997 7,167 (403) 9,550 (406) 16,992 26,785
Expense to OCI – – – 4,946 – – – – 4,946 Other 565 (719) – – – – – 154 – December 31,
2015 $ (4,521) $ (15,988) $ (5,610) $ (52,113) $ (10,923) $ 10,919 $ 4,581 $ 160,887 $ 87,232
YELLOW PAGES LIMITED 2015 ANNUAL REPORT66
NOTES TO THE CONSOLIDATED FINANCIAL STATEMENTS – DECEMBER 31, 2015(ALL TABULAR AMOUNTS ARE IN THOUSANDS OF CANADIAN DOLLARS, EXCEPT SHARE INFORMATION)

YELLOW PAGES LIMITED Notes to the Consolidated Financial Statements – December 31, 2015
(all tabular amounts are in thousands of Canadian dollars, except share information)
ANNUAL REPORT 2015 31
Deferred financing
costs
Non-capital losses carry
forward Deferred revenues
Post-employment
benefits Accrued
liabilities
Property and equipment and lease incentives
Exchang-eable
Deben-tures
Intangible assets
Deferred income tax
liabilities (assets), net
December 31, 2013 $ (4,765) $ (4,057) $ (9,469) $ (48,818) $ (13,127) $ (4,798) $ 5,259 $ 109,099 $ 29,324
Business acquisitions – (3,936) – – – – – 3,665 (271)
Expense (benefit) to income statement 4,731 (2,833) 1,862 527 2,607 6,323 (272) 13,947 26,892
Benefit to OCI – – – (15,935) – – – – (15,935) Other – – – – – – – 8,657 8,657 December 31,
2014 $ (34) $ (10,826) $ (7,607) $ (64,226) $ (10,520) $ 1,525 $ 4,987 $ 135,368 $ 48,667
As at December 31, 2015, the Company had not recognized deferred income tax assets with respect to foreign operating losses of $143.3 million which expire from 2028 to 2035, Canadian capital losses of $9.1 million which can be utilized indefinitely, and deductible temporary differences of $170.5 million.
15. SHAREHOLDERS’ CAPITAL Common shares
An unlimited number of common shares are authorized to be issued.
For the year ended December 31, 2015
Number of Shares Amount
Balance, December 31, 2014 27,976,661 $ 4,030,325 Exercise of stock options (Note 17) 87,250 1,203 Exchange of common share purchase warrants 8 –
Balance, December 31, 2015 28,063,919 $ 4,031,528
For the year ended December 31, 2014
Number of Shares Amount
Balance, December 31, 2013 27,955,077 $ 4,029,869 Exchange of Exchangeable Debentures (Note 13) 21,584 456
Balance, December 31, 2014 27,976,661 $ 4,030,325
Warrants
On December 20, 2012, the Company issued 2,995,506 common share purchase warrants (“Warrants”).
During the year ended December 31, 2015, 8 Warrants were exercised in exchange for 8 common shares of Yellow Pages Limited (2014 – nil). As at December 31, 2015 and December 31, 2014, the Company had a total of 2,995,498 and 2,995,506 Warrants outstanding, respectively.
Each Warrant is transferable and entitles the holder to purchase one common share of Yellow Pages Limited at an exercise price of $28.16 per Warrant payable in cash at any time on or prior to December 20, 2022. The fair value of the Warrants on December 20, 2012 was $1.5 million. The fair value of the Warrants was calculated using a binomial option pricing model with the following assumptions:
Risk free interest rate 2.27% Expected life 10 years Expiry date December 20, 2022 Expected volatility 33.5%
YELLOW PAGES LIMITED 2015 ANNUAL REPORT 67
NOTES TO THE CONSOLIDATED FINANCIAL STATEMENTS – DECEMBER 31, 2015(ALL TABULAR AMOUNTS ARE IN THOUSANDS OF CANADIAN DOLLARS, EXCEPT SHARE INFORMATION)

YELLOW PAGES LIMITED Notes to Consolidated Financial Statements – December 31, 2015 (all tabular amounts are in thousands of Canadian dollars, except share information)
32 ANNUAL REPORT 2015
16. EARNINGS PER SHARE The following table reconciles the net earnings attributable to common shareholders and the weighted average number of shares outstanding used in computing basic earnings per share to weighted average number of shares outstanding used in computing diluted earnings per share:
For the years ended December 31,
2015 2014
Weighted average number of shares outstanding used in computing basic earnings per share 26,688,369 27,128,062 Dilutive effect of restricted share units and performance share units 1,082,187 813,909 Dilutive effect of stock options 71,250 142,945 Dilutive effect of Exchangeable Debentures 5,624,422 5,624,422 Weighted average number of shares outstanding used in computing diluted earnings per share 33,466,228 33,709,338 For the years ended December 31,
2015 2014
Net earnings available to common shareholders of Yellow Pages Limited used in the computation of basic and diluted earnings per share $ 61,055 $ 188,540
Impact of assumed conversion of Exchangeable Debentures, net of applicable taxes 7,393 7,291
Net earnings adjusted for dilutive effect $ 68,448 $ 195,831
For the years ended December 31, 2015 and 2014, the diluted earnings per share calculation did not take into consideration the potential dilutive effect of the Warrants (refer to Note 15 – Shareholders’ capital) as well as certain stock options that are not in the money as they are not dilutive.
17. STOCK-BASED COMPENSATION PLANS Yellow Pages Limited’s stock-based compensation plans consist of restricted share units, performance share units, deferred share units and stock options of Yellow Pages Limited.
Restricted Share Unit and Performance Share Unit Plan
On May 6, 2013, Yellow Pages Limited adopted a restricted share unit and performance share unit plan (the “RSU and PSU Plan”) to reward key employees and officers of Yellow Pages Limited (the “Participants”). Following the implementation of the RSU and PSU Plan, Yellow Pages Limited granted to Participants a number of restricted share units (“RSUs”) and/or performance share units (“PSUs”), as applicable, based on the volume weighted average trading price of the common shares for the five days immediately preceding the grant date. The RSUs are time-based awards and will vest upon the continuous employment of the Participants for a period of 36 months starting from the date of the grant or such other period not exceeding 36 months determined by the Board of Directors. The PSUs are performance-based awards and will vest upon confirmation by the Board of Directors of the achievement of specified performance targets and upon the continuous employment of the Participants for a period of 36 months starting from the date of the grant or such other period not exceeding 36 months determined by the Board of Directors. The PSUs for which the performance targets have not been achieved shall automatically be forfeited and cancelled.
Pursuant to the terms of the RSU and PSU Plan, if the RSU and PSU Plan is funded, Participants will receive, upon vesting of the RSUs and PSUs, common shares of the Company acquired on the open market. In the event the RSU and PSU Plan is unfunded, Yellow Pages Limited will pay to the Participant an amount in cash, equivalent to the number of RSUs or PSUs that have vested.
The number of PSUs that vest could potentially reach up to one-and-a-half times the actual number of PSUs awarded if the actual performance reaches the maximum level of performance targets.
During the year ended December 31, 2015, 417,669 common shares of Yellow Pages Limited (2014 - 571,322) were purchased on the open market of the TSX by the trustee appointed under the RSU and PSU Plan at a cost of $6.8 million (2014 - $12.5 million) and are restricted for the purpose of funding of the RSU and PSU Plan. The total number of common shares of Yellow Pages Limited held by the trustee for the purpose of funding the RSU and PSU Plan amounted to 1,378,141 as at December 31, 2015.
YELLOW PAGES LIMITED 2015 ANNUAL REPORT68
NOTES TO THE CONSOLIDATED FINANCIAL STATEMENTS – DECEMBER 31, 2015(ALL TABULAR AMOUNTS ARE IN THOUSANDS OF CANADIAN DOLLARS, EXCEPT SHARE INFORMATION)

YELLOW PAGES LIMITED Notes to the Consolidated Financial Statements – December 31, 2015
(all tabular amounts are in thousands of Canadian dollars, except share information)
ANNUAL REPORT 2015 33
The following table summarizes the status of the RSU and PSU grants during the years ended December 31:
2015 2014
Number of RSUs PSUs¹ RSUs PSUs¹
Outstanding, beginning of period 399,238 363,290 252,655 131,776 Granted 265,716 360,843 198,008 286,609 Settled (58,517) – (6,815) – Forfeited (141,513) (204,016) (44,610) (55,095) Outstanding, end of period 464,924 520,117 399,238 363,290 Weighted average remaining life (years) 1.1 1.4 1.4 1.7
1 The outstanding number of PSUs represents a payout of 100%. In addition, the potential payout in excess of 100% and limited to a maximum payout of 150% amounted to 259,997 common shares as at December 31, 2015 (2014 – 181,607 common shares).
During the year ended December 31, 2015, an expense of $5.9 million (2014 - $4.4 million) was recorded in the consolidated income statement in relation to the RSU and PSU Plan.
Deferred Share Unit Plan
On June 12, 2013, Yellow Pages Limited adopted a deferred share unit plan (the “DSU Plan”). The DSU Plan was amended in October 2013 to provide for the participation by eligible employees as designated by the Board of Directors. The Company shall settle the vested DSUs in cash or in common shares of Yellow Pages Limited acquired on the open market at the discretion of the Company when a Director leaves the Board of Directors or an eligible employee ceases employment with the Company.
The following table summarizes the status of the DSU grants during the years ended December 31:
2015 2014
Number of DSUs Liability¹ Number of DSUs Liability¹
Outstanding, beginning of period 151,141 $ 2,959 100,557 $ 2,067 Granted 41,823 800 50,584 1,056 Variation due to change in stock price – (812) – (164)
Outstanding and vested, end of period 192,964 $ 2,947 151,141 $ 2,959
1 The liability related to the DSU Plan is recorded in trade and other payables, and the expense related to the units vested and the variation due to changes in stock price is included in operating costs.
Stock Options
On December 20, 2012, as part of the implementation of Yellow Pages Limited’s Recapitalization transaction, a new stock option plan (the “Stock Option Plan”) was adopted. The Stock Option Plan is intended to attract and retain the services of selected employees of Yellow Pages Limited who are in a position to make a material contribution to the successful operation of the business, provide meaningful incentive to management to lead Yellow Pages Limited through the transformation of its business and to more closely align the interests of management with those of the shareholders of Yellow Pages Limited. A maximum of 1,290,612 stock options may be granted under the Stock Option Plan.
The following table summarizes the status of the stock option grants during the years ended December 31:
2015 2014
Number of options Weighted average
exercise price per option Number of options Weighted average
exercise price per option
Outstanding, beginning of period 480,200 $ 15.10 376,000 $ 10.12 Granted 243,300 $ 16.50 195,800 $ 24.35 Exercised (87,250) $ 10.12 $
Forfeited (113,300) $ 16.05 (91,600) $ 14.42 Outstanding, end of period 522,950 $ 16.38 480,200 $ 15.10
Exercisable, end of period 78,000 $ 10.12 $
YELLOW PAGES LIMITED 2015 ANNUAL REPORT 69
NOTES TO THE CONSOLIDATED FINANCIAL STATEMENTS – DECEMBER 31, 2015(ALL TABULAR AMOUNTS ARE IN THOUSANDS OF CANADIAN DOLLARS, EXCEPT SHARE INFORMATION)

YELLOW PAGES LIMITED Notes to Consolidated Financial Statements – December 31, 2015 (all tabular amounts are in thousands of Canadian dollars, except share information)
34 ANNUAL REPORT 2015
The following table provides additional information about Yellow Pages Limited’s Stock Option Plan as at December 31:
2015 2014
Exercise price Number of options
outstanding Weighted average
remaining life Number of options
outstanding Weighted average
remaining life
$10.12 178,750 4.4 311,500 5.4 $16.44 195,900 6.2 $17.96 9,200 6.4 $19.61 7,700 5.5 7,700 6.5 $20.33 4,900 5.4 4,900 6.4 $24.65 126,500 5.2 156,100 6.2
Outstanding, end of period 522,950 5.3 480,200 5.6
Exercisable, end of period 78,000 4.4
Stock options were valued using a binomial option pricing model. Expected volatility is based on the historical share price volatility over the average expected life of the options granted. The following table shows the key inputs into the valuation model for the years ended December 31:
2015 2014
Weighted average grant share date price $ 15.90 $ 25.00 Exercise price $ 16.50 $ 24.35 Expected volatility 38% 30% -Option life 7 years 7 years Risk-free interest rate 1.44% 2.40% Weighted average remaining life 6.2 years 6.2 years
An expense of $0.8 million was recorded during the year ended December 31, 2015 (2014 - $1.2 million) in relation to the Stock Option Plan.
18. OPERATING COSTS
For the years ended December 31,
2015 2014
Salaries, commissions and benefits $ 295,628 $ 285,025 Supply chain and logistics1 109,669 110,489 Other goods and services2 104,926 111,416 Information systems 47,679 45,533 Bad debt expense (Note 22) 11,182 9,089
$ 569,084 $ 561,552
¹ Supply chain and logistics costs relate to external supplier costs for manufacturing and distribution of our print and online products.
2 Other goods and services include promotion and advertising costs, real estate, telecommunications, office services, consulting services including contractors and professional fees. Operating leases recognized in operating costs during the year amounted to $20.4 million (2014 - $19.7 million).
19. FINANCIAL CHARGES, NET The significant components of the financial charges are as follows:
For the years ended December 31,
2015 2014
Interest on long-term debt and Exchangeable Debentures $ 53,111 $ 63,897 Net interest on the defined benefit obligations (Note 11) 8,517 8,129 Reclassification of accumulated foreign currency translation loss (Note 6) 1,598 Gain on business acquisition (Note 5) (3,613) Loss on the settlement of note receivable (Note 22) 1,150 Other, net (706) 955
$ 60,922 $ 72,116
YELLOW PAGES LIMITED 2015 ANNUAL REPORT70
NOTES TO THE CONSOLIDATED FINANCIAL STATEMENTS – DECEMBER 31, 2015(ALL TABULAR AMOUNTS ARE IN THOUSANDS OF CANADIAN DOLLARS, EXCEPT SHARE INFORMATION)

YELLOW PAGES LIMITED Notes to the Consolidated Financial Statements – December 31, 2015
(all tabular amounts are in thousands of Canadian dollars, except share information)
ANNUAL REPORT 2015 35
20. SUPPLEMENTAL DISCLOSURE OF CASH FLOW INFORMATION The following are non-cash transactions:
For the years ended December 31,
2015 2014
Additions to property and equipment included in trade and other payables $ 462 $ 1,903 Additions to intangible assets included in trade and other payables $ 5,516 $ 4,485 Additions to property and equipment under finance leases $ 102 $ 540 Exchange of Exchangeable Debentures (Note 13) $ $ 456
21. COMMITMENT AND CONTINGENCIES a) As at December 31, 2015, Yellow Pages Limited has commitments under various leases for premises, equipment, purchase and service contract obligations for both operating and capital expenditures for each of the next five years and thereafter, and in the aggregate of:
Operating leases Other Total commitments
2016 $ 21,771 $ 39,881 $ 61,652 2017 19,487 14,185 33,672 2018 9,309 10,514 19,823 2019 6,915 426 7,341 2020 6,006 424 6,430 Thereafter 82,238 4,032 86,270
$ 145,726 $ 69,462 $ 215,188
Under certain lease agreements, incentives for leasehold improvements exist. These lease incentives are accounted for as part of deferred credits and amount to $6.5 million.
b) Yellow Pages Limited has four billing and collection services agreements. The term of the Billing and Collection Services Agreement with Bell Canada (“Bell”) expires on December 31, 2017. The agreement with TELUS Communications Inc. (“TELUS”) expires in 2031. The agreement with MTS Inc. expires on October 2, 2016, with two automatic renewal periods for ten years. The agreement with Bell Canada Inc. (as successor to Bell Aliant Regional Communications LP) expires on April 30, 2017, with two automatic renewal periods for ten years.
Pursuant to publication agreements with each of Bell, TELUS, MTS Inc. and Bell Canada Inc., Yellow Pages Limited produces alphabetical listing telephone directories for each of these companies in order for them to meet their regulatory obligations.
The Company also entered into several other agreements with Bell, TELUS, MTS Inc. and Bell Canada Inc., providing for the use of listing information and trademarks for the publications of directories. If the Company materially fails to perform its obligations under the publication agreements mentioned above and as a result these publication agreements are terminated in accordance with their terms, these other listing information and trademark licenses with Bell, TELUS, MTS Inc. or Bell Canada Inc., as the case may be, may also be terminated. These other agreements with Bell, TELUS, MTS Inc. and Bell Canada Inc. will terminate between 2031 and 2037.
c) Yellow Pages Limited entered into directory printing agreements with its printing suppliers to print, bind and furnish alphabetical, classified and combined directories as well as other publications. It also entered into distribution agreements.
d) Yellow Pages Limited is subject to various claims and proceedings which have been instituted against it during the normal course of business for which certain of the claims are provided for and included in trade and other payables, and provisions based on management’s best estimate of the likelihood of the outcome. Management believes that the disposition of the matters pending or asserted is not expected to have any material adverse effect on the financial position, financial performance or cash flows of Yellow Pages Limited.
YELLOW PAGES LIMITED 2015 ANNUAL REPORT 71
NOTES TO THE CONSOLIDATED FINANCIAL STATEMENTS – DECEMBER 31, 2015(ALL TABULAR AMOUNTS ARE IN THOUSANDS OF CANADIAN DOLLARS, EXCEPT SHARE INFORMATION)

YELLOW PAGES LIMITED Notes to Consolidated Financial Statements – December 31, 2015 (all tabular amounts are in thousands of Canadian dollars, except share information)
36 ANNUAL REPORT 2015
22. FINANCIAL RISK MANAGEMENT
Credit Risk Credit risk stems primarily from the potential inability of a customer or counterparty to a financial instrument to meet its contractual obligations. Yellow Pages Limited is exposed to credit risk with respect to cash and trade receivables from customers. The carrying value of financial assets represents Yellow Pages Limited’s maximum exposure.
Credit risk associated with cash is minimized substantially by ensuring that these financial assets are placed with creditworthy counterparties. An ongoing review is performed to evaluate changes in the status of counterparties.
Yellow Pages Limited’s extension of credit to customers involves judgment. Yellow Pages Limited has established internal controls designed to mitigate credit risk, including a formal credit policy managed by its credit department. New customers, customers increasing their advertising spend by a certain threshold and customers not respecting payment terms are subject to a specific vetting and approval process.
Yellow Pages Limited considers that it has limited exposure to concentration of credit risk with respect to trade receivables from customers due to its large and diverse customer base operating in numerous industries and its geographic diversity. There are no individual customers that account for 1% or more of revenues and there are no trade receivables from any one individual customer that exceeds 5% of the total balance of trade receivables at any point in time during the year.
Bell, TELUS, MTS Inc. and Bell Canada Inc. provide Yellow Pages Limited with customer collection services with respect to advertisers who are also their customers. As such, they receive money from customers on behalf of Yellow Pages Limited. Yellow Pages Limited retains the ultimate collection risk on these receivables.
Allowance for doubtful accounts and past due receivables are reviewed by management at each statement of financial position date. Yellow Pages Limited updates its estimate of the allowance for doubtful accounts based on the evaluation of the recoverability of trade receivable balances of each customer taking into account historic collection trends of past due accounts and current economic conditions. Trade receivables are written off once determined not to be collectible. Subsequent recoveries of amounts previously written off are credited to the income statement.
In 2011, Yellow Pages Limited sold Trader Corporation. The purchase price consideration included a note receivable of $15 million. The note receivable was to mature in 2020. Interest and principal on the note receivable was subordinated to the senior debt of Trader Corporation. In May 2014, Yellow Pages Limited settled this note receivable, which had a carrying value of $15.3 million, including accrued interest of $3.4 million, for $14.1 million, and recorded a loss of $1.2 million in financial charges (refer to Note 19 – Financial charges, net).
The components of trade and other receivables are as follows:
As at December 31, 2015 December 31, 2014
Trade receivables Current $ 65,147 $ 73,498 Past due less than 180 days 26,801 29,950 Past due over 180 days 4,901 5,783
Trade receivables $ 96,849 $ 109,231
Other receivables1 $ 26,977 $ 23,047
Trade and other receivables $ 123,826 $ 132,278
1 Other receivables is mainly comprised of sales tax receivables and a loan receivable associated with a forward contract.
Yellow Pages Limited’s trade receivables are stated after deducting an allowance for doubtful accounts of $12.7 million as at December 31, 2015 (2014 - $19.2 million). The movements in the allowance for doubtful accounts were as follows:
As at December 31, 2015 December 31, 2014
Balance, beginning of year $ 19,247 $ 21,122 Bad debt expense, net of recovery 11,182 9,089 Written-off (17,746) (10,964)
Balance, end of year $ 12,683 $ 19,247
YELLOW PAGES LIMITED 2015 ANNUAL REPORT72
NOTES TO THE CONSOLIDATED FINANCIAL STATEMENTS – DECEMBER 31, 2015(ALL TABULAR AMOUNTS ARE IN THOUSANDS OF CANADIAN DOLLARS, EXCEPT SHARE INFORMATION)

YELLOW PAGES LIMITED Notes to the Consolidated Financial Statements – December 31, 2015
(all tabular amounts are in thousands of Canadian dollars, except share information)
ANNUAL REPORT 2015 37
Market Risk
(i) Interest Rate Risk Yellow Pages Limited is exposed to interest rate risks resulting from fluctuations in interest rates on its ABL with rates which are generally based on the Canadian BA rate. Yellow Pages Limited does not use derivative instruments to reduce its exposure to interest rate risk. As at December 31, 2015, the ABL had $4.2 million of letters of credit issued and outstanding. The Company manages its interest rate risk by maximizing the interest income earned on excess funds while maintaining the necessary liquidity to conduct its day-to-day operations.
Yellow Pages Limited may also be exposed to fluctuations in long-term interest rates relative to the refinancing of its debt obligations upon their maturity. The interest rate on new long-term debt issuances will be based on the prevailing rates at the time of the refinancing, and will also depend on the tenor of the new debt issued. There are no upcoming maturities that will require refinancing. Changes in interest rates will also affect the fair value of future cash flows of Yellow Pages Limited’s fixed rate debt. As interest rates on the Senior Secured Notes and Exchangeable Debentures are fixed, the Company is not exposed to interest rate fluctuation risk.
(ii) Foreign Exchange Risk Yellow Pages Limited is exposed to foreign exchange risk arising from various currency transactions, which are not significant. Foreign exchange transaction risk arises primarily from commercial transactions that are denominated in a currency that is not the functional currency of Yellow Pages Limited’s business unit that is party to the transaction. Yellow Pages Limited is exposed to fluctuations in the U.S. dollar. The effect on net earnings from existing U.S. dollar exposures of a one point increase or decrease in the Canadian/U.S. dollar exchange rate is not significant. The Company’s expenditures, net of revenues, denominated in U.S. dollars were approximately $35 million for the year ended December 31, 2015.
Liquidity Risk Liquidity risk is the exposure of Yellow Pages Limited to the risk of not being able to meet its financial obligations as they become due.
Yellow Pages Limited manages this risk by maintaining detailed cash forecasts and long-term operating and strategic plans. The management of liquidity requires a constant monitoring of expected cash inflows and outflows which is achieved through a detailed forecast of the Company’s liquidity position to ensure adequate and efficient use of cash resources.
The Company was required to make minimum annual aggregate mandatory redemption payments on its Senior Secured Notes of $125 million in 2014 and 2015 combined. The Company made mandatory redemption payments of $139.6 million in 2014, thereby exceeding the $125 million minimum aggregate mandatory redemption payment. As such, the Company completed its minimum aggregate mandatory redemption payments and is only required to use an amount equal to 75% of its consolidated Excess Cash Flow to redeem on a semi-annual basis the Senior Secured Notes. This requirement is being met through internally-generated cash and cash on hand.
The following are the contractual maturities of the financial liabilities and related capital amounts:
Payments due for the years following December 31, 2015
Total 1 year 2 – 3 years 4 – 5 years After 5 years
Non-derivative financial liabilities Long-term debt1,2 $ 406,733 $ 98,268 $ 308,465 $ – $ – Obligations under finance leases1 620 262 272 86 – Exchangeable Debentures1 107,089 – – – 107,089 Trade and other payables 73,627 73,627 – – – Provisions 72,092 67,641 4,377 74 –
Total $ 660,161 $ 239,798 $ 313,114 $ 160 $ 107,089
1 Principal amount. 2 The repayment of the Senior Secured Notes may vary subject to the Excess Cash Flow clause under the indenture governing the Senior Secured Notes.
YELLOW PAGES LIMITED 2015 ANNUAL REPORT 73
NOTES TO THE CONSOLIDATED FINANCIAL STATEMENTS – DECEMBER 31, 2015(ALL TABULAR AMOUNTS ARE IN THOUSANDS OF CANADIAN DOLLARS, EXCEPT SHARE INFORMATION)

YELLOW PAGES LIMITED Notes to Consolidated Financial Statements – December 31, 2015 (all tabular amounts are in thousands of Canadian dollars, except share information)
38 ANNUAL REPORT 2015
Fair values The fair value is the price that would be received to sell an asset or paid to transfer a liability in an orderly transaction between market participants.
The fair value of cash, trade and other receivables, trade and other payables, and the current portion of provisions is approximately equal to their carrying values due to their short-term maturity.
The fair value of the Senior Secured Notes and the Exchangeable Debentures is evaluated based on quoted market prices at the statement of financial position date.
These estimates are significantly affected by assumptions including the amount and timing of estimated future cash flows and discount rates, all of which reflect varying degrees of risk.
The following schedule represents the carrying values and the fair values of financial instruments not measured at fair value on the statement of financial position:
As at December 31, 2015
Level Carrying Value Fair Value
Current portion of long-term debt 1 $ 98,530 $ 103,075 Non-current portion of long-term debt 1 $ 308,823 $ 323,089 Exchangeable Debentures 1 $ 90,478 $ 109,766
Fair value hierarchy The three levels of fair value hierarchy are as follows:
Level 1 – inputs are unadjusted quoted prices of identical instruments in active markets.
Level 2 – inputs other than quoted prices included in Level 1 that are observable for the asset or liability, either directly or indirectly.
Level 3 – inputs used in a valuation technique are not based on observable market data in determining fair values of the instruments.
Determination of fair value and the resulting hierarchy requires the use of observable market data whenever available. The classification of a financial instrument in the hierarchy is based upon the lowest level of input that is significant to the measurement of fair value.
The following table summarizes the financial instruments measured at fair value using level 3 inputs in consolidated statement of financial position, as well as the reconciliation of Level 3 fair value measurements for the years ended December 31, 2014 and 2015:
Investment – available-for-
sale Put option –
financial liability Total
As at December 31, 2013 $ 3,520 $ (18,472) $ (14,952) Gain on fair value of financial liability (put option) (Note 5) – 2,344 2,344 Settlement of financial liability (Note 5) – 16,128 16,128
As at December 31, 2014 and 2015 $ 3,520 $ – $ 3,520
The fair value of the financial liability (put option) related to 411 was the difference between the price to acquire the remaining ownership interest in the associate, which was based on a fixed multiple of adjusted earnings before income taxes, depreciation and amortization, and the fair value of the investment in the associate on June 1, 2014, using similar assumptions as those used for the online products of Yellow Pages as at December 31, 2013. Yellow Pages Limited’s available-for-sale investment is comprised of a privately held equity security and is carried at fair value based on estimates that are based on market rates prevailing at the statements of financial position date.
YELLOW PAGES LIMITED 2015 ANNUAL REPORT74
NOTES TO THE CONSOLIDATED FINANCIAL STATEMENTS – DECEMBER 31, 2015(ALL TABULAR AMOUNTS ARE IN THOUSANDS OF CANADIAN DOLLARS, EXCEPT SHARE INFORMATION)

YELLOW PAGES LIMITED Notes to the Consolidated Financial Statements – December 31, 2015
(all tabular amounts are in thousands of Canadian dollars, except share information)
ANNUAL REPORT 2015 39
23. CAPITAL DISCLOSURES Yellow Pages Limited’s objective in managing capital is to ensure sufficient liquidity to cover financial obligations and investment requirements. Reducing debt and associated interest charges is one of the Company’s primary financial goals which will improve its financial flexibility and support the implementation of its strategic objectives.
Yellow Pages Limited monitors its capital structure and makes adjustments based on the objectives described above in response to changes in economic conditions and the risk characteristics of the underlying assets and the Company’s working capital requirements.
The primary measure used by Yellow Pages Limited to monitor its financial leverage is its ratio of net debt to Latest Twelve Month Adjusted EBITDA1. Yellow Pages Limited also uses other financial metrics to monitor its financial leverage including Fixed Charge Coverage Ratio and net debt to total capitalization.
Yellow Pages Limited’s capital is comprised of net debt, Exchangeable Debentures and equity attributable to shareholders of Yellow Pages Limited as follows:
As at December 31, 2015 December 31, 2014
Cash $ 67,253 $ 102,776
Senior Secured Notes $ 406,733 $ 507,014 Exchangeable Debentures 90,478 88,959 Obligations under finance leases 620 897
Net debt $ 430,578 $ 494,094 Equity attributable to shareholders 759,524 684,180
Total capitalization $ 1,190,102 $ 1,178,274 Net debt to total capitalization 36.2% 41.9%
For the years ended December 31,
2015 2014
Latest Twelve Month Adjusted EBITDA¹ $ 260,687 $ 315,976 Net Debt to Latest Twelve Month Adjusted EBITDA ratio¹ 1.7 1.6
1 Latest twelve month income from operations before depreciation and amortization, and restructuring and special charges (“Latest Twelve Month Adjusted EBITDA”). Latest Twelve Month Adjusted EBITDA is a non-IFRS measure and may not be comparable with similar measures used by other publicly traded companies.
24. GUARANTEES In the normal course of operations, Yellow Pages Limited has entered into agreements which are customary in the industry that provide for indemnifications and guarantees to counterparties in transactions involving business acquisitions, business dispositions and sale of assets. Yellow Pages Limited has entered into agreements which contain indemnification of its directors and officers indemnifying them against expenses (including legal fees), judgments, fines and any amount actually and reasonably incurred by them in connection with any action, suit or proceeding in which the directors and/or officers are sued as a result of their service, if they acted honestly and in good faith with a view to the best interests of Yellow Pages Limited. Yellow Pages Limited benefits from directors’ and officers’ liability insurance which it has purchased. No amount has been accrued in the consolidated statement of financial position as at December 31, 2015 and 2014 with respect to these indemnities. The nature of these guarantees prevents Yellow Pages Limited from making a reasonable estimate of the maximum potential amount it could be required to pay to counterparties.
25. SEGMENTED INFORMATION The Company operates in a single business segment which is to provide Canadians with digital and print media and marketing solutions.
As at December 31, 2015, Yellow Pages Limited had non-current assets, other than deferred tax assets, held in a foreign country (United States of America) of $2.4 million (2014 - $3.1 million).
YELLOW PAGES LIMITED 2015 ANNUAL REPORT 75
NOTES TO THE CONSOLIDATED FINANCIAL STATEMENTS – DECEMBER 31, 2015(ALL TABULAR AMOUNTS ARE IN THOUSANDS OF CANADIAN DOLLARS, EXCEPT SHARE INFORMATION)
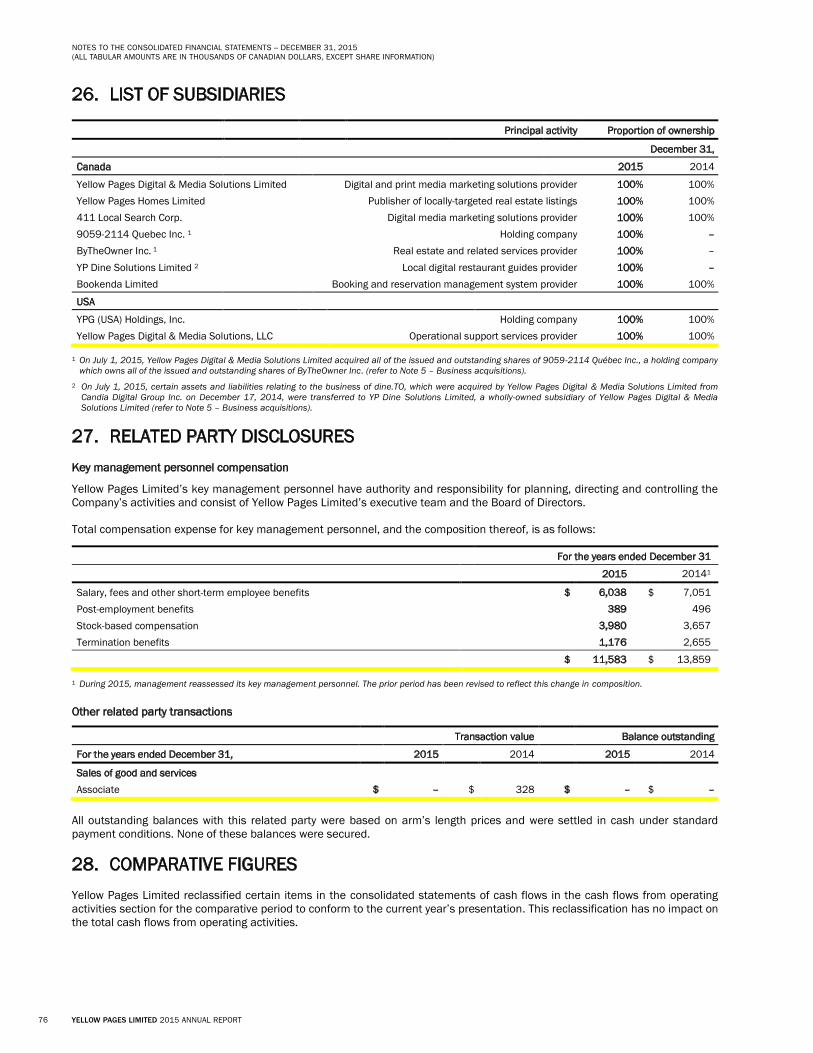
YELLOW PAGES LIMITED Notes to Consolidated Financial Statements – December 31, 2015 (all tabular amounts are in thousands of Canadian dollars, except share information)
40 ANNUAL REPORT 2015
26. LIST OF SUBSIDIARIES
Principal activity Proportion of ownership
December 31,
Canada 2015 2014
Yellow Pages Digital & Media Solutions Limited Digital and print media marketing solutions provider 100% 100% Yellow Pages Homes Limited Publisher of locally-targeted real estate listings 100% 100% 411 Local Search Corp. Digital media marketing solutions provider 100% 100% 9059-2114 Quebec Inc. 1 Holding company 100% – ByTheOwner Inc. 1 Real estate and related services provider 100% – YP Dine Solutions Limited 2 Local digital restaurant guides provider 100% – Bookenda Limited Booking and reservation management system provider 100% 100%
USA
YPG (USA) Holdings, Inc. Holding company 100% 100% Yellow Pages Digital & Media Solutions, LLC Operational support services provider 100% 100%
1 On July 1, 2015, Yellow Pages Digital & Media Solutions Limited acquired all of the issued and outstanding shares of 9059-2114 Québec Inc., a holding company which owns all of the issued and outstanding shares of ByTheOwner Inc. (refer to Note 5 – Business acquisitions).
2 On July 1, 2015, certain assets and liabilities relating to the business of dine.TO, which were acquired by Yellow Pages Digital & Media Solutions Limited from Candia Digital Group Inc. on December 17, 2014, were transferred to YP Dine Solutions Limited, a wholly-owned subsidiary of Yellow Pages Digital & Media Solutions Limited (refer to Note 5 – Business acquisitions).
27. RELATED PARTY DISCLOSURES Key management personnel compensation
Yellow Pages Limited’s key management personnel have authority and responsibility for planning, directing and controlling the Company’s activities and consist of Yellow Pages Limited’s executive team and the Board of Directors.
Total compensation expense for key management personnel, and the composition thereof, is as follows:
1 During 2015, management reassessed its key management personnel. The prior period has been revised to reflect this change in composition.
Other related party transactions
All outstanding balances with this related party were based on arm’s length prices and were settled in cash under standard payment conditions. None of these balances were secured.
28. COMPARATIVE FIGURES Yellow Pages Limited reclassified certain items in the consolidated statements of cash flows in the cash flows from operating activities section for the comparative period to conform to the current year’s presentation. This reclassification has no impact on the total cash flows from operating activities.
For the years ended December 31
2015 20141
Salary, fees and other short-term employee benefits $ 6,038 $ 7,051 Post-employment benefits 389 496 Stock-based compensation 3,980 3,657 Termination benefits 1,176 2,655
$ 11,583 $ 13,859
Transaction value Balance outstanding
For the years ended December 31, 2015 2014 2015 2014
Sales of good and services Associate $ – $ 328 $ – $ –
YELLOW PAGES LIMITED 2015 ANNUAL REPORT76
NOTES TO THE CONSOLIDATED FINANCIAL STATEMENTS – DECEMBER 31, 2015(ALL TABULAR AMOUNTS ARE IN THOUSANDS OF CANADIAN DOLLARS, EXCEPT SHARE INFORMATION)

HEAD OFFICE16 Place du Commerce Verdun, QuébecH3E 2A5
INVESTOR RELATIONSTelephone: 1 877 YLO-2003 (1 877 956-2003) E-mail: [email protected]
AUDITORDeloitte LLP
TSX SYMBOLSY Common SharesYPG.DB Senior Subordinated Unsecured Exchangeable Debentures Y.WT Warrants
TRANSFER AGENTCST Trust Company 2001 Boul. Robert-Bourassa, Suite 1600 Montréal, Québec H3A 2A6 Telephone: 1 800 387-0825E-Mail Inquiries: [email protected]
For further information on Yellow Pages Limited, visit our corporate website at www.corporate.yp.ca.

This annual report is printed on Rolland Enviro 100, the environmentally responsible choice, because it is processed chlorine free, accredited Eco-Logo and 100% post-consumer. In other words, no new trees have been cut to produce this paper, and all the fi bre comes from recycling bins.C101537
www.corporate.yp.ca
YELL
OW
PA
GES
LIM
ITED
20
15
AN
NU
AL R
EPO
RT