Embed Size (px)
Citation preview

2015 Annual Stress Test Disclosure
Dodd‐Frank Wall Street Reform and
Consumer Protection Act
March 5, 2015

Overview – 2015 Annual Stress Test • In November 2014, the Federal Reserve Board (FRB) launched the 2015
Comprehensive Capital Analysis and Review (CCAR).
– Applies to 31 bank holding companies (BHCs), including Citigroup Inc. (Citi)
• 6 BHCs with significant trading activities, including Citi, are required to apply a
hypothetical Global Market Shock to trading and counterparty exposures.
• 8 BHCs, including Citi, are subject to a Counterparty Default Scenario requirement
and must include losses from the default of their largest stressed counterparty (see
page 14).
• Citi’s CCAR submission and these disclosures are also required by the Dodd‐Frank
Wall Street Reform and Consumer Protection Act (DFA):
– Mandates annual stress testing under a set of supervisory scenarios provided by the
FRB, including the Supervisory Severely Adverse Scenario (see next page).
– Requires the FRB and BHCs participating in CCAR to publish a summary of stress test
results, including a post stress capital analysis under the Supervisory Severely
Adverse Scenario.
– Sets forth a definition of “Dodd-Frank Capital Actions” to be used by the FRB and
BHCs under the Supervisory Severely Adverse Scenario (see page 17).
2
Citi’s projections under the Supervisory Severely Adverse Scenario, as disclosed in this document or otherwise, should not be viewed or interpreted as forecasts or
expected or likely outcomes for Citi or Citibank, N.A. (CBNA). Rather, these projections are based solely on the FRB’s hypothetical Supervisory Severely Adverse Scenario
and other specific conditions required to be assumed by Citi and CBNA. These assumptions include, among others, the “Dodd-Frank Capital Actions” (see page 17), as
well as modeling assumptions necessary to project and assess the impact of the Supervisory Severely Adverse Scenario on the capital position of Citi and CBNA.

Overview – Required Scenario
• As required by the DFA stress testing rules, the FRB provided a set of three
hypothetical supervisory scenarios, including the Supervisory Severely Adverse
Scenario.
• The Supervisory Severely Adverse Scenario, the most severe of the three supervisory
scenarios, is characterized by a substantial weakening in global economic activity,
accompanied by large reductions in asset prices. In addition, the scenario features
significant increases in U.S. corporate sector financial distress, widening corporate bond
spreads, and a decline in equity prices.
– The international component of the scenario features severe recessions in the euro
area, the United Kingdom, and Japan; and below-trend growth in developing Asia.
– Reflecting flight-to-safety capital flows associated with the scenario's global recession,
the U.S. dollar is assumed to appreciate strongly against the euro and the currencies
of developing Asia, and to appreciate more modestly against the pound sterling.
– Further description of the scenario can be found in the publication 2015 Supervisory
Scenarios for Annual Stress Tests Required under the Dodd-Frank Act Stress Testing
Rules and the Capital Plan Rule.
3

Citigroup Pro Forma Projections:
Supervisory Severely Adverse Scenario

Pro Forma Projections (Supervisory Severely Adverse Scenario with Dodd-Frank Capital Actions)
5
Note: These projections represent hypothetical estimates based on the Supervisory Severely Adverse Scenario with Dodd-Frank Capital Actions and reflect the capital ratio components
described on page 18. These estimates are not forecasts of Citi’s expected pre-provision net revenues, losses, net income before taxes, planned capital actions, risk-weighted assets,
pro forma capital ratios, or other results or outcomes.
(1) For each quarter during the 9-quarter forecast horizon, the Basel I (Hybrid) Tier 1 Common was calculated using capital based on the General Risk-Based Capital Rules. Risk weighted assets reflect Basel I Credit Risk rules and the final
(revised) market risk capital rules (Basel II.5). All other ratios are calculated in accordance with the transition requirements provided in the FRB's final Basel III rules published in October 2013, as summarized on page 18.
(2) Minimum ratio shows the lowest quarter-end ratio over the 9-quarter horizon. The minimum for each ratio may not occur in the same period.
(3) Under the Basel III transition rules, certain regulatory capital adjustments and deductions are applied to Tier 1 capital, al located between CET1 capital and Additional Tier 1 capital. To the extent Additional Tier 1 capital is not sufficient to
absorb the applicable adjustments and deductions, the excess is applied against CET1 capital. Because adjustments and deductions exceed Citi’s Additional Tier 1 capital, Citi’s Tier 1 capital and CET1 capital are equal.
(4) Citi's balance sheet and RWA projections incorporate the impact of a strengthening dollar on foreign currency denominated assets.
Billions of DollarsPortfolio Loss
Rates (%)
Loan Losses 37.7 6.1%
First Lien Mortgages, Domestic 2.3 2.5%
Junior Liens and HELOCs, Domestic 2.1 8.7%
Commercial & Industrial 3.5 2.3%
Commercial Real Estate, Domestic 0.6 6.1%
Credit Cards 21.1 16.3%
Other Consumer 5.7 16.8%
Other Loans 2.3 1.3%
Projected Cumulative Loan Losses, by Type of Loan, through Q4 2016 under the
Supervisory Severely Adverse Scenario
Actual
Q3 2014 Q4 2016 Minimum2 Min. Quarter
Basel I Hybrid Tier 1 Common Ratio (%) 13.4 8.7 8.7 Q4 2016
Common Equity Tier 1 Capital Ratio (%) 15.1 8.2 8.2 Q4 2016
Tier 1 Risk-Based Capital Ratio (%)3 15.1 8.2 8.2 Q4 2016
Total Risk-based Capital Ratio (%) 17.7 10.5 10.5 Q4 2016
Tier 1 Leverage Ratio (%) 9.0 6.0 6.0 Q4 2016
Projected Stressed Capital Ratios1 through Q4 2016 under the Supervisory Severely Adverse Scenario
Stressed Capital Ratios
Billions of DollarsPercent of
Average Assets
Pre-Provision Net Revenue 30.0 1.7 %
Other Revenue -
Less
Provisions 47.8
Loan Losses 37.7
Net Reserve Builds/(Releases) 10.1
Realized Losses on Securities (AFS/HTM) 1.8
Trading and Counterparty Losses 17.7
Other Losses 3.7
Equals
Net Income/(Loss) Before Taxes (41.0) (2.4)%
Memo Items
Other comprehensive income (12.4)
Other effects on capital Q3 2014 Q4 2016
AOCI included in capital (billions of dollars) (15.4) (27.8)
Projected Cumulative Losses, Revenue, and Net Income Before Taxes through Q4
2016 under the Supervisory Severely Adverse Scenario
General
Approach
(BI Hybrid)
Basel III
Standardized
Approach
Risk-weighted Assets4
(billions of dollars)1,103.6 1,030.1 1,209.3
Actual
Q3 2014
Projected Q4 2016
Actual Q3 2014 and Projected Q4 2016 Risk-weighted Assets under the
Supervisory Severely Adverse Scenario

Key Drivers of Common Equity Tier 1 Capital Ratio (3Q14-4Q16; Supervisory Severely Adverse Scenario with Dodd-Frank Capital Actions)
6
Common Equity Tier 1 (CET1) Capital Ratio Increase
Decrease
Note: These projections represent hypothetical estimates based on the Supervisory Severely Adverse Scenario with Dodd-Frank Capital Actions and reflect the capital ratio components
described on page 18. These estimates are not forecasts of Citi’s expected pro forma capital ratios.
(1) Reflects pre-tax impact.
(2) Other includes impacts due to (i) losses from loans held-for-sale and loans accounted for under the fair value option, (ii) goodwill & intangibles amortization, (iii) issuance of employee stock compensation, (iv) accrued taxes, and (vi) other
income statement and risk-weighted asset items.
15.1%
8.2%-4.5%
-1.6%
-1.1%
-1.4% -0.1% -0.1%
2.4%
-0.5%
CET1Ratio
3Q14
Credit Losses/Provisions &
AFS/HTM NetLosses
Trading andCounterparty
Losses
OtherComprehensive
Income
Net Change inDTA
Disallowance
PreferredDividends
CommonBuybacks &
Dividends
PPNR(inc Operational
Losses)
Other CET1 Ratio4Q16
(1)
(1) (1)
(2)

15.1%
8.2%-4.5%
-1.6%
-1.1%
-1.5% -0.1% -0.1%
2.4% 0.1%
-0.5%
Tier 1Risk-Based
Capital Ratio3Q14
Credit Losses/Provisions &
AFS/HTM NetLosses
Trading andCounterparty
Losses
OtherComprehensive
Income
Net Change inDTA
Disallowance
PreferredDividends
CommonBuybacks &
Dividends
PPNR(inc Operational
Losses)
Preferred Issuance
Other Tier 1Risk-Based
Capital Ratio4Q16
Key Drivers of Tier 1 Risk-Based Capital Ratio (3Q14-4Q16; Supervisory Severely Adverse Scenario with Dodd-Frank Capital Actions)
7
Tier 1 Risk-Based Capital Ratio1
Increase
Decrease
Note: These projections represent hypothetical estimates based on the Supervisory Severely Adverse Scenario with Dodd-Frank Capital Actions and reflect the capital ratio components
described on page 18. These estimates are not forecasts of Citi’s expected pro forma capital ratios.
(1) Under the Basel III transition rules, certain regulatory capital adjustments and deductions are applied to Tier 1 capital, al located between CET1 capital and Additional Tier 1 capital. To the extent Additional Tier 1 capital is not sufficient to
absorb the applicable adjustments and deductions, the excess is applied against CET1 capital. Because adjustments and deductions exceed Citi’s Additional Tier 1 capital, Citi’s Tier 1 capital and CET1 capital are equal.
(2) Reflects pre-tax impact.
(3) Other includes impacts due to (i) losses from loans held-for-sale and loans accounted for under the fair value option, (ii) goodwill & intangibles amortization, (iii) issuance of employee stock compensation, (iv) accrued taxes, and (vi) other
income statement and risk-weighted asset items.
(2)
(2) (2)
(3)

Key Drivers of Tier 1 Leverage Ratio (3Q14-4Q16; Supervisory Severely Adverse Scenario with Dodd-Frank Capital Actions)
8
Tier 1 Leverage Ratio Increase
Decrease
Note: These projections represent hypothetical estimates based on the Supervisory Severely Adverse Scenario with Dodd-Frank Capital Actions and reflect the capital ratio components
described on page 18. These estimates are not forecasts of Citi’s expected pro forma capital ratios.
(1) Reflects pre-tax impact.
(2) Other includes impacts due to (i) losses from loans held-for-sale and loans accounted for under the fair value option, (ii) goodwill & intangibles amortization, (iii) issuance of employee stock compensation, (iv) accrued taxes, and (vi) other
income statement and leverage asset items.
9.0%
6.0%
-2.7%
-1.0%
-0.7%
-0.9%-0.1% 0.0%
1.4%0.1%
0.8%
Tier 1Leverage Ratio
3Q14
Credit Losses/Provisions &
AFS/HTM NetLosses
Trading andCounterparty
Losses
OtherComprehensive
Income
Net Change inDTA
Disallowance
PreferredDividends
CommonBuybacks &
Dividends
PPNR(inc Operational
Losses)
Preferred Issuance
Other Tier 1Leverage Ratio
4Q16(1)
(1) (1)
(2)

Risk Types & Methodologies

Risks Included in 2015 Annual Stress Test
10
Risk Type Description Components Examples
Credit Risk
Credit risk is the potential
for financial loss resulting
from the failure of a
borrower or counterparty to
honor its financial or
contractual obligations.
• Provision for Loan and Lease
Losses • Loan losses and allowance builds/releases
• Counterparty Losses and
Counterparty Default
Scenario
• Credit exposure to counterparties through capital markets
transactions
• Realized Gains / Losses on
Securities
• Credit-related other-than-temporary impairment for investment
securities
• Risk-Weighted Assets • Credit Risk RWA (as described on page 16)
Market Risk
Market risk arises from
fluctuations in the market
value of positions, resulting
from changes in market
factors.
• Pre-Provision Net Revenue • Impact of market prices and interest rates on components of
revenues and expenses across all business segments
• Trading and Counterparty
Losses
• Instantaneous revaluation of trading, private equity, and fair
value exposures as well as incremental default risk (IDR) and
credit valuation adjustment (CVA) losses as required under
the Global Market Shock Scenario
• Other Losses • Quarterly revaluation of loans held-for-sale or under a fair
value option
• Risk-Weighted Assets • Market Risk RWA (as described on page 16)
Operational
Risk
Operational risk is the risk
of loss resulting from
inadequate or failed internal
processes, systems, or
human factors, or from
external events including
litigation, reputation, and
franchise risks.
• Pre-Provision Net Revenue
• Operational risk expenses including litigation expenses, fraud
charges, etc.
• Mortgage repurchase forecast
• The following pages provide details for each forecast component, segmented by key modeling units (Business, Product,
etc.) where applicable.

Pre-Provision Net Revenue
11
• Pre-provision net revenue (PPNR) is defined as net interest income plus non-interest income less non-interest
expense, which includes policyholder benefits and claims and operational risk expenses.
• PPNR is projected using models for each major business unit as shown below.
• Relies on historical relationships between loan/deposit balances, revenues, expenses, and relevant
macroeconomic variables, adjusted by business management as appropriate.
• Operational risk expenses consider both recurring and idiosyncratic events, including legal losses.
Major
Business
Units
Global Consumer
Bank (GCB)
Institutional
Clients Group
(ICG)
Corporate /
Other Citi Holdings
Component
Business
Units
• North America Retail and
Commercial Bank
• North America Cards
• North America Mortgage
• Asia GCB
• Latin America GCB
• Europe, Middle East,
Africa GCB
• Global Markets
• Global Banking
• Private Bank
• Treasury and Trade
Solutions
• Treasury
• Operations &
Technology
• Global Functions
• Other
• Non-core businesses
and portfolios
Key
Modeling
Inputs
• GDP
• Housing
• Inflation
• Unemployment rate
• Interest rates
• Foreign exchange (FX)
rates
• GDP
• Market indices
• Volatility
• Interest rates
• PMI index
• Corporate bond spreads
• FX rates
• Non-regression
models
• Run-off models
Business
Activities
• Retail, small business and
commercial loans and
deposits
• Mortgages
• Credit cards
• Corporate loans and
deposits
• Trading
• Investment banking
• Private banking
• Asset management
• Transaction services
• Non-customer
facing cost centers
• Non-core assets
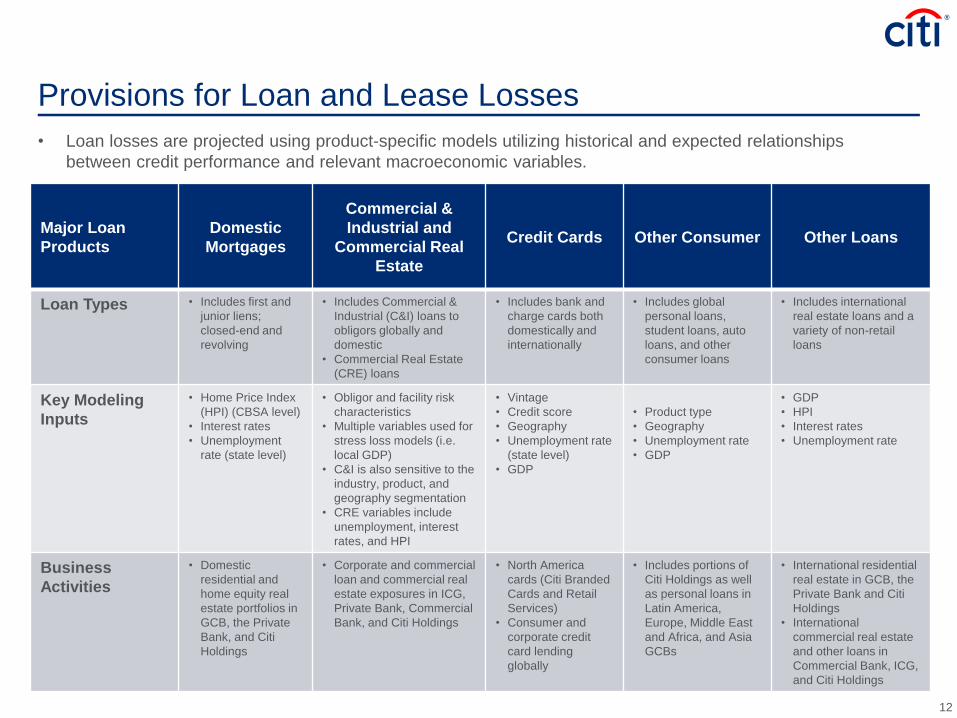
Provisions for Loan and Lease Losses
12
• Loan losses are projected using product-specific models utilizing historical and expected relationships
between credit performance and relevant macroeconomic variables.
Major Loan
Products
Domestic
Mortgages
Commercial &
Industrial and
Commercial Real
Estate
Credit Cards Other Consumer Other Loans
Loan Types • Includes first and
junior liens;
closed-end and
revolving
• Includes Commercial &
Industrial (C&I) loans to
obligors globally and
domestic
• Commercial Real Estate
(CRE) loans
• Includes bank and
charge cards both
domestically and
internationally
• Includes global
personal loans,
student loans, auto
loans, and other
consumer loans
• Includes international
real estate loans and a
variety of non-retail
loans
Key Modeling
Inputs
• Home Price Index
(HPI) (CBSA level)
• Interest rates
• Unemployment
rate (state level)
• Obligor and facility risk
characteristics
• Multiple variables used for
stress loss models (i.e.
local GDP)
• C&I is also sensitive to the
industry, product, and
geography segmentation
• CRE variables include
unemployment, interest
rates, and HPI
• Vintage
• Credit score
• Geography
• Unemployment rate
(state level)
• GDP
• Product type
• Geography
• Unemployment rate
• GDP
• GDP
• HPI
• Interest rates
• Unemployment rate
Business
Activities
• Domestic
residential and
home equity real
estate portfolios in
GCB, the Private
Bank, and Citi
Holdings
• Corporate and commercial
loan and commercial real
estate exposures in ICG,
Private Bank, Commercial
Bank, and Citi Holdings
• North America
cards (Citi Branded
Cards and Retail
Services)
• Consumer and
corporate credit
card lending
globally
• Includes portions of
Citi Holdings as well
as personal loans in
Latin America,
Europe, Middle East
and Africa, and Asia
GCBs
• International residential
real estate in GCB, the
Private Bank and Citi
Holdings
• International
commercial real estate
and other loans in
Commercial Bank, ICG,
and Citi Holdings

Trading and Counterparty Losses
13
• Trading and counterparty losses represent instantaneous losses under the Global Market Shock Scenario on
Citi’s trading portfolios, CVA, FVA and other mark-to-market assets, inclusive of default losses.
• Consistent with FRB instructions, these instantaneous losses are reported in the first quarter of the projection
period (4Q14) with no associated change to risk-weighted assets, GAAP assets, or PPNR.
Trading /
Counterparty
Activities
Trading Book Counterparty Credit Risk
(CCR)
Incremental Default Risk
(IDR)
Risk Types • Equity, FX, interest rates, commodities,
securitized products, traded credit,
private equity, CVA hedges, other fair
value assets
• Mark-to-market counterparty CVA and
FVA for over-the-counter (OTC)
derivative counterparties
• CVA for all securities financing
transaction (SFT) and central clearing
parties (CCP) counterparties
• Trading IDR from securitized products
and other credit sensitive instruments
• Counterparty credit risk, reflected
through Counterparty Default Scenario
Key Modeling
Inputs
• Equity spot and volatility
• FX spot and volatility
• Directional and basis rate risks
• Interest rate volatility
• Commodity spot and volatility
• Agency and municipal spreads
• Residential mortgage-backed
securities, asset-backed securities,
commercial mortgage-backed
securities prices
• Corporate and sovereign credit
spreads for bonds and credit default
swaps
• Private equity carry values
• Equity spot and volatility
• FX spot and volatility
• Directional and basis rate risks
• Interest rate volatility
• Commodity spot and volatility
• Agency and municipal spreads
• Residential mortgage-backed
securities, asset-backed securities,
commercial mortgage-backed
securities prices
• Corporate and sovereign credit
spreads for bonds and credit default
swaps
• Probability of default and loss given
default under stressed scenario
• Jump-to-default exposure and risk
rating by issuer
• Bond, credit default swap, and equity
losses under stressed scenario
Business
Units
• Global Markets
• Corporate Portfolio Management
• Citi Holdings
• Global Consumer Banking
• Treasury and Trade Services
• Citi Holdings
• Citi Treasury
• Global Markets
• Corporate Portfolio Management
• Citi Holdings

Counterparty Default Scenario
14
• For CCAR 2015, the FRB required 8 BHCs, including Citi, to include the potential loss and capital impact
associated with an instantaneous default of their largest stressed counterparty for derivatives and securities
financing transactions (SFTs) under the conditions of the Global Market Shock.
• Consistent with FRB instructions, any products or business activities outside the scope of derivatives and
SFTs were excluded from this analysis (e.g., direct lending, issuer risk, intra-day exposure, etc.).
• In selecting the largest counterparty, firms were instructed not to consider certain sovereign entities (Canada,
France, Germany, Italy, Japan, the United Kingdom, and the United States), including any entity backed by the
full-faith and credit of those sovereign entities, or qualifying central clearing counterparties, as defined by the
Basel Committee on Banking Supervision.
• The FRB prescribed a 10% recovery assumption on the total stressed derivative and SFT credit exposure to
the applicable counterparty.
– Therefore, 90% of the stressed credit exposure to the largest stressed counterparty in the Supervisory
Severely Adverse Scenario, assuming no additional collection of collateral in the stressed environment,
was required to be included to satisfy the Counterparty Default Scenario.
• Similar to Trading and Counterparty losses discussed on the prior page, Counterparty Default Scenario losses
are:
– assumed to occur instantaneously;
– recognized in the first quarter of the planning horizon (4Q14);
– calculated using the same “as-of” date specified for the Global Market Shock; and
– do not impact other projected components (e.g., no associated changes to risk-weighted assets, GAAP
assets, or PPNR).

Realized Gains/Losses on Securities and Other Losses
15
Realized Gains/Losses on Investment Securities
• Citi holds available-for-sale (AFS) and held to maturity (HTM) securities in its Corporate Treasury portfolio as
well as within other individual businesses
• The inherent credit risk for most AFS and HTM securities is forecasted using product-specific cash flow
models and tools which utilize a variety of macroeconomic factors (unemployment, GDP, HPI, etc.) depending
on the security characteristics (including but not limited to country, collateral, and seniority)
• Loss estimates for the AFS and HTM portfolios are aligned to Citi’s established accounting methodology
Other Comprehensive Income (OCI)
• OCI impacts primarily reflect changes to unhedged foreign currency book capital (FAS 52), OCI from cash
flow hedges (FAS 133), OCI from AFS securities (FAS 115), and OCI associated with Citi’s pension plans
(FAS 158)
• The primary drivers for these categories are interest rates, credit spreads, actual plan returns versus expected
returns, and foreign currency exchange rates
Other Losses/Gains
• Primarily reflects losses on loans which are held-for-sale (HFS) or under a fair value option (FVO),
concentrated in Citi’s institutional businesses
– Wholesale HFS and FVO loans are stressed using quarterly credit spreads to estimate changes in fair
value. In addition, default losses are estimated using a ratings migration approach. Wholesale FVO loan
hedges are subjected to similar methodologies to account for changes in value as well as obligor default,
in line with regulatory guidance
– Retail held-for-sale loans are generally assumed to be sold, at a determined price, prior to sufficient
deterioration in the macroeconomic environment
• Also reflects potential goodwill impairment under the hypothetical scenario along with losses related to
investments under equity/cost accounting treatments

Risk-Weighted Assets (RWA)
16
Citi projected its RWA using a combination of Basel I Hybrid RWA (for the first projection quarter) and Basel III
RWA (all subsequent projection quarters). Consistent with FRB instructions, Basel III RWA under the Supervisory
Severely Adverse scenario was limited to only the Standardized Approach.
Credit Risk RWA Projections
• Credit Risk RWA projections leverage the firm’s point-in-time Basel calculations and infrastructure built for
compliance with these rules. These projections are based on corresponding on- and off-balance sheet
forecasts.
• Risk-weight projections utilize prescribed regulatory rules and also consider risk parameters conditioned upon
relevant scenario variables. These parameters include loss forecasts, obligor ratings, risk profile shifts in
future delinquencies, and forecasts of country risk classification.
• Past due balance projections utilized for RWA are consistent with corresponding projections utilized for stress
loss calculations.
Market Risk RWA Projections
• Market Risk RWA forecasts depend upon whether the component is formula-driven or model-driven.
– Formula-driven components include securitization and other exposures utilizing the standardized
measurement method for specific risk.
– Model-driven components include VaR and stressed VaR, Incremental Risk Capital and charges under
Comprehensive Risk Measure.
• While formula-driven components are primarily driven by the corresponding balance projections, the model-
driven components utilize certain quantitative scenario variables and replenishment assumptions for their
forecast.
• Securitization exposures follow similar RWA projection methodologies, irrespective of whether these positions
reside in the trading book or not.

Capital
Dodd-Frank Capital Actions
• As required by FRB rules, Dodd-Frank Capital Actions were included in Citi’s stressed risk-based capital ratios through the 9-
quarter forecast horizon in the following aggregate amounts:
Transitional Capital Phase-in & Phase-out
• DTA and other certain capital deductions are disallowed at an increasing rate defined under the Basel III Transition
Arrangements.
• FAS115/158 Accumulated Other Comprehensive Income neutralization phase-out under the Basel III Transition Arrangements.
• Certain TruPS phase-out from Tier 1 Capital and certain subordinated debt phase-out from Tier 2 Capital.
Deferred Tax Asset (DTA) Position
• Due to Citi’s current DTA position, future DTA accrual resulting from projected stress losses is limited; therefore, a portion of pre-
tax stress losses results in a direct dollar-for-dollar reduction to net income.
• In the transitional capital calculations, to the extent that tax benefits can be realized in the stress scenarios, a portion of the
benefits flows through to capital. These benefits, however, will be excluded when DTA and other capital deductions are fully
phased-in.
Other Items Impacting Capital Position
• Movements in AOCI impacts Citi’s capital position, subject to the AOCI neutralization phase-out noted above.
• Annual common stock awards from incentive compensation programs increase common equity, offset by compensation expense
over the corresponding vesting period.
In addition to the inclusion of estimated stress losses and PPNR, Citi’s hypothetical capital position
under the Supervisory Severely Adverse Scenario is impacted by the following items:
17
Dodd-Frank Capital Actions for Citigroup
Sources of Capital Uses of Capital
- 4Q14 Preferred Stock Issuance: $1.5B - 4Q14 Subordinated Debt Issuance: $1.0B
- Common and Preferred Dividends: $1.7B
- 4Q14 Common Stock Buybacks: $0.5B
- Ordinary payments on TruPS & Subordinated Debt: $2.2B

Capital Ratios
The following table represents the components of the capital ratios evaluated for 2015
CCAR. The applicable regulatory minimum for each period and ratio is noted in red.
18
(1) For each quarter during the 9-quarter forecast horizon, the Basel I (Hybrid) Tier 1 Common was calculated using capital based on the General Risk-Based Capital Rules. Risk-weighted assets reflect Basel I Credit Risk rules
and the final (revised) market risk capital rules (Basel II.5).
(2) The Regulatory Capital Ratios were calculated in accordance with the transition requirements provided in the FRB’s final Basel II I rules published in October 2013.
Capital Ratio
2014
2015 - 2016
Basel I Hybrid Tier 1
Common1
BI Capital
BI Hybrid RWA 5.0%
BI Capital
BI Hybrid RWA 5.0%
Regulatory Capital Ratios2:
Common Equity Tier 1 BIII Capital
BIII Standardized RWA 4.0%
BIII Capital
BIII Standardized RWA 4.5%
Tier 1 Capital BIII Capital
BIII Standardized RWA 5.5%
BIII Capital
BIII Standardized RWA 6.0%
Total Capital BIII Capital
BIII Standardized RWA 8.0%
BIII Capital
BIII Standardized RWA 8.0%
Tier 1 Leverage BIII Capital
Leverage Assets 4.0%
BIII Capital
Leverage Assets 4.0%

Citibank, N.A. Pro Forma Projections:
Supervisory Severely Adverse Scenario

Citibank, N.A. Stress Test Methodology
• The Office of the Comptroller of the Currency (OCC) requires “covered institutions”, including
Citibank, N.A. (CBNA), to conduct the Dodd-Frank Act Stress Test (DFAST).
– For the 2015 DFAST, the OCC required the use of the same hypothetical Supervisory
Severely Adverse Scenario as the FRB used in CCAR, including the same Global Market
Shock and Counterparty Default Scenario.
• CBNA represents Citi’s primary subsidiary U.S. depository institution and accounted for
approximately 73% of Citi’s overall GAAP assets as of 3Q14.
– As such, projected stressed PPNR and stress losses for CBNA under the hypothetical
Supervisory Severely Adverse Scenario, including the Global Market Shock and Counterparty
Default Scenario, are similar to those estimated for Citi.
– Capital ratio projections take into account the capital structure of CBNA1 as well as CBNA-
specific capital actions.
• CBNA used the same methodologies as used in Citi’s CCAR (PPNR, Stress Losses and Capital
Position).
– See pages 9-18 for additional details on included risk types and stress testing methodologies.
20
(1) CBNA’s capital structure varies in amount and form from Citi. For further details, please refer to CBNA’s quarterly Call Reports on Form FFIEC-031, available on Citi’s investor relations website.

CBNA Pro Forma Projections (Supervisory Severely Adverse Scenario with Dodd-Frank Capital Actions)
21
Billions of
Dollars
Portfolio Loss
Rates (%)
Loan Losses 30.1 4.9%
First Lien Mortgages, Domestic 1.5 1.6%
Junior Liens and HELOCs, Domestic 1.9 7.8%
Commercial & Industrial 3.2 2.1%
Commercial Real Estate, Domestic 0.6 6.0%
Credit Cards 19.0 14.7%
Other Consumer 2.2 6.6%
Other Loans 1.7 1.0%
Projected Cumulative Loan Losses, by Type of Loan, through Q4 2016 under the
Supervisory Severely Adverse Scenario
Note: These projections represent hypothetical estimates based on the Supervisory Severely Adverse Scenario with Dodd-Frank Capital Actions and reflect the capital ratio components
described on page 18. These estimates are not forecasts of Citi’s expected pre-provision net revenues, losses, net income before taxes, planned capital actions, risk-weighted assets,
pro forma capital ratios, or other results or outcomes.
(1) For each quarter during the 9-quarter forecast horizon, the Basel I (Hybrid) Tier 1 Common was calculated using capital based on the General Risk-Based Capital Rules. Risk weighted assets reflect Basel I Credit Risk rules and the final
(revised) market risk capital rules (Basel II.5). All other ratios are calculated in accordance with the transition requirements provided in the FRB's final Basel III rules published in October 2013, as summarized on page 18.
(2) Minimum ratio shows the lowest quarter-end ratio over the 9-quarter horizon. The minimum for each ratio may not occur in the same period.
(3) Under the Basel III transition rules, certain regulatory capital adjustments and deductions are applied to Tier 1 capital, al located between CET1 capital and Additional Tier 1 capital. To the extent Additional Tier 1 capital is not sufficient to
absorb the applicable adjustments and deductions, the excess is applied against CET1 capital. Because adjustments and deductions exceed Additional Tier 1 capital, Tier 1 capital and CET1 capital are equal.
(4) Citi's balance sheet and RWA projections incorporate the impact of a strengthening dollar on foreign currency denominated assets.
Actual
Q3 2014 Q4 2016 Minimum2 Min. Quarter
Basel I Hybrid Tier 1 Common Ratio (%) 13.2 11.6 11.1 Q4 2014
Common Equity Tier 1 Capital Ratio (%) 13.7 9.8 9.2 Q3 2015
Tier 1 Risk-Based Capital Ratio (%)3 13.7 9.8 9.2 Q3 2015
Total Risk-based Capital Ratio (%) 15.7 12.0 11.4 Q3 2015
Tier 1 Leverage Ratio (%) 9.5 8.2 8.0 Q1 2016
Projected Stressed Capital Ratios1 through Q4 2016 under the Supervisory Severely Adverse Scenario
Stressed Capital Ratios
Billions of
Dollars
Percent of
Average Assets
Pre-Provision Net Revenue 37.2 3.0 %
Other Revenue -
Less
Provisions 39.3
Loan Losses 30.1
Net Reserve Builds/(Releases) 9.2
Realized Losses on Securities (AFS/HTM) 1.3
Trading and Counterparty Losses 5.9
Other Losses 3.0
Equals
Net Income/(Loss) Before Taxes (12.2) (1.0)%
Memo Items
Other comprehensive income (7.0)
Other effects on capital Q3 2014 Q4 2016
AOCI included in capital (billions of dollars) (8.1) (15.9)
Projected Cumulative Losses, Revenue, and Net Income Before Taxes through
Q4 2016 under the Supervisory Severely Adverse Scenario
General
Approach
(BI Hybrid)
Basel III
Standardized
Approach
Risk-weighted Assets4
(billions of dollars)932.6 868.8 1,023.4
Actual
Q3 2014
Projected Q4 2016
Actual Q3 2014 and Projected Q4 2016 Risk-weighted Assets under the
Supervisory Severely Adverse Scenario


![Dodd-Frank Act - United States House of Representatives Wall Street Reform...1 Dodd-Frank Wall Street Reform and Consumer Protection Act [Public Law 111–203] [As Amended Through](https://img.pdfslide.net/doc/110x75/5aa705137f8b9ac5648b8e0c/dodd-frank-act-united-states-house-of-representatives-wall-street-reform1-dodd-frank.jpg)