Embed Size (px)
Citation preview


2015 THE LITTLE DATA BOOKON PRIVATE SECTORDEVELOPMENT
© 2015 International Bank for Reconstruction and Development / The World Bank1818 H Street NW, Washington, DC 20433Telephone: 202-473-1000; Internet: www.worldbank.orgSome rights reserved1 2 3 4 18 17 16 15
This work is a product of the staff of The World Bank with external contributions. The find-ings, interpretations, and conclusions expressed in this work do not necessarily reflect the views of The World Bank, its Board of Executive Directors, or the governments they repre-sent. The World Bank does not guarantee the accuracy of the data included in this work. The boundaries, colors, denominations, and other information shown on any map in this work do not imply any judgment on the part of The World Bank concerning the legal status of any territory or the endorsement or acceptance of such boundaries.
Nothing herein shall constitute or be considered to be a limitation upon or waiver of the privileges and immunities of The World Bank, all of which are specifically reserved.
Rights and Permissions
This work is available under the Creative Commons Attribution 3.0 IGO license (CC BY 3.0 IGO) http://creativecommons.org/licenses/by/3.0/igo. Under the Creative Commons Attribution license, you are free to copy, distribute, transmit, and adapt this work, including for commercial purposes, under the following conditions:
Attribution—Please cite the work as follows: World Bank. 2015. The Little Data Book on
Private Sector Development 2015. Washington, DC: World Bank. doi:10.1596/978-1-4648-0562-2. License: Creative Commons Attribution CC BY 3.0 IGO
Translations—If you create a translation of this work, please add the following disclaimer along with the attribution: This translation was not created by The World Bank and
should not be considered an official World Bank translation. The World Bank shall not
be liable for any content or error in this translation.
Adaptations—If you create an adaptation of this work, please add the following disclaimer along with the attribution: This is an adaptation of an original work by The World Bank.
Views and opinions expressed in the adaptation are the sole responsibility of the author
or authors of the adaptation and are not endorsed by The World Bank.
Third-party content—The World Bank does not necessarily own each component of the content contained within the work. The World Bank therefore does not warrant that the use of any third-party-owned individual component or part contained in the work will not infringe on the rights of those third parties. The risk of claims resulting from such infringement rests solely with you. If you wish to re-use a component of the work, it is your responsibility to determine whether permission is needed for that re-use and to obtain permission from the copyright owner. Examples of components can include, but are not limited to, tables, figures, or images.
All queries on rights and licenses should be addressed to the Publishing and Knowledge Division, The World Bank, 1818 H Street NW, Washington, DC 20433, USA; fax: 202-522-2625; e-mail: [email protected].
ISBN (paper): 978-1-4648-0562-2ISBN (electronic): 978-1-4648-0563-9DOI: 10.1596/978-1-4648-0562-2
Cover design: Communications Development Incorporated, Washington, DC.

iiiThe Little Data Book on Private Sector Development 2015
Acknowledgments . . . . . . . . . . . . . . . . . . . . . . . . . . . . . . . . . . . . . . . . . iv
Preface. . . . . . . . . . . . . . . . . . . . . . . . . . . . . . . . . . . . . . . . . . . . . . . . . .v
Data notes . . . . . . . . . . . . . . . . . . . . . . . . . . . . . . . . . . . . . . . . . . . . . . vi
Regional tables . . . . . . . . . . . . . . . . . . . . . . . . . . . . . . . . . . . . . . . . . . . 1
World . . . . . . . . . . . . . . . . . . . . . . . . . . . . . . . . . . . . . . . . . . . . . . . 2
East Asia and Pacific . . . . . . . . . . . . . . . . . . . . . . . . . . . . . . . . . . . . 3
Europe and Central Asia. . . . . . . . . . . . . . . . . . . . . . . . . . . . . . . . . . 4
Latin America and the Caribbean . . . . . . . . . . . . . . . . . . . . . . . . . . . 5
Middle East and North Africa . . . . . . . . . . . . . . . . . . . . . . . . . . . . . . 6
South Asia . . . . . . . . . . . . . . . . . . . . . . . . . . . . . . . . . . . . . . . . . . . 7
Sub-Saharan Africa . . . . . . . . . . . . . . . . . . . . . . . . . . . . . . . . . . . . . 8
Income group tables . . . . . . . . . . . . . . . . . . . . . . . . . . . . . . . . . . . . . . . 9
Low income. . . . . . . . . . . . . . . . . . . . . . . . . . . . . . . . . . . . . . . . . . 10
Middle income. . . . . . . . . . . . . . . . . . . . . . . . . . . . . . . . . . . . . . . . 11
Lower middle income . . . . . . . . . . . . . . . . . . . . . . . . . . . . . . . . . . . 12
Upper middle income. . . . . . . . . . . . . . . . . . . . . . . . . . . . . . . . . . . 13
Low and middle income . . . . . . . . . . . . . . . . . . . . . . . . . . . . . . . . . 14
High income . . . . . . . . . . . . . . . . . . . . . . . . . . . . . . . . . . . . . . . . . 15
Euro area . . . . . . . . . . . . . . . . . . . . . . . . . . . . . . . . . . . . . . . . . . . 16
Country tables (in alphabetical order) . . . . . . . . . . . . . . . . . . . . . . . . . . 17
Notes. . . . . . . . . . . . . . . . . . . . . . . . . . . . . . . . . . . . . . . . . . . . . . . . 232
Glossary. . . . . . . . . . . . . . . . . . . . . . . . . . . . . . . . . . . . . . . . . . . . . . 233
Contents
iv 2015 The Little Data Book on Private Sector Development
The Little Data Book on Private Sector Development 2015 is based on World
Development Indicators 2015 and its accompanying online tables, with a focus
on the private sector in development. The Little Data Book on Private Sector
Development 2015 is the result of close collaboration between the staff of
the World Bank’s Development Data Group of the Development Economics
Vice Presidency and the Trade and Competitiveness Global Practice. The
Development Data Group team included Liu Cui, Federico Escaler, Buyant
Erdene Khaltarkhuu, William Prince, and Jomo Tariku. The Trade and
Competitiveness team included Ramin Aliyev, Jenny Datoo, Nathalie David,
and Patricia Ellen Steele. The work was carried out under the management
of Haishan Fu, director of the Development Data Group, and Klaus Tilmes,
director of the Trade and Competitiveness Global Practice. Azita Amjadi
and Leila Rafei coordinated all stages of production. Barton Matheson
Willse & Worthington typeset the book. Nora Ridolfi, Paola Scalabrin, and
Janice Tuten from World Bank’s Publishing and Knowledge Division oversaw
publication and dissemination of the book.
Acknowledgments

vThe Little Data Book on Private Sector Development 2015
PrefaceReliable cross-country data on aspects of private sector development are
crucial in planning for economic recovery and growth. In targeting increased
exports and investment, many governments prioritize an improved climate for
business as a basis to attract capital, create jobs, and provide basic services.
The availability of cross-country data on the business environment has rapidly
expanded in recent years, including data from the World Bank Group’s Doing
Business project, Enterprise Surveys, and the Entrepreneurship Snapshots.
The data sources presented in this book report on the scope and types of
regulations that enhance—and constrain—business activity, and they pro-
vide information on how business owners assess their business environments.
The data have led to new research, enabled benchmarking, and informed
the reform process in many developing countries. Please visit the Business
Environment Snapshots (http://rru.worldbank.org/besnapshots/) for more
information.
Included in this guide are indicators on the economic and social context, the
business environment, private sector investment, finance and banking, and
infrastructure. Though a pocket guide cannot include all relevant variables,
the included indicators provide users with a general understanding of the
private sector in each country. Indicators displayed in the tables are defined
in the glossary, which also lists data sources.
We welcome your suggestions on how to improve future editions and make
them more useful.

vi 2015 The Little Data Book on Private Sector Development
Data notesThe data in this book are for 2005 and 2013 or the most recent year unless
otherwise noted in the table or the glossary.
• Growth rates are proportional changes from the previous year unless
otherwise noted.
• Regional aggregates include data for low- and middle-income
economies only.
• Figures in italics indicate data for years or periods other than those
specified.
Symbols used:
.. indicates that data are not available or that aggregates cannot
be calculated because of missing data.
0 or 0.0 indicates zero or small enough that the number would round to
zero at the displayed number of decimal places.
$ indicates current U.S. dollars.
Lettered notes on some country tables can be found in the notes on page 232.
Data are shown for economies with populations greater than 30,000 or for
smaller economies if they are members of the World Bank. The term country
(used interchangeably with economy) does not imply political independence
or official recognition by the World Bank but refers to any economy for which
the authorities report separate social or economic statistics.
The cutoff date for data is March 1, 2015.
1The Little Data Book on Private Sector Development 2015
The country composition of regions is based on the World Bank’s analytical
regions and may differ from common geographic usage.
East Asia and Pacific
American Samoa, Cambodia, China, Fiji, Indonesia, Kiribati, Democratic
People’s Republic of Korea, Lao People’s Democratic Republic, Malaysia,
Marshall Islands, Federated States of Micronesia, Mongolia, Myanmar,
Palau, Papua New Guinea, the Philippines, Samoa, Solomon Islands,
Thailand, Timor-Leste, Tonga, Tuvalu, Vanuatu, Vietnam
Europe and Central Asia
Albania, Armenia, Azerbaijan, Belarus, Bosnia and Herzegovina, Bulgaria,
Georgia, Hungary, Kazakhstan, Kosovo, Kyrgyz Republic, Former
Yugoslav Republic of Macedonia, Moldova, Montenegro, Romania, Serbia,
Tajikistan, Turkey, Turkmenistan, Ukraine, Uzbekistan
Latin America and the Caribbean
Argentina, Belize, Bolivia, Brazil, Colombia, Costa Rica, Cuba, Dominica,
Dominican Republic, Ecuador, El Salvador, Grenada, Guatemala, Guyana,
Haiti, Honduras, Jamaica, Mexico, Nicaragua, Panama, Paraguay,
Peru, St. Lucia, St. Vincent and the Grenadines, Suriname, República
Bolivariana de Venezuela
Middle East and North Africa
Algeria, Djibouti, Arab Republic of Egypt, Islamic Republic of Iran, Iraq,
Jordan, Lebanon, Libya, Morocco, Syrian Arab Republic, Tunisia, West
Bank and Gaza, Republic of Yemen
South Asia
Afghanistan, Bangladesh, Bhutan, India, Maldives, Nepal, Pakistan,
Sri Lanka
Sub-Saharan Africa
Angola, Benin, Botswana, Burkina Faso, Burundi, Cabo Verde, Cameroon,
Central African Republic, Chad, Comoros, Democratic Republic of Congo,
Republic of Congo, Côte d’Ivoire, Eritrea, Ethiopia, Gabon, The Gambia,
Ghana, Guinea, Guinea-Bissau, Kenya, Lesotho, Liberia, Madagascar,
Malawi, Mali, Mauritania, Mauritius, Mozambique, Namibia, Niger, Nigeria,
Rwanda, São Tomé and Príncipe, Senegal, Seychelles, Sierra Leone,
Somalia, South Africa, South Sudan, Sudan, Swaziland, Tanzania, Togo,
Uganda, Zambia, Zimbabwe
Regional tables
Economic and social context
Population (millions)Labor force (millions)Unemployment rate (% of labor force)GNI per capita, World Bank Atlas method ($)GDP growth, 2000–05 and 2006–13 (average annual %)Agriculture value added (% of GDP)Industry value added (% of GDP) Manufacturing value added (% of GDP)Services value added (% of GDP)Inflation (annual % change in CPI)Exchange rate (local currency units per $)Exports of goods and services (% of GDP)Imports of goods and services (% of GDP)
Business environment
Ease of doing business (ranking 1–189; 1=best)Time to start a business (days)Procedures to start a business (number)Time to prepare, file, and pay taxes (hours)Time to export (days)Time to resolve insolvency (years)Profit tax (% of commercial profits)New businesses registered (thousands)New business density (new regis. per 1,000 working-age pop.)Enterprise surveys
Time spent dealing w/req. of gov't. reg. (% of sr. mgt. time) Firms expected to give gifts in meetings with tax officials (%) Firms competing against unregistered firms (%) Firms using banks to finance working capital (% of firms) Delay in obtaining an electrical connection (days) Internationally recognized quality certification (% of firms)
Private sector investment
Invest. in infra. w/privt. part., 2000–05 and 2006–13 ($ millions)Private foreign direct investment, net (% of GDP)Gross fixed capital formation (% of GDP)Gross fixed private capital formation (% of GDP)
Finance and banking
Government debt (% of GDP)Total financial system deposits (% of GDP)Bank capital to asset ratio (%)Bank nonperforming loans to total gross loans (%)Domestic credit to the private sector (% of GDP)Real interest rate (%)Interest rate spread (percentage points)
Infrastructure
Air transport (thousands registered carrier departures worldwide)Port container traffic (thousand TEU)Electric power consumption (kWh per capita)Power outages in firms in a typical month (number)Mobile-cellular telephone subscriptions (per 100 people)Individuals using the Internet (%)
2015 The Little Data Book on Private Sector Development2
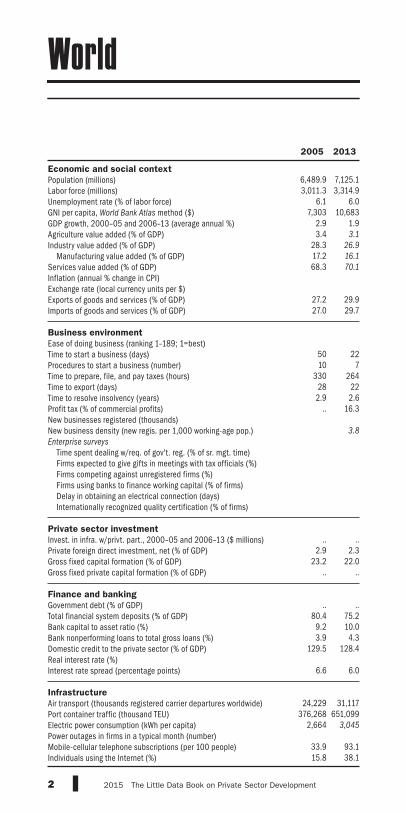
World
2005 2013
6,489.9 7,125.13,011.3 3,314.9
6.1 6.07,303 10,683
2.9 1.93.4 3.1
28.3 26.9
17.2 16.1
68.3 70.1
27.2 29.927.0 29.7
50 2210 7
330 26428 222.9 2.6
.. 16.3 3.8
.. ..
2.9 2.323.2 22.0
.. ..
.. ..
80.4 75.29.2 10.03.9 4.3
129.5 128.4
6.6 6.0
24,229 31,117
376,268 651,0992,664 3,045
33.9 93.115.8 38.1

Economic and social context
Population (millions)Labor force (millions)Unemployment rate (% of labor force)GNI per capita, World Bank Atlas method ($)GDP growth, 2000–05 and 2006–13 (average annual %)Agriculture value added (% of GDP)Industry value added (% of GDP) Manufacturing value added (% of GDP)Services value added (% of GDP)Inflation (annual % change in CPI)Exchange rate (local currency units per $)Exports of goods and services (% of GDP)Imports of goods and services (% of GDP)
Business environment
Ease of doing business (ranking 1–189; 1=best)Time to start a business (days)Procedures to start a business (number)Time to prepare, file, and pay taxes (hours)Time to export (days)Time to resolve insolvency (years)Profit tax (% of commercial profits)New businesses registered (thousands)New business density (new regis. per 1,000 working-age pop.)Enterprise surveys
Time spent dealing w/req. of gov't. reg. (% of sr. mgt. time) Firms expected to give gifts in meetings with tax officials (%) Firms competing against unregistered firms (%) Firms using banks to finance working capital (% of firms) Delay in obtaining an electrical connection (days) Internationally recognized quality certification (% of firms)
Private sector investment
Invest. in infra. w/privt. part., 2000–05 and 2006–13 ($ millions)Private foreign direct investment, net (% of GDP)Gross fixed capital formation (% of GDP)Gross fixed private capital formation (% of GDP)
Finance and banking
Government debt (% of GDP)Total financial system deposits (% of GDP)Bank capital to asset ratio (%)Bank nonperforming loans to total gross loans (%)Domestic credit to the private sector (% of GDP)Real interest rate (%)Interest rate spread (percentage points)
Infrastructure
Air transport (thousands registered carrier departures worldwide)Port container traffic (thousand TEU)Electric power consumption (kWh per capita)Power outages in firms in a typical month (number)Mobile-cellular telephone subscriptions (per 100 people)Individuals using the Internet (%)
The Little Data Book on Private Sector Development 2015 3
East Asia & Pacific
2005 2013
1,892.7 2,005.81,051.2 1,126.5
4.7 4.51,629 5,536
8.4 8.512.2 10.846.3 43.231.3 30.141.5 46.0
43.1 32.538.0 30.3
57 359 8
309 22127 22
3.2 2.9.. 18.0 1.3
92,997 107,154
4.5 3.636.2 42.4
.. ..
.. ..
50.1 51.0.. .... ..
99.6 128.7
5.5 5.2
2,220 4,948
96,232 228,8531,471 2,582
28.1 95.58.3 39.5

Economic and social context
Population (millions)Labor force (millions)Unemployment rate (% of labor force)GNI per capita, World Bank Atlas method ($)GDP growth, 2000–05 and 2006–13 (average annual %)Agriculture value added (% of GDP)Industry value added (% of GDP) Manufacturing value added (% of GDP)Services value added (% of GDP)Inflation (annual % change in CPI)Exchange rate (local currency units per $)Exports of goods and services (% of GDP)Imports of goods and services (% of GDP)
Business environment
Ease of doing business (ranking 1–189; 1=best)Time to start a business (days)Procedures to start a business (number)Time to prepare, file, and pay taxes (hours)Time to export (days)Time to resolve insolvency (years)Profit tax (% of commercial profits)New businesses registered (thousands)New business density (new regis. per 1,000 working-age pop.)Enterprise surveys
Time spent dealing w/req. of gov't. reg. (% of sr. mgt. time) Firms expected to give gifts in meetings with tax officials (%) Firms competing against unregistered firms (%) Firms using banks to finance working capital (% of firms) Delay in obtaining an electrical connection (days) Internationally recognized quality certification (% of firms)
Private sector investment
Invest. in infra. w/privt. part., 2000–05 and 2006–13 ($ millions)Private foreign direct investment, net (% of GDP)Gross fixed capital formation (% of GDP)Gross fixed private capital formation (% of GDP)
Finance and banking
Government debt (% of GDP)Total financial system deposits (% of GDP)Bank capital to asset ratio (%)Bank nonperforming loans to total gross loans (%)Domestic credit to the private sector (% of GDP)Real interest rate (%)Interest rate spread (percentage points)
Infrastructure
Air transport (thousands registered carrier departures worldwide)Port container traffic (thousand TEU)Electric power consumption (kWh per capita)Power outages in firms in a typical month (number)Mobile-cellular telephone subscriptions (per 100 people)Individuals using the Internet (%)
4 2015 The Little Data Book on Private Sector Development
Europe & Central Asia
2005 2013
259.8 272.4109.4 120.5
10.0 9.73,510 7,114
5.8 2.810.3 8.231.2 30.219.2 17.258.5 61.6
35.2 40.539.5 44.5
39 1110 5
477 25738 272.9 2.4
.. 11.5 2.2
27,260 101,549
4.9 2.222.7 21.218.9 18.5
.. ..
33.3 44.713.7 13.23.2 11.6
27.2 56.6
8.2 5.9
412 957
.. ..2,604 2,954
49.5 111.812.0 45.9
Economic and social context
Population (millions)Labor force (millions)Unemployment rate (% of labor force)GNI per capita, World Bank Atlas method ($)GDP growth, 2000–05 and 2006–13 (average annual %)Agriculture value added (% of GDP)Industry value added (% of GDP) Manufacturing value added (% of GDP)Services value added (% of GDP)Inflation (annual % change in CPI)Exchange rate (local currency units per $)Exports of goods and services (% of GDP)Imports of goods and services (% of GDP)
Business environment
Ease of doing business (ranking 1–189; 1=best)Time to start a business (days)Procedures to start a business (number)Time to prepare, file, and pay taxes (hours)Time to export (days)Time to resolve insolvency (years)Profit tax (% of commercial profits)New businesses registered (thousands)New business density (new regis. per 1,000 working-age pop.)Enterprise surveys
Time spent dealing w/req. of gov't. reg. (% of sr. mgt. time) Firms expected to give gifts in meetings with tax officials (%) Firms competing against unregistered firms (%) Firms using banks to finance working capital (% of firms) Delay in obtaining an electrical connection (days) Internationally recognized quality certification (% of firms)
Private sector investment
Invest. in infra. w/privt. part., 2000–05 and 2006–13 ($ millions)Private foreign direct investment, net (% of GDP)Gross fixed capital formation (% of GDP)Gross fixed private capital formation (% of GDP)
Finance and banking
Government debt (% of GDP)Total financial system deposits (% of GDP)Bank capital to asset ratio (%)Bank nonperforming loans to total gross loans (%)Domestic credit to the private sector (% of GDP)Real interest rate (%)Interest rate spread (percentage points)
Infrastructure
Air transport (thousands registered carrier departures worldwide)Port container traffic (thousand TEU)Electric power consumption (kWh per capita)Power outages in firms in a typical month (number)Mobile-cellular telephone subscriptions (per 100 people)Individuals using the Internet (%)
5The Little Data Book on Private Sector Development 2015
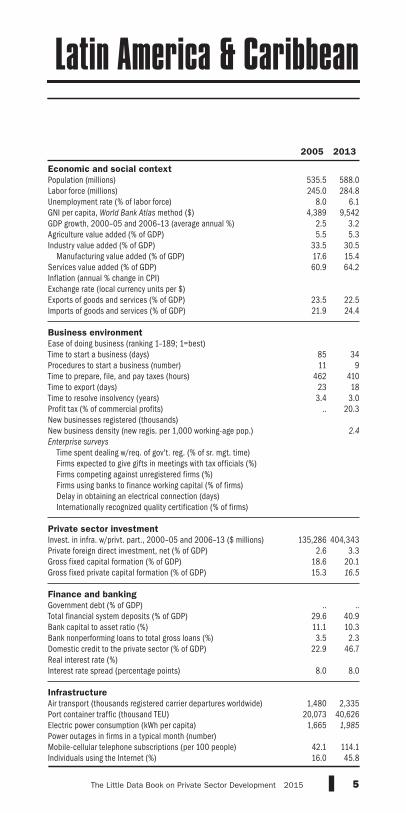
Latin America & Caribbean
2005 2013
535.5 588.0245.0 284.8
8.0 6.14,389 9,542
2.5 3.25.5 5.3
33.5 30.517.6 15.460.9 64.2
23.5 22.521.9 24.4
85 3411 9
462 41023 183.4 3.0
.. 20.3 2.4
135,286 404,343
2.6 3.318.6 20.115.3 16.5
.. ..
29.6 40.911.1 10.33.5 2.3
22.9 46.7
8.0 8.0
1,480 2,335
20,073 40,6261,665 1,985
42.1 114.116.0 45.8

Economic and social context
Population (millions)Labor force (millions)Unemployment rate (% of labor force)GNI per capita, World Bank Atlas method ($)GDP growth, 2000–05 and 2006–13 (average annual %)Agriculture value added (% of GDP)Industry value added (% of GDP) Manufacturing value added (% of GDP)Services value added (% of GDP)Inflation (annual % change in CPI)Exchange rate (local currency units per $)Exports of goods and services (% of GDP)Imports of goods and services (% of GDP)
Business environment
Ease of doing business (ranking 1–189; 1=best)Time to start a business (days)Procedures to start a business (number)Time to prepare, file, and pay taxes (hours)Time to export (days)Time to resolve insolvency (years)Profit tax (% of commercial profits)New businesses registered (thousands)New business density (new regis. per 1,000 working-age pop.)Enterprise surveys
Time spent dealing w/req. of gov't. reg. (% of sr. mgt. time) Firms expected to give gifts in meetings with tax officials (%) Firms competing against unregistered firms (%) Firms using banks to finance working capital (% of firms) Delay in obtaining an electrical connection (days) Internationally recognized quality certification (% of firms)
Private sector investment
Invest. in infra. w/privt. part., 2000–05 and 2006–13 ($ millions)Private foreign direct investment, net (% of GDP)Gross fixed capital formation (% of GDP)Gross fixed private capital formation (% of GDP)
Finance and banking
Government debt (% of GDP)Total financial system deposits (% of GDP)Bank capital to asset ratio (%)Bank nonperforming loans to total gross loans (%)Domestic credit to the private sector (% of GDP)Real interest rate (%)Interest rate spread (percentage points)
Infrastructure
Air transport (thousands registered carrier departures worldwide)Port container traffic (thousand TEU)Electric power consumption (kWh per capita)Power outages in firms in a typical month (number)Mobile-cellular telephone subscriptions (per 100 people)Individuals using the Internet (%)
6 2015 The Little Data Book on Private Sector Development
Middle East & North Africa
2005 2013
300.8 345.495.3 112.012.9 12.7
1,998 ..4.5 3.2
10.6 ..43.1 ..12.9 ..46.4 ..
39.3 ..34.4 ..
36 2010 8
281 30230 243.0 3.0
.. 16.3 0.5
13,435 39,824
2.8 1.622.9 ..14.1 ..
.. ..
50.1 42.9
.. 8.0
.. 7.030.4 25.4
5.0 4.4
361 529
10,615 18,3991,328 1,696
22.4 100.88.5 34.1

Economic and social context
Population (millions)Labor force (millions)Unemployment rate (% of labor force)GNI per capita, World Bank Atlas method ($)GDP growth, 2000–05 and 2006–13 (average annual %)Agriculture value added (% of GDP)Industry value added (% of GDP) Manufacturing value added (% of GDP)Services value added (% of GDP)Inflation (annual % change in CPI)Exchange rate (local currency units per $)Exports of goods and services (% of GDP)Imports of goods and services (% of GDP)
Business environment
Ease of doing business (ranking 1–189; 1=best)Time to start a business (days)Procedures to start a business (number)Time to prepare, file, and pay taxes (hours)Time to export (days)Time to resolve insolvency (years)Profit tax (% of commercial profits)New businesses registered (thousands)New business density (new regis. per 1,000 working-age pop.)Enterprise surveys
Time spent dealing w/req. of gov't. reg. (% of sr. mgt. time) Firms expected to give gifts in meetings with tax officials (%) Firms competing against unregistered firms (%) Firms using banks to finance working capital (% of firms) Delay in obtaining an electrical connection (days) Internationally recognized quality certification (% of firms)
Private sector investment
Invest. in infra. w/privt. part., 2000–05 and 2006–13 ($ millions)Private foreign direct investment, net (% of GDP)Gross fixed capital formation (% of GDP)Gross fixed private capital formation (% of GDP)
Finance and banking
Government debt (% of GDP)Total financial system deposits (% of GDP)Bank capital to asset ratio (%)Bank nonperforming loans to total gross loans (%)Domestic credit to the private sector (% of GDP)Real interest rate (%)Interest rate spread (percentage points)
Infrastructure
Air transport (thousands registered carrier departures worldwide)Port container traffic (thousand TEU)Electric power consumption (kWh per capita)Power outages in firms in a typical month (number)Mobile-cellular telephone subscriptions (per 100 people)Individuals using the Internet (%)
7The Little Data Book on Private Sector Development 2015
South Asia
2005 2013
1,499.0 1,670.8609.8 656.3
4.7 3.9700 1,4836.3 6.8
19.2 18.627.9 29.415.8 16.852.9 52.0
19.1 23.222.7 27.5
38 168 8
305 32536 332.7 2.6
.. 17.9 0.3
44,944 307,474
1.0 1.428.3 27.721.5 20.6
61.2 50.6
50.7 60.0
6.6 7.89.3 5.6
37.7 46.7
6.2 4.8
420 854
9,933 19,173424 605
7.8 71.52.5 13.7

Economic and social context
Population (millions)Labor force (millions)Unemployment rate (% of labor force)GNI per capita, World Bank Atlas method ($)GDP growth, 2000–05 and 2006–13 (average annual %)Agriculture value added (% of GDP)Industry value added (% of GDP) Manufacturing value added (% of GDP)Services value added (% of GDP)Inflation (annual % change in CPI)Exchange rate (local currency units per $)Exports of goods and services (% of GDP)Imports of goods and services (% of GDP)
Business environment
Ease of doing business (ranking 1–189; 1=best)Time to start a business (days)Procedures to start a business (number)Time to prepare, file, and pay taxes (hours)Time to export (days)Time to resolve insolvency (years)Profit tax (% of commercial profits)New businesses registered (thousands)New business density (new regis. per 1,000 working-age pop.)Enterprise surveys
Time spent dealing w/req. of gov't. reg. (% of sr. mgt. time) Firms expected to give gifts in meetings with tax officials (%) Firms competing against unregistered firms (%) Firms using banks to finance working capital (% of firms) Delay in obtaining an electrical connection (days) Internationally recognized quality certification (% of firms)
Private sector investment
Invest. in infra. w/privt. part., 2000–05 and 2006–13 ($ millions)Private foreign direct investment, net (% of GDP)Gross fixed capital formation (% of GDP)Gross fixed private capital formation (% of GDP)
Finance and banking
Government debt (% of GDP)Total financial system deposits (% of GDP)Bank capital to asset ratio (%)Bank nonperforming loans to total gross loans (%)Domestic credit to the private sector (% of GDP)Real interest rate (%)Interest rate spread (percentage points)
Infrastructure
Air transport (thousands registered carrier departures worldwide)Port container traffic (thousand TEU)Electric power consumption (kWh per capita)Power outages in firms in a typical month (number)Mobile-cellular telephone subscriptions (per 100 people)Individuals using the Internet (%)
8 2015 The Little Data Book on Private Sector Development
Sub-Saharan Africa
2005 2013
756.4 936.3291.8 368.7
7.7 7.7791 1,6865.3 4.2
17.0 14.332.0 27.812.3 11.050.4 57.5
31.4 29.631.3 32.9
60 2511 8
340 30739 313.1 3.1
.. 18.0 2.1
24,617 75,835
2.8 2.316.6 20.513.3 13.8
.. ..
32.7 33.0.. .... ..
62.8 48.1
11.7 8.6
380 625
.. ..544 535
12.0 66.0
2.1 16.9

9The Little Data Book on Private Sector Development 2015
For operational and analytical purposes the World Bank’s main criterion for
classifying economies is gross national income (GNI) per capita. Every
economy in The Little Data Book on Private Sector Development is classified
as low income, middle income, or high income. Low- and middle-income
economies are sometimes referred to as developing economies. The use of
the term is convenient; it is not intended to imply that all economies in the
group are experiencing similar development or that other economies have
reached a preferred or final stage of development. Classification by income
does not necessarily reflect development status.
Low-income economies are those with a GNI per capita of $1,045 or less in
2013.
Middle-income economies are those with a GNI per capita of more than
$1,045 but less than $12,746. Lower-middle-income and upper-middle
income economies are separated at a GNI per capita of $4,125.
High-income economies are those with a GNI per capita of $12,746 or more.
Euro area includes the member states of the Economic and Monetary Union
of the European Union that have adopted the euro as their currency: Austria,
Belgium, Cyprus, Estonia, Finland, France, Germany, Greece, Ireland, Italy,
Latvia, Lithuania, Luxembourg, Malta, the Netherlands, Portugal, Slovak
Republic, Slovenia, and Spain.
Income group tables
Economic and social context
Population (millions)Labor force (millions)Unemployment rate (% of labor force)GNI per capita, World Bank Atlas method ($)GDP growth, 2000–05 and 2006–13 (average annual %)Agriculture value added (% of GDP)Industry value added (% of GDP) Manufacturing value added (% of GDP)Services value added (% of GDP)Inflation (annual % change in CPI)Exchange rate (local currency units per $)Exports of goods and services (% of GDP)Imports of goods and services (% of GDP)
Business environment
Ease of doing business (ranking 1–189; 1=best)Time to start a business (days)Procedures to start a business (number)Time to prepare, file, and pay taxes (hours)Time to export (days)Time to resolve insolvency (years)Profit tax (% of commercial profits)New businesses registered (thousands)New business density (new regis. per 1,000 working-age pop.)Enterprise surveys
Time spent dealing w/req. of gov't. reg. (% of sr. mgt. time) Firms expected to give gifts in meetings with tax officials (%) Firms competing against unregistered firms (%) Firms using banks to finance working capital (% of firms) Delay in obtaining an electrical connection (days) Internationally recognized quality certification (% of firms)
Private sector investment
Invest. in infra. w/privt. part., 2000–05 and 2006–13 ($ millions)Private foreign direct investment, net (% of GDP)Gross fixed capital formation (% of GDP)Gross fixed private capital formation (% of GDP)
Finance and banking
Government debt (% of GDP)Total financial system deposits (% of GDP)Bank capital to asset ratio (%)Bank nonperforming loans to total gross loans (%)Domestic credit to the private sector (% of GDP)Real interest rate (%)Interest rate spread (percentage points)
Infrastructure
Air transport (thousands registered carrier departures worldwide)Port container traffic (thousand TEU)Electric power consumption (kWh per capita)Power outages in firms in a typical month (number)Mobile-cellular telephone subscriptions (per 100 people)Individuals using the Internet (%)
10 2015 The Little Data Book on Private Sector Development
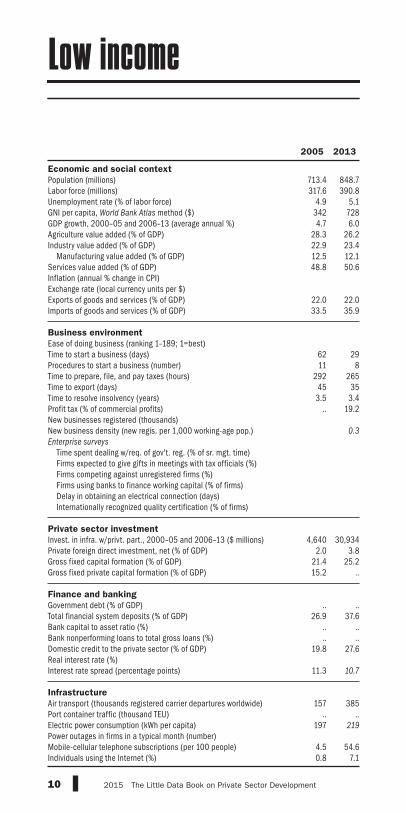
Low income
2005 2013
713.4 848.7317.6 390.8
4.9 5.1342 7284.7 6.0
28.3 26.222.9 23.412.5 12.148.8 50.6
22.0 22.033.5 35.9
62 2911 8
292 26545 353.5 3.4
.. 19.2 0.3
4,640 30,934
2.0 3.821.4 25.215.2 ..
.. ..
26.9 37.6.. .... ..
19.8 27.6
11.3 10.7
157 385
.. ..197 219
4.5 54.60.8 7.1

Economic and social context
Population (millions)Labor force (millions)Unemployment rate (% of labor force)GNI per capita, World Bank Atlas method ($)GDP growth, 2000–05 and 2006–13 (average annual %)Agriculture value added (% of GDP)Industry value added (% of GDP) Manufacturing value added (% of GDP)Services value added (% of GDP)Inflation (annual % change in CPI)Exchange rate (local currency units per $)Exports of goods and services (% of GDP)Imports of goods and services (% of GDP)
Business environment
Ease of doing business (ranking 1–189; 1=best)Time to start a business (days)Procedures to start a business (number)Time to prepare, file, and pay taxes (hours)Time to export (days)Time to resolve insolvency (years)Profit tax (% of commercial profits)New businesses registered (thousands)New business density (new regis. per 1,000 working-age pop.)Enterprise surveys
Time spent dealing w/req. of gov't. reg. (% of sr. mgt. time) Firms expected to give gifts in meetings with tax officials (%) Firms competing against unregistered firms (%) Firms using banks to finance working capital (% of firms) Delay in obtaining an electrical connection (days) Internationally recognized quality certification (% of firms)
Private sector investment
Invest. in infra. w/privt. part., 2000–05 and 2006–13 ($ millions)Private foreign direct investment, net (% of GDP)Gross fixed capital formation (% of GDP)Gross fixed private capital formation (% of GDP)
Finance and banking
Government debt (% of GDP)Total financial system deposits (% of GDP)Bank capital to asset ratio (%)Bank nonperforming loans to total gross loans (%)Domestic credit to the private sector (% of GDP)Real interest rate (%)Interest rate spread (percentage points)
Infrastructure
Air transport (thousands registered carrier departures worldwide)Port container traffic (thousand TEU)Electric power consumption (kWh per capita)Power outages in firms in a typical month (number)Mobile-cellular telephone subscriptions (per 100 people)Individuals using the Internet (%)
11The Little Data Book on Private Sector Development 2015
Middle income
2005 2013
4,530.8 4,970.02,084.9 2,277.9
6.1 5.61,843 4,754
5.5 5.710.9 10.038.1 35.622.2 21.551.0 54.5
33.1 29.531.1 30.4
56 2410 7
395 31929 233.0 2.7
.. 16.7 2.2
365,517 1,098,489
3.4 3.026.9 30.1
.. ..
.. ..
41.5 46.89.8 10.46.5 4.1
55.6 85.8
7.4 6.4
5,115 9,864
139,132 325,1641,237 1,816
24.9 92.3
7.7 32.7

Economic and social context
Population (millions)Labor force (millions)Unemployment rate (% of labor force)GNI per capita, World Bank Atlas method ($)GDP growth, 2000–05 and 2006–13 (average annual %)Agriculture value added (% of GDP)Industry value added (% of GDP) Manufacturing value added (% of GDP)Services value added (% of GDP)Inflation (annual % change in CPI)Exchange rate (local currency units per $)Exports of goods and services (% of GDP)Imports of goods and services (% of GDP)
Business environment
Ease of doing business (ranking 1–189; 1=best)Time to start a business (days)Procedures to start a business (number)Time to prepare, file, and pay taxes (hours)Time to export (days)Time to resolve insolvency (years)Profit tax (% of commercial profits)New businesses registered (thousands)New business density (new regis. per 1,000 working-age pop.)Enterprise surveys
Time spent dealing w/req. of gov't. reg. (% of sr. mgt. time) Firms expected to give gifts in meetings with tax officials (%) Firms competing against unregistered firms (%) Firms using banks to finance working capital (% of firms) Delay in obtaining an electrical connection (days) Internationally recognized quality certification (% of firms)
Private sector investment
Invest. in infra. w/privt. part., 2000–05 and 2006–13 ($ millions)Private foreign direct investment, net (% of GDP)Gross fixed capital formation (% of GDP)Gross fixed private capital formation (% of GDP)
Finance and banking
Government debt (% of GDP)Total financial system deposits (% of GDP)Bank capital to asset ratio (%)Bank nonperforming loans to total gross loans (%)Domestic credit to the private sector (% of GDP)Real interest rate (%)Interest rate spread (percentage points)
Infrastructure
Air transport (thousands registered carrier departures worldwide)Port container traffic (thousand TEU)Electric power consumption (kWh per capita)Power outages in firms in a typical month (number)Mobile-cellular telephone subscriptions (per 100 people)Individuals using the Internet (%)
12 2015 The Little Data Book on Private Sector Development
Lower middle income
2005 2013
2,266.3 2,561.1913.0 1,014.0
6.4 5.3887 2,0745.9 5.8
17.9 17.032.8 32.117.5 17.149.1 51.1
28.6 27.130.7 31.2
53 2210 7
417 31532 25
3.2 2.9.. 15.9 1.1
93,090 402,668
2.4 2.124.7 25.519.6 18.8
.. ..
44.2 47.1
9.8 10.38.5 4.5
33.3 41.5
9.2 7.1
1,231 2,437
27,448 62,268563 736
13.7 85.24.0 21.2

Economic and social context
Population (millions)Labor force (millions)Unemployment rate (% of labor force)GNI per capita, World Bank Atlas method ($)GDP growth, 2000–05 and 2006–13 (average annual %)Agriculture value added (% of GDP)Industry value added (% of GDP) Manufacturing value added (% of GDP)Services value added (% of GDP)Inflation (annual % change in CPI)Exchange rate (local currency units per $)Exports of goods and services (% of GDP)Imports of goods and services (% of GDP)
Business environment
Ease of doing business (ranking 1–189; 1=best)Time to start a business (days)Procedures to start a business (number)Time to prepare, file, and pay taxes (hours)Time to export (days)Time to resolve insolvency (years)Profit tax (% of commercial profits)New businesses registered (thousands)New business density (new regis. per 1,000 working-age pop.)Enterprise surveys
Time spent dealing w/req. of gov't. reg. (% of sr. mgt. time) Firms expected to give gifts in meetings with tax officials (%) Firms competing against unregistered firms (%) Firms using banks to finance working capital (% of firms) Delay in obtaining an electrical connection (days) Internationally recognized quality certification (% of firms)
Private sector investment
Invest. in infra. w/privt. part., 2000–05 and 2006–13 ($ millions)Private foreign direct investment, net (% of GDP)Gross fixed capital formation (% of GDP)Gross fixed private capital formation (% of GDP)
Finance and banking
Government debt (% of GDP)Total financial system deposits (% of GDP)Bank capital to asset ratio (%)Bank nonperforming loans to total gross loans (%)Domestic credit to the private sector (% of GDP)Real interest rate (%)Interest rate spread (percentage points)
Infrastructure
Air transport (thousands registered carrier departures worldwide)Port container traffic (thousand TEU)Electric power consumption (kWh per capita)Power outages in firms in a typical month (number)Mobile-cellular telephone subscriptions (per 100 people)Individuals using the Internet (%)
13The Little Data Book on Private Sector Development 2015
Upper middle income
2005 2013
2,264.5 2,408.91,171.9 1,264.0
5.9 5.92,800 7,604
5.4 5.78.6 7.6
39.8 36.723.8 23.051.6 55.6
34.5 30.331.2 30.1
60 269 7
374 32326 20
2.9 2.6.. 17.5 3.0
265,905 426,038
3.7 3.327.5 31.6
.. ..
.. ..
40.7 48.09.7 10.74.3 3.6
62.3 98.0
6.5 6.0
3,884 7,427
111,684 262,8961,902 2,932
36.1 99.811.3 44.8

Economic and social context
Population (millions)Labor force (millions)Unemployment rate (% of labor force)GNI per capita, World Bank Atlas method ($)GDP growth, 2000–05 and 2006–13 (average annual %)Agriculture value added (% of GDP)Industry value added (% of GDP) Manufacturing value added (% of GDP)Services value added (% of GDP)Inflation (annual % change in CPI)Exchange rate (local currency units per $)Exports of goods and services (% of GDP)Imports of goods and services (% of GDP)
Business environment
Ease of doing business (ranking 1–189; 1=best)Time to start a business (days)Procedures to start a business (number)Time to prepare, file, and pay taxes (hours)Time to export (days)Time to resolve insolvency (years)Profit tax (% of commercial profits)New businesses registered (thousands)New business density (new regis. per 1,000 working-age pop.)Enterprise surveys
Time spent dealing w/req. of gov't. reg. (% of sr. mgt. time) Firms expected to give gifts in meetings with tax officials (%) Firms competing against unregistered firms (%) Firms using banks to finance working capital (% of firms) Delay in obtaining an electrical connection (days) Internationally recognized quality certification (% of firms)
Private sector investment
Invest. in infra. w/privt. part., 2000–05 and 2006–13 ($ millions)Private foreign direct investment, net (% of GDP)Gross fixed capital formation (% of GDP)Gross fixed private capital formation (% of GDP)
Finance and banking
Government debt (% of GDP)Total financial system deposits (% of GDP)Bank capital to asset ratio (%)Bank nonperforming loans to total gross loans (%)Domestic credit to the private sector (% of GDP)Real interest rate (%)Interest rate spread (percentage points)
Infrastructure
Air transport (thousands registered carrier departures worldwide)Port container traffic (thousand TEU)Electric power consumption (kWh per capita)Power outages in firms in a typical month (number)Mobile-cellular telephone subscriptions (per 100 people)Individuals using the Internet (%)
14 2015 The Little Data Book on Private Sector Development
Low & middle income
2005 2013
5,244.2 5,818.72,402.5 2,668.8
6.0 5.51,639 4,168
5.5 5.711.3 10.437.7 35.322.0 21.350.9 54.4
32.9 29.331.2 30.5
58 2510 7
371 30633 263.1 2.9
.. 17.3 1.9
313,205 1,008,068
3.4 3.026.7 29.9
.. ..
.. ..
41.2 46.6.. 10.6
6.6 4.554.7 84.7
7.9 6.6
5,272 10,249
139,941 329,4971,129 1,646
22.2 86.9
6.8 29.1
Economic and social context
Population (millions)Labor force (millions)Unemployment rate (% of labor force)GNI per capita, World Bank Atlas method ($)GDP growth, 2000–05 and 2006–13 (average annual %)Agriculture value added (% of GDP)Industry value added (% of GDP) Manufacturing value added (% of GDP)Services value added (% of GDP)Inflation (annual % change in CPI)Exchange rate (local currency units per $)Exports of goods and services (% of GDP)Imports of goods and services (% of GDP)
Business environment
Ease of doing business (ranking 1–189; 1=best)Time to start a business (days)Procedures to start a business (number)Time to prepare, file, and pay taxes (hours)Time to export (days)Time to resolve insolvency (years)Profit tax (% of commercial profits)New businesses registered (thousands)New business density (new regis. per 1,000 working-age pop.)Enterprise surveys
Time spent dealing w/req. of gov't. reg. (% of sr. mgt. time) Firms expected to give gifts in meetings with tax officials (%) Firms competing against unregistered firms (%) Firms using banks to finance working capital (% of firms) Delay in obtaining an electrical connection (days) Internationally recognized quality certification (% of firms)
Private sector investment
Invest. in infra. w/privt. part., 2000–05 and 2006–13 ($ millions)Private foreign direct investment, net (% of GDP)Gross fixed capital formation (% of GDP)Gross fixed private capital formation (% of GDP)
Finance and banking
Government debt (% of GDP)Total financial system deposits (% of GDP)Bank capital to asset ratio (%)Bank nonperforming loans to total gross loans (%)Domestic credit to the private sector (% of GDP)Real interest rate (%)Interest rate spread (percentage points)
Infrastructure
Air transport (thousands registered carrier departures worldwide)Port container traffic (thousand TEU)Electric power consumption (kWh per capita)Power outages in firms in a typical month (number)Mobile-cellular telephone subscriptions (per 100 people)Individuals using the Internet (%)
15The Little Data Book on Private Sector Development 2015
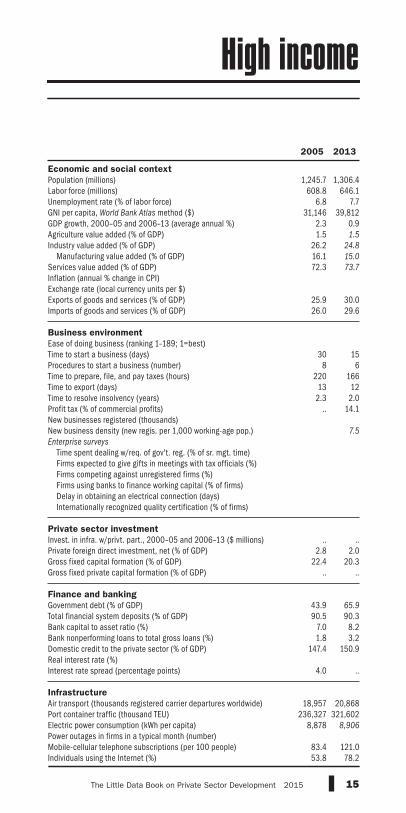
High income
2005 2013
1,245.7 1,306.4608.8 646.1
6.8 7.731,146 39,812
2.3 0.91.5 1.5
26.2 24.8
16.1 15.0
72.3 73.7
25.9 30.026.0 29.6
30 158 6
220 16613 12
2.3 2.0.. 14.1 7.5
.. ..
2.8 2.022.4 20.3
.. ..
43.9 65.9
90.5 90.37.0 8.21.8 3.2
147.4 150.9
4.0 ..
18,957 20,868
236,327 321,6028,878 8,906
83.4 121.053.8 78.2

Economic and social context
Population (millions)Labor force (millions)Unemployment rate (% of labor force)GNI per capita, World Bank Atlas method ($)GDP growth, 2000–05 and 2006–13 (average annual %)Agriculture value added (% of GDP)Industry value added (% of GDP) Manufacturing value added (% of GDP)Services value added (% of GDP)Inflation (annual % change in CPI)Exchange rate (local currency units per $)Exports of goods and services (% of GDP)Imports of goods and services (% of GDP)
Business environment
Ease of doing business (ranking 1–189; 1=best)Time to start a business (days)Procedures to start a business (number)Time to prepare, file, and pay taxes (hours)Time to export (days)Time to resolve insolvency (years)Profit tax (% of commercial profits)New businesses registered (thousands)New business density (new regis. per 1,000 working-age pop.)Enterprise surveys
Time spent dealing w/req. of gov't. reg. (% of sr. mgt. time) Firms expected to give gifts in meetings with tax officials (%) Firms competing against unregistered firms (%) Firms using banks to finance working capital (% of firms) Delay in obtaining an electrical connection (days) Internationally recognized quality certification (% of firms)
Private sector investment
Invest. in infra. w/privt. part., 2000–05 and 2006–13 ($ millions)Private foreign direct investment, net (% of GDP)Gross fixed capital formation (% of GDP)Gross fixed private capital formation (% of GDP)
Finance and banking
Government debt (% of GDP)Total financial system deposits (% of GDP)Bank capital to asset ratio (%)Bank nonperforming loans to total gross loans (%)Domestic credit to the private sector (% of GDP)Real interest rate (%)Interest rate spread (percentage points)
Infrastructure
Air transport (thousands registered carrier departures worldwide)Port container traffic (thousand TEU)Electric power consumption (kWh per capita)Power outages in firms in a typical month (number)Mobile-cellular telephone subscriptions (per 100 people)Individuals using the Internet (%)
16 2015 The Little Data Book on Private Sector Development
Euro area
2005 2013
329.5 337.3156.1 162.5
9.0 12.132,422 39,350
1.5 0.01.8 1.8
26.5 24.617.7 16.271.7 73.7
36.1 42.734.6 39.3
29 118 5
224 16513 11
1.8 1.9.. 13.7 6.6
.. ..
4.2 1.922.0 19.5
.. ..
48.9 73.2
82.4 104.86.6 7.51.8 7.9
105.6 119.0
3.8 ..
4,159 4,139
60,341 87,6536,781 6,599
97.9 122.851.2 75.8

17The Little Data Book on Private Sector Development 2015
China
Data for China do not include data for Hong Kong SAR, China; Macao SAR, China; or Taiwan, China.
Cyprus
GNI and GDP data and data calculated using GNI and GDP refer to the area controlled by the government of Cyprus.
Georgia
GNI, GDP, and population data and data calculated using GNI, GDP, and population exclude Abkhazia and South Ossetia.
Kosovo, Montenegro, and Serbia
Montenegro declared independence from Serbia and Montenegro on June 3, 2006. Where available, data for each country are shown separately. However, some indicators for Serbia prior to 2006 include data for Montenegro. Moreover, data for most indicators for Serbia from 1999 onward exclude data for Kosovo, which in 1999 became a territory under international administration pursuant to UN Security Council Resolution 1244 (1999). Kosovo became a member of the World Bank on June 29, 2009, and its data are shown where available.
Moldova
GNI, GDP, and population data and data calculated using GNI, GDP, and population exclude Transnistria.
Morocco
GNI and GDP data and data calculated using GNI and GDP include Former Spanish Sahara.
South Sudan and Sudan
South Sudan declared its independence on July 9, 2011. Data are shown separately for South Sudan where available. Data reported for Sudan include South Sudan to 2011 unless otherwise noted.
Tanzania
GNI and GDP data and data calculated using GNI and GDP refer to mainland Tanzania only.
For more information, see World Development Indicators 2015 or data.worldbank.org.
Country tables

18 2015 The Little Data Book on Private Sector Development
Economic and social context
Population (millions)Labor force (millions)Unemployment rate (% of labor force)GNI per capita, World Bank Atlas method ($)GDP growth, 2000–05 and 2006–13 (average annual %)Agriculture value added (% of GDP)Industry value added (% of GDP) Manufacturing value added (% of GDP)Services value added (% of GDP)Inflation (annual % change in CPI)Exchange rate (local currency units per $)Exports of goods and services (% of GDP)Imports of goods and services (% of GDP)
Business environment
Ease of doing business (ranking 1–189; 1=best)Time to start a business (days)Procedures to start a business (number)Time to prepare, file, and pay taxes (hours)Time to export (days)Time to resolve insolvency (years)Profit tax (% of commercial profits)New businesses registered (thousands)New business density (new regis. per 1,000 working-age pop.)Enterprise surveys
Time spent dealing w/req. of gov't. reg. (% of sr. mgt. time) Firms expected to give gifts in meetings with tax officials (%) Firms competing against unregistered firms (%) Firms using banks to finance working capital (% of firms) Delay in obtaining an electrical connection (days) Internationally recognized quality certification (% of firms)
Private sector investment
Invest. in infra. w/privt. part., 2000–05 and 2006–13 ($ millions)Private foreign direct investment, net (% of GDP)Gross fixed capital formation (% of GDP)Gross fixed private capital formation (% of GDP)
Finance and banking
Government debt (% of GDP)Total financial system deposits (% of GDP)Bank capital to asset ratio (%)Bank nonperforming loans to total gross loans (%)Domestic credit to the private sector (% of GDP)Real interest rate (%)Interest rate spread (percentage points)
Infrastructure
Air transport (thousands registered carrier departures worldwide)Port container traffic (thousand TEU)Electric power consumption (kWh per capita)Power outages in firms in a typical month (number)Mobile-cellular telephone subscriptions (per 100 people)Individuals using the Internet (%)
South Asia Low income
Afghanistan
2005 2013 2013
Low-
income
groupCountry data
24.9 30.6 8496.0 7.8 3918.5 8.0 5.1
250 690 7286.2 10.2 6.0
31.8 24.0 26.227.4 21.2 23.416.9 12.1 12.140.9 54.8 50.612.7 7.649.6 55.427.4 6.3 22.077.5 49.1 35.9
.. 1839 7 294 3 8
275 275 26567 86 35
2.0 2.0 3.4.. 0.0 19.2
2.5 2.3
0.2 0.2 0.3
.. 9.8.. 34.0.. 41.5.. 3.9.. 111.3.. 22.1
468 1,217 30,9344.3 0.3 3.8
21.6 17.7 25.2.. .. .. .. .. ..
9.0 17.6 37.6.. 7.8 .... 4.9 ..
4.8 4.2 27.610.1 10.7
.. .. 10.7 .. 12 385.. .. .... .. 219
.. 11.54.8 70.7 54.61.2 5.9 7.1
19The Little Data Book on Private Sector Development 2015
Economic and social context
Population (millions)Labor force (millions)Unemployment rate (% of labor force)GNI per capita, World Bank Atlas method ($)GDP growth, 2000–05 and 2006–13 (average annual %)Agriculture value added (% of GDP)Industry value added (% of GDP) Manufacturing value added (% of GDP)Services value added (% of GDP)Inflation (annual % change in CPI)Exchange rate (local currency units per $)Exports of goods and services (% of GDP)Imports of goods and services (% of GDP)
Business environment
Ease of doing business (ranking 1–189; 1=best)Time to start a business (days)Procedures to start a business (number)Time to prepare, file, and pay taxes (hours)Time to export (days)Time to resolve insolvency (years)Profit tax (% of commercial profits)New businesses registered (thousands)New business density (new regis. per 1,000 working-age pop.)Enterprise surveys
Time spent dealing w/req. of gov't. reg. (% of sr. mgt. time) Firms expected to give gifts in meetings with tax officials (%) Firms competing against unregistered firms (%) Firms using banks to finance working capital (% of firms) Delay in obtaining an electrical connection (days) Internationally recognized quality certification (% of firms)
Private sector investment
Invest. in infra. w/privt. part., 2000–05 and 2006–13 ($ millions)Private foreign direct investment, net (% of GDP)Gross fixed capital formation (% of GDP)Gross fixed private capital formation (% of GDP)
Finance and banking
Government debt (% of GDP)Total financial system deposits (% of GDP)Bank capital to asset ratio (%)Bank nonperforming loans to total gross loans (%)Domestic credit to the private sector (% of GDP)Real interest rate (%)Interest rate spread (percentage points)
Infrastructure
Air transport (thousands registered carrier departures worldwide)Port container traffic (thousand TEU)Electric power consumption (kWh per capita)Power outages in firms in a typical month (number)Mobile-cellular telephone subscriptions (per 100 people)Individuals using the Internet (%)
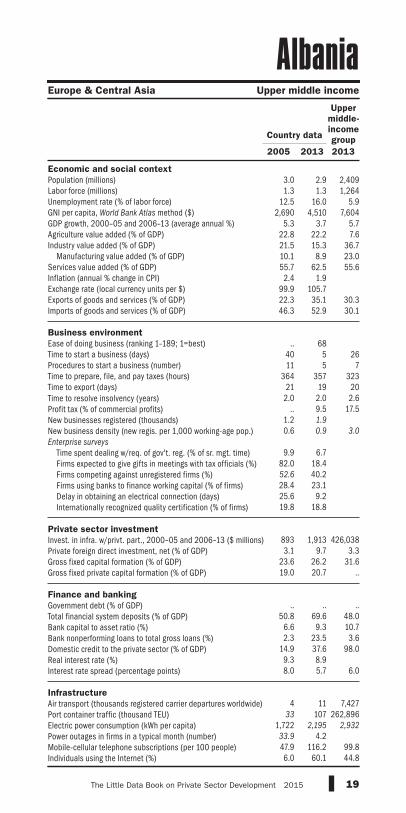
Europe & Central Asia Upper middle income
Albania
2005 2013 2013
Upper
middle-
income
groupCountry data
3.0 2.9 2,4091.3 1.3 1,264
12.5 16.0 5.92,690 4,510 7,604
5.3 3.7 5.722.8 22.2 7.621.5 15.3 36.710.1 8.9 23.055.7 62.5 55.62.4 1.9
99.9 105.722.3 35.1 30.346.3 52.9 30.1
.. 68
40 5 2611 5 7
364 357 32321 19 20
2.0 2.0 2.6.. 9.5 17.5
1.2 1.9
0.6 0.9 3.0
9.9 6.7
82.0 18.452.6 40.228.4 23.125.6 9.219.8 18.8
893 1,913 426,0383.1 9.7 3.3
23.6 26.2 31.619.0 20.7 ..
.. .. ..
50.8 69.6 48.06.6 9.3 10.72.3 23.5 3.6
14.9 37.6 98.09.3 8.98.0 5.7 6.0
4 11 7,427
33 107 262,8961,722 2,195 2,932
33.9 4.247.9 116.2 99.86.0 60.1 44.8

20 2015 The Little Data Book on Private Sector Development
Economic and social context
Population (millions)Labor force (millions)Unemployment rate (% of labor force)GNI per capita, World Bank Atlas method ($)GDP growth, 2000–05 and 2006–13 (average annual %)Agriculture value added (% of GDP)Industry value added (% of GDP) Manufacturing value added (% of GDP)Services value added (% of GDP)Inflation (annual % change in CPI)Exchange rate (local currency units per $)Exports of goods and services (% of GDP)Imports of goods and services (% of GDP)
Business environment
Ease of doing business (ranking 1–189; 1=best)Time to start a business (days)Procedures to start a business (number)Time to prepare, file, and pay taxes (hours)Time to export (days)Time to resolve insolvency (years)Profit tax (% of commercial profits)New businesses registered (thousands)New business density (new regis. per 1,000 working-age pop.)Enterprise surveys
Time spent dealing w/req. of gov't. reg. (% of sr. mgt. time) Firms expected to give gifts in meetings with tax officials (%) Firms competing against unregistered firms (%) Firms using banks to finance working capital (% of firms) Delay in obtaining an electrical connection (days) Internationally recognized quality certification (% of firms)
Private sector investment
Invest. in infra. w/privt. part., 2000–05 and 2006–13 ($ millions)Private foreign direct investment, net (% of GDP)Gross fixed capital formation (% of GDP)Gross fixed private capital formation (% of GDP)
Finance and banking
Government debt (% of GDP)Total financial system deposits (% of GDP)Bank capital to asset ratio (%)Bank nonperforming loans to total gross loans (%)Domestic credit to the private sector (% of GDP)Real interest rate (%)Interest rate spread (percentage points)
Infrastructure
Air transport (thousands registered carrier departures worldwide)Port container traffic (thousand TEU)Electric power consumption (kWh per capita)Power outages in firms in a typical month (number)Mobile-cellular telephone subscriptions (per 100 people)Individuals using the Internet (%)
Middle East & North Africa Upper middle income
Algeria
2005 2013 2013
Upper
middle-
income
groupCountry data
34.0 39.2 2,40910.4 12.4 1,26415.3 9.8 5.9
2,660 5,330 7,6045.6 2.7 5.78.0 10.5 7.6
59.7 47.6 36.7.. .. 23.0
32.3 41.9 55.61.4 3.3
73.3 79.447.2 33.1 30.324.1 30.3 30.1
.. 154
24 22 2613 13 7
451 451 32315 17 20
2.5 2.5 2.6.. 6.6 17.5
10.4 13.9
0.5 0.5 3.0
25.1 ..15.0 ..66.8 ..28.6 ..49.1 ..
5.0 ..
4,912 7,583 426,038
1.1 0.8 3.322.4 33.8 31.6
.. .. ..
.. .. ..
37.8 43.3 48.0.. 7.9 10.7.. 10.6 3.6
12.0 16.7 98.0–7.0 5.46.1 6.3 6.0
46 57 7,427
200 343 262,896869 1,091 2,932
3.3 ..40.2 100.8 99.8
5.8 16.5 44.8

21The Little Data Book on Private Sector Development 2015
Economic and social context
Population (millions)Labor force (millions)Unemployment rate (% of labor force)GNI per capita, World Bank Atlas method ($)GDP growth, 2000–05 and 2006–13 (average annual %)Agriculture value added (% of GDP)Industry value added (% of GDP) Manufacturing value added (% of GDP)Services value added (% of GDP)Inflation (annual % change in CPI)Exchange rate (local currency units per $)Exports of goods and services (% of GDP)Imports of goods and services (% of GDP)
Business environment
Ease of doing business (ranking 1–189; 1=best)Time to start a business (days)Procedures to start a business (number)Time to prepare, file, and pay taxes (hours)Time to export (days)Time to resolve insolvency (years)Profit tax (% of commercial profits)New businesses registered (thousands)New business density (new regis. per 1,000 working-age pop.)Enterprise surveys
Time spent dealing w/req. of gov't. reg. (% of sr. mgt. time) Firms expected to give gifts in meetings with tax officials (%) Firms competing against unregistered firms (%) Firms using banks to finance working capital (% of firms) Delay in obtaining an electrical connection (days) Internationally recognized quality certification (% of firms)
Private sector investment
Invest. in infra. w/privt. part., 2000–05 and 2006–13 ($ millions)Private foreign direct investment, net (% of GDP)Gross fixed capital formation (% of GDP)Gross fixed private capital formation (% of GDP)
Finance and banking
Government debt (% of GDP)Total financial system deposits (% of GDP)Bank capital to asset ratio (%)Bank nonperforming loans to total gross loans (%)Domestic credit to the private sector (% of GDP)Real interest rate (%)Interest rate spread (percentage points)
Infrastructure
Air transport (thousands registered carrier departures worldwide)Port container traffic (thousand TEU)Electric power consumption (kWh per capita)Power outages in firms in a typical month (number)Mobile-cellular telephone subscriptions (per 100 people)Individuals using the Internet (%)
East Asia & Pacific Upper middle income
American Samoa
2005 2013 2013
Upper
middle-
income
groupCountry data
0.06 0.06 2,409.. .. 1,264.. .. 5.9.. .. 7,604.. .. 5.7.. .. 7.6.. .. 36.7.. .. 23.0.. .. 55.6.. .... .... .. 30.3.. .. 30.1
.. .... .. 26.. .. 7.. .. 323.. .. 20.. .. 2.6.. .. 17.5.. .... .. 3.0
.. .... .... .... .... .... ..
.. .. 426,038.. .. 3.3.. .. 31.6.. .. ..
.. .. .... .. 48.0.. .. 10.7.. .. 3.6.. .. 98.0.. .... .. 6.0
.. 4 7,427.. .. 262,896.. .. 2,932
.. ..3.8 .. 99.8
.. .. 44.8
22 2015 The Little Data Book on Private Sector Development
Economic and social context
Population (millions)Labor force (millions)Unemployment rate (% of labor force)GNI per capita, World Bank Atlas method ($)GDP growth, 2000–05 and 2006–13 (average annual %)Agriculture value added (% of GDP)Industry value added (% of GDP) Manufacturing value added (% of GDP)Services value added (% of GDP)Inflation (annual % change in CPI)Exchange rate (local currency units per $)Exports of goods and services (% of GDP)Imports of goods and services (% of GDP)
Business environment
Ease of doing business (ranking 1–189; 1=best)Time to start a business (days)Procedures to start a business (number)Time to prepare, file, and pay taxes (hours)Time to export (days)Time to resolve insolvency (years)Profit tax (% of commercial profits)New businesses registered (thousands)New business density (new regis. per 1,000 working-age pop.)Enterprise surveys
Time spent dealing w/req. of gov't. reg. (% of sr. mgt. time) Firms expected to give gifts in meetings with tax officials (%) Firms competing against unregistered firms (%) Firms using banks to finance working capital (% of firms) Delay in obtaining an electrical connection (days) Internationally recognized quality certification (% of firms)
Private sector investment
Invest. in infra. w/privt. part., 2000–05 and 2006–13 ($ millions)Private foreign direct investment, net (% of GDP)Gross fixed capital formation (% of GDP)Gross fixed private capital formation (% of GDP)
Finance and banking
Government debt (% of GDP)Total financial system deposits (% of GDP)Bank capital to asset ratio (%)Bank nonperforming loans to total gross loans (%)Domestic credit to the private sector (% of GDP)Real interest rate (%)Interest rate spread (percentage points)
Infrastructure
Air transport (thousands registered carrier departures worldwide)Port container traffic (thousand TEU)Electric power consumption (kWh per capita)Power outages in firms in a typical month (number)Mobile-cellular telephone subscriptions (per 100 people)Individuals using the Internet (%)
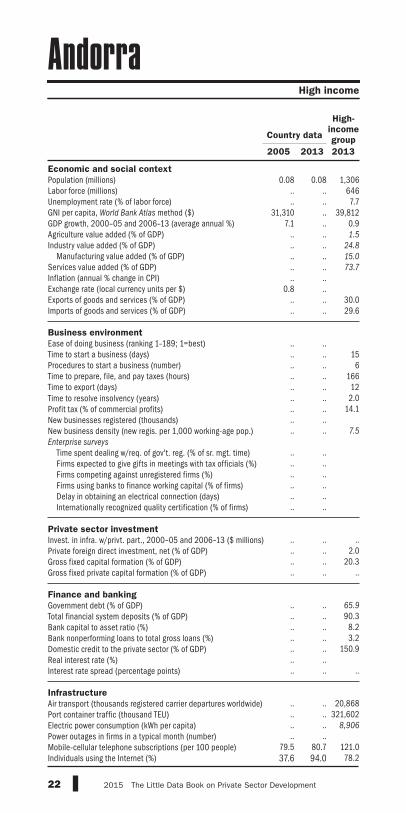
High income
Andorra
2005 2013 2013
High-
income
groupCountry data
0.08 0.08 1,306.. .. 646.. .. 7.7
31,310 .. 39,8127.1 .. 0.9
.. .. 1.5
.. .. 24.8
.. .. 15.0
.. .. 73.7
.. ..0.8 ..
.. .. 30.0
.. .. 29.6
.. .... .. 15.. .. 6.. .. 166.. .. 12.. .. 2.0.. .. 14.1.. .... .. 7.5
.. .... .... .... .... .... ..
.. .. .... .. 2.0.. .. 20.3.. .. .. .. .. 65.9
.. .. 90.3
.. .. 8.2
.. .. 3.2
.. .. 150.9
.. ..
.. .. ..
.. .. 20,868.. .. 321,602.. .. 8,906
.. ..79.5 80.7 121.037.6 94.0 78.2
23The Little Data Book on Private Sector Development 2015
Economic and social context
Population (millions)Labor force (millions)Unemployment rate (% of labor force)GNI per capita, World Bank Atlas method ($)GDP growth, 2000–05 and 2006–13 (average annual %)Agriculture value added (% of GDP)Industry value added (% of GDP) Manufacturing value added (% of GDP)Services value added (% of GDP)Inflation (annual % change in CPI)Exchange rate (local currency units per $)Exports of goods and services (% of GDP)Imports of goods and services (% of GDP)
Business environment
Ease of doing business (ranking 1–189; 1=best)Time to start a business (days)Procedures to start a business (number)Time to prepare, file, and pay taxes (hours)Time to export (days)Time to resolve insolvency (years)Profit tax (% of commercial profits)New businesses registered (thousands)New business density (new regis. per 1,000 working-age pop.)Enterprise surveys
Time spent dealing w/req. of gov't. reg. (% of sr. mgt. time) Firms expected to give gifts in meetings with tax officials (%) Firms competing against unregistered firms (%) Firms using banks to finance working capital (% of firms) Delay in obtaining an electrical connection (days) Internationally recognized quality certification (% of firms)
Private sector investment
Invest. in infra. w/privt. part., 2000–05 and 2006–13 ($ millions)Private foreign direct investment, net (% of GDP)Gross fixed capital formation (% of GDP)Gross fixed private capital formation (% of GDP)
Finance and banking
Government debt (% of GDP)Total financial system deposits (% of GDP)Bank capital to asset ratio (%)Bank nonperforming loans to total gross loans (%)Domestic credit to the private sector (% of GDP)Real interest rate (%)Interest rate spread (percentage points)
Infrastructure
Air transport (thousands registered carrier departures worldwide)Port container traffic (thousand TEU)Electric power consumption (kWh per capita)Power outages in firms in a typical month (number)Mobile-cellular telephone subscriptions (per 100 people)Individuals using the Internet (%)
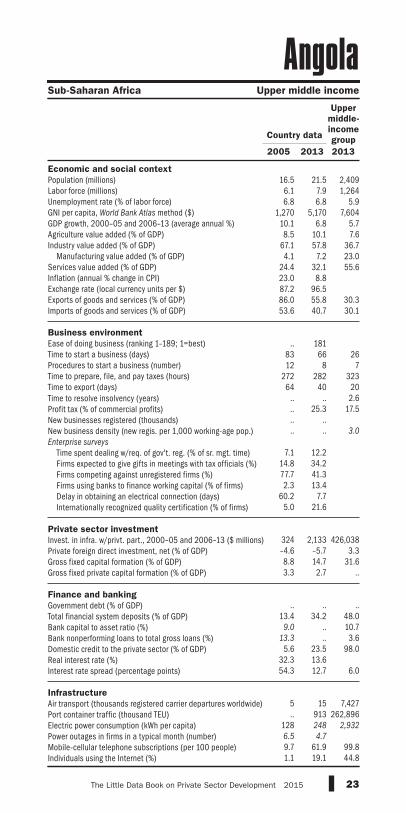
Sub-Saharan Africa Upper middle income
Angola
2005 2013 2013
Upper
middle-
income
groupCountry data
16.5 21.5 2,4096.1 7.9 1,2646.8 6.8 5.9
1,270 5,170 7,60410.1 6.8 5.78.5 10.1 7.6
67.1 57.8 36.74.1 7.2 23.0
24.4 32.1 55.623.0 8.887.2 96.586.0 55.8 30.353.6 40.7 30.1
.. 181
83 66 2612 8 7
272 282 32364 40 20
.. .. 2.6
.. 25.3 17.5
.. ..
.. .. 3.0
7.1 12.2
14.8 34.277.7 41.32.3 13.4
60.2 7.75.0 21.6
324 2,133 426,038–4.6 –5.7 3.38.8 14.7 31.63.3 2.7 ..
.. .. ..
13.4 34.2 48.09.0 .. 10.7
13.3 .. 3.65.6 23.5 98.0
32.3 13.654.3 12.7 6.0
5 15 7,427.. 913 262,896
128 248 2,932
6.5 4.7
9.7 61.9 99.81.1 19.1 44.8
24 2015 The Little Data Book on Private Sector Development
Economic and social context
Population (millions)Labor force (millions)Unemployment rate (% of labor force)GNI per capita, World Bank Atlas method ($)GDP growth, 2000–05 and 2006–13 (average annual %)Agriculture value added (% of GDP)Industry value added (% of GDP) Manufacturing value added (% of GDP)Services value added (% of GDP)Inflation (annual % change in CPI)Exchange rate (local currency units per $)Exports of goods and services (% of GDP)Imports of goods and services (% of GDP)
Business environment
Ease of doing business (ranking 1–189; 1=best)Time to start a business (days)Procedures to start a business (number)Time to prepare, file, and pay taxes (hours)Time to export (days)Time to resolve insolvency (years)Profit tax (% of commercial profits)New businesses registered (thousands)New business density (new regis. per 1,000 working-age pop.)Enterprise surveys
Time spent dealing w/req. of gov't. reg. (% of sr. mgt. time) Firms expected to give gifts in meetings with tax officials (%) Firms competing against unregistered firms (%) Firms using banks to finance working capital (% of firms) Delay in obtaining an electrical connection (days) Internationally recognized quality certification (% of firms)
Private sector investment
Invest. in infra. w/privt. part., 2000–05 and 2006–13 ($ millions)Private foreign direct investment, net (% of GDP)Gross fixed capital formation (% of GDP)Gross fixed private capital formation (% of GDP)
Finance and banking
Government debt (% of GDP)Total financial system deposits (% of GDP)Bank capital to asset ratio (%)Bank nonperforming loans to total gross loans (%)Domestic credit to the private sector (% of GDP)Real interest rate (%)Interest rate spread (percentage points)
Infrastructure
Air transport (thousands registered carrier departures worldwide)Port container traffic (thousand TEU)Electric power consumption (kWh per capita)Power outages in firms in a typical month (number)Mobile-cellular telephone subscriptions (per 100 people)Individuals using the Internet (%)
High income
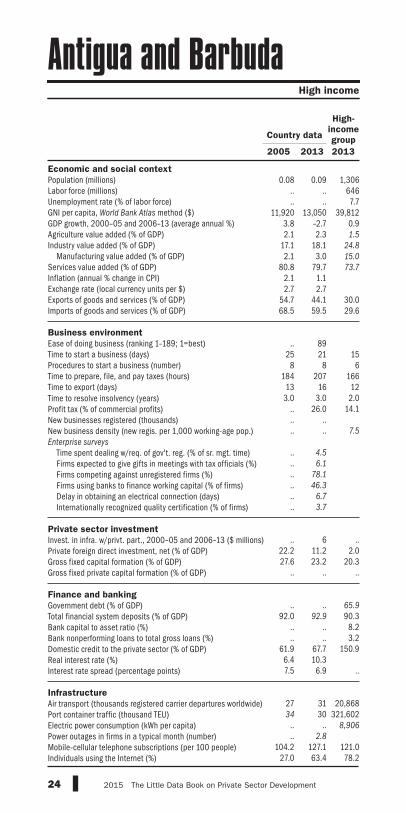
Antigua and Barbuda
2005 2013 2013
High-
income
groupCountry data
0.08 0.09 1,306.. .. 646.. .. 7.7
11,920 13,050 39,8123.8 –2.7 0.92.1 2.3 1.5
17.1 18.1 24.8
2.1 3.0 15.0
80.8 79.7 73.7
2.1 1.12.7 2.7
54.7 44.1 30.068.5 59.5 29.6
.. 89
25 21 158 8 6
184 207 16613 16 12
3.0 3.0 2.0.. 26.0 14.1.. .... .. 7.5
.. 4.5
.. 6.1
.. 78.1
.. 46.3
.. 6.7
.. 3.7
.. 6 ..
22.2 11.2 2.027.6 23.2 20.3
.. .. .. .. .. 65.9
92.0 92.9 90.3.. .. 8.2.. .. 3.2
61.9 67.7 150.96.4 10.37.5 6.9 ..
27 31 20,86834 30 321,602
.. .. 8,906
.. 2.8
104.2 127.1 121.027.0 63.4 78.2

25The Little Data Book on Private Sector Development 2015
Economic and social context
Population (millions)Labor force (millions)Unemployment rate (% of labor force)GNI per capita, World Bank Atlas method ($)GDP growth, 2000–05 and 2006–13 (average annual %)Agriculture value added (% of GDP)Industry value added (% of GDP) Manufacturing value added (% of GDP)Services value added (% of GDP)Inflation (annual % change in CPI)Exchange rate (local currency units per $)Exports of goods and services (% of GDP)Imports of goods and services (% of GDP)
Business environment
Ease of doing business (ranking 1–189; 1=best)Time to start a business (days)Procedures to start a business (number)Time to prepare, file, and pay taxes (hours)Time to export (days)Time to resolve insolvency (years)Profit tax (% of commercial profits)New businesses registered (thousands)New business density (new regis. per 1,000 working-age pop.)Enterprise surveys
Time spent dealing w/req. of gov't. reg. (% of sr. mgt. time) Firms expected to give gifts in meetings with tax officials (%) Firms competing against unregistered firms (%) Firms using banks to finance working capital (% of firms) Delay in obtaining an electrical connection (days) Internationally recognized quality certification (% of firms)
Private sector investment
Invest. in infra. w/privt. part., 2000–05 and 2006–13 ($ millions)Private foreign direct investment, net (% of GDP)Gross fixed capital formation (% of GDP)Gross fixed private capital formation (% of GDP)
Finance and banking
Government debt (% of GDP)Total financial system deposits (% of GDP)Bank capital to asset ratio (%)Bank nonperforming loans to total gross loans (%)Domestic credit to the private sector (% of GDP)Real interest rate (%)Interest rate spread (percentage points)
Infrastructure
Air transport (thousands registered carrier departures worldwide)Port container traffic (thousand TEU)Electric power consumption (kWh per capita)Power outages in firms in a typical month (number)Mobile-cellular telephone subscriptions (per 100 people)Individuals using the Internet (%)
Latin America & Caribbean Upper middle income
Argentina
2005 2013 2013
Upper
middle-
income
groupCountry data
38.6 41.4 2,40917.7 19.1 1,26410.6 7.5 5.9
5,060 .. 7,6042.2 .. 5.78.4 7.0 7.6
34.7 28.5 36.721.9 15.3 23.056.9 64.6 55.6
.. ..2.9 5.5
20.9 14.5 30.315.9 14.8 30.1
.. 124
30 25 2613 14 7
453 405 32316 12 20
2.8 2.8 2.6.. 0.0 17.5
14.2 12.4
0.6 0.5 3.0
14.1 20.8
4.3 8.7
56.1 68.2
28.7 33.3
46.2 54.2
26.9 18.2
10,659 21,003 426,038
2.4 1.9 3.318.3 17.0 31.6
.. .. ..
.. .. ..
19.0 19.5 48.012.1 12.1 10.7
7.6 1.7 3.69.6 15.8 98.0
–4.0 –0.92.4 2.3 6.0
81 96 7,427
1,490 2,143 262,8962,424 2,967 2,932
0.5 1.9
57.3 162.5 99.817.7 59.9 44.8
ab

26 2015 The Little Data Book on Private Sector Development
Economic and social context
Population (millions)Labor force (millions)Unemployment rate (% of labor force)GNI per capita, World Bank Atlas method ($)GDP growth, 2000–05 and 2006–13 (average annual %)Agriculture value added (% of GDP)Industry value added (% of GDP) Manufacturing value added (% of GDP)Services value added (% of GDP)Inflation (annual % change in CPI)Exchange rate (local currency units per $)Exports of goods and services (% of GDP)Imports of goods and services (% of GDP)
Business environment
Ease of doing business (ranking 1–189; 1=best)Time to start a business (days)Procedures to start a business (number)Time to prepare, file, and pay taxes (hours)Time to export (days)Time to resolve insolvency (years)Profit tax (% of commercial profits)New businesses registered (thousands)New business density (new regis. per 1,000 working-age pop.)Enterprise surveys
Time spent dealing w/req. of gov't. reg. (% of sr. mgt. time) Firms expected to give gifts in meetings with tax officials (%) Firms competing against unregistered firms (%) Firms using banks to finance working capital (% of firms) Delay in obtaining an electrical connection (days) Internationally recognized quality certification (% of firms)
Private sector investment
Invest. in infra. w/privt. part., 2000–05 and 2006–13 ($ millions)Private foreign direct investment, net (% of GDP)Gross fixed capital formation (% of GDP)Gross fixed private capital formation (% of GDP)
Finance and banking
Government debt (% of GDP)Total financial system deposits (% of GDP)Bank capital to asset ratio (%)Bank nonperforming loans to total gross loans (%)Domestic credit to the private sector (% of GDP)Real interest rate (%)Interest rate spread (percentage points)
Infrastructure
Air transport (thousands registered carrier departures worldwide)Port container traffic (thousand TEU)Electric power consumption (kWh per capita)Power outages in firms in a typical month (number)Mobile-cellular telephone subscriptions (per 100 people)Individuals using the Internet (%)
Europe & Central Asia Lower middle income
Armenia
2005 2013 2013
Lower
middle-
income
groupCountry data
3.0 3.0 2,5611.4 1.5 1,014
27.8 16.2 5.31,520 3,800 2,07412.3 1.8 5.820.9 21.9 17.045.3 31.5 32.114.8 11.4 17.133.8 46.6 51.1
0.6 5.8457.7 409.628.8 27.0 27.143.2 48.0 31.2
.. 45
18 3 229 2 7
580 321 31537 16 25
1.9 1.9 2.9.. 19.5 15.9
2.3 3.2
1.1 1.5 1.1
3.1 12.2
70.5 4.6.. 12.8
46.3 39.22.5 4.86.3 23.6
454 2,089 402,6686.0 3.5 2.1
29.8 20.9 25.526.8 18.7 18.8
.. .. ..
9.8 27.1 47.1
21.5 15.6 10.31.9 4.5 4.58.0 45.2 41.5
14.3 12.412.2 5.8 7.1
6 1 2,437.. .. 62,268
1,505 1,755 736
.. 0.310.5 112.4 85.25.3 46.3 21.2
27The Little Data Book on Private Sector Development 2015
Economic and social context
Population (millions)Labor force (millions)Unemployment rate (% of labor force)GNI per capita, World Bank Atlas method ($)GDP growth, 2000–05 and 2006–13 (average annual %)Agriculture value added (% of GDP)Industry value added (% of GDP) Manufacturing value added (% of GDP)Services value added (% of GDP)Inflation (annual % change in CPI)Exchange rate (local currency units per $)Exports of goods and services (% of GDP)Imports of goods and services (% of GDP)
Business environment
Ease of doing business (ranking 1–189; 1=best)Time to start a business (days)Procedures to start a business (number)Time to prepare, file, and pay taxes (hours)Time to export (days)Time to resolve insolvency (years)Profit tax (% of commercial profits)New businesses registered (thousands)New business density (new regis. per 1,000 working-age pop.)Enterprise surveys
Time spent dealing w/req. of gov't. reg. (% of sr. mgt. time) Firms expected to give gifts in meetings with tax officials (%) Firms competing against unregistered firms (%) Firms using banks to finance working capital (% of firms) Delay in obtaining an electrical connection (days) Internationally recognized quality certification (% of firms)
Private sector investment
Invest. in infra. w/privt. part., 2000–05 and 2006–13 ($ millions)Private foreign direct investment, net (% of GDP)Gross fixed capital formation (% of GDP)Gross fixed private capital formation (% of GDP)
Finance and banking
Government debt (% of GDP)Total financial system deposits (% of GDP)Bank capital to asset ratio (%)Bank nonperforming loans to total gross loans (%)Domestic credit to the private sector (% of GDP)Real interest rate (%)Interest rate spread (percentage points)
Infrastructure
Air transport (thousands registered carrier departures worldwide)Port container traffic (thousand TEU)Electric power consumption (kWh per capita)Power outages in firms in a typical month (number)Mobile-cellular telephone subscriptions (per 100 people)Individuals using the Internet (%)
High income
Aruba
2005 2013 2013
High-
income
groupCountry data
0.10 0.10 1,306.. .. 646.. .. 7.7.. .. 39,812
2.0 .. 0.90.4 0.5 1.5
20.6 16.3 24.8
4.0 4.7 15.0
78.9 83.2 73.7
3.4 –2.41.8 1.8
68.5 70.8 30.077.9 86.4 29.6
.. .... .. 15.. .. 6.. .. 166.. .. 12.. .. 2.0.. .. 14.1.. .... .. 7.5
.. .... .... .... .... .... ..
.. .. ..
–8.9 18.9 2.035.0 .. 20.3
.. .. .. .. .. 65.9
54.3 64.3 90.3.. .. 8.2.. .. 3.2
54.7 57.4 150.97.0 ..7.6 7.1 ..
.. .. 20,868
135 159 321,602.. .. 8,906
.. ..103.4 134.9 121.0
25.4 78.9 78.2

28 2015 The Little Data Book on Private Sector Development
Economic and social context
Population (millions)Labor force (millions)Unemployment rate (% of labor force)GNI per capita, World Bank Atlas method ($)GDP growth, 2000–05 and 2006–13 (average annual %)Agriculture value added (% of GDP)Industry value added (% of GDP) Manufacturing value added (% of GDP)Services value added (% of GDP)Inflation (annual % change in CPI)Exchange rate (local currency units per $)Exports of goods and services (% of GDP)Imports of goods and services (% of GDP)
Business environment
Ease of doing business (ranking 1–189; 1=best)Time to start a business (days)Procedures to start a business (number)Time to prepare, file, and pay taxes (hours)Time to export (days)Time to resolve insolvency (years)Profit tax (% of commercial profits)New businesses registered (thousands)New business density (new regis. per 1,000 working-age pop.)Enterprise surveys
Time spent dealing w/req. of gov't. reg. (% of sr. mgt. time) Firms expected to give gifts in meetings with tax officials (%) Firms competing against unregistered firms (%) Firms using banks to finance working capital (% of firms) Delay in obtaining an electrical connection (days) Internationally recognized quality certification (% of firms)
Private sector investment
Invest. in infra. w/privt. part., 2000–05 and 2006–13 ($ millions)Private foreign direct investment, net (% of GDP)Gross fixed capital formation (% of GDP)Gross fixed private capital formation (% of GDP)
Finance and banking
Government debt (% of GDP)Total financial system deposits (% of GDP)Bank capital to asset ratio (%)Bank nonperforming loans to total gross loans (%)Domestic credit to the private sector (% of GDP)Real interest rate (%)Interest rate spread (percentage points)
Infrastructure
Air transport (thousands registered carrier departures worldwide)Port container traffic (thousand TEU)Electric power consumption (kWh per capita)Power outages in firms in a typical month (number)Mobile-cellular telephone subscriptions (per 100 people)Individuals using the Internet (%)
High income
Australia
2005 2013 2013
High-
income
groupCountry data
20.4 23.1 1,30610.6 12.2 6465.0 5.7 7.7
30,320 65,400 39,8123.4 2.7 0.93.2 2.4 1.5
26.8 26.8 24.8
11.3 7.1 15.0
70.1 70.7 73.7
2.7 2.41.3 1.0
18.1 19.9 30.020.8 21.1 29.6
.. 103 3 153 3 6
107 105 1669 9 12
1.0 1.0 2.0.. 26.1 14.1
122.0 185.0
8.9 12.2 7.5
.. .... .... .... .... .... ..
.. .. ..
–3.6 3.3 2.027.0 28.3 20.3
.. .. ..
22.5 40.5 65.9
75.4 91.5 90.36.9 5.6 8.20.6 1.4 3.2
108.8 126.1 150.95.2 6.55.2 2.9 ..
343 664 20,868
5,191 7,313 321,60210,458 10,712 8,906
.. ..89.8 106.8 121.063.0 83.0 78.2
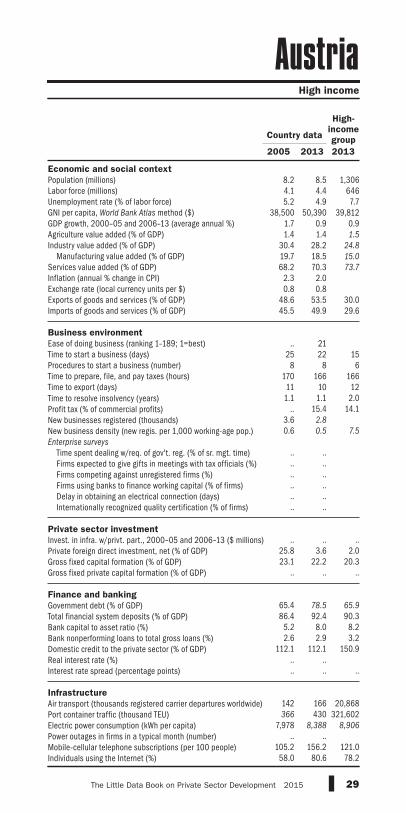
29The Little Data Book on Private Sector Development 2015
Economic and social context
Population (millions)Labor force (millions)Unemployment rate (% of labor force)GNI per capita, World Bank Atlas method ($)GDP growth, 2000–05 and 2006–13 (average annual %)Agriculture value added (% of GDP)Industry value added (% of GDP) Manufacturing value added (% of GDP)Services value added (% of GDP)Inflation (annual % change in CPI)Exchange rate (local currency units per $)Exports of goods and services (% of GDP)Imports of goods and services (% of GDP)
Business environment
Ease of doing business (ranking 1–189; 1=best)Time to start a business (days)Procedures to start a business (number)Time to prepare, file, and pay taxes (hours)Time to export (days)Time to resolve insolvency (years)Profit tax (% of commercial profits)New businesses registered (thousands)New business density (new regis. per 1,000 working-age pop.)Enterprise surveys
Time spent dealing w/req. of gov't. reg. (% of sr. mgt. time) Firms expected to give gifts in meetings with tax officials (%) Firms competing against unregistered firms (%) Firms using banks to finance working capital (% of firms) Delay in obtaining an electrical connection (days) Internationally recognized quality certification (% of firms)
Private sector investment
Invest. in infra. w/privt. part., 2000–05 and 2006–13 ($ millions)Private foreign direct investment, net (% of GDP)Gross fixed capital formation (% of GDP)Gross fixed private capital formation (% of GDP)
Finance and banking
Government debt (% of GDP)Total financial system deposits (% of GDP)Bank capital to asset ratio (%)Bank nonperforming loans to total gross loans (%)Domestic credit to the private sector (% of GDP)Real interest rate (%)Interest rate spread (percentage points)
Infrastructure
Air transport (thousands registered carrier departures worldwide)Port container traffic (thousand TEU)Electric power consumption (kWh per capita)Power outages in firms in a typical month (number)Mobile-cellular telephone subscriptions (per 100 people)Individuals using the Internet (%)
High income
Austria
2005 2013 2013
High-
income
groupCountry data
8.2 8.5 1,3064.1 4.4 6465.2 4.9 7.7
38,500 50,390 39,8121.7 0.9 0.91.4 1.4 1.5
30.4 28.2 24.8
19.7 18.5 15.0
68.2 70.3 73.7
2.3 2.00.8 0.8
48.6 53.5 30.045.5 49.9 29.6
.. 21
25 22 158 8 6
170 166 16611 10 121.1 1.1 2.0
.. 15.4 14.13.6 2.8
0.6 0.5 7.5
.. .... .... .... .... .... ..
.. .. ..
25.8 3.6 2.023.1 22.2 20.3
.. .. ..
65.4 78.5 65.9
86.4 92.4 90.35.2 8.0 8.22.6 2.9 3.2
112.1 112.1 150.9.. .... .. ..
142 166 20,868366 430 321,602
7,978 8,388 8,906
.. ..105.2 156.2 121.058.0 80.6 78.2

30 2015 The Little Data Book on Private Sector Development
Economic and social context
Population (millions)Labor force (millions)Unemployment rate (% of labor force)GNI per capita, World Bank Atlas method ($)GDP growth, 2000–05 and 2006–13 (average annual %)Agriculture value added (% of GDP)Industry value added (% of GDP) Manufacturing value added (% of GDP)Services value added (% of GDP)Inflation (annual % change in CPI)Exchange rate (local currency units per $)Exports of goods and services (% of GDP)Imports of goods and services (% of GDP)
Business environment
Ease of doing business (ranking 1–189; 1=best)Time to start a business (days)Procedures to start a business (number)Time to prepare, file, and pay taxes (hours)Time to export (days)Time to resolve insolvency (years)Profit tax (% of commercial profits)New businesses registered (thousands)New business density (new regis. per 1,000 working-age pop.)Enterprise surveys
Time spent dealing w/req. of gov't. reg. (% of sr. mgt. time) Firms expected to give gifts in meetings with tax officials (%) Firms competing against unregistered firms (%) Firms using banks to finance working capital (% of firms) Delay in obtaining an electrical connection (days) Internationally recognized quality certification (% of firms)
Private sector investment
Invest. in infra. w/privt. part., 2000–05 and 2006–13 ($ millions)Private foreign direct investment, net (% of GDP)Gross fixed capital formation (% of GDP)Gross fixed private capital formation (% of GDP)
Finance and banking
Government debt (% of GDP)Total financial system deposits (% of GDP)Bank capital to asset ratio (%)Bank nonperforming loans to total gross loans (%)Domestic credit to the private sector (% of GDP)Real interest rate (%)Interest rate spread (percentage points)
Infrastructure
Air transport (thousands registered carrier departures worldwide)Port container traffic (thousand TEU)Electric power consumption (kWh per capita)Power outages in firms in a typical month (number)Mobile-cellular telephone subscriptions (per 100 people)Individuals using the Internet (%)
Europe & Central Asia Upper middle income
Azerbaijan
2005 2013 2013
Upper
middle-
income
groupCountry data
8.4 9.4 2,4094.0 4.8 1,2647.3 5.5 5.9
1,270 7,350 7,60412.7 6.8 5.79.9 5.7 7.6
63.6 62.1 36.77.0 4.5 23.0
26.5 32.3 55.69.7 2.40.9 0.8
62.9 48.7 30.352.9 26.9 30.1
.. 80
113 5 2613 3 7
756 195 32334 27 201.5 1.5 2.6
.. 12.9 17.5
.. 4.7
.. 0.7 3.0
5.2 0.2
68.4 11.8.. 18.4
0.4 15.92.0 4.3
10.3 12.8
731 1,602 426,038
33.8 3.6 3.341.3 24.6 31.637.5 .. ..
.. 6.4 ..
10.0 13.9 48.0.. .. 10.7
7.2 4.5 3.69.5 25.5 98.00.8 17.08.5 8.3 6.0
12 16 7,427
.. .. 262,8962,388 1,705 2,932
.. 0.526.2 107.6 99.8
8.0 58.7 44.8
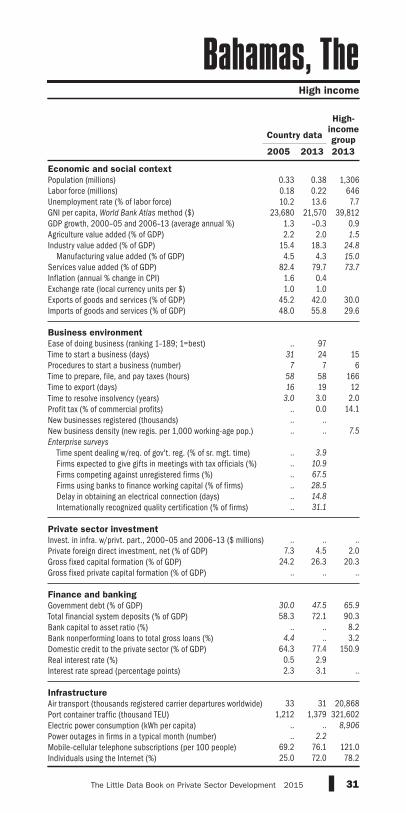
31The Little Data Book on Private Sector Development 2015
Economic and social context
Population (millions)Labor force (millions)Unemployment rate (% of labor force)GNI per capita, World Bank Atlas method ($)GDP growth, 2000–05 and 2006–13 (average annual %)Agriculture value added (% of GDP)Industry value added (% of GDP) Manufacturing value added (% of GDP)Services value added (% of GDP)Inflation (annual % change in CPI)Exchange rate (local currency units per $)Exports of goods and services (% of GDP)Imports of goods and services (% of GDP)
Business environment
Ease of doing business (ranking 1–189; 1=best)Time to start a business (days)Procedures to start a business (number)Time to prepare, file, and pay taxes (hours)Time to export (days)Time to resolve insolvency (years)Profit tax (% of commercial profits)New businesses registered (thousands)New business density (new regis. per 1,000 working-age pop.)Enterprise surveys
Time spent dealing w/req. of gov't. reg. (% of sr. mgt. time) Firms expected to give gifts in meetings with tax officials (%) Firms competing against unregistered firms (%) Firms using banks to finance working capital (% of firms) Delay in obtaining an electrical connection (days) Internationally recognized quality certification (% of firms)
Private sector investment
Invest. in infra. w/privt. part., 2000–05 and 2006–13 ($ millions)Private foreign direct investment, net (% of GDP)Gross fixed capital formation (% of GDP)Gross fixed private capital formation (% of GDP)
Finance and banking
Government debt (% of GDP)Total financial system deposits (% of GDP)Bank capital to asset ratio (%)Bank nonperforming loans to total gross loans (%)Domestic credit to the private sector (% of GDP)Real interest rate (%)Interest rate spread (percentage points)
Infrastructure
Air transport (thousands registered carrier departures worldwide)Port container traffic (thousand TEU)Electric power consumption (kWh per capita)Power outages in firms in a typical month (number)Mobile-cellular telephone subscriptions (per 100 people)Individuals using the Internet (%)
High income
Bahamas, The
2005 2013 2013
High-
income
groupCountry data
0.33 0.38 1,3060.18 0.22 64610.2 13.6 7.7
23,680 21,570 39,8121.3 –0.3 0.92.2 2.0 1.5
15.4 18.3 24.8
4.5 4.3 15.0
82.4 79.7 73.7
1.6 0.41.0 1.0
45.2 42.0 30.048.0 55.8 29.6
.. 97
31 24 157 7 6
58 58 16616 19 12
3.0 3.0 2.0.. 0.0 14.1.. .... .. 7.5
.. 3.9
.. 10.9
.. 67.5
.. 28.5
.. 14.8
.. 31.1
.. .. ..
7.3 4.5 2.024.2 26.3 20.3
.. .. ..
30.0 47.5 65.9
58.3 72.1 90.3.. .. 8.2
4.4 .. 3.264.3 77.4 150.9
0.5 2.92.3 3.1 ..
33 31 20,868
1,212 1,379 321,602.. .. 8,906
.. 2.2
69.2 76.1 121.025.0 72.0 78.2
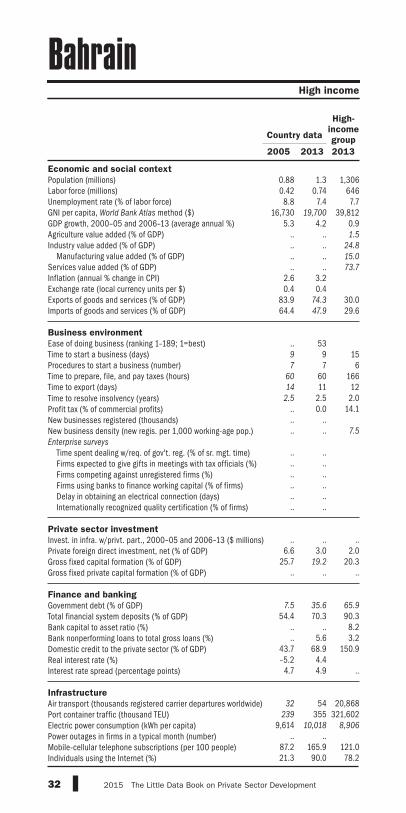
32 2015 The Little Data Book on Private Sector Development
Economic and social context
Population (millions)Labor force (millions)Unemployment rate (% of labor force)GNI per capita, World Bank Atlas method ($)GDP growth, 2000–05 and 2006–13 (average annual %)Agriculture value added (% of GDP)Industry value added (% of GDP) Manufacturing value added (% of GDP)Services value added (% of GDP)Inflation (annual % change in CPI)Exchange rate (local currency units per $)Exports of goods and services (% of GDP)Imports of goods and services (% of GDP)
Business environment
Ease of doing business (ranking 1–189; 1=best)Time to start a business (days)Procedures to start a business (number)Time to prepare, file, and pay taxes (hours)Time to export (days)Time to resolve insolvency (years)Profit tax (% of commercial profits)New businesses registered (thousands)New business density (new regis. per 1,000 working-age pop.)Enterprise surveys
Time spent dealing w/req. of gov't. reg. (% of sr. mgt. time) Firms expected to give gifts in meetings with tax officials (%) Firms competing against unregistered firms (%) Firms using banks to finance working capital (% of firms) Delay in obtaining an electrical connection (days) Internationally recognized quality certification (% of firms)
Private sector investment
Invest. in infra. w/privt. part., 2000–05 and 2006–13 ($ millions)Private foreign direct investment, net (% of GDP)Gross fixed capital formation (% of GDP)Gross fixed private capital formation (% of GDP)
Finance and banking
Government debt (% of GDP)Total financial system deposits (% of GDP)Bank capital to asset ratio (%)Bank nonperforming loans to total gross loans (%)Domestic credit to the private sector (% of GDP)Real interest rate (%)Interest rate spread (percentage points)
Infrastructure
Air transport (thousands registered carrier departures worldwide)Port container traffic (thousand TEU)Electric power consumption (kWh per capita)Power outages in firms in a typical month (number)Mobile-cellular telephone subscriptions (per 100 people)Individuals using the Internet (%)
High income
Bahrain
2005 2013 2013
High-
income
groupCountry data
0.88 1.3 1,3060.42 0.74 6468.8 7.4 7.7
16,730 19,700 39,8125.3 4.2 0.9
.. .. 1.5
.. .. 24.8
.. .. 15.0
.. .. 73.7
2.6 3.20.4 0.4
83.9 74.3 30.064.4 47.9 29.6
.. 539 9 157 7 6
60 60 16614 11 12
2.5 2.5 2.0.. 0.0 14.1.. .... .. 7.5
.. .... .... .... .... .... ..
.. .. ..
6.6 3.0 2.025.7 19.2 20.3
.. .. ..
7.5 35.6 65.9
54.4 70.3 90.3.. .. 8.2.. 5.6 3.2
43.7 68.9 150.9–5.2 4.44.7 4.9 ..
32 54 20,868
239 355 321,6029,614 10,018 8,906
.. ..87.2 165.9 121.021.3 90.0 78.2
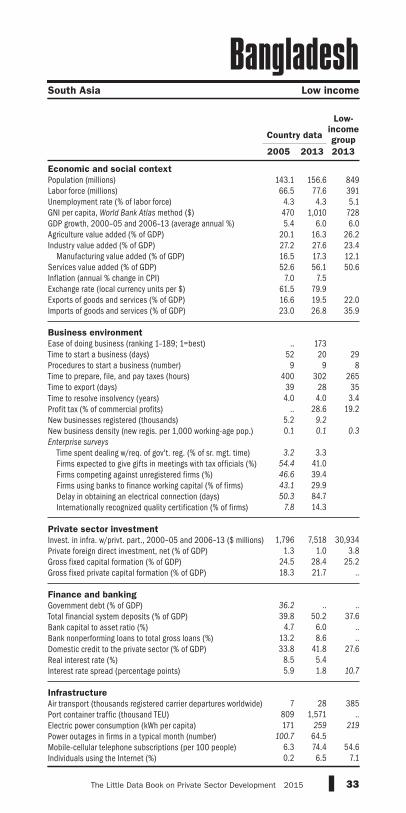
33The Little Data Book on Private Sector Development 2015
Economic and social context
Population (millions)Labor force (millions)Unemployment rate (% of labor force)GNI per capita, World Bank Atlas method ($)GDP growth, 2000–05 and 2006–13 (average annual %)Agriculture value added (% of GDP)Industry value added (% of GDP) Manufacturing value added (% of GDP)Services value added (% of GDP)Inflation (annual % change in CPI)Exchange rate (local currency units per $)Exports of goods and services (% of GDP)Imports of goods and services (% of GDP)
Business environment
Ease of doing business (ranking 1–189; 1=best)Time to start a business (days)Procedures to start a business (number)Time to prepare, file, and pay taxes (hours)Time to export (days)Time to resolve insolvency (years)Profit tax (% of commercial profits)New businesses registered (thousands)New business density (new regis. per 1,000 working-age pop.)Enterprise surveys
Time spent dealing w/req. of gov't. reg. (% of sr. mgt. time) Firms expected to give gifts in meetings with tax officials (%) Firms competing against unregistered firms (%) Firms using banks to finance working capital (% of firms) Delay in obtaining an electrical connection (days) Internationally recognized quality certification (% of firms)
Private sector investment
Invest. in infra. w/privt. part., 2000–05 and 2006–13 ($ millions)Private foreign direct investment, net (% of GDP)Gross fixed capital formation (% of GDP)Gross fixed private capital formation (% of GDP)
Finance and banking
Government debt (% of GDP)Total financial system deposits (% of GDP)Bank capital to asset ratio (%)Bank nonperforming loans to total gross loans (%)Domestic credit to the private sector (% of GDP)Real interest rate (%)Interest rate spread (percentage points)
Infrastructure
Air transport (thousands registered carrier departures worldwide)Port container traffic (thousand TEU)Electric power consumption (kWh per capita)Power outages in firms in a typical month (number)Mobile-cellular telephone subscriptions (per 100 people)Individuals using the Internet (%)
South Asia Low income
Bangladesh
2005 2013 2013
Low-
income
groupCountry data
143.1 156.6 84966.5 77.6 391
4.3 4.3 5.1470 1,010 7285.4 6.0 6.0
20.1 16.3 26.227.2 27.6 23.416.5 17.3 12.152.6 56.1 50.6
7.0 7.561.5 79.916.6 19.5 22.023.0 26.8 35.9
.. 173
52 20 299 9 8
400 302 26539 28 354.0 4.0 3.4
.. 28.6 19.25.2 9.2
0.1 0.1 0.3
3.2 3.3
54.4 41.046.6 39.443.1 29.950.3 84.7
7.8 14.3
1,796 7,518 30,934
1.3 1.0 3.824.5 28.4 25.218.3 21.7 ..
36.2 .. ..39.8 50.2 37.6
4.7 6.0 ..13.2 8.6 ..33.8 41.8 27.6
8.5 5.45.9 1.8 10.7
7 28 385
809 1,571 ..171 259 219
100.7 64.56.3 74.4 54.60.2 6.5 7.1

34 2015 The Little Data Book on Private Sector Development
Economic and social context
Population (millions)Labor force (millions)Unemployment rate (% of labor force)GNI per capita, World Bank Atlas method ($)GDP growth, 2000–05 and 2006–13 (average annual %)Agriculture value added (% of GDP)Industry value added (% of GDP) Manufacturing value added (% of GDP)Services value added (% of GDP)Inflation (annual % change in CPI)Exchange rate (local currency units per $)Exports of goods and services (% of GDP)Imports of goods and services (% of GDP)
Business environment
Ease of doing business (ranking 1–189; 1=best)Time to start a business (days)Procedures to start a business (number)Time to prepare, file, and pay taxes (hours)Time to export (days)Time to resolve insolvency (years)Profit tax (% of commercial profits)New businesses registered (thousands)New business density (new regis. per 1,000 working-age pop.)Enterprise surveys
Time spent dealing w/req. of gov't. reg. (% of sr. mgt. time) Firms expected to give gifts in meetings with tax officials (%) Firms competing against unregistered firms (%) Firms using banks to finance working capital (% of firms) Delay in obtaining an electrical connection (days) Internationally recognized quality certification (% of firms)
Private sector investment
Invest. in infra. w/privt. part., 2000–05 and 2006–13 ($ millions)Private foreign direct investment, net (% of GDP)Gross fixed capital formation (% of GDP)Gross fixed private capital formation (% of GDP)
Finance and banking
Government debt (% of GDP)Total financial system deposits (% of GDP)Bank capital to asset ratio (%)Bank nonperforming loans to total gross loans (%)Domestic credit to the private sector (% of GDP)Real interest rate (%)Interest rate spread (percentage points)
Infrastructure
Air transport (thousands registered carrier departures worldwide)Port container traffic (thousand TEU)Electric power consumption (kWh per capita)Power outages in firms in a typical month (number)Mobile-cellular telephone subscriptions (per 100 people)Individuals using the Internet (%)
High income
Barbados
2005 2013 2013
High-
income
groupCountry data
0.27 0.28 1,3060.15 0.16 646
9.1 12.2 7.713,640 15,080 39,812
1.2 –0.5 0.91.8 1.5 1.5
17.1 15.7 24.8
8.0 6.9 15.0
81.0 82.9 73.7
6.1 1.82.0 2.0
44.0 42.5 30.051.8 54.3 29.6
.. 106.. 18 15.. 8 6.. 237 166.. 9 12.. 1.8 2.0.. 19.5 14.1.. .... .. 7.5
.. 4.3
.. 1.6
.. 49.4
.. 38.7
.. 24.7
.. 18.3
.. .. ..
6.1 12.2 2.018.6 .. 20.3
.. .. ..
69.2 96.8 65.9
102.7 .. 90.3.. .. 8.2.. .. 3.2
71.4 .. 150.92.4 12.4
6.0 6.2 ..
.. .. 20,868
100 68 321,602.. .. 8,906
.. 1.1
75.4 108.1 121.052.5 75.0 78.2
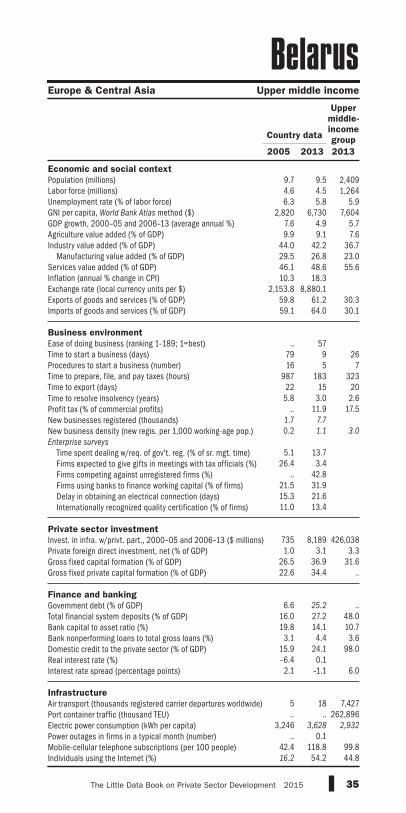
35The Little Data Book on Private Sector Development 2015
Economic and social context
Population (millions)Labor force (millions)Unemployment rate (% of labor force)GNI per capita, World Bank Atlas method ($)GDP growth, 2000–05 and 2006–13 (average annual %)Agriculture value added (% of GDP)Industry value added (% of GDP) Manufacturing value added (% of GDP)Services value added (% of GDP)Inflation (annual % change in CPI)Exchange rate (local currency units per $)Exports of goods and services (% of GDP)Imports of goods and services (% of GDP)
Business environment
Ease of doing business (ranking 1–189; 1=best)Time to start a business (days)Procedures to start a business (number)Time to prepare, file, and pay taxes (hours)Time to export (days)Time to resolve insolvency (years)Profit tax (% of commercial profits)New businesses registered (thousands)New business density (new regis. per 1,000 working-age pop.)Enterprise surveys
Time spent dealing w/req. of gov't. reg. (% of sr. mgt. time) Firms expected to give gifts in meetings with tax officials (%) Firms competing against unregistered firms (%) Firms using banks to finance working capital (% of firms) Delay in obtaining an electrical connection (days) Internationally recognized quality certification (% of firms)
Private sector investment
Invest. in infra. w/privt. part., 2000–05 and 2006–13 ($ millions)Private foreign direct investment, net (% of GDP)Gross fixed capital formation (% of GDP)Gross fixed private capital formation (% of GDP)
Finance and banking
Government debt (% of GDP)Total financial system deposits (% of GDP)Bank capital to asset ratio (%)Bank nonperforming loans to total gross loans (%)Domestic credit to the private sector (% of GDP)Real interest rate (%)Interest rate spread (percentage points)
Infrastructure
Air transport (thousands registered carrier departures worldwide)Port container traffic (thousand TEU)Electric power consumption (kWh per capita)Power outages in firms in a typical month (number)Mobile-cellular telephone subscriptions (per 100 people)Individuals using the Internet (%)
Europe & Central Asia Upper middle income
Belarus
2005 2013 2013
Upper
middle-
income
groupCountry data
9.7 9.5 2,4094.6 4.5 1,2646.3 5.8 5.9
2,820 6,730 7,6047.6 4.9 5.79.9 9.1 7.6
44.0 42.2 36.729.5 26.8 23.046.1 48.6 55.610.3 18.3
2,153.8 8,880.159.8 61.2 30.359.1 64.0 30.1
.. 57
79 9 2616 5 7
987 183 32322 15 20
5.8 3.0 2.6.. 11.9 17.5
1.7 7.7
0.2 1.1 3.0
5.1 13.7
26.4 3.4.. 42.8
21.5 31.915.3 21.611.0 13.4
735 8,189 426,0381.0 3.1 3.3
26.5 36.9 31.622.6 34.4 ..
6.6 25.2 ..
16.0 27.2 48.019.8 14.1 10.7
3.1 4.4 3.615.9 24.1 98.0–6.4 0.12.1 –1.1 6.0
5 18 7,427.. .. 262,896
3,246 3,628 2,932
.. 0.142.4 118.8 99.816.2 54.2 44.8
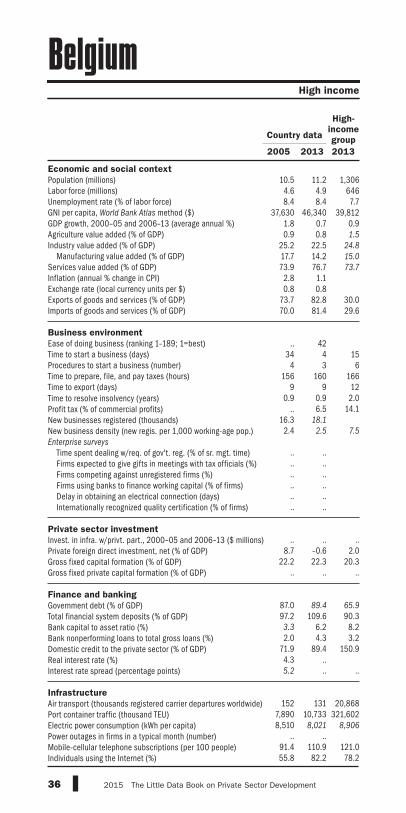
36 2015 The Little Data Book on Private Sector Development
Economic and social context
Population (millions)Labor force (millions)Unemployment rate (% of labor force)GNI per capita, World Bank Atlas method ($)GDP growth, 2000–05 and 2006–13 (average annual %)Agriculture value added (% of GDP)Industry value added (% of GDP) Manufacturing value added (% of GDP)Services value added (% of GDP)Inflation (annual % change in CPI)Exchange rate (local currency units per $)Exports of goods and services (% of GDP)Imports of goods and services (% of GDP)
Business environment
Ease of doing business (ranking 1–189; 1=best)Time to start a business (days)Procedures to start a business (number)Time to prepare, file, and pay taxes (hours)Time to export (days)Time to resolve insolvency (years)Profit tax (% of commercial profits)New businesses registered (thousands)New business density (new regis. per 1,000 working-age pop.)Enterprise surveys
Time spent dealing w/req. of gov't. reg. (% of sr. mgt. time) Firms expected to give gifts in meetings with tax officials (%) Firms competing against unregistered firms (%) Firms using banks to finance working capital (% of firms) Delay in obtaining an electrical connection (days) Internationally recognized quality certification (% of firms)
Private sector investment
Invest. in infra. w/privt. part., 2000–05 and 2006–13 ($ millions)Private foreign direct investment, net (% of GDP)Gross fixed capital formation (% of GDP)Gross fixed private capital formation (% of GDP)
Finance and banking
Government debt (% of GDP)Total financial system deposits (% of GDP)Bank capital to asset ratio (%)Bank nonperforming loans to total gross loans (%)Domestic credit to the private sector (% of GDP)Real interest rate (%)Interest rate spread (percentage points)
Infrastructure
Air transport (thousands registered carrier departures worldwide)Port container traffic (thousand TEU)Electric power consumption (kWh per capita)Power outages in firms in a typical month (number)Mobile-cellular telephone subscriptions (per 100 people)Individuals using the Internet (%)
High income
Belgium
2005 2013 2013
High-
income
groupCountry data
10.5 11.2 1,3064.6 4.9 6468.4 8.4 7.7
37,630 46,340 39,8121.8 0.7 0.90.9 0.8 1.5
25.2 22.5 24.8
17.7 14.2 15.0
73.9 76.7 73.7
2.8 1.10.8 0.8
73.7 82.8 30.070.0 81.4 29.6
.. 42
34 4 154 3 6
156 160 1669 9 12
0.9 0.9 2.0.. 6.5 14.1
16.3 18.1
2.4 2.5 7.5
.. .... .... .... .... .... ..
.. .. ..
8.7 –0.6 2.022.2 22.3 20.3
.. .. ..
87.0 89.4 65.9
97.2 109.6 90.33.3 6.2 8.22.0 4.3 3.2
71.9 89.4 150.94.3 ..5.2 .. ..
152 131 20,868
7,890 10,733 321,6028,510 8,021 8,906
.. ..91.4 110.9 121.055.8 82.2 78.2
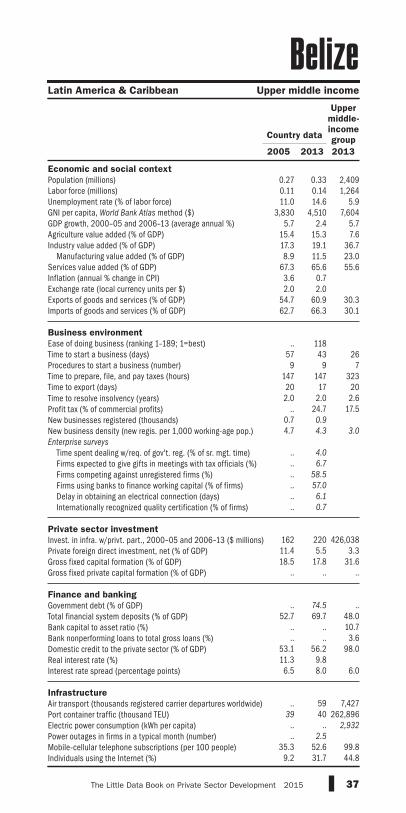
37The Little Data Book on Private Sector Development 2015
Economic and social context
Population (millions)Labor force (millions)Unemployment rate (% of labor force)GNI per capita, World Bank Atlas method ($)GDP growth, 2000–05 and 2006–13 (average annual %)Agriculture value added (% of GDP)Industry value added (% of GDP) Manufacturing value added (% of GDP)Services value added (% of GDP)Inflation (annual % change in CPI)Exchange rate (local currency units per $)Exports of goods and services (% of GDP)Imports of goods and services (% of GDP)
Business environment
Ease of doing business (ranking 1–189; 1=best)Time to start a business (days)Procedures to start a business (number)Time to prepare, file, and pay taxes (hours)Time to export (days)Time to resolve insolvency (years)Profit tax (% of commercial profits)New businesses registered (thousands)New business density (new regis. per 1,000 working-age pop.)Enterprise surveys
Time spent dealing w/req. of gov't. reg. (% of sr. mgt. time) Firms expected to give gifts in meetings with tax officials (%) Firms competing against unregistered firms (%) Firms using banks to finance working capital (% of firms) Delay in obtaining an electrical connection (days) Internationally recognized quality certification (% of firms)
Private sector investment
Invest. in infra. w/privt. part., 2000–05 and 2006–13 ($ millions)Private foreign direct investment, net (% of GDP)Gross fixed capital formation (% of GDP)Gross fixed private capital formation (% of GDP)
Finance and banking
Government debt (% of GDP)Total financial system deposits (% of GDP)Bank capital to asset ratio (%)Bank nonperforming loans to total gross loans (%)Domestic credit to the private sector (% of GDP)Real interest rate (%)Interest rate spread (percentage points)
Infrastructure
Air transport (thousands registered carrier departures worldwide)Port container traffic (thousand TEU)Electric power consumption (kWh per capita)Power outages in firms in a typical month (number)Mobile-cellular telephone subscriptions (per 100 people)Individuals using the Internet (%)
Latin America & Caribbean Upper middle income
Belize
2005 2013 2013
Upper
middle-
income
groupCountry data
0.27 0.33 2,4090.11 0.14 1,26411.0 14.6 5.9
3,830 4,510 7,6045.7 2.4 5.7
15.4 15.3 7.617.3 19.1 36.78.9 11.5 23.0
67.3 65.6 55.63.6 0.72.0 2.0
54.7 60.9 30.362.7 66.3 30.1
.. 118
57 43 269 9 7
147 147 32320 17 202.0 2.0 2.6
.. 24.7 17.50.7 0.9
4.7 4.3 3.0
.. 4.0
.. 6.7
.. 58.5
.. 57.0
.. 6.1
.. 0.7
162 220 426,03811.4 5.5 3.318.5 17.8 31.6
.. .. ..
.. 74.5 ..
52.7 69.7 48.0.. .. 10.7.. .. 3.6
53.1 56.2 98.011.3 9.86.5 8.0 6.0
.. 59 7,427
39 40 262,896.. .. 2,932
.. 2.5
35.3 52.6 99.89.2 31.7 44.8

38 2015 The Little Data Book on Private Sector Development
Economic and social context
Population (millions)Labor force (millions)Unemployment rate (% of labor force)GNI per capita, World Bank Atlas method ($)GDP growth, 2000–05 and 2006–13 (average annual %)Agriculture value added (% of GDP)Industry value added (% of GDP) Manufacturing value added (% of GDP)Services value added (% of GDP)Inflation (annual % change in CPI)Exchange rate (local currency units per $)Exports of goods and services (% of GDP)Imports of goods and services (% of GDP)
Business environment
Ease of doing business (ranking 1–189; 1=best)Time to start a business (days)Procedures to start a business (number)Time to prepare, file, and pay taxes (hours)Time to export (days)Time to resolve insolvency (years)Profit tax (% of commercial profits)New businesses registered (thousands)New business density (new regis. per 1,000 working-age pop.)Enterprise surveys
Time spent dealing w/req. of gov't. reg. (% of sr. mgt. time) Firms expected to give gifts in meetings with tax officials (%) Firms competing against unregistered firms (%) Firms using banks to finance working capital (% of firms) Delay in obtaining an electrical connection (days) Internationally recognized quality certification (% of firms)
Private sector investment
Invest. in infra. w/privt. part., 2000–05 and 2006–13 ($ millions)Private foreign direct investment, net (% of GDP)Gross fixed capital formation (% of GDP)Gross fixed private capital formation (% of GDP)
Finance and banking
Government debt (% of GDP)Total financial system deposits (% of GDP)Bank capital to asset ratio (%)Bank nonperforming loans to total gross loans (%)Domestic credit to the private sector (% of GDP)Real interest rate (%)Interest rate spread (percentage points)
Infrastructure
Air transport (thousands registered carrier departures worldwide)Port container traffic (thousand TEU)Electric power consumption (kWh per capita)Power outages in firms in a typical month (number)Mobile-cellular telephone subscriptions (per 100 people)Individuals using the Internet (%)
Sub-Saharan Africa Low income
Benin
2005 2013 2013
Low-
income
groupCountry data
8.2 10.3 8493.3 4.3 3911.3 1.0 5.1
530 790 7284.0 3.9 6.0
35.9 36.5 26.214.8 14.0 23.4
8.7 8.2 12.149.3 49.5 50.6
5.4 1.0527.5 494.021.6 18.3 22.028.5 33.5 35.9
.. 151
34 12 2910 7 8
270 270 26534 25 354.0 4.0 3.4
.. 15.9 19.2
.. ..
.. .. 0.3
.. .... .... .... .... .... ..
707 1,556 30,934–0.2 3.9 3.819.4 26.3 25.211.4 17.6 ..
.. .. ..
17.9 29.3 37.6.. .. .... .. ..
16.3 24.9 27.6.. .... .. 10.7
.. 2 385.. 388 ..
73 .. 219
.. ..7.3 93.3 54.61.3 4.9 7.1

39The Little Data Book on Private Sector Development 2015
Economic and social context
Population (millions)Labor force (millions)Unemployment rate (% of labor force)GNI per capita, World Bank Atlas method ($)GDP growth, 2000–05 and 2006–13 (average annual %)Agriculture value added (% of GDP)Industry value added (% of GDP) Manufacturing value added (% of GDP)Services value added (% of GDP)Inflation (annual % change in CPI)Exchange rate (local currency units per $)Exports of goods and services (% of GDP)Imports of goods and services (% of GDP)
Business environment
Ease of doing business (ranking 1–189; 1=best)Time to start a business (days)Procedures to start a business (number)Time to prepare, file, and pay taxes (hours)Time to export (days)Time to resolve insolvency (years)Profit tax (% of commercial profits)New businesses registered (thousands)New business density (new regis. per 1,000 working-age pop.)Enterprise surveys
Time spent dealing w/req. of gov't. reg. (% of sr. mgt. time) Firms expected to give gifts in meetings with tax officials (%) Firms competing against unregistered firms (%) Firms using banks to finance working capital (% of firms) Delay in obtaining an electrical connection (days) Internationally recognized quality certification (% of firms)
Private sector investment
Invest. in infra. w/privt. part., 2000–05 and 2006–13 ($ millions)Private foreign direct investment, net (% of GDP)Gross fixed capital formation (% of GDP)Gross fixed private capital formation (% of GDP)
Finance and banking
Government debt (% of GDP)Total financial system deposits (% of GDP)Bank capital to asset ratio (%)Bank nonperforming loans to total gross loans (%)Domestic credit to the private sector (% of GDP)Real interest rate (%)Interest rate spread (percentage points)
Infrastructure
Air transport (thousands registered carrier departures worldwide)Port container traffic (thousand TEU)Electric power consumption (kWh per capita)Power outages in firms in a typical month (number)Mobile-cellular telephone subscriptions (per 100 people)Individuals using the Internet (%)
High income
Bermuda
2005 2013 2013
High-
income
groupCountry data
0.06 0.07 1,306.. .. 646.. .. 7.7
117,640 104,610 39,8122.3 –2.2 0.90.8 0.8 1.5
10.4 6.0 24.8
1.7 1.0 15.0
88.7 93.2 73.7
.. ..1.0 1.0
.. .. 30.0
.. .. 29.6
.. .... .. 15.. .. 6.. .. 166.. .. 12.. .. 2.0.. .. 14.1.. .... .. 7.5
.. .... .... .... .... .... ..
.. .. ..
0.9 0.9 2.0.. .. 20.3.. .. .. .. .. 65.9
.. .. 90.3
.. .. 8.2
.. .. 3.2
.. .. 150.9
.. ..
.. .. ..
.. .. 20,868.. .. 321,602.. .. 8,906
.. ..82.2 144.3 121.065.4 95.3 78.2

40 2015 The Little Data Book on Private Sector Development
Economic and social context
Population (millions)Labor force (millions)Unemployment rate (% of labor force)GNI per capita, World Bank Atlas method ($)GDP growth, 2000–05 and 2006–13 (average annual %)Agriculture value added (% of GDP)Industry value added (% of GDP) Manufacturing value added (% of GDP)Services value added (% of GDP)Inflation (annual % change in CPI)Exchange rate (local currency units per $)Exports of goods and services (% of GDP)Imports of goods and services (% of GDP)
Business environment
Ease of doing business (ranking 1–189; 1=best)Time to start a business (days)Procedures to start a business (number)Time to prepare, file, and pay taxes (hours)Time to export (days)Time to resolve insolvency (years)Profit tax (% of commercial profits)New businesses registered (thousands)New business density (new regis. per 1,000 working-age pop.)Enterprise surveys
Time spent dealing w/req. of gov't. reg. (% of sr. mgt. time) Firms expected to give gifts in meetings with tax officials (%) Firms competing against unregistered firms (%) Firms using banks to finance working capital (% of firms) Delay in obtaining an electrical connection (days) Internationally recognized quality certification (% of firms)
Private sector investment
Invest. in infra. w/privt. part., 2000–05 and 2006–13 ($ millions)Private foreign direct investment, net (% of GDP)Gross fixed capital formation (% of GDP)Gross fixed private capital formation (% of GDP)
Finance and banking
Government debt (% of GDP)Total financial system deposits (% of GDP)Bank capital to asset ratio (%)Bank nonperforming loans to total gross loans (%)Domestic credit to the private sector (% of GDP)Real interest rate (%)Interest rate spread (percentage points)
Infrastructure
Air transport (thousands registered carrier departures worldwide)Port container traffic (thousand TEU)Electric power consumption (kWh per capita)Power outages in firms in a typical month (number)Mobile-cellular telephone subscriptions (per 100 people)Individuals using the Internet (%)
South Asia Lower middle income
Bhutan
2005 2013 2013
Lower
middle-
income
groupCountry data
0.65 0.75 2,5610.31 0.39 1,014
3.1 2.1 5.31,230 2,330 2,074
7.9 7.8 5.823.2 17.1 17.037.3 44.6 32.1
7.4 9.0 17.139.5 38.3 51.15.3 7.0
44.1 58.638.2 40.8 27.162.9 62.9 31.2
.. 125
62 17 2210 8 7
274 274 31538 38 25
.. .. 2.9
.. 37.2 15.90.0 0.1
0.0 0.2 1.1
.. .... .... .... .... .... ..
.. 219 402,668
0.8 2.8 2.149.9 47.3 25.539.8 34.4 18.8
79.5 .. ..44.8 54.3 47.1
.. 17.0 10.3
.. 7.0 4.518.1 46.1 41.5
7.7 8.69.5 8.0 7.1
2 4 2,437.. .. 62,268.. .. 736
.. ..5.5 72.2 85.23.8 29.9 21.2

41The Little Data Book on Private Sector Development 2015
Economic and social context
Population (millions)Labor force (millions)Unemployment rate (% of labor force)GNI per capita, World Bank Atlas method ($)GDP growth, 2000–05 and 2006–13 (average annual %)Agriculture value added (% of GDP)Industry value added (% of GDP) Manufacturing value added (% of GDP)Services value added (% of GDP)Inflation (annual % change in CPI)Exchange rate (local currency units per $)Exports of goods and services (% of GDP)Imports of goods and services (% of GDP)
Business environment
Ease of doing business (ranking 1–189; 1=best)Time to start a business (days)Procedures to start a business (number)Time to prepare, file, and pay taxes (hours)Time to export (days)Time to resolve insolvency (years)Profit tax (% of commercial profits)New businesses registered (thousands)New business density (new regis. per 1,000 working-age pop.)Enterprise surveys
Time spent dealing w/req. of gov't. reg. (% of sr. mgt. time) Firms expected to give gifts in meetings with tax officials (%) Firms competing against unregistered firms (%) Firms using banks to finance working capital (% of firms) Delay in obtaining an electrical connection (days) Internationally recognized quality certification (% of firms)
Private sector investment
Invest. in infra. w/privt. part., 2000–05 and 2006–13 ($ millions)Private foreign direct investment, net (% of GDP)Gross fixed capital formation (% of GDP)Gross fixed private capital formation (% of GDP)
Finance and banking
Government debt (% of GDP)Total financial system deposits (% of GDP)Bank capital to asset ratio (%)Bank nonperforming loans to total gross loans (%)Domestic credit to the private sector (% of GDP)Real interest rate (%)Interest rate spread (percentage points)
Infrastructure
Air transport (thousands registered carrier departures worldwide)Port container traffic (thousand TEU)Electric power consumption (kWh per capita)Power outages in firms in a typical month (number)Mobile-cellular telephone subscriptions (per 100 people)Individuals using the Internet (%)
Latin America & Caribbean Lower middle income
Bolivia
2005 2013 2013
Lower
middle-
income
groupCountry data
9.4 10.7 2,5614.1 5.0 1,0145.4 2.6 5.3
1,000 2,550 2,0743.1 4.9 5.8
14.4 13.3 17.032.0 38.1 32.114.2 13.3 17.153.6 48.6 51.1
5.4 5.78.1 6.9
35.5 44.2 27.132.1 37.2 31.2
.. 157
50 49 2215 15 7
1,080 1,025 31524 22 25
1.8 1.8 2.9.. 0.0 15.9
1.6 3.5
0.3 0.6 1.1
13.5 28.519.6 3.490.1 80.539.4 40.515.2 21.213.8 22.4
1,422 563 402,668
–2.5 5.7 2.113.0 19.1 25.5
6.1 7.8 18.8
.. .. ..
37.4 49.7 47.1
11.3 8.2 10.311.3 1.5 4.545.0 47.0 41.510.1 4.811.7 9.3 7.1
26 38 2,437
.. .. 62,268467 623 736
0.4 1.225.9 97.7 85.25.2 39.5 21.2
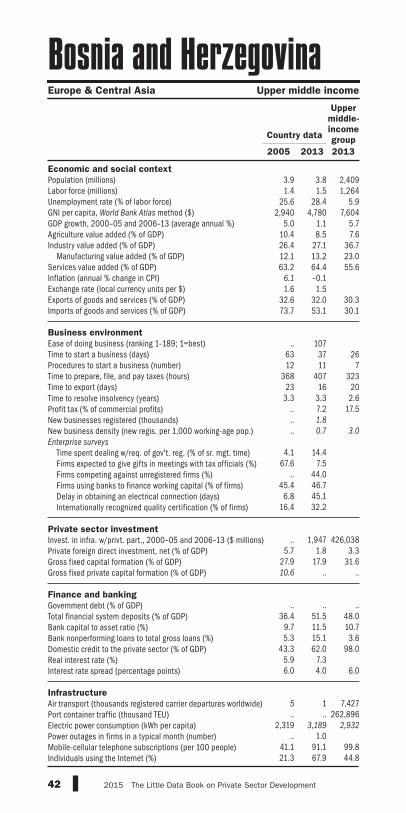
42 2015 The Little Data Book on Private Sector Development
Economic and social context
Population (millions)Labor force (millions)Unemployment rate (% of labor force)GNI per capita, World Bank Atlas method ($)GDP growth, 2000–05 and 2006–13 (average annual %)Agriculture value added (% of GDP)Industry value added (% of GDP) Manufacturing value added (% of GDP)Services value added (% of GDP)Inflation (annual % change in CPI)Exchange rate (local currency units per $)Exports of goods and services (% of GDP)Imports of goods and services (% of GDP)
Business environment
Ease of doing business (ranking 1–189; 1=best)Time to start a business (days)Procedures to start a business (number)Time to prepare, file, and pay taxes (hours)Time to export (days)Time to resolve insolvency (years)Profit tax (% of commercial profits)New businesses registered (thousands)New business density (new regis. per 1,000 working-age pop.)Enterprise surveys
Time spent dealing w/req. of gov't. reg. (% of sr. mgt. time) Firms expected to give gifts in meetings with tax officials (%) Firms competing against unregistered firms (%) Firms using banks to finance working capital (% of firms) Delay in obtaining an electrical connection (days) Internationally recognized quality certification (% of firms)
Private sector investment
Invest. in infra. w/privt. part., 2000–05 and 2006–13 ($ millions)Private foreign direct investment, net (% of GDP)Gross fixed capital formation (% of GDP)Gross fixed private capital formation (% of GDP)
Finance and banking
Government debt (% of GDP)Total financial system deposits (% of GDP)Bank capital to asset ratio (%)Bank nonperforming loans to total gross loans (%)Domestic credit to the private sector (% of GDP)Real interest rate (%)Interest rate spread (percentage points)
Infrastructure
Air transport (thousands registered carrier departures worldwide)Port container traffic (thousand TEU)Electric power consumption (kWh per capita)Power outages in firms in a typical month (number)Mobile-cellular telephone subscriptions (per 100 people)Individuals using the Internet (%)
Europe & Central Asia Upper middle income
Bosnia and Herzegovina
2005 2013 2013
Upper
middle-
income
groupCountry data
3.9 3.8 2,4091.4 1.5 1,264
25.6 28.4 5.92,940 4,780 7,604
5.0 1.1 5.710.4 8.5 7.626.4 27.1 36.712.1 13.2 23.063.2 64.4 55.6
6.1 –0.11.6 1.5
32.6 32.0 30.373.7 53.1 30.1
.. 107
63 37 2612 11 7
368 407 32323 16 20
3.3 3.3 2.6.. 7.2 17.5.. 1.8
.. 0.7 3.0
4.1 14.4
67.6 7.5.. 44.0
45.4 46.76.8 45.1
16.4 32.2
.. 1,947 426,038
5.7 1.8 3.327.9 17.9 31.610.6 .. ..
.. .. ..
36.4 51.5 48.09.7 11.5 10.75.3 15.1 3.6
43.3 62.0 98.05.9 7.36.0 4.0 6.0
5 1 7,427.. .. 262,896
2,319 3,189 2,932
.. 1.041.1 91.1 99.821.3 67.9 44.8

43The Little Data Book on Private Sector Development 2015
Economic and social context
Population (millions)Labor force (millions)Unemployment rate (% of labor force)GNI per capita, World Bank Atlas method ($)GDP growth, 2000–05 and 2006–13 (average annual %)Agriculture value added (% of GDP)Industry value added (% of GDP) Manufacturing value added (% of GDP)Services value added (% of GDP)Inflation (annual % change in CPI)Exchange rate (local currency units per $)Exports of goods and services (% of GDP)Imports of goods and services (% of GDP)
Business environment
Ease of doing business (ranking 1–189; 1=best)Time to start a business (days)Procedures to start a business (number)Time to prepare, file, and pay taxes (hours)Time to export (days)Time to resolve insolvency (years)Profit tax (% of commercial profits)New businesses registered (thousands)New business density (new regis. per 1,000 working-age pop.)Enterprise surveys
Time spent dealing w/req. of gov't. reg. (% of sr. mgt. time) Firms expected to give gifts in meetings with tax officials (%) Firms competing against unregistered firms (%) Firms using banks to finance working capital (% of firms) Delay in obtaining an electrical connection (days) Internationally recognized quality certification (% of firms)
Private sector investment
Invest. in infra. w/privt. part., 2000–05 and 2006–13 ($ millions)Private foreign direct investment, net (% of GDP)Gross fixed capital formation (% of GDP)Gross fixed private capital formation (% of GDP)
Finance and banking
Government debt (% of GDP)Total financial system deposits (% of GDP)Bank capital to asset ratio (%)Bank nonperforming loans to total gross loans (%)Domestic credit to the private sector (% of GDP)Real interest rate (%)Interest rate spread (percentage points)
Infrastructure
Air transport (thousands registered carrier departures worldwide)Port container traffic (thousand TEU)Electric power consumption (kWh per capita)Power outages in firms in a typical month (number)Mobile-cellular telephone subscriptions (per 100 people)Individuals using the Internet (%)
Sub-Saharan Africa Upper middle income
Botswana
2005 2013 2013
Upper
middle-
income
groupCountry data
1.9 2.0 2,4090.91 1.0 1,26422.0 18.4 5.9
4,730 7,770 7,6043.9 3.6 5.72.0 2.5 7.6
47.6 36.9 36.75.5 5.7 23.0
50.3 60.5 55.68.6 5.95.1 8.4
52.9 55.1 30.335.6 59.9 30.1
.. 74
125 60 2611 10 7
140 152 32333 27 202.2 1.7 2.6
.. 21.7 17.56.6 15.4
5.7 12.3 3.0
5.0 10.2
4.5 8.4
49.7 54.6
15.9 32.1
25.5 39.2
12.7 21.3
104 429 426,0382.8 1.3 3.3
25.3 33.9 31.617.9 25.3 ..
.. 19.0 ..
27.4 39.1 48.09.8 .. 10.72.8 .. 3.6
19.8 32.0 98.00.2 4.06.5 7.1 6.0
8 9 7,427.. .. 262,896
1,421 1,603 2,932
0.7 4.1
30.1 160.6 99.83.3 15.0 44.8

44 2015 The Little Data Book on Private Sector Development
Economic and social context
Population (millions)Labor force (millions)Unemployment rate (% of labor force)GNI per capita, World Bank Atlas method ($)GDP growth, 2000–05 and 2006–13 (average annual %)Agriculture value added (% of GDP)Industry value added (% of GDP) Manufacturing value added (% of GDP)Services value added (% of GDP)Inflation (annual % change in CPI)Exchange rate (local currency units per $)Exports of goods and services (% of GDP)Imports of goods and services (% of GDP)
Business environment
Ease of doing business (ranking 1–189; 1=best)Time to start a business (days)Procedures to start a business (number)Time to prepare, file, and pay taxes (hours)Time to export (days)Time to resolve insolvency (years)Profit tax (% of commercial profits)New businesses registered (thousands)New business density (new regis. per 1,000 working-age pop.)Enterprise surveys
Time spent dealing w/req. of gov't. reg. (% of sr. mgt. time) Firms expected to give gifts in meetings with tax officials (%) Firms competing against unregistered firms (%) Firms using banks to finance working capital (% of firms) Delay in obtaining an electrical connection (days) Internationally recognized quality certification (% of firms)
Private sector investment
Invest. in infra. w/privt. part., 2000–05 and 2006–13 ($ millions)Private foreign direct investment, net (% of GDP)Gross fixed capital formation (% of GDP)Gross fixed private capital formation (% of GDP)
Finance and banking
Government debt (% of GDP)Total financial system deposits (% of GDP)Bank capital to asset ratio (%)Bank nonperforming loans to total gross loans (%)Domestic credit to the private sector (% of GDP)Real interest rate (%)Interest rate spread (percentage points)
Infrastructure
Air transport (thousands registered carrier departures worldwide)Port container traffic (thousand TEU)Electric power consumption (kWh per capita)Power outages in firms in a typical month (number)Mobile-cellular telephone subscriptions (per 100 people)Individuals using the Internet (%)
Latin America & Caribbean Upper middle income
Brazil
2005 2013 2013
Upper
middle-
income
groupCountry data
186.1 200.4 2,40994.6 106.2 1,264
9.3 5.9 5.93,960 11,690 7,604
2.8 3.4 5.75.7 5.7 7.6
29.3 25.0 36.718.1 13.1 23.065.0 69.3 55.6
6.9 6.22.4 2.2
15.1 12.6 30.311.5 15.0 30.1
.. 120
156 84 2617 12 7
2,600 2,600 32318 13 20
10.0 4.0 2.6.. 24.7 17.5
246.7 53.9
2.0 2.2 3.0
.. .... .... .... .... .... ..
72,401 268,637 426,038
1.8 3.6 3.315.9 18.2 31.614.3 15.8 ..
.. .. ..
44.2 57.7 48.010.2 9.3 10.7
3.5 2.9 3.631.4 70.7 98.044.9 18.437.8 19.6 6.0
515 959 7,427
5,652 10,177 262,8962,016 2,438 2,932
.. ..46.3 135.3 99.821.0 51.6 44.8

45The Little Data Book on Private Sector Development 2015
Economic and social context
Population (millions)Labor force (millions)Unemployment rate (% of labor force)GNI per capita, World Bank Atlas method ($)GDP growth, 2000–05 and 2006–13 (average annual %)Agriculture value added (% of GDP)Industry value added (% of GDP) Manufacturing value added (% of GDP)Services value added (% of GDP)Inflation (annual % change in CPI)Exchange rate (local currency units per $)Exports of goods and services (% of GDP)Imports of goods and services (% of GDP)
Business environment
Ease of doing business (ranking 1–189; 1=best)Time to start a business (days)Procedures to start a business (number)Time to prepare, file, and pay taxes (hours)Time to export (days)Time to resolve insolvency (years)Profit tax (% of commercial profits)New businesses registered (thousands)New business density (new regis. per 1,000 working-age pop.)Enterprise surveys
Time spent dealing w/req. of gov't. reg. (% of sr. mgt. time) Firms expected to give gifts in meetings with tax officials (%) Firms competing against unregistered firms (%) Firms using banks to finance working capital (% of firms) Delay in obtaining an electrical connection (days) Internationally recognized quality certification (% of firms)
Private sector investment
Invest. in infra. w/privt. part., 2000–05 and 2006–13 ($ millions)Private foreign direct investment, net (% of GDP)Gross fixed capital formation (% of GDP)Gross fixed private capital formation (% of GDP)
Finance and banking
Government debt (% of GDP)Total financial system deposits (% of GDP)Bank capital to asset ratio (%)Bank nonperforming loans to total gross loans (%)Domestic credit to the private sector (% of GDP)Real interest rate (%)Interest rate spread (percentage points)
Infrastructure
Air transport (thousands registered carrier departures worldwide)Port container traffic (thousand TEU)Electric power consumption (kWh per capita)Power outages in firms in a typical month (number)Mobile-cellular telephone subscriptions (per 100 people)Individuals using the Internet (%)
High income
Brunei Darussalam
2005 2013 2013
High-
income
groupCountry data
0.37 0.42 1,3060.17 0.20 6463.2 3.8 7.7
22,920 31,590 39,8122.2 0.5 0.90.9 0.7 1.5
71.6 68.2 24.8
12.3 12.3 15.0
27.5 31.0 73.7
1.2 0.41.7 1.3
70.2 76.2 30.027.3 32.5 29.6
.. 101
116 101 1518 15 6
144 93 16627 19 12
2.5 2.5 2.0.. 7.9 14.1.. .... .. 7.5
.. .... .... .... .... .... ..
.. .. ..
1.8 5.6 2.011.4 15.3 20.3
.. .. .. .. .. 65.9
53.9 61.5 90.3.. 9.3 8.2.. 5.4 3.2
40.3 35.0 150.9–11.2 8.9
4.5 5.2 ..
12 12 20,868
.. 122 321,6028,401 8,507 8,906
.. ..63.3 112.2 121.036.5 64.5 78.2
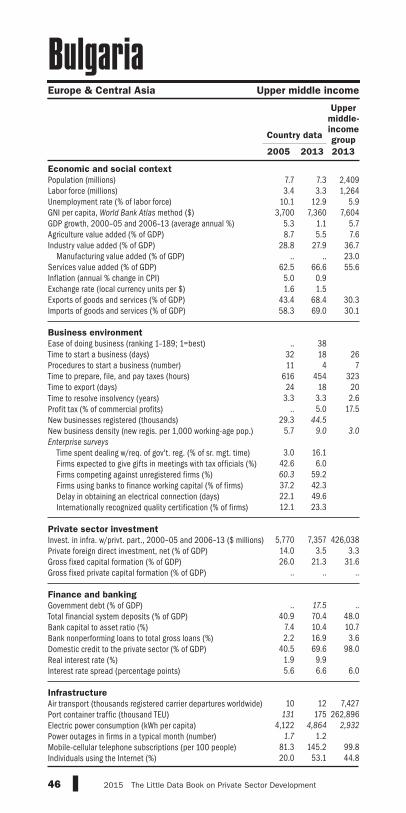
46 2015 The Little Data Book on Private Sector Development
Economic and social context
Population (millions)Labor force (millions)Unemployment rate (% of labor force)GNI per capita, World Bank Atlas method ($)GDP growth, 2000–05 and 2006–13 (average annual %)Agriculture value added (% of GDP)Industry value added (% of GDP) Manufacturing value added (% of GDP)Services value added (% of GDP)Inflation (annual % change in CPI)Exchange rate (local currency units per $)Exports of goods and services (% of GDP)Imports of goods and services (% of GDP)
Business environment
Ease of doing business (ranking 1–189; 1=best)Time to start a business (days)Procedures to start a business (number)Time to prepare, file, and pay taxes (hours)Time to export (days)Time to resolve insolvency (years)Profit tax (% of commercial profits)New businesses registered (thousands)New business density (new regis. per 1,000 working-age pop.)Enterprise surveys
Time spent dealing w/req. of gov't. reg. (% of sr. mgt. time) Firms expected to give gifts in meetings with tax officials (%) Firms competing against unregistered firms (%) Firms using banks to finance working capital (% of firms) Delay in obtaining an electrical connection (days) Internationally recognized quality certification (% of firms)
Private sector investment
Invest. in infra. w/privt. part., 2000–05 and 2006–13 ($ millions)Private foreign direct investment, net (% of GDP)Gross fixed capital formation (% of GDP)Gross fixed private capital formation (% of GDP)
Finance and banking
Government debt (% of GDP)Total financial system deposits (% of GDP)Bank capital to asset ratio (%)Bank nonperforming loans to total gross loans (%)Domestic credit to the private sector (% of GDP)Real interest rate (%)Interest rate spread (percentage points)
Infrastructure
Air transport (thousands registered carrier departures worldwide)Port container traffic (thousand TEU)Electric power consumption (kWh per capita)Power outages in firms in a typical month (number)Mobile-cellular telephone subscriptions (per 100 people)Individuals using the Internet (%)
Europe & Central Asia Upper middle income
Bulgaria
2005 2013 2013
Upper
middle-
income
groupCountry data
7.7 7.3 2,4093.4 3.3 1,264
10.1 12.9 5.93,700 7,360 7,604
5.3 1.1 5.78.7 5.5 7.6
28.8 27.9 36.7.. .. 23.0
62.5 66.6 55.65.0 0.91.6 1.5
43.4 68.4 30.358.3 69.0 30.1
.. 38
32 18 2611 4 7
616 454 32324 18 20
3.3 3.3 2.6.. 5.0 17.5
29.3 44.5
5.7 9.0 3.0
3.0 16.1
42.6 6.060.3 59.237.2 42.322.1 49.612.1 23.3
5,770 7,357 426,038
14.0 3.5 3.326.0 21.3 31.6
.. .. ..
.. 17.5 ..
40.9 70.4 48.07.4 10.4 10.72.2 16.9 3.6
40.5 69.6 98.01.9 9.95.6 6.6 6.0
10 12 7,427
131 175 262,8964,122 4,864 2,932
1.7 1.281.3 145.2 99.820.0 53.1 44.8
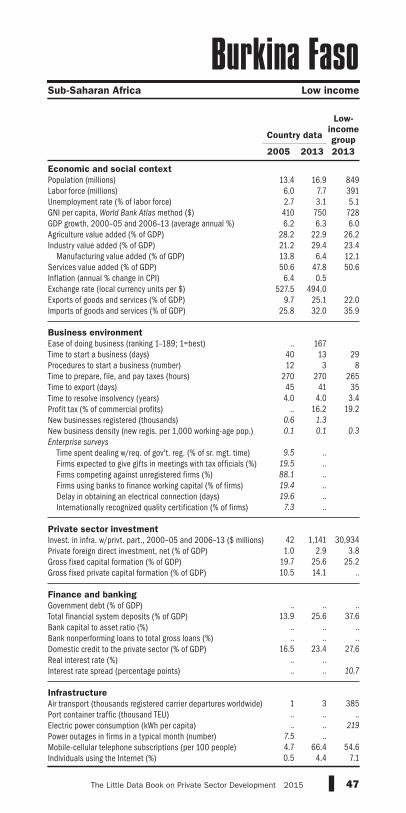
47The Little Data Book on Private Sector Development 2015
Economic and social context
Population (millions)Labor force (millions)Unemployment rate (% of labor force)GNI per capita, World Bank Atlas method ($)GDP growth, 2000–05 and 2006–13 (average annual %)Agriculture value added (% of GDP)Industry value added (% of GDP) Manufacturing value added (% of GDP)Services value added (% of GDP)Inflation (annual % change in CPI)Exchange rate (local currency units per $)Exports of goods and services (% of GDP)Imports of goods and services (% of GDP)
Business environment
Ease of doing business (ranking 1–189; 1=best)Time to start a business (days)Procedures to start a business (number)Time to prepare, file, and pay taxes (hours)Time to export (days)Time to resolve insolvency (years)Profit tax (% of commercial profits)New businesses registered (thousands)New business density (new regis. per 1,000 working-age pop.)Enterprise surveys
Time spent dealing w/req. of gov't. reg. (% of sr. mgt. time) Firms expected to give gifts in meetings with tax officials (%) Firms competing against unregistered firms (%) Firms using banks to finance working capital (% of firms) Delay in obtaining an electrical connection (days) Internationally recognized quality certification (% of firms)
Private sector investment
Invest. in infra. w/privt. part., 2000–05 and 2006–13 ($ millions)Private foreign direct investment, net (% of GDP)Gross fixed capital formation (% of GDP)Gross fixed private capital formation (% of GDP)
Finance and banking
Government debt (% of GDP)Total financial system deposits (% of GDP)Bank capital to asset ratio (%)Bank nonperforming loans to total gross loans (%)Domestic credit to the private sector (% of GDP)Real interest rate (%)Interest rate spread (percentage points)
Infrastructure
Air transport (thousands registered carrier departures worldwide)Port container traffic (thousand TEU)Electric power consumption (kWh per capita)Power outages in firms in a typical month (number)Mobile-cellular telephone subscriptions (per 100 people)Individuals using the Internet (%)
Sub-Saharan Africa Low income
Burkina Faso
2005 2013 2013
Low-
income
groupCountry data
13.4 16.9 8496.0 7.7 3912.7 3.1 5.1410 750 7286.2 6.3 6.0
28.2 22.9 26.221.2 29.4 23.413.8 6.4 12.150.6 47.8 50.6
6.4 0.5527.5 494.0
9.7 25.1 22.025.8 32.0 35.9
.. 167
40 13 2912 3 8
270 270 26545 41 354.0 4.0 3.4
.. 16.2 19.20.6 1.3
0.1 0.1 0.3
9.5 ..
19.5 ..88.1 ..19.4 ..19.6 ..
7.3 ..
42 1,141 30,9341.0 2.9 3.8
19.7 25.6 25.210.5 14.1 ..
.. .. ..
13.9 25.6 37.6.. .. .... .. ..
16.5 23.4 27.6.. .... .. 10.7
1 3 385.. .. .... .. 219
7.5 ..4.7 66.4 54.60.5 4.4 7.1
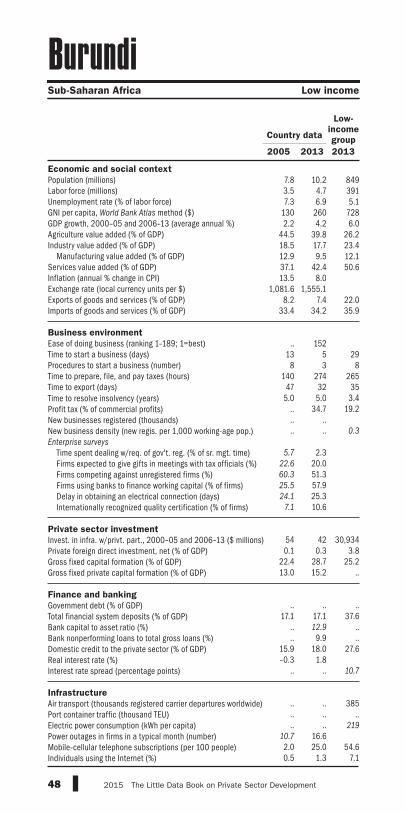
48 2015 The Little Data Book on Private Sector Development
Economic and social context
Population (millions)Labor force (millions)Unemployment rate (% of labor force)GNI per capita, World Bank Atlas method ($)GDP growth, 2000–05 and 2006–13 (average annual %)Agriculture value added (% of GDP)Industry value added (% of GDP) Manufacturing value added (% of GDP)Services value added (% of GDP)Inflation (annual % change in CPI)Exchange rate (local currency units per $)Exports of goods and services (% of GDP)Imports of goods and services (% of GDP)
Business environment
Ease of doing business (ranking 1–189; 1=best)Time to start a business (days)Procedures to start a business (number)Time to prepare, file, and pay taxes (hours)Time to export (days)Time to resolve insolvency (years)Profit tax (% of commercial profits)New businesses registered (thousands)New business density (new regis. per 1,000 working-age pop.)Enterprise surveys
Time spent dealing w/req. of gov't. reg. (% of sr. mgt. time) Firms expected to give gifts in meetings with tax officials (%) Firms competing against unregistered firms (%) Firms using banks to finance working capital (% of firms) Delay in obtaining an electrical connection (days) Internationally recognized quality certification (% of firms)
Private sector investment
Invest. in infra. w/privt. part., 2000–05 and 2006–13 ($ millions)Private foreign direct investment, net (% of GDP)Gross fixed capital formation (% of GDP)Gross fixed private capital formation (% of GDP)
Finance and banking
Government debt (% of GDP)Total financial system deposits (% of GDP)Bank capital to asset ratio (%)Bank nonperforming loans to total gross loans (%)Domestic credit to the private sector (% of GDP)Real interest rate (%)Interest rate spread (percentage points)
Infrastructure
Air transport (thousands registered carrier departures worldwide)Port container traffic (thousand TEU)Electric power consumption (kWh per capita)Power outages in firms in a typical month (number)Mobile-cellular telephone subscriptions (per 100 people)Individuals using the Internet (%)
Sub-Saharan Africa Low income
Burundi
2005 2013 2013
Low-
income
groupCountry data
7.8 10.2 8493.5 4.7 3917.3 6.9 5.1
130 260 7282.2 4.2 6.0
44.5 39.8 26.218.5 17.7 23.412.9 9.5 12.137.1 42.4 50.613.5 8.0
1,081.6 1,555.18.2 7.4 22.0
33.4 34.2 35.9
.. 152
13 5 298 3 8
140 274 26547 32 35
5.0 5.0 3.4.. 34.7 19.2.. .... .. 0.3
5.7 2.3
22.6 20.060.3 51.325.5 57.924.1 25.3
7.1 10.6
54 42 30,9340.1 0.3 3.8
22.4 28.7 25.213.0 15.2 ..
.. .. ..
17.1 17.1 37.6.. 12.9 .... 9.9 ..
15.9 18.0 27.6–0.3 1.8
.. .. 10.7
.. .. 385.. .. .... .. 219
10.7 16.62.0 25.0 54.60.5 1.3 7.1

49The Little Data Book on Private Sector Development 2015
Economic and social context
Population (millions)Labor force (millions)Unemployment rate (% of labor force)GNI per capita, World Bank Atlas method ($)GDP growth, 2000–05 and 2006–13 (average annual %)Agriculture value added (% of GDP)Industry value added (% of GDP) Manufacturing value added (% of GDP)Services value added (% of GDP)Inflation (annual % change in CPI)Exchange rate (local currency units per $)Exports of goods and services (% of GDP)Imports of goods and services (% of GDP)
Business environment
Ease of doing business (ranking 1–189; 1=best)Time to start a business (days)Procedures to start a business (number)Time to prepare, file, and pay taxes (hours)Time to export (days)Time to resolve insolvency (years)Profit tax (% of commercial profits)New businesses registered (thousands)New business density (new regis. per 1,000 working-age pop.)Enterprise surveys
Time spent dealing w/req. of gov't. reg. (% of sr. mgt. time) Firms expected to give gifts in meetings with tax officials (%) Firms competing against unregistered firms (%) Firms using banks to finance working capital (% of firms) Delay in obtaining an electrical connection (days) Internationally recognized quality certification (% of firms)
Private sector investment
Invest. in infra. w/privt. part., 2000–05 and 2006–13 ($ millions)Private foreign direct investment, net (% of GDP)Gross fixed capital formation (% of GDP)Gross fixed private capital formation (% of GDP)
Finance and banking
Government debt (% of GDP)Total financial system deposits (% of GDP)Bank capital to asset ratio (%)Bank nonperforming loans to total gross loans (%)Domestic credit to the private sector (% of GDP)Real interest rate (%)Interest rate spread (percentage points)
Infrastructure
Air transport (thousands registered carrier departures worldwide)Port container traffic (thousand TEU)Electric power consumption (kWh per capita)Power outages in firms in a typical month (number)Mobile-cellular telephone subscriptions (per 100 people)Individuals using the Internet (%)
Sub-Saharan Africa Lower middle income
Cabo Verde
2005 2013 2013
Lower
middle-
income
groupCountry data
0.48 0.50 2,5610.20 0.24 1,014
7.2 7.0 5.32,090 3,620 2,074
5.9 3.1 5.89.0 8.1 17.0
19.2 17.0 32.16.5 .. 17.1
71.8 100.0 51.10.4 1.5
88.7 83.037.8 34.9 27.166.6 52.3 31.2
.. 122
60 10 2212 7 7
186 186 31522 20 25
.. .. 2.9
.. 18.2 15.9
.. ..
.. .. 1.1
12.2 ..10.4 ..60.4 ..19.4 ..
7.8 ..12.2 ..
.. 168 402,668
8.3 2.2 2.144.2 35.9 25.536.0 33.7 18.8
.. .. ..
75.1 76.6 47.1
.. .. 10.3
.. .. 4.539.1 63.2 41.514.3 7.38.9 6.3 7.1
20 8 2,437
.. .. 62,268
.. .. 736
11.3 ..17.1 100.1 85.26.1 37.5 21.2
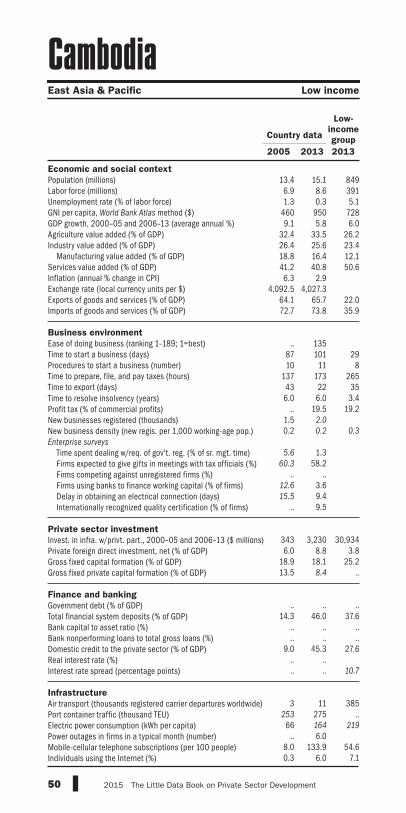
50 2015 The Little Data Book on Private Sector Development
Economic and social context
Population (millions)Labor force (millions)Unemployment rate (% of labor force)GNI per capita, World Bank Atlas method ($)GDP growth, 2000–05 and 2006–13 (average annual %)Agriculture value added (% of GDP)Industry value added (% of GDP) Manufacturing value added (% of GDP)Services value added (% of GDP)Inflation (annual % change in CPI)Exchange rate (local currency units per $)Exports of goods and services (% of GDP)Imports of goods and services (% of GDP)
Business environment
Ease of doing business (ranking 1–189; 1=best)Time to start a business (days)Procedures to start a business (number)Time to prepare, file, and pay taxes (hours)Time to export (days)Time to resolve insolvency (years)Profit tax (% of commercial profits)New businesses registered (thousands)New business density (new regis. per 1,000 working-age pop.)Enterprise surveys
Time spent dealing w/req. of gov't. reg. (% of sr. mgt. time) Firms expected to give gifts in meetings with tax officials (%) Firms competing against unregistered firms (%) Firms using banks to finance working capital (% of firms) Delay in obtaining an electrical connection (days) Internationally recognized quality certification (% of firms)
Private sector investment
Invest. in infra. w/privt. part., 2000–05 and 2006–13 ($ millions)Private foreign direct investment, net (% of GDP)Gross fixed capital formation (% of GDP)Gross fixed private capital formation (% of GDP)
Finance and banking
Government debt (% of GDP)Total financial system deposits (% of GDP)Bank capital to asset ratio (%)Bank nonperforming loans to total gross loans (%)Domestic credit to the private sector (% of GDP)Real interest rate (%)Interest rate spread (percentage points)
Infrastructure
Air transport (thousands registered carrier departures worldwide)Port container traffic (thousand TEU)Electric power consumption (kWh per capita)Power outages in firms in a typical month (number)Mobile-cellular telephone subscriptions (per 100 people)Individuals using the Internet (%)
East Asia & Pacific Low income
Cambodia
2005 2013 2013
Low-
income
groupCountry data
13.4 15.1 8496.9 8.6 3911.3 0.3 5.1
460 950 7289.1 5.8 6.0
32.4 33.5 26.226.4 25.6 23.418.8 16.4 12.141.2 40.8 50.66.3 2.9
4,092.5 4,027.364.1 65.7 22.072.7 73.8 35.9
.. 135
87 101 2910 11 8
137 173 26543 22 356.0 6.0 3.4
.. 19.5 19.21.5 2.0
0.2 0.2 0.3
5.6 1.3
60.3 58.2.. ..
12.6 3.615.5 9.4
.. 9.5
343 3,230 30,9346.0 8.8 3.8
18.9 18.1 25.213.5 8.4 ..
.. .. ..
14.3 46.0 37.6.. .. .... .. ..
9.0 45.3 27.6.. .... .. 10.7
3 11 385
253 275 ..66 164 219
.. 6.08.0 133.9 54.60.3 6.0 7.1

51The Little Data Book on Private Sector Development 2015
Economic and social context
Population (millions)Labor force (millions)Unemployment rate (% of labor force)GNI per capita, World Bank Atlas method ($)GDP growth, 2000–05 and 2006–13 (average annual %)Agriculture value added (% of GDP)Industry value added (% of GDP) Manufacturing value added (% of GDP)Services value added (% of GDP)Inflation (annual % change in CPI)Exchange rate (local currency units per $)Exports of goods and services (% of GDP)Imports of goods and services (% of GDP)
Business environment
Ease of doing business (ranking 1–189; 1=best)Time to start a business (days)Procedures to start a business (number)Time to prepare, file, and pay taxes (hours)Time to export (days)Time to resolve insolvency (years)Profit tax (% of commercial profits)New businesses registered (thousands)New business density (new regis. per 1,000 working-age pop.)Enterprise surveys
Time spent dealing w/req. of gov't. reg. (% of sr. mgt. time) Firms expected to give gifts in meetings with tax officials (%) Firms competing against unregistered firms (%) Firms using banks to finance working capital (% of firms) Delay in obtaining an electrical connection (days) Internationally recognized quality certification (% of firms)
Private sector investment
Invest. in infra. w/privt. part., 2000–05 and 2006–13 ($ millions)Private foreign direct investment, net (% of GDP)Gross fixed capital formation (% of GDP)Gross fixed private capital formation (% of GDP)
Finance and banking
Government debt (% of GDP)Total financial system deposits (% of GDP)Bank capital to asset ratio (%)Bank nonperforming loans to total gross loans (%)Domestic credit to the private sector (% of GDP)Real interest rate (%)Interest rate spread (percentage points)
Infrastructure
Air transport (thousands registered carrier departures worldwide)Port container traffic (thousand TEU)Electric power consumption (kWh per capita)Power outages in firms in a typical month (number)Mobile-cellular telephone subscriptions (per 100 people)Individuals using the Internet (%)
Sub-Saharan Africa Lower middle income
Cameroon
2005 2013 2013
Lower
middle-
income
groupCountry data
18.1 22.3 2,5617.0 8.9 1,0144.4 4.0 5.3
900 1,290 2,0743.8 3.5 5.8
20.6 22.9 17.032.0 29.9 32.118.7 14.4 17.147.4 47.2 51.12.0 1.9
527.5 494.020.5 20.7 27.121.5 28.9 31.2
.. 158
45 15 2211 5 7
654 630 31527 23 25
3.2 2.8 2.9.. 30.0 15.9.. .... .. 1.1
12.8 ..65.4 ..84.6 ..41.9 ..78.9 ..16.4 ..
486 2,434 402,6681.5 1.1 2.1
17.7 19.4 25.515.2 17.1 18.8
.. .. ..
12.9 16.0 47.1
.. .. 10.3
.. 10.3 4.59.9 14.8 41.5
14.7 ..12.8 .. 7.1
11 6 2,437
218 350 62,268182 256 736
11.6 ..12.4 70.4 85.2
1.4 6.4 21.2

52 2015 The Little Data Book on Private Sector Development
Economic and social context
Population (millions)Labor force (millions)Unemployment rate (% of labor force)GNI per capita, World Bank Atlas method ($)GDP growth, 2000–05 and 2006–13 (average annual %)Agriculture value added (% of GDP)Industry value added (% of GDP) Manufacturing value added (% of GDP)Services value added (% of GDP)Inflation (annual % change in CPI)Exchange rate (local currency units per $)Exports of goods and services (% of GDP)Imports of goods and services (% of GDP)
Business environment
Ease of doing business (ranking 1–189; 1=best)Time to start a business (days)Procedures to start a business (number)Time to prepare, file, and pay taxes (hours)Time to export (days)Time to resolve insolvency (years)Profit tax (% of commercial profits)New businesses registered (thousands)New business density (new regis. per 1,000 working-age pop.)Enterprise surveys
Time spent dealing w/req. of gov't. reg. (% of sr. mgt. time) Firms expected to give gifts in meetings with tax officials (%) Firms competing against unregistered firms (%) Firms using banks to finance working capital (% of firms) Delay in obtaining an electrical connection (days) Internationally recognized quality certification (% of firms)
Private sector investment
Invest. in infra. w/privt. part., 2000–05 and 2006–13 ($ millions)Private foreign direct investment, net (% of GDP)Gross fixed capital formation (% of GDP)Gross fixed private capital formation (% of GDP)
Finance and banking
Government debt (% of GDP)Total financial system deposits (% of GDP)Bank capital to asset ratio (%)Bank nonperforming loans to total gross loans (%)Domestic credit to the private sector (% of GDP)Real interest rate (%)Interest rate spread (percentage points)
Infrastructure
Air transport (thousands registered carrier departures worldwide)Port container traffic (thousand TEU)Electric power consumption (kWh per capita)Power outages in firms in a typical month (number)Mobile-cellular telephone subscriptions (per 100 people)Individuals using the Internet (%)
High income
Canada
2005 2013 2013
High-
income
groupCountry data
32.3 35.2 1,30617.7 19.4 6466.7 7.1 7.7
33,950 52,210 39,8122.5 1.3 0.91.6 1.5 1.5
30.0 27.7 24.812.7 10.7 15.068.5 70.8 73.7
2.2 0.91.2 1.0
37.0 30.1 30.033.1 31.8 29.6
.. 163 5 152 1 6
119 131 1668 8 12
0.8 0.8 2.0.. 3.9 14.1
20.9 25.7
0.9 1.1 7.5
.. .... .... .... .... .... ..
.. .. ..
2.2 3.9 2.022.0 23.7 20.3
.. .. ..
45.9 51.9 65.9
145.0 .. 90.34.1 5.1 8.20.5 0.6 3.2
173.5 .. 150.91.2 1.73.6 2.5 ..
1,018 1,263 20,8684,163 5,383 321,602
17,319 16,473 8,906
.. ..52.8 80.6 121.071.7 85.8 78.2

53The Little Data Book on Private Sector Development 2015
Economic and social context
Population (millions)Labor force (millions)Unemployment rate (% of labor force)GNI per capita, World Bank Atlas method ($)GDP growth, 2000–05 and 2006–13 (average annual %)Agriculture value added (% of GDP)Industry value added (% of GDP) Manufacturing value added (% of GDP)Services value added (% of GDP)Inflation (annual % change in CPI)Exchange rate (local currency units per $)Exports of goods and services (% of GDP)Imports of goods and services (% of GDP)
Business environment
Ease of doing business (ranking 1–189; 1=best)Time to start a business (days)Procedures to start a business (number)Time to prepare, file, and pay taxes (hours)Time to export (days)Time to resolve insolvency (years)Profit tax (% of commercial profits)New businesses registered (thousands)New business density (new regis. per 1,000 working-age pop.)Enterprise surveys
Time spent dealing w/req. of gov't. reg. (% of sr. mgt. time) Firms expected to give gifts in meetings with tax officials (%) Firms competing against unregistered firms (%) Firms using banks to finance working capital (% of firms) Delay in obtaining an electrical connection (days) Internationally recognized quality certification (% of firms)
Private sector investment
Invest. in infra. w/privt. part., 2000–05 and 2006–13 ($ millions)Private foreign direct investment, net (% of GDP)Gross fixed capital formation (% of GDP)Gross fixed private capital formation (% of GDP)
Finance and banking
Government debt (% of GDP)Total financial system deposits (% of GDP)Bank capital to asset ratio (%)Bank nonperforming loans to total gross loans (%)Domestic credit to the private sector (% of GDP)Real interest rate (%)Interest rate spread (percentage points)
Infrastructure
Air transport (thousands registered carrier departures worldwide)Port container traffic (thousand TEU)Electric power consumption (kWh per capita)Power outages in firms in a typical month (number)Mobile-cellular telephone subscriptions (per 100 people)Individuals using the Internet (%)
High income
Cayman Islands
2005 2013 2013
High-
income
groupCountry data
0.05 0.06 1,306.. .. 646.. .. 7.7.. .. 39,812.. .. 0.9.. .. 1.5
.. .. 24.8
.. .. 15.0
.. .. 73.7
.. ..
.. ..
.. .. 30.0
.. .. 29.6
.. .... .. 15.. .. 6.. .. 166.. .. 12.. .. 2.0.. .. 14.1.. .... .. 7.5
.. .... .... .... .... .... ..
.. .. .... .. 2.0.. .. 20.3.. .. .. .. .. 65.9
.. .. 90.3
.. .. 8.2
.. .. 3.2
.. .. 150.9
.. ..
.. .. ..
.. .. 20,8681 49 321,602.. .. 8,906
.. ..166.5 167.8 121.038.0 74.1 78.2

54 2015 The Little Data Book on Private Sector Development
Economic and social context
Population (millions)Labor force (millions)Unemployment rate (% of labor force)GNI per capita, World Bank Atlas method ($)GDP growth, 2000–05 and 2006–13 (average annual %)Agriculture value added (% of GDP)Industry value added (% of GDP) Manufacturing value added (% of GDP)Services value added (% of GDP)Inflation (annual % change in CPI)Exchange rate (local currency units per $)Exports of goods and services (% of GDP)Imports of goods and services (% of GDP)
Business environment
Ease of doing business (ranking 1–189; 1=best)Time to start a business (days)Procedures to start a business (number)Time to prepare, file, and pay taxes (hours)Time to export (days)Time to resolve insolvency (years)Profit tax (% of commercial profits)New businesses registered (thousands)New business density (new regis. per 1,000 working-age pop.)Enterprise surveys
Time spent dealing w/req. of gov't. reg. (% of sr. mgt. time) Firms expected to give gifts in meetings with tax officials (%) Firms competing against unregistered firms (%) Firms using banks to finance working capital (% of firms) Delay in obtaining an electrical connection (days) Internationally recognized quality certification (% of firms)
Private sector investment
Invest. in infra. w/privt. part., 2000–05 and 2006–13 ($ millions)Private foreign direct investment, net (% of GDP)Gross fixed capital formation (% of GDP)Gross fixed private capital formation (% of GDP)
Finance and banking
Government debt (% of GDP)Total financial system deposits (% of GDP)Bank capital to asset ratio (%)Bank nonperforming loans to total gross loans (%)Domestic credit to the private sector (% of GDP)Real interest rate (%)Interest rate spread (percentage points)
Infrastructure
Air transport (thousands registered carrier departures worldwide)Port container traffic (thousand TEU)Electric power consumption (kWh per capita)Power outages in firms in a typical month (number)Mobile-cellular telephone subscriptions (per 100 people)Individuals using the Internet (%)
Sub-Saharan Africa Low income
Central African Republic
2005 2013 2013
Low-
income
groupCountry data
4.0 4.6 8491.8 2.2 3917.0 7.6 5.1
340 320 7281.5 1.4 6.0
54.9 54.3 26.214.3 13.7 23.46.4 6.5 12.1
30.8 32.0 50.62.9 1.5
527.5 493.913.2 11.6 22.021.5 21.8 35.9
.. 187
22 22 2911 8 8
504 483 26557 46 35
4.8 4.8 3.4.. 0.0 19.2.. .... .. 0.3
.. 9.2
.. 16.8
.. 66.7
.. 25.3
.. 11.8
.. 37.0
.. 80 30,934
0.7 0.1 3.89.8 14.8 25.2
.. .. ..
.. .. ..
5.3 12.3 37.6.. .. .... .. ..
6.8 14.9 27.611.9 ..12.8 .. 10.7
.. .. 385.. .. .... .. 219
.. 29.0
2.5 29.5 54.60.3 3.5 7.1

55The Little Data Book on Private Sector Development 2015
Economic and social context
Population (millions)Labor force (millions)Unemployment rate (% of labor force)GNI per capita, World Bank Atlas method ($)GDP growth, 2000–05 and 2006–13 (average annual %)Agriculture value added (% of GDP)Industry value added (% of GDP) Manufacturing value added (% of GDP)Services value added (% of GDP)Inflation (annual % change in CPI)Exchange rate (local currency units per $)Exports of goods and services (% of GDP)Imports of goods and services (% of GDP)
Business environment
Ease of doing business (ranking 1–189; 1=best)Time to start a business (days)Procedures to start a business (number)Time to prepare, file, and pay taxes (hours)Time to export (days)Time to resolve insolvency (years)Profit tax (% of commercial profits)New businesses registered (thousands)New business density (new regis. per 1,000 working-age pop.)Enterprise surveys
Time spent dealing w/req. of gov't. reg. (% of sr. mgt. time) Firms expected to give gifts in meetings with tax officials (%) Firms competing against unregistered firms (%) Firms using banks to finance working capital (% of firms) Delay in obtaining an electrical connection (days) Internationally recognized quality certification (% of firms)
Private sector investment
Invest. in infra. w/privt. part., 2000–05 and 2006–13 ($ millions)Private foreign direct investment, net (% of GDP)Gross fixed capital formation (% of GDP)Gross fixed private capital formation (% of GDP)
Finance and banking
Government debt (% of GDP)Total financial system deposits (% of GDP)Bank capital to asset ratio (%)Bank nonperforming loans to total gross loans (%)Domestic credit to the private sector (% of GDP)Real interest rate (%)Interest rate spread (percentage points)
Infrastructure
Air transport (thousands registered carrier departures worldwide)Port container traffic (thousand TEU)Electric power consumption (kWh per capita)Power outages in firms in a typical month (number)Mobile-cellular telephone subscriptions (per 100 people)Individuals using the Internet (%)
Sub-Saharan Africa Low income
Chad
2005 2013 2013
Low-
income
groupCountry data
10.0 12.8 8493.6 4.7 3917.0 7.0 5.1
470 1,030 72817.2 5.6 6.054.8 51.5 26.2
9.4 15.4 23.40.2 2.7 12.1
35.7 33.1 50.67.9 0.1
527.5 494.048.0 32.2 22.037.9 37.5 35.9
.. 185
62 60 2913 9 8
732 732 26578 70 354.0 4.0 3.4
.. 31.3 19.2
.. ..
.. .. 0.3
.. .... .... .... .... .... ..
11 779 30,934
–1.5 4.0 3.820.6 27.4 25.214.4 17.2 ..
.. .. ..
2.6 5.8 37.6.. .. .... .. ..
2.5 5.8 27.6–8.2 ..12.8 .. 10.7
.. 0 385.. .. .... .. 219
.. ..2.1 35.6 54.60.4 2.3 7.1

56 2015 The Little Data Book on Private Sector Development
Economic and social context
Population (millions)Labor force (millions)Unemployment rate (% of labor force)GNI per capita, World Bank Atlas method ($)GDP growth, 2000–05 and 2006–13 (average annual %)Agriculture value added (% of GDP)Industry value added (% of GDP) Manufacturing value added (% of GDP)Services value added (% of GDP)Inflation (annual % change in CPI)Exchange rate (local currency units per $)Exports of goods and services (% of GDP)Imports of goods and services (% of GDP)
Business environment
Ease of doing business (ranking 1–189; 1=best)Time to start a business (days)Procedures to start a business (number)Time to prepare, file, and pay taxes (hours)Time to export (days)Time to resolve insolvency (years)Profit tax (% of commercial profits)New businesses registered (thousands)New business density (new regis. per 1,000 working-age pop.)Enterprise surveys
Time spent dealing w/req. of gov't. reg. (% of sr. mgt. time) Firms expected to give gifts in meetings with tax officials (%) Firms competing against unregistered firms (%) Firms using banks to finance working capital (% of firms) Delay in obtaining an electrical connection (days) Internationally recognized quality certification (% of firms)
Private sector investment
Invest. in infra. w/privt. part., 2000–05 and 2006–13 ($ millions)Private foreign direct investment, net (% of GDP)Gross fixed capital formation (% of GDP)Gross fixed private capital formation (% of GDP)
Finance and banking
Government debt (% of GDP)Total financial system deposits (% of GDP)Bank capital to asset ratio (%)Bank nonperforming loans to total gross loans (%)Domestic credit to the private sector (% of GDP)Real interest rate (%)Interest rate spread (percentage points)
Infrastructure
Air transport (thousands registered carrier departures worldwide)Port container traffic (thousand TEU)Electric power consumption (kWh per capita)Power outages in firms in a typical month (number)Mobile-cellular telephone subscriptions (per 100 people)Individuals using the Internet (%)
High income
Channel Islands
2005 2013 2013
High-
income
groupCountry data
0.15 0.16 1,306.. .. 646.. .. 7.7
55,320 .. 39,812–1.2 .. 0.9
.. .. 1.5
.. .. 24.8
.. .. 15.0
.. .. 73.7
.. ..0.6 ..
.. .. 30.0
.. .. 29.6
.. .... .. 15.. .. 6.. .. 166.. .. 12.. .. 2.0.. .. 14.1.. .... .. 7.5
.. .... .... .... .... .... ..
.. .. .... .. 2.0.. .. 20.3.. .. .. .. .. 65.9
.. .. 90.3
.. .. 8.2
.. .. 3.2
.. .. 150.9
.. ..
.. .. ..
.. .. 20,868.. .. 321,602.. .. 8,906
.. ..
.. .. 121.0
.. .. 78.2

57The Little Data Book on Private Sector Development 2015
Economic and social context
Population (millions)Labor force (millions)Unemployment rate (% of labor force)GNI per capita, World Bank Atlas method ($)GDP growth, 2000–05 and 2006–13 (average annual %)Agriculture value added (% of GDP)Industry value added (% of GDP) Manufacturing value added (% of GDP)Services value added (% of GDP)Inflation (annual % change in CPI)Exchange rate (local currency units per $)Exports of goods and services (% of GDP)Imports of goods and services (% of GDP)
Business environment
Ease of doing business (ranking 1–189; 1=best)Time to start a business (days)Procedures to start a business (number)Time to prepare, file, and pay taxes (hours)Time to export (days)Time to resolve insolvency (years)Profit tax (% of commercial profits)New businesses registered (thousands)New business density (new regis. per 1,000 working-age pop.)Enterprise surveys
Time spent dealing w/req. of gov't. reg. (% of sr. mgt. time) Firms expected to give gifts in meetings with tax officials (%) Firms competing against unregistered firms (%) Firms using banks to finance working capital (% of firms) Delay in obtaining an electrical connection (days) Internationally recognized quality certification (% of firms)
Private sector investment
Invest. in infra. w/privt. part., 2000–05 and 2006–13 ($ millions)Private foreign direct investment, net (% of GDP)Gross fixed capital formation (% of GDP)Gross fixed private capital formation (% of GDP)
Finance and banking
Government debt (% of GDP)Total financial system deposits (% of GDP)Bank capital to asset ratio (%)Bank nonperforming loans to total gross loans (%)Domestic credit to the private sector (% of GDP)Real interest rate (%)Interest rate spread (percentage points)
Infrastructure
Air transport (thousands registered carrier departures worldwide)Port container traffic (thousand TEU)Electric power consumption (kWh per capita)Power outages in firms in a typical month (number)Mobile-cellular telephone subscriptions (per 100 people)Individuals using the Internet (%)
High income
Chile
2005 2013 2013
High-
income
groupCountry data
16.3 17.6 1,3066.8 8.6 6468.0 6.0 7.7
6,250 15,230 39,8124.2 3.9 0.94.6 3.4 1.5
36.9 35.3 24.8
14.7 11.5 15.0
58.5 61.3 73.7
.. 1.8559.8 495.0
38.4 32.6 30.031.6 32.9 29.6
.. 41
42 6 159 7 6
316 291 16617 15 12
5.6 3.2 2.0.. 21.2 14.1
28.7 68.4
2.6 5.7 7.5
9.0 9.9
7.6 0.4
49.6 55.8
48.9 55.1
22.9 21.1
22.0 22.1
8,980 17,422 ..
5.6 7.3 2.021.2 23.6 20.3
.. .. .. .. .. 65.9
47.7 49.8 90.37.1 8.1 8.20.9 2.1 3.2
76.3 105.9 150.9–0.8 7.42.7 4.1 ..
93 127 20,868
1,804 3,784 321,6023,066 3,568 8,906
0.6 0.7
64.7 134.3 121.031.2 66.5 78.2
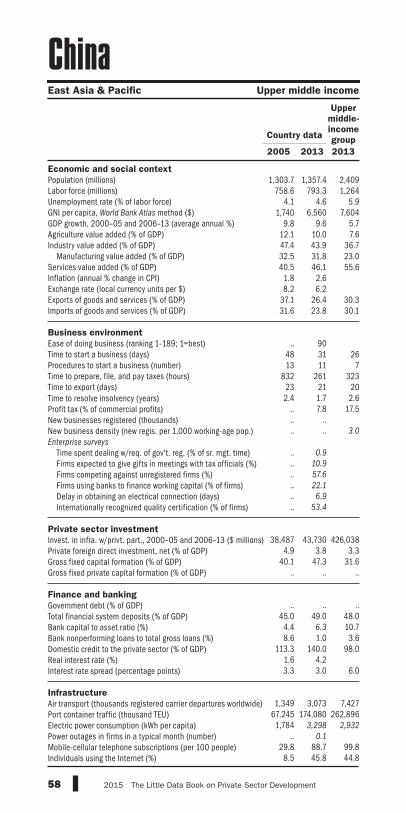
58 2015 The Little Data Book on Private Sector Development
Economic and social context
Population (millions)Labor force (millions)Unemployment rate (% of labor force)GNI per capita, World Bank Atlas method ($)GDP growth, 2000–05 and 2006–13 (average annual %)Agriculture value added (% of GDP)Industry value added (% of GDP) Manufacturing value added (% of GDP)Services value added (% of GDP)Inflation (annual % change in CPI)Exchange rate (local currency units per $)Exports of goods and services (% of GDP)Imports of goods and services (% of GDP)
Business environment
Ease of doing business (ranking 1–189; 1=best)Time to start a business (days)Procedures to start a business (number)Time to prepare, file, and pay taxes (hours)Time to export (days)Time to resolve insolvency (years)Profit tax (% of commercial profits)New businesses registered (thousands)New business density (new regis. per 1,000 working-age pop.)Enterprise surveys
Time spent dealing w/req. of gov't. reg. (% of sr. mgt. time) Firms expected to give gifts in meetings with tax officials (%) Firms competing against unregistered firms (%) Firms using banks to finance working capital (% of firms) Delay in obtaining an electrical connection (days) Internationally recognized quality certification (% of firms)
Private sector investment
Invest. in infra. w/privt. part., 2000–05 and 2006–13 ($ millions)Private foreign direct investment, net (% of GDP)Gross fixed capital formation (% of GDP)Gross fixed private capital formation (% of GDP)
Finance and banking
Government debt (% of GDP)Total financial system deposits (% of GDP)Bank capital to asset ratio (%)Bank nonperforming loans to total gross loans (%)Domestic credit to the private sector (% of GDP)Real interest rate (%)Interest rate spread (percentage points)
Infrastructure
Air transport (thousands registered carrier departures worldwide)Port container traffic (thousand TEU)Electric power consumption (kWh per capita)Power outages in firms in a typical month (number)Mobile-cellular telephone subscriptions (per 100 people)Individuals using the Internet (%)
East Asia & Pacific Upper middle income
China
2005 2013 2013
Upper
middle-
income
groupCountry data
1,303.7 1,357.4 2,409758.6 793.3 1,264
4.1 4.6 5.91,740 6,560 7,604
9.8 9.6 5.712.1 10.0 7.647.4 43.9 36.732.5 31.8 23.040.5 46.1 55.6
1.8 2.68.2 6.2
37.1 26.4 30.331.6 23.8 30.1
.. 90
48 31 2613 11 7
832 261 32323 21 202.4 1.7 2.6
.. 7.8 17.5
.. ..
.. .. 3.0
.. 0.9
.. 10.9
.. 57.6
.. 22.1
.. 6.9
.. 53.4
38,487 43,730 426,038
4.9 3.8 3.340.1 47.3 31.6
.. .. ..
.. .. ..
45.0 49.0 48.04.4 6.3 10.78.6 1.0 3.6
113.3 140.0 98.01.6 4.23.3 3.0 6.0
1,349 3,073 7,427
67,245 174,080 262,8961,784 3,298 2,932
.. 0.1
29.8 88.7 99.88.5 45.8 44.8

59The Little Data Book on Private Sector Development 2015
Economic and social context
Population (millions)Labor force (millions)Unemployment rate (% of labor force)GNI per capita, World Bank Atlas method ($)GDP growth, 2000–05 and 2006–13 (average annual %)Agriculture value added (% of GDP)Industry value added (% of GDP) Manufacturing value added (% of GDP)Services value added (% of GDP)Inflation (annual % change in CPI)Exchange rate (local currency units per $)Exports of goods and services (% of GDP)Imports of goods and services (% of GDP)
Business environment
Ease of doing business (ranking 1–189; 1=best)Time to start a business (days)Procedures to start a business (number)Time to prepare, file, and pay taxes (hours)Time to export (days)Time to resolve insolvency (years)Profit tax (% of commercial profits)New businesses registered (thousands)New business density (new regis. per 1,000 working-age pop.)Enterprise surveys
Time spent dealing w/req. of gov't. reg. (% of sr. mgt. time) Firms expected to give gifts in meetings with tax officials (%) Firms competing against unregistered firms (%) Firms using banks to finance working capital (% of firms) Delay in obtaining an electrical connection (days) Internationally recognized quality certification (% of firms)
Private sector investment
Invest. in infra. w/privt. part., 2000–05 and 2006–13 ($ millions)Private foreign direct investment, net (% of GDP)Gross fixed capital formation (% of GDP)Gross fixed private capital formation (% of GDP)
Finance and banking
Government debt (% of GDP)Total financial system deposits (% of GDP)Bank capital to asset ratio (%)Bank nonperforming loans to total gross loans (%)Domestic credit to the private sector (% of GDP)Real interest rate (%)Interest rate spread (percentage points)
Infrastructure
Air transport (thousands registered carrier departures worldwide)Port container traffic (thousand TEU)Electric power consumption (kWh per capita)Power outages in firms in a typical month (number)Mobile-cellular telephone subscriptions (per 100 people)Individuals using the Internet (%)
Latin America & Caribbean Upper middle income
Colombia
2005 2013 2013
Upper
middle-
income
groupCountry data
43.2 48.3 2,40919.9 23.6 1,26412.0 10.5 5.9
2,930 7,590 7,6043.7 4.3 5.78.4 6.1 7.6
32.8 37.2 36.715.4 12.3 23.058.8 56.7 55.6
5.0 2.02,321.6 1,868.8
16.8 17.8 30.318.8 20.2 30.1
.. 34
40 11 2611 8 7
456 239 32334 14 203.0 1.7 2.6
.. 19.9 17.529.3 63.0
1.1 2.0 3.0
14.3 12.9
1.1 1.5
55.1 70.9
55.7 49.2
26.4 20.9
5.9 20.8
3,734 21,521 426,038
7.0 4.3 3.319.7 24.5 31.6
.. .. ..
52.5 65.3 ..16.5 24.4 48.014.0 14.8 10.7
2.7 2.8 3.629.3 50.2 98.0
8.5 9.37.5 6.8 6.0
162 251 7,427
1,236 2,718 262,896898 1,123 2,932
0.4 0.6
50.6 104.1 99.811.0 51.7 44.8

60 2015 The Little Data Book on Private Sector Development
Economic and social context
Population (millions)Labor force (millions)Unemployment rate (% of labor force)GNI per capita, World Bank Atlas method ($)GDP growth, 2000–05 and 2006–13 (average annual %)Agriculture value added (% of GDP)Industry value added (% of GDP) Manufacturing value added (% of GDP)Services value added (% of GDP)Inflation (annual % change in CPI)Exchange rate (local currency units per $)Exports of goods and services (% of GDP)Imports of goods and services (% of GDP)
Business environment
Ease of doing business (ranking 1–189; 1=best)Time to start a business (days)Procedures to start a business (number)Time to prepare, file, and pay taxes (hours)Time to export (days)Time to resolve insolvency (years)Profit tax (% of commercial profits)New businesses registered (thousands)New business density (new regis. per 1,000 working-age pop.)Enterprise surveys
Time spent dealing w/req. of gov't. reg. (% of sr. mgt. time) Firms expected to give gifts in meetings with tax officials (%) Firms competing against unregistered firms (%) Firms using banks to finance working capital (% of firms) Delay in obtaining an electrical connection (days) Internationally recognized quality certification (% of firms)
Private sector investment
Invest. in infra. w/privt. part., 2000–05 and 2006–13 ($ millions)Private foreign direct investment, net (% of GDP)Gross fixed capital formation (% of GDP)Gross fixed private capital formation (% of GDP)
Finance and banking
Government debt (% of GDP)Total financial system deposits (% of GDP)Bank capital to asset ratio (%)Bank nonperforming loans to total gross loans (%)Domestic credit to the private sector (% of GDP)Real interest rate (%)Interest rate spread (percentage points)
Infrastructure
Air transport (thousands registered carrier departures worldwide)Port container traffic (thousand TEU)Electric power consumption (kWh per capita)Power outages in firms in a typical month (number)Mobile-cellular telephone subscriptions (per 100 people)Individuals using the Internet (%)
Sub-Saharan Africa Low income
ComorosLow-
income
groupCountry data
0.60 0.73 8490.20 0.25 391
6.7 6.5 5.1640 840 7283.6 2.1 6.0
41.2 37.1 26.211.8 12.5 23.4
4.1 7.0 12.147.0 50.4 50.63.0 2.3
395.6 370.515.0 16.4 22.036.4 61.8 35.9
.. 159
30 15 2910 8 8
100 100 26531 31 35
.. .. 3.4
.. 32.1 19.2
.. ..
.. .. 0.3
.. .... .... .... .... .... ..
0.5 .. 30,9340.1 2.3 3.8
10.3 17.8 25.2.. .. ..
.. .. ..
16.0 30.9 37.6.. .. .... .. ..
9.7 23.9 27.610.7 8.68.0 8.8 10.7
.. .. 385.. .. .... .. 219
.. ..2.6 47.3 54.62.0 6.5 7.1
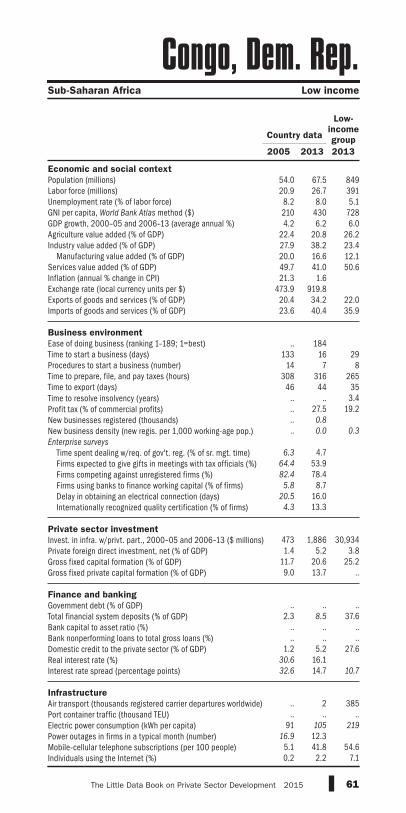
61The Little Data Book on Private Sector Development 2015
Economic and social context
Population (millions)Labor force (millions)Unemployment rate (% of labor force)GNI per capita, World Bank Atlas method ($)GDP growth, 2000–05 and 2006–13 (average annual %)Agriculture value added (% of GDP)Industry value added (% of GDP) Manufacturing value added (% of GDP)Services value added (% of GDP)Inflation (annual % change in CPI)Exchange rate (local currency units per $)Exports of goods and services (% of GDP)Imports of goods and services (% of GDP)
Business environment
Ease of doing business (ranking 1–189; 1=best)Time to start a business (days)Procedures to start a business (number)Time to prepare, file, and pay taxes (hours)Time to export (days)Time to resolve insolvency (years)Profit tax (% of commercial profits)New businesses registered (thousands)New business density (new regis. per 1,000 working-age pop.)Enterprise surveys
Time spent dealing w/req. of gov't. reg. (% of sr. mgt. time) Firms expected to give gifts in meetings with tax officials (%) Firms competing against unregistered firms (%) Firms using banks to finance working capital (% of firms) Delay in obtaining an electrical connection (days) Internationally recognized quality certification (% of firms)
Private sector investment
Invest. in infra. w/privt. part., 2000–05 and 2006–13 ($ millions)Private foreign direct investment, net (% of GDP)Gross fixed capital formation (% of GDP)Gross fixed private capital formation (% of GDP)
Finance and banking
Government debt (% of GDP)Total financial system deposits (% of GDP)Bank capital to asset ratio (%)Bank nonperforming loans to total gross loans (%)Domestic credit to the private sector (% of GDP)Real interest rate (%)Interest rate spread (percentage points)
Infrastructure
Air transport (thousands registered carrier departures worldwide)Port container traffic (thousand TEU)Electric power consumption (kWh per capita)Power outages in firms in a typical month (number)Mobile-cellular telephone subscriptions (per 100 people)Individuals using the Internet (%)
Sub-Saharan Africa Low income
Congo, Dem. Rep.
2005 2013 2013
Low-
income
groupCountry data
54.0 67.5 84920.9 26.7 3918.2 8.0 5.1210 430 7284.2 6.2 6.0
22.4 20.8 26.227.9 38.2 23.420.0 16.6 12.149.7 41.0 50.621.3 1.6
473.9 919.820.4 34.2 22.023.6 40.4 35.9
.. 184
133 16 2914 7 8
308 316 26546 44 35
.. .. 3.4
.. 27.5 19.2
.. 0.8
.. 0.0 0.3
6.3 4.7
64.4 53.982.4 78.4
5.8 8.720.5 16.0
4.3 13.3
473 1,886 30,9341.4 5.2 3.8
11.7 20.6 25.29.0 13.7 ..
.. .. ..
2.3 8.5 37.6.. .. .... .. ..
1.2 5.2 27.630.6 16.132.6 14.7 10.7
.. 2 385.. .. ..
91 105 219
16.9 12.35.1 41.8 54.60.2 2.2 7.1
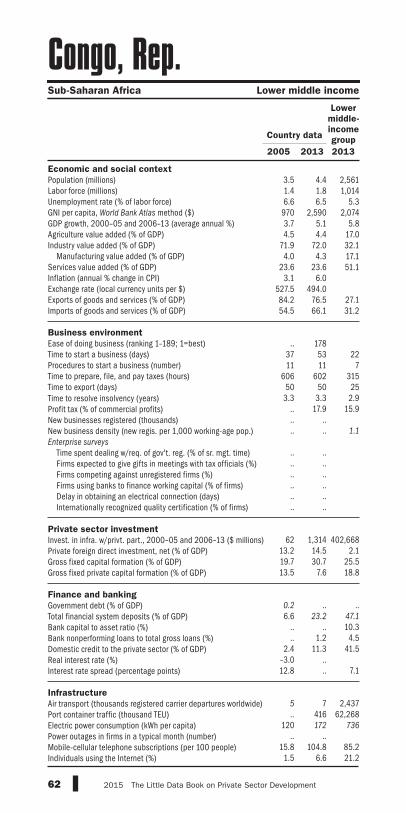
62 2015 The Little Data Book on Private Sector Development
Economic and social context
Population (millions)Labor force (millions)Unemployment rate (% of labor force)GNI per capita, World Bank Atlas method ($)GDP growth, 2000–05 and 2006–13 (average annual %)Agriculture value added (% of GDP)Industry value added (% of GDP) Manufacturing value added (% of GDP)Services value added (% of GDP)Inflation (annual % change in CPI)Exchange rate (local currency units per $)Exports of goods and services (% of GDP)Imports of goods and services (% of GDP)
Business environment
Ease of doing business (ranking 1–189; 1=best)Time to start a business (days)Procedures to start a business (number)Time to prepare, file, and pay taxes (hours)Time to export (days)Time to resolve insolvency (years)Profit tax (% of commercial profits)New businesses registered (thousands)New business density (new regis. per 1,000 working-age pop.)Enterprise surveys
Time spent dealing w/req. of gov't. reg. (% of sr. mgt. time) Firms expected to give gifts in meetings with tax officials (%) Firms competing against unregistered firms (%) Firms using banks to finance working capital (% of firms) Delay in obtaining an electrical connection (days) Internationally recognized quality certification (% of firms)
Private sector investment
Invest. in infra. w/privt. part., 2000–05 and 2006–13 ($ millions)Private foreign direct investment, net (% of GDP)Gross fixed capital formation (% of GDP)Gross fixed private capital formation (% of GDP)
Finance and banking
Government debt (% of GDP)Total financial system deposits (% of GDP)Bank capital to asset ratio (%)Bank nonperforming loans to total gross loans (%)Domestic credit to the private sector (% of GDP)Real interest rate (%)Interest rate spread (percentage points)
Infrastructure
Air transport (thousands registered carrier departures worldwide)Port container traffic (thousand TEU)Electric power consumption (kWh per capita)Power outages in firms in a typical month (number)Mobile-cellular telephone subscriptions (per 100 people)Individuals using the Internet (%)
Sub-Saharan Africa Lower middle income
Congo, Rep.
2005 2013 2013
Lower
middle-
income
groupCountry data
3.5 4.4 2,5611.4 1.8 1,0146.6 6.5 5.3970 2,590 2,0743.7 5.1 5.84.5 4.4 17.0
71.9 72.0 32.14.0 4.3 17.1
23.6 23.6 51.13.1 6.0
527.5 494.084.2 76.5 27.154.5 66.1 31.2
.. 178
37 53 2211 11 7
606 602 31550 50 253.3 3.3 2.9
.. 17.9 15.9
.. ..
.. .. 1.1
.. .... .... .... .... .... ..
62 1,314 402,668
13.2 14.5 2.119.7 30.7 25.513.5 7.6 18.8
0.2 .. ..6.6 23.2 47.1
.. .. 10.3
.. 1.2 4.52.4 11.3 41.5
–3.0 ..12.8 .. 7.1
5 7 2,437.. 416 62,268
120 172 736
.. ..15.8 104.8 85.2
1.5 6.6 21.2
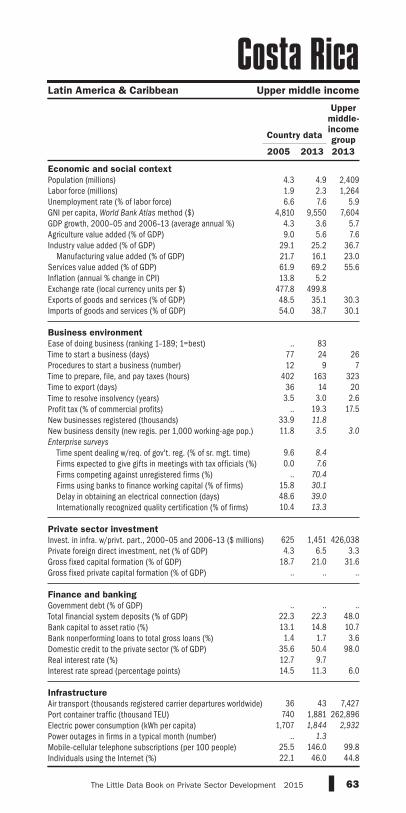
63The Little Data Book on Private Sector Development 2015
Economic and social context
Population (millions)Labor force (millions)Unemployment rate (% of labor force)GNI per capita, World Bank Atlas method ($)GDP growth, 2000–05 and 2006–13 (average annual %)Agriculture value added (% of GDP)Industry value added (% of GDP) Manufacturing value added (% of GDP)Services value added (% of GDP)Inflation (annual % change in CPI)Exchange rate (local currency units per $)Exports of goods and services (% of GDP)Imports of goods and services (% of GDP)
Business environment
Ease of doing business (ranking 1–189; 1=best)Time to start a business (days)Procedures to start a business (number)Time to prepare, file, and pay taxes (hours)Time to export (days)Time to resolve insolvency (years)Profit tax (% of commercial profits)New businesses registered (thousands)New business density (new regis. per 1,000 working-age pop.)Enterprise surveys
Time spent dealing w/req. of gov't. reg. (% of sr. mgt. time) Firms expected to give gifts in meetings with tax officials (%) Firms competing against unregistered firms (%) Firms using banks to finance working capital (% of firms) Delay in obtaining an electrical connection (days) Internationally recognized quality certification (% of firms)
Private sector investment
Invest. in infra. w/privt. part., 2000–05 and 2006–13 ($ millions)Private foreign direct investment, net (% of GDP)Gross fixed capital formation (% of GDP)Gross fixed private capital formation (% of GDP)
Finance and banking
Government debt (% of GDP)Total financial system deposits (% of GDP)Bank capital to asset ratio (%)Bank nonperforming loans to total gross loans (%)Domestic credit to the private sector (% of GDP)Real interest rate (%)Interest rate spread (percentage points)
Infrastructure
Air transport (thousands registered carrier departures worldwide)Port container traffic (thousand TEU)Electric power consumption (kWh per capita)Power outages in firms in a typical month (number)Mobile-cellular telephone subscriptions (per 100 people)Individuals using the Internet (%)
Latin America & Caribbean Upper middle income
Costa Rica
2005 2013 2013
Upper
middle-
income
groupCountry data
4.3 4.9 2,4091.9 2.3 1,2646.6 7.6 5.9
4,810 9,550 7,6044.3 3.6 5.79.0 5.6 7.6
29.1 25.2 36.721.7 16.1 23.061.9 69.2 55.613.8 5.2
477.8 499.848.5 35.1 30.354.0 38.7 30.1
.. 83
77 24 2612 9 7
402 163 32336 14 203.5 3.0 2.6
.. 19.3 17.533.9 11.8
11.8 3.5 3.0
9.6 8.4
0.0 7.6
.. 70.4
15.8 30.1
48.6 39.0
10.4 13.3
625 1,451 426,0384.3 6.5 3.3
18.7 21.0 31.6.. .. ..
.. .. ..
22.3 22.3 48.013.1 14.8 10.71.4 1.7 3.6
35.6 50.4 98.012.7 9.714.5 11.3 6.0
36 43 7,427
740 1,881 262,8961,707 1,844 2,932
.. 1.3
25.5 146.0 99.822.1 46.0 44.8
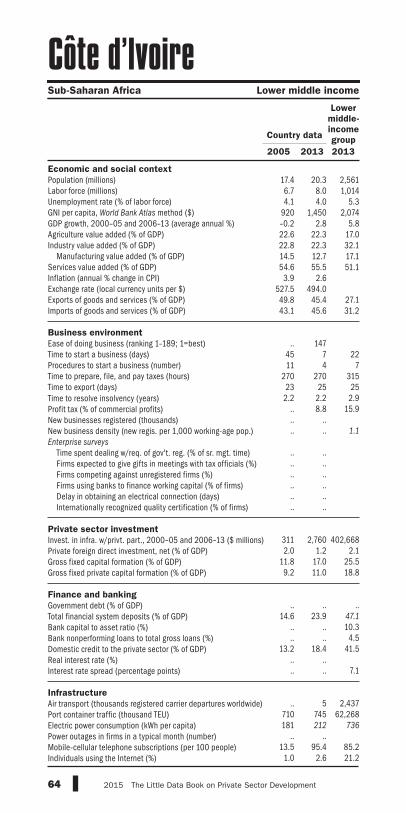
64 2015 The Little Data Book on Private Sector Development
Economic and social context
Population (millions)Labor force (millions)Unemployment rate (% of labor force)GNI per capita, World Bank Atlas method ($)GDP growth, 2000–05 and 2006–13 (average annual %)Agriculture value added (% of GDP)Industry value added (% of GDP) Manufacturing value added (% of GDP)Services value added (% of GDP)Inflation (annual % change in CPI)Exchange rate (local currency units per $)Exports of goods and services (% of GDP)Imports of goods and services (% of GDP)
Business environment
Ease of doing business (ranking 1–189; 1=best)Time to start a business (days)Procedures to start a business (number)Time to prepare, file, and pay taxes (hours)Time to export (days)Time to resolve insolvency (years)Profit tax (% of commercial profits)New businesses registered (thousands)New business density (new regis. per 1,000 working-age pop.)Enterprise surveys
Time spent dealing w/req. of gov't. reg. (% of sr. mgt. time) Firms expected to give gifts in meetings with tax officials (%) Firms competing against unregistered firms (%) Firms using banks to finance working capital (% of firms) Delay in obtaining an electrical connection (days) Internationally recognized quality certification (% of firms)
Private sector investment
Invest. in infra. w/privt. part., 2000–05 and 2006–13 ($ millions)Private foreign direct investment, net (% of GDP)Gross fixed capital formation (% of GDP)Gross fixed private capital formation (% of GDP)
Finance and banking
Government debt (% of GDP)Total financial system deposits (% of GDP)Bank capital to asset ratio (%)Bank nonperforming loans to total gross loans (%)Domestic credit to the private sector (% of GDP)Real interest rate (%)Interest rate spread (percentage points)
Infrastructure
Air transport (thousands registered carrier departures worldwide)Port container traffic (thousand TEU)Electric power consumption (kWh per capita)Power outages in firms in a typical month (number)Mobile-cellular telephone subscriptions (per 100 people)Individuals using the Internet (%)
Sub-Saharan Africa Lower middle income
Côte d’lvoire
2005 2013 2013
Lower
middle-
income
groupCountry data
17.4 20.3 2,5616.7 8.0 1,0144.1 4.0 5.3
920 1,450 2,074–0.2 2.8 5.822.6 22.3 17.022.8 22.3 32.114.5 12.7 17.154.6 55.5 51.1
3.9 2.6527.5 494.049.8 45.4 27.143.1 45.6 31.2
.. 147
45 7 2211 4 7
270 270 31523 25 25
2.2 2.2 2.9.. 8.8 15.9.. .... .. 1.1
.. .... .... .... .... .... ..
311 2,760 402,6682.0 1.2 2.1
11.8 17.0 25.59.2 11.0 18.8
.. .. ..
14.6 23.9 47.1
.. .. 10.3
.. .. 4.513.2 18.4 41.5
.. ..
.. .. 7.1 .. 5 2,437
710 745 62,268181 212 736
.. ..13.5 95.4 85.2
1.0 2.6 21.2

65The Little Data Book on Private Sector Development 2015
Economic and social context
Population (millions)Labor force (millions)Unemployment rate (% of labor force)GNI per capita, World Bank Atlas method ($)GDP growth, 2000–05 and 2006–13 (average annual %)Agriculture value added (% of GDP)Industry value added (% of GDP) Manufacturing value added (% of GDP)Services value added (% of GDP)Inflation (annual % change in CPI)Exchange rate (local currency units per $)Exports of goods and services (% of GDP)Imports of goods and services (% of GDP)
Business environment
Ease of doing business (ranking 1–189; 1=best)Time to start a business (days)Procedures to start a business (number)Time to prepare, file, and pay taxes (hours)Time to export (days)Time to resolve insolvency (years)Profit tax (% of commercial profits)New businesses registered (thousands)New business density (new regis. per 1,000 working-age pop.)Enterprise surveys
Time spent dealing w/req. of gov't. reg. (% of sr. mgt. time) Firms expected to give gifts in meetings with tax officials (%) Firms competing against unregistered firms (%) Firms using banks to finance working capital (% of firms) Delay in obtaining an electrical connection (days) Internationally recognized quality certification (% of firms)
Private sector investment
Invest. in infra. w/privt. part., 2000–05 and 2006–13 ($ millions)Private foreign direct investment, net (% of GDP)Gross fixed capital formation (% of GDP)Gross fixed private capital formation (% of GDP)
Finance and banking
Government debt (% of GDP)Total financial system deposits (% of GDP)Bank capital to asset ratio (%)Bank nonperforming loans to total gross loans (%)Domestic credit to the private sector (% of GDP)Real interest rate (%)Interest rate spread (percentage points)
Infrastructure
Air transport (thousands registered carrier departures worldwide)Port container traffic (thousand TEU)Electric power consumption (kWh per capita)Power outages in firms in a typical month (number)Mobile-cellular telephone subscriptions (per 100 people)Individuals using the Internet (%)
High income
Croatia
2005 2013 2013
High-
income
groupCountry data
4.4 4.3 1,3062.0 1.9 646
12.6 17.7 7.79,870 13,420 39,812
4.6 –1.4 0.95.0 4.3 1.5
29.0 27.2 24.8
15.6 14.0 15.0
66.0 68.6 73.7
3.3 2.25.9 5.7
39.3 42.9 30.045.4 42.5 29.6
.. 65
29 15 1511 7 6
232 208 16626 16 123.1 3.1 2.0
.. 0.0 14.18.4 8.1
2.8 2.8 7.5
2.0 19.6
20.1 0.031.7 48.245.9 38.315.2 42.417.4 24.1
.. .. ..
3.9 1.0 2.025.4 19.3 20.319.9 16.0 ..
.. .. 65.9
53.1 61.7 90.310.1 13.9 8.26.2 15.4 3.2
51.9 76.7 150.97.5 8.39.5 7.7 ..
22 24 20,86894 168 321,602
3,476 3,901 8,906
0.5 1.083.2 114.5 121.033.1 66.7 78.2
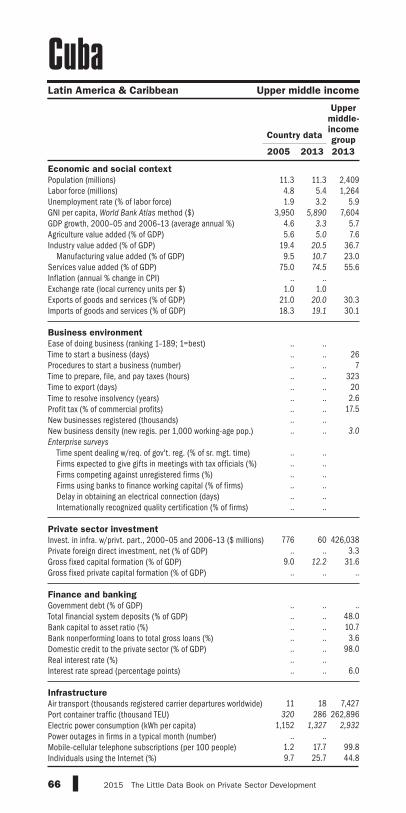
66 2015 The Little Data Book on Private Sector Development
Economic and social context
Population (millions)Labor force (millions)Unemployment rate (% of labor force)GNI per capita, World Bank Atlas method ($)GDP growth, 2000–05 and 2006–13 (average annual %)Agriculture value added (% of GDP)Industry value added (% of GDP) Manufacturing value added (% of GDP)Services value added (% of GDP)Inflation (annual % change in CPI)Exchange rate (local currency units per $)Exports of goods and services (% of GDP)Imports of goods and services (% of GDP)
Business environment
Ease of doing business (ranking 1–189; 1=best)Time to start a business (days)Procedures to start a business (number)Time to prepare, file, and pay taxes (hours)Time to export (days)Time to resolve insolvency (years)Profit tax (% of commercial profits)New businesses registered (thousands)New business density (new regis. per 1,000 working-age pop.)Enterprise surveys
Time spent dealing w/req. of gov't. reg. (% of sr. mgt. time) Firms expected to give gifts in meetings with tax officials (%) Firms competing against unregistered firms (%) Firms using banks to finance working capital (% of firms) Delay in obtaining an electrical connection (days) Internationally recognized quality certification (% of firms)
Private sector investment
Invest. in infra. w/privt. part., 2000–05 and 2006–13 ($ millions)Private foreign direct investment, net (% of GDP)Gross fixed capital formation (% of GDP)Gross fixed private capital formation (% of GDP)
Finance and banking
Government debt (% of GDP)Total financial system deposits (% of GDP)Bank capital to asset ratio (%)Bank nonperforming loans to total gross loans (%)Domestic credit to the private sector (% of GDP)Real interest rate (%)Interest rate spread (percentage points)
Infrastructure
Air transport (thousands registered carrier departures worldwide)Port container traffic (thousand TEU)Electric power consumption (kWh per capita)Power outages in firms in a typical month (number)Mobile-cellular telephone subscriptions (per 100 people)Individuals using the Internet (%)
Latin America & Caribbean Upper middle income
Cuba
2005 2013 2013
Upper
middle-
income
groupCountry data
11.3 11.3 2,4094.8 5.4 1,2641.9 3.2 5.9
3,950 5,890 7,6044.6 3.3 5.75.6 5.0 7.6
19.4 20.5 36.79.5 10.7 23.0
75.0 74.5 55.6.. ..
1.0 1.021.0 20.0 30.318.3 19.1 30.1
.. .... .. 26.. .. 7.. .. 323.. .. 20.. .. 2.6.. .. 17.5.. .... .. 3.0
.. .... .... .... .... .... ..
776 60 426,038
.. .. 3.39.0 12.2 31.6
.. .. ..
.. .. .... .. 48.0.. .. 10.7.. .. 3.6.. .. 98.0.. .... .. 6.0
11 18 7,427
320 286 262,8961,152 1,327 2,932
.. ..1.2 17.7 99.89.7 25.7 44.8

67The Little Data Book on Private Sector Development 2015
Economic and social context
Population (millions)Labor force (millions)Unemployment rate (% of labor force)GNI per capita, World Bank Atlas method ($)GDP growth, 2000–05 and 2006–13 (average annual %)Agriculture value added (% of GDP)Industry value added (% of GDP) Manufacturing value added (% of GDP)Services value added (% of GDP)Inflation (annual % change in CPI)Exchange rate (local currency units per $)Exports of goods and services (% of GDP)Imports of goods and services (% of GDP)
Business environment
Ease of doing business (ranking 1–189; 1=best)Time to start a business (days)Procedures to start a business (number)Time to prepare, file, and pay taxes (hours)Time to export (days)Time to resolve insolvency (years)Profit tax (% of commercial profits)New businesses registered (thousands)New business density (new regis. per 1,000 working-age pop.)Enterprise surveys
Time spent dealing w/req. of gov't. reg. (% of sr. mgt. time) Firms expected to give gifts in meetings with tax officials (%) Firms competing against unregistered firms (%) Firms using banks to finance working capital (% of firms) Delay in obtaining an electrical connection (days) Internationally recognized quality certification (% of firms)
Private sector investment
Invest. in infra. w/privt. part., 2000–05 and 2006–13 ($ millions)Private foreign direct investment, net (% of GDP)Gross fixed capital formation (% of GDP)Gross fixed private capital formation (% of GDP)
Finance and banking
Government debt (% of GDP)Total financial system deposits (% of GDP)Bank capital to asset ratio (%)Bank nonperforming loans to total gross loans (%)Domestic credit to the private sector (% of GDP)Real interest rate (%)Interest rate spread (percentage points)
Infrastructure
Air transport (thousands registered carrier departures worldwide)Port container traffic (thousand TEU)Electric power consumption (kWh per capita)Power outages in firms in a typical month (number)Mobile-cellular telephone subscriptions (per 100 people)Individuals using the Internet (%)
High income
Curaçao
2005 2013 2013
High-
income
groupCountry data
0.14 0.15 1,306.. .. 646.. .. 7.7.. .. 39,812.. .. 0.9.. .. 1.5
.. .. 24.8
.. .. 15.0
.. .. 73.7
.. ..
.. ..
.. .. 30.0
.. .. 29.6
.. .... .. 15.. .. 6.. .. 166.. .. 12.. .. 2.0.. .. 14.1.. .... .. 7.5
.. .... .... .... .... .... ..
.. .. .... .. 2.0.. .. 20.3.. .. .. .. .. 65.9
.. .. 90.3
.. .. 8.2
.. .. 3.2
.. .. 150.9
.. ..
.. .. ..
.. .. 20,868.. .. 321,602.. .. 8,906
.. ..
.. 128.2 121.0
.. .. 78.2

68 2015 The Little Data Book on Private Sector Development
Economic and social context
Population (millions)Labor force (millions)Unemployment rate (% of labor force)GNI per capita, World Bank Atlas method ($)GDP growth, 2000–05 and 2006–13 (average annual %)Agriculture value added (% of GDP)Industry value added (% of GDP) Manufacturing value added (% of GDP)Services value added (% of GDP)Inflation (annual % change in CPI)Exchange rate (local currency units per $)Exports of goods and services (% of GDP)Imports of goods and services (% of GDP)
Business environment
Ease of doing business (ranking 1–189; 1=best)Time to start a business (days)Procedures to start a business (number)Time to prepare, file, and pay taxes (hours)Time to export (days)Time to resolve insolvency (years)Profit tax (% of commercial profits)New businesses registered (thousands)New business density (new regis. per 1,000 working-age pop.)Enterprise surveys
Time spent dealing w/req. of gov't. reg. (% of sr. mgt. time) Firms expected to give gifts in meetings with tax officials (%) Firms competing against unregistered firms (%) Firms using banks to finance working capital (% of firms) Delay in obtaining an electrical connection (days) Internationally recognized quality certification (% of firms)
Private sector investment
Invest. in infra. w/privt. part., 2000–05 and 2006–13 ($ millions)Private foreign direct investment, net (% of GDP)Gross fixed capital formation (% of GDP)Gross fixed private capital formation (% of GDP)
Finance and banking
Government debt (% of GDP)Total financial system deposits (% of GDP)Bank capital to asset ratio (%)Bank nonperforming loans to total gross loans (%)Domestic credit to the private sector (% of GDP)Real interest rate (%)Interest rate spread (percentage points)
Infrastructure
Air transport (thousands registered carrier departures worldwide)Port container traffic (thousand TEU)Electric power consumption (kWh per capita)Power outages in firms in a typical month (number)Mobile-cellular telephone subscriptions (per 100 people)Individuals using the Internet (%)
High income
Cyprus
2005 2013 2013
High-
income
groupCountry data
1.0 1.1 1,3060.52 0.60 646
5.3 15.8 7.721,490 25,210 39,812
3.1 0.1 0.92.8 .. 1.5
19.5 .. 24.8
8.8 .. 15.0
77.7 .. 73.7
2.6 –0.40.8 0.8
48.3 40.1 30.050.9 46.6 29.6
.. 64.. 8 15.. 6 6.. 147 166.. 7 12.. 1.5 2.0.. 9.6 14.1
14.5 18.0
20.2 22.5 7.5
.. .... .... .... .... .... ..
.. .. ..
6.8 2.8 2.019.3 18.4 20.3
.. .. ..
180.6 131.0 65.9
176.9 199.1 90.3.. 8.6 8.2.. 33.7 3.2
209.9 300.6 150.94.6 ..3.3 .. ..
17 12 20,868
377 277 321,6024,080 4,271 8,906
.. ..75.8 96.4 121.032.8 65.5 78.2

69The Little Data Book on Private Sector Development 2015
Economic and social context
Population (millions)Labor force (millions)Unemployment rate (% of labor force)GNI per capita, World Bank Atlas method ($)GDP growth, 2000–05 and 2006–13 (average annual %)Agriculture value added (% of GDP)Industry value added (% of GDP) Manufacturing value added (% of GDP)Services value added (% of GDP)Inflation (annual % change in CPI)Exchange rate (local currency units per $)Exports of goods and services (% of GDP)Imports of goods and services (% of GDP)
Business environment
Ease of doing business (ranking 1–189; 1=best)Time to start a business (days)Procedures to start a business (number)Time to prepare, file, and pay taxes (hours)Time to export (days)Time to resolve insolvency (years)Profit tax (% of commercial profits)New businesses registered (thousands)New business density (new regis. per 1,000 working-age pop.)Enterprise surveys
Time spent dealing w/req. of gov't. reg. (% of sr. mgt. time) Firms expected to give gifts in meetings with tax officials (%) Firms competing against unregistered firms (%) Firms using banks to finance working capital (% of firms) Delay in obtaining an electrical connection (days) Internationally recognized quality certification (% of firms)
Private sector investment
Invest. in infra. w/privt. part., 2000–05 and 2006–13 ($ millions)Private foreign direct investment, net (% of GDP)Gross fixed capital formation (% of GDP)Gross fixed private capital formation (% of GDP)
Finance and banking
Government debt (% of GDP)Total financial system deposits (% of GDP)Bank capital to asset ratio (%)Bank nonperforming loans to total gross loans (%)Domestic credit to the private sector (% of GDP)Real interest rate (%)Interest rate spread (percentage points)
Infrastructure
Air transport (thousands registered carrier departures worldwide)Port container traffic (thousand TEU)Electric power consumption (kWh per capita)Power outages in firms in a typical month (number)Mobile-cellular telephone subscriptions (per 100 people)Individuals using the Internet (%)
High income
Czech Republic
2005 2013 2013
High-
income
groupCountry data
10.2 10.5 1,3065.2 5.3 6467.9 6.9 7.7
12,380 18,970 39,8123.8 0.6 0.92.4 2.6 1.5
37.7 36.7 24.8
25.5 24.9 15.0
59.8 60.7 73.7
1.8 1.424.0 19.662.3 77.2 30.060.0 71.4 29.6
.. 44
40 19 1510 9 6
930 413 16617 17 12
9.2 2.1 2.0.. 7.6 14.1
14.1 21.6
1.9 3.0 7.5
1.9 13.9
36.0 0.4.. 36.0
28.2 45.515.4 57.815.9 40.9
.. .. ..
8.5 2.4 2.028.3 24.9 20.3
.. .. ..
21.1 40.8 65.9
45.7 66.9 90.35.0 7.5 8.23.9 5.2 3.2
33.8 55.4 150.95.7 3.24.6 4.1 ..
75 44 20,868
.. .. 321,6026,357 6,289 8,906
.. 0.4115.1 127.7 121.035.3 74.1 78.2
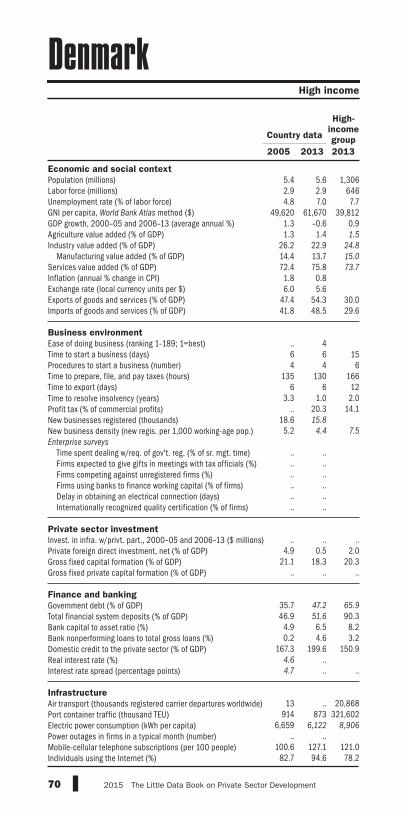
70 2015 The Little Data Book on Private Sector Development
Economic and social context
Population (millions)Labor force (millions)Unemployment rate (% of labor force)GNI per capita, World Bank Atlas method ($)GDP growth, 2000–05 and 2006–13 (average annual %)Agriculture value added (% of GDP)Industry value added (% of GDP) Manufacturing value added (% of GDP)Services value added (% of GDP)Inflation (annual % change in CPI)Exchange rate (local currency units per $)Exports of goods and services (% of GDP)Imports of goods and services (% of GDP)
Business environment
Ease of doing business (ranking 1–189; 1=best)Time to start a business (days)Procedures to start a business (number)Time to prepare, file, and pay taxes (hours)Time to export (days)Time to resolve insolvency (years)Profit tax (% of commercial profits)New businesses registered (thousands)New business density (new regis. per 1,000 working-age pop.)Enterprise surveys
Time spent dealing w/req. of gov't. reg. (% of sr. mgt. time) Firms expected to give gifts in meetings with tax officials (%) Firms competing against unregistered firms (%) Firms using banks to finance working capital (% of firms) Delay in obtaining an electrical connection (days) Internationally recognized quality certification (% of firms)
Private sector investment
Invest. in infra. w/privt. part., 2000–05 and 2006–13 ($ millions)Private foreign direct investment, net (% of GDP)Gross fixed capital formation (% of GDP)Gross fixed private capital formation (% of GDP)
Finance and banking
Government debt (% of GDP)Total financial system deposits (% of GDP)Bank capital to asset ratio (%)Bank nonperforming loans to total gross loans (%)Domestic credit to the private sector (% of GDP)Real interest rate (%)Interest rate spread (percentage points)
Infrastructure
Air transport (thousands registered carrier departures worldwide)Port container traffic (thousand TEU)Electric power consumption (kWh per capita)Power outages in firms in a typical month (number)Mobile-cellular telephone subscriptions (per 100 people)Individuals using the Internet (%)
High income
Denmark
2005 2013 2013
High-
income
groupCountry data
5.4 5.6 1,3062.9 2.9 6464.8 7.0 7.7
49,620 61,670 39,8121.3 –0.6 0.91.3 1.4 1.5
26.2 22.9 24.8
14.4 13.7 15.0
72.4 75.8 73.7
1.8 0.86.0 5.6
47.4 54.3 30.041.8 48.5 29.6
.. 46 6 154 4 6
135 130 1666 6 12
3.3 1.0 2.0.. 20.3 14.1
18.6 15.8
5.2 4.4 7.5
.. .... .... .... .... .... ..
.. .. ..
4.9 0.5 2.021.1 18.3 20.3
.. .. ..
35.7 47.2 65.9
46.9 51.6 90.34.9 6.5 8.20.2 4.6 3.2
167.3 199.6 150.94.6 ..4.7 .. ..
13 .. 20,868
914 873 321,6026,659 6,122 8,906
.. ..100.6 127.1 121.0
82.7 94.6 78.2

71The Little Data Book on Private Sector Development 2015
Economic and social context
Population (millions)Labor force (millions)Unemployment rate (% of labor force)GNI per capita, World Bank Atlas method ($)GDP growth, 2000–05 and 2006–13 (average annual %)Agriculture value added (% of GDP)Industry value added (% of GDP) Manufacturing value added (% of GDP)Services value added (% of GDP)Inflation (annual % change in CPI)Exchange rate (local currency units per $)Exports of goods and services (% of GDP)Imports of goods and services (% of GDP)
Business environment
Ease of doing business (ranking 1–189; 1=best)Time to start a business (days)Procedures to start a business (number)Time to prepare, file, and pay taxes (hours)Time to export (days)Time to resolve insolvency (years)Profit tax (% of commercial profits)New businesses registered (thousands)New business density (new regis. per 1,000 working-age pop.)Enterprise surveys
Time spent dealing w/req. of gov't. reg. (% of sr. mgt. time) Firms expected to give gifts in meetings with tax officials (%) Firms competing against unregistered firms (%) Firms using banks to finance working capital (% of firms) Delay in obtaining an electrical connection (days) Internationally recognized quality certification (% of firms)
Private sector investment
Invest. in infra. w/privt. part., 2000–05 and 2006–13 ($ millions)Private foreign direct investment, net (% of GDP)Gross fixed capital formation (% of GDP)Gross fixed private capital formation (% of GDP)
Finance and banking
Government debt (% of GDP)Total financial system deposits (% of GDP)Bank capital to asset ratio (%)Bank nonperforming loans to total gross loans (%)Domestic credit to the private sector (% of GDP)Real interest rate (%)Interest rate spread (percentage points)
Infrastructure
Air transport (thousands registered carrier departures worldwide)Port container traffic (thousand TEU)Electric power consumption (kWh per capita)Power outages in firms in a typical month (number)Mobile-cellular telephone subscriptions (per 100 people)Individuals using the Internet (%)
Middle East & North Africa Lower middle income
Djibouti
2005 2013 2013
Lower
middle-
income
groupCountry data
0.78 0.87 2,5610.24 0.30 1,014
.. .. 5.31,030 .. 2,074
3.0 4.8 5.83.5 .. 17.0
16.6 .. 32.12.6 .. 17.1
79.9 .. 51.13.1 2.4
177.7 177.740.6 .. 27.151.0 .. 31.2
.. 155
44 14 2211 7 766 82 31527 20 25
2.3 2.3 2.9.. 17.7 15.9.. .... .. 1.1
.. 5.3.. 3.4.. 22.2.. 25.3.. 34.1.. 17.3
180 396 402,6683.1 19.6 2.1
19.0 .. 25.59.7 .. 18.8
.. .. ..
67.0 75.6 47.1
.. .. 10.3
.. .. 4.520.1 31.1 41.5
7.8 6.2
10.3 9.1 7.1
.. .. 2,437
295 736 62,268.. .. 736
.. 1.65.7 28.0 85.21.0 9.5 21.2

72 2015 The Little Data Book on Private Sector Development
Economic and social context
Population (millions)Labor force (millions)Unemployment rate (% of labor force)GNI per capita, World Bank Atlas method ($)GDP growth, 2000–05 and 2006–13 (average annual %)Agriculture value added (% of GDP)Industry value added (% of GDP) Manufacturing value added (% of GDP)Services value added (% of GDP)Inflation (annual % change in CPI)Exchange rate (local currency units per $)Exports of goods and services (% of GDP)Imports of goods and services (% of GDP)
Business environment
Ease of doing business (ranking 1–189; 1=best)Time to start a business (days)Procedures to start a business (number)Time to prepare, file, and pay taxes (hours)Time to export (days)Time to resolve insolvency (years)Profit tax (% of commercial profits)New businesses registered (thousands)New business density (new regis. per 1,000 working-age pop.)Enterprise surveys
Time spent dealing w/req. of gov't. reg. (% of sr. mgt. time) Firms expected to give gifts in meetings with tax officials (%) Firms competing against unregistered firms (%) Firms using banks to finance working capital (% of firms) Delay in obtaining an electrical connection (days) Internationally recognized quality certification (% of firms)
Private sector investment
Invest. in infra. w/privt. part., 2000–05 and 2006–13 ($ millions)Private foreign direct investment, net (% of GDP)Gross fixed capital formation (% of GDP)Gross fixed private capital formation (% of GDP)
Finance and banking
Government debt (% of GDP)Total financial system deposits (% of GDP)Bank capital to asset ratio (%)Bank nonperforming loans to total gross loans (%)Domestic credit to the private sector (% of GDP)Real interest rate (%)Interest rate spread (percentage points)
Infrastructure
Air transport (thousands registered carrier departures worldwide)Port container traffic (thousand TEU)Electric power consumption (kWh per capita)Power outages in firms in a typical month (number)Mobile-cellular telephone subscriptions (per 100 people)Individuals using the Internet (%)
Latin America & Caribbean Upper middle income
Dominica
2005 2013 2013
Upper
middle-
income
groupCountry data
0.07 0.07 2,409.. .. 1,264.. .. 5.9
5,140 6,930 7,6042.3 1.2 5.7
13.3 17.2 7.615.1 14.0 36.74.6 3.5 23.0
71.6 68.8 55.61.7 0.02.7 2.7
34.9 32.8 30.353.0 48.2 30.1
.. 97
14 12 265 5 7
147 117 32316 13 20
4.0 4.0 2.6.. 26.1 17.5
0.2 0.2
3.5 3.3 3.0
.. 2.0
.. 5.6
.. 10.7
.. 37.9
.. 5.6
.. 1.3
.. 5 426,038
5.2 3.5 3.319.8 12.0 31.6
.. .. ..
.. .. ..
71.5 87.5 48.0.. .. 10.7.. .. 3.6
47.8 55.6 98.011.1 7.76.8 6.0 6.0
.. .. 7,427.. .. 262,896.. .. 2,932
.. 2.8
73.7 130.0 99.838.5 59.0 44.8

73The Little Data Book on Private Sector Development 2015
Economic and social context
Population (millions)Labor force (millions)Unemployment rate (% of labor force)GNI per capita, World Bank Atlas method ($)GDP growth, 2000–05 and 2006–13 (average annual %)Agriculture value added (% of GDP)Industry value added (% of GDP) Manufacturing value added (% of GDP)Services value added (% of GDP)Inflation (annual % change in CPI)Exchange rate (local currency units per $)Exports of goods and services (% of GDP)Imports of goods and services (% of GDP)
Business environment
Ease of doing business (ranking 1–189; 1=best)Time to start a business (days)Procedures to start a business (number)Time to prepare, file, and pay taxes (hours)Time to export (days)Time to resolve insolvency (years)Profit tax (% of commercial profits)New businesses registered (thousands)New business density (new regis. per 1,000 working-age pop.)Enterprise surveys
Time spent dealing w/req. of gov't. reg. (% of sr. mgt. time) Firms expected to give gifts in meetings with tax officials (%) Firms competing against unregistered firms (%) Firms using banks to finance working capital (% of firms) Delay in obtaining an electrical connection (days) Internationally recognized quality certification (% of firms)
Private sector investment
Invest. in infra. w/privt. part., 2000–05 and 2006–13 ($ millions)Private foreign direct investment, net (% of GDP)Gross fixed capital formation (% of GDP)Gross fixed private capital formation (% of GDP)
Finance and banking
Government debt (% of GDP)Total financial system deposits (% of GDP)Bank capital to asset ratio (%)Bank nonperforming loans to total gross loans (%)Domestic credit to the private sector (% of GDP)Real interest rate (%)Interest rate spread (percentage points)
Infrastructure
Air transport (thousands registered carrier departures worldwide)Port container traffic (thousand TEU)Electric power consumption (kWh per capita)Power outages in firms in a typical month (number)Mobile-cellular telephone subscriptions (per 100 people)Individuals using the Internet (%)
Latin America & Caribbean Upper middle income
Dominican Republic
2005 2013 2013
Upper
middle-
income
groupCountry data
9.3 10.4 2,4094.0 4.7 1,264
18.0 14.9 5.92,880 5,770 7,604
3.1 4.2 5.77.5 6.3 7.6
29.6 26.9 36.722.9 15.9 23.063.0 66.7 55.6
4.2 4.830.0 41.830.0 25.5 30.335.5 31.2 30.1
.. 84
76 20 269 7 7
232 324 32317 8 20
3.5 3.5 2.6.. 23.7 17.5.. 6.8
.. 1.0 3.0
.. 11.7
.. 15.3
.. 75.8
.. 72.4
.. 24.1
.. 11.8
2,694 2,200 426,038
3.3 2.6 3.316.4 21.5 31.6
.. .. ..
.. .. ..
19.8 22.5 48.09.5 9.3 10.75.9 2.3 3.6
20.9 24.0 98.020.9 10.210.2 7.6 6.0
.. 2 7,427
598 1,708 262,896737 893 2,932
.. 17.7
38.8 88.4 99.811.5 45.9 44.8

74 2015 The Little Data Book on Private Sector Development
Economic and social context
Population (millions)Labor force (millions)Unemployment rate (% of labor force)GNI per capita, World Bank Atlas method ($)GDP growth, 2000–05 and 2006–13 (average annual %)Agriculture value added (% of GDP)Industry value added (% of GDP) Manufacturing value added (% of GDP)Services value added (% of GDP)Inflation (annual % change in CPI)Exchange rate (local currency units per $)Exports of goods and services (% of GDP)Imports of goods and services (% of GDP)
Business environment
Ease of doing business (ranking 1–189; 1=best)Time to start a business (days)Procedures to start a business (number)Time to prepare, file, and pay taxes (hours)Time to export (days)Time to resolve insolvency (years)Profit tax (% of commercial profits)New businesses registered (thousands)New business density (new regis. per 1,000 working-age pop.)Enterprise surveys
Time spent dealing w/req. of gov't. reg. (% of sr. mgt. time) Firms expected to give gifts in meetings with tax officials (%) Firms competing against unregistered firms (%) Firms using banks to finance working capital (% of firms) Delay in obtaining an electrical connection (days) Internationally recognized quality certification (% of firms)
Private sector investment
Invest. in infra. w/privt. part., 2000–05 and 2006–13 ($ millions)Private foreign direct investment, net (% of GDP)Gross fixed capital formation (% of GDP)Gross fixed private capital formation (% of GDP)
Finance and banking
Government debt (% of GDP)Total financial system deposits (% of GDP)Bank capital to asset ratio (%)Bank nonperforming loans to total gross loans (%)Domestic credit to the private sector (% of GDP)Real interest rate (%)Interest rate spread (percentage points)
Infrastructure
Air transport (thousands registered carrier departures worldwide)Port container traffic (thousand TEU)Electric power consumption (kWh per capita)Power outages in firms in a typical month (number)Mobile-cellular telephone subscriptions (per 100 people)Individuals using the Internet (%)
Latin America & Caribbean Upper middle income
Ecuador
2005 2013 2013
Upper
middle-
income
groupCountry data
13.8 15.7 2,4096.5 7.6 1,2646.6 4.2 5.9
2,890 5,760 7,6044.8 4.4 5.7
10.0 9.4 7.633.4 38.7 36.715.0 13.0 23.056.6 52.0 55.6
2.4 2.71.0 1.0
27.6 29.2 30.328.5 31.6 30.1
.. 115
69 56 2614 13 7
600 654 32322 19 20
5.3 5.3 2.6.. 16.1 17.5.. .... .. 3.0
17.3 22.5
11.3 0.4
65.4 65.7
41.9 42.3
23.3 10.7
18.2 9.7
1,865 3,985 426,038
1.2 0.8 3.320.4 27.9 31.6
.. .. ..
.. .. ..
20.9 30.1 48.08.5 8.6 10.75.5 3.6 3.6
20.8 26.7 98.01.8 ..6.0 .. 6.0
30 72 7,427
633 1,205 262,896760 1,192 2,932
1.6 1.0
45.3 111.5 99.86.0 40.4 44.8
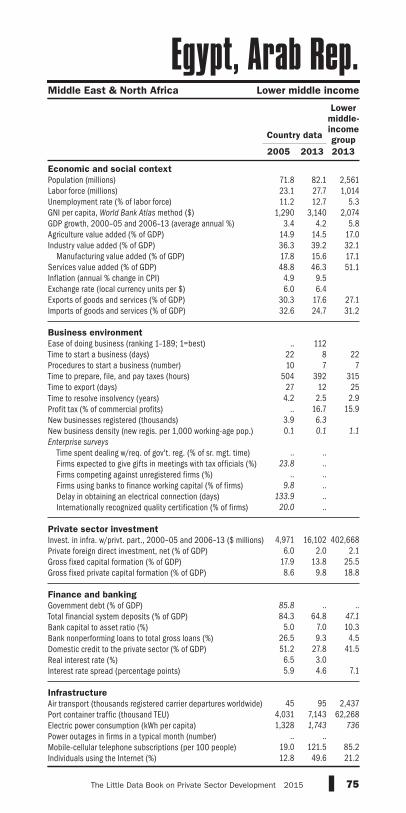
75The Little Data Book on Private Sector Development 2015
Economic and social context
Population (millions)Labor force (millions)Unemployment rate (% of labor force)GNI per capita, World Bank Atlas method ($)GDP growth, 2000–05 and 2006–13 (average annual %)Agriculture value added (% of GDP)Industry value added (% of GDP) Manufacturing value added (% of GDP)Services value added (% of GDP)Inflation (annual % change in CPI)Exchange rate (local currency units per $)Exports of goods and services (% of GDP)Imports of goods and services (% of GDP)
Business environment
Ease of doing business (ranking 1–189; 1=best)Time to start a business (days)Procedures to start a business (number)Time to prepare, file, and pay taxes (hours)Time to export (days)Time to resolve insolvency (years)Profit tax (% of commercial profits)New businesses registered (thousands)New business density (new regis. per 1,000 working-age pop.)Enterprise surveys
Time spent dealing w/req. of gov't. reg. (% of sr. mgt. time) Firms expected to give gifts in meetings with tax officials (%) Firms competing against unregistered firms (%) Firms using banks to finance working capital (% of firms) Delay in obtaining an electrical connection (days) Internationally recognized quality certification (% of firms)
Private sector investment
Invest. in infra. w/privt. part., 2000–05 and 2006–13 ($ millions)Private foreign direct investment, net (% of GDP)Gross fixed capital formation (% of GDP)Gross fixed private capital formation (% of GDP)
Finance and banking
Government debt (% of GDP)Total financial system deposits (% of GDP)Bank capital to asset ratio (%)Bank nonperforming loans to total gross loans (%)Domestic credit to the private sector (% of GDP)Real interest rate (%)Interest rate spread (percentage points)
Infrastructure
Air transport (thousands registered carrier departures worldwide)Port container traffic (thousand TEU)Electric power consumption (kWh per capita)Power outages in firms in a typical month (number)Mobile-cellular telephone subscriptions (per 100 people)Individuals using the Internet (%)
Middle East & North Africa Lower middle income
Egypt, Arab Rep.
2005 2013 2013
Lower
middle-
income
groupCountry data
71.8 82.1 2,56123.1 27.7 1,01411.2 12.7 5.3
1,290 3,140 2,0743.4 4.2 5.8
14.9 14.5 17.036.3 39.2 32.117.8 15.6 17.148.8 46.3 51.1
4.9 9.56.0 6.4
30.3 17.6 27.132.6 24.7 31.2
.. 112
22 8 2210 7 7
504 392 31527 12 25
4.2 2.5 2.9.. 16.7 15.9
3.9 6.3
0.1 0.1 1.1
.. ..
23.8 .... ..
9.8 ..133.9 ..
20.0 ..
4,971 16,102 402,668
6.0 2.0 2.117.9 13.8 25.58.6 9.8 18.8
85.8 .. ..84.3 64.8 47.1
5.0 7.0 10.326.5 9.3 4.551.2 27.8 41.56.5 3.05.9 4.6 7.1
45 95 2,437
4,031 7,143 62,2681,328 1,743 736
.. ..19.0 121.5 85.212.8 49.6 21.2

76 2015 The Little Data Book on Private Sector Development
Economic and social context
Population (millions)Labor force (millions)Unemployment rate (% of labor force)GNI per capita, World Bank Atlas method ($)GDP growth, 2000–05 and 2006–13 (average annual %)Agriculture value added (% of GDP)Industry value added (% of GDP) Manufacturing value added (% of GDP)Services value added (% of GDP)Inflation (annual % change in CPI)Exchange rate (local currency units per $)Exports of goods and services (% of GDP)Imports of goods and services (% of GDP)
Business environment
Ease of doing business (ranking 1–189; 1=best)Time to start a business (days)Procedures to start a business (number)Time to prepare, file, and pay taxes (hours)Time to export (days)Time to resolve insolvency (years)Profit tax (% of commercial profits)New businesses registered (thousands)New business density (new regis. per 1,000 working-age pop.)Enterprise surveys
Time spent dealing w/req. of gov't. reg. (% of sr. mgt. time) Firms expected to give gifts in meetings with tax officials (%) Firms competing against unregistered firms (%) Firms using banks to finance working capital (% of firms) Delay in obtaining an electrical connection (days) Internationally recognized quality certification (% of firms)
Private sector investment
Invest. in infra. w/privt. part., 2000–05 and 2006–13 ($ millions)Private foreign direct investment, net (% of GDP)Gross fixed capital formation (% of GDP)Gross fixed private capital formation (% of GDP)
Finance and banking
Government debt (% of GDP)Total financial system deposits (% of GDP)Bank capital to asset ratio (%)Bank nonperforming loans to total gross loans (%)Domestic credit to the private sector (% of GDP)Real interest rate (%)Interest rate spread (percentage points)
Infrastructure
Air transport (thousands registered carrier departures worldwide)Port container traffic (thousand TEU)Electric power consumption (kWh per capita)Power outages in firms in a typical month (number)Mobile-cellular telephone subscriptions (per 100 people)Individuals using the Internet (%)
Latin America & Caribbean Lower middle income
El Salvador
2005 2013 2013
Lower
middle-
income
groupCountry data
6.1 6.3 2,5612.3 2.8 1,0147.2 6.3 5.3
2,810 3,720 2,0742.3 1.0 5.8
10.6 10.8 17.029.7 27.0 32.123.1 20.2 17.159.7 62.2 51.1
4.7 0.81.0 1.0
25.6 26.4 27.144.2 45.8 31.2
.. 109
40 17 2212 8 7
320 320 31522 13 254.0 3.5 2.9
.. 20.1 15.91.7 1.9
0.5 0.5 1.1
9.2 19.6
2.6 0.3
73.8 65.2
39.0 44.5
22.1 28.6
10.9 14.5
1,196 1,478 402,668
3.0 0.8 2.115.3 15.1 25.512.9 12.5 18.8
48.3 47.8 ..41.0 41.3 47.1
11.1 14.3 10.31.9 2.3 4.5
42.9 42.7 41.5.. .... .. 7.1
24 31 2,437
144 181 62,268753 830 736
1.6 1.2
39.7 136.2 85.24.2 23.1 21.2
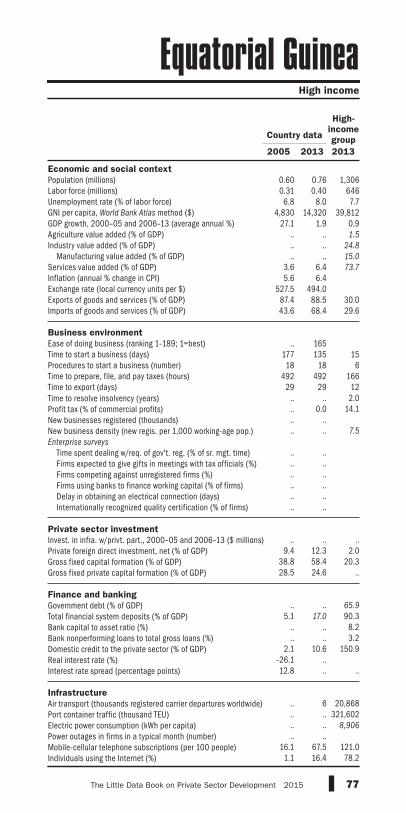
77The Little Data Book on Private Sector Development 2015
Economic and social context
Population (millions)Labor force (millions)Unemployment rate (% of labor force)GNI per capita, World Bank Atlas method ($)GDP growth, 2000–05 and 2006–13 (average annual %)Agriculture value added (% of GDP)Industry value added (% of GDP) Manufacturing value added (% of GDP)Services value added (% of GDP)Inflation (annual % change in CPI)Exchange rate (local currency units per $)Exports of goods and services (% of GDP)Imports of goods and services (% of GDP)
Business environment
Ease of doing business (ranking 1–189; 1=best)Time to start a business (days)Procedures to start a business (number)Time to prepare, file, and pay taxes (hours)Time to export (days)Time to resolve insolvency (years)Profit tax (% of commercial profits)New businesses registered (thousands)New business density (new regis. per 1,000 working-age pop.)Enterprise surveys
Time spent dealing w/req. of gov't. reg. (% of sr. mgt. time) Firms expected to give gifts in meetings with tax officials (%) Firms competing against unregistered firms (%) Firms using banks to finance working capital (% of firms) Delay in obtaining an electrical connection (days) Internationally recognized quality certification (% of firms)
Private sector investment
Invest. in infra. w/privt. part., 2000–05 and 2006–13 ($ millions)Private foreign direct investment, net (% of GDP)Gross fixed capital formation (% of GDP)Gross fixed private capital formation (% of GDP)
Finance and banking
Government debt (% of GDP)Total financial system deposits (% of GDP)Bank capital to asset ratio (%)Bank nonperforming loans to total gross loans (%)Domestic credit to the private sector (% of GDP)Real interest rate (%)Interest rate spread (percentage points)
Infrastructure
Air transport (thousands registered carrier departures worldwide)Port container traffic (thousand TEU)Electric power consumption (kWh per capita)Power outages in firms in a typical month (number)Mobile-cellular telephone subscriptions (per 100 people)Individuals using the Internet (%)
High income
Equatorial Guinea
2005 2013 2013
High-
income
groupCountry data
0.60 0.76 1,3060.31 0.40 6466.8 8.0 7.7
4,830 14,320 39,81227.1 1.9 0.9
.. .. 1.5
.. .. 24.8
.. .. 15.0
3.6 6.4 73.7
5.6 6.4527.5 494.0
87.4 88.5 30.043.6 68.4 29.6
.. 165
177 135 1518 18 6
492 492 16629 29 12
.. .. 2.0
.. 0.0 14.1
.. ..
.. .. 7.5
.. .... .... .... .... .... ..
.. .. ..
9.4 12.3 2.038.8 58.4 20.328.5 24.6 ..
.. .. 65.9
5.1 17.0 90.3.. .. 8.2.. .. 3.2
2.1 10.6 150.9–26.1 ..12.8 .. ..
.. 6 20,868.. .. 321,602.. .. 8,906
.. ..16.1 67.5 121.0
1.1 16.4 78.2

78 2015 The Little Data Book on Private Sector Development
Economic and social context
Population (millions)Labor force (millions)Unemployment rate (% of labor force)GNI per capita, World Bank Atlas method ($)GDP growth, 2000–05 and 2006–13 (average annual %)Agriculture value added (% of GDP)Industry value added (% of GDP) Manufacturing value added (% of GDP)Services value added (% of GDP)Inflation (annual % change in CPI)Exchange rate (local currency units per $)Exports of goods and services (% of GDP)Imports of goods and services (% of GDP)
Business environment
Ease of doing business (ranking 1–189; 1=best)Time to start a business (days)Procedures to start a business (number)Time to prepare, file, and pay taxes (hours)Time to export (days)Time to resolve insolvency (years)Profit tax (% of commercial profits)New businesses registered (thousands)New business density (new regis. per 1,000 working-age pop.)Enterprise surveys
Time spent dealing w/req. of gov't. reg. (% of sr. mgt. time) Firms expected to give gifts in meetings with tax officials (%) Firms competing against unregistered firms (%) Firms using banks to finance working capital (% of firms) Delay in obtaining an electrical connection (days) Internationally recognized quality certification (% of firms)
Private sector investment
Invest. in infra. w/privt. part., 2000–05 and 2006–13 ($ millions)Private foreign direct investment, net (% of GDP)Gross fixed capital formation (% of GDP)Gross fixed private capital formation (% of GDP)
Finance and banking
Government debt (% of GDP)Total financial system deposits (% of GDP)Bank capital to asset ratio (%)Bank nonperforming loans to total gross loans (%)Domestic credit to the private sector (% of GDP)Real interest rate (%)Interest rate spread (percentage points)
Infrastructure
Air transport (thousands registered carrier departures worldwide)Port container traffic (thousand TEU)Electric power consumption (kWh per capita)Power outages in firms in a typical month (number)Mobile-cellular telephone subscriptions (per 100 people)Individuals using the Internet (%)
Sub-Saharan Africa Low income
Eritrea
2005 2013 2013
Low-
income
groupCountry data
4.9 6.3 8492.3 3.1 3917.5 7.2 5.1
230 490 7281.9 2.3 6.0
24.2 14.5 26.221.9 22.4 23.4
7.3 5.7 12.153.9 63.0 50.6
.. ..15.4 15.46.2 14.4 22.0
54.9 23.2 35.9
.. 189
76 84 2913 13 8
216 216 26559 50 35
.. .. 3.4
.. 9.2 19.2
.. ..
.. .. 0.3
.. .... .... .... .... .... ..
40 .. 30,9340.1 1.3 3.8
20.3 10.0 25.22.5 1.9 ..
.. .. ..
107.3 89.7 37.6.. .. .... .. ..
27.6 14.0 27.6.. .... .. 10.7
.. .. 385.. .. ..
50 49 219
.. ..0.8 5.6 54.60.4 0.9 7.1
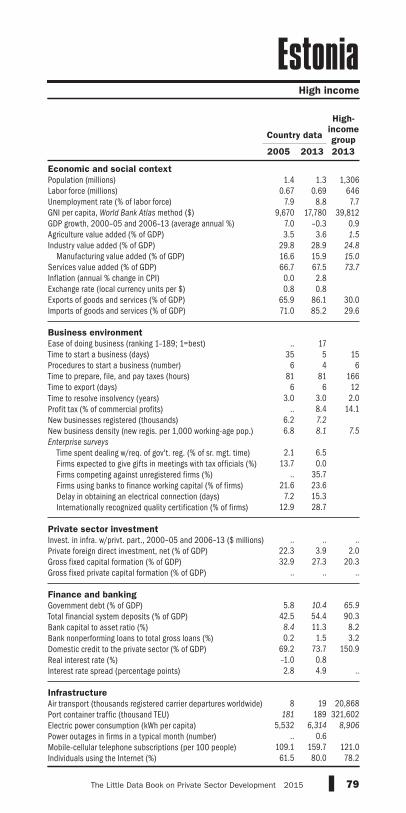
79The Little Data Book on Private Sector Development 2015
Economic and social context
Population (millions)Labor force (millions)Unemployment rate (% of labor force)GNI per capita, World Bank Atlas method ($)GDP growth, 2000–05 and 2006–13 (average annual %)Agriculture value added (% of GDP)Industry value added (% of GDP) Manufacturing value added (% of GDP)Services value added (% of GDP)Inflation (annual % change in CPI)Exchange rate (local currency units per $)Exports of goods and services (% of GDP)Imports of goods and services (% of GDP)
Business environment
Ease of doing business (ranking 1–189; 1=best)Time to start a business (days)Procedures to start a business (number)Time to prepare, file, and pay taxes (hours)Time to export (days)Time to resolve insolvency (years)Profit tax (% of commercial profits)New businesses registered (thousands)New business density (new regis. per 1,000 working-age pop.)Enterprise surveys
Time spent dealing w/req. of gov't. reg. (% of sr. mgt. time) Firms expected to give gifts in meetings with tax officials (%) Firms competing against unregistered firms (%) Firms using banks to finance working capital (% of firms) Delay in obtaining an electrical connection (days) Internationally recognized quality certification (% of firms)
Private sector investment
Invest. in infra. w/privt. part., 2000–05 and 2006–13 ($ millions)Private foreign direct investment, net (% of GDP)Gross fixed capital formation (% of GDP)Gross fixed private capital formation (% of GDP)
Finance and banking
Government debt (% of GDP)Total financial system deposits (% of GDP)Bank capital to asset ratio (%)Bank nonperforming loans to total gross loans (%)Domestic credit to the private sector (% of GDP)Real interest rate (%)Interest rate spread (percentage points)
Infrastructure
Air transport (thousands registered carrier departures worldwide)Port container traffic (thousand TEU)Electric power consumption (kWh per capita)Power outages in firms in a typical month (number)Mobile-cellular telephone subscriptions (per 100 people)Individuals using the Internet (%)
High income
Estonia
2005 2013 2013
High-
income
groupCountry data
1.4 1.3 1,3060.67 0.69 646
7.9 8.8 7.79,670 17,780 39,812
7.0 –0.3 0.93.5 3.6 1.5
29.8 28.9 24.8
16.6 15.9 15.0
66.7 67.5 73.7
0.0 2.80.8 0.8
65.9 86.1 30.071.0 85.2 29.6
.. 17
35 5 156 4 6
81 81 1666 6 12
3.0 3.0 2.0.. 8.4 14.1
6.2 7.2
6.8 8.1 7.5
2.1 6.5
13.7 0.0.. 35.7
21.6 23.67.2 15.3
12.9 28.7
.. .. ..
22.3 3.9 2.032.9 27.3 20.3
.. .. ..
5.8 10.4 65.9
42.5 54.4 90.38.4 11.3 8.20.2 1.5 3.2
69.2 73.7 150.9–1.0 0.82.8 4.9 ..
8 19 20,868
181 189 321,6025,532 6,314 8,906
.. 0.6109.1 159.7 121.061.5 80.0 78.2
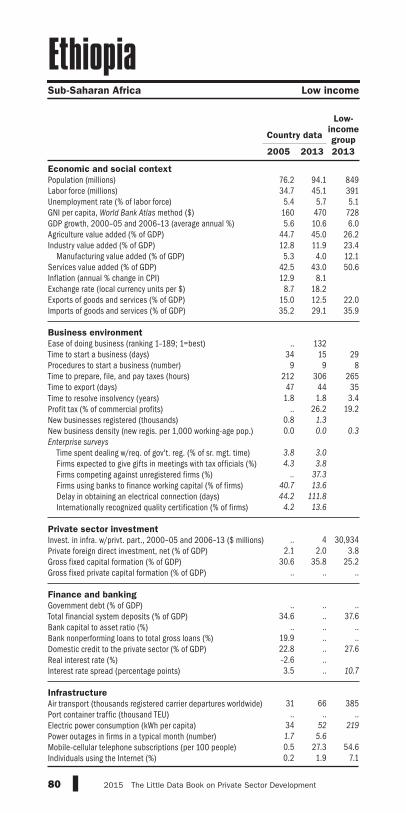
80 2015 The Little Data Book on Private Sector Development
Economic and social context
Population (millions)Labor force (millions)Unemployment rate (% of labor force)GNI per capita, World Bank Atlas method ($)GDP growth, 2000–05 and 2006–13 (average annual %)Agriculture value added (% of GDP)Industry value added (% of GDP) Manufacturing value added (% of GDP)Services value added (% of GDP)Inflation (annual % change in CPI)Exchange rate (local currency units per $)Exports of goods and services (% of GDP)Imports of goods and services (% of GDP)
Business environment
Ease of doing business (ranking 1–189; 1=best)Time to start a business (days)Procedures to start a business (number)Time to prepare, file, and pay taxes (hours)Time to export (days)Time to resolve insolvency (years)Profit tax (% of commercial profits)New businesses registered (thousands)New business density (new regis. per 1,000 working-age pop.)Enterprise surveys
Time spent dealing w/req. of gov't. reg. (% of sr. mgt. time) Firms expected to give gifts in meetings with tax officials (%) Firms competing against unregistered firms (%) Firms using banks to finance working capital (% of firms) Delay in obtaining an electrical connection (days) Internationally recognized quality certification (% of firms)
Private sector investment
Invest. in infra. w/privt. part., 2000–05 and 2006–13 ($ millions)Private foreign direct investment, net (% of GDP)Gross fixed capital formation (% of GDP)Gross fixed private capital formation (% of GDP)
Finance and banking
Government debt (% of GDP)Total financial system deposits (% of GDP)Bank capital to asset ratio (%)Bank nonperforming loans to total gross loans (%)Domestic credit to the private sector (% of GDP)Real interest rate (%)Interest rate spread (percentage points)
Infrastructure
Air transport (thousands registered carrier departures worldwide)Port container traffic (thousand TEU)Electric power consumption (kWh per capita)Power outages in firms in a typical month (number)Mobile-cellular telephone subscriptions (per 100 people)Individuals using the Internet (%)
Sub-Saharan Africa Low income
Ethiopia
2005 2013 2013
Low-
income
groupCountry data
76.2 94.1 84934.7 45.1 3915.4 5.7 5.1
160 470 7285.6 10.6 6.0
44.7 45.0 26.212.8 11.9 23.45.3 4.0 12.1
42.5 43.0 50.612.9 8.1
8.7 18.215.0 12.5 22.035.2 29.1 35.9
.. 132
34 15 299 9 8
212 306 26547 44 35
1.8 1.8 3.4.. 26.2 19.2
0.8 1.3
0.0 0.0 0.3
3.8 3.0
4.3 3.8
.. 37.3
40.7 13.6
44.2 111.8
4.2 13.6
.. 4 30,934
2.1 2.0 3.830.6 35.8 25.2
.. .. ..
.. .. ..
34.6 .. 37.6.. .. ..
19.9 .. ..22.8 .. 27.6–2.6 ..3.5 .. 10.7
31 66 385
.. .. ..34 52 219
1.7 5.6
0.5 27.3 54.60.2 1.9 7.1
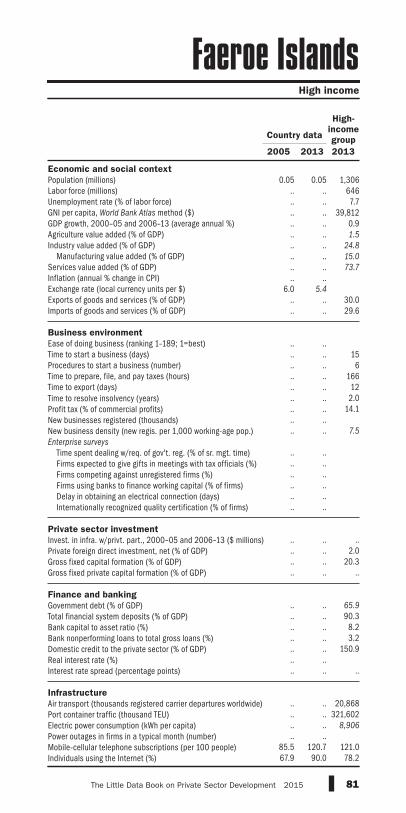
81The Little Data Book on Private Sector Development 2015
Economic and social context
Population (millions)Labor force (millions)Unemployment rate (% of labor force)GNI per capita, World Bank Atlas method ($)GDP growth, 2000–05 and 2006–13 (average annual %)Agriculture value added (% of GDP)Industry value added (% of GDP) Manufacturing value added (% of GDP)Services value added (% of GDP)Inflation (annual % change in CPI)Exchange rate (local currency units per $)Exports of goods and services (% of GDP)Imports of goods and services (% of GDP)
Business environment
Ease of doing business (ranking 1–189; 1=best)Time to start a business (days)Procedures to start a business (number)Time to prepare, file, and pay taxes (hours)Time to export (days)Time to resolve insolvency (years)Profit tax (% of commercial profits)New businesses registered (thousands)New business density (new regis. per 1,000 working-age pop.)Enterprise surveys
Time spent dealing w/req. of gov't. reg. (% of sr. mgt. time) Firms expected to give gifts in meetings with tax officials (%) Firms competing against unregistered firms (%) Firms using banks to finance working capital (% of firms) Delay in obtaining an electrical connection (days) Internationally recognized quality certification (% of firms)
Private sector investment
Invest. in infra. w/privt. part., 2000–05 and 2006–13 ($ millions)Private foreign direct investment, net (% of GDP)Gross fixed capital formation (% of GDP)Gross fixed private capital formation (% of GDP)
Finance and banking
Government debt (% of GDP)Total financial system deposits (% of GDP)Bank capital to asset ratio (%)Bank nonperforming loans to total gross loans (%)Domestic credit to the private sector (% of GDP)Real interest rate (%)Interest rate spread (percentage points)
Infrastructure
Air transport (thousands registered carrier departures worldwide)Port container traffic (thousand TEU)Electric power consumption (kWh per capita)Power outages in firms in a typical month (number)Mobile-cellular telephone subscriptions (per 100 people)Individuals using the Internet (%)
High income
Faeroe Islands
2005 2013 2013
High-
income
groupCountry data
0.05 0.05 1,306.. .. 646.. .. 7.7.. .. 39,812.. .. 0.9.. .. 1.5
.. .. 24.8
.. .. 15.0
.. .. 73.7
.. ..6.0 5.4
.. .. 30.0
.. .. 29.6
.. .... .. 15.. .. 6.. .. 166.. .. 12.. .. 2.0.. .. 14.1.. .... .. 7.5
.. .... .... .... .... .... ..
.. .. .... .. 2.0.. .. 20.3.. .. .. .. .. 65.9
.. .. 90.3
.. .. 8.2
.. .. 3.2
.. .. 150.9
.. ..
.. .. ..
.. .. 20,868.. .. 321,602.. .. 8,906
.. ..85.5 120.7 121.067.9 90.0 78.2

82 2015 The Little Data Book on Private Sector Development
Economic and social context
Population (millions)Labor force (millions)Unemployment rate (% of labor force)GNI per capita, World Bank Atlas method ($)GDP growth, 2000–05 and 2006–13 (average annual %)Agriculture value added (% of GDP)Industry value added (% of GDP) Manufacturing value added (% of GDP)Services value added (% of GDP)Inflation (annual % change in CPI)Exchange rate (local currency units per $)Exports of goods and services (% of GDP)Imports of goods and services (% of GDP)
Business environment
Ease of doing business (ranking 1–189; 1=best)Time to start a business (days)Procedures to start a business (number)Time to prepare, file, and pay taxes (hours)Time to export (days)Time to resolve insolvency (years)Profit tax (% of commercial profits)New businesses registered (thousands)New business density (new regis. per 1,000 working-age pop.)Enterprise surveys
Time spent dealing w/req. of gov't. reg. (% of sr. mgt. time) Firms expected to give gifts in meetings with tax officials (%) Firms competing against unregistered firms (%) Firms using banks to finance working capital (% of firms) Delay in obtaining an electrical connection (days) Internationally recognized quality certification (% of firms)
Private sector investment
Invest. in infra. w/privt. part., 2000–05 and 2006–13 ($ millions)Private foreign direct investment, net (% of GDP)Gross fixed capital formation (% of GDP)Gross fixed private capital formation (% of GDP)
Finance and banking
Government debt (% of GDP)Total financial system deposits (% of GDP)Bank capital to asset ratio (%)Bank nonperforming loans to total gross loans (%)Domestic credit to the private sector (% of GDP)Real interest rate (%)Interest rate spread (percentage points)
Infrastructure
Air transport (thousands registered carrier departures worldwide)Port container traffic (thousand TEU)Electric power consumption (kWh per capita)Power outages in firms in a typical month (number)Mobile-cellular telephone subscriptions (per 100 people)Individuals using the Internet (%)
East Asia & Pacific Upper middle income
Fiji
2005 2013 2013
Upper
middle-
income
groupCountry data
0.82 0.88 2,4090.32 0.34 1,264
4.6 8.1 5.93,590 4,370 7,604
2.6 1.4 5.714.1 12.2 7.619.2 20.2 36.714.2 14.5 23.066.8 67.6 55.6
2.4 2.91.7 1.8
53.1 58.8 30.365.1 77.6 30.1
.. 81
44 59 268 11 7
140 195 32325 19 20
1.8 1.8 2.6.. 20.6 17.5.. .... .. 3.0
.. .... .... .... .... .... ..
50 220 426,038
5.3 4.1 3.321.0 .. 31.617.9 .. ..
.. .. ..
48.1 72.8 48.0.. .. 10.7.. .. 3.6
68.7 81.4 98.00.0 6.65.0 4.0 6.0
42 16 7,427
.. .. 262,896
.. .. 2,932
.. ..24.9 105.6 99.88.5 37.1 44.8

83The Little Data Book on Private Sector Development 2015
Economic and social context
Population (millions)Labor force (millions)Unemployment rate (% of labor force)GNI per capita, World Bank Atlas method ($)GDP growth, 2000–05 and 2006–13 (average annual %)Agriculture value added (% of GDP)Industry value added (% of GDP) Manufacturing value added (% of GDP)Services value added (% of GDP)Inflation (annual % change in CPI)Exchange rate (local currency units per $)Exports of goods and services (% of GDP)Imports of goods and services (% of GDP)
Business environment
Ease of doing business (ranking 1–189; 1=best)Time to start a business (days)Procedures to start a business (number)Time to prepare, file, and pay taxes (hours)Time to export (days)Time to resolve insolvency (years)Profit tax (% of commercial profits)New businesses registered (thousands)New business density (new regis. per 1,000 working-age pop.)Enterprise surveys
Time spent dealing w/req. of gov't. reg. (% of sr. mgt. time) Firms expected to give gifts in meetings with tax officials (%) Firms competing against unregistered firms (%) Firms using banks to finance working capital (% of firms) Delay in obtaining an electrical connection (days) Internationally recognized quality certification (% of firms)
Private sector investment
Invest. in infra. w/privt. part., 2000–05 and 2006–13 ($ millions)Private foreign direct investment, net (% of GDP)Gross fixed capital formation (% of GDP)Gross fixed private capital formation (% of GDP)
Finance and banking
Government debt (% of GDP)Total financial system deposits (% of GDP)Bank capital to asset ratio (%)Bank nonperforming loans to total gross loans (%)Domestic credit to the private sector (% of GDP)Real interest rate (%)Interest rate spread (percentage points)
Infrastructure
Air transport (thousands registered carrier departures worldwide)Port container traffic (thousand TEU)Electric power consumption (kWh per capita)Power outages in firms in a typical month (number)Mobile-cellular telephone subscriptions (per 100 people)Individuals using the Internet (%)
High income
Finland
2005 2013 2013
High-
income
groupCountry data
5.2 5.4 1,3062.6 2.7 6468.4 8.2 7.7
40,090 48,820 39,8122.6 –0.3 0.92.6 2.7 1.5
33.5 26.9 24.8
24.3 16.6 15.0
63.8 70.5 73.7
0.9 1.50.8 0.8
40.3 38.2 30.036.4 39.1 29.6
.. 9
14 14 153 3 6
269 93 1669 9 12
0.9 0.9 2.0.. 14.5 14.1
8.4 8.2
2.4 2.3 7.5
.. .... .... .... .... .... ..
.. .. ..
5.3 –2.0 2.023.0 21.2 20.3
.. .. ..
42.2 51.0 65.9
47.6 62.9 90.39.4 4.9 8.20.3 0.5 3.2
71.9 98.1 150.93.1 ..2.7 .. ..
107 135 20,868
1,312 1,633 321,60216,116 15,738 8,906
.. ..100.5 171.6 121.0
74.5 91.5 78.2
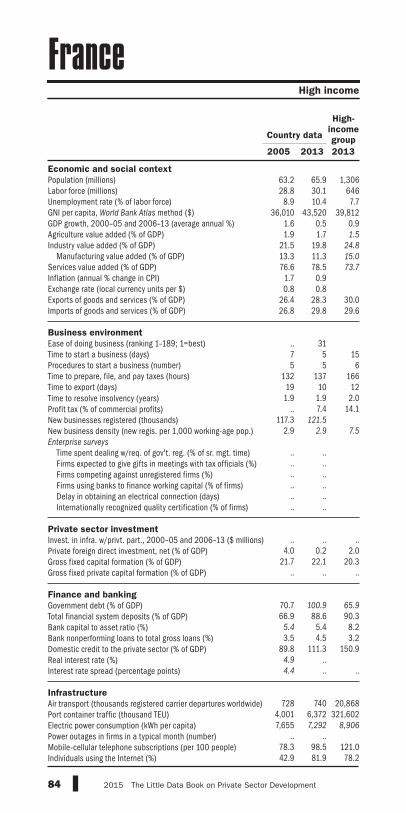
84 2015 The Little Data Book on Private Sector Development
Economic and social context
Population (millions)Labor force (millions)Unemployment rate (% of labor force)GNI per capita, World Bank Atlas method ($)GDP growth, 2000–05 and 2006–13 (average annual %)Agriculture value added (% of GDP)Industry value added (% of GDP) Manufacturing value added (% of GDP)Services value added (% of GDP)Inflation (annual % change in CPI)Exchange rate (local currency units per $)Exports of goods and services (% of GDP)Imports of goods and services (% of GDP)
Business environment
Ease of doing business (ranking 1–189; 1=best)Time to start a business (days)Procedures to start a business (number)Time to prepare, file, and pay taxes (hours)Time to export (days)Time to resolve insolvency (years)Profit tax (% of commercial profits)New businesses registered (thousands)New business density (new regis. per 1,000 working-age pop.)Enterprise surveys
Time spent dealing w/req. of gov't. reg. (% of sr. mgt. time) Firms expected to give gifts in meetings with tax officials (%) Firms competing against unregistered firms (%) Firms using banks to finance working capital (% of firms) Delay in obtaining an electrical connection (days) Internationally recognized quality certification (% of firms)
Private sector investment
Invest. in infra. w/privt. part., 2000–05 and 2006–13 ($ millions)Private foreign direct investment, net (% of GDP)Gross fixed capital formation (% of GDP)Gross fixed private capital formation (% of GDP)
Finance and banking
Government debt (% of GDP)Total financial system deposits (% of GDP)Bank capital to asset ratio (%)Bank nonperforming loans to total gross loans (%)Domestic credit to the private sector (% of GDP)Real interest rate (%)Interest rate spread (percentage points)
Infrastructure
Air transport (thousands registered carrier departures worldwide)Port container traffic (thousand TEU)Electric power consumption (kWh per capita)Power outages in firms in a typical month (number)Mobile-cellular telephone subscriptions (per 100 people)Individuals using the Internet (%)
High income
France
2005 2013 2013
High-
income
groupCountry data
63.2 65.9 1,30628.8 30.1 646
8.9 10.4 7.736,010 43,520 39,812
1.6 0.5 0.91.9 1.7 1.5
21.5 19.8 24.8
13.3 11.3 15.0
76.6 78.5 73.7
1.7 0.90.8 0.8
26.4 28.3 30.026.8 29.8 29.6
.. 317 5 155 5 6
132 137 16619 10 12
1.9 1.9 2.0.. 7.4 14.1
117.3 121.5
2.9 2.9 7.5
.. .... .... .... .... .... ..
.. .. ..
4.0 0.2 2.021.7 22.1 20.3
.. .. ..
70.7 100.9 65.9
66.9 88.6 90.35.4 5.4 8.23.5 4.5 3.2
89.8 111.3 150.94.9 ..4.4 .. ..
728 740 20,868
4,001 6,372 321,6027,655 7,292 8,906
.. ..78.3 98.5 121.042.9 81.9 78.2

85The Little Data Book on Private Sector Development 2015
Economic and social context
Population (millions)Labor force (millions)Unemployment rate (% of labor force)GNI per capita, World Bank Atlas method ($)GDP growth, 2000–05 and 2006–13 (average annual %)Agriculture value added (% of GDP)Industry value added (% of GDP) Manufacturing value added (% of GDP)Services value added (% of GDP)Inflation (annual % change in CPI)Exchange rate (local currency units per $)Exports of goods and services (% of GDP)Imports of goods and services (% of GDP)
Business environment
Ease of doing business (ranking 1–189; 1=best)Time to start a business (days)Procedures to start a business (number)Time to prepare, file, and pay taxes (hours)Time to export (days)Time to resolve insolvency (years)Profit tax (% of commercial profits)New businesses registered (thousands)New business density (new regis. per 1,000 working-age pop.)Enterprise surveys
Time spent dealing w/req. of gov't. reg. (% of sr. mgt. time) Firms expected to give gifts in meetings with tax officials (%) Firms competing against unregistered firms (%) Firms using banks to finance working capital (% of firms) Delay in obtaining an electrical connection (days) Internationally recognized quality certification (% of firms)
Private sector investment
Invest. in infra. w/privt. part., 2000–05 and 2006–13 ($ millions)Private foreign direct investment, net (% of GDP)Gross fixed capital formation (% of GDP)Gross fixed private capital formation (% of GDP)
Finance and banking
Government debt (% of GDP)Total financial system deposits (% of GDP)Bank capital to asset ratio (%)Bank nonperforming loans to total gross loans (%)Domestic credit to the private sector (% of GDP)Real interest rate (%)Interest rate spread (percentage points)
Infrastructure
Air transport (thousands registered carrier departures worldwide)Port container traffic (thousand TEU)Electric power consumption (kWh per capita)Power outages in firms in a typical month (number)Mobile-cellular telephone subscriptions (per 100 people)Individuals using the Internet (%)
High income
French Polynesia
2005 2013 2013
High-
income
groupCountry data
0.25 0.28 1,3060.10 0.12 646
.. .. 7.7
.. .. 39,812
.. .. 0.9
.. .. 1.5
.. .. 24.8
.. .. 15.0
.. .. 73.7
.. ..
.. ..
.. .. 30.0
.. .. 29.6
.. .... .. 15.. .. 6.. .. 166.. .. 12.. .. 2.0.. .. 14.1.. .... .. 7.5
.. .... .... .... .... .... ..
.. .. .... .. 2.0.. .. 20.3.. .. .. .. .. 65.9
.. .. 90.3
.. .. 8.2
.. .. 3.2
.. .. 150.9
.. ..
.. .. ..
.. .. 20,868
70 84 321,602.. .. 8,906
.. ..47.1 85.6 121.021.5 56.8 78.2
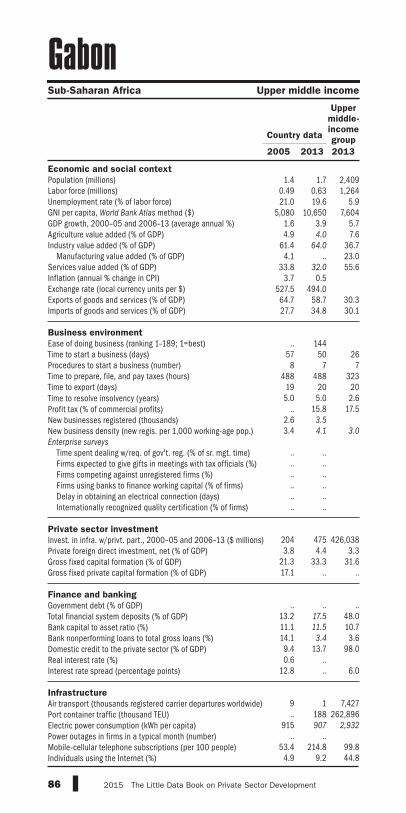
86 2015 The Little Data Book on Private Sector Development
Economic and social context
Population (millions)Labor force (millions)Unemployment rate (% of labor force)GNI per capita, World Bank Atlas method ($)GDP growth, 2000–05 and 2006–13 (average annual %)Agriculture value added (% of GDP)Industry value added (% of GDP) Manufacturing value added (% of GDP)Services value added (% of GDP)Inflation (annual % change in CPI)Exchange rate (local currency units per $)Exports of goods and services (% of GDP)Imports of goods and services (% of GDP)
Business environment
Ease of doing business (ranking 1–189; 1=best)Time to start a business (days)Procedures to start a business (number)Time to prepare, file, and pay taxes (hours)Time to export (days)Time to resolve insolvency (years)Profit tax (% of commercial profits)New businesses registered (thousands)New business density (new regis. per 1,000 working-age pop.)Enterprise surveys
Time spent dealing w/req. of gov't. reg. (% of sr. mgt. time) Firms expected to give gifts in meetings with tax officials (%) Firms competing against unregistered firms (%) Firms using banks to finance working capital (% of firms) Delay in obtaining an electrical connection (days) Internationally recognized quality certification (% of firms)
Private sector investment
Invest. in infra. w/privt. part., 2000–05 and 2006–13 ($ millions)Private foreign direct investment, net (% of GDP)Gross fixed capital formation (% of GDP)Gross fixed private capital formation (% of GDP)
Finance and banking
Government debt (% of GDP)Total financial system deposits (% of GDP)Bank capital to asset ratio (%)Bank nonperforming loans to total gross loans (%)Domestic credit to the private sector (% of GDP)Real interest rate (%)Interest rate spread (percentage points)
Infrastructure
Air transport (thousands registered carrier departures worldwide)Port container traffic (thousand TEU)Electric power consumption (kWh per capita)Power outages in firms in a typical month (number)Mobile-cellular telephone subscriptions (per 100 people)Individuals using the Internet (%)
Sub-Saharan Africa Upper middle income
Gabon
2005 2013 2013
Upper
middle-
income
groupCountry data
1.4 1.7 2,4090.49 0.63 1,26421.0 19.6 5.9
5,080 10,650 7,6041.6 3.9 5.74.9 4.0 7.6
61.4 64.0 36.74.1 .. 23.0
33.8 32.0 55.63.7 0.5
527.5 494.064.7 58.7 30.327.7 34.8 30.1
.. 144
57 50 268 7 7
488 488 32319 20 20
5.0 5.0 2.6.. 15.8 17.5
2.6 3.5
3.4 4.1 3.0
.. .... .... .... .... .... ..
204 475 426,0383.8 4.4 3.3
21.3 33.3 31.617.1 .. ..
.. .. ..
13.2 17.5 48.011.1 11.5 10.714.1 3.4 3.69.4 13.7 98.00.6 ..
12.8 .. 6.0
9 1 7,427.. 188 262,896
915 907 2,932
.. ..53.4 214.8 99.8
4.9 9.2 44.8

87The Little Data Book on Private Sector Development 2015
Economic and social context
Population (millions)Labor force (millions)Unemployment rate (% of labor force)GNI per capita, World Bank Atlas method ($)GDP growth, 2000–05 and 2006–13 (average annual %)Agriculture value added (% of GDP)Industry value added (% of GDP) Manufacturing value added (% of GDP)Services value added (% of GDP)Inflation (annual % change in CPI)Exchange rate (local currency units per $)Exports of goods and services (% of GDP)Imports of goods and services (% of GDP)
Business environment
Ease of doing business (ranking 1–189; 1=best)Time to start a business (days)Procedures to start a business (number)Time to prepare, file, and pay taxes (hours)Time to export (days)Time to resolve insolvency (years)Profit tax (% of commercial profits)New businesses registered (thousands)New business density (new regis. per 1,000 working-age pop.)Enterprise surveys
Time spent dealing w/req. of gov't. reg. (% of sr. mgt. time) Firms expected to give gifts in meetings with tax officials (%) Firms competing against unregistered firms (%) Firms using banks to finance working capital (% of firms) Delay in obtaining an electrical connection (days) Internationally recognized quality certification (% of firms)
Private sector investment
Invest. in infra. w/privt. part., 2000–05 and 2006–13 ($ millions)Private foreign direct investment, net (% of GDP)Gross fixed capital formation (% of GDP)Gross fixed private capital formation (% of GDP)
Finance and banking
Government debt (% of GDP)Total financial system deposits (% of GDP)Bank capital to asset ratio (%)Bank nonperforming loans to total gross loans (%)Domestic credit to the private sector (% of GDP)Real interest rate (%)Interest rate spread (percentage points)
Infrastructure
Air transport (thousands registered carrier departures worldwide)Port container traffic (thousand TEU)Electric power consumption (kWh per capita)Power outages in firms in a typical month (number)Mobile-cellular telephone subscriptions (per 100 people)Individuals using the Internet (%)
Sub-Saharan Africa Low income
Gambia, The
2005 2013 2013
Low-
income
groupCountry data
1.4 1.8 8490.60 0.77 391
7.2 7.0 5.1410 500 7283.2 3.9 6.0
.. .. 26.2
.. .. 23.4
.. .. 12.1
.. .. 50.64.8 5.7
28.6 35.520.7 37.0 22.049.6 50.8 35.9
.. 138
28 26 298 7 8
376 376 26523 19 352.0 2.0 3.4
.. 6.1 19.2
.. ..
.. .. 0.3
7.3 ..
13.6 ..60.3 ..14.3 ..63.9 ..22.2 ..
7 35 30,934
8.6 2.8 3.829.5 20.7 25.213.9 13.7 ..
115.3 .. ..25.9 43.7 37.6
.. .. ..
.. .. ..9.6 15.4 27.6
30.2 22.517.6 14.6 10.7
.. 2 385.. .. .... .. 219
21.0 ..17.2 100.0 54.63.8 14.0 7.1

88 2015 The Little Data Book on Private Sector Development
Economic and social context
Population (millions)Labor force (millions)Unemployment rate (% of labor force)GNI per capita, World Bank Atlas method ($)GDP growth, 2000–05 and 2006–13 (average annual %)Agriculture value added (% of GDP)Industry value added (% of GDP) Manufacturing value added (% of GDP)Services value added (% of GDP)Inflation (annual % change in CPI)Exchange rate (local currency units per $)Exports of goods and services (% of GDP)Imports of goods and services (% of GDP)
Business environment
Ease of doing business (ranking 1–189; 1=best)Time to start a business (days)Procedures to start a business (number)Time to prepare, file, and pay taxes (hours)Time to export (days)Time to resolve insolvency (years)Profit tax (% of commercial profits)New businesses registered (thousands)New business density (new regis. per 1,000 working-age pop.)Enterprise surveys
Time spent dealing w/req. of gov't. reg. (% of sr. mgt. time) Firms expected to give gifts in meetings with tax officials (%) Firms competing against unregistered firms (%) Firms using banks to finance working capital (% of firms) Delay in obtaining an electrical connection (days) Internationally recognized quality certification (% of firms)
Private sector investment
Invest. in infra. w/privt. part., 2000–05 and 2006–13 ($ millions)Private foreign direct investment, net (% of GDP)Gross fixed capital formation (% of GDP)Gross fixed private capital formation (% of GDP)
Finance and banking
Government debt (% of GDP)Total financial system deposits (% of GDP)Bank capital to asset ratio (%)Bank nonperforming loans to total gross loans (%)Domestic credit to the private sector (% of GDP)Real interest rate (%)Interest rate spread (percentage points)
Infrastructure
Air transport (thousands registered carrier departures worldwide)Port container traffic (thousand TEU)Electric power consumption (kWh per capita)Power outages in firms in a typical month (number)Mobile-cellular telephone subscriptions (per 100 people)Individuals using the Internet (%)
Europe & Central Asia Lower middle income
Georgia
2005 2013 2013
Lower
middle-
income
groupCountry data
4.4 4.5 2,5612.3 2.4 1,014
13.8 14.3 5.31,360 3,560 2,074
7.5 4.2 5.816.7 9.4 17.026.8 24.0 32.113.7 13.4 17.156.5 66.6 51.1
8.2 –0.51.8 1.7
33.7 44.7 27.151.6 57.6 31.2
.. 15
21 2 228 2 7
448 362 31554 9 253.3 2.0 2.9
.. 14.3 15.94.0 14.9
1.4 4.9 1.1
3.9 0.9
39.8 0.2.. 54.1
27.8 27.6.. 8.7
17.5 7.7
241 3,094 402,6687.1 5.9 2.1
28.1 21.9 25.522.2 17.7 18.8
40.9 32.5 ..10.5 29.6 47.1
18.8 16.8 10.31.2 3.0 4.5
14.7 39.8 41.58.9 14.4
10.1 3.9 7.1
5 3 2,437
185 277 62,2681,715 1,918 736
.. 1.026.2 115.0 85.2
6.1 43.1 21.2

89The Little Data Book on Private Sector Development 2015
Economic and social context
Population (millions)Labor force (millions)Unemployment rate (% of labor force)GNI per capita, World Bank Atlas method ($)GDP growth, 2000–05 and 2006–13 (average annual %)Agriculture value added (% of GDP)Industry value added (% of GDP) Manufacturing value added (% of GDP)Services value added (% of GDP)Inflation (annual % change in CPI)Exchange rate (local currency units per $)Exports of goods and services (% of GDP)Imports of goods and services (% of GDP)
Business environment
Ease of doing business (ranking 1–189; 1=best)Time to start a business (days)Procedures to start a business (number)Time to prepare, file, and pay taxes (hours)Time to export (days)Time to resolve insolvency (years)Profit tax (% of commercial profits)New businesses registered (thousands)New business density (new regis. per 1,000 working-age pop.)Enterprise surveys
Time spent dealing w/req. of gov't. reg. (% of sr. mgt. time) Firms expected to give gifts in meetings with tax officials (%) Firms competing against unregistered firms (%) Firms using banks to finance working capital (% of firms) Delay in obtaining an electrical connection (days) Internationally recognized quality certification (% of firms)
Private sector investment
Invest. in infra. w/privt. part., 2000–05 and 2006–13 ($ millions)Private foreign direct investment, net (% of GDP)Gross fixed capital formation (% of GDP)Gross fixed private capital formation (% of GDP)
Finance and banking
Government debt (% of GDP)Total financial system deposits (% of GDP)Bank capital to asset ratio (%)Bank nonperforming loans to total gross loans (%)Domestic credit to the private sector (% of GDP)Real interest rate (%)Interest rate spread (percentage points)
Infrastructure
Air transport (thousands registered carrier departures worldwide)Port container traffic (thousand TEU)Electric power consumption (kWh per capita)Power outages in firms in a typical month (number)Mobile-cellular telephone subscriptions (per 100 people)Individuals using the Internet (%)
High income
Germany
2005 2013 2013
High-
income
groupCountry data
82.5 80.7 1,30641.3 42.0 64611.1 5.3 7.7
35,880 47,250 39,8120.4 0.8 0.90.8 0.9 1.5
29.3 30.7 24.8
22.3 22.2 15.0
70.0 68.4 73.7
1.5 1.50.8 0.8
37.8 45.6 30.032.7 39.8 29.6
.. 14
22 15 159 9 6
196 218 1668 9 12
1.2 1.2 2.0.. 23.3 14.1
66.9 69.3
1.2 1.3 7.5
1.2 ..
14.8 .... ..
42.2 ..3.2 ..
.. ..
.. .. ..
2.1 1.4 2.019.1 19.8 20.3
.. .. ..
43.3 55.2 65.9
97.4 108.0 90.34.1 5.5 8.24.1 2.7 3.2
109.0 93.1 150.98.2 ..7.0 .. ..
1,024 928 20,868
13,599 19,039 321,6027,113 7,081 8,906
.. ..94.6 120.9 121.068.7 84.0 78.2
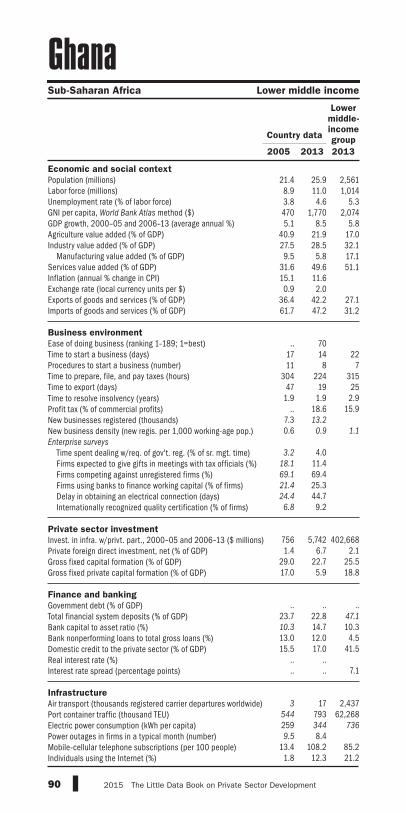
90 2015 The Little Data Book on Private Sector Development
Economic and social context
Population (millions)Labor force (millions)Unemployment rate (% of labor force)GNI per capita, World Bank Atlas method ($)GDP growth, 2000–05 and 2006–13 (average annual %)Agriculture value added (% of GDP)Industry value added (% of GDP) Manufacturing value added (% of GDP)Services value added (% of GDP)Inflation (annual % change in CPI)Exchange rate (local currency units per $)Exports of goods and services (% of GDP)Imports of goods and services (% of GDP)
Business environment
Ease of doing business (ranking 1–189; 1=best)Time to start a business (days)Procedures to start a business (number)Time to prepare, file, and pay taxes (hours)Time to export (days)Time to resolve insolvency (years)Profit tax (% of commercial profits)New businesses registered (thousands)New business density (new regis. per 1,000 working-age pop.)Enterprise surveys
Time spent dealing w/req. of gov't. reg. (% of sr. mgt. time) Firms expected to give gifts in meetings with tax officials (%) Firms competing against unregistered firms (%) Firms using banks to finance working capital (% of firms) Delay in obtaining an electrical connection (days) Internationally recognized quality certification (% of firms)
Private sector investment
Invest. in infra. w/privt. part., 2000–05 and 2006–13 ($ millions)Private foreign direct investment, net (% of GDP)Gross fixed capital formation (% of GDP)Gross fixed private capital formation (% of GDP)
Finance and banking
Government debt (% of GDP)Total financial system deposits (% of GDP)Bank capital to asset ratio (%)Bank nonperforming loans to total gross loans (%)Domestic credit to the private sector (% of GDP)Real interest rate (%)Interest rate spread (percentage points)
Infrastructure
Air transport (thousands registered carrier departures worldwide)Port container traffic (thousand TEU)Electric power consumption (kWh per capita)Power outages in firms in a typical month (number)Mobile-cellular telephone subscriptions (per 100 people)Individuals using the Internet (%)
Sub-Saharan Africa Lower middle income
Ghana
2005 2013 2013
Lower
middle-
income
groupCountry data
21.4 25.9 2,5618.9 11.0 1,0143.8 4.6 5.3470 1,770 2,0745.1 8.5 5.8
40.9 21.9 17.027.5 28.5 32.19.5 5.8 17.1
31.6 49.6 51.115.1 11.60.9 2.0
36.4 42.2 27.161.7 47.2 31.2
.. 70
17 14 2211 8 7
304 224 31547 19 25
1.9 1.9 2.9.. 18.6 15.9
7.3 13.2
0.6 0.9 1.1
3.2 4.0
18.1 11.469.1 69.421.4 25.324.4 44.7
6.8 9.2
756 5,742 402,6681.4 6.7 2.1
29.0 22.7 25.517.0 5.9 18.8
.. .. ..
23.7 22.8 47.1
10.3 14.7 10.313.0 12.0 4.515.5 17.0 41.5
.. ..
.. .. 7.1
3 17 2,437
544 793 62,268259 344 736
9.5 8.413.4 108.2 85.2
1.8 12.3 21.2
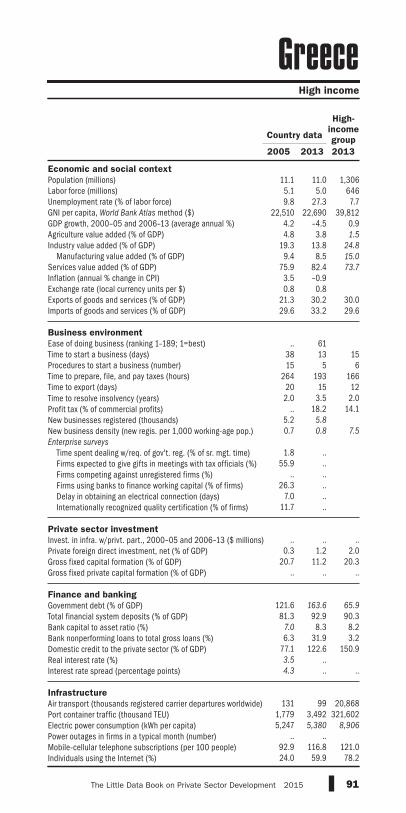
91The Little Data Book on Private Sector Development 2015
Economic and social context
Population (millions)Labor force (millions)Unemployment rate (% of labor force)GNI per capita, World Bank Atlas method ($)GDP growth, 2000–05 and 2006–13 (average annual %)Agriculture value added (% of GDP)Industry value added (% of GDP) Manufacturing value added (% of GDP)Services value added (% of GDP)Inflation (annual % change in CPI)Exchange rate (local currency units per $)Exports of goods and services (% of GDP)Imports of goods and services (% of GDP)
Business environment
Ease of doing business (ranking 1–189; 1=best)Time to start a business (days)Procedures to start a business (number)Time to prepare, file, and pay taxes (hours)Time to export (days)Time to resolve insolvency (years)Profit tax (% of commercial profits)New businesses registered (thousands)New business density (new regis. per 1,000 working-age pop.)Enterprise surveys
Time spent dealing w/req. of gov't. reg. (% of sr. mgt. time) Firms expected to give gifts in meetings with tax officials (%) Firms competing against unregistered firms (%) Firms using banks to finance working capital (% of firms) Delay in obtaining an electrical connection (days) Internationally recognized quality certification (% of firms)
Private sector investment
Invest. in infra. w/privt. part., 2000–05 and 2006–13 ($ millions)Private foreign direct investment, net (% of GDP)Gross fixed capital formation (% of GDP)Gross fixed private capital formation (% of GDP)
Finance and banking
Government debt (% of GDP)Total financial system deposits (% of GDP)Bank capital to asset ratio (%)Bank nonperforming loans to total gross loans (%)Domestic credit to the private sector (% of GDP)Real interest rate (%)Interest rate spread (percentage points)
Infrastructure
Air transport (thousands registered carrier departures worldwide)Port container traffic (thousand TEU)Electric power consumption (kWh per capita)Power outages in firms in a typical month (number)Mobile-cellular telephone subscriptions (per 100 people)Individuals using the Internet (%)
High income
Greece
2005 2013 2013
High-
income
groupCountry data
11.1 11.0 1,3065.1 5.0 6469.8 27.3 7.7
22,510 22,690 39,8124.2 –4.5 0.94.8 3.8 1.5
19.3 13.8 24.8
9.4 8.5 15.0
75.9 82.4 73.7
3.5 –0.90.8 0.8
21.3 30.2 30.029.6 33.2 29.6
.. 61
38 13 1515 5 6
264 193 16620 15 122.0 3.5 2.0
.. 18.2 14.15.2 5.8
0.7 0.8 7.5
1.8 ..
55.9 .... ..
26.3 ..7.0 ..
11.7 ..
.. .. ..
0.3 1.2 2.020.7 11.2 20.3
.. .. ..
121.6 163.6 65.9
81.3 92.9 90.37.0 8.3 8.26.3 31.9 3.2
77.1 122.6 150.93.5 ..4.3 .. ..
131 99 20,868
1,779 3,492 321,6025,247 5,380 8,906
.. ..92.9 116.8 121.024.0 59.9 78.2
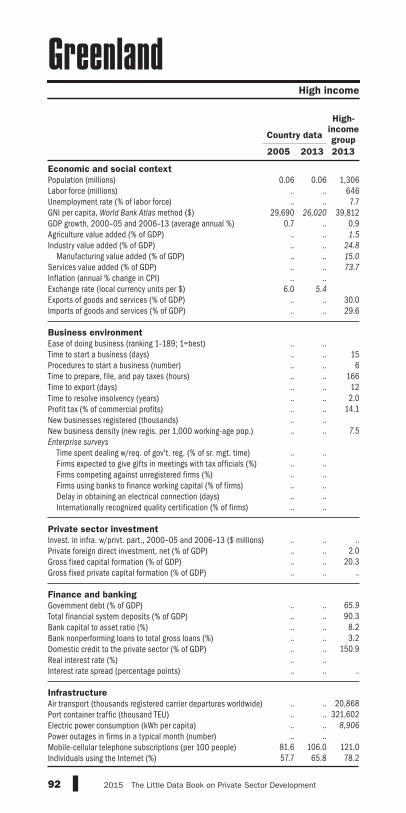
92 2015 The Little Data Book on Private Sector Development
Economic and social context
Population (millions)Labor force (millions)Unemployment rate (% of labor force)GNI per capita, World Bank Atlas method ($)GDP growth, 2000–05 and 2006–13 (average annual %)Agriculture value added (% of GDP)Industry value added (% of GDP) Manufacturing value added (% of GDP)Services value added (% of GDP)Inflation (annual % change in CPI)Exchange rate (local currency units per $)Exports of goods and services (% of GDP)Imports of goods and services (% of GDP)
Business environment
Ease of doing business (ranking 1–189; 1=best)Time to start a business (days)Procedures to start a business (number)Time to prepare, file, and pay taxes (hours)Time to export (days)Time to resolve insolvency (years)Profit tax (% of commercial profits)New businesses registered (thousands)New business density (new regis. per 1,000 working-age pop.)Enterprise surveys
Time spent dealing w/req. of gov't. reg. (% of sr. mgt. time) Firms expected to give gifts in meetings with tax officials (%) Firms competing against unregistered firms (%) Firms using banks to finance working capital (% of firms) Delay in obtaining an electrical connection (days) Internationally recognized quality certification (% of firms)
Private sector investment
Invest. in infra. w/privt. part., 2000–05 and 2006–13 ($ millions)Private foreign direct investment, net (% of GDP)Gross fixed capital formation (% of GDP)Gross fixed private capital formation (% of GDP)
Finance and banking
Government debt (% of GDP)Total financial system deposits (% of GDP)Bank capital to asset ratio (%)Bank nonperforming loans to total gross loans (%)Domestic credit to the private sector (% of GDP)Real interest rate (%)Interest rate spread (percentage points)
Infrastructure
Air transport (thousands registered carrier departures worldwide)Port container traffic (thousand TEU)Electric power consumption (kWh per capita)Power outages in firms in a typical month (number)Mobile-cellular telephone subscriptions (per 100 people)Individuals using the Internet (%)
High income
Greenland
2005 2013 2013
High-
income
groupCountry data
0.06 0.06 1,306.. .. 646.. .. 7.7
29,690 26,020 39,8120.7 .. 0.9
.. .. 1.5
.. .. 24.8
.. .. 15.0
.. .. 73.7
.. ..6.0 5.4
.. .. 30.0
.. .. 29.6
.. .... .. 15.. .. 6.. .. 166.. .. 12.. .. 2.0.. .. 14.1.. .... .. 7.5
.. .... .... .... .... .... ..
.. .. .... .. 2.0.. .. 20.3.. .. .. .. .. 65.9
.. .. 90.3
.. .. 8.2
.. .. 3.2
.. .. 150.9
.. ..
.. .. ..
.. .. 20,868.. .. 321,602.. .. 8,906
.. ..81.6 106.0 121.057.7 65.8 78.2

93The Little Data Book on Private Sector Development 2015
Economic and social context
Population (millions)Labor force (millions)Unemployment rate (% of labor force)GNI per capita, World Bank Atlas method ($)GDP growth, 2000–05 and 2006–13 (average annual %)Agriculture value added (% of GDP)Industry value added (% of GDP) Manufacturing value added (% of GDP)Services value added (% of GDP)Inflation (annual % change in CPI)Exchange rate (local currency units per $)Exports of goods and services (% of GDP)Imports of goods and services (% of GDP)
Business environment
Ease of doing business (ranking 1–189; 1=best)Time to start a business (days)Procedures to start a business (number)Time to prepare, file, and pay taxes (hours)Time to export (days)Time to resolve insolvency (years)Profit tax (% of commercial profits)New businesses registered (thousands)New business density (new regis. per 1,000 working-age pop.)Enterprise surveys
Time spent dealing w/req. of gov't. reg. (% of sr. mgt. time) Firms expected to give gifts in meetings with tax officials (%) Firms competing against unregistered firms (%) Firms using banks to finance working capital (% of firms) Delay in obtaining an electrical connection (days) Internationally recognized quality certification (% of firms)
Private sector investment
Invest. in infra. w/privt. part., 2000–05 and 2006–13 ($ millions)Private foreign direct investment, net (% of GDP)Gross fixed capital formation (% of GDP)Gross fixed private capital formation (% of GDP)
Finance and banking
Government debt (% of GDP)Total financial system deposits (% of GDP)Bank capital to asset ratio (%)Bank nonperforming loans to total gross loans (%)Domestic credit to the private sector (% of GDP)Real interest rate (%)Interest rate spread (percentage points)
Infrastructure
Air transport (thousands registered carrier departures worldwide)Port container traffic (thousand TEU)Electric power consumption (kWh per capita)Power outages in firms in a typical month (number)Mobile-cellular telephone subscriptions (per 100 people)Individuals using the Internet (%)
Latin America & Caribbean Upper middle income
Grenada
2005 2013 2013
Upper
middle-
income
groupCountry data
0.10 0.11 2,409.. .. 1,264.. .. 5.9
6,760 7,490 7,6044.5 –0.5 5.73.4 5.6 7.6
26.5 15.2 36.73.4 3.6 23.0
70.1 79.2 55.63.5 0.02.7 2.7
21.4 25.1 30.357.0 50.7 30.1
.. 126
20 15 266 6 7
140 140 32319 9 20
.. .. 2.6
.. 27.6 17.5
.. ..
.. .. 3.0
.. 7.7
.. 1.9
.. 72.5
.. 50.3
.. 22.9
.. 32.6
19 24 426,038
10.1 8.9 3.346.3 20.1 31.6
.. .. ..
.. .. ..
80.2 86.2 48.0.. .. 10.7.. 13.8 3.6
58.0 74.9 98.07.4 7.17.2 6.6 6.0
.. .. 7,427.. .. 262,896.. .. 2,932
.. 0.7
45.5 125.6 99.820.5 35.0 44.8

94 2015 The Little Data Book on Private Sector Development
Economic and social context
Population (millions)Labor force (millions)Unemployment rate (% of labor force)GNI per capita, World Bank Atlas method ($)GDP growth, 2000–05 and 2006–13 (average annual %)Agriculture value added (% of GDP)Industry value added (% of GDP) Manufacturing value added (% of GDP)Services value added (% of GDP)Inflation (annual % change in CPI)Exchange rate (local currency units per $)Exports of goods and services (% of GDP)Imports of goods and services (% of GDP)
Business environment
Ease of doing business (ranking 1–189; 1=best)Time to start a business (days)Procedures to start a business (number)Time to prepare, file, and pay taxes (hours)Time to export (days)Time to resolve insolvency (years)Profit tax (% of commercial profits)New businesses registered (thousands)New business density (new regis. per 1,000 working-age pop.)Enterprise surveys
Time spent dealing w/req. of gov't. reg. (% of sr. mgt. time) Firms expected to give gifts in meetings with tax officials (%) Firms competing against unregistered firms (%) Firms using banks to finance working capital (% of firms) Delay in obtaining an electrical connection (days) Internationally recognized quality certification (% of firms)
Private sector investment
Invest. in infra. w/privt. part., 2000–05 and 2006–13 ($ millions)Private foreign direct investment, net (% of GDP)Gross fixed capital formation (% of GDP)Gross fixed private capital formation (% of GDP)
Finance and banking
Government debt (% of GDP)Total financial system deposits (% of GDP)Bank capital to asset ratio (%)Bank nonperforming loans to total gross loans (%)Domestic credit to the private sector (% of GDP)Real interest rate (%)Interest rate spread (percentage points)
Infrastructure
Air transport (thousands registered carrier departures worldwide)Port container traffic (thousand TEU)Electric power consumption (kWh per capita)Power outages in firms in a typical month (number)Mobile-cellular telephone subscriptions (per 100 people)Individuals using the Internet (%)
High income
Guam
2005 2013 2013
High-
income
groupCountry data
0.16 0.17 1,3060.07 0.08 646
.. .. 7.7
.. .. 39,812
.. .. 0.9
.. .. 1.5
.. .. 24.8
.. .. 15.0
.. .. 73.7
.. ..
.. ..
.. .. 30.0
.. .. 29.6
.. .... .. 15.. .. 6.. .. 166.. .. 12.. .. 2.0.. .. 14.1.. .... .. 7.5
.. .... .... .... .... .... ..
.. .. .... .. 2.0.. .. 20.3.. .. .. .. .. 65.9
.. .. 90.3
.. .. 8.2
.. .. 3.2
.. .. 150.9
.. ..
.. .. ..
.. .. 20,868
165 225 321,602.. .. 8,906
.. ..61.9 .. 121.038.6 65.4 78.2
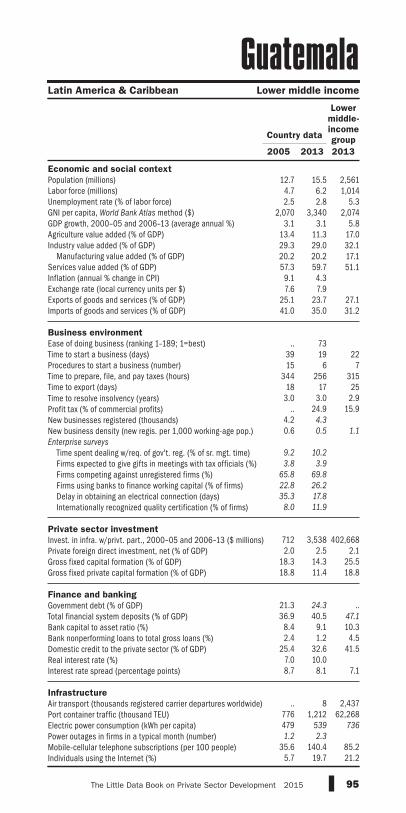
95The Little Data Book on Private Sector Development 2015
Economic and social context
Population (millions)Labor force (millions)Unemployment rate (% of labor force)GNI per capita, World Bank Atlas method ($)GDP growth, 2000–05 and 2006–13 (average annual %)Agriculture value added (% of GDP)Industry value added (% of GDP) Manufacturing value added (% of GDP)Services value added (% of GDP)Inflation (annual % change in CPI)Exchange rate (local currency units per $)Exports of goods and services (% of GDP)Imports of goods and services (% of GDP)
Business environment
Ease of doing business (ranking 1–189; 1=best)Time to start a business (days)Procedures to start a business (number)Time to prepare, file, and pay taxes (hours)Time to export (days)Time to resolve insolvency (years)Profit tax (% of commercial profits)New businesses registered (thousands)New business density (new regis. per 1,000 working-age pop.)Enterprise surveys
Time spent dealing w/req. of gov't. reg. (% of sr. mgt. time) Firms expected to give gifts in meetings with tax officials (%) Firms competing against unregistered firms (%) Firms using banks to finance working capital (% of firms) Delay in obtaining an electrical connection (days) Internationally recognized quality certification (% of firms)
Private sector investment
Invest. in infra. w/privt. part., 2000–05 and 2006–13 ($ millions)Private foreign direct investment, net (% of GDP)Gross fixed capital formation (% of GDP)Gross fixed private capital formation (% of GDP)
Finance and banking
Government debt (% of GDP)Total financial system deposits (% of GDP)Bank capital to asset ratio (%)Bank nonperforming loans to total gross loans (%)Domestic credit to the private sector (% of GDP)Real interest rate (%)Interest rate spread (percentage points)
Infrastructure
Air transport (thousands registered carrier departures worldwide)Port container traffic (thousand TEU)Electric power consumption (kWh per capita)Power outages in firms in a typical month (number)Mobile-cellular telephone subscriptions (per 100 people)Individuals using the Internet (%)
Latin America & Caribbean Lower middle income
Guatemala
2005 2013 2013
Lower
middle-
income
groupCountry data
12.7 15.5 2,5614.7 6.2 1,0142.5 2.8 5.3
2,070 3,340 2,0743.1 3.1 5.8
13.4 11.3 17.029.3 29.0 32.120.2 20.2 17.157.3 59.7 51.19.1 4.37.6 7.9
25.1 23.7 27.141.0 35.0 31.2
.. 73
39 19 2215 6 7
344 256 31518 17 25
3.0 3.0 2.9.. 24.9 15.9
4.2 4.3
0.6 0.5 1.1
9.2 10.2
3.8 3.9
65.8 69.8
22.8 26.2
35.3 17.8
8.0 11.9
712 3,538 402,6682.0 2.5 2.1
18.3 14.3 25.518.8 11.4 18.8
21.3 24.3 ..36.9 40.5 47.1
8.4 9.1 10.32.4 1.2 4.5
25.4 32.6 41.57.0 10.08.7 8.1 7.1
.. 8 2,437
776 1,212 62,268479 539 736
1.2 2.3
35.6 140.4 85.25.7 19.7 21.2
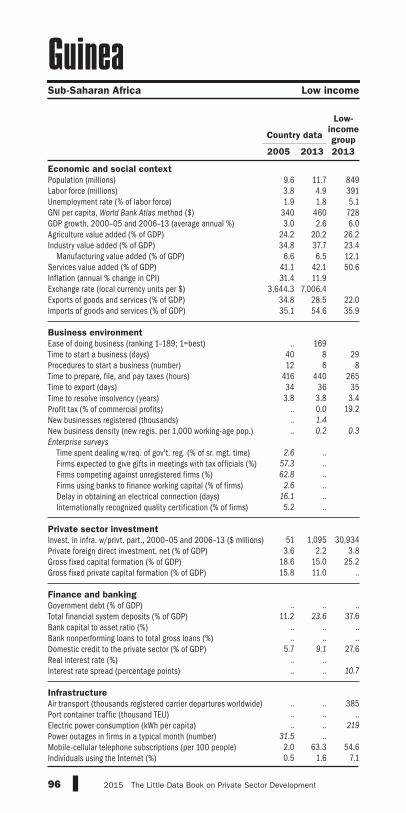
96 2015 The Little Data Book on Private Sector Development
Economic and social context
Population (millions)Labor force (millions)Unemployment rate (% of labor force)GNI per capita, World Bank Atlas method ($)GDP growth, 2000–05 and 2006–13 (average annual %)Agriculture value added (% of GDP)Industry value added (% of GDP) Manufacturing value added (% of GDP)Services value added (% of GDP)Inflation (annual % change in CPI)Exchange rate (local currency units per $)Exports of goods and services (% of GDP)Imports of goods and services (% of GDP)
Business environment
Ease of doing business (ranking 1–189; 1=best)Time to start a business (days)Procedures to start a business (number)Time to prepare, file, and pay taxes (hours)Time to export (days)Time to resolve insolvency (years)Profit tax (% of commercial profits)New businesses registered (thousands)New business density (new regis. per 1,000 working-age pop.)Enterprise surveys
Time spent dealing w/req. of gov't. reg. (% of sr. mgt. time) Firms expected to give gifts in meetings with tax officials (%) Firms competing against unregistered firms (%) Firms using banks to finance working capital (% of firms) Delay in obtaining an electrical connection (days) Internationally recognized quality certification (% of firms)
Private sector investment
Invest. in infra. w/privt. part., 2000–05 and 2006–13 ($ millions)Private foreign direct investment, net (% of GDP)Gross fixed capital formation (% of GDP)Gross fixed private capital formation (% of GDP)
Finance and banking
Government debt (% of GDP)Total financial system deposits (% of GDP)Bank capital to asset ratio (%)Bank nonperforming loans to total gross loans (%)Domestic credit to the private sector (% of GDP)Real interest rate (%)Interest rate spread (percentage points)
Infrastructure
Air transport (thousands registered carrier departures worldwide)Port container traffic (thousand TEU)Electric power consumption (kWh per capita)Power outages in firms in a typical month (number)Mobile-cellular telephone subscriptions (per 100 people)Individuals using the Internet (%)
Sub-Saharan Africa Low income
Guinea
2005 2013 2013
Low-
income
groupCountry data
9.6 11.7 8493.8 4.9 3911.9 1.8 5.1
340 460 7283.0 2.6 6.0
24.2 20.2 26.234.8 37.7 23.4
6.6 6.5 12.141.1 42.1 50.631.4 11.9
3,644.3 7,006.434.8 28.5 22.035.1 54.6 35.9
.. 169
40 8 2912 6 8
416 440 26534 36 353.8 3.8 3.4
.. 0.0 19.2
.. 1.4
.. 0.2 0.3
2.6 ..
57.3 ..62.8 ..
2.6 ..16.1 ..5.2 ..
51 1,095 30,934
3.6 2.2 3.818.6 15.0 25.215.8 11.0 ..
.. .. ..
11.2 23.6 37.6.. .. .... .. ..
5.7 9.1 27.6.. .... .. 10.7
.. .. 385.. .. .... .. 219
31.5 ..2.0 63.3 54.60.5 1.6 7.1

97The Little Data Book on Private Sector Development 2015
Economic and social context
Population (millions)Labor force (millions)Unemployment rate (% of labor force)GNI per capita, World Bank Atlas method ($)GDP growth, 2000–05 and 2006–13 (average annual %)Agriculture value added (% of GDP)Industry value added (% of GDP) Manufacturing value added (% of GDP)Services value added (% of GDP)Inflation (annual % change in CPI)Exchange rate (local currency units per $)Exports of goods and services (% of GDP)Imports of goods and services (% of GDP)
Business environment
Ease of doing business (ranking 1–189; 1=best)Time to start a business (days)Procedures to start a business (number)Time to prepare, file, and pay taxes (hours)Time to export (days)Time to resolve insolvency (years)Profit tax (% of commercial profits)New businesses registered (thousands)New business density (new regis. per 1,000 working-age pop.)Enterprise surveys
Time spent dealing w/req. of gov't. reg. (% of sr. mgt. time) Firms expected to give gifts in meetings with tax officials (%) Firms competing against unregistered firms (%) Firms using banks to finance working capital (% of firms) Delay in obtaining an electrical connection (days) Internationally recognized quality certification (% of firms)
Private sector investment
Invest. in infra. w/privt. part., 2000–05 and 2006–13 ($ millions)Private foreign direct investment, net (% of GDP)Gross fixed capital formation (% of GDP)Gross fixed private capital formation (% of GDP)
Finance and banking
Government debt (% of GDP)Total financial system deposits (% of GDP)Bank capital to asset ratio (%)Bank nonperforming loans to total gross loans (%)Domestic credit to the private sector (% of GDP)Real interest rate (%)Interest rate spread (percentage points)
Infrastructure
Air transport (thousands registered carrier departures worldwide)Port container traffic (thousand TEU)Electric power consumption (kWh per capita)Power outages in firms in a typical month (number)Mobile-cellular telephone subscriptions (per 100 people)Individuals using the Internet (%)
Sub-Saharan Africa Low income
Guinea-Bissau
2005 2013 2013
Low-
income
groupCountry data
1.4 1.7 8490.59 0.73 391
6.9 7.1 5.1400 590 7281.5 3.4 6.0
45.6 43.7 26.214.5 13.7 23.4
.. .. 12.139.9 42.7 50.63.3 0.7
527.5 494.0.. .. 22.0.. .. 35.9
.. 179
259 9 2917 9 8
208 208 26527 25 35
.. .. 3.4
.. 15.1 19.2
.. ..
.. .. 0.3
2.9 ..
22.7 ..53.7 ..
1.1 ..20.5 ..
8.4 ..
7 136 30,934
1.5 1.5 3.8.. .. 25.2.. .. ..
.. .. ..
3.8 20.2 37.6.. .. .... .. ..
1.1 14.0 27.6.. .... .. 10.7
.. .. 385.. .. .... .. 219
5.2 ..7.0 74.1 54.61.9 3.1 7.1

98 2015 The Little Data Book on Private Sector Development
Economic and social context
Population (millions)Labor force (millions)Unemployment rate (% of labor force)GNI per capita, World Bank Atlas method ($)GDP growth, 2000–05 and 2006–13 (average annual %)Agriculture value added (% of GDP)Industry value added (% of GDP) Manufacturing value added (% of GDP)Services value added (% of GDP)Inflation (annual % change in CPI)Exchange rate (local currency units per $)Exports of goods and services (% of GDP)Imports of goods and services (% of GDP)
Business environment
Ease of doing business (ranking 1–189; 1=best)Time to start a business (days)Procedures to start a business (number)Time to prepare, file, and pay taxes (hours)Time to export (days)Time to resolve insolvency (years)Profit tax (% of commercial profits)New businesses registered (thousands)New business density (new regis. per 1,000 working-age pop.)Enterprise surveys
Time spent dealing w/req. of gov't. reg. (% of sr. mgt. time) Firms expected to give gifts in meetings with tax officials (%) Firms competing against unregistered firms (%) Firms using banks to finance working capital (% of firms) Delay in obtaining an electrical connection (days) Internationally recognized quality certification (% of firms)
Private sector investment
Invest. in infra. w/privt. part., 2000–05 and 2006–13 ($ millions)Private foreign direct investment, net (% of GDP)Gross fixed capital formation (% of GDP)Gross fixed private capital formation (% of GDP)
Finance and banking
Government debt (% of GDP)Total financial system deposits (% of GDP)Bank capital to asset ratio (%)Bank nonperforming loans to total gross loans (%)Domestic credit to the private sector (% of GDP)Real interest rate (%)Interest rate spread (percentage points)
Infrastructure
Air transport (thousands registered carrier departures worldwide)Port container traffic (thousand TEU)Electric power consumption (kWh per capita)Power outages in firms in a typical month (number)Mobile-cellular telephone subscriptions (per 100 people)Individuals using the Internet (%)
Latin America & Caribbean Lower middle income
Guyana
2005 2013 2013
Lower
middle-
income
groupCountry data
0.76 0.80 2,5610.29 0.31 1,01412.6 11.1 5.3
1,030 3,750 2,0740.8 4.4 5.8
34.6 21.9 17.020.0 32.8 32.1
3.7 3.7 17.145.4 45.3 51.1
6.9 1.8199.9 205.484.6 .. 27.1
119.2 .. 31.2
.. 123
42 19 228 8 7
288 256 31521 19 25
3.0 3.0 2.9.. 21.3 15.9.. .... .. 1.1
.. 11.5
.. 4.6
.. 59.9
.. 59.4
.. 36.9
.. 29.5
89 26 402,6689.3 6.7 2.1
24.8 24.9 25.519.0 9.4 18.8
.. .. ..
84.7 57.5 47.1
.. .. 10.3
.. .. 4.557.1 44.6 41.56.2 13.3
12.0 12.4 7.1
.. 7 2,437.. .. 62,268.. .. 736
.. 8.4
37.0 69.4 85.213.8 33.0 21.2
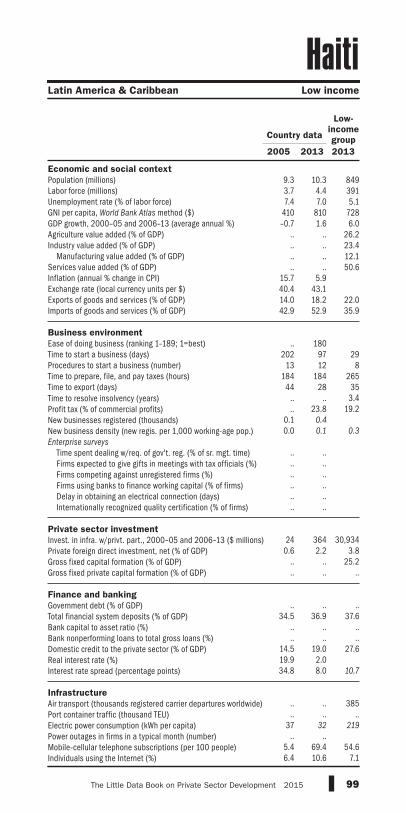
99The Little Data Book on Private Sector Development 2015
Economic and social context
Population (millions)Labor force (millions)Unemployment rate (% of labor force)GNI per capita, World Bank Atlas method ($)GDP growth, 2000–05 and 2006–13 (average annual %)Agriculture value added (% of GDP)Industry value added (% of GDP) Manufacturing value added (% of GDP)Services value added (% of GDP)Inflation (annual % change in CPI)Exchange rate (local currency units per $)Exports of goods and services (% of GDP)Imports of goods and services (% of GDP)
Business environment
Ease of doing business (ranking 1–189; 1=best)Time to start a business (days)Procedures to start a business (number)Time to prepare, file, and pay taxes (hours)Time to export (days)Time to resolve insolvency (years)Profit tax (% of commercial profits)New businesses registered (thousands)New business density (new regis. per 1,000 working-age pop.)Enterprise surveys
Time spent dealing w/req. of gov't. reg. (% of sr. mgt. time) Firms expected to give gifts in meetings with tax officials (%) Firms competing against unregistered firms (%) Firms using banks to finance working capital (% of firms) Delay in obtaining an electrical connection (days) Internationally recognized quality certification (% of firms)
Private sector investment
Invest. in infra. w/privt. part., 2000–05 and 2006–13 ($ millions)Private foreign direct investment, net (% of GDP)Gross fixed capital formation (% of GDP)Gross fixed private capital formation (% of GDP)
Finance and banking
Government debt (% of GDP)Total financial system deposits (% of GDP)Bank capital to asset ratio (%)Bank nonperforming loans to total gross loans (%)Domestic credit to the private sector (% of GDP)Real interest rate (%)Interest rate spread (percentage points)
Infrastructure
Air transport (thousands registered carrier departures worldwide)Port container traffic (thousand TEU)Electric power consumption (kWh per capita)Power outages in firms in a typical month (number)Mobile-cellular telephone subscriptions (per 100 people)Individuals using the Internet (%)
Latin America & Caribbean Low income
Haiti
2005 2013 2013
Low-
income
groupCountry data
9.3 10.3 8493.7 4.4 3917.4 7.0 5.1
410 810 728–0.7 1.6 6.0
.. .. 26.2
.. .. 23.4
.. .. 12.1
.. .. 50.615.7 5.940.4 43.114.0 18.2 22.042.9 52.9 35.9
.. 180
202 97 2913 12 8
184 184 26544 28 35
.. .. 3.4
.. 23.8 19.20.1 0.4
0.0 0.1 0.3
.. .... .... .... .... .... ..
24 364 30,934
0.6 2.2 3.8.. .. 25.2.. .. ..
.. .. ..
34.5 36.9 37.6.. .. .... .. ..
14.5 19.0 27.619.9 2.034.8 8.0 10.7
.. .. 385.. .. ..
37 32 219
.. ..5.4 69.4 54.66.4 10.6 7.1
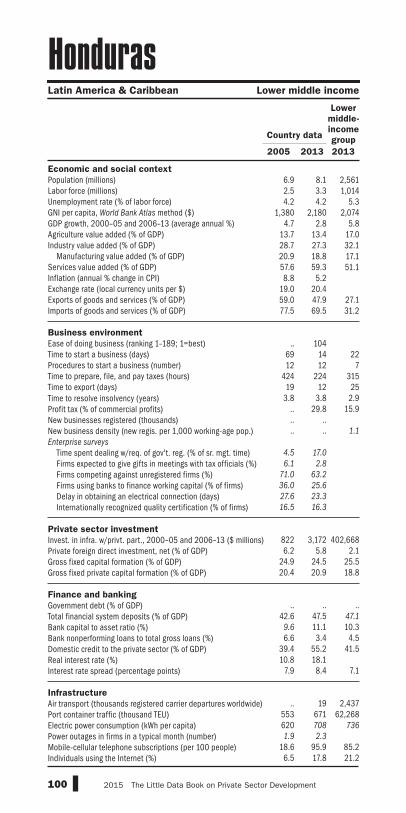
100 2015 The Little Data Book on Private Sector Development
Economic and social context
Population (millions)Labor force (millions)Unemployment rate (% of labor force)GNI per capita, World Bank Atlas method ($)GDP growth, 2000–05 and 2006–13 (average annual %)Agriculture value added (% of GDP)Industry value added (% of GDP) Manufacturing value added (% of GDP)Services value added (% of GDP)Inflation (annual % change in CPI)Exchange rate (local currency units per $)Exports of goods and services (% of GDP)Imports of goods and services (% of GDP)
Business environment
Ease of doing business (ranking 1–189; 1=best)Time to start a business (days)Procedures to start a business (number)Time to prepare, file, and pay taxes (hours)Time to export (days)Time to resolve insolvency (years)Profit tax (% of commercial profits)New businesses registered (thousands)New business density (new regis. per 1,000 working-age pop.)Enterprise surveys
Time spent dealing w/req. of gov't. reg. (% of sr. mgt. time) Firms expected to give gifts in meetings with tax officials (%) Firms competing against unregistered firms (%) Firms using banks to finance working capital (% of firms) Delay in obtaining an electrical connection (days) Internationally recognized quality certification (% of firms)
Private sector investment
Invest. in infra. w/privt. part., 2000–05 and 2006–13 ($ millions)Private foreign direct investment, net (% of GDP)Gross fixed capital formation (% of GDP)Gross fixed private capital formation (% of GDP)
Finance and banking
Government debt (% of GDP)Total financial system deposits (% of GDP)Bank capital to asset ratio (%)Bank nonperforming loans to total gross loans (%)Domestic credit to the private sector (% of GDP)Real interest rate (%)Interest rate spread (percentage points)
Infrastructure
Air transport (thousands registered carrier departures worldwide)Port container traffic (thousand TEU)Electric power consumption (kWh per capita)Power outages in firms in a typical month (number)Mobile-cellular telephone subscriptions (per 100 people)Individuals using the Internet (%)
Latin America & Caribbean Lower middle income
Honduras
2005 2013 2013
Lower
middle-
income
groupCountry data
6.9 8.1 2,5612.5 3.3 1,0144.2 4.2 5.3
1,380 2,180 2,0744.7 2.8 5.8
13.7 13.4 17.028.7 27.3 32.120.9 18.8 17.157.6 59.3 51.18.8 5.2
19.0 20.459.0 47.9 27.177.5 69.5 31.2
.. 104
69 14 2212 12 7
424 224 31519 12 25
3.8 3.8 2.9.. 29.8 15.9.. .... .. 1.1
4.5 17.0
6.1 2.8
71.0 63.2
36.0 25.6
27.6 23.3
16.5 16.3
822 3,172 402,6686.2 5.8 2.1
24.9 24.5 25.520.4 20.9 18.8
.. .. ..
42.6 47.5 47.1
9.6 11.1 10.36.6 3.4 4.5
39.4 55.2 41.510.8 18.1
7.9 8.4 7.1
.. 19 2,437
553 671 62,268620 708 736
1.9 2.3
18.6 95.9 85.26.5 17.8 21.2

101The Little Data Book on Private Sector Development 2015
Economic and social context
Population (millions)Labor force (millions)Unemployment rate (% of labor force)GNI per capita, World Bank Atlas method ($)GDP growth, 2000–05 and 2006–13 (average annual %)Agriculture value added (% of GDP)Industry value added (% of GDP) Manufacturing value added (% of GDP)Services value added (% of GDP)Inflation (annual % change in CPI)Exchange rate (local currency units per $)Exports of goods and services (% of GDP)Imports of goods and services (% of GDP)
Business environment
Ease of doing business (ranking 1–189; 1=best)Time to start a business (days)Procedures to start a business (number)Time to prepare, file, and pay taxes (hours)Time to export (days)Time to resolve insolvency (years)Profit tax (% of commercial profits)New businesses registered (thousands)New business density (new regis. per 1,000 working-age pop.)Enterprise surveys
Time spent dealing w/req. of gov't. reg. (% of sr. mgt. time) Firms expected to give gifts in meetings with tax officials (%) Firms competing against unregistered firms (%) Firms using banks to finance working capital (% of firms) Delay in obtaining an electrical connection (days) Internationally recognized quality certification (% of firms)
Private sector investment
Invest. in infra. w/privt. part., 2000–05 and 2006–13 ($ millions)Private foreign direct investment, net (% of GDP)Gross fixed capital formation (% of GDP)Gross fixed private capital formation (% of GDP)
Finance and banking
Government debt (% of GDP)Total financial system deposits (% of GDP)Bank capital to asset ratio (%)Bank nonperforming loans to total gross loans (%)Domestic credit to the private sector (% of GDP)Real interest rate (%)Interest rate spread (percentage points)
Infrastructure
Air transport (thousands registered carrier departures worldwide)Port container traffic (thousand TEU)Electric power consumption (kWh per capita)Power outages in firms in a typical month (number)Mobile-cellular telephone subscriptions (per 100 people)Individuals using the Internet (%)
High income
Hong Kong SAR, China
2005 2013 2013
High-
income
groupCountry data
6.8 7.2 1,3063.6 3.7 6465.6 3.3 7.7
28,890 38,420 39,8124.2 3.0 0.90.1 0.1 1.5
8.7 7.2 24.8
2.9 1.5 15.0
91.3 92.7 73.7
0.9 4.47.8 7.8
194.7 229.6 30.0182.4 228.7 29.6
.. 3
11 3 155 3 6
80 78 16614 6 121.1 0.8 2.0
.. 17.6 14.173.4 150.2
14.6 28.1 7.5
.. .... .... .... .... .... ..
.. .. ..
22.6 28.0 2.021.4 23.9 20.3
.. .. ..
31.6 .. 65.9
241.7 337.9 90.313.0 8.7 8.2
1.4 0.5 3.2143.1 219.5 150.9
7.9 3.66.5 5.0 ..
123 197 20,868
22,602 22,352 321,6025,878 5,949 8,906
.. ..123.9 237.4 121.0
56.9 74.2 78.2

102 2015 The Little Data Book on Private Sector Development
Economic and social context
Population (millions)Labor force (millions)Unemployment rate (% of labor force)GNI per capita, World Bank Atlas method ($)GDP growth, 2000–05 and 2006–13 (average annual %)Agriculture value added (% of GDP)Industry value added (% of GDP) Manufacturing value added (% of GDP)Services value added (% of GDP)Inflation (annual % change in CPI)Exchange rate (local currency units per $)Exports of goods and services (% of GDP)Imports of goods and services (% of GDP)
Business environment
Ease of doing business (ranking 1–189; 1=best)Time to start a business (days)Procedures to start a business (number)Time to prepare, file, and pay taxes (hours)Time to export (days)Time to resolve insolvency (years)Profit tax (% of commercial profits)New businesses registered (thousands)New business density (new regis. per 1,000 working-age pop.)Enterprise surveys
Time spent dealing w/req. of gov't. reg. (% of sr. mgt. time) Firms expected to give gifts in meetings with tax officials (%) Firms competing against unregistered firms (%) Firms using banks to finance working capital (% of firms) Delay in obtaining an electrical connection (days) Internationally recognized quality certification (% of firms)
Private sector investment
Invest. in infra. w/privt. part., 2000–05 and 2006–13 ($ millions)Private foreign direct investment, net (% of GDP)Gross fixed capital formation (% of GDP)Gross fixed private capital formation (% of GDP)
Finance and banking
Government debt (% of GDP)Total financial system deposits (% of GDP)Bank capital to asset ratio (%)Bank nonperforming loans to total gross loans (%)Domestic credit to the private sector (% of GDP)Real interest rate (%)Interest rate spread (percentage points)
Infrastructure
Air transport (thousands registered carrier departures worldwide)Port container traffic (thousand TEU)Electric power consumption (kWh per capita)Power outages in firms in a typical month (number)Mobile-cellular telephone subscriptions (per 100 people)Individuals using the Internet (%)
Europe & Central Asia Upper middle income
Hungary
2005 2013 2013
Upper
middle-
income
groupCountry data
10.1 9.9 2,4094.3 4.4 1,2647.2 10.2 5.9
10,410 13,260 7,6044.2 –0.7 5.74.3 4.4 7.6
31.4 30.2 36.722.2 22.8 23.064.3 65.4 55.6
3.6 1.7199.6 223.763.2 88.8 30.365.4 81.2 30.1
.. 54
38 5 266 4 7
340 277 32316 17 20
2.0 2.0 2.6.. 11.8 17.5
21.7 32.3
3.1 4.8 3.0
4.0 11.3
24.2 0.0.. 12.9
41.8 25.39.8 23.6
27.4 48.8
.. .. 426,038
7.6 –3.2 3.323.9 19.9 31.6
.. .. ..
67.9 84.7 ..40.7 43.1 48.08.3 9.1 10.72.3 16.7 3.6
50.5 50.8 98.06.0 3.23.4 3.8 6.0
47 92 7,427
.. .. 262,8963,771 3,895 2,932
.. 0.392.3 116.4 99.839.0 72.6 44.8

103The Little Data Book on Private Sector Development 2015
Economic and social context
Population (millions)Labor force (millions)Unemployment rate (% of labor force)GNI per capita, World Bank Atlas method ($)GDP growth, 2000–05 and 2006–13 (average annual %)Agriculture value added (% of GDP)Industry value added (% of GDP) Manufacturing value added (% of GDP)Services value added (% of GDP)Inflation (annual % change in CPI)Exchange rate (local currency units per $)Exports of goods and services (% of GDP)Imports of goods and services (% of GDP)
Business environment
Ease of doing business (ranking 1–189; 1=best)Time to start a business (days)Procedures to start a business (number)Time to prepare, file, and pay taxes (hours)Time to export (days)Time to resolve insolvency (years)Profit tax (% of commercial profits)New businesses registered (thousands)New business density (new regis. per 1,000 working-age pop.)Enterprise surveys
Time spent dealing w/req. of gov't. reg. (% of sr. mgt. time) Firms expected to give gifts in meetings with tax officials (%) Firms competing against unregistered firms (%) Firms using banks to finance working capital (% of firms) Delay in obtaining an electrical connection (days) Internationally recognized quality certification (% of firms)
Private sector investment
Invest. in infra. w/privt. part., 2000–05 and 2006–13 ($ millions)Private foreign direct investment, net (% of GDP)Gross fixed capital formation (% of GDP)Gross fixed private capital formation (% of GDP)
Finance and banking
Government debt (% of GDP)Total financial system deposits (% of GDP)Bank capital to asset ratio (%)Bank nonperforming loans to total gross loans (%)Domestic credit to the private sector (% of GDP)Real interest rate (%)Interest rate spread (percentage points)
Infrastructure
Air transport (thousands registered carrier departures worldwide)Port container traffic (thousand TEU)Electric power consumption (kWh per capita)Power outages in firms in a typical month (number)Mobile-cellular telephone subscriptions (per 100 people)Individuals using the Internet (%)
High income
Iceland
2005 2013 2013
High-
income
groupCountry data
0.30 0.32 1,3060.17 0.19 6462.6 5.6 7.7
50,730 46,290 39,8124.0 0.2 0.95.8 7.7 1.5
25.7 24.5 24.8
10.8 13.5 15.0
68.5 67.8 73.7
4.0 3.963.0 122.230.4 55.7 30.042.2 47.4 29.6
.. 125 4 155 5 6
140 140 16610 10 12
1.0 1.0 2.0.. 9.0 14.1
2.9 1.7
14.9 8.2 7.5
.. .... .... .... .... .... ..
.. .. ..
15.7 3.1 2.029.5 15.1 20.3
.. .. ..
38.2 112.6 65.9
65.9 81.6 90.37.3 23.3 8.21.1 4.3 3.2
240.3 91.5 150.910.9 6.0
7.2 .. ..
12 27 20,868
292 224 321,60227,988 52,374 8,906
.. ..95.4 108.1 121.087.0 96.5 78.2

104 2015 The Little Data Book on Private Sector Development
Economic and social context
Population (millions)Labor force (millions)Unemployment rate (% of labor force)GNI per capita, World Bank Atlas method ($)GDP growth, 2000–05 and 2006–13 (average annual %)Agriculture value added (% of GDP)Industry value added (% of GDP) Manufacturing value added (% of GDP)Services value added (% of GDP)Inflation (annual % change in CPI)Exchange rate (local currency units per $)Exports of goods and services (% of GDP)Imports of goods and services (% of GDP)
Business environment
Ease of doing business (ranking 1–189; 1=best)Time to start a business (days)Procedures to start a business (number)Time to prepare, file, and pay taxes (hours)Time to export (days)Time to resolve insolvency (years)Profit tax (% of commercial profits)New businesses registered (thousands)New business density (new regis. per 1,000 working-age pop.)Enterprise surveys
Time spent dealing w/req. of gov't. reg. (% of sr. mgt. time) Firms expected to give gifts in meetings with tax officials (%) Firms competing against unregistered firms (%) Firms using banks to finance working capital (% of firms) Delay in obtaining an electrical connection (days) Internationally recognized quality certification (% of firms)
Private sector investment
Invest. in infra. w/privt. part., 2000–05 and 2006–13 ($ millions)Private foreign direct investment, net (% of GDP)Gross fixed capital formation (% of GDP)Gross fixed private capital formation (% of GDP)
Finance and banking
Government debt (% of GDP)Total financial system deposits (% of GDP)Bank capital to asset ratio (%)Bank nonperforming loans to total gross loans (%)Domestic credit to the private sector (% of GDP)Real interest rate (%)Interest rate spread (percentage points)
Infrastructure
Air transport (thousands registered carrier departures worldwide)Port container traffic (thousand TEU)Electric power consumption (kWh per capita)Power outages in firms in a typical month (number)Mobile-cellular telephone subscriptions (per 100 people)Individuals using the Internet (%)
South Asia Lower middle income
India
2005 2013 2013
Lower
middle-
income
groupCountry data
1,127.1 1,252.1 2,561464.5 481.2 1,014
4.4 3.6 5.3740 1,570 2,0746.7 7.3 5.8
18.8 18.0 17.028.1 30.7 32.115.4 17.3 17.153.1 51.3 51.14.2 10.9
44.3 60.519.3 25.2 27.122.0 28.1 31.2
.. 142
70 28 2211 12 7
264 243 31527 17 25
4.3 4.3 2.9.. 25.3 15.9
38.1 99.6
0.1 0.1 1.1
6.7 1.9
52.3 15.3.. 50.1
36.4 36.429.5 21.922.5 27.5
33,775 275,483 402,668
0.9 1.5 2.130.3 29.7 25.523.0 21.9 18.8
61.2 50.3 ..53.7 65.6 47.1
6.6 6.9 10.35.2 4.0 4.5
39.4 51.9 41.56.2 3.8
.. .. 7.1
330 681 2,437
4,982 10,653 62,268461 684 736
.. 13.88.0 70.8 85.22.4 15.1 21.2

105The Little Data Book on Private Sector Development 2015
Economic and social context
Population (millions)Labor force (millions)Unemployment rate (% of labor force)GNI per capita, World Bank Atlas method ($)GDP growth, 2000–05 and 2006–13 (average annual %)Agriculture value added (% of GDP)Industry value added (% of GDP) Manufacturing value added (% of GDP)Services value added (% of GDP)Inflation (annual % change in CPI)Exchange rate (local currency units per $)Exports of goods and services (% of GDP)Imports of goods and services (% of GDP)
Business environment
Ease of doing business (ranking 1–189; 1=best)Time to start a business (days)Procedures to start a business (number)Time to prepare, file, and pay taxes (hours)Time to export (days)Time to resolve insolvency (years)Profit tax (% of commercial profits)New businesses registered (thousands)New business density (new regis. per 1,000 working-age pop.)Enterprise surveys
Time spent dealing w/req. of gov't. reg. (% of sr. mgt. time) Firms expected to give gifts in meetings with tax officials (%) Firms competing against unregistered firms (%) Firms using banks to finance working capital (% of firms) Delay in obtaining an electrical connection (days) Internationally recognized quality certification (% of firms)
Private sector investment
Invest. in infra. w/privt. part., 2000–05 and 2006–13 ($ millions)Private foreign direct investment, net (% of GDP)Gross fixed capital formation (% of GDP)Gross fixed private capital formation (% of GDP)
Finance and banking
Government debt (% of GDP)Total financial system deposits (% of GDP)Bank capital to asset ratio (%)Bank nonperforming loans to total gross loans (%)Domestic credit to the private sector (% of GDP)Real interest rate (%)Interest rate spread (percentage points)
Infrastructure
Air transport (thousands registered carrier departures worldwide)Port container traffic (thousand TEU)Electric power consumption (kWh per capita)Power outages in firms in a typical month (number)Mobile-cellular telephone subscriptions (per 100 people)Individuals using the Internet (%)
East Asia & Pacific Lower middle income
Indonesia
2005 2013 2013
Lower
middle-
income
groupCountry data
224.5 249.9 2,561106.4 120.3 1,014
11.2 6.3 5.31,230 3,580 2,074
4.7 5.9 5.813.1 14.4 17.046.5 45.7 32.127.4 23.7 17.140.3 39.9 51.110.5 6.4
9,704.7 10,461.234.1 23.7 27.129.9 25.7 31.2
.. 114
151 53 2212 10 7
560 254 31522 17 255.5 1.9 2.9
.. 16.7 15.923.3 47.5
0.2 0.3 1.1
.. .... .... .... .... .... ..
8,168 31,978 402,668
2.9 2.7 2.123.6 31.7 25.5
.. .. 18.8
47.3 .. ..38.8 36.4 47.1
8.7 12.5 10.37.3 1.7 4.5
26.4 37.9 41.5–0.2 7.06.0 5.4 7.1
321 664 2,437
5,503 10,790 62,268504 680 736
.. ..20.9 125.4 85.2
3.6 15.8 21.2

106 2015 The Little Data Book on Private Sector Development
Economic and social context
Population (millions)Labor force (millions)Unemployment rate (% of labor force)GNI per capita, World Bank Atlas method ($)GDP growth, 2000–05 and 2006–13 (average annual %)Agriculture value added (% of GDP)Industry value added (% of GDP) Manufacturing value added (% of GDP)Services value added (% of GDP)Inflation (annual % change in CPI)Exchange rate (local currency units per $)Exports of goods and services (% of GDP)Imports of goods and services (% of GDP)
Business environment
Ease of doing business (ranking 1–189; 1=best)Time to start a business (days)Procedures to start a business (number)Time to prepare, file, and pay taxes (hours)Time to export (days)Time to resolve insolvency (years)Profit tax (% of commercial profits)New businesses registered (thousands)New business density (new regis. per 1,000 working-age pop.)Enterprise surveys
Time spent dealing w/req. of gov't. reg. (% of sr. mgt. time) Firms expected to give gifts in meetings with tax officials (%) Firms competing against unregistered firms (%) Firms using banks to finance working capital (% of firms) Delay in obtaining an electrical connection (days) Internationally recognized quality certification (% of firms)
Private sector investment
Invest. in infra. w/privt. part., 2000–05 and 2006–13 ($ millions)Private foreign direct investment, net (% of GDP)Gross fixed capital formation (% of GDP)Gross fixed private capital formation (% of GDP)
Finance and banking
Government debt (% of GDP)Total financial system deposits (% of GDP)Bank capital to asset ratio (%)Bank nonperforming loans to total gross loans (%)Domestic credit to the private sector (% of GDP)Real interest rate (%)Interest rate spread (percentage points)
Infrastructure
Air transport (thousands registered carrier departures worldwide)Port container traffic (thousand TEU)Electric power consumption (kWh per capita)Power outages in firms in a typical month (number)Mobile-cellular telephone subscriptions (per 100 people)Individuals using the Internet (%)
Middle East & North Africa Upper middle income
Iran, Islamic Rep.
2005 2013 2013
Upper
middle-
income
groupCountry data
70.2 77.4 2,40924.8 26.6 1,26412.1 13.2 5.9
2,530 5,780 7,6045.9 3.0 5.7
10.2 .. 7.644.7 .. 36.710.7 .. 23.045.1 .. 55.613.4 39.3
8,964.0 18,414.433.1 .. 30.324.7 .. 30.1
.. 130
27 12 267 6 7
344 344 32326 25 20
4.5 4.5 2.6.. 17.8 17.5.. .... .. 3.0
.. .... .... .... .... .... ..
1,345 3,419 426,038
1.5 0.8 3.327.0 .. 31.617.9 .. ..
.. .. ..
33.8 15.6 48.0.. .. 10.7.. .. 3.6
30.0 12.2 98.0–0.9 –5.84.2 –3.8 6.0
121 157 7,427
1,326 3,179 262,8962,068 2,649 2,932
.. ..12.1 84.2 99.88.1 31.4 44.8

107The Little Data Book on Private Sector Development 2015
Economic and social context
Population (millions)Labor force (millions)Unemployment rate (% of labor force)GNI per capita, World Bank Atlas method ($)GDP growth, 2000–05 and 2006–13 (average annual %)Agriculture value added (% of GDP)Industry value added (% of GDP) Manufacturing value added (% of GDP)Services value added (% of GDP)Inflation (annual % change in CPI)Exchange rate (local currency units per $)Exports of goods and services (% of GDP)Imports of goods and services (% of GDP)
Business environment
Ease of doing business (ranking 1–189; 1=best)Time to start a business (days)Procedures to start a business (number)Time to prepare, file, and pay taxes (hours)Time to export (days)Time to resolve insolvency (years)Profit tax (% of commercial profits)New businesses registered (thousands)New business density (new regis. per 1,000 working-age pop.)Enterprise surveys
Time spent dealing w/req. of gov't. reg. (% of sr. mgt. time) Firms expected to give gifts in meetings with tax officials (%) Firms competing against unregistered firms (%) Firms using banks to finance working capital (% of firms) Delay in obtaining an electrical connection (days) Internationally recognized quality certification (% of firms)
Private sector investment
Invest. in infra. w/privt. part., 2000–05 and 2006–13 ($ millions)Private foreign direct investment, net (% of GDP)Gross fixed capital formation (% of GDP)Gross fixed private capital formation (% of GDP)
Finance and banking
Government debt (% of GDP)Total financial system deposits (% of GDP)Bank capital to asset ratio (%)Bank nonperforming loans to total gross loans (%)Domestic credit to the private sector (% of GDP)Real interest rate (%)Interest rate spread (percentage points)
Infrastructure
Air transport (thousands registered carrier departures worldwide)Port container traffic (thousand TEU)Electric power consumption (kWh per capita)Power outages in firms in a typical month (number)Mobile-cellular telephone subscriptions (per 100 people)Individuals using the Internet (%)
Middle East & North Africa Upper middle income
Iraq
2005 2013 2013
Upper
middle-
income
groupCountry data
27.4 33.4 2,4096.6 8.5 1,264
18.0 16.0 5.91,990 6,720 7,604
–1.1 6.8 5.7.. .. 7.6.. .. 36.7.. .. 23.0.. .. 55.6
37.0 1.91,472.0 1,166.0
54.3 34.0 30.361.4 32.7 30.1
.. 156
32 29 2611 10 7
312 312 323102 80 20
.. .. 2.6
.. 14.3 17.57.8 2.3
0.5 0.1 3.0
.. 6.5
.. 29.1
.. 49.3
.. 4.6
.. 19.6
.. 4.2
984 8,970 426,0381.0 1.2 3.3
13.8 16.7 31.6.. .. ..
.. .. ..
7.4 18.5 48.0.. .. 10.7.. .. 3.6
1.6 6.5 98.0–14.1 11.1
7.1 7.4 6.0
.. 5 7,427.. .. 262,896
823 1,343 2,932
.. 41.0
5.6 96.1 99.80.9 9.2 44.8

108 2015 The Little Data Book on Private Sector Development
Economic and social context
Population (millions)Labor force (millions)Unemployment rate (% of labor force)GNI per capita, World Bank Atlas method ($)GDP growth, 2000–05 and 2006–13 (average annual %)Agriculture value added (% of GDP)Industry value added (% of GDP) Manufacturing value added (% of GDP)Services value added (% of GDP)Inflation (annual % change in CPI)Exchange rate (local currency units per $)Exports of goods and services (% of GDP)Imports of goods and services (% of GDP)
Business environment
Ease of doing business (ranking 1–189; 1=best)Time to start a business (days)Procedures to start a business (number)Time to prepare, file, and pay taxes (hours)Time to export (days)Time to resolve insolvency (years)Profit tax (% of commercial profits)New businesses registered (thousands)New business density (new regis. per 1,000 working-age pop.)Enterprise surveys
Time spent dealing w/req. of gov't. reg. (% of sr. mgt. time) Firms expected to give gifts in meetings with tax officials (%) Firms competing against unregistered firms (%) Firms using banks to finance working capital (% of firms) Delay in obtaining an electrical connection (days) Internationally recognized quality certification (% of firms)
Private sector investment
Invest. in infra. w/privt. part., 2000–05 and 2006–13 ($ millions)Private foreign direct investment, net (% of GDP)Gross fixed capital formation (% of GDP)Gross fixed private capital formation (% of GDP)
Finance and banking
Government debt (% of GDP)Total financial system deposits (% of GDP)Bank capital to asset ratio (%)Bank nonperforming loans to total gross loans (%)Domestic credit to the private sector (% of GDP)Real interest rate (%)Interest rate spread (percentage points)
Infrastructure
Air transport (thousands registered carrier departures worldwide)Port container traffic (thousand TEU)Electric power consumption (kWh per capita)Power outages in firms in a typical month (number)Mobile-cellular telephone subscriptions (per 100 people)Individuals using the Internet (%)
High income
Ireland
2005 2013 2013
High-
income
groupCountry data
4.2 4.6 1,3062.1 2.2 6464.3 13.1 7.7
43,570 43,090 39,8124.7 –0.7 0.91.3 1.6 1.5
33.0 24.1 24.8
21.2 19.4 15.0
65.7 74.3 73.7
2.4 0.50.8 0.8
78.3 105.3 30.067.1 84.5 29.6
.. 13
18 6 154 4 6
76 80 1668 8 12
0.4 0.4 2.0.. 12.4 14.1
17.0 13.8
6.0 4.5 7.5
2.3 ..
11.0 .... ..
46.1 ..28.3 ..17.2 ..
.. .. ..
22.4 21.5 2.028.9 15.2 20.3
.. .. ..
31.8 120.5 65.9
86.9 104.4 90.34.3 8.1 8.20.5 25.3 3.2
154.1 168.0 150.9–0.3 ..2.6 .. ..
304 669 20,868973 794 321,602
6,242 5,701 8,906
.. ..102.7 102.8 121.0
41.6 78.2 78.2

109The Little Data Book on Private Sector Development 2015
Economic and social context
Population (millions)Labor force (millions)Unemployment rate (% of labor force)GNI per capita, World Bank Atlas method ($)GDP growth, 2000–05 and 2006–13 (average annual %)Agriculture value added (% of GDP)Industry value added (% of GDP) Manufacturing value added (% of GDP)Services value added (% of GDP)Inflation (annual % change in CPI)Exchange rate (local currency units per $)Exports of goods and services (% of GDP)Imports of goods and services (% of GDP)
Business environment
Ease of doing business (ranking 1–189; 1=best)Time to start a business (days)Procedures to start a business (number)Time to prepare, file, and pay taxes (hours)Time to export (days)Time to resolve insolvency (years)Profit tax (% of commercial profits)New businesses registered (thousands)New business density (new regis. per 1,000 working-age pop.)Enterprise surveys
Time spent dealing w/req. of gov't. reg. (% of sr. mgt. time) Firms expected to give gifts in meetings with tax officials (%) Firms competing against unregistered firms (%) Firms using banks to finance working capital (% of firms) Delay in obtaining an electrical connection (days) Internationally recognized quality certification (% of firms)
Private sector investment
Invest. in infra. w/privt. part., 2000–05 and 2006–13 ($ millions)Private foreign direct investment, net (% of GDP)Gross fixed capital formation (% of GDP)Gross fixed private capital formation (% of GDP)
Finance and banking
Government debt (% of GDP)Total financial system deposits (% of GDP)Bank capital to asset ratio (%)Bank nonperforming loans to total gross loans (%)Domestic credit to the private sector (% of GDP)Real interest rate (%)Interest rate spread (percentage points)
Infrastructure
Air transport (thousands registered carrier departures worldwide)Port container traffic (thousand TEU)Electric power consumption (kWh per capita)Power outages in firms in a typical month (number)Mobile-cellular telephone subscriptions (per 100 people)Individuals using the Internet (%)
High income
Isle of Man
2005 2013 2013
High-
income
groupCountry data
0.08 0.09 1,306.. .. 646.. .. 7.7
38,440 .. 39,8125.8 .. 0.9
.. .. 1.5
.. .. 24.8
.. .. 15.0
.. .. 73.7
.. ..0.6 ..
.. .. 30.0
.. .. 29.6
.. .... .. 15.. .. 6.. .. 166.. .. 12.. .. 2.0.. .. 14.1
2.7 2.3
54.4 45.3 7.5
.. .... .... .... .... .... ..
.. .. .... .. 2.0.. .. 20.3.. .. .. .. .. 65.9
.. .. 90.3
.. .. 8.2
.. .. 3.2
.. .. 150.9
.. ..
.. .. ..
.. .. 20,868.. .. 321,602.. .. 8,906
.. ..
.. .. 121.0
.. .. 78.2
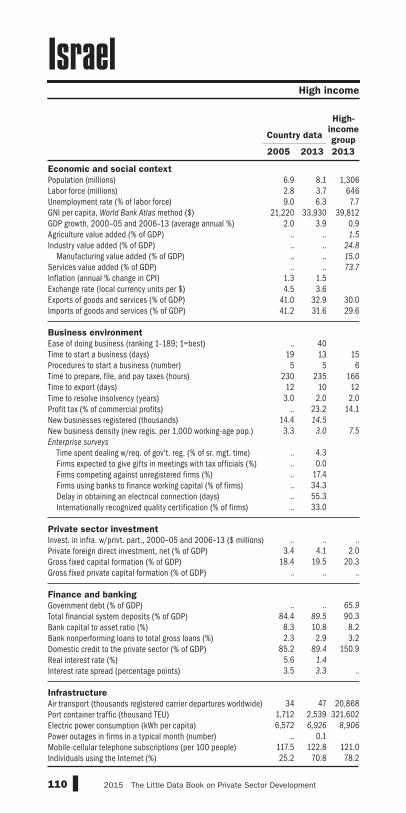
110 2015 The Little Data Book on Private Sector Development
Economic and social context
Population (millions)Labor force (millions)Unemployment rate (% of labor force)GNI per capita, World Bank Atlas method ($)GDP growth, 2000–05 and 2006–13 (average annual %)Agriculture value added (% of GDP)Industry value added (% of GDP) Manufacturing value added (% of GDP)Services value added (% of GDP)Inflation (annual % change in CPI)Exchange rate (local currency units per $)Exports of goods and services (% of GDP)Imports of goods and services (% of GDP)
Business environment
Ease of doing business (ranking 1–189; 1=best)Time to start a business (days)Procedures to start a business (number)Time to prepare, file, and pay taxes (hours)Time to export (days)Time to resolve insolvency (years)Profit tax (% of commercial profits)New businesses registered (thousands)New business density (new regis. per 1,000 working-age pop.)Enterprise surveys
Time spent dealing w/req. of gov't. reg. (% of sr. mgt. time) Firms expected to give gifts in meetings with tax officials (%) Firms competing against unregistered firms (%) Firms using banks to finance working capital (% of firms) Delay in obtaining an electrical connection (days) Internationally recognized quality certification (% of firms)
Private sector investment
Invest. in infra. w/privt. part., 2000–05 and 2006–13 ($ millions)Private foreign direct investment, net (% of GDP)Gross fixed capital formation (% of GDP)Gross fixed private capital formation (% of GDP)
Finance and banking
Government debt (% of GDP)Total financial system deposits (% of GDP)Bank capital to asset ratio (%)Bank nonperforming loans to total gross loans (%)Domestic credit to the private sector (% of GDP)Real interest rate (%)Interest rate spread (percentage points)
Infrastructure
Air transport (thousands registered carrier departures worldwide)Port container traffic (thousand TEU)Electric power consumption (kWh per capita)Power outages in firms in a typical month (number)Mobile-cellular telephone subscriptions (per 100 people)Individuals using the Internet (%)
High income
Israel
2005 2013 2013
High-
income
groupCountry data
6.9 8.1 1,3062.8 3.7 6469.0 6.3 7.7
21,220 33,930 39,8122.0 3.9 0.9
.. .. 1.5
.. .. 24.8
.. .. 15.0
.. .. 73.7
1.3 1.54.5 3.6
41.0 32.9 30.041.2 31.6 29.6
.. 40
19 13 155 5 6
230 235 16612 10 123.0 2.0 2.0
.. 23.2 14.114.4 14.5
3.3 3.0 7.5
.. 4.3.. 0.0.. 17.4.. 34.3.. 55.3.. 33.0
.. .. ..
3.4 4.1 2.018.4 19.5 20.3
.. .. .. .. .. 65.9
84.4 89.5 90.38.3 10.8 8.22.3 2.9 3.2
85.2 89.4 150.95.6 1.4
3.5 3.3 ..
34 47 20,868
1,712 2,539 321,6026,572 6,926 8,906
.. 0.1117.5 122.8 121.025.2 70.8 78.2
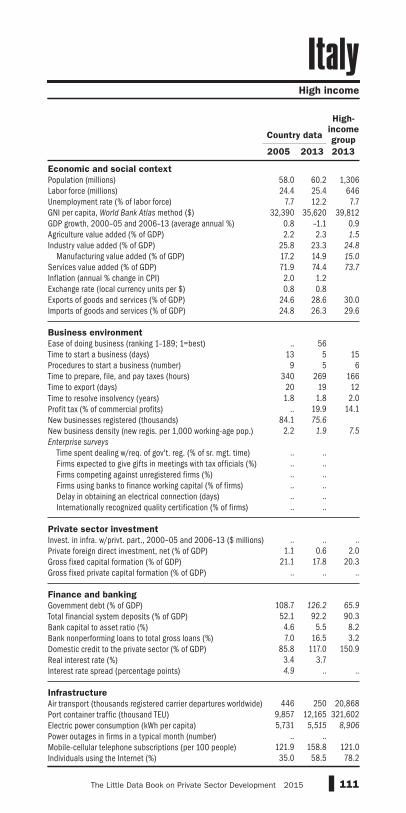
111The Little Data Book on Private Sector Development 2015
Economic and social context
Population (millions)Labor force (millions)Unemployment rate (% of labor force)GNI per capita, World Bank Atlas method ($)GDP growth, 2000–05 and 2006–13 (average annual %)Agriculture value added (% of GDP)Industry value added (% of GDP) Manufacturing value added (% of GDP)Services value added (% of GDP)Inflation (annual % change in CPI)Exchange rate (local currency units per $)Exports of goods and services (% of GDP)Imports of goods and services (% of GDP)
Business environment
Ease of doing business (ranking 1–189; 1=best)Time to start a business (days)Procedures to start a business (number)Time to prepare, file, and pay taxes (hours)Time to export (days)Time to resolve insolvency (years)Profit tax (% of commercial profits)New businesses registered (thousands)New business density (new regis. per 1,000 working-age pop.)Enterprise surveys
Time spent dealing w/req. of gov't. reg. (% of sr. mgt. time) Firms expected to give gifts in meetings with tax officials (%) Firms competing against unregistered firms (%) Firms using banks to finance working capital (% of firms) Delay in obtaining an electrical connection (days) Internationally recognized quality certification (% of firms)
Private sector investment
Invest. in infra. w/privt. part., 2000–05 and 2006–13 ($ millions)Private foreign direct investment, net (% of GDP)Gross fixed capital formation (% of GDP)Gross fixed private capital formation (% of GDP)
Finance and banking
Government debt (% of GDP)Total financial system deposits (% of GDP)Bank capital to asset ratio (%)Bank nonperforming loans to total gross loans (%)Domestic credit to the private sector (% of GDP)Real interest rate (%)Interest rate spread (percentage points)
Infrastructure
Air transport (thousands registered carrier departures worldwide)Port container traffic (thousand TEU)Electric power consumption (kWh per capita)Power outages in firms in a typical month (number)Mobile-cellular telephone subscriptions (per 100 people)Individuals using the Internet (%)
High income
Italy
2005 2013 2013
High-
income
groupCountry data
58.0 60.2 1,30624.4 25.4 646
7.7 12.2 7.732,390 35,620 39,812
0.8 –1.1 0.92.2 2.3 1.5
25.8 23.3 24.8
17.2 14.9 15.0
71.9 74.4 73.7
2.0 1.20.8 0.8
24.6 28.6 30.024.8 26.3 29.6
.. 56
13 5 159 5 6
340 269 16620 19 121.8 1.8 2.0
.. 19.9 14.184.1 75.6
2.2 1.9 7.5
.. .... .... .... .... .... ..
.. .. ..
1.1 0.6 2.021.1 17.8 20.3
.. .. ..
108.7 126.2 65.9
52.1 92.2 90.34.6 5.5 8.27.0 16.5 3.2
85.8 117.0 150.93.4 3.74.9 .. ..
446 250 20,868
9,857 12,165 321,6025,731 5,515 8,906
.. ..121.9 158.8 121.035.0 58.5 78.2

112 2015 The Little Data Book on Private Sector Development
Economic and social context
Population (millions)Labor force (millions)Unemployment rate (% of labor force)GNI per capita, World Bank Atlas method ($)GDP growth, 2000–05 and 2006–13 (average annual %)Agriculture value added (% of GDP)Industry value added (% of GDP) Manufacturing value added (% of GDP)Services value added (% of GDP)Inflation (annual % change in CPI)Exchange rate (local currency units per $)Exports of goods and services (% of GDP)Imports of goods and services (% of GDP)
Business environment
Ease of doing business (ranking 1–189; 1=best)Time to start a business (days)Procedures to start a business (number)Time to prepare, file, and pay taxes (hours)Time to export (days)Time to resolve insolvency (years)Profit tax (% of commercial profits)New businesses registered (thousands)New business density (new regis. per 1,000 working-age pop.)Enterprise surveys
Time spent dealing w/req. of gov't. reg. (% of sr. mgt. time) Firms expected to give gifts in meetings with tax officials (%) Firms competing against unregistered firms (%) Firms using banks to finance working capital (% of firms) Delay in obtaining an electrical connection (days) Internationally recognized quality certification (% of firms)
Private sector investment
Invest. in infra. w/privt. part., 2000–05 and 2006–13 ($ millions)Private foreign direct investment, net (% of GDP)Gross fixed capital formation (% of GDP)Gross fixed private capital formation (% of GDP)
Finance and banking
Government debt (% of GDP)Total financial system deposits (% of GDP)Bank capital to asset ratio (%)Bank nonperforming loans to total gross loans (%)Domestic credit to the private sector (% of GDP)Real interest rate (%)Interest rate spread (percentage points)
Infrastructure
Air transport (thousands registered carrier departures worldwide)Port container traffic (thousand TEU)Electric power consumption (kWh per capita)Power outages in firms in a typical month (number)Mobile-cellular telephone subscriptions (per 100 people)Individuals using the Internet (%)
Latin America & Caribbean Upper middle income
Jamaica
2005 2013 2013
Upper
middle-
income
groupCountry data
2.6 2.7 2,4091.2 1.3 1,264
10.9 15.0 5.9.. 5,220 7,604.. –0.6 5.7
5.9 6.7 7.625.0 20.8 36.78.8 9.2 23.0
69.0 72.5 55.615.3 9.363.2 100.235.3 30.4 30.355.2 53.0 30.1
.. 588 15 266 2 7
414 368 32319 20 201.1 1.1 2.6
.. 19.5 17.51.7 1.9
1.0 1.1 3.0
.. 1.7
.. 14.3
.. 66.4
.. 53.1
.. 20.5
.. 16.5
1,365 1,320 426,038
5.8 4.6 3.326.7 19.7 31.6
.. .. ..
121.1 .. ..40.4 41.0 48.0
9.3 .. 10.72.9 .. 3.6
21.0 29.6 98.05.3 8.79.9 14.1 6.0
22 0 7,427
1,672 2,319 262,8962,484 1,553 2,932
.. 2.5
73.9 102.2 99.812.8 37.8 44.8

113The Little Data Book on Private Sector Development 2015
Economic and social context
Population (millions)Labor force (millions)Unemployment rate (% of labor force)GNI per capita, World Bank Atlas method ($)GDP growth, 2000–05 and 2006–13 (average annual %)Agriculture value added (% of GDP)Industry value added (% of GDP) Manufacturing value added (% of GDP)Services value added (% of GDP)Inflation (annual % change in CPI)Exchange rate (local currency units per $)Exports of goods and services (% of GDP)Imports of goods and services (% of GDP)
Business environment
Ease of doing business (ranking 1–189; 1=best)Time to start a business (days)Procedures to start a business (number)Time to prepare, file, and pay taxes (hours)Time to export (days)Time to resolve insolvency (years)Profit tax (% of commercial profits)New businesses registered (thousands)New business density (new regis. per 1,000 working-age pop.)Enterprise surveys
Time spent dealing w/req. of gov't. reg. (% of sr. mgt. time) Firms expected to give gifts in meetings with tax officials (%) Firms competing against unregistered firms (%) Firms using banks to finance working capital (% of firms) Delay in obtaining an electrical connection (days) Internationally recognized quality certification (% of firms)
Private sector investment
Invest. in infra. w/privt. part., 2000–05 and 2006–13 ($ millions)Private foreign direct investment, net (% of GDP)Gross fixed capital formation (% of GDP)Gross fixed private capital formation (% of GDP)
Finance and banking
Government debt (% of GDP)Total financial system deposits (% of GDP)Bank capital to asset ratio (%)Bank nonperforming loans to total gross loans (%)Domestic credit to the private sector (% of GDP)Real interest rate (%)Interest rate spread (percentage points)
Infrastructure
Air transport (thousands registered carrier departures worldwide)Port container traffic (thousand TEU)Electric power consumption (kWh per capita)Power outages in firms in a typical month (number)Mobile-cellular telephone subscriptions (per 100 people)Individuals using the Internet (%)
High income
Japan
2005 2013 2013
High-
income
groupCountry data
127.8 127.3 1,30666.6 65.5 646
4.4 4.0 7.739,140 46,330 39,812
1.3 0.2 0.91.2 1.2 1.5
28.1 25.6 24.8
19.9 18.2 15.0
70.6 73.2 73.7
–0.3 0.4110.2 97.614.3 16.2 30.012.9 19.0 29.6
.. 29
30 11 1511 8 6
315 330 16611 11 12
0.6 0.6 2.0.. 28.9 14.1
80.0 91.8
0.9 1.2 7.5
.. .... .... .... .... .... ..
.. .. ..
0.1 0.1 2.022.3 21.7 20.317.5 16.9 ..
144.3 196.0 65.9
191.3 223.4 90.34.8 5.5 8.21.8 2.3 3.2
194.2 188.3 150.93.0 1.91.4 0.8 ..
652 916 20,868
17,055 19,688 321,6028,213 7,848 8,906
.. ..76.0 117.6 121.066.9 86.3 78.2

114 2015 The Little Data Book on Private Sector Development
Economic and social context
Population (millions)Labor force (millions)Unemployment rate (% of labor force)GNI per capita, World Bank Atlas method ($)GDP growth, 2000–05 and 2006–13 (average annual %)Agriculture value added (% of GDP)Industry value added (% of GDP) Manufacturing value added (% of GDP)Services value added (% of GDP)Inflation (annual % change in CPI)Exchange rate (local currency units per $)Exports of goods and services (% of GDP)Imports of goods and services (% of GDP)
Business environment
Ease of doing business (ranking 1–189; 1=best)Time to start a business (days)Procedures to start a business (number)Time to prepare, file, and pay taxes (hours)Time to export (days)Time to resolve insolvency (years)Profit tax (% of commercial profits)New businesses registered (thousands)New business density (new regis. per 1,000 working-age pop.)Enterprise surveys
Time spent dealing w/req. of gov't. reg. (% of sr. mgt. time) Firms expected to give gifts in meetings with tax officials (%) Firms competing against unregistered firms (%) Firms using banks to finance working capital (% of firms) Delay in obtaining an electrical connection (days) Internationally recognized quality certification (% of firms)
Private sector investment
Invest. in infra. w/privt. part., 2000–05 and 2006–13 ($ millions)Private foreign direct investment, net (% of GDP)Gross fixed capital formation (% of GDP)Gross fixed private capital formation (% of GDP)
Finance and banking
Government debt (% of GDP)Total financial system deposits (% of GDP)Bank capital to asset ratio (%)Bank nonperforming loans to total gross loans (%)Domestic credit to the private sector (% of GDP)Real interest rate (%)Interest rate spread (percentage points)
Infrastructure
Air transport (thousands registered carrier departures worldwide)Port container traffic (thousand TEU)Electric power consumption (kWh per capita)Power outages in firms in a typical month (number)Mobile-cellular telephone subscriptions (per 100 people)Individuals using the Internet (%)
Middle East & North Africa Upper middle income
Jordan
2005 2013 2013
Upper
middle-
income
groupCountry data
5.4 6.5 2,4091.4 1.8 1,264
14.9 12.6 5.92,490 4,950 7,604
6.3 4.2 5.73.1 3.4 7.6
28.6 29.7 36.717.9 19.4 23.068.3 66.9 55.6
3.5 5.50.7 0.7
52.7 42.5 30.394.2 71.3 30.1
.. 117
16 12 2610 7 7
136 151 32328 12 203.0 3.0 2.6
.. 13.2 17.51.8 3.9
0.6 1.0 3.0
6.7 5.30.9 14.4
.. 20.618.3 26.147.1 13.215.5 6.8
1,758 6,443 426,03815.8 5.3 3.330.6 27.2 31.624.5 23.6 ..
80.0 66.8 ..
116.2 95.8 48.08.2 12.9 10.76.6 7.0 3.6
88.1 72.3 98.05.5 3.24.7 4.2 6.0
20 39 7,427
414 759 262,8961,682 2,289 2,932
0.9 0.259.9 141.8 99.812.9 44.2 44.8
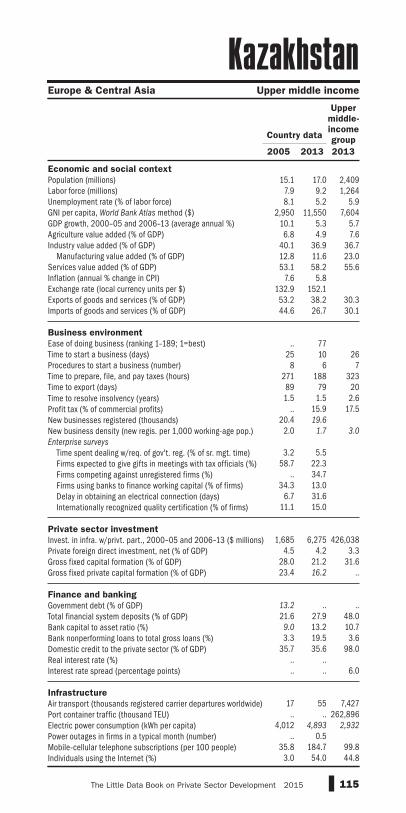
115The Little Data Book on Private Sector Development 2015
Economic and social context
Population (millions)Labor force (millions)Unemployment rate (% of labor force)GNI per capita, World Bank Atlas method ($)GDP growth, 2000–05 and 2006–13 (average annual %)Agriculture value added (% of GDP)Industry value added (% of GDP) Manufacturing value added (% of GDP)Services value added (% of GDP)Inflation (annual % change in CPI)Exchange rate (local currency units per $)Exports of goods and services (% of GDP)Imports of goods and services (% of GDP)
Business environment
Ease of doing business (ranking 1–189; 1=best)Time to start a business (days)Procedures to start a business (number)Time to prepare, file, and pay taxes (hours)Time to export (days)Time to resolve insolvency (years)Profit tax (% of commercial profits)New businesses registered (thousands)New business density (new regis. per 1,000 working-age pop.)Enterprise surveys
Time spent dealing w/req. of gov't. reg. (% of sr. mgt. time) Firms expected to give gifts in meetings with tax officials (%) Firms competing against unregistered firms (%) Firms using banks to finance working capital (% of firms) Delay in obtaining an electrical connection (days) Internationally recognized quality certification (% of firms)
Private sector investment
Invest. in infra. w/privt. part., 2000–05 and 2006–13 ($ millions)Private foreign direct investment, net (% of GDP)Gross fixed capital formation (% of GDP)Gross fixed private capital formation (% of GDP)
Finance and banking
Government debt (% of GDP)Total financial system deposits (% of GDP)Bank capital to asset ratio (%)Bank nonperforming loans to total gross loans (%)Domestic credit to the private sector (% of GDP)Real interest rate (%)Interest rate spread (percentage points)
Infrastructure
Air transport (thousands registered carrier departures worldwide)Port container traffic (thousand TEU)Electric power consumption (kWh per capita)Power outages in firms in a typical month (number)Mobile-cellular telephone subscriptions (per 100 people)Individuals using the Internet (%)
Europe & Central Asia Upper middle income
Kazakhstan
2005 2013 2013
Upper
middle-
income
groupCountry data
15.1 17.0 2,4097.9 9.2 1,2648.1 5.2 5.9
2,950 11,550 7,60410.1 5.3 5.76.8 4.9 7.6
40.1 36.9 36.712.8 11.6 23.053.1 58.2 55.6
7.6 5.8132.9 152.153.2 38.2 30.344.6 26.7 30.1
.. 77
25 10 268 6 7
271 188 32389 79 201.5 1.5 2.6
.. 15.9 17.520.4 19.6
2.0 1.7 3.0
3.2 5.5
58.7 22.3.. 34.7
34.3 13.06.7 31.6
11.1 15.0
1,685 6,275 426,038
4.5 4.2 3.328.0 21.2 31.623.4 16.2 ..
13.2 .. ..21.6 27.9 48.09.0 13.2 10.73.3 19.5 3.6
35.7 35.6 98.0.. .... .. 6.0
17 55 7,427.. .. 262,896
4,012 4,893 2,932
.. 0.535.8 184.7 99.8
3.0 54.0 44.8

116 2015 The Little Data Book on Private Sector Development
Economic and social context
Population (millions)Labor force (millions)Unemployment rate (% of labor force)GNI per capita, World Bank Atlas method ($)GDP growth, 2000–05 and 2006–13 (average annual %)Agriculture value added (% of GDP)Industry value added (% of GDP) Manufacturing value added (% of GDP)Services value added (% of GDP)Inflation (annual % change in CPI)Exchange rate (local currency units per $)Exports of goods and services (% of GDP)Imports of goods and services (% of GDP)
Business environment
Ease of doing business (ranking 1–189; 1=best)Time to start a business (days)Procedures to start a business (number)Time to prepare, file, and pay taxes (hours)Time to export (days)Time to resolve insolvency (years)Profit tax (% of commercial profits)New businesses registered (thousands)New business density (new regis. per 1,000 working-age pop.)Enterprise surveys
Time spent dealing w/req. of gov't. reg. (% of sr. mgt. time) Firms expected to give gifts in meetings with tax officials (%) Firms competing against unregistered firms (%) Firms using banks to finance working capital (% of firms) Delay in obtaining an electrical connection (days) Internationally recognized quality certification (% of firms)
Private sector investment
Invest. in infra. w/privt. part., 2000–05 and 2006–13 ($ millions)Private foreign direct investment, net (% of GDP)Gross fixed capital formation (% of GDP)Gross fixed private capital formation (% of GDP)
Finance and banking
Government debt (% of GDP)Total financial system deposits (% of GDP)Bank capital to asset ratio (%)Bank nonperforming loans to total gross loans (%)Domestic credit to the private sector (% of GDP)Real interest rate (%)Interest rate spread (percentage points)
Infrastructure
Air transport (thousands registered carrier departures worldwide)Port container traffic (thousand TEU)Electric power consumption (kWh per capita)Power outages in firms in a typical month (number)Mobile-cellular telephone subscriptions (per 100 people)Individuals using the Internet (%)
Sub-Saharan Africa Low income
Kenya
2005 2013 2013
Low-
income
groupCountry data
35.8 44.4 84913.3 17.2 391
9.5 9.2 5.1520 1,160 7283.4 5.0 6.0
27.2 29.5 26.219.1 19.8 23.411.8 11.7 12.153.7 50.7 50.610.3 5.775.6 86.128.5 17.7 22.036.0 33.2 35.9
.. 136
54 30 2913 10 8
372 202 26545 26 354.5 4.5 3.4
.. 30.8 19.27.3 ..0.4 .. 0.3
5.1 7.2
32.3 17.5.. 59.1
26.0 41.140.5 42.5
9.8 22.3
1,434 6,909 30,934
0.1 0.9 3.818.7 20.4 25.216.2 .. ..
.. .. ..
34.2 37.2 37.611.0 11.8 ..25.6 5.0 ..25.9 31.6 27.6
7.6 10.97.8 8.7 10.7
28 74 385
585 853 ..136 155 219
5.8 6.312.9 71.8 54.6
3.1 39.0 7.1

117The Little Data Book on Private Sector Development 2015
Economic and social context
Population (millions)Labor force (millions)Unemployment rate (% of labor force)GNI per capita, World Bank Atlas method ($)GDP growth, 2000–05 and 2006–13 (average annual %)Agriculture value added (% of GDP)Industry value added (% of GDP) Manufacturing value added (% of GDP)Services value added (% of GDP)Inflation (annual % change in CPI)Exchange rate (local currency units per $)Exports of goods and services (% of GDP)Imports of goods and services (% of GDP)
Business environment
Ease of doing business (ranking 1–189; 1=best)Time to start a business (days)Procedures to start a business (number)Time to prepare, file, and pay taxes (hours)Time to export (days)Time to resolve insolvency (years)Profit tax (% of commercial profits)New businesses registered (thousands)New business density (new regis. per 1,000 working-age pop.)Enterprise surveys
Time spent dealing w/req. of gov't. reg. (% of sr. mgt. time) Firms expected to give gifts in meetings with tax officials (%) Firms competing against unregistered firms (%) Firms using banks to finance working capital (% of firms) Delay in obtaining an electrical connection (days) Internationally recognized quality certification (% of firms)
Private sector investment
Invest. in infra. w/privt. part., 2000–05 and 2006–13 ($ millions)Private foreign direct investment, net (% of GDP)Gross fixed capital formation (% of GDP)Gross fixed private capital formation (% of GDP)
Finance and banking
Government debt (% of GDP)Total financial system deposits (% of GDP)Bank capital to asset ratio (%)Bank nonperforming loans to total gross loans (%)Domestic credit to the private sector (% of GDP)Real interest rate (%)Interest rate spread (percentage points)
Infrastructure
Air transport (thousands registered carrier departures worldwide)Port container traffic (thousand TEU)Electric power consumption (kWh per capita)Power outages in firms in a typical month (number)Mobile-cellular telephone subscriptions (per 100 people)Individuals using the Internet (%)
East Asia & Pacific Lower middle income
Kiribati
2005 2013 2013
Lower
middle-
income
groupCountry data
0.09 0.10 2,561.. .. 1,014.. .. 5.3
1,800 2,620 2,0742.0 1.9 5.8
23.7 25.3 17.07.8 8.2 32.15.5 5.5 17.1
68.5 66.5 51.1.. ..
1.3 1.014.1 10.5 27.1
123.0 110.5 31.2
.. 134
31 31 227 7 7
120 120 31521 20 25
.. .. 2.9
.. 24.3 15.9
.. 0.0
.. 0.1 1.1
.. .... .... .... .... .... ..
.. .. 402,668
2.5 5.3 2.1.. .. 25.5.. .. 18.8
.. .. .... .. 47.1
.. .. 10.3
.. .. 4.5
.. .. 41.5
.. ..
.. .. 7.1
.. .. 2,437.. .. 62,268.. .. 736
.. ..0.7 16.6 85.24.0 11.5 21.2

118 2015 The Little Data Book on Private Sector Development
Economic and social context
Population (millions)Labor force (millions)Unemployment rate (% of labor force)GNI per capita, World Bank Atlas method ($)GDP growth, 2000–05 and 2006–13 (average annual %)Agriculture value added (% of GDP)Industry value added (% of GDP) Manufacturing value added (% of GDP)Services value added (% of GDP)Inflation (annual % change in CPI)Exchange rate (local currency units per $)Exports of goods and services (% of GDP)Imports of goods and services (% of GDP)
Business environment
Ease of doing business (ranking 1–189; 1=best)Time to start a business (days)Procedures to start a business (number)Time to prepare, file, and pay taxes (hours)Time to export (days)Time to resolve insolvency (years)Profit tax (% of commercial profits)New businesses registered (thousands)New business density (new regis. per 1,000 working-age pop.)Enterprise surveys
Time spent dealing w/req. of gov't. reg. (% of sr. mgt. time) Firms expected to give gifts in meetings with tax officials (%) Firms competing against unregistered firms (%) Firms using banks to finance working capital (% of firms) Delay in obtaining an electrical connection (days) Internationally recognized quality certification (% of firms)
Private sector investment
Invest. in infra. w/privt. part., 2000–05 and 2006–13 ($ millions)Private foreign direct investment, net (% of GDP)Gross fixed capital formation (% of GDP)Gross fixed private capital formation (% of GDP)
Finance and banking
Government debt (% of GDP)Total financial system deposits (% of GDP)Bank capital to asset ratio (%)Bank nonperforming loans to total gross loans (%)Domestic credit to the private sector (% of GDP)Real interest rate (%)Interest rate spread (percentage points)
Infrastructure
Air transport (thousands registered carrier departures worldwide)Port container traffic (thousand TEU)Electric power consumption (kWh per capita)Power outages in firms in a typical month (number)Mobile-cellular telephone subscriptions (per 100 people)Individuals using the Internet (%)
East Asia & Pacific Low income
Korea, Dem. People’s Rep.
2005 2013 2013
Low-
income
groupCountry data
23.8 24.9 84914.3 15.2 391
4.6 4.6 5.1.. .. 728.. .. 6.0.. .. 26.2.. .. 23.4.. .. 12.1.. .. 50.6.. .... .... .. 22.0.. .. 35.9
.. .... .. 29.. .. 8.. .. 265.. .. 35.. .. 3.4.. .. 19.2.. .... .. 0.3
.. .... .... .... .... .... ..
.. 474 30,934.. .. 3.8.. .. 25.2.. .. ..
.. .. .... .. 37.6.. .. .... .. .... .. 27.6.. .... .. 10.7
2 1 385.. .. ..
810 739 219
.. ..0.0 9.7 54.60.0 0.0 7.1
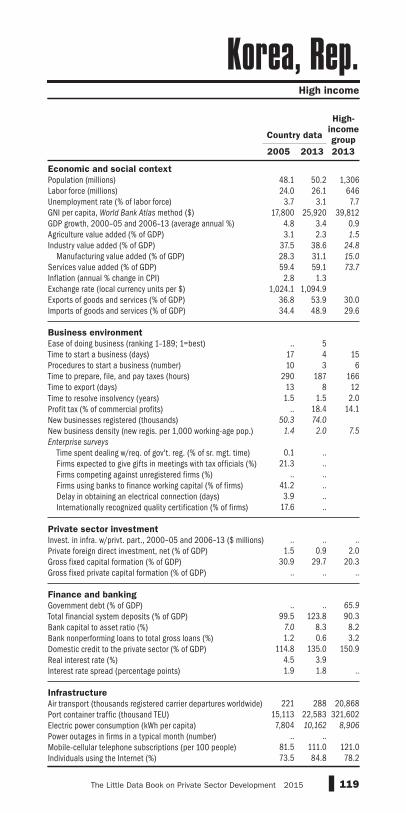
119The Little Data Book on Private Sector Development 2015
Economic and social context
Population (millions)Labor force (millions)Unemployment rate (% of labor force)GNI per capita, World Bank Atlas method ($)GDP growth, 2000–05 and 2006–13 (average annual %)Agriculture value added (% of GDP)Industry value added (% of GDP) Manufacturing value added (% of GDP)Services value added (% of GDP)Inflation (annual % change in CPI)Exchange rate (local currency units per $)Exports of goods and services (% of GDP)Imports of goods and services (% of GDP)
Business environment
Ease of doing business (ranking 1–189; 1=best)Time to start a business (days)Procedures to start a business (number)Time to prepare, file, and pay taxes (hours)Time to export (days)Time to resolve insolvency (years)Profit tax (% of commercial profits)New businesses registered (thousands)New business density (new regis. per 1,000 working-age pop.)Enterprise surveys
Time spent dealing w/req. of gov't. reg. (% of sr. mgt. time) Firms expected to give gifts in meetings with tax officials (%) Firms competing against unregistered firms (%) Firms using banks to finance working capital (% of firms) Delay in obtaining an electrical connection (days) Internationally recognized quality certification (% of firms)
Private sector investment
Invest. in infra. w/privt. part., 2000–05 and 2006–13 ($ millions)Private foreign direct investment, net (% of GDP)Gross fixed capital formation (% of GDP)Gross fixed private capital formation (% of GDP)
Finance and banking
Government debt (% of GDP)Total financial system deposits (% of GDP)Bank capital to asset ratio (%)Bank nonperforming loans to total gross loans (%)Domestic credit to the private sector (% of GDP)Real interest rate (%)Interest rate spread (percentage points)
Infrastructure
Air transport (thousands registered carrier departures worldwide)Port container traffic (thousand TEU)Electric power consumption (kWh per capita)Power outages in firms in a typical month (number)Mobile-cellular telephone subscriptions (per 100 people)Individuals using the Internet (%)
High income
Korea, Rep.
2005 2013 2013
High-
income
groupCountry data
48.1 50.2 1,30624.0 26.1 646
3.7 3.1 7.717,800 25,920 39,812
4.8 3.4 0.93.1 2.3 1.5
37.5 38.6 24.8
28.3 31.1 15.0
59.4 59.1 73.7
2.8 1.31,024.1 1,094.9
36.8 53.9 30.034.4 48.9 29.6
.. 5
17 4 1510 3 6
290 187 16613 8 121.5 1.5 2.0
.. 18.4 14.150.3 74.0
1.4 2.0 7.5
0.1 ..
21.3 .... ..
41.2 ..3.9 ..
17.6 ..
.. .. ..
1.5 0.9 2.030.9 29.7 20.3
.. .. .. .. .. 65.9
99.5 123.8 90.37.0 8.3 8.21.2 0.6 3.2
114.8 135.0 150.94.5 3.91.9 1.8 ..
221 288 20,868
15,113 22,583 321,6027,804 10,162 8,906
.. ..81.5 111.0 121.073.5 84.8 78.2

120 2015 The Little Data Book on Private Sector Development
Economic and social context
Population (millions)Labor force (millions)Unemployment rate (% of labor force)GNI per capita, World Bank Atlas method ($)GDP growth, 2000–05 and 2006–13 (average annual %)Agriculture value added (% of GDP)Industry value added (% of GDP) Manufacturing value added (% of GDP)Services value added (% of GDP)Inflation (annual % change in CPI)Exchange rate (local currency units per $)Exports of goods and services (% of GDP)Imports of goods and services (% of GDP)
Business environment
Ease of doing business (ranking 1–189; 1=best)Time to start a business (days)Procedures to start a business (number)Time to prepare, file, and pay taxes (hours)Time to export (days)Time to resolve insolvency (years)Profit tax (% of commercial profits)New businesses registered (thousands)New business density (new regis. per 1,000 working-age pop.)Enterprise surveys
Time spent dealing w/req. of gov't. reg. (% of sr. mgt. time) Firms expected to give gifts in meetings with tax officials (%) Firms competing against unregistered firms (%) Firms using banks to finance working capital (% of firms) Delay in obtaining an electrical connection (days) Internationally recognized quality certification (% of firms)
Private sector investment
Invest. in infra. w/privt. part., 2000–05 and 2006–13 ($ millions)Private foreign direct investment, net (% of GDP)Gross fixed capital formation (% of GDP)Gross fixed private capital formation (% of GDP)
Finance and banking
Government debt (% of GDP)Total financial system deposits (% of GDP)Bank capital to asset ratio (%)Bank nonperforming loans to total gross loans (%)Domestic credit to the private sector (% of GDP)Real interest rate (%)Interest rate spread (percentage points)
Infrastructure
Air transport (thousands registered carrier departures worldwide)Port container traffic (thousand TEU)Electric power consumption (kWh per capita)Power outages in firms in a typical month (number)Mobile-cellular telephone subscriptions (per 100 people)Individuals using the Internet (%)
Europe & Central Asia Lower middle income
Kosovo
2005 2013 2013
Lower
middle-
income
groupCountry data
1.7 1.8 2,561.. .. 1,014.. .. 5.3
2,550 3,940 2,0746.4 3.6 5.8
15.0 15.0 17.026.1 29.1 32.111.3 13.8 17.158.8 55.8 51.1–1.4 1.80.8 0.8
14.1 17.4 27.150.8 49.0 31.2
.. 75.. 11 22.. 5 7.. 155 315.. 15 25.. 2.0 2.9.. 9.1 15.9
0.7 1.4
0.6 1.2 1.1
.. 13.3.. 9.9.. 65.5.. 56.1.. 58.8.. 32.5
.. 1,055 402,668
3.6 4.9 2.124.0 24.8 25.516.4 14.8 18.8
.. .. ..
26.6 40.3 47.1
.. 9.1 10.3
.. 8.5 4.518.8 34.9 41.517.8 8.710.9 8.7 7.1
.. .. 2,437.. .. 62,268
2,169 2,947 736
.. 10.7
.. .. 85.2
.. .. 21.2
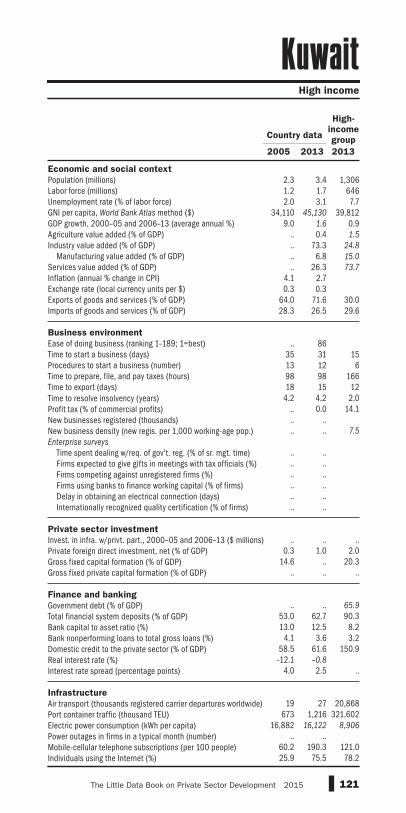
121The Little Data Book on Private Sector Development 2015
Economic and social context
Population (millions)Labor force (millions)Unemployment rate (% of labor force)GNI per capita, World Bank Atlas method ($)GDP growth, 2000–05 and 2006–13 (average annual %)Agriculture value added (% of GDP)Industry value added (% of GDP) Manufacturing value added (% of GDP)Services value added (% of GDP)Inflation (annual % change in CPI)Exchange rate (local currency units per $)Exports of goods and services (% of GDP)Imports of goods and services (% of GDP)
Business environment
Ease of doing business (ranking 1–189; 1=best)Time to start a business (days)Procedures to start a business (number)Time to prepare, file, and pay taxes (hours)Time to export (days)Time to resolve insolvency (years)Profit tax (% of commercial profits)New businesses registered (thousands)New business density (new regis. per 1,000 working-age pop.)Enterprise surveys
Time spent dealing w/req. of gov't. reg. (% of sr. mgt. time) Firms expected to give gifts in meetings with tax officials (%) Firms competing against unregistered firms (%) Firms using banks to finance working capital (% of firms) Delay in obtaining an electrical connection (days) Internationally recognized quality certification (% of firms)
Private sector investment
Invest. in infra. w/privt. part., 2000–05 and 2006–13 ($ millions)Private foreign direct investment, net (% of GDP)Gross fixed capital formation (% of GDP)Gross fixed private capital formation (% of GDP)
Finance and banking
Government debt (% of GDP)Total financial system deposits (% of GDP)Bank capital to asset ratio (%)Bank nonperforming loans to total gross loans (%)Domestic credit to the private sector (% of GDP)Real interest rate (%)Interest rate spread (percentage points)
Infrastructure
Air transport (thousands registered carrier departures worldwide)Port container traffic (thousand TEU)Electric power consumption (kWh per capita)Power outages in firms in a typical month (number)Mobile-cellular telephone subscriptions (per 100 people)Individuals using the Internet (%)
High income
Kuwait
2005 2013 2013
High-
income
groupCountry data
2.3 3.4 1,3061.2 1.7 6462.0 3.1 7.7
34,110 45,130 39,8129.0 1.6 0.9
.. 0.4 1.5
.. 73.3 24.8
.. 6.8 15.0
.. 26.3 73.7
4.1 2.70.3 0.3
64.0 71.6 30.028.3 26.5 29.6
.. 86
35 31 1513 12 698 98 16618 15 12
4.2 4.2 2.0.. 0.0 14.1.. .... .. 7.5
.. .... .... .... .... .... ..
.. .. ..
0.3 1.0 2.014.6 .. 20.3
.. .. .. .. .. 65.9
53.0 62.7 90.313.0 12.5 8.2
4.1 3.6 3.258.5 61.6 150.9
–12.1 –0.8
4.0 2.5 ..
19 27 20,868
673 1,216 321,60216,882 16,122 8,906
.. ..60.2 190.3 121.025.9 75.5 78.2

122 2015 The Little Data Book on Private Sector Development
Economic and social context
Population (millions)Labor force (millions)Unemployment rate (% of labor force)GNI per capita, World Bank Atlas method ($)GDP growth, 2000–05 and 2006–13 (average annual %)Agriculture value added (% of GDP)Industry value added (% of GDP) Manufacturing value added (% of GDP)Services value added (% of GDP)Inflation (annual % change in CPI)Exchange rate (local currency units per $)Exports of goods and services (% of GDP)Imports of goods and services (% of GDP)
Business environment
Ease of doing business (ranking 1–189; 1=best)Time to start a business (days)Procedures to start a business (number)Time to prepare, file, and pay taxes (hours)Time to export (days)Time to resolve insolvency (years)Profit tax (% of commercial profits)New businesses registered (thousands)New business density (new regis. per 1,000 working-age pop.)Enterprise surveys
Time spent dealing w/req. of gov't. reg. (% of sr. mgt. time) Firms expected to give gifts in meetings with tax officials (%) Firms competing against unregistered firms (%) Firms using banks to finance working capital (% of firms) Delay in obtaining an electrical connection (days) Internationally recognized quality certification (% of firms)
Private sector investment
Invest. in infra. w/privt. part., 2000–05 and 2006–13 ($ millions)Private foreign direct investment, net (% of GDP)Gross fixed capital formation (% of GDP)Gross fixed private capital formation (% of GDP)
Finance and banking
Government debt (% of GDP)Total financial system deposits (% of GDP)Bank capital to asset ratio (%)Bank nonperforming loans to total gross loans (%)Domestic credit to the private sector (% of GDP)Real interest rate (%)Interest rate spread (percentage points)
Infrastructure
Air transport (thousands registered carrier departures worldwide)Port container traffic (thousand TEU)Electric power consumption (kWh per capita)Power outages in firms in a typical month (number)Mobile-cellular telephone subscriptions (per 100 people)Individuals using the Internet (%)
Europe & Central Asia Lower middle income
Kyrgyz Republic
2005 2013 2013
Lower
middle-
income
groupCountry data
5.2 5.7 2,5612.3 2.7 1,0148.1 8.0 5.3
450 1,210 2,0744.1 4.2 5.8
31.9 17.7 17.022.4 26.7 32.114.4 15.6 17.145.7 55.6 51.14.4 6.6
41.0 48.438.3 47.2 27.156.8 95.9 31.2
.. 102
21 8 229 2 7
202 210 31564 63 254.0 4.0 2.9
.. 6.4 15.93.2 3.4
1.0 0.9 1.1
5.1 12.0
83.8 54.8.. 43.2
23.6 23.314.1 54.614.7 28.0
12 271 402,6681.7 10.5 2.1
16.2 30.5 25.511.4 21.3 18.8
.. .. ..
8.2 .. 47.1
21.3 16.9 10.36.2 5.5 4.58.0 .. 41.5
18.2 14.020.8 11.4 7.1
5 8 2,437.. .. 62,268
1,540 1,642 736
.. 0.910.7 121.4 85.210.5 23.4 21.2
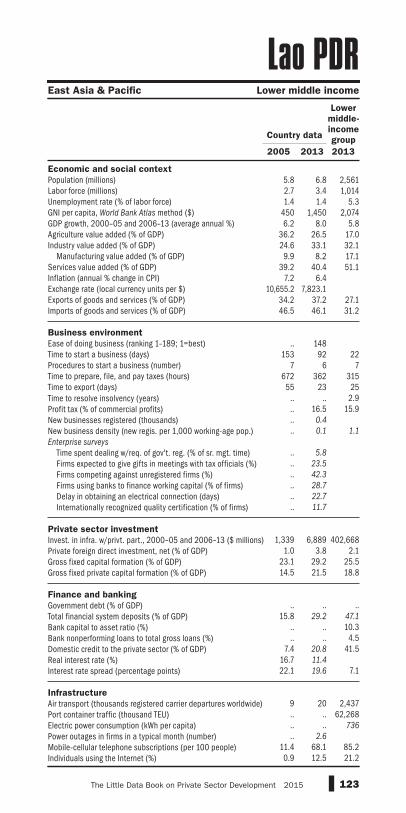
123The Little Data Book on Private Sector Development 2015
Economic and social context
Population (millions)Labor force (millions)Unemployment rate (% of labor force)GNI per capita, World Bank Atlas method ($)GDP growth, 2000–05 and 2006–13 (average annual %)Agriculture value added (% of GDP)Industry value added (% of GDP) Manufacturing value added (% of GDP)Services value added (% of GDP)Inflation (annual % change in CPI)Exchange rate (local currency units per $)Exports of goods and services (% of GDP)Imports of goods and services (% of GDP)
Business environment
Ease of doing business (ranking 1–189; 1=best)Time to start a business (days)Procedures to start a business (number)Time to prepare, file, and pay taxes (hours)Time to export (days)Time to resolve insolvency (years)Profit tax (% of commercial profits)New businesses registered (thousands)New business density (new regis. per 1,000 working-age pop.)Enterprise surveys
Time spent dealing w/req. of gov't. reg. (% of sr. mgt. time) Firms expected to give gifts in meetings with tax officials (%) Firms competing against unregistered firms (%) Firms using banks to finance working capital (% of firms) Delay in obtaining an electrical connection (days) Internationally recognized quality certification (% of firms)
Private sector investment
Invest. in infra. w/privt. part., 2000–05 and 2006–13 ($ millions)Private foreign direct investment, net (% of GDP)Gross fixed capital formation (% of GDP)Gross fixed private capital formation (% of GDP)
Finance and banking
Government debt (% of GDP)Total financial system deposits (% of GDP)Bank capital to asset ratio (%)Bank nonperforming loans to total gross loans (%)Domestic credit to the private sector (% of GDP)Real interest rate (%)Interest rate spread (percentage points)
Infrastructure
Air transport (thousands registered carrier departures worldwide)Port container traffic (thousand TEU)Electric power consumption (kWh per capita)Power outages in firms in a typical month (number)Mobile-cellular telephone subscriptions (per 100 people)Individuals using the Internet (%)
East Asia & Pacific Lower middle income
Lao PDR
2005 2013 2013
Lower
middle-
income
groupCountry data
5.8 6.8 2,5612.7 3.4 1,0141.4 1.4 5.3
450 1,450 2,0746.2 8.0 5.8
36.2 26.5 17.024.6 33.1 32.19.9 8.2 17.1
39.2 40.4 51.17.2 6.4
10,655.2 7,823.134.2 37.2 27.146.5 46.1 31.2
.. 148
153 92 227 6 7
672 362 31555 23 25
.. .. 2.9
.. 16.5 15.9
.. 0.4
.. 0.1 1.1
.. 5.8
.. 23.5
.. 42.3
.. 28.7
.. 22.7
.. 11.7
1,339 6,889 402,668
1.0 3.8 2.123.1 29.2 25.514.5 21.5 18.8
.. .. ..
15.8 29.2 47.1
.. .. 10.3
.. .. 4.57.4 20.8 41.5
16.7 11.4
22.1 19.6 7.1
9 20 2,437.. .. 62,268.. .. 736
.. 2.6
11.4 68.1 85.20.9 12.5 21.2

124 2015 The Little Data Book on Private Sector Development
Economic and social context
Population (millions)Labor force (millions)Unemployment rate (% of labor force)GNI per capita, World Bank Atlas method ($)GDP growth, 2000–05 and 2006–13 (average annual %)Agriculture value added (% of GDP)Industry value added (% of GDP) Manufacturing value added (% of GDP)Services value added (% of GDP)Inflation (annual % change in CPI)Exchange rate (local currency units per $)Exports of goods and services (% of GDP)Imports of goods and services (% of GDP)
Business environment
Ease of doing business (ranking 1–189; 1=best)Time to start a business (days)Procedures to start a business (number)Time to prepare, file, and pay taxes (hours)Time to export (days)Time to resolve insolvency (years)Profit tax (% of commercial profits)New businesses registered (thousands)New business density (new regis. per 1,000 working-age pop.)Enterprise surveys
Time spent dealing w/req. of gov't. reg. (% of sr. mgt. time) Firms expected to give gifts in meetings with tax officials (%) Firms competing against unregistered firms (%) Firms using banks to finance working capital (% of firms) Delay in obtaining an electrical connection (days) Internationally recognized quality certification (% of firms)
Private sector investment
Invest. in infra. w/privt. part., 2000–05 and 2006–13 ($ millions)Private foreign direct investment, net (% of GDP)Gross fixed capital formation (% of GDP)Gross fixed private capital formation (% of GDP)
Finance and banking
Government debt (% of GDP)Total financial system deposits (% of GDP)Bank capital to asset ratio (%)Bank nonperforming loans to total gross loans (%)Domestic credit to the private sector (% of GDP)Real interest rate (%)Interest rate spread (percentage points)
Infrastructure
Air transport (thousands registered carrier departures worldwide)Port container traffic (thousand TEU)Electric power consumption (kWh per capita)Power outages in firms in a typical month (number)Mobile-cellular telephone subscriptions (per 100 people)Individuals using the Internet (%)
High income
Latvia
2005 2013 2013
High-
income
groupCountry data
2.2 2.0 1,3061.1 1.0 6468.9 11.1 7.7
6,950 15,290 39,8128.0 –1.5 0.94.0 4.1 1.5
21.6 21.8 24.8
12.6 12.2 15.0
74.5 74.1 73.7
6.7 0.00.6 0.5
47.8 58.8 30.062.2 62.7 29.6
.. 23
16 13 155 4 6
280 193 16613 10 12
3.0 1.5 2.0.. 4.9 14.1
8.8 15.8
5.6 11.6 7.5
3.2 5.2
30.0 0.9.. 26.5
45.2 11.123.5 4.9
9.5 19.6
.. .. ..
5.1 2.8 2.030.6 22.2 20.330.6 .. ..
.. 41.1 65.9
34.4 38.8 90.37.6 11.4 8.20.7 6.4 3.2
68.2 60.7 150.9–3.7 4.53.3 5.8 ..
23 44 20,868
236 333 321,6022,777 3,264 8,906
.. 0.384.0 228.4 121.046.0 75.2 78.2
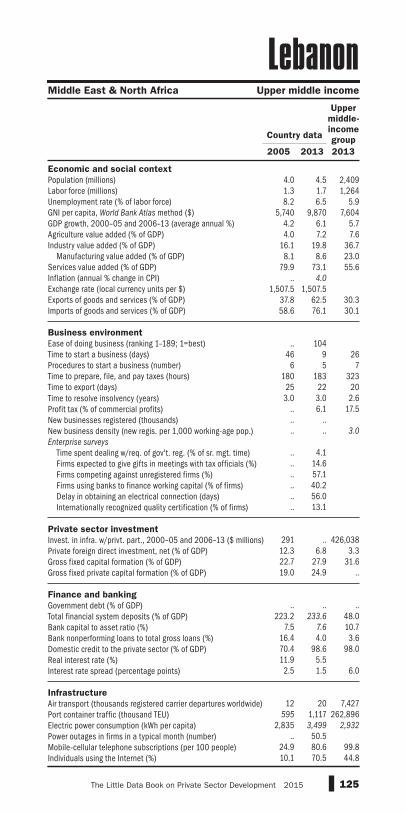
125The Little Data Book on Private Sector Development 2015
Economic and social context
Population (millions)Labor force (millions)Unemployment rate (% of labor force)GNI per capita, World Bank Atlas method ($)GDP growth, 2000–05 and 2006–13 (average annual %)Agriculture value added (% of GDP)Industry value added (% of GDP) Manufacturing value added (% of GDP)Services value added (% of GDP)Inflation (annual % change in CPI)Exchange rate (local currency units per $)Exports of goods and services (% of GDP)Imports of goods and services (% of GDP)
Business environment
Ease of doing business (ranking 1–189; 1=best)Time to start a business (days)Procedures to start a business (number)Time to prepare, file, and pay taxes (hours)Time to export (days)Time to resolve insolvency (years)Profit tax (% of commercial profits)New businesses registered (thousands)New business density (new regis. per 1,000 working-age pop.)Enterprise surveys
Time spent dealing w/req. of gov't. reg. (% of sr. mgt. time) Firms expected to give gifts in meetings with tax officials (%) Firms competing against unregistered firms (%) Firms using banks to finance working capital (% of firms) Delay in obtaining an electrical connection (days) Internationally recognized quality certification (% of firms)
Private sector investment
Invest. in infra. w/privt. part., 2000–05 and 2006–13 ($ millions)Private foreign direct investment, net (% of GDP)Gross fixed capital formation (% of GDP)Gross fixed private capital formation (% of GDP)
Finance and banking
Government debt (% of GDP)Total financial system deposits (% of GDP)Bank capital to asset ratio (%)Bank nonperforming loans to total gross loans (%)Domestic credit to the private sector (% of GDP)Real interest rate (%)Interest rate spread (percentage points)
Infrastructure
Air transport (thousands registered carrier departures worldwide)Port container traffic (thousand TEU)Electric power consumption (kWh per capita)Power outages in firms in a typical month (number)Mobile-cellular telephone subscriptions (per 100 people)Individuals using the Internet (%)
Middle East & North Africa Upper middle income
Lebanon
2005 2013 2013
Upper
middle-
income
groupCountry data
4.0 4.5 2,4091.3 1.7 1,2648.2 6.5 5.9
5,740 9,870 7,6044.2 6.1 5.74.0 7.2 7.6
16.1 19.8 36.78.1 8.6 23.0
79.9 73.1 55.6.. 4.0
1,507.5 1,507.537.8 62.5 30.358.6 76.1 30.1
.. 104
46 9 266 5 7
180 183 32325 22 20
3.0 3.0 2.6.. 6.1 17.5.. .... .. 3.0
.. 4.1.. 14.6.. 57.1.. 40.2.. 56.0.. 13.1
291 .. 426,038
12.3 6.8 3.322.7 27.9 31.619.0 24.9 ..
.. .. ..
223.2 233.6 48.07.5 7.6 10.7
16.4 4.0 3.670.4 98.6 98.011.9 5.52.5 1.5 6.0
12 20 7,427
595 1,117 262,8962,835 3,499 2,932
.. 50.524.9 80.6 99.810.1 70.5 44.8

126 2015 The Little Data Book on Private Sector Development
Economic and social context
Population (millions)Labor force (millions)Unemployment rate (% of labor force)GNI per capita, World Bank Atlas method ($)GDP growth, 2000–05 and 2006–13 (average annual %)Agriculture value added (% of GDP)Industry value added (% of GDP) Manufacturing value added (% of GDP)Services value added (% of GDP)Inflation (annual % change in CPI)Exchange rate (local currency units per $)Exports of goods and services (% of GDP)Imports of goods and services (% of GDP)
Business environment
Ease of doing business (ranking 1–189; 1=best)Time to start a business (days)Procedures to start a business (number)Time to prepare, file, and pay taxes (hours)Time to export (days)Time to resolve insolvency (years)Profit tax (% of commercial profits)New businesses registered (thousands)New business density (new regis. per 1,000 working-age pop.)Enterprise surveys
Time spent dealing w/req. of gov't. reg. (% of sr. mgt. time) Firms expected to give gifts in meetings with tax officials (%) Firms competing against unregistered firms (%) Firms using banks to finance working capital (% of firms) Delay in obtaining an electrical connection (days) Internationally recognized quality certification (% of firms)
Private sector investment
Invest. in infra. w/privt. part., 2000–05 and 2006–13 ($ millions)Private foreign direct investment, net (% of GDP)Gross fixed capital formation (% of GDP)Gross fixed private capital formation (% of GDP)
Finance and banking
Government debt (% of GDP)Total financial system deposits (% of GDP)Bank capital to asset ratio (%)Bank nonperforming loans to total gross loans (%)Domestic credit to the private sector (% of GDP)Real interest rate (%)Interest rate spread (percentage points)
Infrastructure
Air transport (thousands registered carrier departures worldwide)Port container traffic (thousand TEU)Electric power consumption (kWh per capita)Power outages in firms in a typical month (number)Mobile-cellular telephone subscriptions (per 100 people)Individuals using the Internet (%)
Sub-Saharan Africa Lower middle income
Lesotho
2005 2013 2013
Lower
middle-
income
groupCountry data
1.9 2.1 2,5610.79 0.87 1,01436.4 24.7 5.3910 1,500 2,0742.8 5.0 5.89.0 8.3 17.0
33.1 31.8 32.119.4 11.7 17.157.9 59.9 51.13.4 4.96.4 9.7
48.9 45.0 27.1120.9 105.6 31.2
.. 128
103 29 229 7 7
564 324 31544 31 252.6 2.6 2.9
.. 10.8 15.90.8 1.8
0.8 1.5 1.1
.. .... .... .... .... .... ..
88 81 402,6685.1 1.9 2.1
21.1 36.7 25.516.8 15.2 18.8
.. .. ..
25.1 34.1 47.1
10.2 9.4 10.33.0 4.1 4.58.9 20.2 41.55.1 –1.77.8 7.1 7.1
.. .. 2,437.. .. 62,268.. .. 736
.. ..13.0 86.3 85.2
2.6 5.0 21.2

127The Little Data Book on Private Sector Development 2015
Economic and social context
Population (millions)Labor force (millions)Unemployment rate (% of labor force)GNI per capita, World Bank Atlas method ($)GDP growth, 2000–05 and 2006–13 (average annual %)Agriculture value added (% of GDP)Industry value added (% of GDP) Manufacturing value added (% of GDP)Services value added (% of GDP)Inflation (annual % change in CPI)Exchange rate (local currency units per $)Exports of goods and services (% of GDP)Imports of goods and services (% of GDP)
Business environment
Ease of doing business (ranking 1–189; 1=best)Time to start a business (days)Procedures to start a business (number)Time to prepare, file, and pay taxes (hours)Time to export (days)Time to resolve insolvency (years)Profit tax (% of commercial profits)New businesses registered (thousands)New business density (new regis. per 1,000 working-age pop.)Enterprise surveys
Time spent dealing w/req. of gov't. reg. (% of sr. mgt. time) Firms expected to give gifts in meetings with tax officials (%) Firms competing against unregistered firms (%) Firms using banks to finance working capital (% of firms) Delay in obtaining an electrical connection (days) Internationally recognized quality certification (% of firms)
Private sector investment
Invest. in infra. w/privt. part., 2000–05 and 2006–13 ($ millions)Private foreign direct investment, net (% of GDP)Gross fixed capital formation (% of GDP)Gross fixed private capital formation (% of GDP)
Finance and banking
Government debt (% of GDP)Total financial system deposits (% of GDP)Bank capital to asset ratio (%)Bank nonperforming loans to total gross loans (%)Domestic credit to the private sector (% of GDP)Real interest rate (%)Interest rate spread (percentage points)
Infrastructure
Air transport (thousands registered carrier departures worldwide)Port container traffic (thousand TEU)Electric power consumption (kWh per capita)Power outages in firms in a typical month (number)Mobile-cellular telephone subscriptions (per 100 people)Individuals using the Internet (%)
Sub-Saharan Africa Low income
Liberia
2005 2013 2013
Low-
income
groupCountry data
3.3 4.3 8491.1 1.5 3915.0 3.7 5.1
120 410 728–1.0 11.4 6.067.0 38.8 26.27.3 16.4 23.47.2 3.3 12.1
25.7 44.7 50.610.8 7.657.1 75.523.8 32.4 22.076.3 89.5 35.9
.. 174
68 5 2910 4 8
158 151 26520 15 35
3.0 3.0 3.4.. 21.2 19.2.. .... .. 0.3
.. .... .... .... .... .... ..
70 589 30,934
15.3 35.9 3.813.3 25.4 25.212.2 17.8 ..
.. 32.7 ..
13.5 29.0 37.6.. .. .... .. ..
6.7 20.1 27.66.2 9.3
13.6 9.6 10.7
.. .. 385.. .. .... .. 219
.. ..4.9 59.4 54.60.0 4.6 7.1
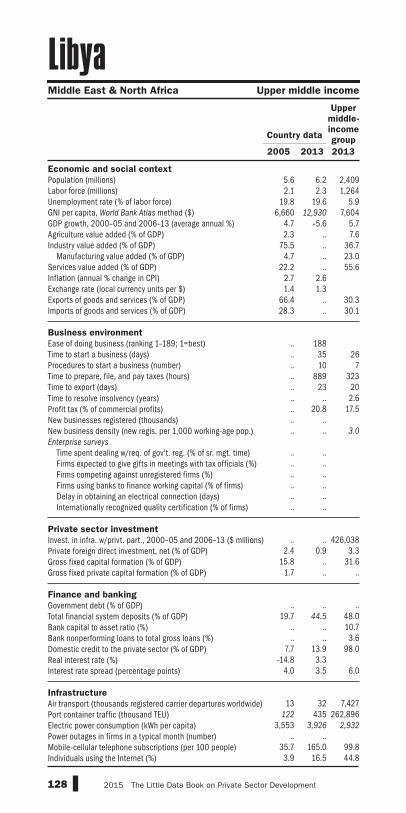
128 2015 The Little Data Book on Private Sector Development
Economic and social context
Population (millions)Labor force (millions)Unemployment rate (% of labor force)GNI per capita, World Bank Atlas method ($)GDP growth, 2000–05 and 2006–13 (average annual %)Agriculture value added (% of GDP)Industry value added (% of GDP) Manufacturing value added (% of GDP)Services value added (% of GDP)Inflation (annual % change in CPI)Exchange rate (local currency units per $)Exports of goods and services (% of GDP)Imports of goods and services (% of GDP)
Business environment
Ease of doing business (ranking 1–189; 1=best)Time to start a business (days)Procedures to start a business (number)Time to prepare, file, and pay taxes (hours)Time to export (days)Time to resolve insolvency (years)Profit tax (% of commercial profits)New businesses registered (thousands)New business density (new regis. per 1,000 working-age pop.)Enterprise surveys
Time spent dealing w/req. of gov't. reg. (% of sr. mgt. time) Firms expected to give gifts in meetings with tax officials (%) Firms competing against unregistered firms (%) Firms using banks to finance working capital (% of firms) Delay in obtaining an electrical connection (days) Internationally recognized quality certification (% of firms)
Private sector investment
Invest. in infra. w/privt. part., 2000–05 and 2006–13 ($ millions)Private foreign direct investment, net (% of GDP)Gross fixed capital formation (% of GDP)Gross fixed private capital formation (% of GDP)
Finance and banking
Government debt (% of GDP)Total financial system deposits (% of GDP)Bank capital to asset ratio (%)Bank nonperforming loans to total gross loans (%)Domestic credit to the private sector (% of GDP)Real interest rate (%)Interest rate spread (percentage points)
Infrastructure
Air transport (thousands registered carrier departures worldwide)Port container traffic (thousand TEU)Electric power consumption (kWh per capita)Power outages in firms in a typical month (number)Mobile-cellular telephone subscriptions (per 100 people)Individuals using the Internet (%)
Middle East & North Africa Upper middle income
Libya
2005 2013 2013
Upper
middle-
income
groupCountry data
5.6 6.2 2,4092.1 2.3 1,264
19.8 19.6 5.96,660 12,930 7,604
4.7 –5.6 5.72.3 .. 7.6
75.5 .. 36.74.7 .. 23.0
22.2 .. 55.62.7 2.61.4 1.3
66.4 .. 30.328.3 .. 30.1
.. 188.. 35 26.. 10 7.. 889 323.. 23 20.. .. 2.6.. 20.8 17.5.. .... .. 3.0
.. .... .... .... .... .... ..
.. .. 426,038
2.4 0.9 3.315.8 .. 31.6
1.7 .. ..
.. .. ..
19.7 44.5 48.0.. .. 10.7.. .. 3.6
7.7 13.9 98.0–14.8 3.3
4.0 3.5 6.0
13 32 7,427
122 435 262,8963,553 3,926 2,932
.. ..35.7 165.0 99.83.9 16.5 44.8
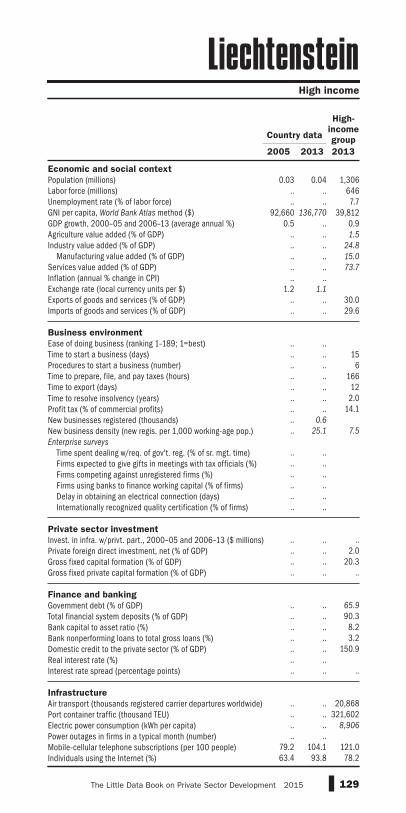
129The Little Data Book on Private Sector Development 2015
Economic and social context
Population (millions)Labor force (millions)Unemployment rate (% of labor force)GNI per capita, World Bank Atlas method ($)GDP growth, 2000–05 and 2006–13 (average annual %)Agriculture value added (% of GDP)Industry value added (% of GDP) Manufacturing value added (% of GDP)Services value added (% of GDP)Inflation (annual % change in CPI)Exchange rate (local currency units per $)Exports of goods and services (% of GDP)Imports of goods and services (% of GDP)
Business environment
Ease of doing business (ranking 1–189; 1=best)Time to start a business (days)Procedures to start a business (number)Time to prepare, file, and pay taxes (hours)Time to export (days)Time to resolve insolvency (years)Profit tax (% of commercial profits)New businesses registered (thousands)New business density (new regis. per 1,000 working-age pop.)Enterprise surveys
Time spent dealing w/req. of gov't. reg. (% of sr. mgt. time) Firms expected to give gifts in meetings with tax officials (%) Firms competing against unregistered firms (%) Firms using banks to finance working capital (% of firms) Delay in obtaining an electrical connection (days) Internationally recognized quality certification (% of firms)
Private sector investment
Invest. in infra. w/privt. part., 2000–05 and 2006–13 ($ millions)Private foreign direct investment, net (% of GDP)Gross fixed capital formation (% of GDP)Gross fixed private capital formation (% of GDP)
Finance and banking
Government debt (% of GDP)Total financial system deposits (% of GDP)Bank capital to asset ratio (%)Bank nonperforming loans to total gross loans (%)Domestic credit to the private sector (% of GDP)Real interest rate (%)Interest rate spread (percentage points)
Infrastructure
Air transport (thousands registered carrier departures worldwide)Port container traffic (thousand TEU)Electric power consumption (kWh per capita)Power outages in firms in a typical month (number)Mobile-cellular telephone subscriptions (per 100 people)Individuals using the Internet (%)
High income
Liechtenstein
2005 2013 2013
High-
income
groupCountry data
0.03 0.04 1,306.. .. 646.. .. 7.7
92,660 136,770 39,8120.5 .. 0.9
.. .. 1.5
.. .. 24.8
.. .. 15.0
.. .. 73.7
.. ..1.2 1.1
.. .. 30.0
.. .. 29.6
.. .... .. 15.. .. 6.. .. 166.. .. 12.. .. 2.0.. .. 14.1.. 0.6
.. 25.1 7.5
.. .... .... .... .... .... ..
.. .. .... .. 2.0.. .. 20.3.. .. .. .. .. 65.9
.. .. 90.3
.. .. 8.2
.. .. 3.2
.. .. 150.9
.. ..
.. .. ..
.. .. 20,868.. .. 321,602.. .. 8,906
.. ..79.2 104.1 121.063.4 93.8 78.2

130 2015 The Little Data Book on Private Sector Development
Economic and social context
Population (millions)Labor force (millions)Unemployment rate (% of labor force)GNI per capita, World Bank Atlas method ($)GDP growth, 2000–05 and 2006–13 (average annual %)Agriculture value added (% of GDP)Industry value added (% of GDP) Manufacturing value added (% of GDP)Services value added (% of GDP)Inflation (annual % change in CPI)Exchange rate (local currency units per $)Exports of goods and services (% of GDP)Imports of goods and services (% of GDP)
Business environment
Ease of doing business (ranking 1–189; 1=best)Time to start a business (days)Procedures to start a business (number)Time to prepare, file, and pay taxes (hours)Time to export (days)Time to resolve insolvency (years)Profit tax (% of commercial profits)New businesses registered (thousands)New business density (new regis. per 1,000 working-age pop.)Enterprise surveys
Time spent dealing w/req. of gov't. reg. (% of sr. mgt. time) Firms expected to give gifts in meetings with tax officials (%) Firms competing against unregistered firms (%) Firms using banks to finance working capital (% of firms) Delay in obtaining an electrical connection (days) Internationally recognized quality certification (% of firms)
Private sector investment
Invest. in infra. w/privt. part., 2000–05 and 2006–13 ($ millions)Private foreign direct investment, net (% of GDP)Gross fixed capital formation (% of GDP)Gross fixed private capital formation (% of GDP)
Finance and banking
Government debt (% of GDP)Total financial system deposits (% of GDP)Bank capital to asset ratio (%)Bank nonperforming loans to total gross loans (%)Domestic credit to the private sector (% of GDP)Real interest rate (%)Interest rate spread (percentage points)
Infrastructure
Air transport (thousands registered carrier departures worldwide)Port container traffic (thousand TEU)Electric power consumption (kWh per capita)Power outages in firms in a typical month (number)Mobile-cellular telephone subscriptions (per 100 people)Individuals using the Internet (%)
High income
Lithuania
2005 2013 2013
High-
income
groupCountry data
3.3 3.0 1,3061.6 1.5 6468.3 11.8 7.7
7,580 14,900 39,8128.0 0.4 0.94.8 3.5 1.5
32.7 27.8 24.8
20.7 16.3 15.0
62.5 68.7 73.7
2.6 1.12.8 2.6
57.3 77.1 30.064.3 78.6 29.6
.. 24
26 4 158 3 6
166 175 16610 10 121.7 2.3 2.0
.. 6.1 14.14.5 9.7
1.9 4.7 7.5
4.5 6.0
35.4 10.8.. 58.0
31.9 25.437.5 42.917.5 17.9
1,507 1,390 ..
4.6 1.6 2.022.7 17.4 20.319.1 .. ..
21.3 49.4 65.9
31.9 37.9 90.37.6 12.5 8.20.6 11.6 3.2
40.7 46.2 150.9–1.3 3.3
2.9 4.3 ..
12 12 20,868
321 403 321,6023,187 3,530 8,906
.. 0.2132.5 151.3 121.036.2 68.5 78.2

131The Little Data Book on Private Sector Development 2015
Economic and social context
Population (millions)Labor force (millions)Unemployment rate (% of labor force)GNI per capita, World Bank Atlas method ($)GDP growth, 2000–05 and 2006–13 (average annual %)Agriculture value added (% of GDP)Industry value added (% of GDP) Manufacturing value added (% of GDP)Services value added (% of GDP)Inflation (annual % change in CPI)Exchange rate (local currency units per $)Exports of goods and services (% of GDP)Imports of goods and services (% of GDP)
Business environment
Ease of doing business (ranking 1–189; 1=best)Time to start a business (days)Procedures to start a business (number)Time to prepare, file, and pay taxes (hours)Time to export (days)Time to resolve insolvency (years)Profit tax (% of commercial profits)New businesses registered (thousands)New business density (new regis. per 1,000 working-age pop.)Enterprise surveys
Time spent dealing w/req. of gov't. reg. (% of sr. mgt. time) Firms expected to give gifts in meetings with tax officials (%) Firms competing against unregistered firms (%) Firms using banks to finance working capital (% of firms) Delay in obtaining an electrical connection (days) Internationally recognized quality certification (% of firms)
Private sector investment
Invest. in infra. w/privt. part., 2000–05 and 2006–13 ($ millions)Private foreign direct investment, net (% of GDP)Gross fixed capital formation (% of GDP)Gross fixed private capital formation (% of GDP)
Finance and banking
Government debt (% of GDP)Total financial system deposits (% of GDP)Bank capital to asset ratio (%)Bank nonperforming loans to total gross loans (%)Domestic credit to the private sector (% of GDP)Real interest rate (%)Interest rate spread (percentage points)
Infrastructure
Air transport (thousands registered carrier departures worldwide)Port container traffic (thousand TEU)Electric power consumption (kWh per capita)Power outages in firms in a typical month (number)Mobile-cellular telephone subscriptions (per 100 people)Individuals using the Internet (%)
High income
Luxembourg
2005 2013 2013
High-
income
groupCountry data
0.47 0.54 1,3060.21 0.26 646
4.5 5.9 7.770,340 69,880 39,812
3.0 1.2 0.90.4 0.3 1.5
16.5 12.2 24.8
8.9 5.2 15.0
83.1 87.5 73.7
2.5 1.70.8 0.8
162.1 203.3 30.0135.4 168.1 29.6
.. 59
29 19 156 6 6
59 55 1668 8 12
2.0 2.0 2.0.. 4.2 14.1
1.8 7.6
5.6 21.0 7.5
.. .... .... .... .... .... ..
.. .. ..
17.7 50.0 2.019.0 17.1 20.3
.. .. ..
3.7 20.0 65.9
368.8 352.5 90.35.0 6.4 8.20.2 0.2 3.2
131.2 162.4 150.9.. .... .. ..
42 39 20,868
.. .. 321,60215,642 15,530 8,906
.. ..111.4 148.6 121.070.0 93.8 78.2
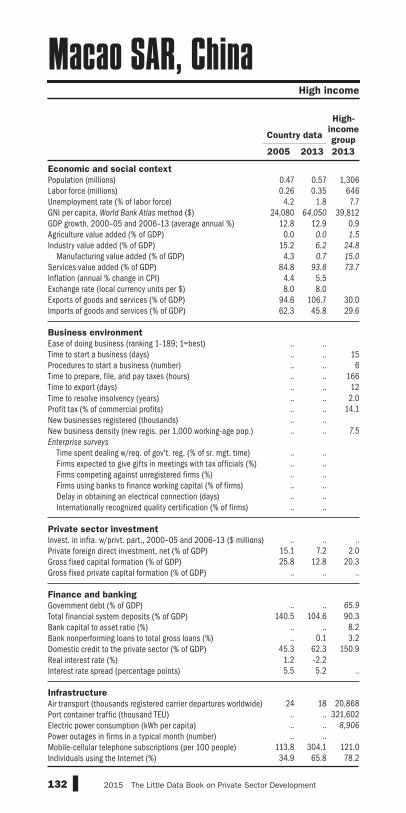
132 2015 The Little Data Book on Private Sector Development
Economic and social context
Population (millions)Labor force (millions)Unemployment rate (% of labor force)GNI per capita, World Bank Atlas method ($)GDP growth, 2000–05 and 2006–13 (average annual %)Agriculture value added (% of GDP)Industry value added (% of GDP) Manufacturing value added (% of GDP)Services value added (% of GDP)Inflation (annual % change in CPI)Exchange rate (local currency units per $)Exports of goods and services (% of GDP)Imports of goods and services (% of GDP)
Business environment
Ease of doing business (ranking 1–189; 1=best)Time to start a business (days)Procedures to start a business (number)Time to prepare, file, and pay taxes (hours)Time to export (days)Time to resolve insolvency (years)Profit tax (% of commercial profits)New businesses registered (thousands)New business density (new regis. per 1,000 working-age pop.)Enterprise surveys
Time spent dealing w/req. of gov't. reg. (% of sr. mgt. time) Firms expected to give gifts in meetings with tax officials (%) Firms competing against unregistered firms (%) Firms using banks to finance working capital (% of firms) Delay in obtaining an electrical connection (days) Internationally recognized quality certification (% of firms)
Private sector investment
Invest. in infra. w/privt. part., 2000–05 and 2006–13 ($ millions)Private foreign direct investment, net (% of GDP)Gross fixed capital formation (% of GDP)Gross fixed private capital formation (% of GDP)
Finance and banking
Government debt (% of GDP)Total financial system deposits (% of GDP)Bank capital to asset ratio (%)Bank nonperforming loans to total gross loans (%)Domestic credit to the private sector (% of GDP)Real interest rate (%)Interest rate spread (percentage points)
Infrastructure
Air transport (thousands registered carrier departures worldwide)Port container traffic (thousand TEU)Electric power consumption (kWh per capita)Power outages in firms in a typical month (number)Mobile-cellular telephone subscriptions (per 100 people)Individuals using the Internet (%)
High income
Macao SAR, China
2005 2013 2013
High-
income
groupCountry data
0.47 0.57 1,3060.26 0.35 646
4.2 1.8 7.724,080 64,050 39,812
12.8 12.9 0.90.0 0.0 1.5
15.2 6.2 24.8
4.3 0.7 15.0
84.8 93.8 73.7
4.4 5.58.0 8.0
94.6 106.7 30.062.3 45.8 29.6
.. .... .. 15.. .. 6.. .. 166.. .. 12.. .. 2.0.. .. 14.1.. .... .. 7.5
.. .... .... .... .... .... ..
.. .. ..
15.1 7.2 2.025.8 12.8 20.3
.. .. .. .. .. 65.9
140.5 104.6 90.3.. .. 8.2.. 0.1 3.2
45.3 62.3 150.91.2 –2.25.5 5.2 ..
24 18 20,868
.. .. 321,602
.. .. 8,906
.. ..113.8 304.1 121.034.9 65.8 78.2

133The Little Data Book on Private Sector Development 2015
Economic and social context
Population (millions)Labor force (millions)Unemployment rate (% of labor force)GNI per capita, World Bank Atlas method ($)GDP growth, 2000–05 and 2006–13 (average annual %)Agriculture value added (% of GDP)Industry value added (% of GDP) Manufacturing value added (% of GDP)Services value added (% of GDP)Inflation (annual % change in CPI)Exchange rate (local currency units per $)Exports of goods and services (% of GDP)Imports of goods and services (% of GDP)
Business environment
Ease of doing business (ranking 1–189; 1=best)Time to start a business (days)Procedures to start a business (number)Time to prepare, file, and pay taxes (hours)Time to export (days)Time to resolve insolvency (years)Profit tax (% of commercial profits)New businesses registered (thousands)New business density (new regis. per 1,000 working-age pop.)Enterprise surveys
Time spent dealing w/req. of gov't. reg. (% of sr. mgt. time) Firms expected to give gifts in meetings with tax officials (%) Firms competing against unregistered firms (%) Firms using banks to finance working capital (% of firms) Delay in obtaining an electrical connection (days) Internationally recognized quality certification (% of firms)
Private sector investment
Invest. in infra. w/privt. part., 2000–05 and 2006–13 ($ millions)Private foreign direct investment, net (% of GDP)Gross fixed capital formation (% of GDP)Gross fixed private capital formation (% of GDP)
Finance and banking
Government debt (% of GDP)Total financial system deposits (% of GDP)Bank capital to asset ratio (%)Bank nonperforming loans to total gross loans (%)Domestic credit to the private sector (% of GDP)Real interest rate (%)Interest rate spread (percentage points)
Infrastructure
Air transport (thousands registered carrier departures worldwide)Port container traffic (thousand TEU)Electric power consumption (kWh per capita)Power outages in firms in a typical month (number)Mobile-cellular telephone subscriptions (per 100 people)Individuals using the Internet (%)
Europe & Central Asia Upper middle income
Macedonia, FYR
2005 2013 2013
Upper
middle-
income
groupCountry data
2.1 2.1 2,4090.89 0.97 1,26437.3 29.0 5.9
2,830 4,870 7,6041.9 2.3 5.7
12.3 10.4 7.628.2 26.2 36.717.4 11.6 23.059.5 63.4 55.60.2 2.8
49.3 46.444.1 53.9 30.361.1 72.8 30.1
.. 30
48 2 2613 2 7
192 119 32317 12 20
2.0 1.8 2.6.. 5.5 17.5
8.0 5.4
5.5 3.6 3.0
9.7 10.3
32.8 2.4.. 55.5
17.3 38.48.5 28.9
14.1 34.8
707 1,730 426,0382.4 4.1 3.3
16.6 24.8 31.610.6 18.6 ..
.. .. ..
31.4 54.8 48.013.3 11.3 10.715.0 10.9 3.624.4 49.2 98.0
8.1 8.06.9 3.6 6.0
2 .. 7,427.. .. 262,896
3,326 3,881 2,932
.. 1.254.1 106.2 99.826.5 61.2 44.8

134 2015 The Little Data Book on Private Sector Development
Economic and social context
Population (millions)Labor force (millions)Unemployment rate (% of labor force)GNI per capita, World Bank Atlas method ($)GDP growth, 2000–05 and 2006–13 (average annual %)Agriculture value added (% of GDP)Industry value added (% of GDP) Manufacturing value added (% of GDP)Services value added (% of GDP)Inflation (annual % change in CPI)Exchange rate (local currency units per $)Exports of goods and services (% of GDP)Imports of goods and services (% of GDP)
Business environment
Ease of doing business (ranking 1–189; 1=best)Time to start a business (days)Procedures to start a business (number)Time to prepare, file, and pay taxes (hours)Time to export (days)Time to resolve insolvency (years)Profit tax (% of commercial profits)New businesses registered (thousands)New business density (new regis. per 1,000 working-age pop.)Enterprise surveys
Time spent dealing w/req. of gov't. reg. (% of sr. mgt. time) Firms expected to give gifts in meetings with tax officials (%) Firms competing against unregistered firms (%) Firms using banks to finance working capital (% of firms) Delay in obtaining an electrical connection (days) Internationally recognized quality certification (% of firms)
Private sector investment
Invest. in infra. w/privt. part., 2000–05 and 2006–13 ($ millions)Private foreign direct investment, net (% of GDP)Gross fixed capital formation (% of GDP)Gross fixed private capital formation (% of GDP)
Finance and banking
Government debt (% of GDP)Total financial system deposits (% of GDP)Bank capital to asset ratio (%)Bank nonperforming loans to total gross loans (%)Domestic credit to the private sector (% of GDP)Real interest rate (%)Interest rate spread (percentage points)
Infrastructure
Air transport (thousands registered carrier departures worldwide)Port container traffic (thousand TEU)Electric power consumption (kWh per capita)Power outages in firms in a typical month (number)Mobile-cellular telephone subscriptions (per 100 people)Individuals using the Internet (%)
Sub-Saharan Africa Low income
Madagascar
2005 2013 2013
Low-
income
groupCountry data
18.3 22.9 8498.7 11.7 3912.6 3.6 5.1
290 440 7282.0 1.7 6.0
28.3 26.4 26.215.8 16.1 23.414.0 14.2 12.155.9 57.5 50.618.5 5.8
2,003.0 2,206.928.2 30.1 22.045.6 43.0 35.9
.. 163
42 8 2911 4 8
400 183 26549 22 352.0 2.0 3.4
.. 13.3 19.2
.. 0.6
.. 0.1 0.3
.. 20.8.. 31.7.. 71.7.. 19.1.. 24.0.. 15.3
74 744 30,934
1.7 7.9 3.822.2 15.7 25.213.5 12.9 ..
.. .. ..
14.2 16.9 37.66.7 .. ..
10.1 .. ..9.9 11.9 27.67.3 52.38.3 49.3 10.7
18 9 385
112 173 .... .. 219
.. 6.72.8 36.9 54.60.6 2.2 7.1
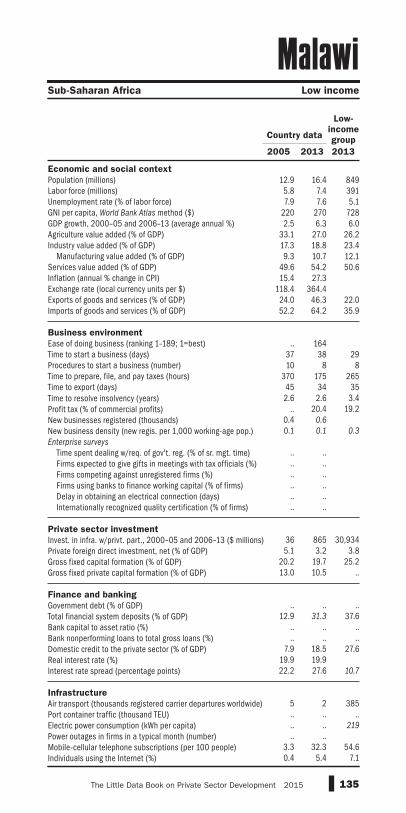
135The Little Data Book on Private Sector Development 2015
Economic and social context
Population (millions)Labor force (millions)Unemployment rate (% of labor force)GNI per capita, World Bank Atlas method ($)GDP growth, 2000–05 and 2006–13 (average annual %)Agriculture value added (% of GDP)Industry value added (% of GDP) Manufacturing value added (% of GDP)Services value added (% of GDP)Inflation (annual % change in CPI)Exchange rate (local currency units per $)Exports of goods and services (% of GDP)Imports of goods and services (% of GDP)
Business environment
Ease of doing business (ranking 1–189; 1=best)Time to start a business (days)Procedures to start a business (number)Time to prepare, file, and pay taxes (hours)Time to export (days)Time to resolve insolvency (years)Profit tax (% of commercial profits)New businesses registered (thousands)New business density (new regis. per 1,000 working-age pop.)Enterprise surveys
Time spent dealing w/req. of gov't. reg. (% of sr. mgt. time) Firms expected to give gifts in meetings with tax officials (%) Firms competing against unregistered firms (%) Firms using banks to finance working capital (% of firms) Delay in obtaining an electrical connection (days) Internationally recognized quality certification (% of firms)
Private sector investment
Invest. in infra. w/privt. part., 2000–05 and 2006–13 ($ millions)Private foreign direct investment, net (% of GDP)Gross fixed capital formation (% of GDP)Gross fixed private capital formation (% of GDP)
Finance and banking
Government debt (% of GDP)Total financial system deposits (% of GDP)Bank capital to asset ratio (%)Bank nonperforming loans to total gross loans (%)Domestic credit to the private sector (% of GDP)Real interest rate (%)Interest rate spread (percentage points)
Infrastructure
Air transport (thousands registered carrier departures worldwide)Port container traffic (thousand TEU)Electric power consumption (kWh per capita)Power outages in firms in a typical month (number)Mobile-cellular telephone subscriptions (per 100 people)Individuals using the Internet (%)
Sub-Saharan Africa Low income
Malawi
2005 2013 2013
Low-
income
groupCountry data
12.9 16.4 8495.8 7.4 3917.9 7.6 5.1
220 270 7282.5 6.3 6.0
33.1 27.0 26.217.3 18.8 23.49.3 10.7 12.1
49.6 54.2 50.615.4 27.3
118.4 364.424.0 46.3 22.052.2 64.2 35.9
.. 164
37 38 2910 8 8
370 175 26545 34 352.6 2.6 3.4
.. 20.4 19.20.4 0.6
0.1 0.1 0.3
.. .... .... .... .... .... ..
36 865 30,9345.1 3.2 3.8
20.2 19.7 25.213.0 10.5 ..
.. .. ..
12.9 31.3 37.6.. .. .... .. ..
7.9 18.5 27.619.9 19.922.2 27.6 10.7
5 2 385.. .. .... .. 219
.. ..3.3 32.3 54.60.4 5.4 7.1
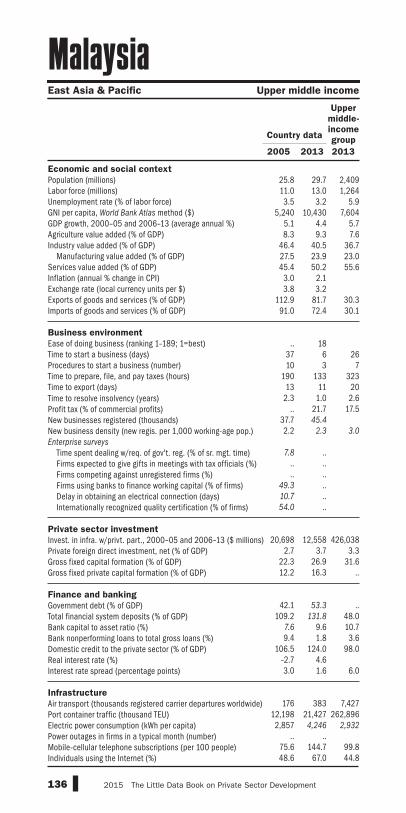
136 2015 The Little Data Book on Private Sector Development
Economic and social context
Population (millions)Labor force (millions)Unemployment rate (% of labor force)GNI per capita, World Bank Atlas method ($)GDP growth, 2000–05 and 2006–13 (average annual %)Agriculture value added (% of GDP)Industry value added (% of GDP) Manufacturing value added (% of GDP)Services value added (% of GDP)Inflation (annual % change in CPI)Exchange rate (local currency units per $)Exports of goods and services (% of GDP)Imports of goods and services (% of GDP)
Business environment
Ease of doing business (ranking 1–189; 1=best)Time to start a business (days)Procedures to start a business (number)Time to prepare, file, and pay taxes (hours)Time to export (days)Time to resolve insolvency (years)Profit tax (% of commercial profits)New businesses registered (thousands)New business density (new regis. per 1,000 working-age pop.)Enterprise surveys
Time spent dealing w/req. of gov't. reg. (% of sr. mgt. time) Firms expected to give gifts in meetings with tax officials (%) Firms competing against unregistered firms (%) Firms using banks to finance working capital (% of firms) Delay in obtaining an electrical connection (days) Internationally recognized quality certification (% of firms)
Private sector investment
Invest. in infra. w/privt. part., 2000–05 and 2006–13 ($ millions)Private foreign direct investment, net (% of GDP)Gross fixed capital formation (% of GDP)Gross fixed private capital formation (% of GDP)
Finance and banking
Government debt (% of GDP)Total financial system deposits (% of GDP)Bank capital to asset ratio (%)Bank nonperforming loans to total gross loans (%)Domestic credit to the private sector (% of GDP)Real interest rate (%)Interest rate spread (percentage points)
Infrastructure
Air transport (thousands registered carrier departures worldwide)Port container traffic (thousand TEU)Electric power consumption (kWh per capita)Power outages in firms in a typical month (number)Mobile-cellular telephone subscriptions (per 100 people)Individuals using the Internet (%)
East Asia & Pacific Upper middle income
Malaysia
2005 2013 2013
Upper
middle-
income
groupCountry data
25.8 29.7 2,40911.0 13.0 1,2643.5 3.2 5.9
5,240 10,430 7,6045.1 4.4 5.78.3 9.3 7.6
46.4 40.5 36.727.5 23.9 23.045.4 50.2 55.6
3.0 2.13.8 3.2
112.9 81.7 30.391.0 72.4 30.1
.. 18
37 6 2610 3 7
190 133 32313 11 20
2.3 1.0 2.6.. 21.7 17.5
37.7 45.4
2.2 2.3 3.0
7.8 ..
.. ..
.. ..49.3 ..10.7 ..54.0 ..
20,698 12,558 426,038
2.7 3.7 3.322.3 26.9 31.612.2 16.3 ..
42.1 53.3 ..
109.2 131.8 48.07.6 9.6 10.79.4 1.8 3.6
106.5 124.0 98.0–2.7 4.63.0 1.6 6.0
176 383 7,427
12,198 21,427 262,8962,857 4,246 2,932
.. ..75.6 144.7 99.848.6 67.0 44.8
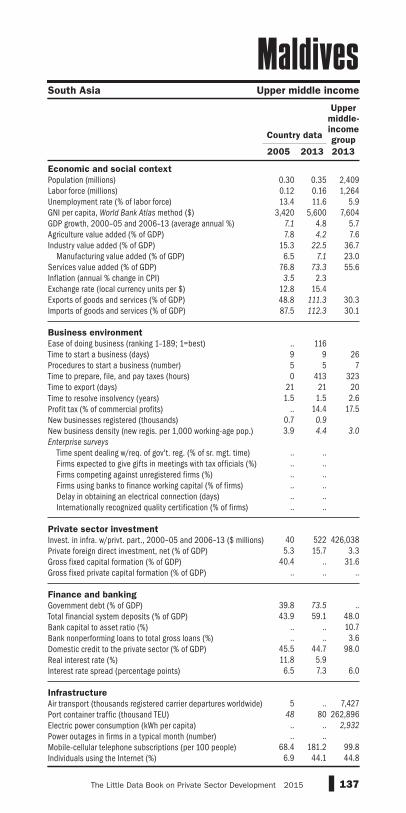
137The Little Data Book on Private Sector Development 2015
Economic and social context
Population (millions)Labor force (millions)Unemployment rate (% of labor force)GNI per capita, World Bank Atlas method ($)GDP growth, 2000–05 and 2006–13 (average annual %)Agriculture value added (% of GDP)Industry value added (% of GDP) Manufacturing value added (% of GDP)Services value added (% of GDP)Inflation (annual % change in CPI)Exchange rate (local currency units per $)Exports of goods and services (% of GDP)Imports of goods and services (% of GDP)
Business environment
Ease of doing business (ranking 1–189; 1=best)Time to start a business (days)Procedures to start a business (number)Time to prepare, file, and pay taxes (hours)Time to export (days)Time to resolve insolvency (years)Profit tax (% of commercial profits)New businesses registered (thousands)New business density (new regis. per 1,000 working-age pop.)Enterprise surveys
Time spent dealing w/req. of gov't. reg. (% of sr. mgt. time) Firms expected to give gifts in meetings with tax officials (%) Firms competing against unregistered firms (%) Firms using banks to finance working capital (% of firms) Delay in obtaining an electrical connection (days) Internationally recognized quality certification (% of firms)
Private sector investment
Invest. in infra. w/privt. part., 2000–05 and 2006–13 ($ millions)Private foreign direct investment, net (% of GDP)Gross fixed capital formation (% of GDP)Gross fixed private capital formation (% of GDP)
Finance and banking
Government debt (% of GDP)Total financial system deposits (% of GDP)Bank capital to asset ratio (%)Bank nonperforming loans to total gross loans (%)Domestic credit to the private sector (% of GDP)Real interest rate (%)Interest rate spread (percentage points)
Infrastructure
Air transport (thousands registered carrier departures worldwide)Port container traffic (thousand TEU)Electric power consumption (kWh per capita)Power outages in firms in a typical month (number)Mobile-cellular telephone subscriptions (per 100 people)Individuals using the Internet (%)
South Asia Upper middle income
Maldives
2005 2013 2013
Upper
middle-
income
groupCountry data
0.30 0.35 2,4090.12 0.16 1,26413.4 11.6 5.9
3,420 5,600 7,6047.1 4.8 5.77.8 4.2 7.6
15.3 22.5 36.76.5 7.1 23.0
76.8 73.3 55.63.5 2.3
12.8 15.448.8 111.3 30.387.5 112.3 30.1
.. 1169 9 265 5 70 413 323
21 21 201.5 1.5 2.6
.. 14.4 17.50.7 0.9
3.9 4.4 3.0
.. .... .... .... .... .... ..
40 522 426,0385.3 15.7 3.3
40.4 .. 31.6.. .. ..
39.8 73.5 ..43.9 59.1 48.0
.. .. 10.7
.. .. 3.645.5 44.7 98.011.8 5.96.5 7.3 6.0
5 .. 7,427
48 80 262,896.. .. 2,932
.. ..68.4 181.2 99.8
6.9 44.1 44.8

138 2015 The Little Data Book on Private Sector Development
Economic and social context
Population (millions)Labor force (millions)Unemployment rate (% of labor force)GNI per capita, World Bank Atlas method ($)GDP growth, 2000–05 and 2006–13 (average annual %)Agriculture value added (% of GDP)Industry value added (% of GDP) Manufacturing value added (% of GDP)Services value added (% of GDP)Inflation (annual % change in CPI)Exchange rate (local currency units per $)Exports of goods and services (% of GDP)Imports of goods and services (% of GDP)
Business environment
Ease of doing business (ranking 1–189; 1=best)Time to start a business (days)Procedures to start a business (number)Time to prepare, file, and pay taxes (hours)Time to export (days)Time to resolve insolvency (years)Profit tax (% of commercial profits)New businesses registered (thousands)New business density (new regis. per 1,000 working-age pop.)Enterprise surveys
Time spent dealing w/req. of gov't. reg. (% of sr. mgt. time) Firms expected to give gifts in meetings with tax officials (%) Firms competing against unregistered firms (%) Firms using banks to finance working capital (% of firms) Delay in obtaining an electrical connection (days) Internationally recognized quality certification (% of firms)
Private sector investment
Invest. in infra. w/privt. part., 2000–05 and 2006–13 ($ millions)Private foreign direct investment, net (% of GDP)Gross fixed capital formation (% of GDP)Gross fixed private capital formation (% of GDP)
Finance and banking
Government debt (% of GDP)Total financial system deposits (% of GDP)Bank capital to asset ratio (%)Bank nonperforming loans to total gross loans (%)Domestic credit to the private sector (% of GDP)Real interest rate (%)Interest rate spread (percentage points)
Infrastructure
Air transport (thousands registered carrier departures worldwide)Port container traffic (thousand TEU)Electric power consumption (kWh per capita)Power outages in firms in a typical month (number)Mobile-cellular telephone subscriptions (per 100 people)Individuals using the Internet (%)
Sub-Saharan Africa Low income
Mali
2005 2013 2013
Low-
income
groupCountry data
11.9 15.3 8493.5 5.3 3918.5 8.2 5.1
440 670 7285.9 3.6 6.0
36.6 42.3 26.224.2 22.7 23.43.2 .. 12.1
39.3 35.0 50.66.4 –0.6
527.5 494.025.6 31.3 22.037.3 37.7 35.9
.. 146
27 11 2912 5 8
270 270 26544 26 353.6 3.6 3.4
.. 10.1 19.2
.. ..
.. .. 0.3
2.4 2.0
31.1 20.2
72.8 75.4
6.7 21.4
48.4 32.9
8.6 24.8
504 1,233 30,9343.0 3.7 3.8
22.6 16.3 25.215.0 13.1 ..
.. .. ..
17.7 24.1 37.6.. .. .... .. ..
17.2 22.8 27.6.. .... .. 10.7
.. 0 385.. .. .... .. 219
3.0 2.7
6.4 129.1 54.60.5 2.3 7.1

139The Little Data Book on Private Sector Development 2015
Economic and social context
Population (millions)Labor force (millions)Unemployment rate (% of labor force)GNI per capita, World Bank Atlas method ($)GDP growth, 2000–05 and 2006–13 (average annual %)Agriculture value added (% of GDP)Industry value added (% of GDP) Manufacturing value added (% of GDP)Services value added (% of GDP)Inflation (annual % change in CPI)Exchange rate (local currency units per $)Exports of goods and services (% of GDP)Imports of goods and services (% of GDP)
Business environment
Ease of doing business (ranking 1–189; 1=best)Time to start a business (days)Procedures to start a business (number)Time to prepare, file, and pay taxes (hours)Time to export (days)Time to resolve insolvency (years)Profit tax (% of commercial profits)New businesses registered (thousands)New business density (new regis. per 1,000 working-age pop.)Enterprise surveys
Time spent dealing w/req. of gov't. reg. (% of sr. mgt. time) Firms expected to give gifts in meetings with tax officials (%) Firms competing against unregistered firms (%) Firms using banks to finance working capital (% of firms) Delay in obtaining an electrical connection (days) Internationally recognized quality certification (% of firms)
Private sector investment
Invest. in infra. w/privt. part., 2000–05 and 2006–13 ($ millions)Private foreign direct investment, net (% of GDP)Gross fixed capital formation (% of GDP)Gross fixed private capital formation (% of GDP)
Finance and banking
Government debt (% of GDP)Total financial system deposits (% of GDP)Bank capital to asset ratio (%)Bank nonperforming loans to total gross loans (%)Domestic credit to the private sector (% of GDP)Real interest rate (%)Interest rate spread (percentage points)
Infrastructure
Air transport (thousands registered carrier departures worldwide)Port container traffic (thousand TEU)Electric power consumption (kWh per capita)Power outages in firms in a typical month (number)Mobile-cellular telephone subscriptions (per 100 people)Individuals using the Internet (%)
High income
Malta
2005 2013 2013
High-
income
groupCountry data
0.40 0.42 1,3060.16 0.19 6467.3 6.5 7.7
14,380 20,980 39,8120.8 1.9 0.92.6 1.9 1.5
37.8 32.7 24.8
16.1 13.4 15.0
59.5 65.4 73.7
3.0 1.40.8 0.8
76.8 93.6 30.079.9 88.9 29.6
.. 94.. 35 15.. 11 6.. 139 166.. 11 12.. 3.0 2.0.. 30.3 14.1
2.4 4.0
8.6 13.6 7.5
.. .... .... .... .... .... ..
.. .. ..
11.6 –19.4 2.022.0 14.3 20.3
.. .. ..
193.5 85.9 65.9
137.1 154.0 90.37.0 7.3 8.29.0 9.2 3.2
106.1 119.3 150.92.9 2.5
2.8 .. ..
15 14 20,868
1,382 2,848 321,6024,913 4,689 8,906
.. ..78.1 129.8 121.041.2 68.9 78.2

140 2015 The Little Data Book on Private Sector Development
Economic and social context
Population (millions)Labor force (millions)Unemployment rate (% of labor force)GNI per capita, World Bank Atlas method ($)GDP growth, 2000–05 and 2006–13 (average annual %)Agriculture value added (% of GDP)Industry value added (% of GDP) Manufacturing value added (% of GDP)Services value added (% of GDP)Inflation (annual % change in CPI)Exchange rate (local currency units per $)Exports of goods and services (% of GDP)Imports of goods and services (% of GDP)
Business environment
Ease of doing business (ranking 1–189; 1=best)Time to start a business (days)Procedures to start a business (number)Time to prepare, file, and pay taxes (hours)Time to export (days)Time to resolve insolvency (years)Profit tax (% of commercial profits)New businesses registered (thousands)New business density (new regis. per 1,000 working-age pop.)Enterprise surveys
Time spent dealing w/req. of gov't. reg. (% of sr. mgt. time) Firms expected to give gifts in meetings with tax officials (%) Firms competing against unregistered firms (%) Firms using banks to finance working capital (% of firms) Delay in obtaining an electrical connection (days) Internationally recognized quality certification (% of firms)
Private sector investment
Invest. in infra. w/privt. part., 2000–05 and 2006–13 ($ millions)Private foreign direct investment, net (% of GDP)Gross fixed capital formation (% of GDP)Gross fixed private capital formation (% of GDP)
Finance and banking
Government debt (% of GDP)Total financial system deposits (% of GDP)Bank capital to asset ratio (%)Bank nonperforming loans to total gross loans (%)Domestic credit to the private sector (% of GDP)Real interest rate (%)Interest rate spread (percentage points)
Infrastructure
Air transport (thousands registered carrier departures worldwide)Port container traffic (thousand TEU)Electric power consumption (kWh per capita)Power outages in firms in a typical month (number)Mobile-cellular telephone subscriptions (per 100 people)Individuals using the Internet (%)
East Asia & Pacific Upper middle income
Marshall Islands
2005 2013 2013
Upper
middle-
income
groupCountry data
0.05 0.05 2,409.. .. 1,264.. .. 5.9
3,570 4,310 7,6041.8 1.8 5.7
.. .. 7.6
.. .. 36.7
.. .. 23.0
.. .. 55.6
.. ..1.0 1.0
.. .. 30.3
.. .. 30.1
.. 139
17 17 265 5 7
128 128 32323 23 202.0 2.0 2.6
.. 0.0 17.5
.. ..
.. .. 3.0
.. .... .... .... .... .... ..
.. .. 426,038
2.4 11.9 3.3.. .. 31.6.. .. ..
.. .. .... .. 48.0.. .. 10.7.. .. 3.6.. .. 98.0.. .... .. 6.0
3 .. 7,427.. .. 262,896.. .. 2,932
.. ..1.3 .. 99.83.9 11.7 44.8

141The Little Data Book on Private Sector Development 2015
Economic and social context
Population (millions)Labor force (millions)Unemployment rate (% of labor force)GNI per capita, World Bank Atlas method ($)GDP growth, 2000–05 and 2006–13 (average annual %)Agriculture value added (% of GDP)Industry value added (% of GDP) Manufacturing value added (% of GDP)Services value added (% of GDP)Inflation (annual % change in CPI)Exchange rate (local currency units per $)Exports of goods and services (% of GDP)Imports of goods and services (% of GDP)
Business environment
Ease of doing business (ranking 1–189; 1=best)Time to start a business (days)Procedures to start a business (number)Time to prepare, file, and pay taxes (hours)Time to export (days)Time to resolve insolvency (years)Profit tax (% of commercial profits)New businesses registered (thousands)New business density (new regis. per 1,000 working-age pop.)Enterprise surveys
Time spent dealing w/req. of gov't. reg. (% of sr. mgt. time) Firms expected to give gifts in meetings with tax officials (%) Firms competing against unregistered firms (%) Firms using banks to finance working capital (% of firms) Delay in obtaining an electrical connection (days) Internationally recognized quality certification (% of firms)
Private sector investment
Invest. in infra. w/privt. part., 2000–05 and 2006–13 ($ millions)Private foreign direct investment, net (% of GDP)Gross fixed capital formation (% of GDP)Gross fixed private capital formation (% of GDP)
Finance and banking
Government debt (% of GDP)Total financial system deposits (% of GDP)Bank capital to asset ratio (%)Bank nonperforming loans to total gross loans (%)Domestic credit to the private sector (% of GDP)Real interest rate (%)Interest rate spread (percentage points)
Infrastructure
Air transport (thousands registered carrier departures worldwide)Port container traffic (thousand TEU)Electric power consumption (kWh per capita)Power outages in firms in a typical month (number)Mobile-cellular telephone subscriptions (per 100 people)Individuals using the Internet (%)
Sub-Saharan Africa Lower middle income
Mauritania
2005 2013 2013
Lower
middle-
income
groupCountry data
3.1 3.9 2,5610.96 1.3 1,01432.1 31.0 5.3560 1,060 2,0744.0 3.4 5.8
23.7 15.5 17.029.3 41.5 32.1
5.0 4.1 17.147.0 43.0 51.112.1 4.1
265.5 300.633.7 66.7 27.176.9 67.0 31.2
.. 176
82 9 2211 7 7
696 734 31540 31 25
.. .. 2.9
.. 0.0 15.9
.. ..
.. .. 1.1
5.8 17.2
48.2 20.465.2 78.513.5 29.4
7.5 16.15.9 16.2
92 367 402,668
43.8 27.1 2.161.5 38.0 25.549.8 20.8 18.8
.. .. ..
21.2 25.4 47.1
.. .. 10.3
.. .. 4.529.1 30.5 41.54.3 23.9
15.1 11.2 7.1
2 3 2,437.. 81 62,268.. .. 736
3.3 5.323.7 102.5 85.2
0.7 6.2 21.2
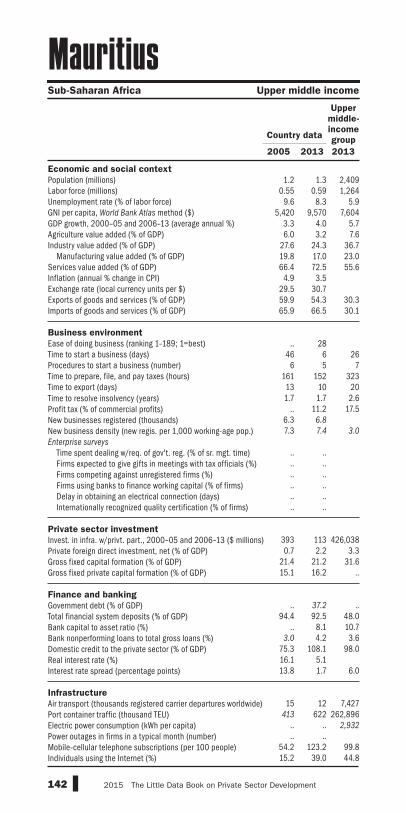
142 2015 The Little Data Book on Private Sector Development
Economic and social context
Population (millions)Labor force (millions)Unemployment rate (% of labor force)GNI per capita, World Bank Atlas method ($)GDP growth, 2000–05 and 2006–13 (average annual %)Agriculture value added (% of GDP)Industry value added (% of GDP) Manufacturing value added (% of GDP)Services value added (% of GDP)Inflation (annual % change in CPI)Exchange rate (local currency units per $)Exports of goods and services (% of GDP)Imports of goods and services (% of GDP)
Business environment
Ease of doing business (ranking 1–189; 1=best)Time to start a business (days)Procedures to start a business (number)Time to prepare, file, and pay taxes (hours)Time to export (days)Time to resolve insolvency (years)Profit tax (% of commercial profits)New businesses registered (thousands)New business density (new regis. per 1,000 working-age pop.)Enterprise surveys
Time spent dealing w/req. of gov't. reg. (% of sr. mgt. time) Firms expected to give gifts in meetings with tax officials (%) Firms competing against unregistered firms (%) Firms using banks to finance working capital (% of firms) Delay in obtaining an electrical connection (days) Internationally recognized quality certification (% of firms)
Private sector investment
Invest. in infra. w/privt. part., 2000–05 and 2006–13 ($ millions)Private foreign direct investment, net (% of GDP)Gross fixed capital formation (% of GDP)Gross fixed private capital formation (% of GDP)
Finance and banking
Government debt (% of GDP)Total financial system deposits (% of GDP)Bank capital to asset ratio (%)Bank nonperforming loans to total gross loans (%)Domestic credit to the private sector (% of GDP)Real interest rate (%)Interest rate spread (percentage points)
Infrastructure
Air transport (thousands registered carrier departures worldwide)Port container traffic (thousand TEU)Electric power consumption (kWh per capita)Power outages in firms in a typical month (number)Mobile-cellular telephone subscriptions (per 100 people)Individuals using the Internet (%)
Sub-Saharan Africa Upper middle income
Mauritius
2005 2013 2013
Upper
middle-
income
groupCountry data
1.2 1.3 2,4090.55 0.59 1,264
9.6 8.3 5.95,420 9,570 7,604
3.3 4.0 5.76.0 3.2 7.6
27.6 24.3 36.719.8 17.0 23.066.4 72.5 55.6
4.9 3.529.5 30.759.9 54.3 30.365.9 66.5 30.1
.. 28
46 6 266 5 7
161 152 32313 10 201.7 1.7 2.6
.. 11.2 17.56.3 6.8
7.3 7.4 3.0
.. .... .... .... .... .... ..
393 113 426,0380.7 2.2 3.3
21.4 21.2 31.615.1 16.2 ..
.. 37.2 ..
94.4 92.5 48.0.. 8.1 10.7
3.0 4.2 3.675.3 108.1 98.016.1 5.113.8 1.7 6.0
15 12 7,427
413 622 262,896.. .. 2,932
.. ..54.2 123.2 99.815.2 39.0 44.8

143The Little Data Book on Private Sector Development 2015
Economic and social context
Population (millions)Labor force (millions)Unemployment rate (% of labor force)GNI per capita, World Bank Atlas method ($)GDP growth, 2000–05 and 2006–13 (average annual %)Agriculture value added (% of GDP)Industry value added (% of GDP) Manufacturing value added (% of GDP)Services value added (% of GDP)Inflation (annual % change in CPI)Exchange rate (local currency units per $)Exports of goods and services (% of GDP)Imports of goods and services (% of GDP)
Business environment
Ease of doing business (ranking 1–189; 1=best)Time to start a business (days)Procedures to start a business (number)Time to prepare, file, and pay taxes (hours)Time to export (days)Time to resolve insolvency (years)Profit tax (% of commercial profits)New businesses registered (thousands)New business density (new regis. per 1,000 working-age pop.)Enterprise surveys
Time spent dealing w/req. of gov't. reg. (% of sr. mgt. time) Firms expected to give gifts in meetings with tax officials (%) Firms competing against unregistered firms (%) Firms using banks to finance working capital (% of firms) Delay in obtaining an electrical connection (days) Internationally recognized quality certification (% of firms)
Private sector investment
Invest. in infra. w/privt. part., 2000–05 and 2006–13 ($ millions)Private foreign direct investment, net (% of GDP)Gross fixed capital formation (% of GDP)Gross fixed private capital formation (% of GDP)
Finance and banking
Government debt (% of GDP)Total financial system deposits (% of GDP)Bank capital to asset ratio (%)Bank nonperforming loans to total gross loans (%)Domestic credit to the private sector (% of GDP)Real interest rate (%)Interest rate spread (percentage points)
Infrastructure
Air transport (thousands registered carrier departures worldwide)Port container traffic (thousand TEU)Electric power consumption (kWh per capita)Power outages in firms in a typical month (number)Mobile-cellular telephone subscriptions (per 100 people)Individuals using the Internet (%)
Latin America & Caribbean Upper middle income
Mexico
2005 2013 2013
Upper
middle-
income
groupCountry data
110.7 122.3 2,40944.8 53.9 1,264
3.5 4.9 5.97,650 9,940 7,604
1.7 1.9 5.73.4 3.5 7.6
35.2 34.8 36.717.2 17.8 23.061.5 61.7 55.64.0 3.8
10.9 12.826.6 31.7 30.328.0 32.4 30.1
.. 39
30 6 269 6 7
560 334 32313 12 20
1.8 1.8 2.6.. 24.9 17.5
40.4 68.7
0.6 0.9 3.0
20.5 13.6
9.6 10.4
69.7 70.3
5.9 26.9
8.3 17.1
20.3 24.0
29,001 56,099 426,038
2.9 3.3 3.321.3 21.0 31.616.7 17.1 ..
.. .. ..
21.2 28.4 48.08.8 10.4 10.71.5 3.2 3.6
16.2 30.6 98.04.1 2.26.2 2.9 6.0
331 441 7,427
2,144 4,900 262,8961,853 2,092 2,932
0.8 1.6
42.6 85.8 99.817.2 43.5 44.8
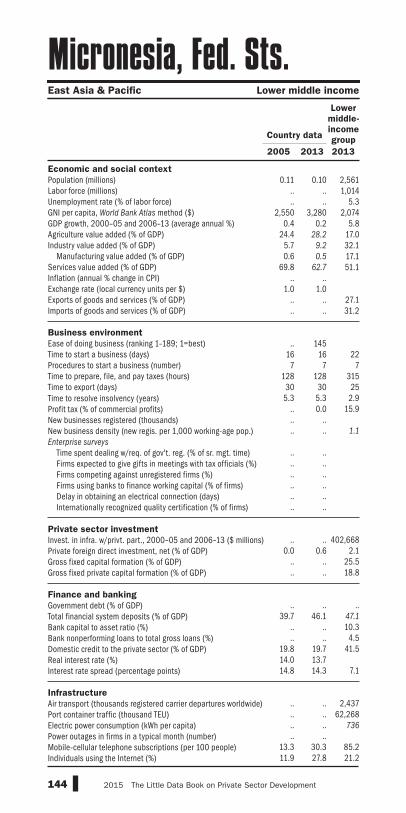
144 2015 The Little Data Book on Private Sector Development
Economic and social context
Population (millions)Labor force (millions)Unemployment rate (% of labor force)GNI per capita, World Bank Atlas method ($)GDP growth, 2000–05 and 2006–13 (average annual %)Agriculture value added (% of GDP)Industry value added (% of GDP) Manufacturing value added (% of GDP)Services value added (% of GDP)Inflation (annual % change in CPI)Exchange rate (local currency units per $)Exports of goods and services (% of GDP)Imports of goods and services (% of GDP)
Business environment
Ease of doing business (ranking 1–189; 1=best)Time to start a business (days)Procedures to start a business (number)Time to prepare, file, and pay taxes (hours)Time to export (days)Time to resolve insolvency (years)Profit tax (% of commercial profits)New businesses registered (thousands)New business density (new regis. per 1,000 working-age pop.)Enterprise surveys
Time spent dealing w/req. of gov't. reg. (% of sr. mgt. time) Firms expected to give gifts in meetings with tax officials (%) Firms competing against unregistered firms (%) Firms using banks to finance working capital (% of firms) Delay in obtaining an electrical connection (days) Internationally recognized quality certification (% of firms)
Private sector investment
Invest. in infra. w/privt. part., 2000–05 and 2006–13 ($ millions)Private foreign direct investment, net (% of GDP)Gross fixed capital formation (% of GDP)Gross fixed private capital formation (% of GDP)
Finance and banking
Government debt (% of GDP)Total financial system deposits (% of GDP)Bank capital to asset ratio (%)Bank nonperforming loans to total gross loans (%)Domestic credit to the private sector (% of GDP)Real interest rate (%)Interest rate spread (percentage points)
Infrastructure
Air transport (thousands registered carrier departures worldwide)Port container traffic (thousand TEU)Electric power consumption (kWh per capita)Power outages in firms in a typical month (number)Mobile-cellular telephone subscriptions (per 100 people)Individuals using the Internet (%)
East Asia & Pacific Lower middle income
Micronesia, Fed. Sts.
2005 2013 2013
Lower
middle-
income
groupCountry data
0.11 0.10 2,561.. .. 1,014.. .. 5.3
2,550 3,280 2,0740.4 0.2 5.8
24.4 28.2 17.05.7 9.2 32.10.6 0.5 17.1
69.8 62.7 51.1.. ..
1.0 1.0.. .. 27.1.. .. 31.2
.. 145
16 16 227 7 7
128 128 31530 30 25
5.3 5.3 2.9.. 0.0 15.9.. .... .. 1.1
.. .... .... .... .... .... ..
.. .. 402,668
0.0 0.6 2.1.. .. 25.5.. .. 18.8
.. .. ..
39.7 46.1 47.1
.. .. 10.3
.. .. 4.519.8 19.7 41.514.0 13.714.8 14.3 7.1
.. .. 2,437.. .. 62,268.. .. 736
.. ..13.3 30.3 85.211.9 27.8 21.2

145The Little Data Book on Private Sector Development 2015
Economic and social context
Population (millions)Labor force (millions)Unemployment rate (% of labor force)GNI per capita, World Bank Atlas method ($)GDP growth, 2000–05 and 2006–13 (average annual %)Agriculture value added (% of GDP)Industry value added (% of GDP) Manufacturing value added (% of GDP)Services value added (% of GDP)Inflation (annual % change in CPI)Exchange rate (local currency units per $)Exports of goods and services (% of GDP)Imports of goods and services (% of GDP)
Business environment
Ease of doing business (ranking 1–189; 1=best)Time to start a business (days)Procedures to start a business (number)Time to prepare, file, and pay taxes (hours)Time to export (days)Time to resolve insolvency (years)Profit tax (% of commercial profits)New businesses registered (thousands)New business density (new regis. per 1,000 working-age pop.)Enterprise surveys
Time spent dealing w/req. of gov't. reg. (% of sr. mgt. time) Firms expected to give gifts in meetings with tax officials (%) Firms competing against unregistered firms (%) Firms using banks to finance working capital (% of firms) Delay in obtaining an electrical connection (days) Internationally recognized quality certification (% of firms)
Private sector investment
Invest. in infra. w/privt. part., 2000–05 and 2006–13 ($ millions)Private foreign direct investment, net (% of GDP)Gross fixed capital formation (% of GDP)Gross fixed private capital formation (% of GDP)
Finance and banking
Government debt (% of GDP)Total financial system deposits (% of GDP)Bank capital to asset ratio (%)Bank nonperforming loans to total gross loans (%)Domestic credit to the private sector (% of GDP)Real interest rate (%)Interest rate spread (percentage points)
Infrastructure
Air transport (thousands registered carrier departures worldwide)Port container traffic (thousand TEU)Electric power consumption (kWh per capita)Power outages in firms in a typical month (number)Mobile-cellular telephone subscriptions (per 100 people)Individuals using the Internet (%)
Europe & Central Asia Lower middle income
Moldova
2005 2013 2013
Lower
middle-
income
groupCountry data
3.6 3.6 2,5611.4 1.2 1,0147.3 5.1 5.3
890 2,470 2,0747.1 3.4 5.8
19.5 15.0 17.016.3 16.6 32.115.9 13.6 17.164.1 68.4 51.111.8 4.612.6 12.651.1 43.8 27.191.7 81.5 31.2
.. 63
30 6 2210 5 7
234 185 31523 23 252.8 2.8 2.9
.. 9.3 15.94.6 4.2
1.8 1.6 1.1
3.7 6.8
45.2 13.5.. 32.3
33.7 26.630.4 10.5
7.2 18.7
171 662 402,6686.4 3.1 2.1
24.6 22.9 25.522.6 17.0 18.8
32.4 24.3 ..29.9 44.9 47.1
16.7 16.1 10.34.4 11.6 4.5
23.6 39.7 41.59.1 7.66.0 5.1 7.1
4 7 2,437.. .. 62,268
2,048 1,470 736
.. 0.428.9 106.0 85.214.6 48.8 21.2

146 2015 The Little Data Book on Private Sector Development
Economic and social context
Population (millions)Labor force (millions)Unemployment rate (% of labor force)GNI per capita, World Bank Atlas method ($)GDP growth, 2000–05 and 2006–13 (average annual %)Agriculture value added (% of GDP)Industry value added (% of GDP) Manufacturing value added (% of GDP)Services value added (% of GDP)Inflation (annual % change in CPI)Exchange rate (local currency units per $)Exports of goods and services (% of GDP)Imports of goods and services (% of GDP)
Business environment
Ease of doing business (ranking 1–189; 1=best)Time to start a business (days)Procedures to start a business (number)Time to prepare, file, and pay taxes (hours)Time to export (days)Time to resolve insolvency (years)Profit tax (% of commercial profits)New businesses registered (thousands)New business density (new regis. per 1,000 working-age pop.)Enterprise surveys
Time spent dealing w/req. of gov't. reg. (% of sr. mgt. time) Firms expected to give gifts in meetings with tax officials (%) Firms competing against unregistered firms (%) Firms using banks to finance working capital (% of firms) Delay in obtaining an electrical connection (days) Internationally recognized quality certification (% of firms)
Private sector investment
Invest. in infra. w/privt. part., 2000–05 and 2006–13 ($ millions)Private foreign direct investment, net (% of GDP)Gross fixed capital formation (% of GDP)Gross fixed private capital formation (% of GDP)
Finance and banking
Government debt (% of GDP)Total financial system deposits (% of GDP)Bank capital to asset ratio (%)Bank nonperforming loans to total gross loans (%)Domestic credit to the private sector (% of GDP)Real interest rate (%)Interest rate spread (percentage points)
Infrastructure
Air transport (thousands registered carrier departures worldwide)Port container traffic (thousand TEU)Electric power consumption (kWh per capita)Power outages in firms in a typical month (number)Mobile-cellular telephone subscriptions (per 100 people)Individuals using the Internet (%)
High income
Monaco
2005 2013 2013
High-
income
groupCountry data
0.03 0.04 1,306.. .. 646.. .. 7.7
128,380 .. 39,8121.7 .. 0.9
.. .. 1.5
.. .. 24.8
.. .. 15.0
.. .. 73.7
.. ..0.8 0.8
.. .. 30.0
.. .. 29.6
.. .... .. 15.. .. 6.. .. 166.. .. 12.. .. 2.0.. .. 14.1.. .... .. 7.5
.. .... .... .... .... .... ..
.. .. .... .. 2.0.. .. 20.3.. .. .. .. .. 65.9
.. .. 90.3
.. .. 8.2
.. .. 3.2
.. .. 150.9
.. ..
.. .. ..
12 11 20,868
.. .. 321,602
.. .. 8,906
.. ..50.8 93.7 121.055.5 90.7 78.2
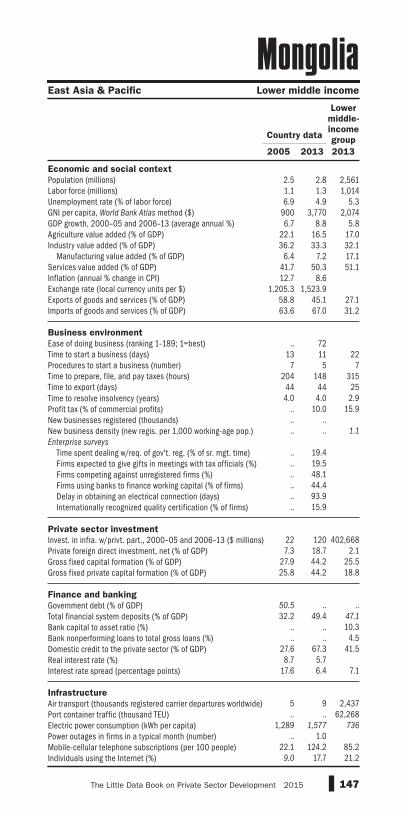
147The Little Data Book on Private Sector Development 2015
Economic and social context
Population (millions)Labor force (millions)Unemployment rate (% of labor force)GNI per capita, World Bank Atlas method ($)GDP growth, 2000–05 and 2006–13 (average annual %)Agriculture value added (% of GDP)Industry value added (% of GDP) Manufacturing value added (% of GDP)Services value added (% of GDP)Inflation (annual % change in CPI)Exchange rate (local currency units per $)Exports of goods and services (% of GDP)Imports of goods and services (% of GDP)
Business environment
Ease of doing business (ranking 1–189; 1=best)Time to start a business (days)Procedures to start a business (number)Time to prepare, file, and pay taxes (hours)Time to export (days)Time to resolve insolvency (years)Profit tax (% of commercial profits)New businesses registered (thousands)New business density (new regis. per 1,000 working-age pop.)Enterprise surveys
Time spent dealing w/req. of gov't. reg. (% of sr. mgt. time) Firms expected to give gifts in meetings with tax officials (%) Firms competing against unregistered firms (%) Firms using banks to finance working capital (% of firms) Delay in obtaining an electrical connection (days) Internationally recognized quality certification (% of firms)
Private sector investment
Invest. in infra. w/privt. part., 2000–05 and 2006–13 ($ millions)Private foreign direct investment, net (% of GDP)Gross fixed capital formation (% of GDP)Gross fixed private capital formation (% of GDP)
Finance and banking
Government debt (% of GDP)Total financial system deposits (% of GDP)Bank capital to asset ratio (%)Bank nonperforming loans to total gross loans (%)Domestic credit to the private sector (% of GDP)Real interest rate (%)Interest rate spread (percentage points)
Infrastructure
Air transport (thousands registered carrier departures worldwide)Port container traffic (thousand TEU)Electric power consumption (kWh per capita)Power outages in firms in a typical month (number)Mobile-cellular telephone subscriptions (per 100 people)Individuals using the Internet (%)
East Asia & Pacific Lower middle income
Mongolia
2005 2013 2013
Lower
middle-
income
groupCountry data
2.5 2.8 2,5611.1 1.3 1,0146.9 4.9 5.3
900 3,770 2,0746.7 8.8 5.8
22.1 16.5 17.036.2 33.3 32.1
6.4 7.2 17.141.7 50.3 51.112.7 8.6
1,205.3 1,523.958.8 45.1 27.163.6 67.0 31.2
.. 72
13 11 227 5 7
204 148 31544 44 254.0 4.0 2.9
.. 10.0 15.9
.. ..
.. .. 1.1
.. 19.4.. 19.5.. 48.1.. 44.4.. 93.9.. 15.9
22 120 402,6687.3 18.7 2.1
27.9 44.2 25.525.8 44.2 18.8
50.5 .. ..32.2 49.4 47.1
.. .. 10.3
.. .. 4.527.6 67.3 41.58.7 5.7
17.6 6.4 7.1
5 9 2,437.. .. 62,268
1,289 1,577 736
.. 1.022.1 124.2 85.2
9.0 17.7 21.2
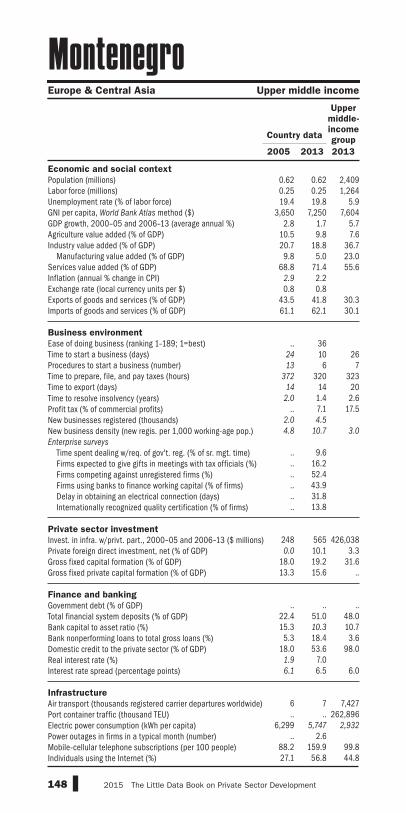
148 2015 The Little Data Book on Private Sector Development
Economic and social context
Population (millions)Labor force (millions)Unemployment rate (% of labor force)GNI per capita, World Bank Atlas method ($)GDP growth, 2000–05 and 2006–13 (average annual %)Agriculture value added (% of GDP)Industry value added (% of GDP) Manufacturing value added (% of GDP)Services value added (% of GDP)Inflation (annual % change in CPI)Exchange rate (local currency units per $)Exports of goods and services (% of GDP)Imports of goods and services (% of GDP)
Business environment
Ease of doing business (ranking 1–189; 1=best)Time to start a business (days)Procedures to start a business (number)Time to prepare, file, and pay taxes (hours)Time to export (days)Time to resolve insolvency (years)Profit tax (% of commercial profits)New businesses registered (thousands)New business density (new regis. per 1,000 working-age pop.)Enterprise surveys
Time spent dealing w/req. of gov't. reg. (% of sr. mgt. time) Firms expected to give gifts in meetings with tax officials (%) Firms competing against unregistered firms (%) Firms using banks to finance working capital (% of firms) Delay in obtaining an electrical connection (days) Internationally recognized quality certification (% of firms)
Private sector investment
Invest. in infra. w/privt. part., 2000–05 and 2006–13 ($ millions)Private foreign direct investment, net (% of GDP)Gross fixed capital formation (% of GDP)Gross fixed private capital formation (% of GDP)
Finance and banking
Government debt (% of GDP)Total financial system deposits (% of GDP)Bank capital to asset ratio (%)Bank nonperforming loans to total gross loans (%)Domestic credit to the private sector (% of GDP)Real interest rate (%)Interest rate spread (percentage points)
Infrastructure
Air transport (thousands registered carrier departures worldwide)Port container traffic (thousand TEU)Electric power consumption (kWh per capita)Power outages in firms in a typical month (number)Mobile-cellular telephone subscriptions (per 100 people)Individuals using the Internet (%)
Europe & Central Asia Upper middle income
Montenegro
2005 2013 2013
Upper
middle-
income
groupCountry data
0.62 0.62 2,4090.25 0.25 1,26419.4 19.8 5.9
3,650 7,250 7,6042.8 1.7 5.7
10.5 9.8 7.620.7 18.8 36.79.8 5.0 23.0
68.8 71.4 55.62.9 2.20.8 0.8
43.5 41.8 30.361.1 62.1 30.1
.. 36
24 10 2613 6 7
372 320 32314 14 20
2.0 1.4 2.6.. 7.1 17.5
2.0 4.5
4.8 10.7 3.0
.. 9.6.. 16.2.. 52.4.. 43.9.. 31.8.. 13.8
248 565 426,0380.0 10.1 3.3
18.0 19.2 31.613.3 15.6 ..
.. .. ..
22.4 51.0 48.015.3 10.3 10.75.3 18.4 3.6
18.0 53.6 98.01.9 7.06.1 6.5 6.0
6 7 7,427.. .. 262,896
6,299 5,747 2,932
.. 2.688.2 159.9 99.827.1 56.8 44.8

149The Little Data Book on Private Sector Development 2015
Economic and social context
Population (millions)Labor force (millions)Unemployment rate (% of labor force)GNI per capita, World Bank Atlas method ($)GDP growth, 2000–05 and 2006–13 (average annual %)Agriculture value added (% of GDP)Industry value added (% of GDP) Manufacturing value added (% of GDP)Services value added (% of GDP)Inflation (annual % change in CPI)Exchange rate (local currency units per $)Exports of goods and services (% of GDP)Imports of goods and services (% of GDP)
Business environment
Ease of doing business (ranking 1–189; 1=best)Time to start a business (days)Procedures to start a business (number)Time to prepare, file, and pay taxes (hours)Time to export (days)Time to resolve insolvency (years)Profit tax (% of commercial profits)New businesses registered (thousands)New business density (new regis. per 1,000 working-age pop.)Enterprise surveys
Time spent dealing w/req. of gov't. reg. (% of sr. mgt. time) Firms expected to give gifts in meetings with tax officials (%) Firms competing against unregistered firms (%) Firms using banks to finance working capital (% of firms) Delay in obtaining an electrical connection (days) Internationally recognized quality certification (% of firms)
Private sector investment
Invest. in infra. w/privt. part., 2000–05 and 2006–13 ($ millions)Private foreign direct investment, net (% of GDP)Gross fixed capital formation (% of GDP)Gross fixed private capital formation (% of GDP)
Finance and banking
Government debt (% of GDP)Total financial system deposits (% of GDP)Bank capital to asset ratio (%)Bank nonperforming loans to total gross loans (%)Domestic credit to the private sector (% of GDP)Real interest rate (%)Interest rate spread (percentage points)
Infrastructure
Air transport (thousands registered carrier departures worldwide)Port container traffic (thousand TEU)Electric power consumption (kWh per capita)Power outages in firms in a typical month (number)Mobile-cellular telephone subscriptions (per 100 people)Individuals using the Internet (%)
Middle East & North Africa Lower middle income
Morocco
2005 2013 2013
Lower
middle-
income
groupCountry data
30.1 33.0 2,56110.9 12.0 1,01411.0 9.2 5.3
1,980 3,020 2,0745.0 4.2 5.8
14.7 16.6 17.028.2 28.5 32.116.6 15.4 17.157.1 54.9 51.11.0 1.98.9 8.4
32.3 33.6 27.137.9 46.9 31.2
.. 71
12 11 226 5 7
358 232 31517 10 25
1.8 3.5 2.9.. 25.3 15.9
11.3 26.2
0.6 1.3 1.1
11.4 ..10.7 ..47.7 ..30.2 ..18.8 ..17.3 ..
7,389 9,327 402,668
2.8 3.2 2.127.5 30.2 25.5
.. .. 18.8
57.3 59.7 ..70.9 88.8 47.1
7.7 8.9 10.315.7 5.9 4.546.1 70.2 41.5
9.9 ..8.0 .. 7.1
49 62 2,437
561 2,500 62,268641 826 736
0.8 ..41.1 128.5 85.215.1 56.0 21.2
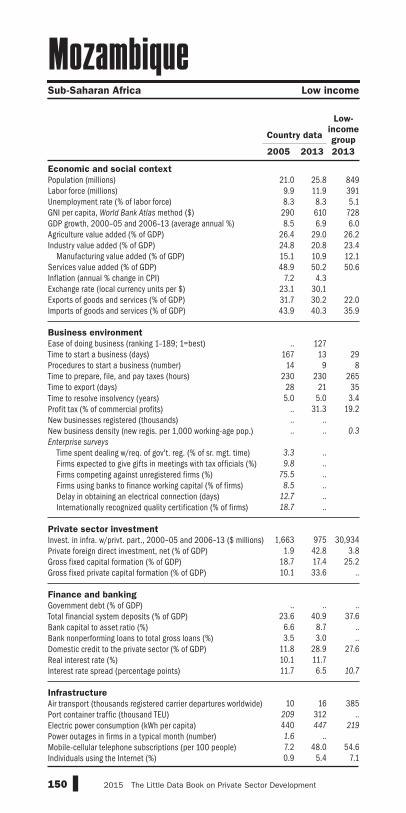
150 2015 The Little Data Book on Private Sector Development
Economic and social context
Population (millions)Labor force (millions)Unemployment rate (% of labor force)GNI per capita, World Bank Atlas method ($)GDP growth, 2000–05 and 2006–13 (average annual %)Agriculture value added (% of GDP)Industry value added (% of GDP) Manufacturing value added (% of GDP)Services value added (% of GDP)Inflation (annual % change in CPI)Exchange rate (local currency units per $)Exports of goods and services (% of GDP)Imports of goods and services (% of GDP)
Business environment
Ease of doing business (ranking 1–189; 1=best)Time to start a business (days)Procedures to start a business (number)Time to prepare, file, and pay taxes (hours)Time to export (days)Time to resolve insolvency (years)Profit tax (% of commercial profits)New businesses registered (thousands)New business density (new regis. per 1,000 working-age pop.)Enterprise surveys
Time spent dealing w/req. of gov't. reg. (% of sr. mgt. time) Firms expected to give gifts in meetings with tax officials (%) Firms competing against unregistered firms (%) Firms using banks to finance working capital (% of firms) Delay in obtaining an electrical connection (days) Internationally recognized quality certification (% of firms)
Private sector investment
Invest. in infra. w/privt. part., 2000–05 and 2006–13 ($ millions)Private foreign direct investment, net (% of GDP)Gross fixed capital formation (% of GDP)Gross fixed private capital formation (% of GDP)
Finance and banking
Government debt (% of GDP)Total financial system deposits (% of GDP)Bank capital to asset ratio (%)Bank nonperforming loans to total gross loans (%)Domestic credit to the private sector (% of GDP)Real interest rate (%)Interest rate spread (percentage points)
Infrastructure
Air transport (thousands registered carrier departures worldwide)Port container traffic (thousand TEU)Electric power consumption (kWh per capita)Power outages in firms in a typical month (number)Mobile-cellular telephone subscriptions (per 100 people)Individuals using the Internet (%)
Sub-Saharan Africa Low income
Mozambique
2005 2013 2013
Low-
income
groupCountry data
21.0 25.8 8499.9 11.9 3918.3 8.3 5.1
290 610 7288.5 6.9 6.0
26.4 29.0 26.224.8 20.8 23.415.1 10.9 12.148.9 50.2 50.6
7.2 4.323.1 30.131.7 30.2 22.043.9 40.3 35.9
.. 127
167 13 2914 9 8
230 230 26528 21 355.0 5.0 3.4
.. 31.3 19.2
.. ..
.. .. 0.3
3.3 ..9.8 ..
75.5 ..8.5 ..
12.7 ..18.7 ..
1,663 975 30,934
1.9 42.8 3.818.7 17.4 25.210.1 33.6 ..
.. .. ..
23.6 40.9 37.66.6 8.7 ..3.5 3.0 ..
11.8 28.9 27.610.1 11.711.7 6.5 10.7
10 16 385
209 312 ..440 447 219
1.6 ..7.2 48.0 54.60.9 5.4 7.1

151The Little Data Book on Private Sector Development 2015
Economic and social context
Population (millions)Labor force (millions)Unemployment rate (% of labor force)GNI per capita, World Bank Atlas method ($)GDP growth, 2000–05 and 2006–13 (average annual %)Agriculture value added (% of GDP)Industry value added (% of GDP) Manufacturing value added (% of GDP)Services value added (% of GDP)Inflation (annual % change in CPI)Exchange rate (local currency units per $)Exports of goods and services (% of GDP)Imports of goods and services (% of GDP)
Business environment
Ease of doing business (ranking 1–189; 1=best)Time to start a business (days)Procedures to start a business (number)Time to prepare, file, and pay taxes (hours)Time to export (days)Time to resolve insolvency (years)Profit tax (% of commercial profits)New businesses registered (thousands)New business density (new regis. per 1,000 working-age pop.)Enterprise surveys
Time spent dealing w/req. of gov't. reg. (% of sr. mgt. time) Firms expected to give gifts in meetings with tax officials (%) Firms competing against unregistered firms (%) Firms using banks to finance working capital (% of firms) Delay in obtaining an electrical connection (days) Internationally recognized quality certification (% of firms)
Private sector investment
Invest. in infra. w/privt. part., 2000–05 and 2006–13 ($ millions)Private foreign direct investment, net (% of GDP)Gross fixed capital formation (% of GDP)Gross fixed private capital formation (% of GDP)
Finance and banking
Government debt (% of GDP)Total financial system deposits (% of GDP)Bank capital to asset ratio (%)Bank nonperforming loans to total gross loans (%)Domestic credit to the private sector (% of GDP)Real interest rate (%)Interest rate spread (percentage points)
Infrastructure
Air transport (thousands registered carrier departures worldwide)Port container traffic (thousand TEU)Electric power consumption (kWh per capita)Power outages in firms in a typical month (number)Mobile-cellular telephone subscriptions (per 100 people)Individuals using the Internet (%)
East Asia & Pacific Low income
Myanmar
2005 2013 2013
Low-
income
groupCountry data
50.2 53.3 84928.0 31.4 391
3.4 3.4 5.1.. .. 728
12.8 .. 6.048.4 .. 26.216.2 .. 23.411.6 .. 12.135.4 .. 50.6
9.4 5.5.. ..
0.2 .. 22.00.1 .. 35.9
.. 177.. 72 29.. 11 8.. 155 265.. 20 35.. 5.0 3.4.. 25.4 19.2.. .... .. 0.3
.. 2.0.. 37.1.. 31.2.. 4.7.. 105.6.. 1.7
.. 726 30,934.. .. 3.8
11.7 .. 25.2.. .. ..
.. .. ..
8.1 .. 37.6.. .. .... .. ..
4.7 .. 27.611.1 ..5.5 5.0 10.7
26 43 385
170 233 ..73 110 219
.. 12.50.3 12.8 54.60.1 1.2 7.1
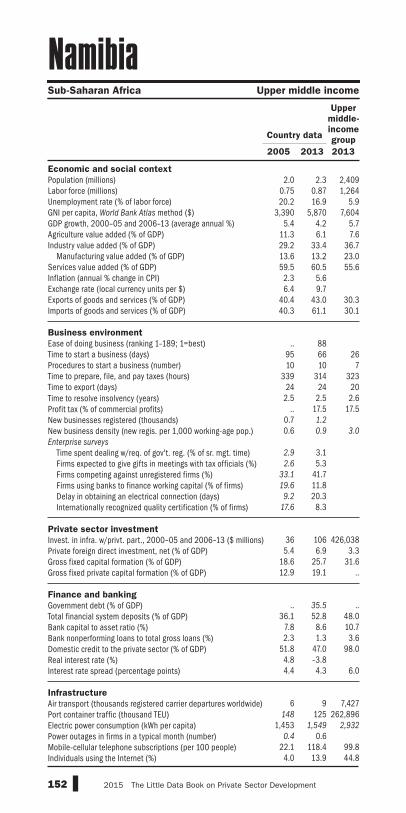
152 2015 The Little Data Book on Private Sector Development
Economic and social context
Population (millions)Labor force (millions)Unemployment rate (% of labor force)GNI per capita, World Bank Atlas method ($)GDP growth, 2000–05 and 2006–13 (average annual %)Agriculture value added (% of GDP)Industry value added (% of GDP) Manufacturing value added (% of GDP)Services value added (% of GDP)Inflation (annual % change in CPI)Exchange rate (local currency units per $)Exports of goods and services (% of GDP)Imports of goods and services (% of GDP)
Business environment
Ease of doing business (ranking 1–189; 1=best)Time to start a business (days)Procedures to start a business (number)Time to prepare, file, and pay taxes (hours)Time to export (days)Time to resolve insolvency (years)Profit tax (% of commercial profits)New businesses registered (thousands)New business density (new regis. per 1,000 working-age pop.)Enterprise surveys
Time spent dealing w/req. of gov't. reg. (% of sr. mgt. time) Firms expected to give gifts in meetings with tax officials (%) Firms competing against unregistered firms (%) Firms using banks to finance working capital (% of firms) Delay in obtaining an electrical connection (days) Internationally recognized quality certification (% of firms)
Private sector investment
Invest. in infra. w/privt. part., 2000–05 and 2006–13 ($ millions)Private foreign direct investment, net (% of GDP)Gross fixed capital formation (% of GDP)Gross fixed private capital formation (% of GDP)
Finance and banking
Government debt (% of GDP)Total financial system deposits (% of GDP)Bank capital to asset ratio (%)Bank nonperforming loans to total gross loans (%)Domestic credit to the private sector (% of GDP)Real interest rate (%)Interest rate spread (percentage points)
Infrastructure
Air transport (thousands registered carrier departures worldwide)Port container traffic (thousand TEU)Electric power consumption (kWh per capita)Power outages in firms in a typical month (number)Mobile-cellular telephone subscriptions (per 100 people)Individuals using the Internet (%)
Sub-Saharan Africa Upper middle income
Namibia
2005 2013 2013
Upper
middle-
income
groupCountry data
2.0 2.3 2,4090.75 0.87 1,26420.2 16.9 5.9
3,390 5,870 7,6045.4 4.2 5.7
11.3 6.1 7.629.2 33.4 36.713.6 13.2 23.059.5 60.5 55.6
2.3 5.66.4 9.7
40.4 43.0 30.340.3 61.1 30.1
.. 88
95 66 2610 10 7
339 314 32324 24 20
2.5 2.5 2.6.. 17.5 17.5
0.7 1.2
0.6 0.9 3.0
2.9 3.12.6 5.3
33.1 41.719.6 11.8
9.2 20.317.6 8.3
36 106 426,0385.4 6.9 3.3
18.6 25.7 31.612.9 19.1 ..
.. 35.5 ..
36.1 52.8 48.07.8 8.6 10.72.3 1.3 3.6
51.8 47.0 98.04.8 –3.84.4 4.3 6.0
6 9 7,427
148 125 262,8961,453 1,549 2,932
0.4 0.622.1 118.4 99.84.0 13.9 44.8
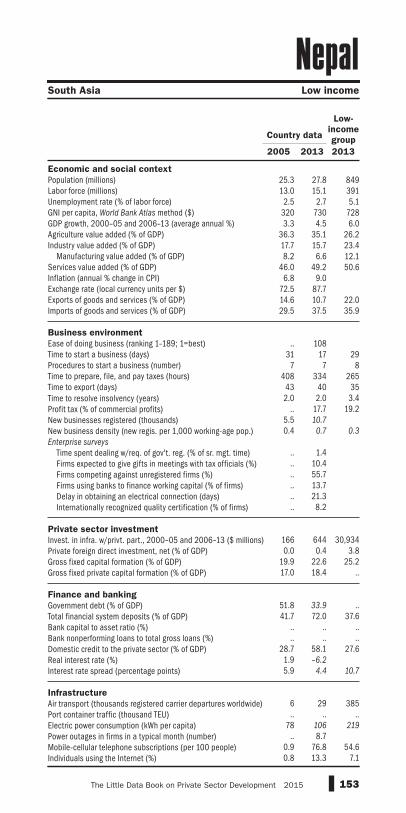
153The Little Data Book on Private Sector Development 2015
Economic and social context
Population (millions)Labor force (millions)Unemployment rate (% of labor force)GNI per capita, World Bank Atlas method ($)GDP growth, 2000–05 and 2006–13 (average annual %)Agriculture value added (% of GDP)Industry value added (% of GDP) Manufacturing value added (% of GDP)Services value added (% of GDP)Inflation (annual % change in CPI)Exchange rate (local currency units per $)Exports of goods and services (% of GDP)Imports of goods and services (% of GDP)
Business environment
Ease of doing business (ranking 1–189; 1=best)Time to start a business (days)Procedures to start a business (number)Time to prepare, file, and pay taxes (hours)Time to export (days)Time to resolve insolvency (years)Profit tax (% of commercial profits)New businesses registered (thousands)New business density (new regis. per 1,000 working-age pop.)Enterprise surveys
Time spent dealing w/req. of gov't. reg. (% of sr. mgt. time) Firms expected to give gifts in meetings with tax officials (%) Firms competing against unregistered firms (%) Firms using banks to finance working capital (% of firms) Delay in obtaining an electrical connection (days) Internationally recognized quality certification (% of firms)
Private sector investment
Invest. in infra. w/privt. part., 2000–05 and 2006–13 ($ millions)Private foreign direct investment, net (% of GDP)Gross fixed capital formation (% of GDP)Gross fixed private capital formation (% of GDP)
Finance and banking
Government debt (% of GDP)Total financial system deposits (% of GDP)Bank capital to asset ratio (%)Bank nonperforming loans to total gross loans (%)Domestic credit to the private sector (% of GDP)Real interest rate (%)Interest rate spread (percentage points)
Infrastructure
Air transport (thousands registered carrier departures worldwide)Port container traffic (thousand TEU)Electric power consumption (kWh per capita)Power outages in firms in a typical month (number)Mobile-cellular telephone subscriptions (per 100 people)Individuals using the Internet (%)
South Asia Low income
Nepal
2005 2013 2013
Low-
income
groupCountry data
25.3 27.8 84913.0 15.1 391
2.5 2.7 5.1320 730 7283.3 4.5 6.0
36.3 35.1 26.217.7 15.7 23.48.2 6.6 12.1
46.0 49.2 50.66.8 9.0
72.5 87.714.6 10.7 22.029.5 37.5 35.9
.. 108
31 17 297 7 8
408 334 26543 40 352.0 2.0 3.4
.. 17.7 19.25.5 10.7
0.4 0.7 0.3
.. 1.4.. 10.4.. 55.7.. 13.7.. 21.3.. 8.2
166 644 30,9340.0 0.4 3.8
19.9 22.6 25.217.0 18.4 ..
51.8 33.9 ..41.7 72.0 37.6
.. .. ..
.. .. ..28.7 58.1 27.61.9 –6.2
5.9 4.4 10.7
6 29 385.. .. ..
78 106 219
.. 8.70.9 76.8 54.60.8 13.3 7.1

154 2015 The Little Data Book on Private Sector Development
Economic and social context
Population (millions)Labor force (millions)Unemployment rate (% of labor force)GNI per capita, World Bank Atlas method ($)GDP growth, 2000–05 and 2006–13 (average annual %)Agriculture value added (% of GDP)Industry value added (% of GDP) Manufacturing value added (% of GDP)Services value added (% of GDP)Inflation (annual % change in CPI)Exchange rate (local currency units per $)Exports of goods and services (% of GDP)Imports of goods and services (% of GDP)
Business environment
Ease of doing business (ranking 1–189; 1=best)Time to start a business (days)Procedures to start a business (number)Time to prepare, file, and pay taxes (hours)Time to export (days)Time to resolve insolvency (years)Profit tax (% of commercial profits)New businesses registered (thousands)New business density (new regis. per 1,000 working-age pop.)Enterprise surveys
Time spent dealing w/req. of gov't. reg. (% of sr. mgt. time) Firms expected to give gifts in meetings with tax officials (%) Firms competing against unregistered firms (%) Firms using banks to finance working capital (% of firms) Delay in obtaining an electrical connection (days) Internationally recognized quality certification (% of firms)
Private sector investment
Invest. in infra. w/privt. part., 2000–05 and 2006–13 ($ millions)Private foreign direct investment, net (% of GDP)Gross fixed capital formation (% of GDP)Gross fixed private capital formation (% of GDP)
Finance and banking
Government debt (% of GDP)Total financial system deposits (% of GDP)Bank capital to asset ratio (%)Bank nonperforming loans to total gross loans (%)Domestic credit to the private sector (% of GDP)Real interest rate (%)Interest rate spread (percentage points)
Infrastructure
Air transport (thousands registered carrier departures worldwide)Port container traffic (thousand TEU)Electric power consumption (kWh per capita)Power outages in firms in a typical month (number)Mobile-cellular telephone subscriptions (per 100 people)Individuals using the Internet (%)
High income
Netherlands
2005 2013 2013
High-
income
groupCountry data
16.3 16.8 1,3068.6 9.0 6464.7 6.7 7.7
42,010 51,060 39,8121.0 0.2 0.92.0 2.0 1.5
23.6 22.2 24.8
13.8 12.1 15.0
74.4 75.9 73.7
1.7 2.50.8 0.8
66.4 82.9 30.058.3 72.6 29.6
.. 279 4 157 4 6
250 123 1667 7 12
1.1 1.1 2.0.. 21.1 14.1
46.5 49.4
4.2 4.4 7.5
.. .... .... .... .... .... ..
.. .. ..
6.6 3.8 2.020.4 18.2 20.3
.. .. ..
48.9 67.9 65.9
107.2 125.0 90.33.0 4.8 8.21.2 3.2 3.2
156.7 178.0 150.91.1 0.4
0.4 –1.1 ..
241 313 20,868
9,472 11,829 321,6026,988 7,036 8,906
.. ..97.1 113.7 121.081.0 94.0 78.2

155The Little Data Book on Private Sector Development 2015
Economic and social context
Population (millions)Labor force (millions)Unemployment rate (% of labor force)GNI per capita, World Bank Atlas method ($)GDP growth, 2000–05 and 2006–13 (average annual %)Agriculture value added (% of GDP)Industry value added (% of GDP) Manufacturing value added (% of GDP)Services value added (% of GDP)Inflation (annual % change in CPI)Exchange rate (local currency units per $)Exports of goods and services (% of GDP)Imports of goods and services (% of GDP)
Business environment
Ease of doing business (ranking 1–189; 1=best)Time to start a business (days)Procedures to start a business (number)Time to prepare, file, and pay taxes (hours)Time to export (days)Time to resolve insolvency (years)Profit tax (% of commercial profits)New businesses registered (thousands)New business density (new regis. per 1,000 working-age pop.)Enterprise surveys
Time spent dealing w/req. of gov't. reg. (% of sr. mgt. time) Firms expected to give gifts in meetings with tax officials (%) Firms competing against unregistered firms (%) Firms using banks to finance working capital (% of firms) Delay in obtaining an electrical connection (days) Internationally recognized quality certification (% of firms)
Private sector investment
Invest. in infra. w/privt. part., 2000–05 and 2006–13 ($ millions)Private foreign direct investment, net (% of GDP)Gross fixed capital formation (% of GDP)Gross fixed private capital formation (% of GDP)
Finance and banking
Government debt (% of GDP)Total financial system deposits (% of GDP)Bank capital to asset ratio (%)Bank nonperforming loans to total gross loans (%)Domestic credit to the private sector (% of GDP)Real interest rate (%)Interest rate spread (percentage points)
Infrastructure
Air transport (thousands registered carrier departures worldwide)Port container traffic (thousand TEU)Electric power consumption (kWh per capita)Power outages in firms in a typical month (number)Mobile-cellular telephone subscriptions (per 100 people)Individuals using the Internet (%)
High income
New Caledonia
2005 2013 2013
High-
income
groupCountry data
0.23 0.26 1,3060.10 0.11 646
.. .. 7.7
.. .. 39,812
.. .. 0.9
.. .. 1.5
.. .. 24.8
.. .. 15.0
.. .. 73.7
.. ..
.. ..
.. .. 30.0
.. .. 29.6
.. .... .. 15.. .. 6.. .. 166.. .. 12.. .. 2.0.. .. 14.1.. .... .. 7.5
.. .... .... .... .... .... ..
.. .. .... .. 2.0.. .. 20.3.. .. .. .. .. 65.9
.. .. 90.3
.. .. 8.2
.. .. 3.2
.. .. 150.9
.. ..
.. .. ..
.. .. 20,868
83 111 321,602.. .. 8,906
.. ..58.7 93.8 121.032.4 66.0 78.2

156 2015 The Little Data Book on Private Sector Development
Economic and social context
Population (millions)Labor force (millions)Unemployment rate (% of labor force)GNI per capita, World Bank Atlas method ($)GDP growth, 2000–05 and 2006–13 (average annual %)Agriculture value added (% of GDP)Industry value added (% of GDP) Manufacturing value added (% of GDP)Services value added (% of GDP)Inflation (annual % change in CPI)Exchange rate (local currency units per $)Exports of goods and services (% of GDP)Imports of goods and services (% of GDP)
Business environment
Ease of doing business (ranking 1–189; 1=best)Time to start a business (days)Procedures to start a business (number)Time to prepare, file, and pay taxes (hours)Time to export (days)Time to resolve insolvency (years)Profit tax (% of commercial profits)New businesses registered (thousands)New business density (new regis. per 1,000 working-age pop.)Enterprise surveys
Time spent dealing w/req. of gov't. reg. (% of sr. mgt. time) Firms expected to give gifts in meetings with tax officials (%) Firms competing against unregistered firms (%) Firms using banks to finance working capital (% of firms) Delay in obtaining an electrical connection (days) Internationally recognized quality certification (% of firms)
Private sector investment
Invest. in infra. w/privt. part., 2000–05 and 2006–13 ($ millions)Private foreign direct investment, net (% of GDP)Gross fixed capital formation (% of GDP)Gross fixed private capital formation (% of GDP)
Finance and banking
Government debt (% of GDP)Total financial system deposits (% of GDP)Bank capital to asset ratio (%)Bank nonperforming loans to total gross loans (%)Domestic credit to the private sector (% of GDP)Real interest rate (%)Interest rate spread (percentage points)
Infrastructure
Air transport (thousands registered carrier departures worldwide)Port container traffic (thousand TEU)Electric power consumption (kWh per capita)Power outages in firms in a typical month (number)Mobile-cellular telephone subscriptions (per 100 people)Individuals using the Internet (%)
High income
New Zealand
2005 2013 2013
High-
income
groupCountry data
4.1 4.4 1,3062.2 2.4 6463.8 6.2 7.7
25,140 35,760 39,8124.0 1.5 0.94.9 7.2 1.5
25.9 23.8 24.8
15.7 12.2 15.0
69.1 69.1 73.7
3.0 1.31.4 1.2
28.5 29.7 30.030.0 27.8 29.6
.. 2
12 1 152 1 6
172 152 16610 10 12
1.3 1.3 2.0.. 30.0 14.1
64.8 44.2
23.6 15.1 7.5
.. .... .... .... .... .... ..
.. .. ..
1.7 –0.3 2.023.9 20.6 20.3
.. .. ..
44.5 69.0 65.9
77.5 92.8 90.35.3 7.2 8.20.3 1.0 3.2
121.6 145.4 150.95.4 1.01.1 1.7 ..
209 194 20,868
1,603 3,093 321,6029,674 9,444 8,906
.. ..85.4 105.8 121.062.7 82.8 78.2

157The Little Data Book on Private Sector Development 2015
Economic and social context
Population (millions)Labor force (millions)Unemployment rate (% of labor force)GNI per capita, World Bank Atlas method ($)GDP growth, 2000–05 and 2006–13 (average annual %)Agriculture value added (% of GDP)Industry value added (% of GDP) Manufacturing value added (% of GDP)Services value added (% of GDP)Inflation (annual % change in CPI)Exchange rate (local currency units per $)Exports of goods and services (% of GDP)Imports of goods and services (% of GDP)
Business environment
Ease of doing business (ranking 1–189; 1=best)Time to start a business (days)Procedures to start a business (number)Time to prepare, file, and pay taxes (hours)Time to export (days)Time to resolve insolvency (years)Profit tax (% of commercial profits)New businesses registered (thousands)New business density (new regis. per 1,000 working-age pop.)Enterprise surveys
Time spent dealing w/req. of gov't. reg. (% of sr. mgt. time) Firms expected to give gifts in meetings with tax officials (%) Firms competing against unregistered firms (%) Firms using banks to finance working capital (% of firms) Delay in obtaining an electrical connection (days) Internationally recognized quality certification (% of firms)
Private sector investment
Invest. in infra. w/privt. part., 2000–05 and 2006–13 ($ millions)Private foreign direct investment, net (% of GDP)Gross fixed capital formation (% of GDP)Gross fixed private capital formation (% of GDP)
Finance and banking
Government debt (% of GDP)Total financial system deposits (% of GDP)Bank capital to asset ratio (%)Bank nonperforming loans to total gross loans (%)Domestic credit to the private sector (% of GDP)Real interest rate (%)Interest rate spread (percentage points)
Infrastructure
Air transport (thousands registered carrier departures worldwide)Port container traffic (thousand TEU)Electric power consumption (kWh per capita)Power outages in firms in a typical month (number)Mobile-cellular telephone subscriptions (per 100 people)Individuals using the Internet (%)
Latin America & Caribbean Lower middle income
Nicaragua
2005 2013 2013
Lower
middle-
income
groupCountry data
5.5 6.1 2,5612.1 2.6 1,0145.6 7.2 5.3
1,160 1,790 2,0743.1 3.1 5.8
17.7 16.9 17.022.9 30.9 32.114.8 19.3 17.159.4 52.2 51.1
9.6 7.116.7 24.724.4 40.5 27.147.3 52.1 31.2
.. 119
40 13 228 6 7
240 207 31538 21 252.2 2.2 2.9
.. 22.5 15.9
.. ..
.. .. 1.1
9.3 20.2
2.6 4.2
73.4 62.6
37.9 18.4
62.7 24.7
18.7 15.5
449 1,593 402,6683.8 7.5 2.1
23.5 22.9 25.519.4 16.9 18.8
.. .. ..
27.9 31.2 47.1
7.3 .. 10.38.0 .. 4.5
22.6 28.8 41.52.0 8.38.1 14.0 7.1
.. .. 2,437
61 96 62,268411 522 736
9.3 4.9
20.5 112.0 85.22.6 15.5 21.2

158 2015 The Little Data Book on Private Sector Development
Economic and social context
Population (millions)Labor force (millions)Unemployment rate (% of labor force)GNI per capita, World Bank Atlas method ($)GDP growth, 2000–05 and 2006–13 (average annual %)Agriculture value added (% of GDP)Industry value added (% of GDP) Manufacturing value added (% of GDP)Services value added (% of GDP)Inflation (annual % change in CPI)Exchange rate (local currency units per $)Exports of goods and services (% of GDP)Imports of goods and services (% of GDP)
Business environment
Ease of doing business (ranking 1–189; 1=best)Time to start a business (days)Procedures to start a business (number)Time to prepare, file, and pay taxes (hours)Time to export (days)Time to resolve insolvency (years)Profit tax (% of commercial profits)New businesses registered (thousands)New business density (new regis. per 1,000 working-age pop.)Enterprise surveys
Time spent dealing w/req. of gov't. reg. (% of sr. mgt. time) Firms expected to give gifts in meetings with tax officials (%) Firms competing against unregistered firms (%) Firms using banks to finance working capital (% of firms) Delay in obtaining an electrical connection (days) Internationally recognized quality certification (% of firms)
Private sector investment
Invest. in infra. w/privt. part., 2000–05 and 2006–13 ($ millions)Private foreign direct investment, net (% of GDP)Gross fixed capital formation (% of GDP)Gross fixed private capital formation (% of GDP)
Finance and banking
Government debt (% of GDP)Total financial system deposits (% of GDP)Bank capital to asset ratio (%)Bank nonperforming loans to total gross loans (%)Domestic credit to the private sector (% of GDP)Real interest rate (%)Interest rate spread (percentage points)
Infrastructure
Air transport (thousands registered carrier departures worldwide)Port container traffic (thousand TEU)Electric power consumption (kWh per capita)Power outages in firms in a typical month (number)Mobile-cellular telephone subscriptions (per 100 people)Individuals using the Internet (%)
Sub-Saharan Africa Low income
Niger
2005 2013 2013
Low-
income
groupCountry data
13.2 17.8 8494.3 5.8 3915.1 5.1 5.1
250 400 7283.7 5.3 6.0
24.7 37.2 26.215.4 19.4 23.4
6.1 6.1 12.159.9 43.4 50.6
7.8 2.3527.5 494.016.6 23.3 22.030.8 41.4 35.9
.. 168
35 15 2913 6 8
270 270 26559 56 355.0 5.0 3.4
.. 21.3 19.20.0 0.0
0.0 0.0 0.3
11.4 ..17.1 ..
.. ..26.4 ..20.6 ..
4.8 ..
89 572 30,9341.5 8.5 3.8
21.4 34.4 25.214.5 22.9 ..
.. .. ..
7.7 13.1 37.6.. .. .... .. ..
6.8 14.2 27.6.. .... .. 10.7
.. 1 385.. .. .... .. 219
20.7 ..2.5 39.3 54.60.2 1.7 7.1
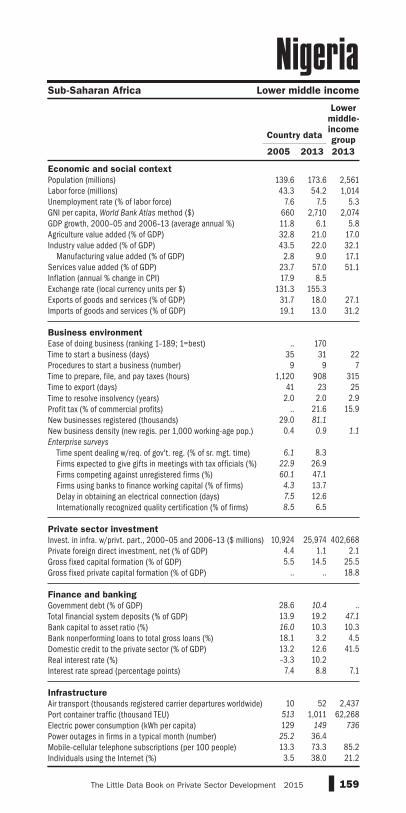
159The Little Data Book on Private Sector Development 2015
Economic and social context
Population (millions)Labor force (millions)Unemployment rate (% of labor force)GNI per capita, World Bank Atlas method ($)GDP growth, 2000–05 and 2006–13 (average annual %)Agriculture value added (% of GDP)Industry value added (% of GDP) Manufacturing value added (% of GDP)Services value added (% of GDP)Inflation (annual % change in CPI)Exchange rate (local currency units per $)Exports of goods and services (% of GDP)Imports of goods and services (% of GDP)
Business environment
Ease of doing business (ranking 1–189; 1=best)Time to start a business (days)Procedures to start a business (number)Time to prepare, file, and pay taxes (hours)Time to export (days)Time to resolve insolvency (years)Profit tax (% of commercial profits)New businesses registered (thousands)New business density (new regis. per 1,000 working-age pop.)Enterprise surveys
Time spent dealing w/req. of gov't. reg. (% of sr. mgt. time) Firms expected to give gifts in meetings with tax officials (%) Firms competing against unregistered firms (%) Firms using banks to finance working capital (% of firms) Delay in obtaining an electrical connection (days) Internationally recognized quality certification (% of firms)
Private sector investment
Invest. in infra. w/privt. part., 2000–05 and 2006–13 ($ millions)Private foreign direct investment, net (% of GDP)Gross fixed capital formation (% of GDP)Gross fixed private capital formation (% of GDP)
Finance and banking
Government debt (% of GDP)Total financial system deposits (% of GDP)Bank capital to asset ratio (%)Bank nonperforming loans to total gross loans (%)Domestic credit to the private sector (% of GDP)Real interest rate (%)Interest rate spread (percentage points)
Infrastructure
Air transport (thousands registered carrier departures worldwide)Port container traffic (thousand TEU)Electric power consumption (kWh per capita)Power outages in firms in a typical month (number)Mobile-cellular telephone subscriptions (per 100 people)Individuals using the Internet (%)
Sub-Saharan Africa Lower middle income
Nigeria
2005 2013 2013
Lower
middle-
income
groupCountry data
139.6 173.6 2,56143.3 54.2 1,014
7.6 7.5 5.3660 2,710 2,07411.8 6.1 5.832.8 21.0 17.043.5 22.0 32.1
2.8 9.0 17.123.7 57.0 51.117.9 8.5
131.3 155.331.7 18.0 27.119.1 13.0 31.2
.. 170
35 31 229 9 7
1,120 908 31541 23 25
2.0 2.0 2.9.. 21.6 15.9
29.0 81.1
0.4 0.9 1.1
6.1 8.3
22.9 26.960.1 47.14.3 13.77.5 12.68.5 6.5
10,924 25,974 402,668
4.4 1.1 2.15.5 14.5 25.5
.. .. 18.8
28.6 10.4 ..13.9 19.2 47.1
16.0 10.3 10.318.1 3.2 4.513.2 12.6 41.5–3.3 10.2
7.4 8.8 7.1
10 52 2,437
513 1,011 62,268129 149 736
25.2 36.413.3 73.3 85.2
3.5 38.0 21.2
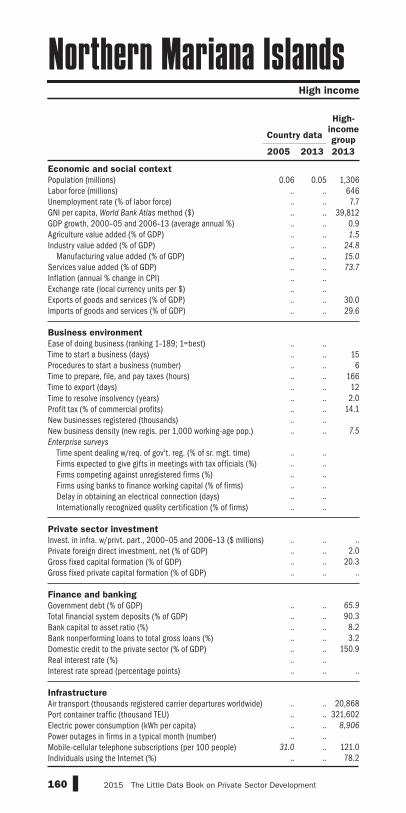
160 2015 The Little Data Book on Private Sector Development
Economic and social context
Population (millions)Labor force (millions)Unemployment rate (% of labor force)GNI per capita, World Bank Atlas method ($)GDP growth, 2000–05 and 2006–13 (average annual %)Agriculture value added (% of GDP)Industry value added (% of GDP) Manufacturing value added (% of GDP)Services value added (% of GDP)Inflation (annual % change in CPI)Exchange rate (local currency units per $)Exports of goods and services (% of GDP)Imports of goods and services (% of GDP)
Business environment
Ease of doing business (ranking 1–189; 1=best)Time to start a business (days)Procedures to start a business (number)Time to prepare, file, and pay taxes (hours)Time to export (days)Time to resolve insolvency (years)Profit tax (% of commercial profits)New businesses registered (thousands)New business density (new regis. per 1,000 working-age pop.)Enterprise surveys
Time spent dealing w/req. of gov't. reg. (% of sr. mgt. time) Firms expected to give gifts in meetings with tax officials (%) Firms competing against unregistered firms (%) Firms using banks to finance working capital (% of firms) Delay in obtaining an electrical connection (days) Internationally recognized quality certification (% of firms)
Private sector investment
Invest. in infra. w/privt. part., 2000–05 and 2006–13 ($ millions)Private foreign direct investment, net (% of GDP)Gross fixed capital formation (% of GDP)Gross fixed private capital formation (% of GDP)
Finance and banking
Government debt (% of GDP)Total financial system deposits (% of GDP)Bank capital to asset ratio (%)Bank nonperforming loans to total gross loans (%)Domestic credit to the private sector (% of GDP)Real interest rate (%)Interest rate spread (percentage points)
Infrastructure
Air transport (thousands registered carrier departures worldwide)Port container traffic (thousand TEU)Electric power consumption (kWh per capita)Power outages in firms in a typical month (number)Mobile-cellular telephone subscriptions (per 100 people)Individuals using the Internet (%)
High income
Northern Mariana Islands
2005 2013 2013
High-
income
groupCountry data
0.06 0.05 1,306.. .. 646.. .. 7.7.. .. 39,812.. .. 0.9.. .. 1.5
.. .. 24.8
.. .. 15.0
.. .. 73.7
.. ..
.. ..
.. .. 30.0
.. .. 29.6
.. .... .. 15.. .. 6.. .. 166.. .. 12.. .. 2.0.. .. 14.1.. .... .. 7.5
.. .... .... .... .... .... ..
.. .. .... .. 2.0.. .. 20.3.. .. .. .. .. 65.9
.. .. 90.3
.. .. 8.2
.. .. 3.2
.. .. 150.9
.. ..
.. .. ..
.. .. 20,868.. .. 321,602.. .. 8,906
.. ..31.0 .. 121.0
.. .. 78.2

161The Little Data Book on Private Sector Development 2015
Economic and social context
Population (millions)Labor force (millions)Unemployment rate (% of labor force)GNI per capita, World Bank Atlas method ($)GDP growth, 2000–05 and 2006–13 (average annual %)Agriculture value added (% of GDP)Industry value added (% of GDP) Manufacturing value added (% of GDP)Services value added (% of GDP)Inflation (annual % change in CPI)Exchange rate (local currency units per $)Exports of goods and services (% of GDP)Imports of goods and services (% of GDP)
Business environment
Ease of doing business (ranking 1–189; 1=best)Time to start a business (days)Procedures to start a business (number)Time to prepare, file, and pay taxes (hours)Time to export (days)Time to resolve insolvency (years)Profit tax (% of commercial profits)New businesses registered (thousands)New business density (new regis. per 1,000 working-age pop.)Enterprise surveys
Time spent dealing w/req. of gov't. reg. (% of sr. mgt. time) Firms expected to give gifts in meetings with tax officials (%) Firms competing against unregistered firms (%) Firms using banks to finance working capital (% of firms) Delay in obtaining an electrical connection (days) Internationally recognized quality certification (% of firms)
Private sector investment
Invest. in infra. w/privt. part., 2000–05 and 2006–13 ($ millions)Private foreign direct investment, net (% of GDP)Gross fixed capital formation (% of GDP)Gross fixed private capital formation (% of GDP)
Finance and banking
Government debt (% of GDP)Total financial system deposits (% of GDP)Bank capital to asset ratio (%)Bank nonperforming loans to total gross loans (%)Domestic credit to the private sector (% of GDP)Real interest rate (%)Interest rate spread (percentage points)
Infrastructure
Air transport (thousands registered carrier departures worldwide)Port container traffic (thousand TEU)Electric power consumption (kWh per capita)Power outages in firms in a typical month (number)Mobile-cellular telephone subscriptions (per 100 people)Individuals using the Internet (%)
High income
Norway
2005 2013 2013
High-
income
groupCountry data
4.6 5.1 1,3062.4 2.7 6464.6 3.5 7.7
62,760 102,700 39,8122.1 0.7 0.91.6 1.5 1.5
42.8 40.8 24.8
9.0 7.3 15.0
55.6 57.7 73.7
1.5 2.16.4 5.9
44.1 38.9 30.027.8 28.2 29.6
.. 68 5 155 4 6
87 83 1668 8 12
0.9 0.9 2.0.. 24.8 14.1
20.5 25.9
6.8 7.8 7.5
.. .... .... .... .... .... ..
.. .. ..
3.5 0.5 2.019.2 22.6 20.3
.. .. ..
35.9 20.9 65.9
51.1 .. 90.37.0 6.8 8.20.7 1.3 3.2
80.9 .. 150.9–4.5 ..2.2 .. ..
254 .. 20,868329 361 321,602
25,083 23,174 8,906
.. ..102.8 116.3 121.0
82.0 95.1 78.2

162 2015 The Little Data Book on Private Sector Development
Economic and social context
Population (millions)Labor force (millions)Unemployment rate (% of labor force)GNI per capita, World Bank Atlas method ($)GDP growth, 2000–05 and 2006–13 (average annual %)Agriculture value added (% of GDP)Industry value added (% of GDP) Manufacturing value added (% of GDP)Services value added (% of GDP)Inflation (annual % change in CPI)Exchange rate (local currency units per $)Exports of goods and services (% of GDP)Imports of goods and services (% of GDP)
Business environment
Ease of doing business (ranking 1–189; 1=best)Time to start a business (days)Procedures to start a business (number)Time to prepare, file, and pay taxes (hours)Time to export (days)Time to resolve insolvency (years)Profit tax (% of commercial profits)New businesses registered (thousands)New business density (new regis. per 1,000 working-age pop.)Enterprise surveys
Time spent dealing w/req. of gov't. reg. (% of sr. mgt. time) Firms expected to give gifts in meetings with tax officials (%) Firms competing against unregistered firms (%) Firms using banks to finance working capital (% of firms) Delay in obtaining an electrical connection (days) Internationally recognized quality certification (% of firms)
Private sector investment
Invest. in infra. w/privt. part., 2000–05 and 2006–13 ($ millions)Private foreign direct investment, net (% of GDP)Gross fixed capital formation (% of GDP)Gross fixed private capital formation (% of GDP)
Finance and banking
Government debt (% of GDP)Total financial system deposits (% of GDP)Bank capital to asset ratio (%)Bank nonperforming loans to total gross loans (%)Domestic credit to the private sector (% of GDP)Real interest rate (%)Interest rate spread (percentage points)
Infrastructure
Air transport (thousands registered carrier departures worldwide)Port container traffic (thousand TEU)Electric power consumption (kWh per capita)Power outages in firms in a typical month (number)Mobile-cellular telephone subscriptions (per 100 people)Individuals using the Internet (%)
High income
Oman
2005 2013 2013
High-
income
groupCountry data
2.5 3.6 1,3060.91 1.8 6468.4 7.9 7.7
10,580 25,150 39,8120.3 5.0 0.91.6 1.3 1.5
63.5 67.3 24.8
8.6 10.7 15.0
34.8 31.4 73.7
1.9 1.20.4 0.4
58.3 62.6 30.031.1 35.9 29.6
.. 66
35 7 1510 5 652 68 16614 10 12
4.0 4.0 2.0.. 11.1 14.1
1.4 3.2
0.9 1.7 7.5
.. .... .... .... .... .... ..
.. .. ..
4.9 2.0 2.022.0 22.3 20.3
.. .. ..
8.5 5.0 65.9
26.7 35.2 90.313.9 11.9 8.2
7.0 2.1 3.230.6 42.7 150.9
–12.6 0.2
3.8 3.0 ..
32 47 20,868
2,749 3,930 321,6024,084 6,292 8,906
.. ..52.9 154.6 121.0
6.7 66.5 78.2

163The Little Data Book on Private Sector Development 2015
Economic and social context
Population (millions)Labor force (millions)Unemployment rate (% of labor force)GNI per capita, World Bank Atlas method ($)GDP growth, 2000–05 and 2006–13 (average annual %)Agriculture value added (% of GDP)Industry value added (% of GDP) Manufacturing value added (% of GDP)Services value added (% of GDP)Inflation (annual % change in CPI)Exchange rate (local currency units per $)Exports of goods and services (% of GDP)Imports of goods and services (% of GDP)
Business environment
Ease of doing business (ranking 1–189; 1=best)Time to start a business (days)Procedures to start a business (number)Time to prepare, file, and pay taxes (hours)Time to export (days)Time to resolve insolvency (years)Profit tax (% of commercial profits)New businesses registered (thousands)New business density (new regis. per 1,000 working-age pop.)Enterprise surveys
Time spent dealing w/req. of gov't. reg. (% of sr. mgt. time) Firms expected to give gifts in meetings with tax officials (%) Firms competing against unregistered firms (%) Firms using banks to finance working capital (% of firms) Delay in obtaining an electrical connection (days) Internationally recognized quality certification (% of firms)
Private sector investment
Invest. in infra. w/privt. part., 2000–05 and 2006–13 ($ millions)Private foreign direct investment, net (% of GDP)Gross fixed capital formation (% of GDP)Gross fixed private capital formation (% of GDP)
Finance and banking
Government debt (% of GDP)Total financial system deposits (% of GDP)Bank capital to asset ratio (%)Bank nonperforming loans to total gross loans (%)Domestic credit to the private sector (% of GDP)Real interest rate (%)Interest rate spread (percentage points)
Infrastructure
Air transport (thousands registered carrier departures worldwide)Port container traffic (thousand TEU)Electric power consumption (kWh per capita)Power outages in firms in a typical month (number)Mobile-cellular telephone subscriptions (per 100 people)Individuals using the Internet (%)
South Asia Lower middle income
Pakistan
2005 2013 2013
Lower
middle-
income
groupCountry data
158.0 182.1 2,56151.4 65.6 1,014
7.1 5.1 5.3710 1,360 2,0745.0 2.8 5.8
21.5 25.1 17.027.1 21.1 32.118.6 14.0 17.151.4 53.8 51.1
9.1 7.759.4 96.815.7 13.2 27.119.6 19.9 31.2
.. 128
22 19 2211 10 7
560 594 31531 21 25
2.8 2.7 2.9.. 18.7 15.9
3.9 4.2
0.0 0.0 1.1
1.9 3.9
58.8 29.112.4 44.8
4.6 9.5106.3 82.3
9.6 36.8
7,642 18,769 402,668
2.0 0.6 2.117.5 13.0 25.513.1 9.6 18.8
.. .. ..
37.9 31.6 47.1
7.6 9.3 10.39.0 13.0 4.5
28.6 16.0 41.51.9 4.26.5 4.8 7.1
49 67 2,437
1,686 2,563 62,268450 449 736
31.7 69.68.1 70.1 85.26.3 10.9 21.2
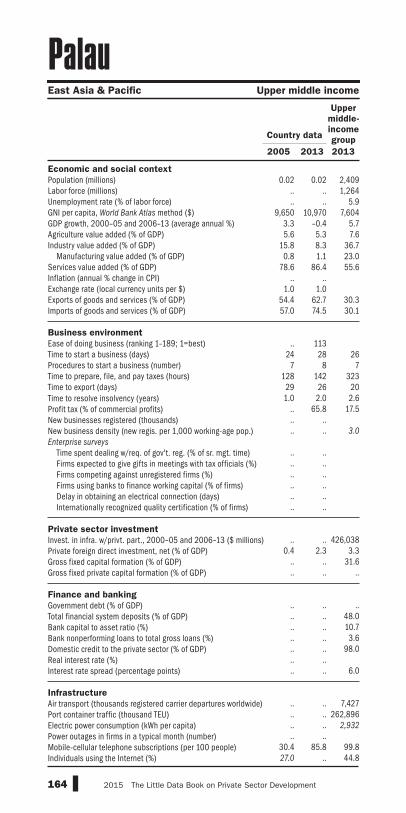
164 2015 The Little Data Book on Private Sector Development
Economic and social context
Population (millions)Labor force (millions)Unemployment rate (% of labor force)GNI per capita, World Bank Atlas method ($)GDP growth, 2000–05 and 2006–13 (average annual %)Agriculture value added (% of GDP)Industry value added (% of GDP) Manufacturing value added (% of GDP)Services value added (% of GDP)Inflation (annual % change in CPI)Exchange rate (local currency units per $)Exports of goods and services (% of GDP)Imports of goods and services (% of GDP)
Business environment
Ease of doing business (ranking 1–189; 1=best)Time to start a business (days)Procedures to start a business (number)Time to prepare, file, and pay taxes (hours)Time to export (days)Time to resolve insolvency (years)Profit tax (% of commercial profits)New businesses registered (thousands)New business density (new regis. per 1,000 working-age pop.)Enterprise surveys
Time spent dealing w/req. of gov't. reg. (% of sr. mgt. time) Firms expected to give gifts in meetings with tax officials (%) Firms competing against unregistered firms (%) Firms using banks to finance working capital (% of firms) Delay in obtaining an electrical connection (days) Internationally recognized quality certification (% of firms)
Private sector investment
Invest. in infra. w/privt. part., 2000–05 and 2006–13 ($ millions)Private foreign direct investment, net (% of GDP)Gross fixed capital formation (% of GDP)Gross fixed private capital formation (% of GDP)
Finance and banking
Government debt (% of GDP)Total financial system deposits (% of GDP)Bank capital to asset ratio (%)Bank nonperforming loans to total gross loans (%)Domestic credit to the private sector (% of GDP)Real interest rate (%)Interest rate spread (percentage points)
Infrastructure
Air transport (thousands registered carrier departures worldwide)Port container traffic (thousand TEU)Electric power consumption (kWh per capita)Power outages in firms in a typical month (number)Mobile-cellular telephone subscriptions (per 100 people)Individuals using the Internet (%)
East Asia & Pacific Upper middle income
Palau
2005 2013 2013
Upper
middle-
income
groupCountry data
0.02 0.02 2,409.. .. 1,264.. .. 5.9
9,650 10,970 7,6043.3 –0.4 5.75.6 5.3 7.6
15.8 8.3 36.70.8 1.1 23.0
78.6 86.4 55.6.. ..
1.0 1.054.4 62.7 30.357.0 74.5 30.1
.. 113
24 28 267 8 7
128 142 32329 26 201.0 2.0 2.6
.. 65.8 17.5
.. ..
.. .. 3.0
.. .... .... .... .... .... ..
.. .. 426,038
0.4 2.3 3.3.. .. 31.6.. .. ..
.. .. .... .. 48.0.. .. 10.7.. .. 3.6.. .. 98.0.. .... .. 6.0
.. .. 7,427.. .. 262,896.. .. 2,932
.. ..30.4 85.8 99.827.0 .. 44.8

165The Little Data Book on Private Sector Development 2015
Economic and social context
Population (millions)Labor force (millions)Unemployment rate (% of labor force)GNI per capita, World Bank Atlas method ($)GDP growth, 2000–05 and 2006–13 (average annual %)Agriculture value added (% of GDP)Industry value added (% of GDP) Manufacturing value added (% of GDP)Services value added (% of GDP)Inflation (annual % change in CPI)Exchange rate (local currency units per $)Exports of goods and services (% of GDP)Imports of goods and services (% of GDP)
Business environment
Ease of doing business (ranking 1–189; 1=best)Time to start a business (days)Procedures to start a business (number)Time to prepare, file, and pay taxes (hours)Time to export (days)Time to resolve insolvency (years)Profit tax (% of commercial profits)New businesses registered (thousands)New business density (new regis. per 1,000 working-age pop.)Enterprise surveys
Time spent dealing w/req. of gov't. reg. (% of sr. mgt. time) Firms expected to give gifts in meetings with tax officials (%) Firms competing against unregistered firms (%) Firms using banks to finance working capital (% of firms) Delay in obtaining an electrical connection (days) Internationally recognized quality certification (% of firms)
Private sector investment
Invest. in infra. w/privt. part., 2000–05 and 2006–13 ($ millions)Private foreign direct investment, net (% of GDP)Gross fixed capital formation (% of GDP)Gross fixed private capital formation (% of GDP)
Finance and banking
Government debt (% of GDP)Total financial system deposits (% of GDP)Bank capital to asset ratio (%)Bank nonperforming loans to total gross loans (%)Domestic credit to the private sector (% of GDP)Real interest rate (%)Interest rate spread (percentage points)
Infrastructure
Air transport (thousands registered carrier departures worldwide)Port container traffic (thousand TEU)Electric power consumption (kWh per capita)Power outages in firms in a typical month (number)Mobile-cellular telephone subscriptions (per 100 people)Individuals using the Internet (%)
Latin America & Caribbean Upper middle income
Panama
2005 2013 2013
Upper
middle-
income
groupCountry data
3.4 3.9 2,4091.5 1.8 1,2649.8 4.1 5.9
4,460 10,700 7,6044.4 8.2 5.77.0 3.5 7.6
16.6 22.1 36.77.4 5.8 23.0
76.5 74.4 55.63.2 4.01.0 1.0
75.5 79.8 30.369.1 75.0 30.1
.. 52
18 6 266 5 7
560 417 32310 10 20
2.5 2.5 2.6.. 12.4 17.5
40.3 34.5
18.9 14.1 3.0
10.3 33.3
7.7 6.4
40.1 51.4
39.4 9.0
10.2 1.8
14.7 22.5
712 3,668 426,0387.1 11.8 3.3
16.8 26.5 31.614.4 .. ..
.. .. ..
73.8 74.5 48.013.1 10.2 10.72.9 1.9 3.6
87.1 70.7 98.06.8 2.86.0 4.5 6.0
30 93 7,427
3,064 7,448 262,8961,440 1,829 2,932
3.1 0.652.0 163.0 99.811.5 42.9 44.8

166 2015 The Little Data Book on Private Sector Development
Economic and social context
Population (millions)Labor force (millions)Unemployment rate (% of labor force)GNI per capita, World Bank Atlas method ($)GDP growth, 2000–05 and 2006–13 (average annual %)Agriculture value added (% of GDP)Industry value added (% of GDP) Manufacturing value added (% of GDP)Services value added (% of GDP)Inflation (annual % change in CPI)Exchange rate (local currency units per $)Exports of goods and services (% of GDP)Imports of goods and services (% of GDP)
Business environment
Ease of doing business (ranking 1–189; 1=best)Time to start a business (days)Procedures to start a business (number)Time to prepare, file, and pay taxes (hours)Time to export (days)Time to resolve insolvency (years)Profit tax (% of commercial profits)New businesses registered (thousands)New business density (new regis. per 1,000 working-age pop.)Enterprise surveys
Time spent dealing w/req. of gov't. reg. (% of sr. mgt. time) Firms expected to give gifts in meetings with tax officials (%) Firms competing against unregistered firms (%) Firms using banks to finance working capital (% of firms) Delay in obtaining an electrical connection (days) Internationally recognized quality certification (% of firms)
Private sector investment
Invest. in infra. w/privt. part., 2000–05 and 2006–13 ($ millions)Private foreign direct investment, net (% of GDP)Gross fixed capital formation (% of GDP)Gross fixed private capital formation (% of GDP)
Finance and banking
Government debt (% of GDP)Total financial system deposits (% of GDP)Bank capital to asset ratio (%)Bank nonperforming loans to total gross loans (%)Domestic credit to the private sector (% of GDP)Real interest rate (%)Interest rate spread (percentage points)
Infrastructure
Air transport (thousands registered carrier departures worldwide)Port container traffic (thousand TEU)Electric power consumption (kWh per capita)Power outages in firms in a typical month (number)Mobile-cellular telephone subscriptions (per 100 people)Individuals using the Internet (%)
East Asia & Pacific Lower middle income
Papua New Guinea
2005 2013 2013
Lower
middle-
income
groupCountry data
6.1 7.3 2,5612.7 3.3 1,0142.6 2.1 5.3
700 2,020 2,0742.0 7.6 5.8
37.8 .. 17.038.9 .. 32.1
7.0 .. 17.123.3 .. 51.1
1.8 5.03.1 2.2
72.2 .. 27.158.9 .. 31.2
.. 133
52 53 226 6 7
207 207 31523 23 253.0 3.0 2.9
.. 23.2 15.9
.. ..
.. .. 1.1
.. .... .... .... .... .... ..
.. 150 402,668
0.7 0.1 2.118.1 .. 25.5
.. .. 18.8
69.7 .. ..30.6 48.4 47.1
.. .. 10.3
.. .. 4.514.1 34.6 41.5–0.6 7.710.6 9.8 7.1
20 43 2,437
282 364 62,268.. .. 736
.. ..1.2 41.0 85.21.7 6.5 21.2

167The Little Data Book on Private Sector Development 2015
Economic and social context
Population (millions)Labor force (millions)Unemployment rate (% of labor force)GNI per capita, World Bank Atlas method ($)GDP growth, 2000–05 and 2006–13 (average annual %)Agriculture value added (% of GDP)Industry value added (% of GDP) Manufacturing value added (% of GDP)Services value added (% of GDP)Inflation (annual % change in CPI)Exchange rate (local currency units per $)Exports of goods and services (% of GDP)Imports of goods and services (% of GDP)
Business environment
Ease of doing business (ranking 1–189; 1=best)Time to start a business (days)Procedures to start a business (number)Time to prepare, file, and pay taxes (hours)Time to export (days)Time to resolve insolvency (years)Profit tax (% of commercial profits)New businesses registered (thousands)New business density (new regis. per 1,000 working-age pop.)Enterprise surveys
Time spent dealing w/req. of gov't. reg. (% of sr. mgt. time) Firms expected to give gifts in meetings with tax officials (%) Firms competing against unregistered firms (%) Firms using banks to finance working capital (% of firms) Delay in obtaining an electrical connection (days) Internationally recognized quality certification (% of firms)
Private sector investment
Invest. in infra. w/privt. part., 2000–05 and 2006–13 ($ millions)Private foreign direct investment, net (% of GDP)Gross fixed capital formation (% of GDP)Gross fixed private capital formation (% of GDP)
Finance and banking
Government debt (% of GDP)Total financial system deposits (% of GDP)Bank capital to asset ratio (%)Bank nonperforming loans to total gross loans (%)Domestic credit to the private sector (% of GDP)Real interest rate (%)Interest rate spread (percentage points)
Infrastructure
Air transport (thousands registered carrier departures worldwide)Port container traffic (thousand TEU)Electric power consumption (kWh per capita)Power outages in firms in a typical month (number)Mobile-cellular telephone subscriptions (per 100 people)Individuals using the Internet (%)
Latin America & Caribbean Lower middle income
Paraguay
2005 2013 2013
Lower
middle-
income
groupCountry data
5.9 6.8 2,5612.7 3.2 1,0145.8 5.2 5.3
1,210 4,010 2,0742.2 4.7 5.8
19.6 21.6 17.034.8 28.4 32.112.9 11.6 17.145.7 50.0 51.16.8 2.7
6,178.0 4,303.958.2 49.4 27.146.0 44.7 31.2
.. 92
72 35 2217 7 7
328 378 31536 29 25
3.9 3.9 2.9.. 9.6 15.9.. .... .. 1.1
7.9 20.6
24.4 14.6
76.7 75.3
25.8 48.0
27.2 23.2
7.0 15.0
199 1,168 402,6680.1 1.2 2.1
16.6 15.1 25.5.. .. 18.8
.. .. ..
16.4 27.4 47.1
9.9 10.0 10.36.5 2.0 4.5
15.1 45.8 41.518.0 18.828.2 15.0 7.1
10 6 2,437
.. 10 62,268848 1,228 736
1.8 2.732.0 103.7 85.2
7.9 36.9 21.2

168 2015 The Little Data Book on Private Sector Development
Economic and social context
Population (millions)Labor force (millions)Unemployment rate (% of labor force)GNI per capita, World Bank Atlas method ($)GDP growth, 2000–05 and 2006–13 (average annual %)Agriculture value added (% of GDP)Industry value added (% of GDP) Manufacturing value added (% of GDP)Services value added (% of GDP)Inflation (annual % change in CPI)Exchange rate (local currency units per $)Exports of goods and services (% of GDP)Imports of goods and services (% of GDP)
Business environment
Ease of doing business (ranking 1–189; 1=best)Time to start a business (days)Procedures to start a business (number)Time to prepare, file, and pay taxes (hours)Time to export (days)Time to resolve insolvency (years)Profit tax (% of commercial profits)New businesses registered (thousands)New business density (new regis. per 1,000 working-age pop.)Enterprise surveys
Time spent dealing w/req. of gov't. reg. (% of sr. mgt. time) Firms expected to give gifts in meetings with tax officials (%) Firms competing against unregistered firms (%) Firms using banks to finance working capital (% of firms) Delay in obtaining an electrical connection (days) Internationally recognized quality certification (% of firms)
Private sector investment
Invest. in infra. w/privt. part., 2000–05 and 2006–13 ($ millions)Private foreign direct investment, net (% of GDP)Gross fixed capital formation (% of GDP)Gross fixed private capital formation (% of GDP)
Finance and banking
Government debt (% of GDP)Total financial system deposits (% of GDP)Bank capital to asset ratio (%)Bank nonperforming loans to total gross loans (%)Domestic credit to the private sector (% of GDP)Real interest rate (%)Interest rate spread (percentage points)
Infrastructure
Air transport (thousands registered carrier departures worldwide)Port container traffic (thousand TEU)Electric power consumption (kWh per capita)Power outages in firms in a typical month (number)Mobile-cellular telephone subscriptions (per 100 people)Individuals using the Internet (%)
Latin America & Caribbean Upper middle income
Peru
2005 2013 2013
Upper
middle-
income
groupCountry data
27.7 30.4 2,40912.9 16.5 1,2645.2 3.9 5.9
2,530 6,270 7,6044.4 6.3 5.77.3 .. 7.6
41.1 .. 36.718.0 .. 23.051.6 .. 55.61.6 2.83.3 2.7
26.6 23.7 30.320.3 24.6 30.1
.. 35
104 26 2610 6 7
424 293 32322 12 203.1 3.1 2.6
.. 22.8 17.523.3 74.1
1.4 3.8 3.0
13.5 14.1
1.6 8.4
64.1 68.6
60.9 49.9
81.6 33.4
14.6 14.2
5,415 19,381 426,038
3.4 4.6 3.317.4 26.6 31.614.3 20.8 ..
32.8 19.2 ..24.0 35.4 48.09.2 10.1 10.76.3 3.5 3.6
19.7 31.4 98.022.9 16.122.9 15.8 6.0
61 110 7,427
992 2,192 262,896834 1,248 2,932
0.2 0.6
20.1 98.1 99.817.1 39.2 44.8
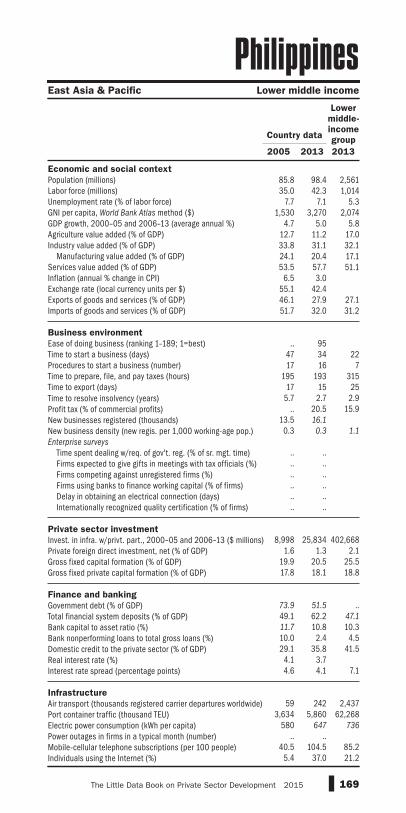
169The Little Data Book on Private Sector Development 2015
Economic and social context
Population (millions)Labor force (millions)Unemployment rate (% of labor force)GNI per capita, World Bank Atlas method ($)GDP growth, 2000–05 and 2006–13 (average annual %)Agriculture value added (% of GDP)Industry value added (% of GDP) Manufacturing value added (% of GDP)Services value added (% of GDP)Inflation (annual % change in CPI)Exchange rate (local currency units per $)Exports of goods and services (% of GDP)Imports of goods and services (% of GDP)
Business environment
Ease of doing business (ranking 1–189; 1=best)Time to start a business (days)Procedures to start a business (number)Time to prepare, file, and pay taxes (hours)Time to export (days)Time to resolve insolvency (years)Profit tax (% of commercial profits)New businesses registered (thousands)New business density (new regis. per 1,000 working-age pop.)Enterprise surveys
Time spent dealing w/req. of gov't. reg. (% of sr. mgt. time) Firms expected to give gifts in meetings with tax officials (%) Firms competing against unregistered firms (%) Firms using banks to finance working capital (% of firms) Delay in obtaining an electrical connection (days) Internationally recognized quality certification (% of firms)
Private sector investment
Invest. in infra. w/privt. part., 2000–05 and 2006–13 ($ millions)Private foreign direct investment, net (% of GDP)Gross fixed capital formation (% of GDP)Gross fixed private capital formation (% of GDP)
Finance and banking
Government debt (% of GDP)Total financial system deposits (% of GDP)Bank capital to asset ratio (%)Bank nonperforming loans to total gross loans (%)Domestic credit to the private sector (% of GDP)Real interest rate (%)Interest rate spread (percentage points)
Infrastructure
Air transport (thousands registered carrier departures worldwide)Port container traffic (thousand TEU)Electric power consumption (kWh per capita)Power outages in firms in a typical month (number)Mobile-cellular telephone subscriptions (per 100 people)Individuals using the Internet (%)
East Asia & Pacific Lower middle income
Philippines
2005 2013 2013
Lower
middle-
income
groupCountry data
85.8 98.4 2,56135.0 42.3 1,014
7.7 7.1 5.31,530 3,270 2,074
4.7 5.0 5.812.7 11.2 17.033.8 31.1 32.124.1 20.4 17.153.5 57.7 51.1
6.5 3.055.1 42.446.1 27.9 27.151.7 32.0 31.2
.. 95
47 34 2217 16 7
195 193 31517 15 25
5.7 2.7 2.9.. 20.5 15.9
13.5 16.1
0.3 0.3 1.1
.. .... .... .... .... .... ..
8,998 25,834 402,668
1.6 1.3 2.119.9 20.5 25.517.8 18.1 18.8
73.9 51.5 ..49.1 62.2 47.1
11.7 10.8 10.310.0 2.4 4.529.1 35.8 41.5
4.1 3.74.6 4.1 7.1
59 242 2,437
3,634 5,860 62,268580 647 736
.. ..40.5 104.5 85.2
5.4 37.0 21.2
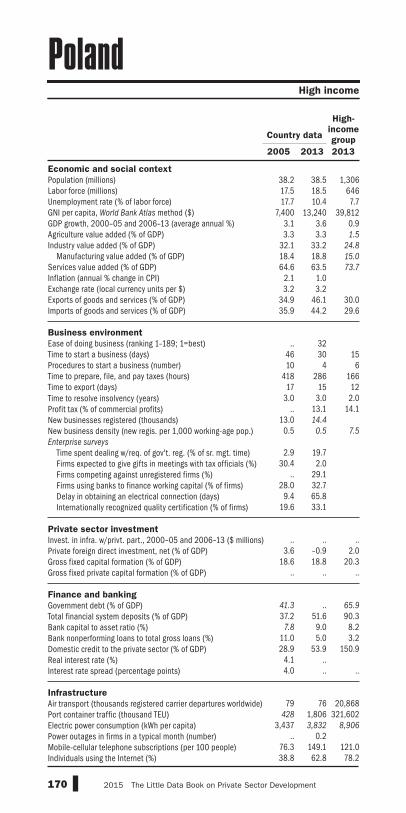
170 2015 The Little Data Book on Private Sector Development
Economic and social context
Population (millions)Labor force (millions)Unemployment rate (% of labor force)GNI per capita, World Bank Atlas method ($)GDP growth, 2000–05 and 2006–13 (average annual %)Agriculture value added (% of GDP)Industry value added (% of GDP) Manufacturing value added (% of GDP)Services value added (% of GDP)Inflation (annual % change in CPI)Exchange rate (local currency units per $)Exports of goods and services (% of GDP)Imports of goods and services (% of GDP)
Business environment
Ease of doing business (ranking 1–189; 1=best)Time to start a business (days)Procedures to start a business (number)Time to prepare, file, and pay taxes (hours)Time to export (days)Time to resolve insolvency (years)Profit tax (% of commercial profits)New businesses registered (thousands)New business density (new regis. per 1,000 working-age pop.)Enterprise surveys
Time spent dealing w/req. of gov't. reg. (% of sr. mgt. time) Firms expected to give gifts in meetings with tax officials (%) Firms competing against unregistered firms (%) Firms using banks to finance working capital (% of firms) Delay in obtaining an electrical connection (days) Internationally recognized quality certification (% of firms)
Private sector investment
Invest. in infra. w/privt. part., 2000–05 and 2006–13 ($ millions)Private foreign direct investment, net (% of GDP)Gross fixed capital formation (% of GDP)Gross fixed private capital formation (% of GDP)
Finance and banking
Government debt (% of GDP)Total financial system deposits (% of GDP)Bank capital to asset ratio (%)Bank nonperforming loans to total gross loans (%)Domestic credit to the private sector (% of GDP)Real interest rate (%)Interest rate spread (percentage points)
Infrastructure
Air transport (thousands registered carrier departures worldwide)Port container traffic (thousand TEU)Electric power consumption (kWh per capita)Power outages in firms in a typical month (number)Mobile-cellular telephone subscriptions (per 100 people)Individuals using the Internet (%)
High income
Poland
2005 2013 2013
High-
income
groupCountry data
38.2 38.5 1,30617.5 18.5 64617.7 10.4 7.7
7,400 13,240 39,8123.1 3.6 0.93.3 3.3 1.5
32.1 33.2 24.8
18.4 18.8 15.0
64.6 63.5 73.7
2.1 1.03.2 3.2
34.9 46.1 30.035.9 44.2 29.6
.. 32
46 30 1510 4 6
418 286 16617 15 12
3.0 3.0 2.0.. 13.1 14.1
13.0 14.4
0.5 0.5 7.5
2.9 19.7
30.4 2.0.. 29.1
28.0 32.79.4 65.8
19.6 33.1
.. .. ..
3.6 –0.9 2.018.6 18.8 20.3
.. .. ..
41.3 .. 65.9
37.2 51.6 90.37.8 9.0 8.2
11.0 5.0 3.228.9 53.9 150.9
4.1 ..4.0 .. ..
79 76 20,868
428 1,806 321,6023,437 3,832 8,906
.. 0.276.3 149.1 121.038.8 62.8 78.2
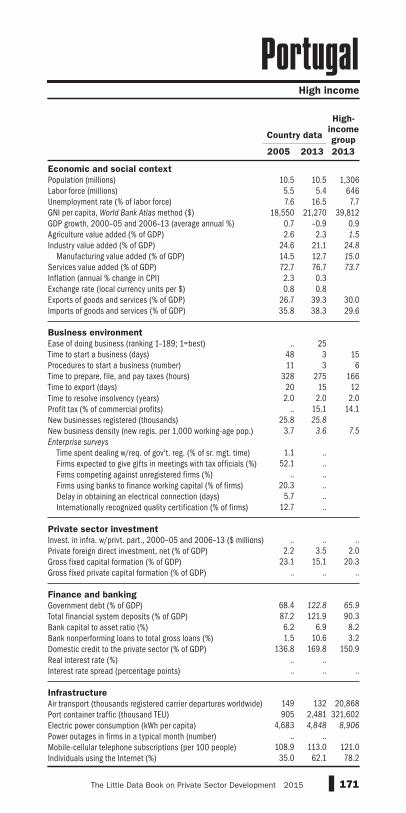
171The Little Data Book on Private Sector Development 2015
Economic and social context
Population (millions)Labor force (millions)Unemployment rate (% of labor force)GNI per capita, World Bank Atlas method ($)GDP growth, 2000–05 and 2006–13 (average annual %)Agriculture value added (% of GDP)Industry value added (% of GDP) Manufacturing value added (% of GDP)Services value added (% of GDP)Inflation (annual % change in CPI)Exchange rate (local currency units per $)Exports of goods and services (% of GDP)Imports of goods and services (% of GDP)
Business environment
Ease of doing business (ranking 1–189; 1=best)Time to start a business (days)Procedures to start a business (number)Time to prepare, file, and pay taxes (hours)Time to export (days)Time to resolve insolvency (years)Profit tax (% of commercial profits)New businesses registered (thousands)New business density (new regis. per 1,000 working-age pop.)Enterprise surveys
Time spent dealing w/req. of gov't. reg. (% of sr. mgt. time) Firms expected to give gifts in meetings with tax officials (%) Firms competing against unregistered firms (%) Firms using banks to finance working capital (% of firms) Delay in obtaining an electrical connection (days) Internationally recognized quality certification (% of firms)
Private sector investment
Invest. in infra. w/privt. part., 2000–05 and 2006–13 ($ millions)Private foreign direct investment, net (% of GDP)Gross fixed capital formation (% of GDP)Gross fixed private capital formation (% of GDP)
Finance and banking
Government debt (% of GDP)Total financial system deposits (% of GDP)Bank capital to asset ratio (%)Bank nonperforming loans to total gross loans (%)Domestic credit to the private sector (% of GDP)Real interest rate (%)Interest rate spread (percentage points)
Infrastructure
Air transport (thousands registered carrier departures worldwide)Port container traffic (thousand TEU)Electric power consumption (kWh per capita)Power outages in firms in a typical month (number)Mobile-cellular telephone subscriptions (per 100 people)Individuals using the Internet (%)
High income
Portugal
2005 2013 2013
High-
income
groupCountry data
10.5 10.5 1,3065.5 5.4 6467.6 16.5 7.7
18,550 21,270 39,8120.7 –0.9 0.92.6 2.3 1.5
24.6 21.1 24.8
14.5 12.7 15.0
72.7 76.7 73.7
2.3 0.30.8 0.8
26.7 39.3 30.035.8 38.3 29.6
.. 25
48 3 1511 3 6
328 275 16620 15 122.0 2.0 2.0
.. 15.1 14.125.8 25.8
3.7 3.6 7.5
1.1 ..
52.1 .... ..
20.3 ..5.7 ..
12.7 ..
.. .. ..
2.2 3.5 2.023.1 15.1 20.3
.. .. ..
68.4 122.8 65.9
87.2 121.9 90.36.2 6.9 8.21.5 10.6 3.2
136.8 169.8 150.9.. .... .. ..
149 132 20,868905 2,481 321,602
4,683 4,848 8,906
.. ..108.9 113.0 121.0
35.0 62.1 78.2
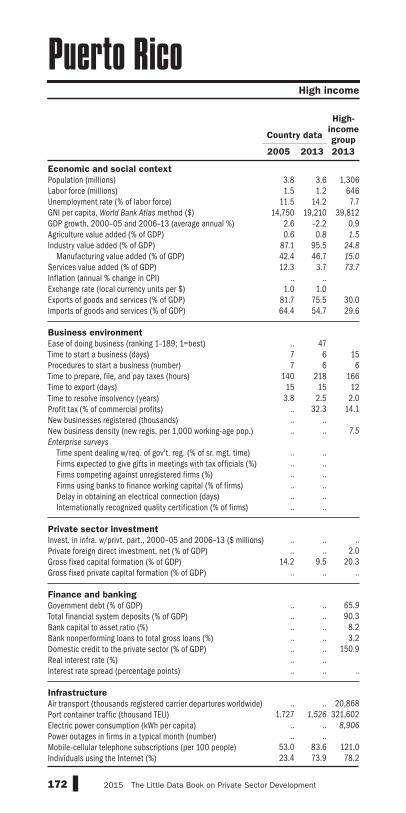
172 2015 The Little Data Book on Private Sector Development
Economic and social context
Population (millions)Labor force (millions)Unemployment rate (% of labor force)GNI per capita, World Bank Atlas method ($)GDP growth, 2000–05 and 2006–13 (average annual %)Agriculture value added (% of GDP)Industry value added (% of GDP) Manufacturing value added (% of GDP)Services value added (% of GDP)Inflation (annual % change in CPI)Exchange rate (local currency units per $)Exports of goods and services (% of GDP)Imports of goods and services (% of GDP)
Business environment
Ease of doing business (ranking 1–189; 1=best)Time to start a business (days)Procedures to start a business (number)Time to prepare, file, and pay taxes (hours)Time to export (days)Time to resolve insolvency (years)Profit tax (% of commercial profits)New businesses registered (thousands)New business density (new regis. per 1,000 working-age pop.)Enterprise surveys
Time spent dealing w/req. of gov't. reg. (% of sr. mgt. time) Firms expected to give gifts in meetings with tax officials (%) Firms competing against unregistered firms (%) Firms using banks to finance working capital (% of firms) Delay in obtaining an electrical connection (days) Internationally recognized quality certification (% of firms)
Private sector investment
Invest. in infra. w/privt. part., 2000–05 and 2006–13 ($ millions)Private foreign direct investment, net (% of GDP)Gross fixed capital formation (% of GDP)Gross fixed private capital formation (% of GDP)
Finance and banking
Government debt (% of GDP)Total financial system deposits (% of GDP)Bank capital to asset ratio (%)Bank nonperforming loans to total gross loans (%)Domestic credit to the private sector (% of GDP)Real interest rate (%)Interest rate spread (percentage points)
Infrastructure
Air transport (thousands registered carrier departures worldwide)Port container traffic (thousand TEU)Electric power consumption (kWh per capita)Power outages in firms in a typical month (number)Mobile-cellular telephone subscriptions (per 100 people)Individuals using the Internet (%)
High income
Puerto Rico
2005 2013 2013
High-
income
groupCountry data
3.8 3.6 1,3061.5 1.2 646
11.5 14.2 7.714,750 19,210 39,812
2.6 –2.2 0.90.6 0.8 1.5
87.1 95.5 24.8
42.4 46.7 15.0
12.3 3.7 73.7
.. ..1.0 1.0
81.7 75.5 30.064.4 54.7 29.6
.. 477 6 157 6 6
140 218 16615 15 12
3.8 2.5 2.0.. 32.3 14.1.. .... .. 7.5
.. .... .... .... .... .... ..
.. .. .... .. 2.0
14.2 9.5 20.3.. .. .. .. .. 65.9
.. .. 90.3
.. .. 8.2
.. .. 3.2
.. .. 150.9
.. ..
.. .. ..
.. .. 20,868
1,727 1,526 321,602.. .. 8,906
.. ..53.0 83.6 121.023.4 73.9 78.2
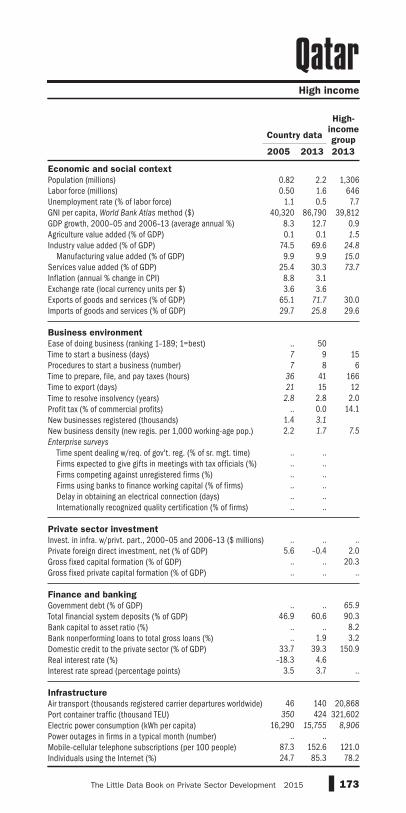
173The Little Data Book on Private Sector Development 2015
Economic and social context
Population (millions)Labor force (millions)Unemployment rate (% of labor force)GNI per capita, World Bank Atlas method ($)GDP growth, 2000–05 and 2006–13 (average annual %)Agriculture value added (% of GDP)Industry value added (% of GDP) Manufacturing value added (% of GDP)Services value added (% of GDP)Inflation (annual % change in CPI)Exchange rate (local currency units per $)Exports of goods and services (% of GDP)Imports of goods and services (% of GDP)
Business environment
Ease of doing business (ranking 1–189; 1=best)Time to start a business (days)Procedures to start a business (number)Time to prepare, file, and pay taxes (hours)Time to export (days)Time to resolve insolvency (years)Profit tax (% of commercial profits)New businesses registered (thousands)New business density (new regis. per 1,000 working-age pop.)Enterprise surveys
Time spent dealing w/req. of gov't. reg. (% of sr. mgt. time) Firms expected to give gifts in meetings with tax officials (%) Firms competing against unregistered firms (%) Firms using banks to finance working capital (% of firms) Delay in obtaining an electrical connection (days) Internationally recognized quality certification (% of firms)
Private sector investment
Invest. in infra. w/privt. part., 2000–05 and 2006–13 ($ millions)Private foreign direct investment, net (% of GDP)Gross fixed capital formation (% of GDP)Gross fixed private capital formation (% of GDP)
Finance and banking
Government debt (% of GDP)Total financial system deposits (% of GDP)Bank capital to asset ratio (%)Bank nonperforming loans to total gross loans (%)Domestic credit to the private sector (% of GDP)Real interest rate (%)Interest rate spread (percentage points)
Infrastructure
Air transport (thousands registered carrier departures worldwide)Port container traffic (thousand TEU)Electric power consumption (kWh per capita)Power outages in firms in a typical month (number)Mobile-cellular telephone subscriptions (per 100 people)Individuals using the Internet (%)
High income
Qatar
2005 2013 2013
High-
income
groupCountry data
0.82 2.2 1,3060.50 1.6 646
1.1 0.5 7.740,320 86,790 39,812
8.3 12.7 0.90.1 0.1 1.5
74.5 69.6 24.8
9.9 9.9 15.0
25.4 30.3 73.7
8.8 3.13.6 3.6
65.1 71.7 30.029.7 25.8 29.6
.. 507 9 157 8 6
36 41 16621 15 12
2.8 2.8 2.0.. 0.0 14.1
1.4 3.1
2.2 1.7 7.5
.. .... .... .... .... .... ..
.. .. ..
5.6 –0.4 2.0.. .. 20.3.. .. .. .. .. 65.9
46.9 60.6 90.3.. .. 8.2.. 1.9 3.2
33.7 39.3 150.9–18.3 4.6
3.5 3.7 ..
46 140 20,868
350 424 321,60216,290 15,755 8,906
.. ..87.3 152.6 121.024.7 85.3 78.2

174 2015 The Little Data Book on Private Sector Development
Economic and social context
Population (millions)Labor force (millions)Unemployment rate (% of labor force)GNI per capita, World Bank Atlas method ($)GDP growth, 2000–05 and 2006–13 (average annual %)Agriculture value added (% of GDP)Industry value added (% of GDP) Manufacturing value added (% of GDP)Services value added (% of GDP)Inflation (annual % change in CPI)Exchange rate (local currency units per $)Exports of goods and services (% of GDP)Imports of goods and services (% of GDP)
Business environment
Ease of doing business (ranking 1–189; 1=best)Time to start a business (days)Procedures to start a business (number)Time to prepare, file, and pay taxes (hours)Time to export (days)Time to resolve insolvency (years)Profit tax (% of commercial profits)New businesses registered (thousands)New business density (new regis. per 1,000 working-age pop.)Enterprise surveys
Time spent dealing w/req. of gov't. reg. (% of sr. mgt. time) Firms expected to give gifts in meetings with tax officials (%) Firms competing against unregistered firms (%) Firms using banks to finance working capital (% of firms) Delay in obtaining an electrical connection (days) Internationally recognized quality certification (% of firms)
Private sector investment
Invest. in infra. w/privt. part., 2000–05 and 2006–13 ($ millions)Private foreign direct investment, net (% of GDP)Gross fixed capital formation (% of GDP)Gross fixed private capital formation (% of GDP)
Finance and banking
Government debt (% of GDP)Total financial system deposits (% of GDP)Bank capital to asset ratio (%)Bank nonperforming loans to total gross loans (%)Domestic credit to the private sector (% of GDP)Real interest rate (%)Interest rate spread (percentage points)
Infrastructure
Air transport (thousands registered carrier departures worldwide)Port container traffic (thousand TEU)Electric power consumption (kWh per capita)Power outages in firms in a typical month (number)Mobile-cellular telephone subscriptions (per 100 people)Individuals using the Internet (%)
Europe & Central Asia Upper middle income
Romania
2005 2013 2013
Upper
middle-
income
groupCountry data
21.3 20.0 2,4099.9 9.6 1,2647.2 7.3 5.9
3,920 9,050 7,6046.0 0.9 5.79.5 6.4 7.6
35.9 43.2 36.7.. .. 23.0
54.6 50.4 55.69.0 4.02.9 3.3
33.1 42.0 30.343.2 42.5 30.1
.. 48
11 8 265 5 7
190 159 32328 13 204.6 3.3 2.6
.. 10.7 17.592.3 61.5
6.1 4.1 3.0
1.1 15.8
27.4 6.8.. 34.6
36.0 41.323.6 51.818.2 34.4
5,264 16,968 426,038
6.9 2.2 3.323.7 23.5 31.6
.. .. ..
.. .. ..
24.8 32.7 48.010.7 7.5 10.71.4 21.9 3.6
19.9 41.4 98.06.8 6.5
13.2 6.0 6.0
39 45 7,427
771 738 262,8962,365 2,639 2,932
.. 1.460.4 105.6 99.821.5 49.8 44.8
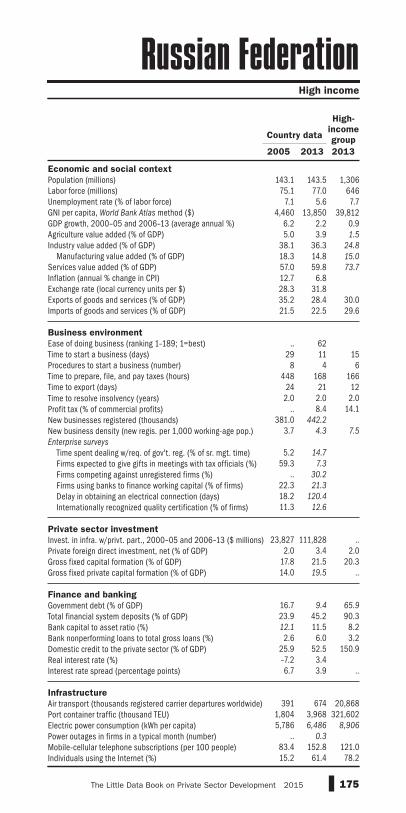
175The Little Data Book on Private Sector Development 2015
Economic and social context
Population (millions)Labor force (millions)Unemployment rate (% of labor force)GNI per capita, World Bank Atlas method ($)GDP growth, 2000–05 and 2006–13 (average annual %)Agriculture value added (% of GDP)Industry value added (% of GDP) Manufacturing value added (% of GDP)Services value added (% of GDP)Inflation (annual % change in CPI)Exchange rate (local currency units per $)Exports of goods and services (% of GDP)Imports of goods and services (% of GDP)
Business environment
Ease of doing business (ranking 1–189; 1=best)Time to start a business (days)Procedures to start a business (number)Time to prepare, file, and pay taxes (hours)Time to export (days)Time to resolve insolvency (years)Profit tax (% of commercial profits)New businesses registered (thousands)New business density (new regis. per 1,000 working-age pop.)Enterprise surveys
Time spent dealing w/req. of gov't. reg. (% of sr. mgt. time) Firms expected to give gifts in meetings with tax officials (%) Firms competing against unregistered firms (%) Firms using banks to finance working capital (% of firms) Delay in obtaining an electrical connection (days) Internationally recognized quality certification (% of firms)
Private sector investment
Invest. in infra. w/privt. part., 2000–05 and 2006–13 ($ millions)Private foreign direct investment, net (% of GDP)Gross fixed capital formation (% of GDP)Gross fixed private capital formation (% of GDP)
Finance and banking
Government debt (% of GDP)Total financial system deposits (% of GDP)Bank capital to asset ratio (%)Bank nonperforming loans to total gross loans (%)Domestic credit to the private sector (% of GDP)Real interest rate (%)Interest rate spread (percentage points)
Infrastructure
Air transport (thousands registered carrier departures worldwide)Port container traffic (thousand TEU)Electric power consumption (kWh per capita)Power outages in firms in a typical month (number)Mobile-cellular telephone subscriptions (per 100 people)Individuals using the Internet (%)
High income
Russian Federation
2005 2013 2013
High-
income
groupCountry data
143.1 143.5 1,30675.1 77.0 646
7.1 5.6 7.74,460 13,850 39,812
6.2 2.2 0.95.0 3.9 1.5
38.1 36.3 24.8
18.3 14.8 15.0
57.0 59.8 73.7
12.7 6.828.3 31.835.2 28.4 30.021.5 22.5 29.6
.. 62
29 11 158 4 6
448 168 16624 21 12
2.0 2.0 2.0.. 8.4 14.1
381.0 442.2
3.7 4.3 7.5
5.2 14.7
59.3 7.3
.. 30.2
22.3 21.3
18.2 120.4
11.3 12.6
23,827 111,828 ..
2.0 3.4 2.017.8 21.5 20.314.0 19.5 ..
16.7 9.4 65.9
23.9 45.2 90.312.1 11.5 8.22.6 6.0 3.2
25.9 52.5 150.9–7.2 3.46.7 3.9 ..
391 674 20,868
1,804 3,968 321,6025,786 6,486 8,906
.. 0.3
83.4 152.8 121.015.2 61.4 78.2
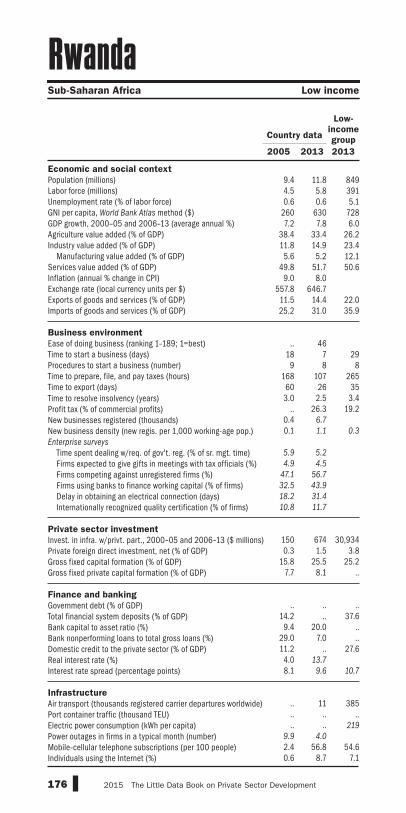
176 2015 The Little Data Book on Private Sector Development
Economic and social context
Population (millions)Labor force (millions)Unemployment rate (% of labor force)GNI per capita, World Bank Atlas method ($)GDP growth, 2000–05 and 2006–13 (average annual %)Agriculture value added (% of GDP)Industry value added (% of GDP) Manufacturing value added (% of GDP)Services value added (% of GDP)Inflation (annual % change in CPI)Exchange rate (local currency units per $)Exports of goods and services (% of GDP)Imports of goods and services (% of GDP)
Business environment
Ease of doing business (ranking 1–189; 1=best)Time to start a business (days)Procedures to start a business (number)Time to prepare, file, and pay taxes (hours)Time to export (days)Time to resolve insolvency (years)Profit tax (% of commercial profits)New businesses registered (thousands)New business density (new regis. per 1,000 working-age pop.)Enterprise surveys
Time spent dealing w/req. of gov't. reg. (% of sr. mgt. time) Firms expected to give gifts in meetings with tax officials (%) Firms competing against unregistered firms (%) Firms using banks to finance working capital (% of firms) Delay in obtaining an electrical connection (days) Internationally recognized quality certification (% of firms)
Private sector investment
Invest. in infra. w/privt. part., 2000–05 and 2006–13 ($ millions)Private foreign direct investment, net (% of GDP)Gross fixed capital formation (% of GDP)Gross fixed private capital formation (% of GDP)
Finance and banking
Government debt (% of GDP)Total financial system deposits (% of GDP)Bank capital to asset ratio (%)Bank nonperforming loans to total gross loans (%)Domestic credit to the private sector (% of GDP)Real interest rate (%)Interest rate spread (percentage points)
Infrastructure
Air transport (thousands registered carrier departures worldwide)Port container traffic (thousand TEU)Electric power consumption (kWh per capita)Power outages in firms in a typical month (number)Mobile-cellular telephone subscriptions (per 100 people)Individuals using the Internet (%)
Sub-Saharan Africa Low income
Rwanda
2005 2013 2013
Low-
income
groupCountry data
9.4 11.8 8494.5 5.8 3910.6 0.6 5.1
260 630 7287.2 7.8 6.0
38.4 33.4 26.211.8 14.9 23.45.6 5.2 12.1
49.8 51.7 50.69.0 8.0
557.8 646.711.5 14.4 22.025.2 31.0 35.9
.. 46
18 7 299 8 8
168 107 26560 26 353.0 2.5 3.4
.. 26.3 19.20.4 6.7
0.1 1.1 0.3
5.9 5.2
4.9 4.5
47.1 56.7
32.5 43.9
18.2 31.4
10.8 11.7
150 674 30,9340.3 1.5 3.8
15.8 25.5 25.27.7 8.1 ..
.. .. ..
14.2 .. 37.69.4 20.0 ..
29.0 7.0 ..11.2 .. 27.64.0 13.7
8.1 9.6 10.7
.. 11 385.. .. .... .. 219
9.9 4.0
2.4 56.8 54.60.6 8.7 7.1
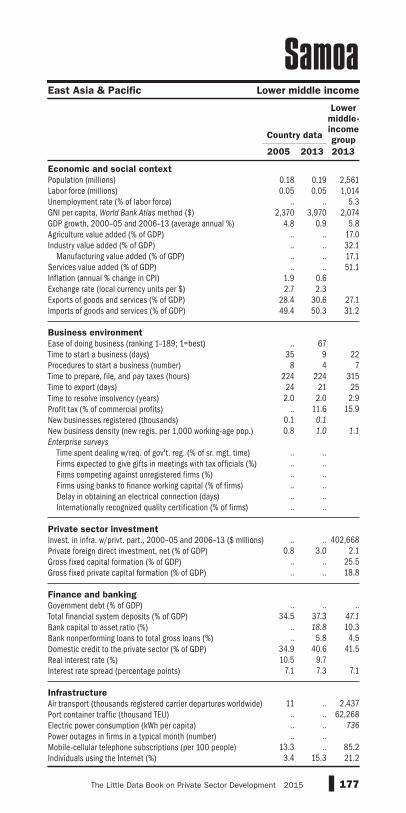
177The Little Data Book on Private Sector Development 2015
Economic and social context
Population (millions)Labor force (millions)Unemployment rate (% of labor force)GNI per capita, World Bank Atlas method ($)GDP growth, 2000–05 and 2006–13 (average annual %)Agriculture value added (% of GDP)Industry value added (% of GDP) Manufacturing value added (% of GDP)Services value added (% of GDP)Inflation (annual % change in CPI)Exchange rate (local currency units per $)Exports of goods and services (% of GDP)Imports of goods and services (% of GDP)
Business environment
Ease of doing business (ranking 1–189; 1=best)Time to start a business (days)Procedures to start a business (number)Time to prepare, file, and pay taxes (hours)Time to export (days)Time to resolve insolvency (years)Profit tax (% of commercial profits)New businesses registered (thousands)New business density (new regis. per 1,000 working-age pop.)Enterprise surveys
Time spent dealing w/req. of gov't. reg. (% of sr. mgt. time) Firms expected to give gifts in meetings with tax officials (%) Firms competing against unregistered firms (%) Firms using banks to finance working capital (% of firms) Delay in obtaining an electrical connection (days) Internationally recognized quality certification (% of firms)
Private sector investment
Invest. in infra. w/privt. part., 2000–05 and 2006–13 ($ millions)Private foreign direct investment, net (% of GDP)Gross fixed capital formation (% of GDP)Gross fixed private capital formation (% of GDP)
Finance and banking
Government debt (% of GDP)Total financial system deposits (% of GDP)Bank capital to asset ratio (%)Bank nonperforming loans to total gross loans (%)Domestic credit to the private sector (% of GDP)Real interest rate (%)Interest rate spread (percentage points)
Infrastructure
Air transport (thousands registered carrier departures worldwide)Port container traffic (thousand TEU)Electric power consumption (kWh per capita)Power outages in firms in a typical month (number)Mobile-cellular telephone subscriptions (per 100 people)Individuals using the Internet (%)
East Asia & Pacific Lower middle income
Samoa
2005 2013 2013
Lower
middle-
income
groupCountry data
0.18 0.19 2,5610.05 0.05 1,014
.. .. 5.32,370 3,970 2,074
4.8 0.9 5.8.. .. 17.0.. .. 32.1.. .. 17.1.. .. 51.1
1.9 0.62.7 2.3
28.4 30.6 27.149.4 50.3 31.2
.. 67
35 9 228 4 7
224 224 31524 21 25
2.0 2.0 2.9.. 11.6 15.9
0.1 0.1
0.8 1.0 1.1
.. .... .... .... .... .... ..
.. .. 402,668
0.8 3.0 2.1.. .. 25.5.. .. 18.8
.. .. ..
34.5 37.3 47.1
.. 18.8 10.3
.. 5.8 4.534.9 40.6 41.510.5 9.7
7.1 7.3 7.1
11 .. 2,437
.. .. 62,268
.. .. 736
.. ..13.3 .. 85.2
3.4 15.3 21.2

178 2015 The Little Data Book on Private Sector Development
Economic and social context
Population (millions)Labor force (millions)Unemployment rate (% of labor force)GNI per capita, World Bank Atlas method ($)GDP growth, 2000–05 and 2006–13 (average annual %)Agriculture value added (% of GDP)Industry value added (% of GDP) Manufacturing value added (% of GDP)Services value added (% of GDP)Inflation (annual % change in CPI)Exchange rate (local currency units per $)Exports of goods and services (% of GDP)Imports of goods and services (% of GDP)
Business environment
Ease of doing business (ranking 1–189; 1=best)Time to start a business (days)Procedures to start a business (number)Time to prepare, file, and pay taxes (hours)Time to export (days)Time to resolve insolvency (years)Profit tax (% of commercial profits)New businesses registered (thousands)New business density (new regis. per 1,000 working-age pop.)Enterprise surveys
Time spent dealing w/req. of gov't. reg. (% of sr. mgt. time) Firms expected to give gifts in meetings with tax officials (%) Firms competing against unregistered firms (%) Firms using banks to finance working capital (% of firms) Delay in obtaining an electrical connection (days) Internationally recognized quality certification (% of firms)
Private sector investment
Invest. in infra. w/privt. part., 2000–05 and 2006–13 ($ millions)Private foreign direct investment, net (% of GDP)Gross fixed capital formation (% of GDP)Gross fixed private capital formation (% of GDP)
Finance and banking
Government debt (% of GDP)Total financial system deposits (% of GDP)Bank capital to asset ratio (%)Bank nonperforming loans to total gross loans (%)Domestic credit to the private sector (% of GDP)Real interest rate (%)Interest rate spread (percentage points)
Infrastructure
Air transport (thousands registered carrier departures worldwide)Port container traffic (thousand TEU)Electric power consumption (kWh per capita)Power outages in firms in a typical month (number)Mobile-cellular telephone subscriptions (per 100 people)Individuals using the Internet (%)
High income
San Marino
2005 2013 2013
High-
income
groupCountry data
0.03 0.03 1,306.. .. 646.. .. 7.7
41,080 .. 39,8123.2 .. 0.9
.. .. 1.5
.. .. 24.8
.. .. 15.0
.. .. 73.7
1.7 1.60.8 ..
.. .. 30.0
.. .. 29.6
.. 93.. 40 15.. 8 6.. 52 166.. 15 12.. 2.3 2.0.. 12.4 14.1.. .... .. 7.5
.. .... .... .... .... .... ..
.. .. .... .. 2.0.. .. 20.3.. .. ..
51.1 .. 65.9
.. .. 90.3
.. .. 8.2
.. 42.4 3.2
.. .. 150.95.2 ..5.8 4.8 ..
.. .. 20,868.. .. 321,602.. .. 8,906
.. ..57.6 117.0 121.050.3 50.8 78.2
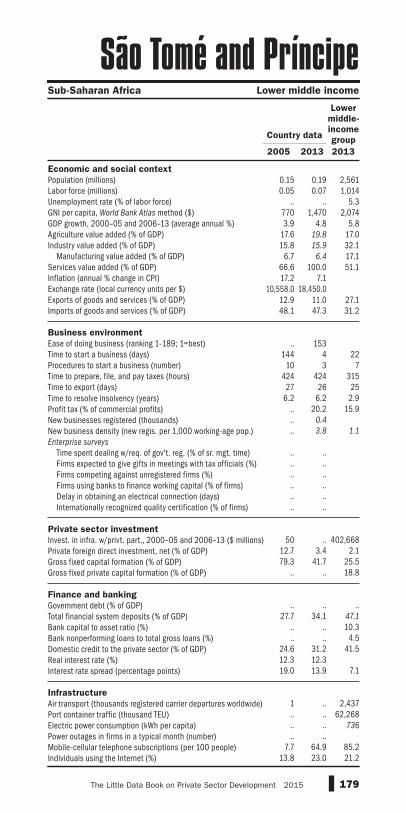
179The Little Data Book on Private Sector Development 2015
Economic and social context
Population (millions)Labor force (millions)Unemployment rate (% of labor force)GNI per capita, World Bank Atlas method ($)GDP growth, 2000–05 and 2006–13 (average annual %)Agriculture value added (% of GDP)Industry value added (% of GDP) Manufacturing value added (% of GDP)Services value added (% of GDP)Inflation (annual % change in CPI)Exchange rate (local currency units per $)Exports of goods and services (% of GDP)Imports of goods and services (% of GDP)
Business environment
Ease of doing business (ranking 1–189; 1=best)Time to start a business (days)Procedures to start a business (number)Time to prepare, file, and pay taxes (hours)Time to export (days)Time to resolve insolvency (years)Profit tax (% of commercial profits)New businesses registered (thousands)New business density (new regis. per 1,000 working-age pop.)Enterprise surveys
Time spent dealing w/req. of gov't. reg. (% of sr. mgt. time) Firms expected to give gifts in meetings with tax officials (%) Firms competing against unregistered firms (%) Firms using banks to finance working capital (% of firms) Delay in obtaining an electrical connection (days) Internationally recognized quality certification (% of firms)
Private sector investment
Invest. in infra. w/privt. part., 2000–05 and 2006–13 ($ millions)Private foreign direct investment, net (% of GDP)Gross fixed capital formation (% of GDP)Gross fixed private capital formation (% of GDP)
Finance and banking
Government debt (% of GDP)Total financial system deposits (% of GDP)Bank capital to asset ratio (%)Bank nonperforming loans to total gross loans (%)Domestic credit to the private sector (% of GDP)Real interest rate (%)Interest rate spread (percentage points)
Infrastructure
Air transport (thousands registered carrier departures worldwide)Port container traffic (thousand TEU)Electric power consumption (kWh per capita)Power outages in firms in a typical month (number)Mobile-cellular telephone subscriptions (per 100 people)Individuals using the Internet (%)
Sub-Saharan Africa Lower middle income
São Tomé and Príncipe
2005 2013 2013
Lower
middle-
income
groupCountry data
0.15 0.19 2,5610.05 0.07 1,014
.. .. 5.3770 1,470 2,0743.9 4.8 5.8
17.6 19.8 17.015.8 15.9 32.1
6.7 6.4 17.166.6 100.0 51.117.2 7.1
10,558.0 18,450.012.9 11.0 27.148.1 47.3 31.2
.. 153
144 4 2210 3 7
424 424 31527 26 25
6.2 6.2 2.9.. 20.2 15.9.. 0.4
.. 3.8 1.1
.. .... .... .... .... .... ..
50 .. 402,668
12.7 3.4 2.179.3 41.7 25.5
.. .. 18.8
.. .. ..
27.7 34.1 47.1
.. .. 10.3
.. .. 4.524.6 31.2 41.512.3 12.319.0 13.9 7.1
1 .. 2,437.. .. 62,268.. .. 736
.. ..7.7 64.9 85.2
13.8 23.0 21.2

180 2015 The Little Data Book on Private Sector Development
Economic and social context
Population (millions)Labor force (millions)Unemployment rate (% of labor force)GNI per capita, World Bank Atlas method ($)GDP growth, 2000–05 and 2006–13 (average annual %)Agriculture value added (% of GDP)Industry value added (% of GDP) Manufacturing value added (% of GDP)Services value added (% of GDP)Inflation (annual % change in CPI)Exchange rate (local currency units per $)Exports of goods and services (% of GDP)Imports of goods and services (% of GDP)
Business environment
Ease of doing business (ranking 1–189; 1=best)Time to start a business (days)Procedures to start a business (number)Time to prepare, file, and pay taxes (hours)Time to export (days)Time to resolve insolvency (years)Profit tax (% of commercial profits)New businesses registered (thousands)New business density (new regis. per 1,000 working-age pop.)Enterprise surveys
Time spent dealing w/req. of gov't. reg. (% of sr. mgt. time) Firms expected to give gifts in meetings with tax officials (%) Firms competing against unregistered firms (%) Firms using banks to finance working capital (% of firms) Delay in obtaining an electrical connection (days) Internationally recognized quality certification (% of firms)
Private sector investment
Invest. in infra. w/privt. part., 2000–05 and 2006–13 ($ millions)Private foreign direct investment, net (% of GDP)Gross fixed capital formation (% of GDP)Gross fixed private capital formation (% of GDP)
Finance and banking
Government debt (% of GDP)Total financial system deposits (% of GDP)Bank capital to asset ratio (%)Bank nonperforming loans to total gross loans (%)Domestic credit to the private sector (% of GDP)Real interest rate (%)Interest rate spread (percentage points)
Infrastructure
Air transport (thousands registered carrier departures worldwide)Port container traffic (thousand TEU)Electric power consumption (kWh per capita)Power outages in firms in a typical month (number)Mobile-cellular telephone subscriptions (per 100 people)Individuals using the Internet (%)
High income
Saudi Arabia
2005 2013 2013
High-
income
groupCountry data
24.7 28.8 1,3068.2 11.2 6465.9 5.7 7.7
12,480 26,260 39,8125.2 6.1 0.93.2 1.8 1.5
62.1 60.6 24.8
9.5 10.1 15.0
34.7 37.6 73.7
0.7 3.53.7 3.8
57.1 51.8 30.024.9 30.6 29.6
.. 49
67 21 1514 9 669 64 16617 13 12
2.8 2.8 2.0.. 2.1 14.1.. .... .. 7.5
.. .... .... .... .... .... ..
.. .. ..
3.7 1.2 2.019.3 23.2 20.3
.. .. .. .. .. 65.9
17.9 30.7 90.38.8 13.6 8.21.9 1.3 3.2
35.4 40.3 150.9.. .... .. ..
116 217 20,868
3,733 6,742 321,6026,381 8,161 8,906
.. ..57.4 184.2 121.012.7 60.5 78.2

181The Little Data Book on Private Sector Development 2015
Economic and social context
Population (millions)Labor force (millions)Unemployment rate (% of labor force)GNI per capita, World Bank Atlas method ($)GDP growth, 2000–05 and 2006–13 (average annual %)Agriculture value added (% of GDP)Industry value added (% of GDP) Manufacturing value added (% of GDP)Services value added (% of GDP)Inflation (annual % change in CPI)Exchange rate (local currency units per $)Exports of goods and services (% of GDP)Imports of goods and services (% of GDP)
Business environment
Ease of doing business (ranking 1–189; 1=best)Time to start a business (days)Procedures to start a business (number)Time to prepare, file, and pay taxes (hours)Time to export (days)Time to resolve insolvency (years)Profit tax (% of commercial profits)New businesses registered (thousands)New business density (new regis. per 1,000 working-age pop.)Enterprise surveys
Time spent dealing w/req. of gov't. reg. (% of sr. mgt. time) Firms expected to give gifts in meetings with tax officials (%) Firms competing against unregistered firms (%) Firms using banks to finance working capital (% of firms) Delay in obtaining an electrical connection (days) Internationally recognized quality certification (% of firms)
Private sector investment
Invest. in infra. w/privt. part., 2000–05 and 2006–13 ($ millions)Private foreign direct investment, net (% of GDP)Gross fixed capital formation (% of GDP)Gross fixed private capital formation (% of GDP)
Finance and banking
Government debt (% of GDP)Total financial system deposits (% of GDP)Bank capital to asset ratio (%)Bank nonperforming loans to total gross loans (%)Domestic credit to the private sector (% of GDP)Real interest rate (%)Interest rate spread (percentage points)
Infrastructure
Air transport (thousands registered carrier departures worldwide)Port container traffic (thousand TEU)Electric power consumption (kWh per capita)Power outages in firms in a typical month (number)Mobile-cellular telephone subscriptions (per 100 people)Individuals using the Internet (%)
Sub-Saharan Africa Lower middle income
Senegal
2005 2013 2013
Lower
middle-
income
groupCountry data
11.3 14.1 2,5614.8 6.1 1,014
10.1 10.3 5.3770 1,050 2,0744.6 3.3 5.8
16.8 17.5 17.023.6 24.0 32.115.0 13.6 17.159.6 58.4 51.1
1.7 0.7527.5 494.0
27.0 26.2 27.142.4 47.4 31.2
.. 161
57 6 2211 4 7
696 620 31521 12 25
3.0 3.0 2.9.. 16.2 15.9
1.0 2.0
0.2 0.3 1.1
2.9 3.0
18.7 7.374.1 76.49.6 19.69.4 24.86.1 9.3
701 2,666 402,6681.9 2.0 2.1
23.3 25.1 25.517.4 18.6 18.8
.. .. ..
25.4 34.2 47.1
7.6 10.2 10.311.9 20.6 4.523.2 33.0 41.5
.. ..
.. .. 7.1
6 7 2,437
424 428 62,268158 187 736
11.5 6.015.4 92.9 85.24.8 20.9 21.2
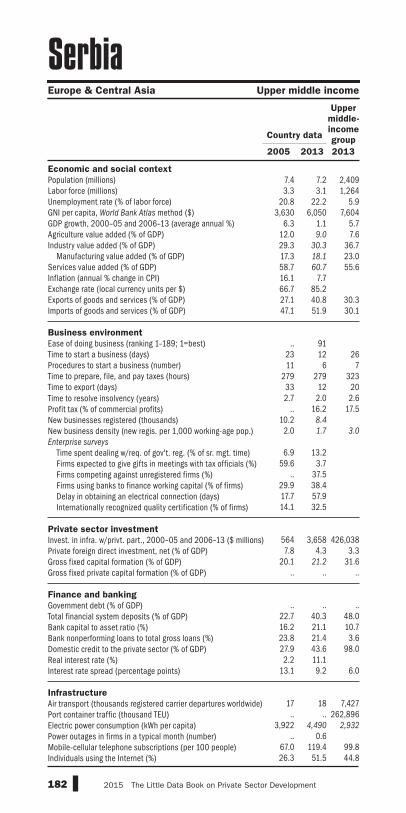
182 2015 The Little Data Book on Private Sector Development
Economic and social context
Population (millions)Labor force (millions)Unemployment rate (% of labor force)GNI per capita, World Bank Atlas method ($)GDP growth, 2000–05 and 2006–13 (average annual %)Agriculture value added (% of GDP)Industry value added (% of GDP) Manufacturing value added (% of GDP)Services value added (% of GDP)Inflation (annual % change in CPI)Exchange rate (local currency units per $)Exports of goods and services (% of GDP)Imports of goods and services (% of GDP)
Business environment
Ease of doing business (ranking 1–189; 1=best)Time to start a business (days)Procedures to start a business (number)Time to prepare, file, and pay taxes (hours)Time to export (days)Time to resolve insolvency (years)Profit tax (% of commercial profits)New businesses registered (thousands)New business density (new regis. per 1,000 working-age pop.)Enterprise surveys
Time spent dealing w/req. of gov't. reg. (% of sr. mgt. time) Firms expected to give gifts in meetings with tax officials (%) Firms competing against unregistered firms (%) Firms using banks to finance working capital (% of firms) Delay in obtaining an electrical connection (days) Internationally recognized quality certification (% of firms)
Private sector investment
Invest. in infra. w/privt. part., 2000–05 and 2006–13 ($ millions)Private foreign direct investment, net (% of GDP)Gross fixed capital formation (% of GDP)Gross fixed private capital formation (% of GDP)
Finance and banking
Government debt (% of GDP)Total financial system deposits (% of GDP)Bank capital to asset ratio (%)Bank nonperforming loans to total gross loans (%)Domestic credit to the private sector (% of GDP)Real interest rate (%)Interest rate spread (percentage points)
Infrastructure
Air transport (thousands registered carrier departures worldwide)Port container traffic (thousand TEU)Electric power consumption (kWh per capita)Power outages in firms in a typical month (number)Mobile-cellular telephone subscriptions (per 100 people)Individuals using the Internet (%)
Europe & Central Asia Upper middle income
Serbia
2005 2013 2013
Upper
middle-
income
groupCountry data
7.4 7.2 2,4093.3 3.1 1,264
20.8 22.2 5.93,630 6,050 7,604
6.3 1.1 5.712.0 9.0 7.629.3 30.3 36.717.3 18.1 23.058.7 60.7 55.616.1 7.766.7 85.227.1 40.8 30.347.1 51.9 30.1
.. 91
23 12 2611 6 7
279 279 32333 12 202.7 2.0 2.6
.. 16.2 17.510.2 8.4
2.0 1.7 3.0
6.9 13.2
59.6 3.7.. 37.5
29.9 38.417.7 57.914.1 32.5
564 3,658 426,0387.8 4.3 3.3
20.1 21.2 31.6.. .. ..
.. .. ..
22.7 40.3 48.016.2 21.1 10.723.8 21.4 3.627.9 43.6 98.02.2 11.1
13.1 9.2 6.0
17 18 7,427.. .. 262,896
3,922 4,490 2,932
.. 0.667.0 119.4 99.826.3 51.5 44.8
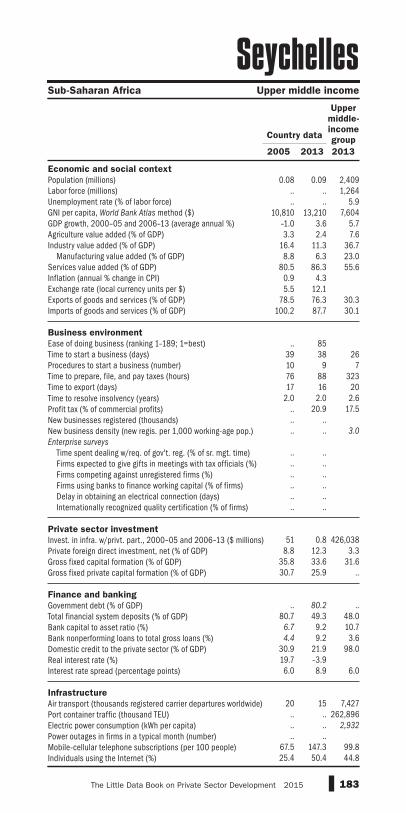
183The Little Data Book on Private Sector Development 2015
Economic and social context
Population (millions)Labor force (millions)Unemployment rate (% of labor force)GNI per capita, World Bank Atlas method ($)GDP growth, 2000–05 and 2006–13 (average annual %)Agriculture value added (% of GDP)Industry value added (% of GDP) Manufacturing value added (% of GDP)Services value added (% of GDP)Inflation (annual % change in CPI)Exchange rate (local currency units per $)Exports of goods and services (% of GDP)Imports of goods and services (% of GDP)
Business environment
Ease of doing business (ranking 1–189; 1=best)Time to start a business (days)Procedures to start a business (number)Time to prepare, file, and pay taxes (hours)Time to export (days)Time to resolve insolvency (years)Profit tax (% of commercial profits)New businesses registered (thousands)New business density (new regis. per 1,000 working-age pop.)Enterprise surveys
Time spent dealing w/req. of gov't. reg. (% of sr. mgt. time) Firms expected to give gifts in meetings with tax officials (%) Firms competing against unregistered firms (%) Firms using banks to finance working capital (% of firms) Delay in obtaining an electrical connection (days) Internationally recognized quality certification (% of firms)
Private sector investment
Invest. in infra. w/privt. part., 2000–05 and 2006–13 ($ millions)Private foreign direct investment, net (% of GDP)Gross fixed capital formation (% of GDP)Gross fixed private capital formation (% of GDP)
Finance and banking
Government debt (% of GDP)Total financial system deposits (% of GDP)Bank capital to asset ratio (%)Bank nonperforming loans to total gross loans (%)Domestic credit to the private sector (% of GDP)Real interest rate (%)Interest rate spread (percentage points)
Infrastructure
Air transport (thousands registered carrier departures worldwide)Port container traffic (thousand TEU)Electric power consumption (kWh per capita)Power outages in firms in a typical month (number)Mobile-cellular telephone subscriptions (per 100 people)Individuals using the Internet (%)
Sub-Saharan Africa Upper middle income
Seychelles
2005 2013 2013
Upper
middle-
income
groupCountry data
0.08 0.09 2,409.. .. 1,264.. .. 5.9
10,810 13,210 7,604–1.0 3.6 5.73.3 2.4 7.6
16.4 11.3 36.78.8 6.3 23.0
80.5 86.3 55.60.9 4.35.5 12.1
78.5 76.3 30.3100.2 87.7 30.1
.. 85
39 38 2610 9 776 88 32317 16 20
2.0 2.0 2.6.. 20.9 17.5.. .... .. 3.0
.. .... .... .... .... .... ..
51 0.8 426,038
8.8 12.3 3.335.8 33.6 31.630.7 25.9 ..
.. 80.2 ..
80.7 49.3 48.06.7 9.2 10.74.4 9.2 3.6
30.9 21.9 98.019.7 –3.96.0 8.9 6.0
20 15 7,427
.. .. 262,896
.. .. 2,932
.. ..67.5 147.3 99.825.4 50.4 44.8
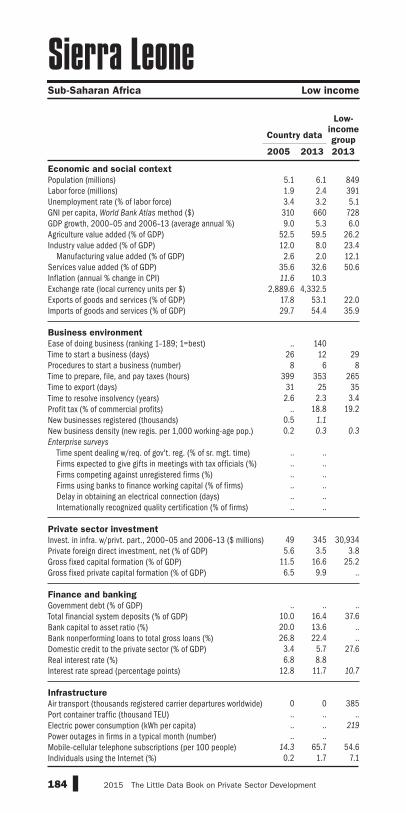
184 2015 The Little Data Book on Private Sector Development
Economic and social context
Population (millions)Labor force (millions)Unemployment rate (% of labor force)GNI per capita, World Bank Atlas method ($)GDP growth, 2000–05 and 2006–13 (average annual %)Agriculture value added (% of GDP)Industry value added (% of GDP) Manufacturing value added (% of GDP)Services value added (% of GDP)Inflation (annual % change in CPI)Exchange rate (local currency units per $)Exports of goods and services (% of GDP)Imports of goods and services (% of GDP)
Business environment
Ease of doing business (ranking 1–189; 1=best)Time to start a business (days)Procedures to start a business (number)Time to prepare, file, and pay taxes (hours)Time to export (days)Time to resolve insolvency (years)Profit tax (% of commercial profits)New businesses registered (thousands)New business density (new regis. per 1,000 working-age pop.)Enterprise surveys
Time spent dealing w/req. of gov't. reg. (% of sr. mgt. time) Firms expected to give gifts in meetings with tax officials (%) Firms competing against unregistered firms (%) Firms using banks to finance working capital (% of firms) Delay in obtaining an electrical connection (days) Internationally recognized quality certification (% of firms)
Private sector investment
Invest. in infra. w/privt. part., 2000–05 and 2006–13 ($ millions)Private foreign direct investment, net (% of GDP)Gross fixed capital formation (% of GDP)Gross fixed private capital formation (% of GDP)
Finance and banking
Government debt (% of GDP)Total financial system deposits (% of GDP)Bank capital to asset ratio (%)Bank nonperforming loans to total gross loans (%)Domestic credit to the private sector (% of GDP)Real interest rate (%)Interest rate spread (percentage points)
Infrastructure
Air transport (thousands registered carrier departures worldwide)Port container traffic (thousand TEU)Electric power consumption (kWh per capita)Power outages in firms in a typical month (number)Mobile-cellular telephone subscriptions (per 100 people)Individuals using the Internet (%)
Sub-Saharan Africa Low income
Sierra Leone
2005 2013 2013
Low-
income
groupCountry data
5.1 6.1 8491.9 2.4 3913.4 3.2 5.1310 660 7289.0 5.3 6.0
52.5 59.5 26.212.0 8.0 23.4
2.6 2.0 12.135.6 32.6 50.611.6 10.3
2,889.6 4,332.517.8 53.1 22.029.7 54.4 35.9
.. 140
26 12 298 6 8
399 353 26531 25 35
2.6 2.3 3.4.. 18.8 19.2
0.5 1.1
0.2 0.3 0.3
.. .... .... .... .... .... ..
49 345 30,9345.6 3.5 3.8
11.5 16.6 25.26.5 9.9 ..
.. .. ..
10.0 16.4 37.620.0 13.6 ..26.8 22.4 ..
3.4 5.7 27.66.8 8.8
12.8 11.7 10.7
0 0 385.. .. .... .. 219
.. ..14.3 65.7 54.60.2 1.7 7.1

185The Little Data Book on Private Sector Development 2015
Economic and social context
Population (millions)Labor force (millions)Unemployment rate (% of labor force)GNI per capita, World Bank Atlas method ($)GDP growth, 2000–05 and 2006–13 (average annual %)Agriculture value added (% of GDP)Industry value added (% of GDP) Manufacturing value added (% of GDP)Services value added (% of GDP)Inflation (annual % change in CPI)Exchange rate (local currency units per $)Exports of goods and services (% of GDP)Imports of goods and services (% of GDP)
Business environment
Ease of doing business (ranking 1–189; 1=best)Time to start a business (days)Procedures to start a business (number)Time to prepare, file, and pay taxes (hours)Time to export (days)Time to resolve insolvency (years)Profit tax (% of commercial profits)New businesses registered (thousands)New business density (new regis. per 1,000 working-age pop.)Enterprise surveys
Time spent dealing w/req. of gov't. reg. (% of sr. mgt. time) Firms expected to give gifts in meetings with tax officials (%) Firms competing against unregistered firms (%) Firms using banks to finance working capital (% of firms) Delay in obtaining an electrical connection (days) Internationally recognized quality certification (% of firms)
Private sector investment
Invest. in infra. w/privt. part., 2000–05 and 2006–13 ($ millions)Private foreign direct investment, net (% of GDP)Gross fixed capital formation (% of GDP)Gross fixed private capital formation (% of GDP)
Finance and banking
Government debt (% of GDP)Total financial system deposits (% of GDP)Bank capital to asset ratio (%)Bank nonperforming loans to total gross loans (%)Domestic credit to the private sector (% of GDP)Real interest rate (%)Interest rate spread (percentage points)
Infrastructure
Air transport (thousands registered carrier departures worldwide)Port container traffic (thousand TEU)Electric power consumption (kWh per capita)Power outages in firms in a typical month (number)Mobile-cellular telephone subscriptions (per 100 people)Individuals using the Internet (%)
High income
Singapore
2005 2013 2013
High-
income
groupCountry data
4.3 5.4 1,3062.2 3.1 6464.1 2.8 7.7
28,370 54,040 39,8125.2 5.4 0.90.1 0.0 1.5
32.4 25.1 24.8
27.8 18.8 15.0
67.6 74.9 73.7
0.4 2.41.7 1.3
226.1 190.5 30.0196.3 167.5 29.6
.. 16 3 156 3 6
49 82 1666 6 12
0.8 0.8 2.0.. 2.2 14.1
18.7 31.5
6.0 8.0 7.5
.. .... .... .... .... .... ..
.. .. ..
14.2 21.4 2.023.1 25.9 20.3
.. .. ..
95.3 110.9 65.9
96.8 125.3 90.39.6 8.2 8.23.8 0.9 3.2
89.5 128.2 150.93.0 5.24.9 5.2 ..
77 167 20,868
23,192 33,516 321,6028,507 8,404 8,906
.. ..97.5 155.9 121.061.0 73.0 78.2

186 2015 The Little Data Book on Private Sector Development
Economic and social context
Population (millions)Labor force (millions)Unemployment rate (% of labor force)GNI per capita, World Bank Atlas method ($)GDP growth, 2000–05 and 2006–13 (average annual %)Agriculture value added (% of GDP)Industry value added (% of GDP) Manufacturing value added (% of GDP)Services value added (% of GDP)Inflation (annual % change in CPI)Exchange rate (local currency units per $)Exports of goods and services (% of GDP)Imports of goods and services (% of GDP)
Business environment
Ease of doing business (ranking 1–189; 1=best)Time to start a business (days)Procedures to start a business (number)Time to prepare, file, and pay taxes (hours)Time to export (days)Time to resolve insolvency (years)Profit tax (% of commercial profits)New businesses registered (thousands)New business density (new regis. per 1,000 working-age pop.)Enterprise surveys
Time spent dealing w/req. of gov't. reg. (% of sr. mgt. time) Firms expected to give gifts in meetings with tax officials (%) Firms competing against unregistered firms (%) Firms using banks to finance working capital (% of firms) Delay in obtaining an electrical connection (days) Internationally recognized quality certification (% of firms)
Private sector investment
Invest. in infra. w/privt. part., 2000–05 and 2006–13 ($ millions)Private foreign direct investment, net (% of GDP)Gross fixed capital formation (% of GDP)Gross fixed private capital formation (% of GDP)
Finance and banking
Government debt (% of GDP)Total financial system deposits (% of GDP)Bank capital to asset ratio (%)Bank nonperforming loans to total gross loans (%)Domestic credit to the private sector (% of GDP)Real interest rate (%)Interest rate spread (percentage points)
Infrastructure
Air transport (thousands registered carrier departures worldwide)Port container traffic (thousand TEU)Electric power consumption (kWh per capita)Power outages in firms in a typical month (number)Mobile-cellular telephone subscriptions (per 100 people)Individuals using the Internet (%)
High income
Sint Maarten (Dutch part)
2005 2013 2013
High-
income
groupCountry data
0.04 0.04 1,306.. .. 646.. .. 7.7.. .. 39,812.. .. 0.9.. .. 1.5
.. .. 24.8
.. .. 15.0
.. .. 73.7
.. ..
.. ..
.. .. 30.0
.. .. 29.6
.. .... .. 15.. .. 6.. .. 166.. .. 12.. .. 2.0.. .. 14.1.. .... .. 7.5
.. .... .... .... .... .... ..
.. .. .... .. 2.0.. .. 20.3.. .. .. .. .. 65.9
.. .. 90.3
.. .. 8.2
.. .. 3.2
.. .. 150.9
.. ..
.. .. ..
.. .. 20,868.. .. 321,602.. .. 8,906
.. ..
.. .. 121.0
.. .. 78.2
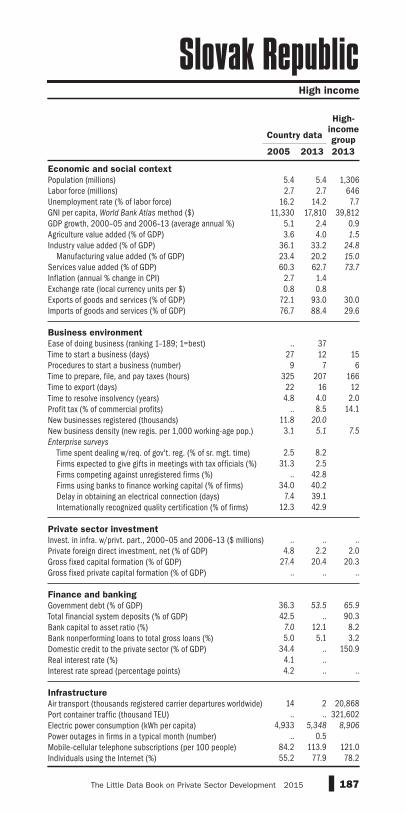
187The Little Data Book on Private Sector Development 2015
Economic and social context
Population (millions)Labor force (millions)Unemployment rate (% of labor force)GNI per capita, World Bank Atlas method ($)GDP growth, 2000–05 and 2006–13 (average annual %)Agriculture value added (% of GDP)Industry value added (% of GDP) Manufacturing value added (% of GDP)Services value added (% of GDP)Inflation (annual % change in CPI)Exchange rate (local currency units per $)Exports of goods and services (% of GDP)Imports of goods and services (% of GDP)
Business environment
Ease of doing business (ranking 1–189; 1=best)Time to start a business (days)Procedures to start a business (number)Time to prepare, file, and pay taxes (hours)Time to export (days)Time to resolve insolvency (years)Profit tax (% of commercial profits)New businesses registered (thousands)New business density (new regis. per 1,000 working-age pop.)Enterprise surveys
Time spent dealing w/req. of gov't. reg. (% of sr. mgt. time) Firms expected to give gifts in meetings with tax officials (%) Firms competing against unregistered firms (%) Firms using banks to finance working capital (% of firms) Delay in obtaining an electrical connection (days) Internationally recognized quality certification (% of firms)
Private sector investment
Invest. in infra. w/privt. part., 2000–05 and 2006–13 ($ millions)Private foreign direct investment, net (% of GDP)Gross fixed capital formation (% of GDP)Gross fixed private capital formation (% of GDP)
Finance and banking
Government debt (% of GDP)Total financial system deposits (% of GDP)Bank capital to asset ratio (%)Bank nonperforming loans to total gross loans (%)Domestic credit to the private sector (% of GDP)Real interest rate (%)Interest rate spread (percentage points)
Infrastructure
Air transport (thousands registered carrier departures worldwide)Port container traffic (thousand TEU)Electric power consumption (kWh per capita)Power outages in firms in a typical month (number)Mobile-cellular telephone subscriptions (per 100 people)Individuals using the Internet (%)
High income
Slovak Republic
2005 2013 2013
High-
income
groupCountry data
5.4 5.4 1,3062.7 2.7 646
16.2 14.2 7.711,330 17,810 39,812
5.1 2.4 0.93.6 4.0 1.5
36.1 33.2 24.8
23.4 20.2 15.0
60.3 62.7 73.7
2.7 1.40.8 0.8
72.1 93.0 30.076.7 88.4 29.6
.. 37
27 12 159 7 6
325 207 16622 16 124.8 4.0 2.0
.. 8.5 14.111.8 20.0
3.1 5.1 7.5
2.5 8.2
31.3 2.5.. 42.8
34.0 40.27.4 39.1
12.3 42.9
.. .. ..
4.8 2.2 2.027.4 20.4 20.3
.. .. ..
36.3 53.5 65.9
42.5 .. 90.37.0 12.1 8.25.0 5.1 3.2
34.4 .. 150.94.1 ..4.2 .. ..
14 2 20,868
.. .. 321,6024,933 5,348 8,906
.. 0.584.2 113.9 121.055.2 77.9 78.2

188 2015 The Little Data Book on Private Sector Development
Economic and social context
Population (millions)Labor force (millions)Unemployment rate (% of labor force)GNI per capita, World Bank Atlas method ($)GDP growth, 2000–05 and 2006–13 (average annual %)Agriculture value added (% of GDP)Industry value added (% of GDP) Manufacturing value added (% of GDP)Services value added (% of GDP)Inflation (annual % change in CPI)Exchange rate (local currency units per $)Exports of goods and services (% of GDP)Imports of goods and services (% of GDP)
Business environment
Ease of doing business (ranking 1–189; 1=best)Time to start a business (days)Procedures to start a business (number)Time to prepare, file, and pay taxes (hours)Time to export (days)Time to resolve insolvency (years)Profit tax (% of commercial profits)New businesses registered (thousands)New business density (new regis. per 1,000 working-age pop.)Enterprise surveys
Time spent dealing w/req. of gov't. reg. (% of sr. mgt. time) Firms expected to give gifts in meetings with tax officials (%) Firms competing against unregistered firms (%) Firms using banks to finance working capital (% of firms) Delay in obtaining an electrical connection (days) Internationally recognized quality certification (% of firms)
Private sector investment
Invest. in infra. w/privt. part., 2000–05 and 2006–13 ($ millions)Private foreign direct investment, net (% of GDP)Gross fixed capital formation (% of GDP)Gross fixed private capital formation (% of GDP)
Finance and banking
Government debt (% of GDP)Total financial system deposits (% of GDP)Bank capital to asset ratio (%)Bank nonperforming loans to total gross loans (%)Domestic credit to the private sector (% of GDP)Real interest rate (%)Interest rate spread (percentage points)
Infrastructure
Air transport (thousands registered carrier departures worldwide)Port container traffic (thousand TEU)Electric power consumption (kWh per capita)Power outages in firms in a typical month (number)Mobile-cellular telephone subscriptions (per 100 people)Individuals using the Internet (%)
High income
Slovenia
2005 2013 2013
High-
income
groupCountry data
2.0 2.1 1,3061.0 1.0 6466.5 10.2 7.7
18,460 23,220 39,8123.6 –0.6 0.92.6 2.1 1.5
34.1 32.0 24.8
23.6 22.3 15.0
63.3 65.8 73.7
2.5 1.80.8 0.8
59.6 74.7 30.060.2 68.7 29.6
.. 51
60 6 159 2 6
260 260 16620 16 122.0 2.0 2.0
.. 12.5 14.13.3 6.2
2.4 4.4 7.5
2.4 10.1
13.9 0.3.. 26.5
42.8 36.312.7 63.330.5 22.4
.. .. ..
2.7 –0.9 2.026.6 19.7 20.3
.. .. .. .. .. 65.9
52.7 55.7 90.38.5 8.2 8.22.5 13.3 3.2
55.4 70.8 150.96.2 ..4.6 .. ..
18 17 20,868
306 616 321,6026,918 6,806 8,906
.. 0.287.9 110.2 121.046.8 72.7 78.2
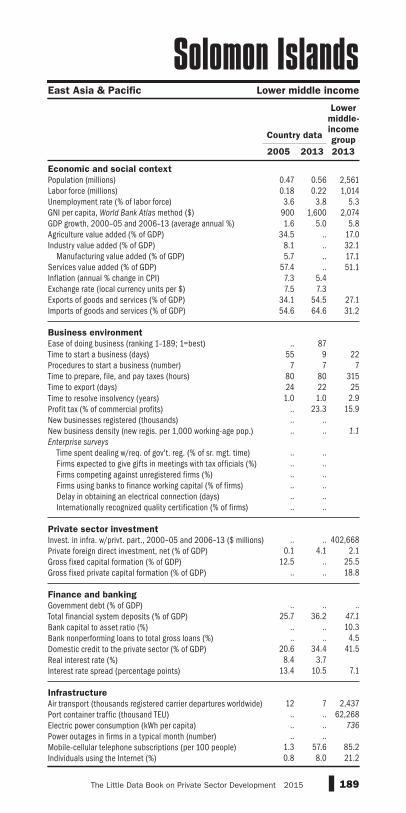
189The Little Data Book on Private Sector Development 2015
Economic and social context
Population (millions)Labor force (millions)Unemployment rate (% of labor force)GNI per capita, World Bank Atlas method ($)GDP growth, 2000–05 and 2006–13 (average annual %)Agriculture value added (% of GDP)Industry value added (% of GDP) Manufacturing value added (% of GDP)Services value added (% of GDP)Inflation (annual % change in CPI)Exchange rate (local currency units per $)Exports of goods and services (% of GDP)Imports of goods and services (% of GDP)
Business environment
Ease of doing business (ranking 1–189; 1=best)Time to start a business (days)Procedures to start a business (number)Time to prepare, file, and pay taxes (hours)Time to export (days)Time to resolve insolvency (years)Profit tax (% of commercial profits)New businesses registered (thousands)New business density (new regis. per 1,000 working-age pop.)Enterprise surveys
Time spent dealing w/req. of gov't. reg. (% of sr. mgt. time) Firms expected to give gifts in meetings with tax officials (%) Firms competing against unregistered firms (%) Firms using banks to finance working capital (% of firms) Delay in obtaining an electrical connection (days) Internationally recognized quality certification (% of firms)
Private sector investment
Invest. in infra. w/privt. part., 2000–05 and 2006–13 ($ millions)Private foreign direct investment, net (% of GDP)Gross fixed capital formation (% of GDP)Gross fixed private capital formation (% of GDP)
Finance and banking
Government debt (% of GDP)Total financial system deposits (% of GDP)Bank capital to asset ratio (%)Bank nonperforming loans to total gross loans (%)Domestic credit to the private sector (% of GDP)Real interest rate (%)Interest rate spread (percentage points)
Infrastructure
Air transport (thousands registered carrier departures worldwide)Port container traffic (thousand TEU)Electric power consumption (kWh per capita)Power outages in firms in a typical month (number)Mobile-cellular telephone subscriptions (per 100 people)Individuals using the Internet (%)
East Asia & Pacific Lower middle income
Solomon Islands
2005 2013 2013
Lower
middle-
income
groupCountry data
0.47 0.56 2,5610.18 0.22 1,0143.6 3.8 5.3
900 1,600 2,0741.6 5.0 5.8
34.5 .. 17.08.1 .. 32.15.7 .. 17.1
57.4 .. 51.17.3 5.47.5 7.3
34.1 54.5 27.154.6 64.6 31.2
.. 87
55 9 227 7 7
80 80 31524 22 25
1.0 1.0 2.9.. 23.3 15.9.. .... .. 1.1
.. .... .... .... .... .... ..
.. .. 402,668
0.1 4.1 2.112.5 .. 25.5
.. .. 18.8
.. .. ..
25.7 36.2 47.1
.. .. 10.3
.. .. 4.520.6 34.4 41.58.4 3.7
13.4 10.5 7.1
12 7 2,437
.. .. 62,268
.. .. 736
.. ..1.3 57.6 85.20.8 8.0 21.2

190 2015 The Little Data Book on Private Sector Development
Economic and social context
Population (millions)Labor force (millions)Unemployment rate (% of labor force)GNI per capita, World Bank Atlas method ($)GDP growth, 2000–05 and 2006–13 (average annual %)Agriculture value added (% of GDP)Industry value added (% of GDP) Manufacturing value added (% of GDP)Services value added (% of GDP)Inflation (annual % change in CPI)Exchange rate (local currency units per $)Exports of goods and services (% of GDP)Imports of goods and services (% of GDP)
Business environment
Ease of doing business (ranking 1–189; 1=best)Time to start a business (days)Procedures to start a business (number)Time to prepare, file, and pay taxes (hours)Time to export (days)Time to resolve insolvency (years)Profit tax (% of commercial profits)New businesses registered (thousands)New business density (new regis. per 1,000 working-age pop.)Enterprise surveys
Time spent dealing w/req. of gov't. reg. (% of sr. mgt. time) Firms expected to give gifts in meetings with tax officials (%) Firms competing against unregistered firms (%) Firms using banks to finance working capital (% of firms) Delay in obtaining an electrical connection (days) Internationally recognized quality certification (% of firms)
Private sector investment
Invest. in infra. w/privt. part., 2000–05 and 2006–13 ($ millions)Private foreign direct investment, net (% of GDP)Gross fixed capital formation (% of GDP)Gross fixed private capital formation (% of GDP)
Finance and banking
Government debt (% of GDP)Total financial system deposits (% of GDP)Bank capital to asset ratio (%)Bank nonperforming loans to total gross loans (%)Domestic credit to the private sector (% of GDP)Real interest rate (%)Interest rate spread (percentage points)
Infrastructure
Air transport (thousands registered carrier departures worldwide)Port container traffic (thousand TEU)Electric power consumption (kWh per capita)Power outages in firms in a typical month (number)Mobile-cellular telephone subscriptions (per 100 people)Individuals using the Internet (%)
Sub-Saharan Africa Low income
Somalia
2005 2013 2013
Low-
income
groupCountry data
8.5 10.5 8492.5 3.1 3916.9 6.9 5.1
.. .. 728
.. .. 6.0
.. .. 26.2
.. .. 23.4
.. .. 12.1
.. .. 50.6
.. ..
.. ..
.. .. 22.0
.. .. 35.9
.. .... .. 29.. .. 8.. .. 265.. .. 35.. .. 3.4.. .. 19.2.. .... .. 0.3
.. .... .... .... .... .... ..
13 10 30,934
.. .. 3.8
.. .. 25.2
.. .. ..
.. .. .... .. 37.6.. .. .... .. .... .. 27.6.. .... .. 10.7
.. 4 385.. .. .... .. 219
.. ..5.9 49.4 54.61.1 1.5 7.1
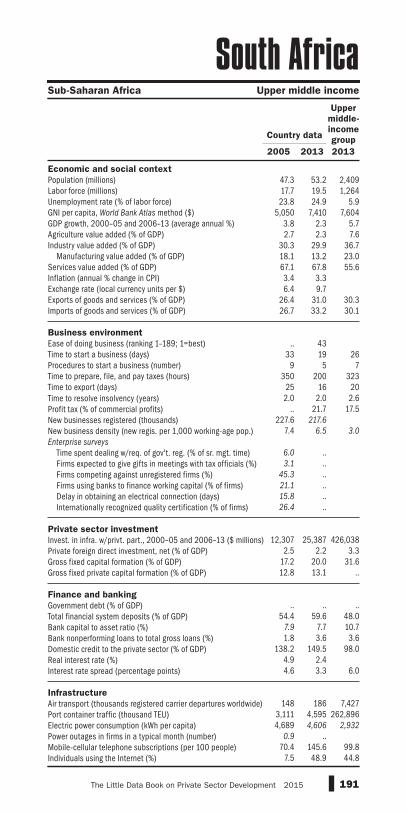
191The Little Data Book on Private Sector Development 2015
Economic and social context
Population (millions)Labor force (millions)Unemployment rate (% of labor force)GNI per capita, World Bank Atlas method ($)GDP growth, 2000–05 and 2006–13 (average annual %)Agriculture value added (% of GDP)Industry value added (% of GDP) Manufacturing value added (% of GDP)Services value added (% of GDP)Inflation (annual % change in CPI)Exchange rate (local currency units per $)Exports of goods and services (% of GDP)Imports of goods and services (% of GDP)
Business environment
Ease of doing business (ranking 1–189; 1=best)Time to start a business (days)Procedures to start a business (number)Time to prepare, file, and pay taxes (hours)Time to export (days)Time to resolve insolvency (years)Profit tax (% of commercial profits)New businesses registered (thousands)New business density (new regis. per 1,000 working-age pop.)Enterprise surveys
Time spent dealing w/req. of gov't. reg. (% of sr. mgt. time) Firms expected to give gifts in meetings with tax officials (%) Firms competing against unregistered firms (%) Firms using banks to finance working capital (% of firms) Delay in obtaining an electrical connection (days) Internationally recognized quality certification (% of firms)
Private sector investment
Invest. in infra. w/privt. part., 2000–05 and 2006–13 ($ millions)Private foreign direct investment, net (% of GDP)Gross fixed capital formation (% of GDP)Gross fixed private capital formation (% of GDP)
Finance and banking
Government debt (% of GDP)Total financial system deposits (% of GDP)Bank capital to asset ratio (%)Bank nonperforming loans to total gross loans (%)Domestic credit to the private sector (% of GDP)Real interest rate (%)Interest rate spread (percentage points)
Infrastructure
Air transport (thousands registered carrier departures worldwide)Port container traffic (thousand TEU)Electric power consumption (kWh per capita)Power outages in firms in a typical month (number)Mobile-cellular telephone subscriptions (per 100 people)Individuals using the Internet (%)
Sub-Saharan Africa Upper middle income
South Africa
2005 2013 2013
Upper
middle-
income
groupCountry data
47.3 53.2 2,40917.7 19.5 1,26423.8 24.9 5.9
5,050 7,410 7,6043.8 2.3 5.72.7 2.3 7.6
30.3 29.9 36.718.1 13.2 23.067.1 67.8 55.63.4 3.36.4 9.7
26.4 31.0 30.326.7 33.2 30.1
.. 43
33 19 269 5 7
350 200 32325 16 202.0 2.0 2.6
.. 21.7 17.5227.6 217.6
7.4 6.5 3.0
6.0 ..3.1 ..
45.3 ..21.1 ..15.8 ..26.4 ..
12,307 25,387 426,038
2.5 2.2 3.317.2 20.0 31.612.8 13.1 ..
.. .. ..
54.4 59.6 48.07.9 7.7 10.71.8 3.6 3.6
138.2 149.5 98.04.9 2.44.6 3.3 6.0
148 186 7,427
3,111 4,595 262,8964,689 4,606 2,932
0.9 ..70.4 145.6 99.8
7.5 48.9 44.8
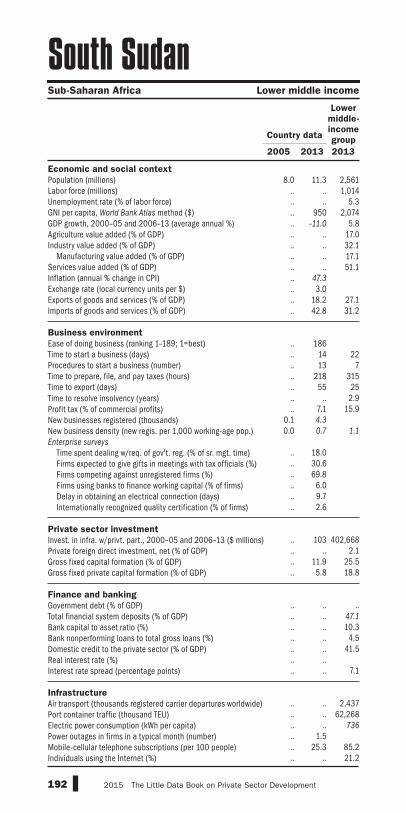
192 2015 The Little Data Book on Private Sector Development
Economic and social context
Population (millions)Labor force (millions)Unemployment rate (% of labor force)GNI per capita, World Bank Atlas method ($)GDP growth, 2000–05 and 2006–13 (average annual %)Agriculture value added (% of GDP)Industry value added (% of GDP) Manufacturing value added (% of GDP)Services value added (% of GDP)Inflation (annual % change in CPI)Exchange rate (local currency units per $)Exports of goods and services (% of GDP)Imports of goods and services (% of GDP)
Business environment
Ease of doing business (ranking 1–189; 1=best)Time to start a business (days)Procedures to start a business (number)Time to prepare, file, and pay taxes (hours)Time to export (days)Time to resolve insolvency (years)Profit tax (% of commercial profits)New businesses registered (thousands)New business density (new regis. per 1,000 working-age pop.)Enterprise surveys
Time spent dealing w/req. of gov't. reg. (% of sr. mgt. time) Firms expected to give gifts in meetings with tax officials (%) Firms competing against unregistered firms (%) Firms using banks to finance working capital (% of firms) Delay in obtaining an electrical connection (days) Internationally recognized quality certification (% of firms)
Private sector investment
Invest. in infra. w/privt. part., 2000–05 and 2006–13 ($ millions)Private foreign direct investment, net (% of GDP)Gross fixed capital formation (% of GDP)Gross fixed private capital formation (% of GDP)
Finance and banking
Government debt (% of GDP)Total financial system deposits (% of GDP)Bank capital to asset ratio (%)Bank nonperforming loans to total gross loans (%)Domestic credit to the private sector (% of GDP)Real interest rate (%)Interest rate spread (percentage points)
Infrastructure
Air transport (thousands registered carrier departures worldwide)Port container traffic (thousand TEU)Electric power consumption (kWh per capita)Power outages in firms in a typical month (number)Mobile-cellular telephone subscriptions (per 100 people)Individuals using the Internet (%)
Sub-Saharan Africa Lower middle income
South Sudan
2005 2013 2013
Lower
middle-
income
groupCountry data
8.0 11.3 2,561.. .. 1,014.. .. 5.3.. 950 2,074.. –11.0 5.8.. .. 17.0.. .. 32.1.. .. 17.1.. .. 51.1.. 47.3
.. 3.0
.. 18.2 27.1
.. 42.8 31.2
.. 186.. 14 22.. 13 7.. 218 315.. 55 25.. .. 2.9.. 7.1 15.9
0.1 4.3
0.0 0.7 1.1
.. 18.0.. 30.6.. 69.8.. 6.0.. 9.7.. 2.6
.. 103 402,668.. .. 2.1.. 11.9 25.5.. 5.8 18.8
.. .. .... .. 47.1
.. .. 10.3
.. .. 4.5
.. .. 41.5
.. ..
.. .. 7.1
.. .. 2,437.. .. 62,268.. .. 736
.. 1.5
.. 25.3 85.2
.. .. 21.2
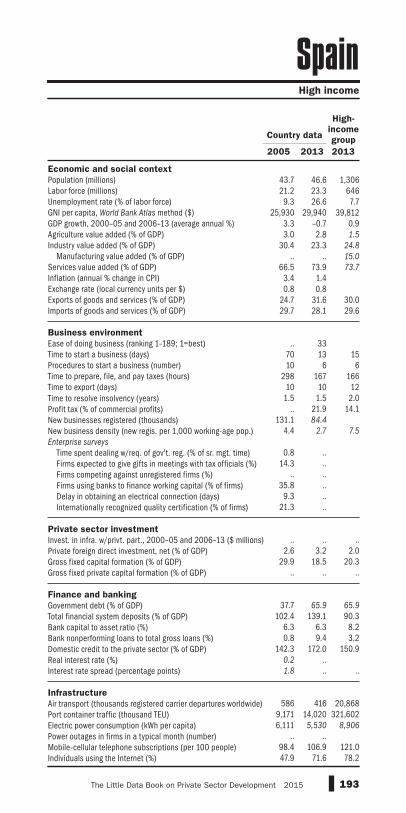
193The Little Data Book on Private Sector Development 2015
Economic and social context
Population (millions)Labor force (millions)Unemployment rate (% of labor force)GNI per capita, World Bank Atlas method ($)GDP growth, 2000–05 and 2006–13 (average annual %)Agriculture value added (% of GDP)Industry value added (% of GDP) Manufacturing value added (% of GDP)Services value added (% of GDP)Inflation (annual % change in CPI)Exchange rate (local currency units per $)Exports of goods and services (% of GDP)Imports of goods and services (% of GDP)
Business environment
Ease of doing business (ranking 1–189; 1=best)Time to start a business (days)Procedures to start a business (number)Time to prepare, file, and pay taxes (hours)Time to export (days)Time to resolve insolvency (years)Profit tax (% of commercial profits)New businesses registered (thousands)New business density (new regis. per 1,000 working-age pop.)Enterprise surveys
Time spent dealing w/req. of gov't. reg. (% of sr. mgt. time) Firms expected to give gifts in meetings with tax officials (%) Firms competing against unregistered firms (%) Firms using banks to finance working capital (% of firms) Delay in obtaining an electrical connection (days) Internationally recognized quality certification (% of firms)
Private sector investment
Invest. in infra. w/privt. part., 2000–05 and 2006–13 ($ millions)Private foreign direct investment, net (% of GDP)Gross fixed capital formation (% of GDP)Gross fixed private capital formation (% of GDP)
Finance and banking
Government debt (% of GDP)Total financial system deposits (% of GDP)Bank capital to asset ratio (%)Bank nonperforming loans to total gross loans (%)Domestic credit to the private sector (% of GDP)Real interest rate (%)Interest rate spread (percentage points)
Infrastructure
Air transport (thousands registered carrier departures worldwide)Port container traffic (thousand TEU)Electric power consumption (kWh per capita)Power outages in firms in a typical month (number)Mobile-cellular telephone subscriptions (per 100 people)Individuals using the Internet (%)
High income
Spain
2005 2013 2013
High-
income
groupCountry data
43.7 46.6 1,30621.2 23.3 6469.3 26.6 7.7
25,930 29,940 39,8123.3 –0.7 0.93.0 2.8 1.5
30.4 23.3 24.8
.. .. 15.0
66.5 73.9 73.7
3.4 1.40.8 0.8
24.7 31.6 30.029.7 28.1 29.6
.. 33
70 13 1510 6 6
298 167 16610 10 12
1.5 1.5 2.0.. 21.9 14.1
131.1 84.4
4.4 2.7 7.5
0.8 ..
14.3 .... ..
35.8 ..9.3 ..
21.3 ..
.. .. ..
2.6 3.2 2.029.9 18.5 20.3
.. .. ..
37.7 65.9 65.9
102.4 139.1 90.36.3 6.3 8.20.8 9.4 3.2
142.3 172.0 150.90.2 ..1.8 .. ..
586 416 20,868
9,171 14,020 321,6026,111 5,530 8,906
.. ..98.4 106.9 121.047.9 71.6 78.2
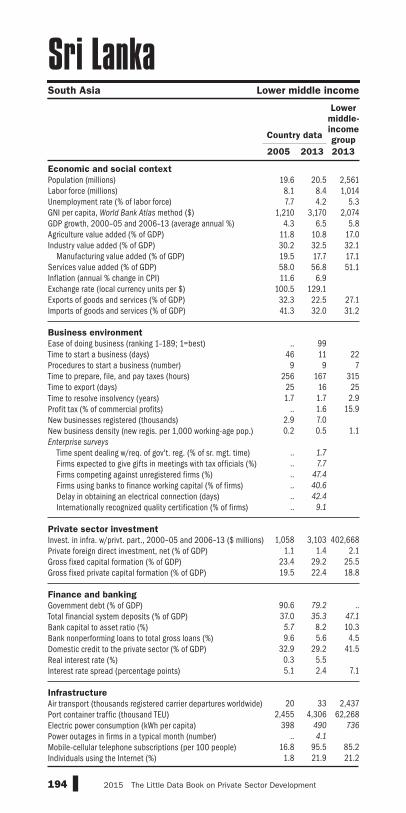
194 2015 The Little Data Book on Private Sector Development
Economic and social context
Population (millions)Labor force (millions)Unemployment rate (% of labor force)GNI per capita, World Bank Atlas method ($)GDP growth, 2000–05 and 2006–13 (average annual %)Agriculture value added (% of GDP)Industry value added (% of GDP) Manufacturing value added (% of GDP)Services value added (% of GDP)Inflation (annual % change in CPI)Exchange rate (local currency units per $)Exports of goods and services (% of GDP)Imports of goods and services (% of GDP)
Business environment
Ease of doing business (ranking 1–189; 1=best)Time to start a business (days)Procedures to start a business (number)Time to prepare, file, and pay taxes (hours)Time to export (days)Time to resolve insolvency (years)Profit tax (% of commercial profits)New businesses registered (thousands)New business density (new regis. per 1,000 working-age pop.)Enterprise surveys
Time spent dealing w/req. of gov't. reg. (% of sr. mgt. time) Firms expected to give gifts in meetings with tax officials (%) Firms competing against unregistered firms (%) Firms using banks to finance working capital (% of firms) Delay in obtaining an electrical connection (days) Internationally recognized quality certification (% of firms)
Private sector investment
Invest. in infra. w/privt. part., 2000–05 and 2006–13 ($ millions)Private foreign direct investment, net (% of GDP)Gross fixed capital formation (% of GDP)Gross fixed private capital formation (% of GDP)
Finance and banking
Government debt (% of GDP)Total financial system deposits (% of GDP)Bank capital to asset ratio (%)Bank nonperforming loans to total gross loans (%)Domestic credit to the private sector (% of GDP)Real interest rate (%)Interest rate spread (percentage points)
Infrastructure
Air transport (thousands registered carrier departures worldwide)Port container traffic (thousand TEU)Electric power consumption (kWh per capita)Power outages in firms in a typical month (number)Mobile-cellular telephone subscriptions (per 100 people)Individuals using the Internet (%)
South Asia Lower middle income
Sri Lanka
2005 2013 2013
Lower
middle-
income
groupCountry data
19.6 20.5 2,5618.1 8.4 1,0147.7 4.2 5.3
1,210 3,170 2,0744.3 6.5 5.8
11.8 10.8 17.030.2 32.5 32.119.5 17.7 17.158.0 56.8 51.111.6 6.9
100.5 129.132.3 22.5 27.141.3 32.0 31.2
.. 99
46 11 229 9 7
256 167 31525 16 251.7 1.7 2.9
.. 1.6 15.92.9 7.00.2 0.5 1.1
.. 1.7
.. 7.7
.. 47.4
.. 40.6
.. 42.4
.. 9.1
1,058 3,103 402,668
1.1 1.4 2.123.4 29.2 25.519.5 22.4 18.8
90.6 79.2 ..37.0 35.3 47.1
5.7 8.2 10.39.6 5.6 4.5
32.9 29.2 41.50.3 5.55.1 2.4 7.1
20 33 2,437
2,455 4,306 62,268398 490 736
.. 4.1
16.8 95.5 85.21.8 21.9 21.2
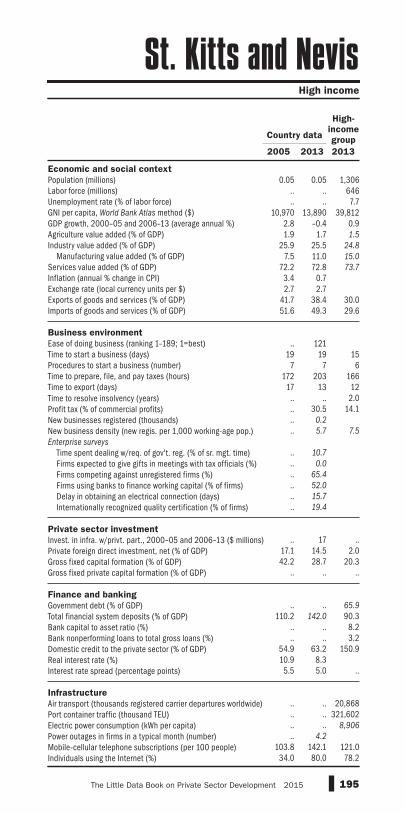
195The Little Data Book on Private Sector Development 2015
Economic and social context
Population (millions)Labor force (millions)Unemployment rate (% of labor force)GNI per capita, World Bank Atlas method ($)GDP growth, 2000–05 and 2006–13 (average annual %)Agriculture value added (% of GDP)Industry value added (% of GDP) Manufacturing value added (% of GDP)Services value added (% of GDP)Inflation (annual % change in CPI)Exchange rate (local currency units per $)Exports of goods and services (% of GDP)Imports of goods and services (% of GDP)
Business environment
Ease of doing business (ranking 1–189; 1=best)Time to start a business (days)Procedures to start a business (number)Time to prepare, file, and pay taxes (hours)Time to export (days)Time to resolve insolvency (years)Profit tax (% of commercial profits)New businesses registered (thousands)New business density (new regis. per 1,000 working-age pop.)Enterprise surveys
Time spent dealing w/req. of gov't. reg. (% of sr. mgt. time) Firms expected to give gifts in meetings with tax officials (%) Firms competing against unregistered firms (%) Firms using banks to finance working capital (% of firms) Delay in obtaining an electrical connection (days) Internationally recognized quality certification (% of firms)
Private sector investment
Invest. in infra. w/privt. part., 2000–05 and 2006–13 ($ millions)Private foreign direct investment, net (% of GDP)Gross fixed capital formation (% of GDP)Gross fixed private capital formation (% of GDP)
Finance and banking
Government debt (% of GDP)Total financial system deposits (% of GDP)Bank capital to asset ratio (%)Bank nonperforming loans to total gross loans (%)Domestic credit to the private sector (% of GDP)Real interest rate (%)Interest rate spread (percentage points)
Infrastructure
Air transport (thousands registered carrier departures worldwide)Port container traffic (thousand TEU)Electric power consumption (kWh per capita)Power outages in firms in a typical month (number)Mobile-cellular telephone subscriptions (per 100 people)Individuals using the Internet (%)
High income
St. Kitts and Nevis
2005 2013 2013
High-
income
groupCountry data
0.05 0.05 1,306.. .. 646.. .. 7.7
10,970 13,890 39,8122.8 –0.4 0.91.9 1.7 1.5
25.9 25.5 24.8
7.5 11.0 15.0
72.2 72.8 73.7
3.4 0.72.7 2.7
41.7 38.4 30.051.6 49.3 29.6
.. 121
19 19 157 7 6
172 203 16617 13 12.. .. 2.0.. 30.5 14.1.. 0.2
.. 5.7 7.5
.. 10.7
.. 0.0
.. 65.4
.. 52.0
.. 15.7
.. 19.4
.. 17 ..
17.1 14.5 2.042.2 28.7 20.3
.. .. .. .. .. 65.9
110.2 142.0 90.3.. .. 8.2.. .. 3.2
54.9 63.2 150.910.9 8.35.5 5.0 ..
.. .. 20,868.. .. 321,602.. .. 8,906
.. 4.2
103.8 142.1 121.034.0 80.0 78.2
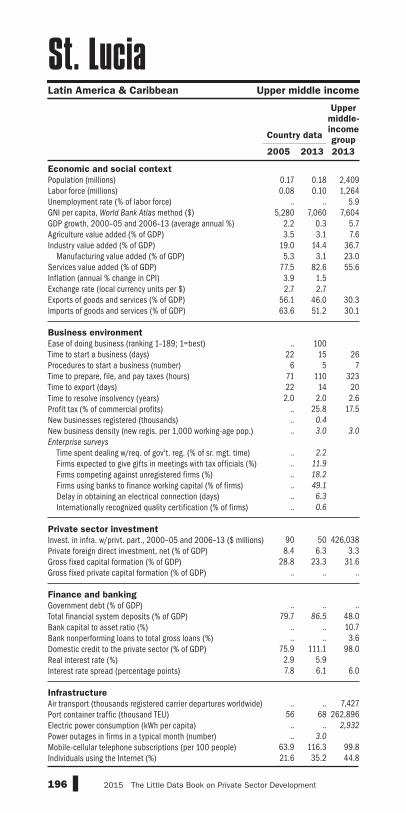
196 2015 The Little Data Book on Private Sector Development
Economic and social context
Population (millions)Labor force (millions)Unemployment rate (% of labor force)GNI per capita, World Bank Atlas method ($)GDP growth, 2000–05 and 2006–13 (average annual %)Agriculture value added (% of GDP)Industry value added (% of GDP) Manufacturing value added (% of GDP)Services value added (% of GDP)Inflation (annual % change in CPI)Exchange rate (local currency units per $)Exports of goods and services (% of GDP)Imports of goods and services (% of GDP)
Business environment
Ease of doing business (ranking 1–189; 1=best)Time to start a business (days)Procedures to start a business (number)Time to prepare, file, and pay taxes (hours)Time to export (days)Time to resolve insolvency (years)Profit tax (% of commercial profits)New businesses registered (thousands)New business density (new regis. per 1,000 working-age pop.)Enterprise surveys
Time spent dealing w/req. of gov't. reg. (% of sr. mgt. time) Firms expected to give gifts in meetings with tax officials (%) Firms competing against unregistered firms (%) Firms using banks to finance working capital (% of firms) Delay in obtaining an electrical connection (days) Internationally recognized quality certification (% of firms)
Private sector investment
Invest. in infra. w/privt. part., 2000–05 and 2006–13 ($ millions)Private foreign direct investment, net (% of GDP)Gross fixed capital formation (% of GDP)Gross fixed private capital formation (% of GDP)
Finance and banking
Government debt (% of GDP)Total financial system deposits (% of GDP)Bank capital to asset ratio (%)Bank nonperforming loans to total gross loans (%)Domestic credit to the private sector (% of GDP)Real interest rate (%)Interest rate spread (percentage points)
Infrastructure
Air transport (thousands registered carrier departures worldwide)Port container traffic (thousand TEU)Electric power consumption (kWh per capita)Power outages in firms in a typical month (number)Mobile-cellular telephone subscriptions (per 100 people)Individuals using the Internet (%)
Latin America & Caribbean Upper middle income
St. Lucia
2005 2013 2013
Upper
middle-
income
groupCountry data
0.17 0.18 2,4090.08 0.10 1,264
.. .. 5.95,280 7,060 7,604
2.2 0.3 5.73.5 3.1 7.6
19.0 14.4 36.75.3 3.1 23.0
77.5 82.6 55.63.9 1.52.7 2.7
56.1 46.0 30.363.6 51.2 30.1
.. 100
22 15 266 5 7
71 110 32322 14 202.0 2.0 2.6
.. 25.8 17.5
.. 0.4
.. 3.0 3.0
.. 2.2
.. 11.9
.. 18.2
.. 49.1
.. 6.3
.. 0.6
90 50 426,0388.4 6.3 3.3
28.8 23.3 31.6.. .. ..
.. .. ..
79.7 86.5 48.0.. .. 10.7.. .. 3.6
75.9 111.1 98.02.9 5.97.8 6.1 6.0
.. .. 7,427
56 68 262,896.. .. 2,932
.. 3.0
63.9 116.3 99.821.6 35.2 44.8
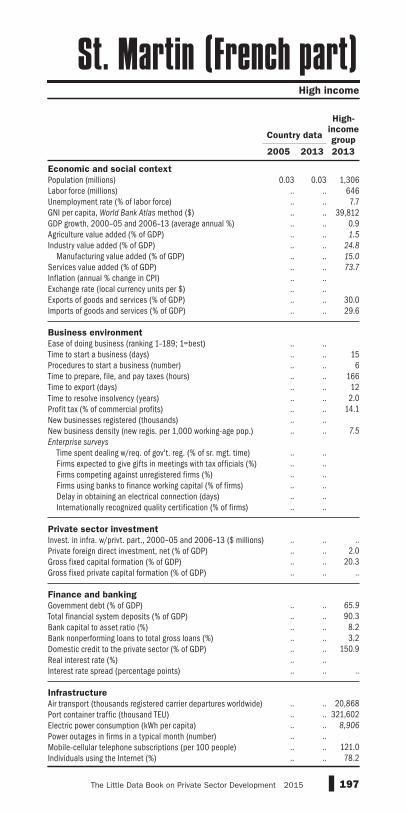
197The Little Data Book on Private Sector Development 2015
Economic and social context
Population (millions)Labor force (millions)Unemployment rate (% of labor force)GNI per capita, World Bank Atlas method ($)GDP growth, 2000–05 and 2006–13 (average annual %)Agriculture value added (% of GDP)Industry value added (% of GDP) Manufacturing value added (% of GDP)Services value added (% of GDP)Inflation (annual % change in CPI)Exchange rate (local currency units per $)Exports of goods and services (% of GDP)Imports of goods and services (% of GDP)
Business environment
Ease of doing business (ranking 1–189; 1=best)Time to start a business (days)Procedures to start a business (number)Time to prepare, file, and pay taxes (hours)Time to export (days)Time to resolve insolvency (years)Profit tax (% of commercial profits)New businesses registered (thousands)New business density (new regis. per 1,000 working-age pop.)Enterprise surveys
Time spent dealing w/req. of gov't. reg. (% of sr. mgt. time) Firms expected to give gifts in meetings with tax officials (%) Firms competing against unregistered firms (%) Firms using banks to finance working capital (% of firms) Delay in obtaining an electrical connection (days) Internationally recognized quality certification (% of firms)
Private sector investment
Invest. in infra. w/privt. part., 2000–05 and 2006–13 ($ millions)Private foreign direct investment, net (% of GDP)Gross fixed capital formation (% of GDP)Gross fixed private capital formation (% of GDP)
Finance and banking
Government debt (% of GDP)Total financial system deposits (% of GDP)Bank capital to asset ratio (%)Bank nonperforming loans to total gross loans (%)Domestic credit to the private sector (% of GDP)Real interest rate (%)Interest rate spread (percentage points)
Infrastructure
Air transport (thousands registered carrier departures worldwide)Port container traffic (thousand TEU)Electric power consumption (kWh per capita)Power outages in firms in a typical month (number)Mobile-cellular telephone subscriptions (per 100 people)Individuals using the Internet (%)
High income
St. Martin (French part)
2005 2013 2013
High-
income
groupCountry data
0.03 0.03 1,306.. .. 646.. .. 7.7.. .. 39,812.. .. 0.9.. .. 1.5
.. .. 24.8
.. .. 15.0
.. .. 73.7
.. ..
.. ..
.. .. 30.0
.. .. 29.6
.. .... .. 15.. .. 6.. .. 166.. .. 12.. .. 2.0.. .. 14.1.. .... .. 7.5
.. .... .... .... .... .... ..
.. .. .... .. 2.0.. .. 20.3.. .. .. .. .. 65.9
.. .. 90.3
.. .. 8.2
.. .. 3.2
.. .. 150.9
.. ..
.. .. ..
.. .. 20,868.. .. 321,602.. .. 8,906
.. ..
.. .. 121.0
.. .. 78.2

198 2015 The Little Data Book on Private Sector Development
Economic and social context
Population (millions)Labor force (millions)Unemployment rate (% of labor force)GNI per capita, World Bank Atlas method ($)GDP growth, 2000–05 and 2006–13 (average annual %)Agriculture value added (% of GDP)Industry value added (% of GDP) Manufacturing value added (% of GDP)Services value added (% of GDP)Inflation (annual % change in CPI)Exchange rate (local currency units per $)Exports of goods and services (% of GDP)Imports of goods and services (% of GDP)
Business environment
Ease of doing business (ranking 1–189; 1=best)Time to start a business (days)Procedures to start a business (number)Time to prepare, file, and pay taxes (hours)Time to export (days)Time to resolve insolvency (years)Profit tax (% of commercial profits)New businesses registered (thousands)New business density (new regis. per 1,000 working-age pop.)Enterprise surveys
Time spent dealing w/req. of gov't. reg. (% of sr. mgt. time) Firms expected to give gifts in meetings with tax officials (%) Firms competing against unregistered firms (%) Firms using banks to finance working capital (% of firms) Delay in obtaining an electrical connection (days) Internationally recognized quality certification (% of firms)
Private sector investment
Invest. in infra. w/privt. part., 2000–05 and 2006–13 ($ millions)Private foreign direct investment, net (% of GDP)Gross fixed capital formation (% of GDP)Gross fixed private capital formation (% of GDP)
Finance and banking
Government debt (% of GDP)Total financial system deposits (% of GDP)Bank capital to asset ratio (%)Bank nonperforming loans to total gross loans (%)Domestic credit to the private sector (% of GDP)Real interest rate (%)Interest rate spread (percentage points)
Infrastructure
Air transport (thousands registered carrier departures worldwide)Port container traffic (thousand TEU)Electric power consumption (kWh per capita)Power outages in firms in a typical month (number)Mobile-cellular telephone subscriptions (per 100 people)Individuals using the Internet (%)
Latin America & Caribbean Upper middle income
St. Vincent and the Grenadines
2005 2013 2013
Upper
middle-
income
groupCountry data
0.11 0.11 2,4090.05 0.05 1,264
.. .. 5.94,950 6,460 7,604
4.9 –0.3 5.76.3 7.1 7.6
18.8 17.7 36.75.9 4.7 23.0
74.9 75.1 55.63.7 0.82.7 2.7
36.4 27.4 30.352.9 59.9 30.1
.. 103
12 10 268 7 7
76 108 32315 12 20
.. .. 2.6
.. 30.2 17.50.1 0.1
1.8 1.4 3.0
.. 4.8
.. 5.9
.. 65.0
.. 52.7
.. 9.3
.. 20.9
50 .. 426,0387.3 17.9 3.3
25.1 24.9 31.6.. .. ..
.. .. ..
64.9 68.2 48.0.. .. 10.7.. 8.3 3.6
45.6 53.6 98.06.4 8.76.7 6.7 6.0
.. .. 7,427.. 23 262,896.. .. 2,932
.. 1.7
64.9 114.6 99.89.2 52.0 44.8
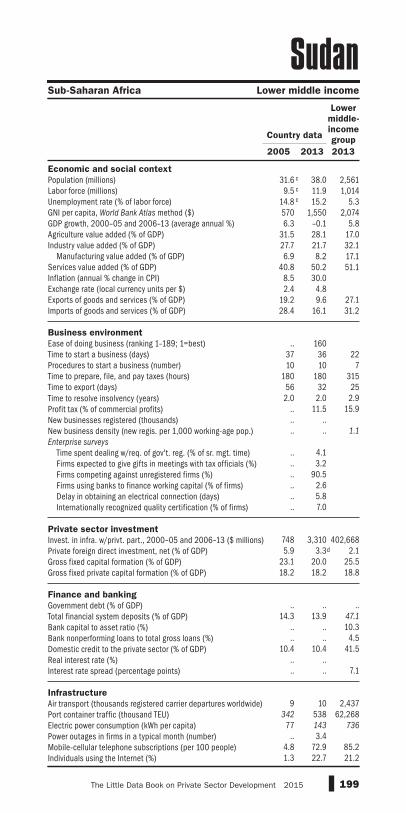
199The Little Data Book on Private Sector Development 2015
Economic and social context
Population (millions)Labor force (millions)Unemployment rate (% of labor force)GNI per capita, World Bank Atlas method ($)GDP growth, 2000–05 and 2006–13 (average annual %)Agriculture value added (% of GDP)Industry value added (% of GDP) Manufacturing value added (% of GDP)Services value added (% of GDP)Inflation (annual % change in CPI)Exchange rate (local currency units per $)Exports of goods and services (% of GDP)Imports of goods and services (% of GDP)
Business environment
Ease of doing business (ranking 1–189; 1=best)Time to start a business (days)Procedures to start a business (number)Time to prepare, file, and pay taxes (hours)Time to export (days)Time to resolve insolvency (years)Profit tax (% of commercial profits)New businesses registered (thousands)New business density (new regis. per 1,000 working-age pop.)Enterprise surveys
Time spent dealing w/req. of gov't. reg. (% of sr. mgt. time) Firms expected to give gifts in meetings with tax officials (%) Firms competing against unregistered firms (%) Firms using banks to finance working capital (% of firms) Delay in obtaining an electrical connection (days) Internationally recognized quality certification (% of firms)
Private sector investment
Invest. in infra. w/privt. part., 2000–05 and 2006–13 ($ millions)Private foreign direct investment, net (% of GDP)Gross fixed capital formation (% of GDP)Gross fixed private capital formation (% of GDP)
Finance and banking
Government debt (% of GDP)Total financial system deposits (% of GDP)Bank capital to asset ratio (%)Bank nonperforming loans to total gross loans (%)Domestic credit to the private sector (% of GDP)Real interest rate (%)Interest rate spread (percentage points)
Infrastructure
Air transport (thousands registered carrier departures worldwide)Port container traffic (thousand TEU)Electric power consumption (kWh per capita)Power outages in firms in a typical month (number)Mobile-cellular telephone subscriptions (per 100 people)Individuals using the Internet (%)
Sub-Saharan Africa Lower middle income
Sudan
2005 2013 2013
Lower
middle-
income
groupCountry data
31.6 38.0 2,5619.5 11.9 1,014
14.8 15.2 5.3570 1,550 2,0746.3 –0.1 5.8
31.5 28.1 17.027.7 21.7 32.16.9 8.2 17.1
40.8 50.2 51.18.5 30.02.4 4.8
19.2 9.6 27.128.4 16.1 31.2
.. 160
37 36 2210 10 7
180 180 31556 32 252.0 2.0 2.9
.. 11.5 15.9
.. ..
.. .. 1.1
.. 4.1.. 3.2.. 90.5.. 2.6.. 5.8.. 7.0
748 3,310 402,6685.9 3.3 2.1
23.1 20.0 25.518.2 18.2 18.8
.. .. ..
14.3 13.9 47.1
.. .. 10.3
.. .. 4.510.4 10.4 41.5
.. ..
.. .. 7.1 9 10 2,437
342 538 62,26877 143 736
.. 3.44.8 72.9 85.21.3 22.7 21.2
c
c
c
d

200 2015 The Little Data Book on Private Sector Development
Economic and social context
Population (millions)Labor force (millions)Unemployment rate (% of labor force)GNI per capita, World Bank Atlas method ($)GDP growth, 2000–05 and 2006–13 (average annual %)Agriculture value added (% of GDP)Industry value added (% of GDP) Manufacturing value added (% of GDP)Services value added (% of GDP)Inflation (annual % change in CPI)Exchange rate (local currency units per $)Exports of goods and services (% of GDP)Imports of goods and services (% of GDP)
Business environment
Ease of doing business (ranking 1–189; 1=best)Time to start a business (days)Procedures to start a business (number)Time to prepare, file, and pay taxes (hours)Time to export (days)Time to resolve insolvency (years)Profit tax (% of commercial profits)New businesses registered (thousands)New business density (new regis. per 1,000 working-age pop.)Enterprise surveys
Time spent dealing w/req. of gov't. reg. (% of sr. mgt. time) Firms expected to give gifts in meetings with tax officials (%) Firms competing against unregistered firms (%) Firms using banks to finance working capital (% of firms) Delay in obtaining an electrical connection (days) Internationally recognized quality certification (% of firms)
Private sector investment
Invest. in infra. w/privt. part., 2000–05 and 2006–13 ($ millions)Private foreign direct investment, net (% of GDP)Gross fixed capital formation (% of GDP)Gross fixed private capital formation (% of GDP)
Finance and banking
Government debt (% of GDP)Total financial system deposits (% of GDP)Bank capital to asset ratio (%)Bank nonperforming loans to total gross loans (%)Domestic credit to the private sector (% of GDP)Real interest rate (%)Interest rate spread (percentage points)
Infrastructure
Air transport (thousands registered carrier departures worldwide)Port container traffic (thousand TEU)Electric power consumption (kWh per capita)Power outages in firms in a typical month (number)Mobile-cellular telephone subscriptions (per 100 people)Individuals using the Internet (%)
Latin America & Caribbean Upper middle income
Suriname
2005 2013 2013
Upper
middle-
income
groupCountry data
0.50 0.54 2,4090.18 0.21 1,2648.2 7.8 5.9
3,330 9,370 7,6045.9 4.1 5.75.4 7.0 7.6
37.3 48.6 36.718.4 16.4 23.057.3 44.4 55.69.9 2.02.7 3.3
30.4 .. 30.345.2 .. 30.1
.. 162
697 84 2613 13 7
199 199 32320 22 205.0 5.0 2.6
.. 27.9 17.50.2 0.6
0.5 1.6 3.0
.. 6.4
.. 1.8
.. 85.3
.. 57.6
.. 44.4
.. 16.9
.. 60 426,038
1.6 2.6 3.324.9 .. 31.619.6 .. ..
.. .. ..
37.3 46.3 48.0.. .. 10.7.. .. 3.6
19.3 27.0 98.01.7 9.0
10.1 4.9 6.0
5 3 7,427.. .. 262,896.. .. 2,932
.. 0.7
46.6 161.1 99.86.4 37.4 44.8

201The Little Data Book on Private Sector Development 2015
Economic and social context
Population (millions)Labor force (millions)Unemployment rate (% of labor force)GNI per capita, World Bank Atlas method ($)GDP growth, 2000–05 and 2006–13 (average annual %)Agriculture value added (% of GDP)Industry value added (% of GDP) Manufacturing value added (% of GDP)Services value added (% of GDP)Inflation (annual % change in CPI)Exchange rate (local currency units per $)Exports of goods and services (% of GDP)Imports of goods and services (% of GDP)
Business environment
Ease of doing business (ranking 1–189; 1=best)Time to start a business (days)Procedures to start a business (number)Time to prepare, file, and pay taxes (hours)Time to export (days)Time to resolve insolvency (years)Profit tax (% of commercial profits)New businesses registered (thousands)New business density (new regis. per 1,000 working-age pop.)Enterprise surveys
Time spent dealing w/req. of gov't. reg. (% of sr. mgt. time) Firms expected to give gifts in meetings with tax officials (%) Firms competing against unregistered firms (%) Firms using banks to finance working capital (% of firms) Delay in obtaining an electrical connection (days) Internationally recognized quality certification (% of firms)
Private sector investment
Invest. in infra. w/privt. part., 2000–05 and 2006–13 ($ millions)Private foreign direct investment, net (% of GDP)Gross fixed capital formation (% of GDP)Gross fixed private capital formation (% of GDP)
Finance and banking
Government debt (% of GDP)Total financial system deposits (% of GDP)Bank capital to asset ratio (%)Bank nonperforming loans to total gross loans (%)Domestic credit to the private sector (% of GDP)Real interest rate (%)Interest rate spread (percentage points)
Infrastructure
Air transport (thousands registered carrier departures worldwide)Port container traffic (thousand TEU)Electric power consumption (kWh per capita)Power outages in firms in a typical month (number)Mobile-cellular telephone subscriptions (per 100 people)Individuals using the Internet (%)
Sub-Saharan Africa Lower middle income
Swaziland
2005 2013 2013
Lower
middle-
income
groupCountry data
1.1 1.2 2,5610.36 0.45 1,01422.9 22.5 5.3
2,390 2,990 2,0742.2 1.6 5.88.8 7.5 17.0
44.7 47.7 32.138.9 43.8 17.146.5 44.8 51.1
4.8 5.66.4 9.7
87.1 55.3 27.191.2 59.3 31.2
.. 110
60 30 2212 12 7
104 110 31521 17 25
2.0 2.0 2.9.. 28.6 15.9.. .... .. 1.1
4.4 ..3.3 ..
39.7 ..16.0 ..16.9 ..22.1 ..
28 75 402,668
–1.8 0.6 2.115.0 9.6 25.5
7.1 5.0 18.8
.. .. ..
19.6 28.2 47.1
14.4 17.9 10.37.0 6.8 4.5
21.1 25.3 41.57.9 1.26.6 6.4 7.1
.. .. 2,437.. .. 62,268.. .. 736
1.8 ..18.1 71.5 85.2
3.7 24.7 21.2

202 2015 The Little Data Book on Private Sector Development
Economic and social context
Population (millions)Labor force (millions)Unemployment rate (% of labor force)GNI per capita, World Bank Atlas method ($)GDP growth, 2000–05 and 2006–13 (average annual %)Agriculture value added (% of GDP)Industry value added (% of GDP) Manufacturing value added (% of GDP)Services value added (% of GDP)Inflation (annual % change in CPI)Exchange rate (local currency units per $)Exports of goods and services (% of GDP)Imports of goods and services (% of GDP)
Business environment
Ease of doing business (ranking 1–189; 1=best)Time to start a business (days)Procedures to start a business (number)Time to prepare, file, and pay taxes (hours)Time to export (days)Time to resolve insolvency (years)Profit tax (% of commercial profits)New businesses registered (thousands)New business density (new regis. per 1,000 working-age pop.)Enterprise surveys
Time spent dealing w/req. of gov't. reg. (% of sr. mgt. time) Firms expected to give gifts in meetings with tax officials (%) Firms competing against unregistered firms (%) Firms using banks to finance working capital (% of firms) Delay in obtaining an electrical connection (days) Internationally recognized quality certification (% of firms)
Private sector investment
Invest. in infra. w/privt. part., 2000–05 and 2006–13 ($ millions)Private foreign direct investment, net (% of GDP)Gross fixed capital formation (% of GDP)Gross fixed private capital formation (% of GDP)
Finance and banking
Government debt (% of GDP)Total financial system deposits (% of GDP)Bank capital to asset ratio (%)Bank nonperforming loans to total gross loans (%)Domestic credit to the private sector (% of GDP)Real interest rate (%)Interest rate spread (percentage points)
Infrastructure
Air transport (thousands registered carrier departures worldwide)Port container traffic (thousand TEU)Electric power consumption (kWh per capita)Power outages in firms in a typical month (number)Mobile-cellular telephone subscriptions (per 100 people)Individuals using the Internet (%)
High income
Sweden
2005 2013 2013
High-
income
groupCountry data
9.0 9.6 1,3064.8 5.1 6467.8 8.1 7.7
45,350 61,710 39,8122.7 0.9 0.91.1 1.4 1.5
29.7 25.9 24.8
20.5 16.5 15.0
69.2 72.7 73.7
0.5 0.07.5 6.5
45.9 43.8 30.038.7 38.9 29.6
.. 11
16 16 153 3 6
122 122 1669 9 12
2.0 2.0 2.0.. 13.4 14.1
20.6 39.3
3.5 6.4 7.5
.. 4.9.. 0.3.. 29.7.. 26.6.. 24.3.. 39.1
.. .. ..
5.2 –0.9 2.022.1 22.1 20.3
.. .. ..
50.6 35.3 65.9
42.9 62.9 90.34.9 .. 8.20.8 0.6 3.2
102.7 135.3 150.92.5 ..2.5 .. ..
190 .. 20,868
1,253 1,602 321,60215,431 14,030 8,906
.. ..100.8 124.4 121.084.8 94.8 78.2

203The Little Data Book on Private Sector Development 2015
Economic and social context
Population (millions)Labor force (millions)Unemployment rate (% of labor force)GNI per capita, World Bank Atlas method ($)GDP growth, 2000–05 and 2006–13 (average annual %)Agriculture value added (% of GDP)Industry value added (% of GDP) Manufacturing value added (% of GDP)Services value added (% of GDP)Inflation (annual % change in CPI)Exchange rate (local currency units per $)Exports of goods and services (% of GDP)Imports of goods and services (% of GDP)
Business environment
Ease of doing business (ranking 1–189; 1=best)Time to start a business (days)Procedures to start a business (number)Time to prepare, file, and pay taxes (hours)Time to export (days)Time to resolve insolvency (years)Profit tax (% of commercial profits)New businesses registered (thousands)New business density (new regis. per 1,000 working-age pop.)Enterprise surveys
Time spent dealing w/req. of gov't. reg. (% of sr. mgt. time) Firms expected to give gifts in meetings with tax officials (%) Firms competing against unregistered firms (%) Firms using banks to finance working capital (% of firms) Delay in obtaining an electrical connection (days) Internationally recognized quality certification (% of firms)
Private sector investment
Invest. in infra. w/privt. part., 2000–05 and 2006–13 ($ millions)Private foreign direct investment, net (% of GDP)Gross fixed capital formation (% of GDP)Gross fixed private capital formation (% of GDP)
Finance and banking
Government debt (% of GDP)Total financial system deposits (% of GDP)Bank capital to asset ratio (%)Bank nonperforming loans to total gross loans (%)Domestic credit to the private sector (% of GDP)Real interest rate (%)Interest rate spread (percentage points)
Infrastructure
Air transport (thousands registered carrier departures worldwide)Port container traffic (thousand TEU)Electric power consumption (kWh per capita)Power outages in firms in a typical month (number)Mobile-cellular telephone subscriptions (per 100 people)Individuals using the Internet (%)
High income
Switzerland
2005 2013 2013
High-
income
groupCountry data
7.4 8.1 1,3064.2 4.7 6464.4 4.4 7.7
61,550 90,680 39,8121.3 1.5 0.90.9 0.7 1.5
26.8 25.7 24.8
19.6 18.7 15.0
72.3 73.6 73.7
1.2 –0.21.2 0.9
53.9 72.1 30.046.7 60.0 29.6
.. 20
18 10 156 6 6
63 63 1668 8 12
3.0 3.0 2.0.. 9.5 14.1
11.1 13.7
2.2 2.5 7.5
.. .... .... .... .... .... ..
.. .. ..
0.7 –1.2 2.024.5 23.4 20.3
.. .. ..
38.3 24.3 65.9
127.9 163.9 90.34.9 5.7 8.20.5 0.8 3.2
150.2 169.0 150.92.5 2.92.6 2.7 ..
135 259 20,868104 121 321,602
8,305 7,928 8,906
.. ..92.2 136.8 121.070.1 86.7 78.2
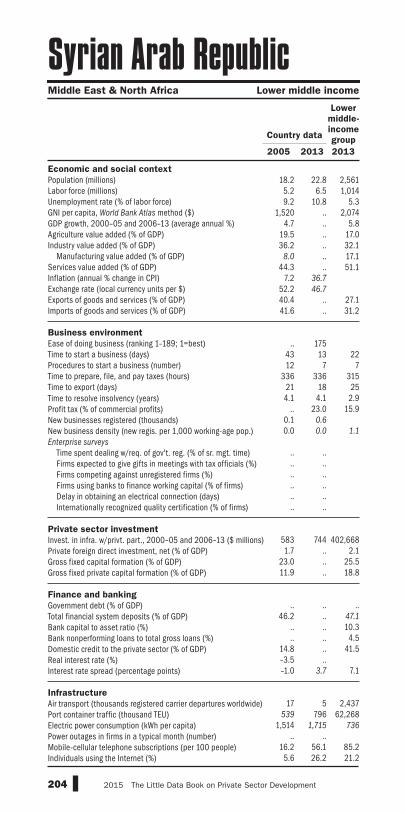
204 2015 The Little Data Book on Private Sector Development
Economic and social context
Population (millions)Labor force (millions)Unemployment rate (% of labor force)GNI per capita, World Bank Atlas method ($)GDP growth, 2000–05 and 2006–13 (average annual %)Agriculture value added (% of GDP)Industry value added (% of GDP) Manufacturing value added (% of GDP)Services value added (% of GDP)Inflation (annual % change in CPI)Exchange rate (local currency units per $)Exports of goods and services (% of GDP)Imports of goods and services (% of GDP)
Business environment
Ease of doing business (ranking 1–189; 1=best)Time to start a business (days)Procedures to start a business (number)Time to prepare, file, and pay taxes (hours)Time to export (days)Time to resolve insolvency (years)Profit tax (% of commercial profits)New businesses registered (thousands)New business density (new regis. per 1,000 working-age pop.)Enterprise surveys
Time spent dealing w/req. of gov't. reg. (% of sr. mgt. time) Firms expected to give gifts in meetings with tax officials (%) Firms competing against unregistered firms (%) Firms using banks to finance working capital (% of firms) Delay in obtaining an electrical connection (days) Internationally recognized quality certification (% of firms)
Private sector investment
Invest. in infra. w/privt. part., 2000–05 and 2006–13 ($ millions)Private foreign direct investment, net (% of GDP)Gross fixed capital formation (% of GDP)Gross fixed private capital formation (% of GDP)
Finance and banking
Government debt (% of GDP)Total financial system deposits (% of GDP)Bank capital to asset ratio (%)Bank nonperforming loans to total gross loans (%)Domestic credit to the private sector (% of GDP)Real interest rate (%)Interest rate spread (percentage points)
Infrastructure
Air transport (thousands registered carrier departures worldwide)Port container traffic (thousand TEU)Electric power consumption (kWh per capita)Power outages in firms in a typical month (number)Mobile-cellular telephone subscriptions (per 100 people)Individuals using the Internet (%)
Middle East & North Africa Lower middle income
Syrian Arab Republic
2005 2013 2013
Lower
middle-
income
groupCountry data
18.2 22.8 2,5615.2 6.5 1,0149.2 10.8 5.3
1,520 .. 2,0744.7 .. 5.8
19.5 .. 17.036.2 .. 32.1
8.0 .. 17.144.3 .. 51.1
7.2 36.7
52.2 46.7
40.4 .. 27.141.6 .. 31.2
.. 175
43 13 2212 7 7
336 336 31521 18 254.1 4.1 2.9
.. 23.0 15.90.1 0.6
0.0 0.0 1.1
.. .... .... .... .... .... ..
583 744 402,6681.7 .. 2.1
23.0 .. 25.511.9 .. 18.8
.. .. ..
46.2 .. 47.1
.. .. 10.3
.. .. 4.514.8 .. 41.5–3.5 ..–1.0 3.7 7.1
17 5 2,437
539 796 62,2681,514 1,715 736
.. ..16.2 56.1 85.2
5.6 26.2 21.2
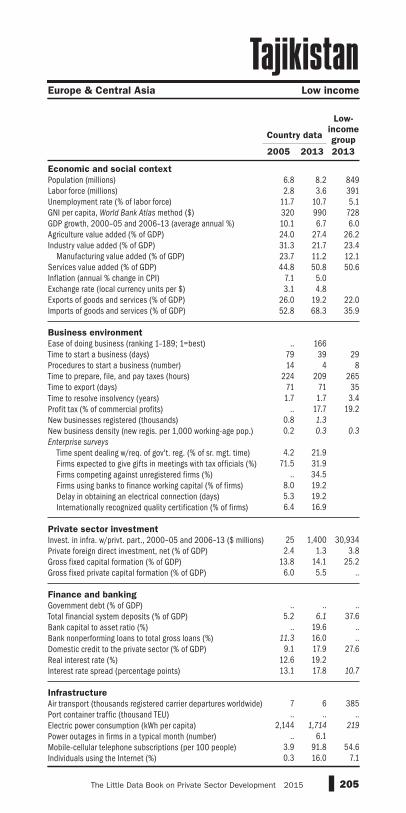
205The Little Data Book on Private Sector Development 2015
Economic and social context
Population (millions)Labor force (millions)Unemployment rate (% of labor force)GNI per capita, World Bank Atlas method ($)GDP growth, 2000–05 and 2006–13 (average annual %)Agriculture value added (% of GDP)Industry value added (% of GDP) Manufacturing value added (% of GDP)Services value added (% of GDP)Inflation (annual % change in CPI)Exchange rate (local currency units per $)Exports of goods and services (% of GDP)Imports of goods and services (% of GDP)
Business environment
Ease of doing business (ranking 1–189; 1=best)Time to start a business (days)Procedures to start a business (number)Time to prepare, file, and pay taxes (hours)Time to export (days)Time to resolve insolvency (years)Profit tax (% of commercial profits)New businesses registered (thousands)New business density (new regis. per 1,000 working-age pop.)Enterprise surveys
Time spent dealing w/req. of gov't. reg. (% of sr. mgt. time) Firms expected to give gifts in meetings with tax officials (%) Firms competing against unregistered firms (%) Firms using banks to finance working capital (% of firms) Delay in obtaining an electrical connection (days) Internationally recognized quality certification (% of firms)
Private sector investment
Invest. in infra. w/privt. part., 2000–05 and 2006–13 ($ millions)Private foreign direct investment, net (% of GDP)Gross fixed capital formation (% of GDP)Gross fixed private capital formation (% of GDP)
Finance and banking
Government debt (% of GDP)Total financial system deposits (% of GDP)Bank capital to asset ratio (%)Bank nonperforming loans to total gross loans (%)Domestic credit to the private sector (% of GDP)Real interest rate (%)Interest rate spread (percentage points)
Infrastructure
Air transport (thousands registered carrier departures worldwide)Port container traffic (thousand TEU)Electric power consumption (kWh per capita)Power outages in firms in a typical month (number)Mobile-cellular telephone subscriptions (per 100 people)Individuals using the Internet (%)
Europe & Central Asia Low income
Tajikistan
2005 2013 2013
Low-
income
groupCountry data
6.8 8.2 8492.8 3.6 391
11.7 10.7 5.1320 990 72810.1 6.7 6.024.0 27.4 26.231.3 21.7 23.423.7 11.2 12.144.8 50.8 50.6
7.1 5.03.1 4.8
26.0 19.2 22.052.8 68.3 35.9
.. 166
79 39 2914 4 8
224 209 26571 71 351.7 1.7 3.4
.. 17.7 19.20.8 1.3
0.2 0.3 0.3
4.2 21.9
71.5 31.9.. 34.5
8.0 19.25.3 19.26.4 16.9
25 1,400 30,9342.4 1.3 3.8
13.8 14.1 25.26.0 5.5 ..
.. .. ..
5.2 6.1 37.6.. 19.6 ..
11.3 16.0 ..9.1 17.9 27.6
12.6 19.213.1 17.8 10.7
7 6 385.. .. ..
2,144 1,714 219
.. 6.13.9 91.8 54.60.3 16.0 7.1

206 2015 The Little Data Book on Private Sector Development
Economic and social context
Population (millions)Labor force (millions)Unemployment rate (% of labor force)GNI per capita, World Bank Atlas method ($)GDP growth, 2000–05 and 2006–13 (average annual %)Agriculture value added (% of GDP)Industry value added (% of GDP) Manufacturing value added (% of GDP)Services value added (% of GDP)Inflation (annual % change in CPI)Exchange rate (local currency units per $)Exports of goods and services (% of GDP)Imports of goods and services (% of GDP)
Business environment
Ease of doing business (ranking 1–189; 1=best)Time to start a business (days)Procedures to start a business (number)Time to prepare, file, and pay taxes (hours)Time to export (days)Time to resolve insolvency (years)Profit tax (% of commercial profits)New businesses registered (thousands)New business density (new regis. per 1,000 working-age pop.)Enterprise surveys
Time spent dealing w/req. of gov't. reg. (% of sr. mgt. time) Firms expected to give gifts in meetings with tax officials (%) Firms competing against unregistered firms (%) Firms using banks to finance working capital (% of firms) Delay in obtaining an electrical connection (days) Internationally recognized quality certification (% of firms)
Private sector investment
Invest. in infra. w/privt. part., 2000–05 and 2006–13 ($ millions)Private foreign direct investment, net (% of GDP)Gross fixed capital formation (% of GDP)Gross fixed private capital formation (% of GDP)
Finance and banking
Government debt (% of GDP)Total financial system deposits (% of GDP)Bank capital to asset ratio (%)Bank nonperforming loans to total gross loans (%)Domestic credit to the private sector (% of GDP)Real interest rate (%)Interest rate spread (percentage points)
Infrastructure
Air transport (thousands registered carrier departures worldwide)Port container traffic (thousand TEU)Electric power consumption (kWh per capita)Power outages in firms in a typical month (number)Mobile-cellular telephone subscriptions (per 100 people)Individuals using the Internet (%)
Sub-Saharan Africa Low income
Tanzania
2005 2013 2013
Low-
income
groupCountry data
38.8 49.3 84919.2 24.2 391
2.5 3.5 5.1380 860 7287.1 6.3 6.0
31.8 33.8 26.222.7 23.2 23.4
8.7 7.4 12.145.5 43.0 50.6
5.0 7.91,128.9 1,600.4
20.8 17.9 22.029.7 31.6 35.9
.. 131
34 26 2911 9 8
172 181 26530 18 353.0 3.0 3.4
.. 20.7 19.2
.. ..
.. .. 0.3
4.0 2.0
14.7 14.666.8 72.617.3 14.744.3 52.614.7 17.6
899 3,469 30,9346.6 4.3 3.8
24.7 30.0 25.218.7 .. ..
.. .. ..
21.0 19.1 37.6.. .. ..
9.2 5.1 ..10.2 13.1 27.68.3 9.1
10.5 6.0 10.7
6 32 385
351 526 ..68 92 219
9.1 8.97.6 55.7 54.61.1 4.4 7.1

207The Little Data Book on Private Sector Development 2015
Economic and social context
Population (millions)Labor force (millions)Unemployment rate (% of labor force)GNI per capita, World Bank Atlas method ($)GDP growth, 2000–05 and 2006–13 (average annual %)Agriculture value added (% of GDP)Industry value added (% of GDP) Manufacturing value added (% of GDP)Services value added (% of GDP)Inflation (annual % change in CPI)Exchange rate (local currency units per $)Exports of goods and services (% of GDP)Imports of goods and services (% of GDP)
Business environment
Ease of doing business (ranking 1–189; 1=best)Time to start a business (days)Procedures to start a business (number)Time to prepare, file, and pay taxes (hours)Time to export (days)Time to resolve insolvency (years)Profit tax (% of commercial profits)New businesses registered (thousands)New business density (new regis. per 1,000 working-age pop.)Enterprise surveys
Time spent dealing w/req. of gov't. reg. (% of sr. mgt. time) Firms expected to give gifts in meetings with tax officials (%) Firms competing against unregistered firms (%) Firms using banks to finance working capital (% of firms) Delay in obtaining an electrical connection (days) Internationally recognized quality certification (% of firms)
Private sector investment
Invest. in infra. w/privt. part., 2000–05 and 2006–13 ($ millions)Private foreign direct investment, net (% of GDP)Gross fixed capital formation (% of GDP)Gross fixed private capital formation (% of GDP)
Finance and banking
Government debt (% of GDP)Total financial system deposits (% of GDP)Bank capital to asset ratio (%)Bank nonperforming loans to total gross loans (%)Domestic credit to the private sector (% of GDP)Real interest rate (%)Interest rate spread (percentage points)
Infrastructure
Air transport (thousands registered carrier departures worldwide)Port container traffic (thousand TEU)Electric power consumption (kWh per capita)Power outages in firms in a typical month (number)Mobile-cellular telephone subscriptions (per 100 people)Individuals using the Internet (%)
East Asia & Pacific Upper middle income
Thailand
2005 2013 2013
Upper
middle-
income
groupCountry data
65.6 67.0 2,40937.4 39.7 1,2641.3 0.7 5.9
2,600 5,340 7,6045.5 3.0 5.7
10.3 12.0 7.644.0 42.5 36.734.7 32.9 23.045.8 45.5 55.6
4.5 2.240.2 30.773.6 73.6 30.374.7 70.3 30.1
.. 26
33 28 268 4 7
264 264 32324 14 202.7 2.7 2.6
.. 19.9 17.532.2 41.2
0.7 0.9 3.0
0.4 ..
.. ..
.. ..71.9 ..27.9 ..39.0 ..
11,760 15,230 426,038
4.6 3.3 3.328.9 26.7 31.621.8 21.2 ..
27.3 .. ..
101.5 123.5 48.09.0 10.9 10.79.1 2.3 3.6
100.7 154.4 98.01.2 4.13.9 4.1 6.0
124 285 7,427
5,115 7,702 262,8961,911 2,316 2,932
1.3 ..46.5 140.1 99.815.0 28.9 44.8
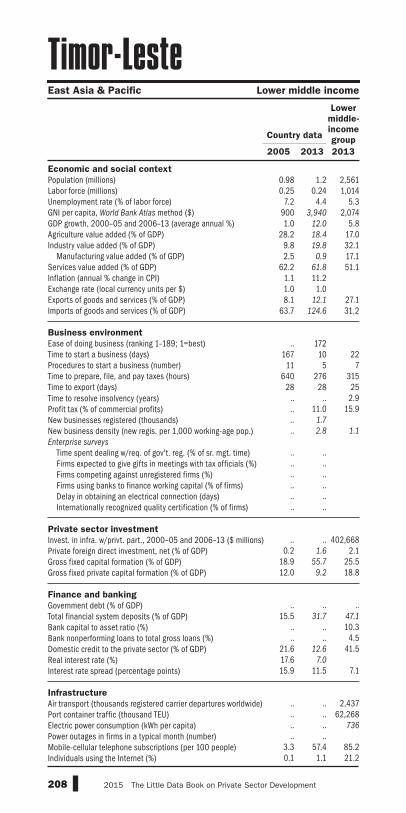
208 2015 The Little Data Book on Private Sector Development
Economic and social context
Population (millions)Labor force (millions)Unemployment rate (% of labor force)GNI per capita, World Bank Atlas method ($)GDP growth, 2000–05 and 2006–13 (average annual %)Agriculture value added (% of GDP)Industry value added (% of GDP) Manufacturing value added (% of GDP)Services value added (% of GDP)Inflation (annual % change in CPI)Exchange rate (local currency units per $)Exports of goods and services (% of GDP)Imports of goods and services (% of GDP)
Business environment
Ease of doing business (ranking 1–189; 1=best)Time to start a business (days)Procedures to start a business (number)Time to prepare, file, and pay taxes (hours)Time to export (days)Time to resolve insolvency (years)Profit tax (% of commercial profits)New businesses registered (thousands)New business density (new regis. per 1,000 working-age pop.)Enterprise surveys
Time spent dealing w/req. of gov't. reg. (% of sr. mgt. time) Firms expected to give gifts in meetings with tax officials (%) Firms competing against unregistered firms (%) Firms using banks to finance working capital (% of firms) Delay in obtaining an electrical connection (days) Internationally recognized quality certification (% of firms)
Private sector investment
Invest. in infra. w/privt. part., 2000–05 and 2006–13 ($ millions)Private foreign direct investment, net (% of GDP)Gross fixed capital formation (% of GDP)Gross fixed private capital formation (% of GDP)
Finance and banking
Government debt (% of GDP)Total financial system deposits (% of GDP)Bank capital to asset ratio (%)Bank nonperforming loans to total gross loans (%)Domestic credit to the private sector (% of GDP)Real interest rate (%)Interest rate spread (percentage points)
Infrastructure
Air transport (thousands registered carrier departures worldwide)Port container traffic (thousand TEU)Electric power consumption (kWh per capita)Power outages in firms in a typical month (number)Mobile-cellular telephone subscriptions (per 100 people)Individuals using the Internet (%)
East Asia & Pacific Lower middle income
Timor-Leste
2005 2013 2013
Lower
middle-
income
groupCountry data
0.98 1.2 2,5610.25 0.24 1,014
7.2 4.4 5.3900 3,940 2,0741.0 12.0 5.8
28.2 18.4 17.09.8 19.8 32.12.5 0.9 17.1
62.2 61.8 51.11.1 11.21.0 1.08.1 12.1 27.1
63.7 124.6 31.2
.. 172
167 10 2211 5 7
640 276 31528 28 25
.. .. 2.9
.. 11.0 15.9
.. 1.7
.. 2.8 1.1
.. .... .... .... .... .... ..
.. .. 402,668
0.2 1.6 2.118.9 55.7 25.512.0 9.2 18.8
.. .. ..
15.5 31.7 47.1
.. .. 10.3
.. .. 4.521.6 12.6 41.517.6 7.0
15.9 11.5 7.1
.. .. 2,437.. .. 62,268.. .. 736
.. ..3.3 57.4 85.20.1 1.1 21.2
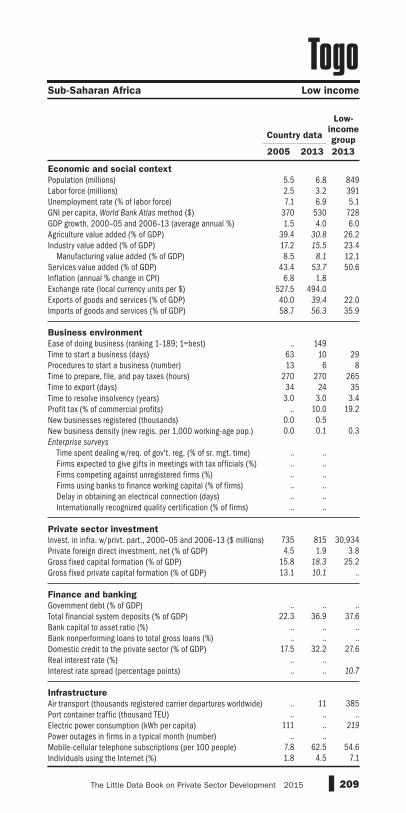
209The Little Data Book on Private Sector Development 2015
Economic and social context
Population (millions)Labor force (millions)Unemployment rate (% of labor force)GNI per capita, World Bank Atlas method ($)GDP growth, 2000–05 and 2006–13 (average annual %)Agriculture value added (% of GDP)Industry value added (% of GDP) Manufacturing value added (% of GDP)Services value added (% of GDP)Inflation (annual % change in CPI)Exchange rate (local currency units per $)Exports of goods and services (% of GDP)Imports of goods and services (% of GDP)
Business environment
Ease of doing business (ranking 1–189; 1=best)Time to start a business (days)Procedures to start a business (number)Time to prepare, file, and pay taxes (hours)Time to export (days)Time to resolve insolvency (years)Profit tax (% of commercial profits)New businesses registered (thousands)New business density (new regis. per 1,000 working-age pop.)Enterprise surveys
Time spent dealing w/req. of gov't. reg. (% of sr. mgt. time) Firms expected to give gifts in meetings with tax officials (%) Firms competing against unregistered firms (%) Firms using banks to finance working capital (% of firms) Delay in obtaining an electrical connection (days) Internationally recognized quality certification (% of firms)
Private sector investment
Invest. in infra. w/privt. part., 2000–05 and 2006–13 ($ millions)Private foreign direct investment, net (% of GDP)Gross fixed capital formation (% of GDP)Gross fixed private capital formation (% of GDP)
Finance and banking
Government debt (% of GDP)Total financial system deposits (% of GDP)Bank capital to asset ratio (%)Bank nonperforming loans to total gross loans (%)Domestic credit to the private sector (% of GDP)Real interest rate (%)Interest rate spread (percentage points)
Infrastructure
Air transport (thousands registered carrier departures worldwide)Port container traffic (thousand TEU)Electric power consumption (kWh per capita)Power outages in firms in a typical month (number)Mobile-cellular telephone subscriptions (per 100 people)Individuals using the Internet (%)
Sub-Saharan Africa Low income
Togo
2005 2013 2013
Low-
income
groupCountry data
5.5 6.8 8492.5 3.2 3917.1 6.9 5.1
370 530 7281.5 4.0 6.0
39.4 30.8 26.217.2 15.5 23.48.5 8.1 12.1
43.4 53.7 50.66.8 1.8
527.5 494.040.0 39.4 22.058.7 56.3 35.9
.. 149
63 10 2913 6 8
270 270 26534 24 353.0 3.0 3.4
.. 10.0 19.20.0 0.50.0 0.1 0.3
.. .... .... .... .... .... ..
735 815 30,9344.5 1.9 3.8
15.8 18.3 25.213.1 10.1 ..
.. .. ..
22.3 36.9 37.6.. .. .... .. ..
17.5 32.2 27.6.. .... .. 10.7
.. 11 385.. .. ..
111 .. 219
.. ..7.8 62.5 54.61.8 4.5 7.1

210 2015 The Little Data Book on Private Sector Development
Economic and social context
Population (millions)Labor force (millions)Unemployment rate (% of labor force)GNI per capita, World Bank Atlas method ($)GDP growth, 2000–05 and 2006–13 (average annual %)Agriculture value added (% of GDP)Industry value added (% of GDP) Manufacturing value added (% of GDP)Services value added (% of GDP)Inflation (annual % change in CPI)Exchange rate (local currency units per $)Exports of goods and services (% of GDP)Imports of goods and services (% of GDP)
Business environment
Ease of doing business (ranking 1–189; 1=best)Time to start a business (days)Procedures to start a business (number)Time to prepare, file, and pay taxes (hours)Time to export (days)Time to resolve insolvency (years)Profit tax (% of commercial profits)New businesses registered (thousands)New business density (new regis. per 1,000 working-age pop.)Enterprise surveys
Time spent dealing w/req. of gov't. reg. (% of sr. mgt. time) Firms expected to give gifts in meetings with tax officials (%) Firms competing against unregistered firms (%) Firms using banks to finance working capital (% of firms) Delay in obtaining an electrical connection (days) Internationally recognized quality certification (% of firms)
Private sector investment
Invest. in infra. w/privt. part., 2000–05 and 2006–13 ($ millions)Private foreign direct investment, net (% of GDP)Gross fixed capital formation (% of GDP)Gross fixed private capital formation (% of GDP)
Finance and banking
Government debt (% of GDP)Total financial system deposits (% of GDP)Bank capital to asset ratio (%)Bank nonperforming loans to total gross loans (%)Domestic credit to the private sector (% of GDP)Real interest rate (%)Interest rate spread (percentage points)
Infrastructure
Air transport (thousands registered carrier departures worldwide)Port container traffic (thousand TEU)Electric power consumption (kWh per capita)Power outages in firms in a typical month (number)Mobile-cellular telephone subscriptions (per 100 people)Individuals using the Internet (%)
East Asia & Pacific Upper middle income
Tonga
2005 2013 2013
Upper
middle-
income
groupCountry data
0.10 0.11 2,4090.04 0.04 1,264
.. .. 5.92,550 4,490 7,604
2.4 1.7 5.720.5 19.2 7.619.4 21.5 36.78.6 6.4 23.0
60.0 59.3 55.68.3 0.71.9 1.7
17.6 17.8 30.357.7 62.7 30.1
.. 69
32 16 264 4 7
164 200 32321 22 202.7 2.7 2.6
.. 23.8 17.50.1 0.1
2.3 1.9 3.0
.. .... .... .... .... .... ..
32 6 426,0382.7 2.5 3.3
21.9 33.1 31.6.. .. ..
.. .. ..
43.2 37.3 48.0.. .. 10.7.. .. 3.6
52.2 28.2 98.05.5 9.05.5 6.9 6.0
5 .. 7,427.. .. 262,896.. .. 2,932
.. ..29.6 54.6 99.84.9 35.0 44.8
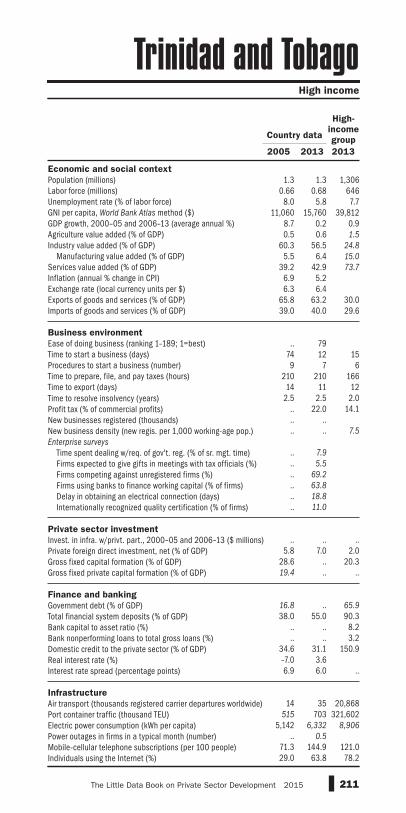
211The Little Data Book on Private Sector Development 2015
Economic and social context
Population (millions)Labor force (millions)Unemployment rate (% of labor force)GNI per capita, World Bank Atlas method ($)GDP growth, 2000–05 and 2006–13 (average annual %)Agriculture value added (% of GDP)Industry value added (% of GDP) Manufacturing value added (% of GDP)Services value added (% of GDP)Inflation (annual % change in CPI)Exchange rate (local currency units per $)Exports of goods and services (% of GDP)Imports of goods and services (% of GDP)
Business environment
Ease of doing business (ranking 1–189; 1=best)Time to start a business (days)Procedures to start a business (number)Time to prepare, file, and pay taxes (hours)Time to export (days)Time to resolve insolvency (years)Profit tax (% of commercial profits)New businesses registered (thousands)New business density (new regis. per 1,000 working-age pop.)Enterprise surveys
Time spent dealing w/req. of gov't. reg. (% of sr. mgt. time) Firms expected to give gifts in meetings with tax officials (%) Firms competing against unregistered firms (%) Firms using banks to finance working capital (% of firms) Delay in obtaining an electrical connection (days) Internationally recognized quality certification (% of firms)
Private sector investment
Invest. in infra. w/privt. part., 2000–05 and 2006–13 ($ millions)Private foreign direct investment, net (% of GDP)Gross fixed capital formation (% of GDP)Gross fixed private capital formation (% of GDP)
Finance and banking
Government debt (% of GDP)Total financial system deposits (% of GDP)Bank capital to asset ratio (%)Bank nonperforming loans to total gross loans (%)Domestic credit to the private sector (% of GDP)Real interest rate (%)Interest rate spread (percentage points)
Infrastructure
Air transport (thousands registered carrier departures worldwide)Port container traffic (thousand TEU)Electric power consumption (kWh per capita)Power outages in firms in a typical month (number)Mobile-cellular telephone subscriptions (per 100 people)Individuals using the Internet (%)
High income
Trinidad and Tobago
2005 2013 2013
High-
income
groupCountry data
1.3 1.3 1,3060.66 0.68 646
8.0 5.8 7.711,060 15,760 39,812
8.7 0.2 0.90.5 0.6 1.5
60.3 56.5 24.8
5.5 6.4 15.0
39.2 42.9 73.7
6.9 5.26.3 6.4
65.8 63.2 30.039.0 40.0 29.6
.. 79
74 12 159 7 6
210 210 16614 11 12
2.5 2.5 2.0.. 22.0 14.1.. .... .. 7.5
.. 7.9
.. 5.5
.. 69.2
.. 63.8
.. 18.8
.. 11.0
.. .. ..
5.8 7.0 2.028.6 .. 20.319.4 .. ..
16.8 .. 65.9
38.0 55.0 90.3.. .. 8.2.. .. 3.2
34.6 31.1 150.9–7.0 3.66.9 6.0 ..
14 35 20,868
515 703 321,6025,142 6,332 8,906
.. 0.5
71.3 144.9 121.029.0 63.8 78.2

212 2015 The Little Data Book on Private Sector Development
Economic and social context
Population (millions)Labor force (millions)Unemployment rate (% of labor force)GNI per capita, World Bank Atlas method ($)GDP growth, 2000–05 and 2006–13 (average annual %)Agriculture value added (% of GDP)Industry value added (% of GDP) Manufacturing value added (% of GDP)Services value added (% of GDP)Inflation (annual % change in CPI)Exchange rate (local currency units per $)Exports of goods and services (% of GDP)Imports of goods and services (% of GDP)
Business environment
Ease of doing business (ranking 1–189; 1=best)Time to start a business (days)Procedures to start a business (number)Time to prepare, file, and pay taxes (hours)Time to export (days)Time to resolve insolvency (years)Profit tax (% of commercial profits)New businesses registered (thousands)New business density (new regis. per 1,000 working-age pop.)Enterprise surveys
Time spent dealing w/req. of gov't. reg. (% of sr. mgt. time) Firms expected to give gifts in meetings with tax officials (%) Firms competing against unregistered firms (%) Firms using banks to finance working capital (% of firms) Delay in obtaining an electrical connection (days) Internationally recognized quality certification (% of firms)
Private sector investment
Invest. in infra. w/privt. part., 2000–05 and 2006–13 ($ millions)Private foreign direct investment, net (% of GDP)Gross fixed capital formation (% of GDP)Gross fixed private capital formation (% of GDP)
Finance and banking
Government debt (% of GDP)Total financial system deposits (% of GDP)Bank capital to asset ratio (%)Bank nonperforming loans to total gross loans (%)Domestic credit to the private sector (% of GDP)Real interest rate (%)Interest rate spread (percentage points)
Infrastructure
Air transport (thousands registered carrier departures worldwide)Port container traffic (thousand TEU)Electric power consumption (kWh per capita)Power outages in firms in a typical month (number)Mobile-cellular telephone subscriptions (per 100 people)Individuals using the Internet (%)
Middle East & North Africa Lower middle income
Tunisia
2005 2013 2013
Lower
middle-
income
groupCountry data
10.0 10.9 2,5613.4 4.0 1,014
14.2 13.3 5.33,190 4,200 2,074
4.2 3.2 5.810.1 8.6 17.029.3 30.0 32.117.4 17.0 17.160.6 61.4 51.1
2.0 5.81.3 1.6
44.9 47.0 27.145.3 56.2 31.2
.. 60
11 11 2210 10 7
268 144 31516 16 25
1.3 1.3 2.9.. 15.4 15.9
5.6 11.3
0.8 1.5 1.1
.. 46.5.. 4.9.. 45.2.. 44.7.. 89.3.. 16.8
781 5,239 402,6682.2 2.3 2.1
21.3 20.2 25.518.3 .. 18.8
52.4 44.5 ..43.9 55.4 47.1
7.7 .. 10.320.9 .. 4.558.3 75.7 41.5
.. ..
.. .. 7.1
21 43 2,437
421 572 62,2681,092 1,297 736
.. 0.356.5 115.6 85.2
9.7 43.8 21.2

213The Little Data Book on Private Sector Development 2015
Economic and social context
Population (millions)Labor force (millions)Unemployment rate (% of labor force)GNI per capita, World Bank Atlas method ($)GDP growth, 2000–05 and 2006–13 (average annual %)Agriculture value added (% of GDP)Industry value added (% of GDP) Manufacturing value added (% of GDP)Services value added (% of GDP)Inflation (annual % change in CPI)Exchange rate (local currency units per $)Exports of goods and services (% of GDP)Imports of goods and services (% of GDP)
Business environment
Ease of doing business (ranking 1–189; 1=best)Time to start a business (days)Procedures to start a business (number)Time to prepare, file, and pay taxes (hours)Time to export (days)Time to resolve insolvency (years)Profit tax (% of commercial profits)New businesses registered (thousands)New business density (new regis. per 1,000 working-age pop.)Enterprise surveys
Time spent dealing w/req. of gov't. reg. (% of sr. mgt. time) Firms expected to give gifts in meetings with tax officials (%) Firms competing against unregistered firms (%) Firms using banks to finance working capital (% of firms) Delay in obtaining an electrical connection (days) Internationally recognized quality certification (% of firms)
Private sector investment
Invest. in infra. w/privt. part., 2000–05 and 2006–13 ($ millions)Private foreign direct investment, net (% of GDP)Gross fixed capital formation (% of GDP)Gross fixed private capital formation (% of GDP)
Finance and banking
Government debt (% of GDP)Total financial system deposits (% of GDP)Bank capital to asset ratio (%)Bank nonperforming loans to total gross loans (%)Domestic credit to the private sector (% of GDP)Real interest rate (%)Interest rate spread (percentage points)
Infrastructure
Air transport (thousands registered carrier departures worldwide)Port container traffic (thousand TEU)Electric power consumption (kWh per capita)Power outages in firms in a typical month (number)Mobile-cellular telephone subscriptions (per 100 people)Individuals using the Internet (%)
Europe & Central Asia Upper middle income
Turkey
2005 2013 2013
Upper
middle-
income
groupCountry data
67.7 74.9 2,40922.3 27.5 1,26410.6 10.0 5.9
6,520 10,970 7,6045.2 3.5 5.7
10.8 8.5 7.628.5 27.1 36.719.8 17.6 23.060.7 64.4 55.610.1 7.51.3 1.9
21.9 25.6 30.325.4 32.2 30.1
.. 556 7 266 7 7
254 226 32320 13 20
3.3 3.3 2.6.. 18.1 17.5
45.8 38.8
1.0 0.8 3.0
6.3 19.08.4 1.2
.. 40.036.8 42.411.1 8.326.7 32.4
21,742 71,575 426,038
2.1 1.6 3.321.0 20.3 31.617.7 15.6 ..
.. 45.1 ..
37.7 55.0 48.012.3 11.2 10.7
4.3 2.6 3.622.2 70.2 98.0
.. ..
.. .. 6.0
146 566 7,427
3,174 7,284 262,8962,019 2,709 2,932
.. 1.764.4 93.0 99.815.5 46.3 44.8

214 2015 The Little Data Book on Private Sector Development
Economic and social context
Population (millions)Labor force (millions)Unemployment rate (% of labor force)GNI per capita, World Bank Atlas method ($)GDP growth, 2000–05 and 2006–13 (average annual %)Agriculture value added (% of GDP)Industry value added (% of GDP) Manufacturing value added (% of GDP)Services value added (% of GDP)Inflation (annual % change in CPI)Exchange rate (local currency units per $)Exports of goods and services (% of GDP)Imports of goods and services (% of GDP)
Business environment
Ease of doing business (ranking 1–189; 1=best)Time to start a business (days)Procedures to start a business (number)Time to prepare, file, and pay taxes (hours)Time to export (days)Time to resolve insolvency (years)Profit tax (% of commercial profits)New businesses registered (thousands)New business density (new regis. per 1,000 working-age pop.)Enterprise surveys
Time spent dealing w/req. of gov't. reg. (% of sr. mgt. time) Firms expected to give gifts in meetings with tax officials (%) Firms competing against unregistered firms (%) Firms using banks to finance working capital (% of firms) Delay in obtaining an electrical connection (days) Internationally recognized quality certification (% of firms)
Private sector investment
Invest. in infra. w/privt. part., 2000–05 and 2006–13 ($ millions)Private foreign direct investment, net (% of GDP)Gross fixed capital formation (% of GDP)Gross fixed private capital formation (% of GDP)
Finance and banking
Government debt (% of GDP)Total financial system deposits (% of GDP)Bank capital to asset ratio (%)Bank nonperforming loans to total gross loans (%)Domestic credit to the private sector (% of GDP)Real interest rate (%)Interest rate spread (percentage points)
Infrastructure
Air transport (thousands registered carrier departures worldwide)Port container traffic (thousand TEU)Electric power consumption (kWh per capita)Power outages in firms in a typical month (number)Mobile-cellular telephone subscriptions (per 100 people)Individuals using the Internet (%)
Europe & Central Asia Upper middle income
Turkmenistan
2005 2013 2013
Upper
middle-
income
groupCountry data
4.7 5.2 2,4091.9 2.3 1,264
11.0 10.6 5.91,600 6,880 7,604
4.5 10.9 5.718.8 14.5 7.637.6 48.4 36.721.7 .. 23.043.6 37.0 55.6
.. ..2.2 2.9
65.0 73.3 30.347.8 44.4 30.1
.. .... .. 26.. .. 7.. .. 323.. .. 20.. .. 2.6.. .. 17.5.. .... .. 3.0
.. .... .... .... .... .... ..
20 219 426,038
5.2 7.3 3.322.9 47.2 31.622.7 10.5 ..
.. .. .... .. 48.0.. .. 10.7.. 0.0 3.6.. .. 98.0.. .... .. 6.0
14 1 7,427
.. .. 262,8962,055 2,444 2,932
.. ..2.2 116.9 99.81.0 9.6 44.8
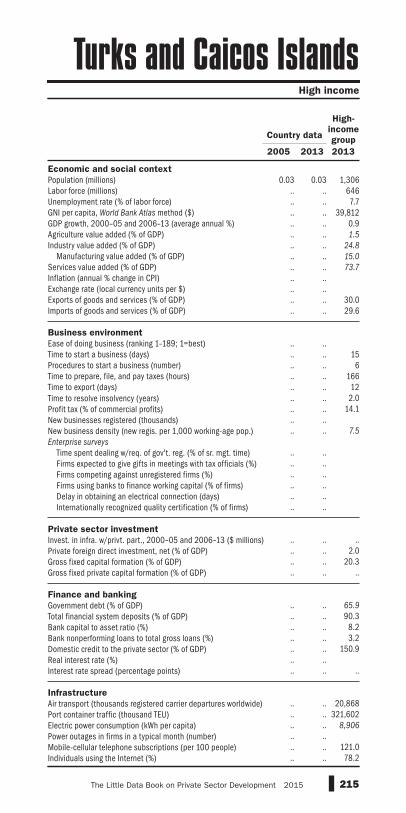
215The Little Data Book on Private Sector Development 2015
Economic and social context
Population (millions)Labor force (millions)Unemployment rate (% of labor force)GNI per capita, World Bank Atlas method ($)GDP growth, 2000–05 and 2006–13 (average annual %)Agriculture value added (% of GDP)Industry value added (% of GDP) Manufacturing value added (% of GDP)Services value added (% of GDP)Inflation (annual % change in CPI)Exchange rate (local currency units per $)Exports of goods and services (% of GDP)Imports of goods and services (% of GDP)
Business environment
Ease of doing business (ranking 1–189; 1=best)Time to start a business (days)Procedures to start a business (number)Time to prepare, file, and pay taxes (hours)Time to export (days)Time to resolve insolvency (years)Profit tax (% of commercial profits)New businesses registered (thousands)New business density (new regis. per 1,000 working-age pop.)Enterprise surveys
Time spent dealing w/req. of gov't. reg. (% of sr. mgt. time) Firms expected to give gifts in meetings with tax officials (%) Firms competing against unregistered firms (%) Firms using banks to finance working capital (% of firms) Delay in obtaining an electrical connection (days) Internationally recognized quality certification (% of firms)
Private sector investment
Invest. in infra. w/privt. part., 2000–05 and 2006–13 ($ millions)Private foreign direct investment, net (% of GDP)Gross fixed capital formation (% of GDP)Gross fixed private capital formation (% of GDP)
Finance and banking
Government debt (% of GDP)Total financial system deposits (% of GDP)Bank capital to asset ratio (%)Bank nonperforming loans to total gross loans (%)Domestic credit to the private sector (% of GDP)Real interest rate (%)Interest rate spread (percentage points)
Infrastructure
Air transport (thousands registered carrier departures worldwide)Port container traffic (thousand TEU)Electric power consumption (kWh per capita)Power outages in firms in a typical month (number)Mobile-cellular telephone subscriptions (per 100 people)Individuals using the Internet (%)
High income
Turks and Caicos Islands
2005 2013 2013
High-
income
groupCountry data
0.03 0.03 1,306.. .. 646.. .. 7.7.. .. 39,812.. .. 0.9.. .. 1.5
.. .. 24.8
.. .. 15.0
.. .. 73.7
.. ..
.. ..
.. .. 30.0
.. .. 29.6
.. .... .. 15.. .. 6.. .. 166.. .. 12.. .. 2.0.. .. 14.1.. .... .. 7.5
.. .... .... .... .... .... ..
.. .. .... .. 2.0.. .. 20.3.. .. .. .. .. 65.9
.. .. 90.3
.. .. 8.2
.. .. 3.2
.. .. 150.9
.. ..
.. .. ..
.. .. 20,868.. .. 321,602.. .. 8,906
.. ..
.. .. 121.0
.. .. 78.2

216 2015 The Little Data Book on Private Sector Development
Economic and social context
Population (millions)Labor force (millions)Unemployment rate (% of labor force)GNI per capita, World Bank Atlas method ($)GDP growth, 2000–05 and 2006–13 (average annual %)Agriculture value added (% of GDP)Industry value added (% of GDP) Manufacturing value added (% of GDP)Services value added (% of GDP)Inflation (annual % change in CPI)Exchange rate (local currency units per $)Exports of goods and services (% of GDP)Imports of goods and services (% of GDP)
Business environment
Ease of doing business (ranking 1–189; 1=best)Time to start a business (days)Procedures to start a business (number)Time to prepare, file, and pay taxes (hours)Time to export (days)Time to resolve insolvency (years)Profit tax (% of commercial profits)New businesses registered (thousands)New business density (new regis. per 1,000 working-age pop.)Enterprise surveys
Time spent dealing w/req. of gov't. reg. (% of sr. mgt. time) Firms expected to give gifts in meetings with tax officials (%) Firms competing against unregistered firms (%) Firms using banks to finance working capital (% of firms) Delay in obtaining an electrical connection (days) Internationally recognized quality certification (% of firms)
Private sector investment
Invest. in infra. w/privt. part., 2000–05 and 2006–13 ($ millions)Private foreign direct investment, net (% of GDP)Gross fixed capital formation (% of GDP)Gross fixed private capital formation (% of GDP)
Finance and banking
Government debt (% of GDP)Total financial system deposits (% of GDP)Bank capital to asset ratio (%)Bank nonperforming loans to total gross loans (%)Domestic credit to the private sector (% of GDP)Real interest rate (%)Interest rate spread (percentage points)
Infrastructure
Air transport (thousands registered carrier departures worldwide)Port container traffic (thousand TEU)Electric power consumption (kWh per capita)Power outages in firms in a typical month (number)Mobile-cellular telephone subscriptions (per 100 people)Individuals using the Internet (%)
East Asia & Pacific Upper middle income
Tuvalu
2005 2013 2013
Upper
middle-
income
groupCountry data
0.01 0.01 2,409.. .. 1,264.. .. 5.9
3,740 5,840 7,6040.2 1.9 5.7
22.6 22.2 7.68.6 8.7 36.70.9 1.2 23.0
68.8 69.1 55.6.. ..
1.3 1.0.. .. 30.3.. .. 30.1
.. .... .. 26.. .. 7.. .. 323.. .. 20.. .. 2.6.. .. 17.5.. .... .. 3.0
.. .... .... .... .... .... ..
.. .. 426,038
–0.1 0.9 3.3.. .. 31.6.. .. ..
.. .. .... .. 48.0.. .. 10.7.. .. 3.6.. .. 98.0.. .... .. 6.0
.. .. 7,427.. .. 262,896.. .. 2,932
.. ..13.4 34.4 99.810.0 37.0 44.8

217The Little Data Book on Private Sector Development 2015
Economic and social context
Population (millions)Labor force (millions)Unemployment rate (% of labor force)GNI per capita, World Bank Atlas method ($)GDP growth, 2000–05 and 2006–13 (average annual %)Agriculture value added (% of GDP)Industry value added (% of GDP) Manufacturing value added (% of GDP)Services value added (% of GDP)Inflation (annual % change in CPI)Exchange rate (local currency units per $)Exports of goods and services (% of GDP)Imports of goods and services (% of GDP)
Business environment
Ease of doing business (ranking 1–189; 1=best)Time to start a business (days)Procedures to start a business (number)Time to prepare, file, and pay taxes (hours)Time to export (days)Time to resolve insolvency (years)Profit tax (% of commercial profits)New businesses registered (thousands)New business density (new regis. per 1,000 working-age pop.)Enterprise surveys
Time spent dealing w/req. of gov't. reg. (% of sr. mgt. time) Firms expected to give gifts in meetings with tax officials (%) Firms competing against unregistered firms (%) Firms using banks to finance working capital (% of firms) Delay in obtaining an electrical connection (days) Internationally recognized quality certification (% of firms)
Private sector investment
Invest. in infra. w/privt. part., 2000–05 and 2006–13 ($ millions)Private foreign direct investment, net (% of GDP)Gross fixed capital formation (% of GDP)Gross fixed private capital formation (% of GDP)
Finance and banking
Government debt (% of GDP)Total financial system deposits (% of GDP)Bank capital to asset ratio (%)Bank nonperforming loans to total gross loans (%)Domestic credit to the private sector (% of GDP)Real interest rate (%)Interest rate spread (percentage points)
Infrastructure
Air transport (thousands registered carrier departures worldwide)Port container traffic (thousand TEU)Electric power consumption (kWh per capita)Power outages in firms in a typical month (number)Mobile-cellular telephone subscriptions (per 100 people)Individuals using the Internet (%)
Sub-Saharan Africa Low income
Uganda
2005 2013 2013
Low-
income
groupCountry data
28.7 37.6 84911.4 15.0 3912.0 3.8 5.1
290 600 7286.9 6.8 6.0
26.7 25.3 26.225.0 20.8 23.4
7.5 10.0 12.148.3 54.0 50.6
8.4 5.51,780.7 2,586.9
14.2 20.2 22.024.8 30.5 35.9
.. 150
34 32 2918 15 8
237 209 26538 28 352.2 2.2 3.4
.. 25.2 19.28.2 20.8
0.6 1.2 0.3
5.2 6.5
14.5 14.373.1 95.214.0 21.433.0 18.115.5 11.6
502 3,916 30,9344.2 4.8 3.8
22.2 29.1 25.217.2 22.4 ..
64.9 33.2 ..14.9 17.1 37.611.9 16.1 ..2.3 5.6 ..8.6 13.5 27.6
21.8 18.410.9 11.4 10.7
0 8 385.. .. .... .. 219
10.7 6.34.6 44.1 54.61.7 16.2 7.1

218 2015 The Little Data Book on Private Sector Development
Economic and social context
Population (millions)Labor force (millions)Unemployment rate (% of labor force)GNI per capita, World Bank Atlas method ($)GDP growth, 2000–05 and 2006–13 (average annual %)Agriculture value added (% of GDP)Industry value added (% of GDP) Manufacturing value added (% of GDP)Services value added (% of GDP)Inflation (annual % change in CPI)Exchange rate (local currency units per $)Exports of goods and services (% of GDP)Imports of goods and services (% of GDP)
Business environment
Ease of doing business (ranking 1–189; 1=best)Time to start a business (days)Procedures to start a business (number)Time to prepare, file, and pay taxes (hours)Time to export (days)Time to resolve insolvency (years)Profit tax (% of commercial profits)New businesses registered (thousands)New business density (new regis. per 1,000 working-age pop.)Enterprise surveys
Time spent dealing w/req. of gov't. reg. (% of sr. mgt. time) Firms expected to give gifts in meetings with tax officials (%) Firms competing against unregistered firms (%) Firms using banks to finance working capital (% of firms) Delay in obtaining an electrical connection (days) Internationally recognized quality certification (% of firms)
Private sector investment
Invest. in infra. w/privt. part., 2000–05 and 2006–13 ($ millions)Private foreign direct investment, net (% of GDP)Gross fixed capital formation (% of GDP)Gross fixed private capital formation (% of GDP)
Finance and banking
Government debt (% of GDP)Total financial system deposits (% of GDP)Bank capital to asset ratio (%)Bank nonperforming loans to total gross loans (%)Domestic credit to the private sector (% of GDP)Real interest rate (%)Interest rate spread (percentage points)
Infrastructure
Air transport (thousands registered carrier departures worldwide)Port container traffic (thousand TEU)Electric power consumption (kWh per capita)Power outages in firms in a typical month (number)Mobile-cellular telephone subscriptions (per 100 people)Individuals using the Internet (%)
Europe & Central Asia Lower middle income
Ukraine
2005 2013 2013
Lower
middle-
income
groupCountry data
47.1 45.5 2,56123.3 23.1 1,014
7.2 7.9 5.31,540 3,960 2,074
8.0 0.0 5.810.4 10.4 17.032.3 26.9 32.119.6 13.7 17.157.3 62.6 51.113.6 –0.3
5.1 8.251.5 46.9 27.150.6 55.4 31.2
.. 96
34 21 2215 6 7
2,085 350 31530 29 252.9 2.9 2.9
.. 9.7 15.927.7 29.7
0.8 0.9 1.1
8.0 19.6
49.5 50.0.. 50.1
27.3 14.833.5 6.712.9 16.6
3,443 9,716 402,668
9.1 2.5 2.122.0 18.2 25.520.1 17.0 18.8
.. 33.5 ..
30.1 45.8 47.1
11.9 15.1 10.358.0 12.9 4.532.2 74.0 41.5–6.7 15.37.6 5.9 7.1
42 67 2,437
579 808 62,2683,246 3,662 736
.. 0.363.7 138.1 85.2
3.7 41.8 21.2
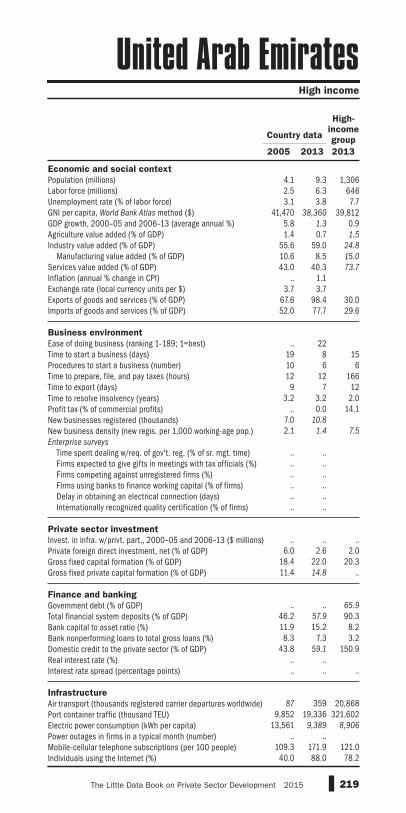
219The Little Data Book on Private Sector Development 2015
Economic and social context
Population (millions)Labor force (millions)Unemployment rate (% of labor force)GNI per capita, World Bank Atlas method ($)GDP growth, 2000–05 and 2006–13 (average annual %)Agriculture value added (% of GDP)Industry value added (% of GDP) Manufacturing value added (% of GDP)Services value added (% of GDP)Inflation (annual % change in CPI)Exchange rate (local currency units per $)Exports of goods and services (% of GDP)Imports of goods and services (% of GDP)
Business environment
Ease of doing business (ranking 1–189; 1=best)Time to start a business (days)Procedures to start a business (number)Time to prepare, file, and pay taxes (hours)Time to export (days)Time to resolve insolvency (years)Profit tax (% of commercial profits)New businesses registered (thousands)New business density (new regis. per 1,000 working-age pop.)Enterprise surveys
Time spent dealing w/req. of gov't. reg. (% of sr. mgt. time) Firms expected to give gifts in meetings with tax officials (%) Firms competing against unregistered firms (%) Firms using banks to finance working capital (% of firms) Delay in obtaining an electrical connection (days) Internationally recognized quality certification (% of firms)
Private sector investment
Invest. in infra. w/privt. part., 2000–05 and 2006–13 ($ millions)Private foreign direct investment, net (% of GDP)Gross fixed capital formation (% of GDP)Gross fixed private capital formation (% of GDP)
Finance and banking
Government debt (% of GDP)Total financial system deposits (% of GDP)Bank capital to asset ratio (%)Bank nonperforming loans to total gross loans (%)Domestic credit to the private sector (% of GDP)Real interest rate (%)Interest rate spread (percentage points)
Infrastructure
Air transport (thousands registered carrier departures worldwide)Port container traffic (thousand TEU)Electric power consumption (kWh per capita)Power outages in firms in a typical month (number)Mobile-cellular telephone subscriptions (per 100 people)Individuals using the Internet (%)
High income
United Arab Emirates
2005 2013 2013
High-
income
groupCountry data
4.1 9.3 1,3062.5 6.3 6463.1 3.8 7.7
41,470 38,360 39,8125.8 1.3 0.91.4 0.7 1.5
55.6 59.0 24.8
10.6 8.5 15.0
43.0 40.3 73.7
.. 1.13.7 3.7
67.6 98.4 30.052.0 77.7 29.6
.. 22
19 8 1510 6 612 12 166
9 7 123.2 3.2 2.0
.. 0.0 14.17.0 10.8
2.1 1.4 7.5
.. .... .... .... .... .... ..
.. .. ..
6.0 2.6 2.018.4 22.0 20.311.4 14.8 ..
.. .. 65.9
46.2 57.9 90.311.9 15.2 8.28.3 7.3 3.2
43.8 59.1 150.9.. .... .. ..
87 359 20,868
9,852 19,336 321,60213,561 9,389 8,906
.. ..109.3 171.9 121.040.0 88.0 78.2
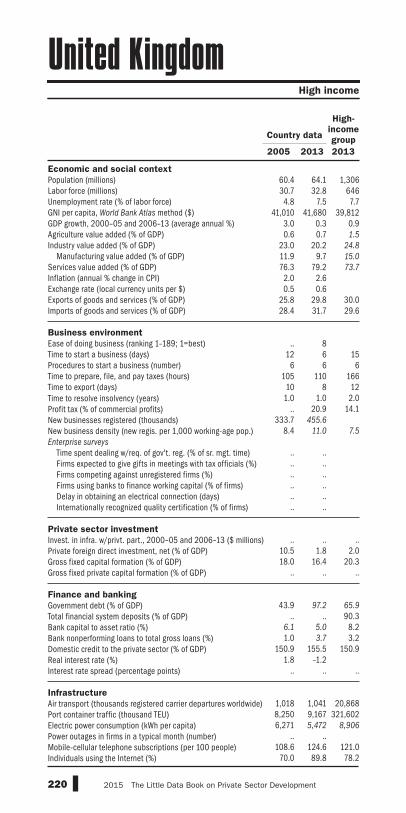
220 2015 The Little Data Book on Private Sector Development
Economic and social context
Population (millions)Labor force (millions)Unemployment rate (% of labor force)GNI per capita, World Bank Atlas method ($)GDP growth, 2000–05 and 2006–13 (average annual %)Agriculture value added (% of GDP)Industry value added (% of GDP) Manufacturing value added (% of GDP)Services value added (% of GDP)Inflation (annual % change in CPI)Exchange rate (local currency units per $)Exports of goods and services (% of GDP)Imports of goods and services (% of GDP)
Business environment
Ease of doing business (ranking 1–189; 1=best)Time to start a business (days)Procedures to start a business (number)Time to prepare, file, and pay taxes (hours)Time to export (days)Time to resolve insolvency (years)Profit tax (% of commercial profits)New businesses registered (thousands)New business density (new regis. per 1,000 working-age pop.)Enterprise surveys
Time spent dealing w/req. of gov't. reg. (% of sr. mgt. time) Firms expected to give gifts in meetings with tax officials (%) Firms competing against unregistered firms (%) Firms using banks to finance working capital (% of firms) Delay in obtaining an electrical connection (days) Internationally recognized quality certification (% of firms)
Private sector investment
Invest. in infra. w/privt. part., 2000–05 and 2006–13 ($ millions)Private foreign direct investment, net (% of GDP)Gross fixed capital formation (% of GDP)Gross fixed private capital formation (% of GDP)
Finance and banking
Government debt (% of GDP)Total financial system deposits (% of GDP)Bank capital to asset ratio (%)Bank nonperforming loans to total gross loans (%)Domestic credit to the private sector (% of GDP)Real interest rate (%)Interest rate spread (percentage points)
Infrastructure
Air transport (thousands registered carrier departures worldwide)Port container traffic (thousand TEU)Electric power consumption (kWh per capita)Power outages in firms in a typical month (number)Mobile-cellular telephone subscriptions (per 100 people)Individuals using the Internet (%)
High income
United Kingdom
2005 2013 2013
High-
income
groupCountry data
60.4 64.1 1,30630.7 32.8 6464.8 7.5 7.7
41,010 41,680 39,8123.0 0.3 0.90.6 0.7 1.5
23.0 20.2 24.8
11.9 9.7 15.0
76.3 79.2 73.7
2.0 2.60.5 0.6
25.8 29.8 30.028.4 31.7 29.6
.. 8
12 6 156 6 6
105 110 16610 8 12
1.0 1.0 2.0.. 20.9 14.1
333.7 455.6
8.4 11.0 7.5
.. .... .... .... .... .... ..
.. .. ..
10.5 1.8 2.018.0 16.4 20.3
.. .. ..
43.9 97.2 65.9
.. .. 90.36.1 5.0 8.21.0 3.7 3.2
150.9 155.5 150.91.8 –1.2
.. .. ..
1,018 1,041 20,8688,250 9,167 321,6026,271 5,472 8,906
.. ..108.6 124.6 121.0
70.0 89.8 78.2
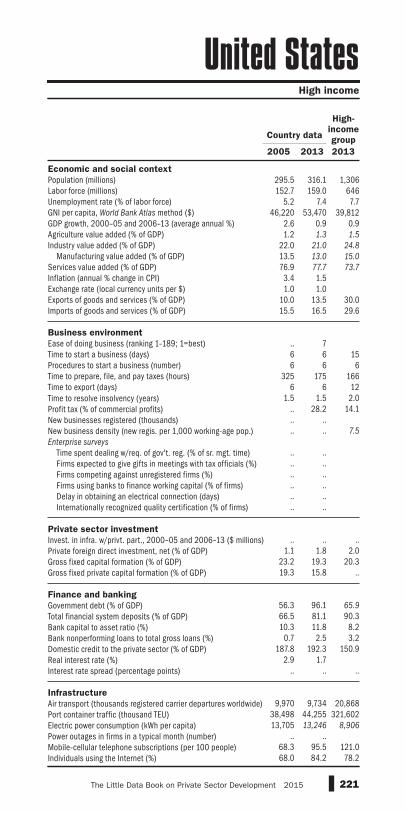
221The Little Data Book on Private Sector Development 2015
Economic and social context
Population (millions)Labor force (millions)Unemployment rate (% of labor force)GNI per capita, World Bank Atlas method ($)GDP growth, 2000–05 and 2006–13 (average annual %)Agriculture value added (% of GDP)Industry value added (% of GDP) Manufacturing value added (% of GDP)Services value added (% of GDP)Inflation (annual % change in CPI)Exchange rate (local currency units per $)Exports of goods and services (% of GDP)Imports of goods and services (% of GDP)
Business environment
Ease of doing business (ranking 1–189; 1=best)Time to start a business (days)Procedures to start a business (number)Time to prepare, file, and pay taxes (hours)Time to export (days)Time to resolve insolvency (years)Profit tax (% of commercial profits)New businesses registered (thousands)New business density (new regis. per 1,000 working-age pop.)Enterprise surveys
Time spent dealing w/req. of gov't. reg. (% of sr. mgt. time) Firms expected to give gifts in meetings with tax officials (%) Firms competing against unregistered firms (%) Firms using banks to finance working capital (% of firms) Delay in obtaining an electrical connection (days) Internationally recognized quality certification (% of firms)
Private sector investment
Invest. in infra. w/privt. part., 2000–05 and 2006–13 ($ millions)Private foreign direct investment, net (% of GDP)Gross fixed capital formation (% of GDP)Gross fixed private capital formation (% of GDP)
Finance and banking
Government debt (% of GDP)Total financial system deposits (% of GDP)Bank capital to asset ratio (%)Bank nonperforming loans to total gross loans (%)Domestic credit to the private sector (% of GDP)Real interest rate (%)Interest rate spread (percentage points)
Infrastructure
Air transport (thousands registered carrier departures worldwide)Port container traffic (thousand TEU)Electric power consumption (kWh per capita)Power outages in firms in a typical month (number)Mobile-cellular telephone subscriptions (per 100 people)Individuals using the Internet (%)
High income
United States
2005 2013 2013
High-
income
groupCountry data
295.5 316.1 1,306152.7 159.0 646
5.2 7.4 7.746,220 53,470 39,812
2.6 0.9 0.91.2 1.3 1.5
22.0 21.0 24.8
13.5 13.0 15.0
76.9 77.7 73.7
3.4 1.51.0 1.0
10.0 13.5 30.015.5 16.5 29.6
.. 76 6 156 6 6
325 175 1666 6 12
1.5 1.5 2.0.. 28.2 14.1.. .... .. 7.5
.. .... .... .... .... .... ..
.. .. ..
1.1 1.8 2.023.2 19.3 20.319.3 15.8 ..
56.3 96.1 65.9
66.5 81.1 90.310.3 11.8 8.2
0.7 2.5 3.2187.8 192.3 150.9
2.9 1.7.. .. ..
9,970 9,734 20,868
38,498 44,255 321,60213,705 13,246 8,906
.. ..68.3 95.5 121.068.0 84.2 78.2

222 2015 The Little Data Book on Private Sector Development
Economic and social context
Population (millions)Labor force (millions)Unemployment rate (% of labor force)GNI per capita, World Bank Atlas method ($)GDP growth, 2000–05 and 2006–13 (average annual %)Agriculture value added (% of GDP)Industry value added (% of GDP) Manufacturing value added (% of GDP)Services value added (% of GDP)Inflation (annual % change in CPI)Exchange rate (local currency units per $)Exports of goods and services (% of GDP)Imports of goods and services (% of GDP)
Business environment
Ease of doing business (ranking 1–189; 1=best)Time to start a business (days)Procedures to start a business (number)Time to prepare, file, and pay taxes (hours)Time to export (days)Time to resolve insolvency (years)Profit tax (% of commercial profits)New businesses registered (thousands)New business density (new regis. per 1,000 working-age pop.)Enterprise surveys
Time spent dealing w/req. of gov't. reg. (% of sr. mgt. time) Firms expected to give gifts in meetings with tax officials (%) Firms competing against unregistered firms (%) Firms using banks to finance working capital (% of firms) Delay in obtaining an electrical connection (days) Internationally recognized quality certification (% of firms)
Private sector investment
Invest. in infra. w/privt. part., 2000–05 and 2006–13 ($ millions)Private foreign direct investment, net (% of GDP)Gross fixed capital formation (% of GDP)Gross fixed private capital formation (% of GDP)
Finance and banking
Government debt (% of GDP)Total financial system deposits (% of GDP)Bank capital to asset ratio (%)Bank nonperforming loans to total gross loans (%)Domestic credit to the private sector (% of GDP)Real interest rate (%)Interest rate spread (percentage points)
Infrastructure
Air transport (thousands registered carrier departures worldwide)Port container traffic (thousand TEU)Electric power consumption (kWh per capita)Power outages in firms in a typical month (number)Mobile-cellular telephone subscriptions (per 100 people)Individuals using the Internet (%)
High income
Uruguay
2005 2013 2013
High-
income
groupCountry data
3.3 3.4 1,3061.6 1.7 6469.0 6.6 7.7
4,720 15,180 39,8120.0 5.8 0.9
10.4 10.0 1.5
27.1 25.4 24.8
17.1 12.6 15.0
62.5 64.6 73.7
4.7 8.624.5 20.530.4 24.0 30.028.5 27.3 29.6
.. 82
45 7 1511 5 6
304 312 16623 15 122.1 1.8 2.0
.. 23.6 14.17.5 6.5
3.6 3.0 7.5
7.0 11.6
0.6 1.8
87.1 67.7
20.6 26.4
38.6 15.5
6.8 10.8
1,063 3,588 ..
4.8 5.0 2.016.5 22.9 20.313.2 18.3 ..
76.1 44.5 65.9
39.6 41.6 90.37.2 9.3 8.25.6 1.3 3.2
22.5 26.8 150.912.8 4.510.8 7.8 ..
9 .. 20,868
596 861 321,6022,000 2,810 8,906
0.1 0.1
34.7 154.6 121.020.1 58.1 78.2
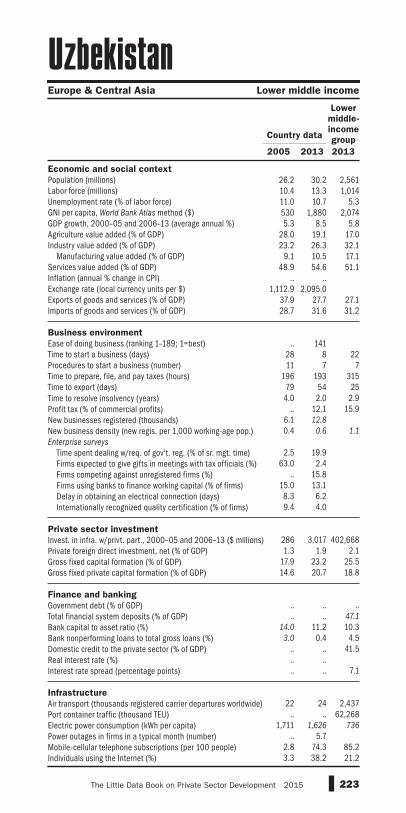
223The Little Data Book on Private Sector Development 2015
Economic and social context
Population (millions)Labor force (millions)Unemployment rate (% of labor force)GNI per capita, World Bank Atlas method ($)GDP growth, 2000–05 and 2006–13 (average annual %)Agriculture value added (% of GDP)Industry value added (% of GDP) Manufacturing value added (% of GDP)Services value added (% of GDP)Inflation (annual % change in CPI)Exchange rate (local currency units per $)Exports of goods and services (% of GDP)Imports of goods and services (% of GDP)
Business environment
Ease of doing business (ranking 1–189; 1=best)Time to start a business (days)Procedures to start a business (number)Time to prepare, file, and pay taxes (hours)Time to export (days)Time to resolve insolvency (years)Profit tax (% of commercial profits)New businesses registered (thousands)New business density (new regis. per 1,000 working-age pop.)Enterprise surveys
Time spent dealing w/req. of gov't. reg. (% of sr. mgt. time) Firms expected to give gifts in meetings with tax officials (%) Firms competing against unregistered firms (%) Firms using banks to finance working capital (% of firms) Delay in obtaining an electrical connection (days) Internationally recognized quality certification (% of firms)
Private sector investment
Invest. in infra. w/privt. part., 2000–05 and 2006–13 ($ millions)Private foreign direct investment, net (% of GDP)Gross fixed capital formation (% of GDP)Gross fixed private capital formation (% of GDP)
Finance and banking
Government debt (% of GDP)Total financial system deposits (% of GDP)Bank capital to asset ratio (%)Bank nonperforming loans to total gross loans (%)Domestic credit to the private sector (% of GDP)Real interest rate (%)Interest rate spread (percentage points)
Infrastructure
Air transport (thousands registered carrier departures worldwide)Port container traffic (thousand TEU)Electric power consumption (kWh per capita)Power outages in firms in a typical month (number)Mobile-cellular telephone subscriptions (per 100 people)Individuals using the Internet (%)
Europe & Central Asia Lower middle income
Uzbekistan
2005 2013 2013
Lower
middle-
income
groupCountry data
26.2 30.2 2,56110.4 13.3 1,01411.0 10.7 5.3530 1,880 2,0745.3 8.5 5.8
28.0 19.1 17.023.2 26.3 32.1
9.1 10.5 17.148.9 54.6 51.1
.. ..1,112.9 2,095.0
37.9 27.7 27.128.7 31.6 31.2
.. 141
28 8 2211 7 7
196 193 31579 54 254.0 2.0 2.9
.. 12.1 15.96.1 12.8
0.4 0.6 1.1
2.5 19.9
63.0 2.4.. 15.8
15.0 13.18.3 6.29.4 4.0
286 3,017 402,6681.3 1.9 2.1
17.9 23.2 25.514.6 20.7 18.8
.. .. .... .. 47.1
14.0 11.2 10.33.0 0.4 4.5
.. .. 41.5
.. ..
.. .. 7.1
22 24 2,437
.. .. 62,2681,711 1,626 736
.. 5.72.8 74.3 85.23.3 38.2 21.2

224 2015 The Little Data Book on Private Sector Development
Economic and social context
Population (millions)Labor force (millions)Unemployment rate (% of labor force)GNI per capita, World Bank Atlas method ($)GDP growth, 2000–05 and 2006–13 (average annual %)Agriculture value added (% of GDP)Industry value added (% of GDP) Manufacturing value added (% of GDP)Services value added (% of GDP)Inflation (annual % change in CPI)Exchange rate (local currency units per $)Exports of goods and services (% of GDP)Imports of goods and services (% of GDP)
Business environment
Ease of doing business (ranking 1–189; 1=best)Time to start a business (days)Procedures to start a business (number)Time to prepare, file, and pay taxes (hours)Time to export (days)Time to resolve insolvency (years)Profit tax (% of commercial profits)New businesses registered (thousands)New business density (new regis. per 1,000 working-age pop.)Enterprise surveys
Time spent dealing w/req. of gov't. reg. (% of sr. mgt. time) Firms expected to give gifts in meetings with tax officials (%) Firms competing against unregistered firms (%) Firms using banks to finance working capital (% of firms) Delay in obtaining an electrical connection (days) Internationally recognized quality certification (% of firms)
Private sector investment
Invest. in infra. w/privt. part., 2000–05 and 2006–13 ($ millions)Private foreign direct investment, net (% of GDP)Gross fixed capital formation (% of GDP)Gross fixed private capital formation (% of GDP)
Finance and banking
Government debt (% of GDP)Total financial system deposits (% of GDP)Bank capital to asset ratio (%)Bank nonperforming loans to total gross loans (%)Domestic credit to the private sector (% of GDP)Real interest rate (%)Interest rate spread (percentage points)
Infrastructure
Air transport (thousands registered carrier departures worldwide)Port container traffic (thousand TEU)Electric power consumption (kWh per capita)Power outages in firms in a typical month (number)Mobile-cellular telephone subscriptions (per 100 people)Individuals using the Internet (%)
East Asia & Pacific Lower middle income
Vanuatu
2005 2013 2013
Lower
middle-
income
groupCountry data
0.21 0.25 2,5610.09 0.11 1,014
.. .. 5.31,780 3,130 2,074
1.0 2.9 5.825.3 28.0 17.0
8.9 8.8 32.14.3 3.6 17.1
65.8 63.2 51.11.2 1.4
109.2 91.545.4 47.8 27.154.8 51.3 31.2
.. 76
47 35 228 8 7
120 120 31526 21 252.6 2.6 2.9
.. 0.0 15.90.5 0.3
4.4 2.3 1.1
.. .... .... .... .... .... ..
6 41 402,668
3.4 4.0 2.123.4 25.2 25.5
.. .. 18.8
.. .. ..
92.4 71.9 47.1
.. .. 10.3
.. .. 4.543.6 68.7 41.5
7.0 2.35.5 3.8 7.1
2 13 2,437.. .. 62,268.. .. 736
.. ..6.1 50.3 85.25.1 11.3 21.2

225The Little Data Book on Private Sector Development 2015
Economic and social context
Population (millions)Labor force (millions)Unemployment rate (% of labor force)GNI per capita, World Bank Atlas method ($)GDP growth, 2000–05 and 2006–13 (average annual %)Agriculture value added (% of GDP)Industry value added (% of GDP) Manufacturing value added (% of GDP)Services value added (% of GDP)Inflation (annual % change in CPI)Exchange rate (local currency units per $)Exports of goods and services (% of GDP)Imports of goods and services (% of GDP)
Business environment
Ease of doing business (ranking 1–189; 1=best)Time to start a business (days)Procedures to start a business (number)Time to prepare, file, and pay taxes (hours)Time to export (days)Time to resolve insolvency (years)Profit tax (% of commercial profits)New businesses registered (thousands)New business density (new regis. per 1,000 working-age pop.)Enterprise surveys
Time spent dealing w/req. of gov't. reg. (% of sr. mgt. time) Firms expected to give gifts in meetings with tax officials (%) Firms competing against unregistered firms (%) Firms using banks to finance working capital (% of firms) Delay in obtaining an electrical connection (days) Internationally recognized quality certification (% of firms)
Private sector investment
Invest. in infra. w/privt. part., 2000–05 and 2006–13 ($ millions)Private foreign direct investment, net (% of GDP)Gross fixed capital formation (% of GDP)Gross fixed private capital formation (% of GDP)
Finance and banking
Government debt (% of GDP)Total financial system deposits (% of GDP)Bank capital to asset ratio (%)Bank nonperforming loans to total gross loans (%)Domestic credit to the private sector (% of GDP)Real interest rate (%)Interest rate spread (percentage points)
Infrastructure
Air transport (thousands registered carrier departures worldwide)Port container traffic (thousand TEU)Electric power consumption (kWh per capita)Power outages in firms in a typical month (number)Mobile-cellular telephone subscriptions (per 100 people)Individuals using the Internet (%)
Latin America & Caribbean Upper middle income
Venezuela, RB
2005 2013 2013
Upper
middle-
income
groupCountry data
26.7 30.4 2,40912.2 14.1 1,26411.4 7.5 5.9
4,920 12,550 7,6041.5 2.2 5.74.0 5.8 7.6
57.8 52.2 36.716.4 13.9 23.038.2 42.1 55.6
.. 40.62.1 6.0
39.7 26.2 30.320.5 24.2 30.1
.. 182
143 144 2616 17 7
864 792 32334 56 204.0 4.0 2.6
.. 10.3 17.5
.. ..
.. .. 3.0
33.6 27.6
2.6 6.4
.. 29.824.9 27.1
25.4 13.9
12.5 25.9
3,425 4,448 426,038
1.9 1.6 3.320.3 20.3 31.612.1 7.4 ..
.. .. ..
19.0 41.1 48.011.1 10.9 10.71.1 .. 3.6
13.1 25.3 98.0–9.9 –27.55.2 1.4 6.0
136 79 7,427
1,120 1,348 262,8962,859 3,313 2,932
0.6 2.6
46.8 101.6 99.812.6 54.9 44.8
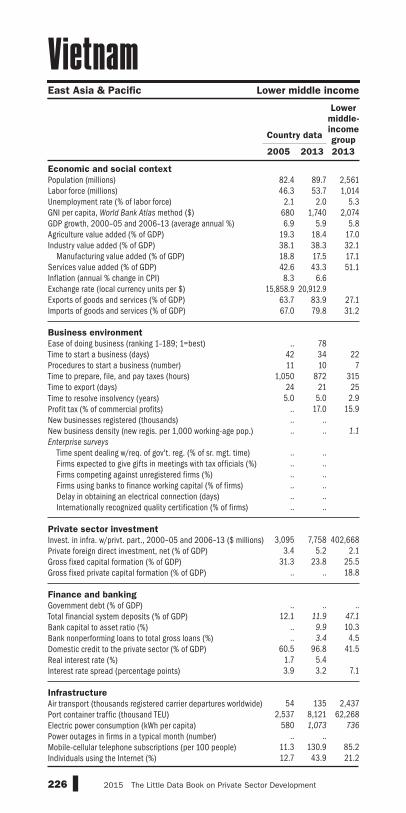
226 2015 The Little Data Book on Private Sector Development
Economic and social context
Population (millions)Labor force (millions)Unemployment rate (% of labor force)GNI per capita, World Bank Atlas method ($)GDP growth, 2000–05 and 2006–13 (average annual %)Agriculture value added (% of GDP)Industry value added (% of GDP) Manufacturing value added (% of GDP)Services value added (% of GDP)Inflation (annual % change in CPI)Exchange rate (local currency units per $)Exports of goods and services (% of GDP)Imports of goods and services (% of GDP)
Business environment
Ease of doing business (ranking 1–189; 1=best)Time to start a business (days)Procedures to start a business (number)Time to prepare, file, and pay taxes (hours)Time to export (days)Time to resolve insolvency (years)Profit tax (% of commercial profits)New businesses registered (thousands)New business density (new regis. per 1,000 working-age pop.)Enterprise surveys
Time spent dealing w/req. of gov't. reg. (% of sr. mgt. time) Firms expected to give gifts in meetings with tax officials (%) Firms competing against unregistered firms (%) Firms using banks to finance working capital (% of firms) Delay in obtaining an electrical connection (days) Internationally recognized quality certification (% of firms)
Private sector investment
Invest. in infra. w/privt. part., 2000–05 and 2006–13 ($ millions)Private foreign direct investment, net (% of GDP)Gross fixed capital formation (% of GDP)Gross fixed private capital formation (% of GDP)
Finance and banking
Government debt (% of GDP)Total financial system deposits (% of GDP)Bank capital to asset ratio (%)Bank nonperforming loans to total gross loans (%)Domestic credit to the private sector (% of GDP)Real interest rate (%)Interest rate spread (percentage points)
Infrastructure
Air transport (thousands registered carrier departures worldwide)Port container traffic (thousand TEU)Electric power consumption (kWh per capita)Power outages in firms in a typical month (number)Mobile-cellular telephone subscriptions (per 100 people)Individuals using the Internet (%)
East Asia & Pacific Lower middle income
Vietnam
2005 2013 2013
Lower
middle-
income
groupCountry data
82.4 89.7 2,56146.3 53.7 1,014
2.1 2.0 5.3680 1,740 2,0746.9 5.9 5.8
19.3 18.4 17.038.1 38.3 32.118.8 17.5 17.142.6 43.3 51.18.3 6.6
15,858.9 20,912.963.7 83.9 27.167.0 79.8 31.2
.. 78
42 34 2211 10 7
1,050 872 31524 21 25
5.0 5.0 2.9.. 17.0 15.9.. .... .. 1.1
.. .... .... .... .... .... ..
3,095 7,758 402,668
3.4 5.2 2.131.3 23.8 25.5
.. .. 18.8
.. .. ..
12.1 11.9 47.1
.. 9.9 10.3
.. 3.4 4.560.5 96.8 41.5
1.7 5.43.9 3.2 7.1
54 135 2,437
2,537 8,121 62,268580 1,073 736
.. ..11.3 130.9 85.212.7 43.9 21.2
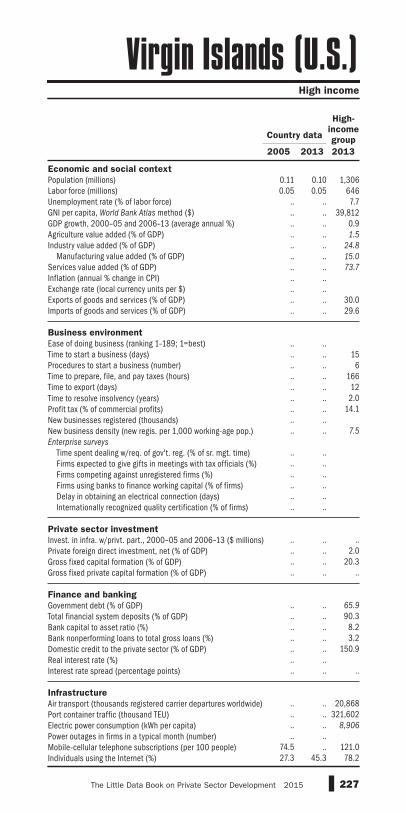
227The Little Data Book on Private Sector Development 2015
Economic and social context
Population (millions)Labor force (millions)Unemployment rate (% of labor force)GNI per capita, World Bank Atlas method ($)GDP growth, 2000–05 and 2006–13 (average annual %)Agriculture value added (% of GDP)Industry value added (% of GDP) Manufacturing value added (% of GDP)Services value added (% of GDP)Inflation (annual % change in CPI)Exchange rate (local currency units per $)Exports of goods and services (% of GDP)Imports of goods and services (% of GDP)
Business environment
Ease of doing business (ranking 1–189; 1=best)Time to start a business (days)Procedures to start a business (number)Time to prepare, file, and pay taxes (hours)Time to export (days)Time to resolve insolvency (years)Profit tax (% of commercial profits)New businesses registered (thousands)New business density (new regis. per 1,000 working-age pop.)Enterprise surveys
Time spent dealing w/req. of gov't. reg. (% of sr. mgt. time) Firms expected to give gifts in meetings with tax officials (%) Firms competing against unregistered firms (%) Firms using banks to finance working capital (% of firms) Delay in obtaining an electrical connection (days) Internationally recognized quality certification (% of firms)
Private sector investment
Invest. in infra. w/privt. part., 2000–05 and 2006–13 ($ millions)Private foreign direct investment, net (% of GDP)Gross fixed capital formation (% of GDP)Gross fixed private capital formation (% of GDP)
Finance and banking
Government debt (% of GDP)Total financial system deposits (% of GDP)Bank capital to asset ratio (%)Bank nonperforming loans to total gross loans (%)Domestic credit to the private sector (% of GDP)Real interest rate (%)Interest rate spread (percentage points)
Infrastructure
Air transport (thousands registered carrier departures worldwide)Port container traffic (thousand TEU)Electric power consumption (kWh per capita)Power outages in firms in a typical month (number)Mobile-cellular telephone subscriptions (per 100 people)Individuals using the Internet (%)
High income
Virgin Islands (U.S.)
2005 2013 2013
High-
income
groupCountry data
0.11 0.10 1,3060.05 0.05 646
.. .. 7.7
.. .. 39,812
.. .. 0.9
.. .. 1.5
.. .. 24.8
.. .. 15.0
.. .. 73.7
.. ..
.. ..
.. .. 30.0
.. .. 29.6
.. .... .. 15.. .. 6.. .. 166.. .. 12.. .. 2.0.. .. 14.1.. .... .. 7.5
.. .... .... .... .... .... ..
.. .. .... .. 2.0.. .. 20.3.. .. .. .. .. 65.9
.. .. 90.3
.. .. 8.2
.. .. 3.2
.. .. 150.9
.. ..
.. .. ..
.. .. 20,868.. .. 321,602.. .. 8,906
.. ..74.5 .. 121.027.3 45.3 78.2

228 2015 The Little Data Book on Private Sector Development
Economic and social context
Population (millions)Labor force (millions)Unemployment rate (% of labor force)GNI per capita, World Bank Atlas method ($)GDP growth, 2000–05 and 2006–13 (average annual %)Agriculture value added (% of GDP)Industry value added (% of GDP) Manufacturing value added (% of GDP)Services value added (% of GDP)Inflation (annual % change in CPI)Exchange rate (local currency units per $)Exports of goods and services (% of GDP)Imports of goods and services (% of GDP)
Business environment
Ease of doing business (ranking 1–189; 1=best)Time to start a business (days)Procedures to start a business (number)Time to prepare, file, and pay taxes (hours)Time to export (days)Time to resolve insolvency (years)Profit tax (% of commercial profits)New businesses registered (thousands)New business density (new regis. per 1,000 working-age pop.)Enterprise surveys
Time spent dealing w/req. of gov't. reg. (% of sr. mgt. time) Firms expected to give gifts in meetings with tax officials (%) Firms competing against unregistered firms (%) Firms using banks to finance working capital (% of firms) Delay in obtaining an electrical connection (days) Internationally recognized quality certification (% of firms)
Private sector investment
Invest. in infra. w/privt. part., 2000–05 and 2006–13 ($ millions)Private foreign direct investment, net (% of GDP)Gross fixed capital formation (% of GDP)Gross fixed private capital formation (% of GDP)
Finance and banking
Government debt (% of GDP)Total financial system deposits (% of GDP)Bank capital to asset ratio (%)Bank nonperforming loans to total gross loans (%)Domestic credit to the private sector (% of GDP)Real interest rate (%)Interest rate spread (percentage points)
Infrastructure
Air transport (thousands registered carrier departures worldwide)Port container traffic (thousand TEU)Electric power consumption (kWh per capita)Power outages in firms in a typical month (number)Mobile-cellular telephone subscriptions (per 100 people)Individuals using the Internet (%)
Middle East & North Africa Lower middle income
West Bank and Gaza
2005 2013 2013
Lower
middle-
income
groupCountry data
3.3 4.2 2,5610.74 1.0 1,01426.0 23.4 5.3
1,660 3,070 2,0744.5 5.4 5.86.1 5.3 17.0
26.8 25.1 32.114.6 16.2 17.167.1 69.6 51.13.5 2.8
4.5 3.615.0 16.6 27.174.0 55.9 31.2
.. 143
93 44 2212 9 7
170 162 31525 23 25
.. .. 2.9
.. 15.0 15.9
.. ..
.. .. 1.1
5.7 4.42.7 2.9
.. 50.714.2 11.337.1 42.518.2 7.9
430 777 402,6680.7 1.6 2.1
25.3 22.2 25.5.. .. 18.8 .. .. ..
16.7 15.6 47.1
.. 10.0 10.3
.. 2.9 4.5
.. .. 41.5
.. ..
.. .. 7.1 .. .. 2,437.. .. 62,268.. .. 736
2.3 8.715.9 73.7 85.216.0 46.6 21.2

229The Little Data Book on Private Sector Development 2015
Economic and social context
Population (millions)Labor force (millions)Unemployment rate (% of labor force)GNI per capita, World Bank Atlas method ($)GDP growth, 2000–05 and 2006–13 (average annual %)Agriculture value added (% of GDP)Industry value added (% of GDP) Manufacturing value added (% of GDP)Services value added (% of GDP)Inflation (annual % change in CPI)Exchange rate (local currency units per $)Exports of goods and services (% of GDP)Imports of goods and services (% of GDP)
Business environment
Ease of doing business (ranking 1–189; 1=best)Time to start a business (days)Procedures to start a business (number)Time to prepare, file, and pay taxes (hours)Time to export (days)Time to resolve insolvency (years)Profit tax (% of commercial profits)New businesses registered (thousands)New business density (new regis. per 1,000 working-age pop.)Enterprise surveys
Time spent dealing w/req. of gov't. reg. (% of sr. mgt. time) Firms expected to give gifts in meetings with tax officials (%) Firms competing against unregistered firms (%) Firms using banks to finance working capital (% of firms) Delay in obtaining an electrical connection (days) Internationally recognized quality certification (% of firms)
Private sector investment
Invest. in infra. w/privt. part., 2000–05 and 2006–13 ($ millions)Private foreign direct investment, net (% of GDP)Gross fixed capital formation (% of GDP)Gross fixed private capital formation (% of GDP)
Finance and banking
Government debt (% of GDP)Total financial system deposits (% of GDP)Bank capital to asset ratio (%)Bank nonperforming loans to total gross loans (%)Domestic credit to the private sector (% of GDP)Real interest rate (%)Interest rate spread (percentage points)
Infrastructure
Air transport (thousands registered carrier departures worldwide)Port container traffic (thousand TEU)Electric power consumption (kWh per capita)Power outages in firms in a typical month (number)Mobile-cellular telephone subscriptions (per 100 people)Individuals using the Internet (%)
Middle East & North Africa Lower middle income
Yemen, Rep.
2005 2013 2013
Lower
middle-
income
groupCountry data
20.1 24.4 2,5615.2 7.1 1,014
16.1 17.4 5.3700 1,330 2,0744.1 –0.1 5.8
10.5 .. 17.049.0 .. 32.1
7.1 .. 17.140.5 100.0 51.111.8 11.0
191.5 214.940.9 .. 27.135.9 .. 31.2
.. 137
63 40 2212 6 7
248 248 31533 29 253.0 3.0 2.9
.. 20.2 15.9
.. ..
.. .. 1.1
.. 1.9.. 62.6.. 43.0.. 4.6.. 25.6.. 4.9
377 1,052 402,668–1.8 –0.4 2.118.5 .. 25.510.6 .. 18.8
.. .. ..
19.2 25.4 47.1
.. .. 10.3
.. 21.7 4.56.9 6.3 41.5
–0.4 13.25.0 6.8 7.1
17 14 2,437
773 820 62,268183 193 736
.. 38.811.3 69.0 85.21.0 20.0 21.2
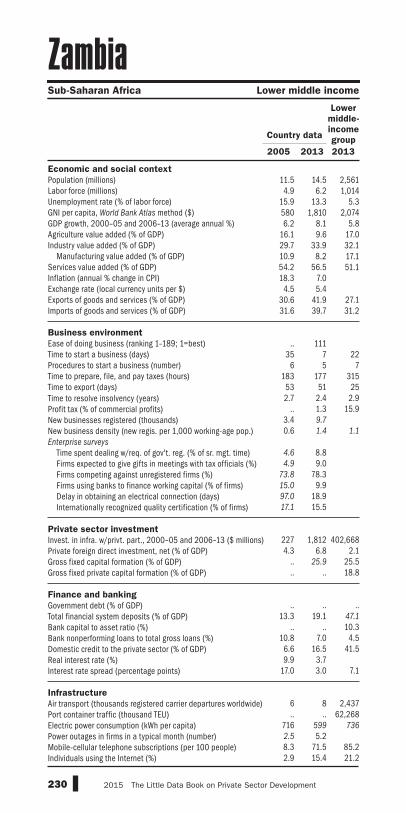
230 2015 The Little Data Book on Private Sector Development
Economic and social context
Population (millions)Labor force (millions)Unemployment rate (% of labor force)GNI per capita, World Bank Atlas method ($)GDP growth, 2000–05 and 2006–13 (average annual %)Agriculture value added (% of GDP)Industry value added (% of GDP) Manufacturing value added (% of GDP)Services value added (% of GDP)Inflation (annual % change in CPI)Exchange rate (local currency units per $)Exports of goods and services (% of GDP)Imports of goods and services (% of GDP)
Business environment
Ease of doing business (ranking 1–189; 1=best)Time to start a business (days)Procedures to start a business (number)Time to prepare, file, and pay taxes (hours)Time to export (days)Time to resolve insolvency (years)Profit tax (% of commercial profits)New businesses registered (thousands)New business density (new regis. per 1,000 working-age pop.)Enterprise surveys
Time spent dealing w/req. of gov't. reg. (% of sr. mgt. time) Firms expected to give gifts in meetings with tax officials (%) Firms competing against unregistered firms (%) Firms using banks to finance working capital (% of firms) Delay in obtaining an electrical connection (days) Internationally recognized quality certification (% of firms)
Private sector investment
Invest. in infra. w/privt. part., 2000–05 and 2006–13 ($ millions)Private foreign direct investment, net (% of GDP)Gross fixed capital formation (% of GDP)Gross fixed private capital formation (% of GDP)
Finance and banking
Government debt (% of GDP)Total financial system deposits (% of GDP)Bank capital to asset ratio (%)Bank nonperforming loans to total gross loans (%)Domestic credit to the private sector (% of GDP)Real interest rate (%)Interest rate spread (percentage points)
Infrastructure
Air transport (thousands registered carrier departures worldwide)Port container traffic (thousand TEU)Electric power consumption (kWh per capita)Power outages in firms in a typical month (number)Mobile-cellular telephone subscriptions (per 100 people)Individuals using the Internet (%)
Sub-Saharan Africa Lower middle income
Zambia
2005 2013 2013
Lower
middle-
income
groupCountry data
11.5 14.5 2,5614.9 6.2 1,014
15.9 13.3 5.3580 1,810 2,0746.2 8.1 5.8
16.1 9.6 17.029.7 33.9 32.110.9 8.2 17.154.2 56.5 51.118.3 7.0
4.5 5.430.6 41.9 27.131.6 39.7 31.2
.. 111
35 7 226 5 7
183 177 31553 51 252.7 2.4 2.9
.. 1.3 15.93.4 9.7
0.6 1.4 1.1
4.6 8.84.9 9.0
73.8 78.315.0 9.997.0 18.917.1 15.5
227 1,812 402,6684.3 6.8 2.1
.. 25.9 25.5
.. .. 18.8
.. .. ..
13.3 19.1 47.1
.. .. 10.310.8 7.0 4.5
6.6 16.5 41.59.9 3.7
17.0 3.0 7.1
6 8 2,437.. .. 62,268
716 599 736
2.5 5.28.3 71.5 85.22.9 15.4 21.2
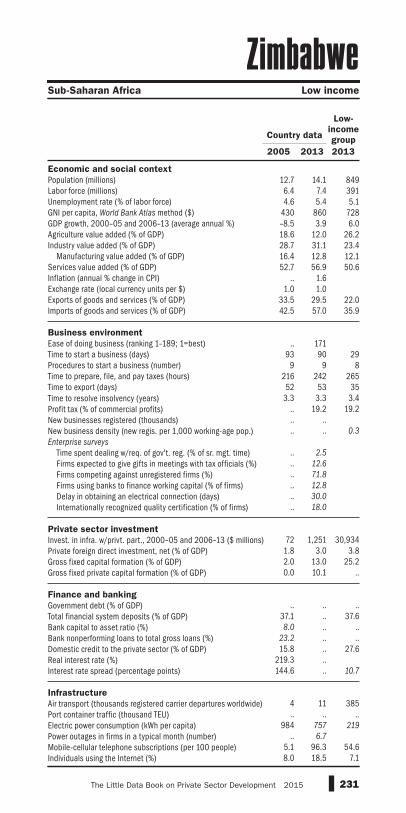
231The Little Data Book on Private Sector Development 2015
Economic and social context
Population (millions)Labor force (millions)Unemployment rate (% of labor force)GNI per capita, World Bank Atlas method ($)GDP growth, 2000–05 and 2006–13 (average annual %)Agriculture value added (% of GDP)Industry value added (% of GDP) Manufacturing value added (% of GDP)Services value added (% of GDP)Inflation (annual % change in CPI)Exchange rate (local currency units per $)Exports of goods and services (% of GDP)Imports of goods and services (% of GDP)
Business environment
Ease of doing business (ranking 1–189; 1=best)Time to start a business (days)Procedures to start a business (number)Time to prepare, file, and pay taxes (hours)Time to export (days)Time to resolve insolvency (years)Profit tax (% of commercial profits)New businesses registered (thousands)New business density (new regis. per 1,000 working-age pop.)Enterprise surveys
Time spent dealing w/req. of gov't. reg. (% of sr. mgt. time) Firms expected to give gifts in meetings with tax officials (%) Firms competing against unregistered firms (%) Firms using banks to finance working capital (% of firms) Delay in obtaining an electrical connection (days) Internationally recognized quality certification (% of firms)
Private sector investment
Invest. in infra. w/privt. part., 2000–05 and 2006–13 ($ millions)Private foreign direct investment, net (% of GDP)Gross fixed capital formation (% of GDP)Gross fixed private capital formation (% of GDP)
Finance and banking
Government debt (% of GDP)Total financial system deposits (% of GDP)Bank capital to asset ratio (%)Bank nonperforming loans to total gross loans (%)Domestic credit to the private sector (% of GDP)Real interest rate (%)Interest rate spread (percentage points)
Infrastructure
Air transport (thousands registered carrier departures worldwide)Port container traffic (thousand TEU)Electric power consumption (kWh per capita)Power outages in firms in a typical month (number)Mobile-cellular telephone subscriptions (per 100 people)Individuals using the Internet (%)
Sub-Saharan Africa Low income
Zimbabwe
2005 2013 2013
Low-
income
groupCountry data
12.7 14.1 8496.4 7.4 3914.6 5.4 5.1
430 860 728–8.5 3.9 6.018.6 12.0 26.228.7 31.1 23.416.4 12.8 12.152.7 56.9 50.6
.. 1.61.0 1.0
33.5 29.5 22.042.5 57.0 35.9
.. 171
93 90 299 9 8
216 242 26552 53 35
3.3 3.3 3.4.. 19.2 19.2.. .... .. 0.3
.. 2.5
.. 12.6
.. 71.8
.. 12.8
.. 30.0
.. 18.0
72 1,251 30,9341.8 3.0 3.82.0 13.0 25.20.0 10.1 ..
.. .. ..
37.1 .. 37.68.0 .. ..
23.2 .. ..15.8 .. 27.6
219.3 ..144.6 .. 10.7
4 11 385.. .. ..
984 757 219
.. 6.7
5.1 96.3 54.68.0 18.5 7.1
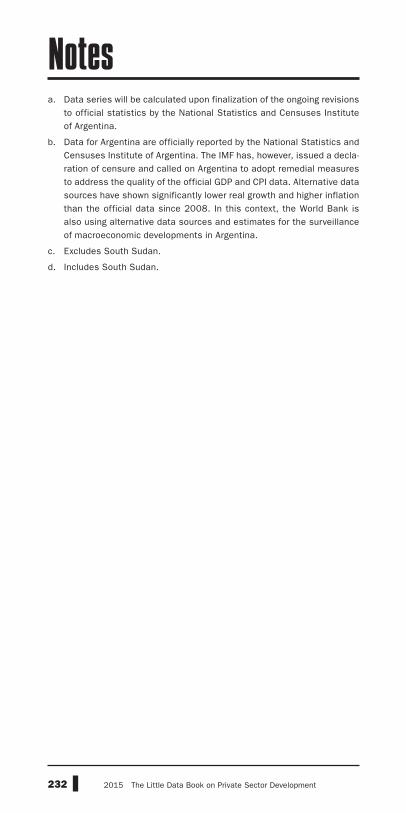
232 2015 The Little Data Book on Private Sector Development
a. Data series will be calculated upon finalization of the ongoing revisions to official statistics by the National Statistics and Censuses Institute of Argentina.
b. Data for Argentina are officially reported by the National Statistics and Censuses Institute of Argentina. The IMF has, however, issued a decla-ration of censure and called on Argentina to adopt remedial measures to address the quality of the official GDP and CPI data. Alternative data sources have shown significantly lower real growth and higher inflation than the official data since 2008. In this context, the World Bank is also using alternative data sources and estimates for the surveillance of macroeconomic developments in Argentina.
c. Excludes South Sudan.
d. Includes South Sudan.
Notes
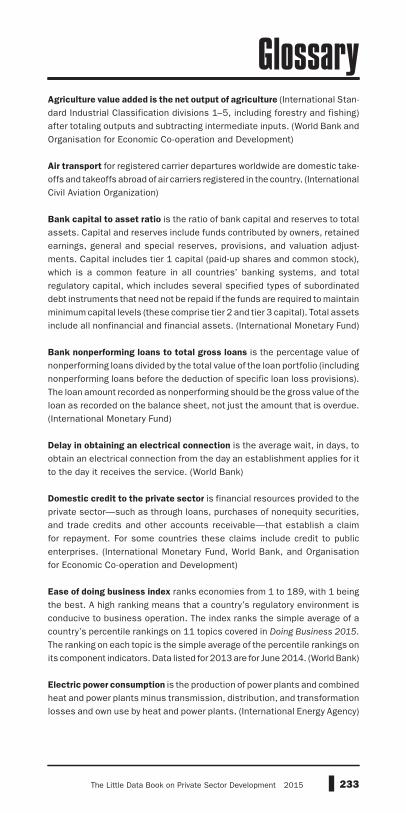
233The Little Data Book on Private Sector Development 2015
Agriculture value added is the net output of agriculture (International Stan-dard Industrial Classification divisions 1–5, including forestry and fishing) after totaling outputs and subtracting intermediate inputs. (World Bank and Organisation for Economic Co-operation and Development)
Air transport for registered carrier departures worldwide are domestic take-offs and takeoffs abroad of air carriers registered in the country. (International Civil Aviation Organization)
Bank capital to asset ratio is the ratio of bank capital and reserves to total assets. Capital and reserves include funds contributed by owners, retained earnings, general and special reserves, provisions, and valuation adjust-ments. Capital includes tier 1 capital (paid-up shares and common stock), which is a common feature in all countries’ banking systems, and total regulatory capital, which includes several specified types of subordinated debt instruments that need not be repaid if the funds are required to maintain minimum capital levels (these comprise tier 2 and tier 3 capital). Total assets include all nonfinancial and financial assets. (International Monetary Fund)
Bank nonperforming loans to total gross loans is the percentage value of nonperforming loans divided by the total value of the loan portfolio (including nonperforming loans before the deduction of specific loan loss provisions). The loan amount recorded as nonperforming should be the gross value of the loan as recorded on the balance sheet, not just the amount that is overdue. (International Monetary Fund)
Delay in obtaining an electrical connection is the average wait, in days, to obtain an electrical connection from the day an establishment applies for it to the day it receives the service. (World Bank)
Domestic credit to the private sector is financial resources provided to the private sector—such as through loans, purchases of nonequity securities, and trade credits and other accounts receivable—that establish a claim for repayment. For some countries these claims include credit to public enterprises. (International Monetary Fund, World Bank, and Organisation for Economic Co-operation and Development)
Ease of doing business index ranks economies from 1 to 189, with 1 being the best. A high ranking means that a country’s regulatory environment is conducive to business operation. The index ranks the simple average of a country’s percentile rankings on 11 topics covered in Doing Business 2015. The ranking on each topic is the simple average of the percentile rankings on its component indicators. Data listed for 2013 are for June 2014. (World Bank)
Electric power consumption is the production of power plants and combined heat and power plants minus transmission, distribution, and transformation losses and own use by heat and power plants. (International Energy Agency)
Glossary

234 2015 The Little Data Book on Private Sector Development
Enterprise surveys gather firm-level data to benchmark the business environment of economies and assess how business environment constraints affect productivity and job creation. (World Bank)
Exchange rate is the exchange rate determined by national authorities or the rate determined in the legally sanctioned exchange market. It is calculated in local currency units relative to the U.S. dollar as an annual average based on monthly averages. (International Monetary Fund)
Exports of goods and services are the value of all goods and other market services provided to the rest of the world. They include the value of mer-chandise, freight, insurance, transport, travel, royalties, license fees, and other services, such as communication, construction, financial, information, business, personal, and government services. They exclude compensation of employees and investment income (formerly called factor services) as well as transfer payments. (World Bank and Organisation for Economic Co-operation and Development)
Firms competing against unregistered firms are the percentage of firms competing against unregistered or informal firms. (World Bank)
Firms expected to give gifts in meetings with tax officials are the percentage of firms that report that a gift or informal payment is expected or requested during a meeting with tax officials. (World Bank)
Firms using banks to finance working capital are the percentage of firms using bank loans to finance working capital. (World Bank)
GDP growth is the annual percentage growth rate of gross domestic product (GDP) at market prices based on constant local currency. Aggregates are based on constant 2005 U.S. dollars. GDP is the sum of gross value added by all resident producers in the economy plus any product taxes and minus any subsidies not included in the value of the products. It is calculated without deducting for depreciation of fabricated assets or for depletion and degradation of natural resources. (World Bank and Organisation for Economic Co-operation and Development)
GNI per capita, World Bank Atlas method, is gross national income (GNI) converted to U.S. dollars using the World Bank Atlas method, divided by the midyear population. GNI is the sum of value added by all resident producers plus any product taxes minus any subsidies not included in the valuation of output plus net receipts of primary income (compensation of employees and property income) from abroad. GNI, calculated in national currency, is usually converted to U.S. dollars at official exchange rates for comparisons across economies. To smooth fluctuations in prices and exchange rates, the World Bank Atlas method is used; it averages the exchange rate for a given year and the two preceding years, adjusted for differences in rates of inflation between the country and the Euro area, Japan, the United Kingdom, and the United States. (World Bank)
Glossary

235The Little Data Book on Private Sector Development 2015
Government debt is the entire stock of direct government fixed-term contractual obligations to others outstanding on a particular date. It includes domestic and foreign liabilities such as loans, currency and money deposits, and securities other than shares. It is the gross amount of government liabilities reduced by the amount of equity and financial derivatives held by the government. Because debt is a stock rather than a flow, it is measured as of a given date, usually the last day of the fiscal year. (International Monetary Fund, World Bank, and Organisation for Economic Co-operation and Development)
Gross fixed capital formation includes land improvements (fences, ditches, drains, and so on); plant, machinery, and equipment purchases; and the construction of roads, railways, and the like, including schools, offices, hospitals, private residential dwellings, and commercial and industrial build-ings. According to the 1993 System of National Accounts, net acquisition of valuables is also considered capital formation. (World Bank and Organisation for Economic Co-operation and Development)
Gross fixed private capital formation is gross outlays by the private sector (including private nonprofit organizations) on additions to its fixed domes-tic assets. (World Bank and Organisation for Economic Co-operation and Development)
Imports of goods and services are the value of all goods and other market services received from the rest of the world. They include the value of mer-chandise, freight, insurance, transport, travel, royalties, license fees, and other services, such as communication, construction, financial, information, business, personal, and government services. They exclude compensation of employees and investment income (formerly called factor services) as well as transfer payments. (World Bank and Organisation for Economic Co-operation and Development)
Individuals using the Internet are the percentage of individuals who have used the Internet (from any location) in the last 12 months. Internet can be used via a computer, mobile phone, personal digital assistant, games machine, digital TV, etc. (International Telecommunication Union)
Industry value added is the net output of industry (International Standard Industrial Classification divisions 10–45, including mining, manufacturing, construction, electricity, water, and gas) after totaling outputs and sub-tracting intermediate inputs. (World Bank and Organisation for Economic Co-operation and Development)
Inflation is the annual percentage change in the cost to the average consumer of acquiring a basket of goods and services that may be fixed or changed at specified intervals, such as yearly. The Laspeyres formula is generally used. (International Monetary Fund)
Glossary

236 2015 The Little Data Book on Private Sector Development
Interest rate spread is the interest rate charged by banks on loans to prime customers minus the interest rate paid by commercial or similar banks for demand, time, or savings deposits. (International Monetary Fund)
Internationally recognized quality certification is the percentage of firms that have an internationally recognized quality certification. (World Bank)
Investment in infrastructure with private participation is the value of infra-structure projects in telecommunications, energy (electricity and natural gas transmission and distribution), transport, and water and sanitation that have reached financial closure and directly or indirectly serve the public, including operation and management contracts with major capital expen-diture, greenfield projects (in which a private entity or public-private joint venture builds and operates a new facility), and divestitures. Incinerators, movable assets, standalone solid waste projects, and small projects such as windmills are excluded. Data listed for 2005 and 2013 refer to total for the period 2000–05 and 2006–13. (World Bank)
Labor force is all people who supply labor for the production of goods and services during a specified period, according to the International Labour Organization definition of the economically active population. It includes both the employed and the unemployed. While national practices vary in the treatment of such groups as the armed forces and seasonal or part- time workers, in general the labor force includes the armed forces, the unemployed, and first-time job-seekers and excludes homemakers and other unpaid caregivers and workers in the informal sector. (International Labour Organization and World Bank)
Manufacturing value added is the net output of industries belonging to International Standard Industrial Classification divisions 15–37 after totaling outputs and subtracting intermediate inputs. (World Bank and Organisation for Economic Co-operation and Development)
Mobile-cellular telephone subscriptions are the number of subscriptions to a public mobile-telephone service that provide access to the public switched telephone network (PSTN) using cellular technology. The indicator includes (and is split into) the number of postpaid subscriptions, and the number of active prepaid accounts (i.e. that have been used during the last three months). The indicator applies to all mobile-cellular subscriptions that offer voice communications. It excludes subscriptions via data cards or USB modems, subscriptions to public mobile data services, private trunked mobile radio, telepoint, radio paging, and telemetry services. It is calculated per 100 people. (International Telecommunication Union)
New business density is the number of newly registered limited liability corporations per 1,000 people ages 15–64. (World Bank)
New businesses registered are the number of new limited liability corpora-tions registered in the calendar year. (World Bank)
Glossary
237The Little Data Book on Private Sector Development 2015
Population is based on the de facto definition of population, which counts all residents regardless of legal status or citizenship—except for refugees not permanently settled in the country of asylum, who are generally considered part of the population of their country of origin. Data are midyear estimates. (World Bank)
Port container traffic is the flow of containers from land to sea transport modes and vice versa in twenty-foot-equivalent units (TEUs), a standard-size container. Data cover coastal shipping as well as international journeys. Transshipment traffic is counted as two lifts at the intermediate port (once to off-load and again as an outbound lift) and includes empty units. (Contai-nerisation International and the United Nations Conference on Trade and Development)
Power outages in firms in a typical month are the average number of power outages that establishments experience in a typical month. (World Bank)
Private foreign direct investment, net, is net inflows of private investment to acquire a lasting management interest (10 percent or more of voting stock) in an enterprise operating in an economy other than that of the investor. It is the sum of equity capital, reinvestment of earnings, other long-term capital, and short-term capital, as shown in the balance of payments. (International Monetary Fund, World Bank, and Organisation for Economic Co-operation and Development)
Procedures to start a business are the number of procedures required to start a business, including interactions to obtain necessary permits and licenses and to complete all inscriptions, verifications, and notifications to start operations. Data are for businesses with specific characteristics of ownership, size, and type of production. Data listed for 2013 are for June 2014. (World Bank)
Profit tax is the amount of taxes on profits paid by the business as a percentage of commercial profits. For further details on the method, see the World Bank’s Doing Business 2015. Data listed for 2013 are for June 2014. (World Bank)
Real interest rate is the lending interest rate adjusted for inflation as mea-sured by the GDP deflator. (International Monetary Fund and World Bank)
Services value added is the net output of services (International Standard Industrial Classification divisions 50–99) after totaling outputs and sub-tracting intermediate inputs. (World Bank and Organisation for Economic Co-operation and Development)
Time spent dealing with the requirements of government regulations is the percentage of senior management time in a given week spent on require-ments imposed by government regulations (taxes, customs, labor regulations, licensing, and registration). (World Bank)
Glossary
238 2015 The Little Data Book on Private Sector Development
Time to export is the time necessary to comply with all procedures required to export goods. If a procedure can be accelerated for an additional cost, the fastest legal procedure is chosen. (World Bank)
Time to prepare, file, and pay taxes is the time, in hours per year, it takes to prepare, file, and pay (or withhold) three major types of taxes: the corporate income tax, the value added or sales tax, and labor taxes, including payroll taxes and social security contributions. (World Bank)
Time to resolve insolvency is the number of years from time of filing for insolvency in court until resolution of distressed assets and payment of creditors. Data listed for 2013 are for June 2014. (World Bank)
Time to start a business is the number of calendar days needed to complete the required procedures for legally operating a business. If a procedure can be expedited at additional cost, the fastest procedure, independent of cost, is chosen. Data listed for 2013 are for June 2014. (World Bank)
Total financial system deposits are the demand, time, and saving depos-its in deposit money banks and other financial institutions. (International Monetary Fund)
Unemployment rate is the share of the labor force without work but available for and seeking employment. Definitions of labor force and unemployment differ by country. (International Labour Organization)
Glossary