Embed Size (px)
Citation preview

2015 BOSTON TAX HELP COALITION
TAXPAYER DATA REPORT

2015 Boston Tax Help Coalition
2
༺ TABLE OF CONTENTS ༻
OVERALL OPERATIONS
OVERALL OPERATIONS …….………………………………………………………………………………………………… 3
TAXPAYER DATA
REFUNDS AND CREDITS …….……………………………………………………………………………………………….. 4
GEOGRAPHIC
DISTRIBUTION
…….……………………………………………………………………………………………….. 5
TAX SITE DISTRIBUTION …….……………………………………………………………………………………………….. 6
TAXPAYER SURVEY DATA
DEMOGRAPHICS …….……………………………………………………………………………………………….. 7
HOUSING, BENEFITS,
EMPLOYMENT
…….……………………………………………………………………………………………….. 10
TAXES AND REFUNDS …….……………………………………………………………………………………………….. 12
BANKING …….……………………………………………………………………………………………….. 14
CREDIT AND
MISCELLANEOUS
…….……………………………………………………………………………………………….. 16

2015 Boston Tax Help Coalition
3
21.1
22.822.2
22.8
8.49.8
8.7 8.6
0
5
10
15
20
25
2 0 1 2 2 0 1 3 2 0 1 4 2 0 1 5
DO
LLA
RS
(IN
MIL
LIO
NS)
YEAR
OVERALL OPERATIONS
Total Refunds Total EITC
Overall Operations 27 TAX PREPARATI ON SI TES SERVI NG 12,940 TAXPAYERS
Quick Comparison: 2012-2015 Campaigns
2012 2013 2014 2015
Taxpayers Served 11,208 11,312 11,272 12,940
Total Refunds* $21.1m $22.8m $22.2m $22.8m
Total EITC* $8.4m $9.8m $8.7m $8.6m
Tax Prep Sites 23 25 26 27
Volunteers 440 320 314 325
Credit Advis ing Participants
1,050 1,576 1,477 1,279

2015 Boston Tax Help Coalition
4
$- $8,000,000 $16,000,000 $24,000,000
Cre
dits
Ref
und
s
Overall Taxpayer Data
Total Federal Massachusetts
Taxpayer Data REFUNDS AND CREDI TS
Refunds Credits
Total Refunds Total Earned Income Credits
Total Combined Refunds $ 22,842,239.00 Total Combined EIC $ 8,558,143.60
Median Combined Refund $ 1,033.00 Median Combined EIC $ 947.60
Average Combined Refund $ 1,881.56 Average Combined EIC $ 1,902.23
Federal Refund Details Federal Earned Income Credit Details
Total Federal Refunds $ 18,386,354.00
Total Federal EIC $ 7,441,864.00
Median Federal Refund $ 804.00
Median Federal EIC $ 824.00
Average Federal Refund $ 1,569.34 Average Federal EIC $ 1,654.12
Massachusetts Refund Details
Massachusetts Earned Income Credit Details
Total Massachusetts Refunds $ 3,881,966.00
Total Massachusetts EIC $ 1,116,279.60
Median Massachusetts Refund $ 261.00
Median Massachusetts EIC $ 123.60
Average Massachusetts Refund $ 343.69 Average Massachusetts EIC $ 248.12
Average Credit
Total Credit
Elderly Credits $ 154.67 $ 3,712.00
Child Care Credits $ 502.13 $ 183,276.00
Child Tax Credits $ 903.21 $ 927,599.00
Education Credits $ 1137.39 $ 1,054,360.00

2015 Boston Tax Help Coalition
5
Taxpayer Data GEOGRAPHI C D I STRI BUTI ON
Frequency Percentage
DORCHESTER 1749 21.17%
MATTAPAN 725 8.77%
ROXBURY 634 7.67%
HYDE PARK 542 6.56%
EAST BOSTON 448 5.42%
BRIGHTON 398 4.82%
JAMAICA PLAIN 393 4.76%
ROSLINDALE 386 4.67%
SOUTH BOSTON 269 3.26%
QUINCY 247 2.99%
ALLSTON 229 2.77%
SPRINGFIELD 176 2.13%
BROCKTON 147 1.78%
WEST ROXBURY 124 1.50%
BROOKLINE 122 1.48%
RANDOLPH 112 1.36%
MALDEN 99 1.20%
CAMBRIDGE 91 1.10%
CHARLESTOWN 90 1.09%
BOSTON (SOUTH END) 82 0.99%
SOMERVILLE 64 0.77%
REVERE 61 0.74%
LYNN 53 0.64%
OTHERS 1022 12.37%
Total 8263 100.00%

2015 Boston Tax Help Coalition
6
Taxpayer Data TAX SI TE D I STRI BUTI ON
ABCD Tax Sites Number Percentage Other Tax Sites Number Percent
ABCD Allston Brighton NOC 253 1.96% 1199 SEIU of Boston 975 7.53%
ABCD Dorchester NSC 484 3.74% Allston Brighton APAC 783 6.05%
ABCD East Boston APAC 508 3.93% Allston Brighton Child and Family Services Center
198 1.53%
ABCD Elm Hill FSC 269 2.08% Boston Chinatown Neighborhood Center
310 2.40%
ABCD Jamaica Plain APAC 315 2.43% Codman Square Tech Center 1,113 8.60%
ABCD Mattapan FSC 692 5.35% Dorchester House Multi Service Center
1,147 8.86%
ABCD Parker Hill Fenway 442 3.42% FSA/myfreetaxes (Suffolk County)
478 3.69&
ABCD Robert M Coard Building
622 4.81% JVS Partnerships for Careers and Learning
230 1.78%
ABCD South End NSC 549 4.24% Neighborhood of Affordable Housing
92 0.71%
ABCD Southboston APAC 299 2.31% Operation ABLE 140 1.08%
ABCD Southside Headstart 344 2.66% Roxbury Center for Financial Empowerment
1,349 10.43%
ABCD Total 4,777 36.92% Roxbury Community College 389 3.01%
South Boston Resource Center
64 0.49%
Urban Edge Housing Corporation
575 4.44%
Work, Inc. 320 2.47%
Other Sites Total 8,163 63.08%
Total 12,940 100.00%

2015 Boston Tax Help Coalition
7
Gender(N=4,847)
Female
Male
Veteran(N=4,702)
Yes
No
Registered to Vote (N=4,699)
Yes
No
12.51% 87.50%
Do You or Any Member of Your Household Have A Disability? (N=4,342)
Yes No
9
2838
14
38
16
45
123
0
20
40
60
80
100
120
140
Nature of Disability
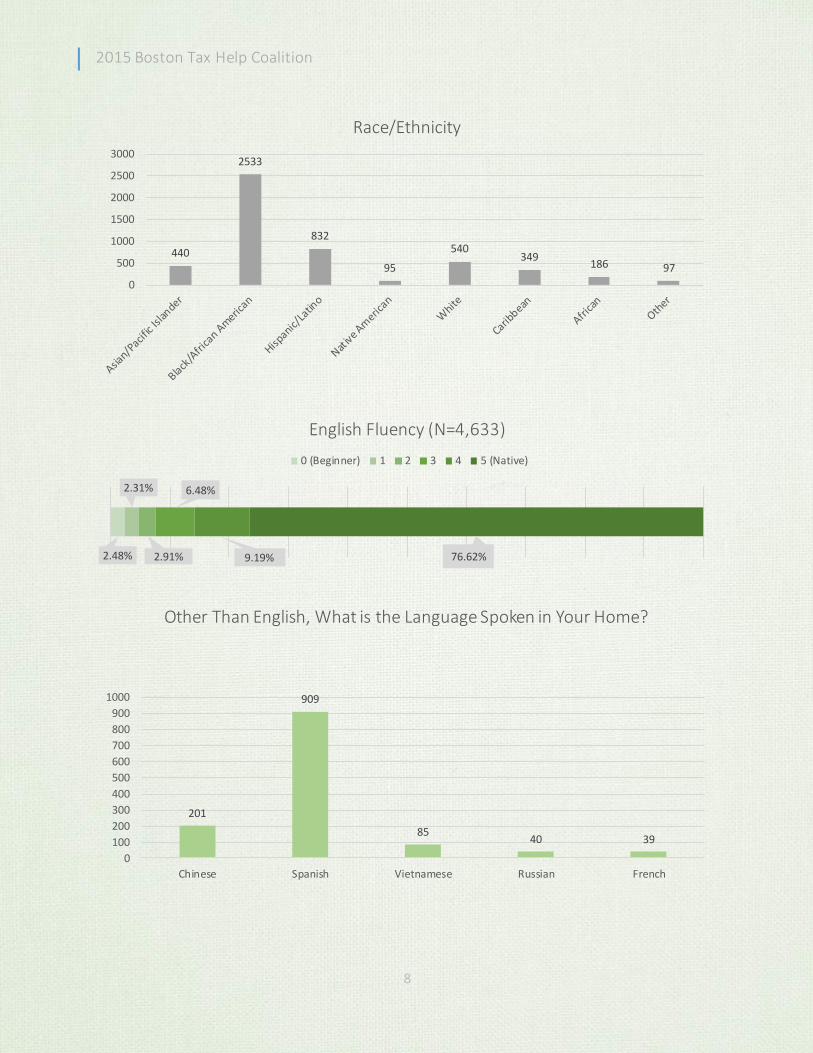
Taxpayer Survey Data DEMOGRAPHI CS
2015 Boston Tax Help Coalition
8
440
2533
832
95
540349
186 97
0
500
1000
1500
2000
2500
3000
Race/Ethnicity
2.48%
2.31%
2.91%
6.48%
9.19% 76.62%
English Fluency (N=4,633)
0 (Beginner) 1 2 3 4 5 (Native)
201
909
8540 39
0
100
200
300
400
500
600
700
800
900
1000
Chinese Spanish Vietnamese Russian French
Other Than English, What is the Language Spoken in Your Home?

2015 Boston Tax Help Coalition
9
Yes , but I don't have enough time
Yes , but I don't have enough money to
cover a l l cost
Yes , but I am not sure in investing in additional education or training will pay off for me
No, I am a ll set
Do You Want to Continue Your Education or Vocational Training? (N=4,700)
0
200
400
600
800
1000
1200
1400
1600
1800
0-8 grades 9-12 grades
(no diploma)High School
grad or GEDSome col lege Associate’s
DegreeBachelor’s
DegreeSome
graduate school
Graduate
Degree
Highest Level of Education
2015 Boston Tax Help Coalition
10
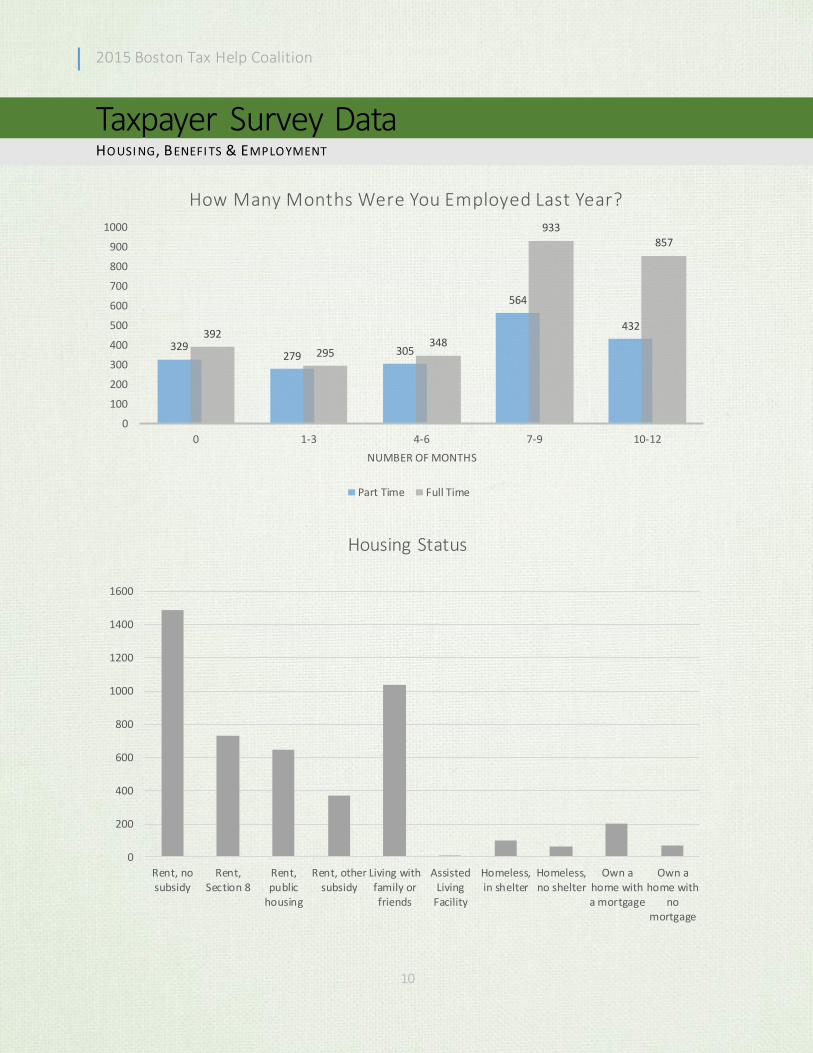
329279 305
564
432392
295348
933857
0
100
200
300
400
500
600
700
800
900
1000
0 1-3 4-6 7-9 10-12
NUMBER OF MONTHS
How Many Months Were You Employed Last Year?
Part Time Full Time
0
200
400
600
800
1000
1200
1400
1600
Rent, nosubsidy
Rent,Section 8
Rent,public
housing
Rent, othersubsidy
Living withfamily orfriends
AssistedLiving
Facility
Homeless,in shelter
Homeless,no shelter
Own ahome witha mortgage
Own ahome with
nomortgage
Housing Status
Taxpayer Survey Data HOUSI NG, BENEFI TS & EMPLOYMENT
2015 Boston Tax Help Coalition
11
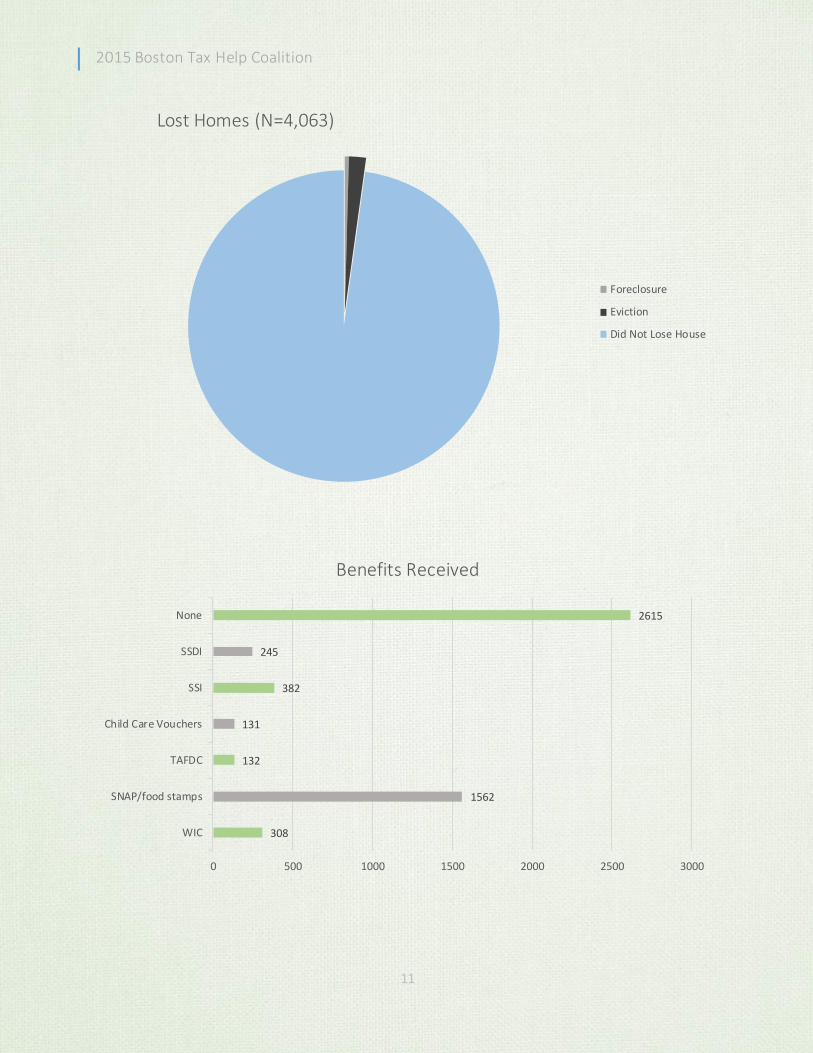
308
1562
132
131
382
245
2615
0 500 1000 1500 2000 2500 3000
WIC
SNAP/food stamps
TAFDC
Child Care Vouchers
SSI
SSDI
None
Benefits Received
Lost Homes (N=4,063)
Foreclosure
Eviction
Did Not Lose House

2015 Boston Tax Help Coalition
12
Did You File Taxes Last Year? (N=4,713)
Yes
No
Did You Receive a Refund? (N=4,079)
Yes, >$1,000
Yes, <$1,000
No
Don't Remember
1601
264
670
347
520
0
200
400
600
800
1000
1200
1400
1600
1800
Yes, pretty much as Ihad planned
No, I had planned tosave more of my
refund
No, I had planned touse it for somethingelse but ended up
spending most of it onbills
I did not have anyspecific plans for the
refund
I don't remember
If You Received a Refund, Were You Able to Use It As You Intended?
Taxpayer Survey Data TAXES & REFUNDS
2015 Boston Tax Help Coalition
13
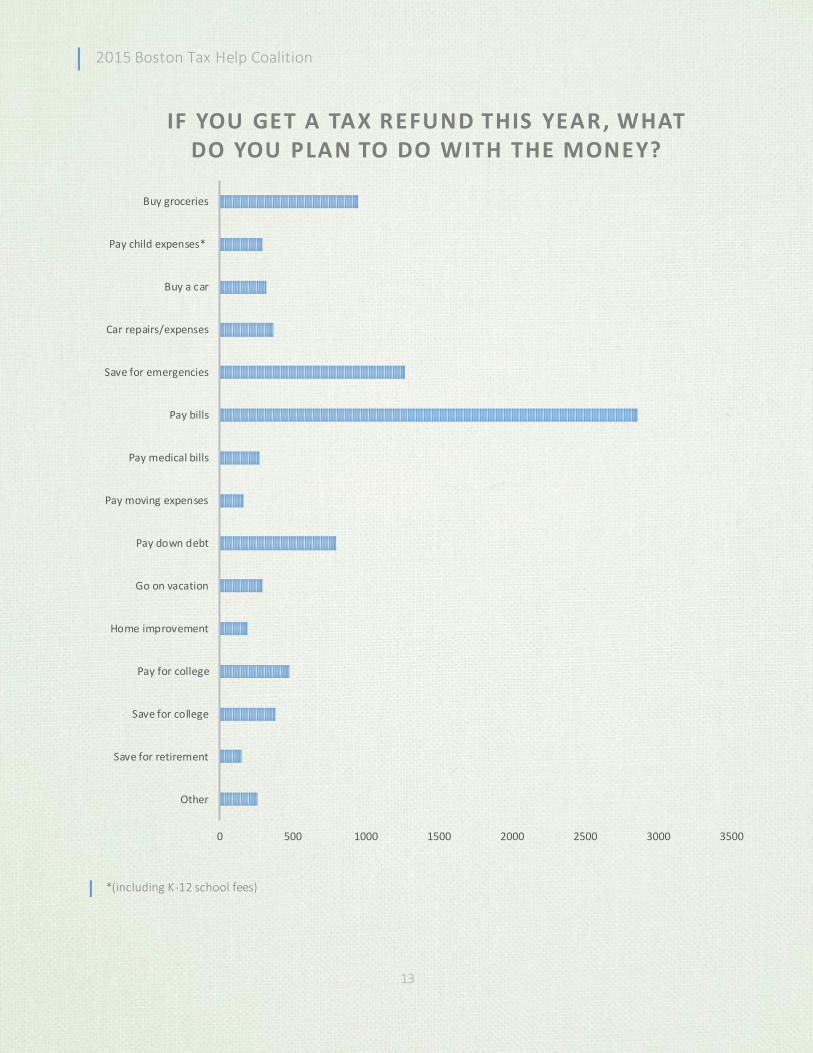
0 500 1000 1500 2000 2500 3000 3500
Other
Save for retirement
Save for college
Pay for college
Home improvement
Go on vacation
Pay down debt
Pay moving expenses
Pay medical bills
Pay bills
Save for emergencies
Car repairs/expenses
Buy a car
Pay child expenses*
Buy groceries
IF YOU GET A TAX REFUND THIS YEAR, WHAT DO YOU PLAN TO DO WITH THE MONEY?
*(including K-12 school fees)

2015 Boston Tax Help Coalition
14
0
500
1000
1500
2000
2500
3000
Checking & Saving Just Checking Just Savings No, but I aminterested in one
No, not interested
Do You Have a Bank Account?
0
20
40
60
80
100
120
140
Overdraftfees
Other fees I don’t trust them
Goes againstmy religious
beliefs
I don’t think I can get an
account
They don’t speak my
language
Locations orhours are
not good forme
Isn’t really worth i t
Other
If You Don't Have Bank Account(s), Why Not?
Taxpayer Survey Data BANKI NG

2015 Boston Tax Help Coalition
15
0 200 400 600 800 1000 1200 1400 1600
Other
Webster FirstFinancial
Century Bank
Capital One 360
Metro Credit Union
Mass State EmployeesCredit Union
Cathay
Santander
One United
TD Bank
Eastern
East Boston Savings/Mt. Washington
City of Boston Credit Union
Citizens
Citibank
Bank of America
I F Y O U H AV E B AN K AC C O U N T ( S ) , W I T H W H O M D O Y O U B AN K W I T H ?
570 691
3080
0
500
1000
1500
2000
2500
3000
3500
Yes, once Yes, more thanonce
No
Did You Pay An Overdraft Fee In the Past 12 Months?
314
1315
1076
600 612
0
200
400
600
800
1000
1200
1400
How Much Money Do You Regularly Keep In Your Account?

2015 Boston Tax Help Coalition
16
In The Event of a Financial Hardship, Do You Know Anyone Likely to Loan You $200 or More If You asked? (N=4,346)
No, nobody
Yes, maybe 1-2people
Yes, maybe 3-4people
Yes, maybe 5or more people
Did You Have a Friend or Relative that Borrowed $200 or More From You Because of a Financial Hardship? (N=4,121)
No
Yes, and I expect toget paid back
Yes, and I do notexpect to get paidback
1040 958
668
1818
0
500
1000
1500
2000
Yes, onlyone
Yes, morethan one
No, but Iwant one
No, I don'twant one
Do You Have One or More Credit Cards?
592
852
573
170
0
100
200
300
400
500
600
700
800
900
The full balance More than theminimumpayment
The minimumpayment
Less than theminimumpayment
How Much Do You Usually Pay Each Month On Your Highest Balance Card?
1008
624
167 74381
0
500
1000
1500
Less than$1,000
$1,000 -$5,000
$5,000 -$10,000
Morethan
$10,000
Unsure
What is Your Current Outstanding Balance On All
Credit Cards?
351 379 329262
871
0
200
400
600
800
1000
Less than10%
10%-14.9% 15%-19.9% More than20%
Don'tknow
What Is The Interest Rate You are Charged On Your Credit Card?
Taxpayer Survey Data CREDI T AND MI SCELLANEOUS

2015 Boston Tax Help Coalition
17
231341
985
448510
2083
0
500
1000
1500
2000
2500
Medical bills Prescriptions Groceries Utilities Phone Did not have acredit card in thelast year (2014)
Did You Use a Credit Card In the Last Year (2014) For Any of the Following Reasons Because You had No Access to Cash To Pay?
487
186
74
445
12143
744
1887
0
200
400
600
800
1000
1200
1400
1600
1800
2000
Missed acredit cardpayment
Went over thecredit card
limit
Credit limiteddecreased
Credit limitedincreased
Interest ratechanged
Offered acredit card topay a medical
expense
I don’t know Did not have acredit card inthe last year
(2014)
Did You Experience Any of the Following Last Year with Credit Cards?

2015 Boston Tax Help Coalition
18
1543
569
2045
0
500
1000
1500
2000
2500
No Yes, I know butit is not
important forme
Yes, I know andit is important
for me
Do You Know What a Credit Score Is?
280
798
1474
916
440
0
200
400
600
800
1000
1200
1400
1600
Very bad Bad Fair Good Very good
How Would You Rate Your Credit Score?
752
278
242
578
389
0 100 200 300 400 500 600 700 800
Request it on-line through AnnualCreditReport.com
Request it by mail throughAnnualCreditReport.com
Access it online for a fee
A different method
Through the tax sites
How Do You Get Your Credit Report?
312
668
1474
924
356
0
200
400
600
800
1000
1200
1400
1600
Very easy Easy Neutral Hard Very hard
How Easy Do You Think It Is To Improve Your Credit Score?
1551
746
1003
354
0
200
400
600
800
1000
1200
1400
1600
1800
Never Less thanonce per year
Once peryear
More thanonce per year
How Often Do You Get Your Credit Report?

2015 Boston Tax Help Coalition
19
0 200 400 600 800 1000 1200 1400 1600 1800
Attend a credit counseling session
Experience a financial crisis
Filed a credit report complaint
Lose a job
Open a checking account
Open a retirement account
Open a savings account
Pay a bill over the internet
Purchase a money order
Purchase a US Savings Bond
Received a court order for debt collection
Received a notice for debt you don’t owe
Received threatening phone calls for debt collection
Take a class on personal finances
Take a loan from a payday lender
Take out a loan from a bank
Use a Check Casher
Use Direct Deposit
Used a pre-paid debit card with fees
Used mobile banking on a smartphone
D U R I N G 2 0 1 4 , D I D Y O U D O AN Y O F T H E F O L L O W I N G ?
237
24
130
449
117 85
395 367
921833
0100200300400500600700800900
1000
WOULD YOU LIKE HELP WITH ANY OF THE FOLLOWING?
2015 Boston Tax Help Coalition
20
BOSTON TAX HELP COALI TI ON
43 HAWKINS STREET
BOSTON, MASSACHUSETTS, 02114
WWW.BOSTON TAXHELP.ORG