Embed Size (px)
Citation preview
Consumer Report Card on Health Insurance
Carriers in Connecticut
October 2015
1
Table of Contents
Dear Health Insurance Customer:
I know how important and challenging making the right health insurance decision can be for you and your family, particularly when you have many options. This Consumer Report Card is designed to help you as a consumer make an informed decision. To help you through that, each year the Connecticut Insurance Department (CID) compares Health Maintenance Organizations – commonly referred to as HMOs – and up to 15 insurers with the highest premium volume in Connecticut, that offer Managed Care Plans. We compile information from customer surveys on the overall satisfaction that members have with their plans. The Report Card also provides you with data on provider networks by county and offers a range of quality measures such as breast cancer screening, controlling high blood pressure, prenatal care, childhood immunization and much more. You can even compare the track record for each insurer on requests and denials for services and appeal outcomes. To assist you in your decision making, we have provided an easy-to-use Worksheet that lists the criteria that the CID believes are most critical in determining which health plan is right for you. I urge you to work with your insurer or independent agent to help pick the plan that best meets your needs. Connecticut residents are fortunate to have many health insurance options. Therefore, you will find that companies offer a range of benefits at different prices based on various factors. The CID is a state agency that is statutorily required to regulate the insurance industry. As regulators, our only interest is to provide you with the most accurate and unbiased information available. I am confident you will find the information in the Report Card useful and hope you will take a few minute to fill out the Worksheet. Doing so may make the difference in helping you choose the most appropriate plan and company for you and your family.
Sincerely,
About this Repor t Card 2 Managed Care Plan Comparison Worksheet 3 Health B enefit Plan Statutes 4 MCOs included in the Report Card 5 MCOs included in the Report Card and their Websites 6 General Information
HMOs 7 Indemnit y Car r iers 9
Participating Providers by County HMOs 11 Indemnit y Car r iers 14
Measures of Members Usage of Benefits HMOs 17 Indemnit y Car r iers 24 Utilization Review Data
HMOs 31 Indemnit y Car r iers 32
Behavioral Health Comparisons HMOs 33 Indemnit y Car r iers 39
Member Satisfaction Survey Results HMOs 45 Indemnit y Car r iers 47
Medical Loss Rat ios by Carrier 51 Glossar y 52 Other Indemnit y MCOs not Included in This Repor t 55 Where to Find Help or Additional Information 56
Katharine L. Wade Insurance Commissioner
2
About This Report Card The information in this report card is based on data provided by the MCOs as of year end 2014. This report card does not contain information on specific plans offered by the MCOs. Each MCO offers several different plans, and often tailors them to a specific policyholder’s needs. You will need to get additional information from the MCO or your employer to make your choice. In addition to this report card, you will need provider directories, premium or contribution rates and schedules of benefits for each plan you are considering.
Q. What types of plans are covered in this comparison? A. Managed Care Plans offered by HMOs or traditional indemnity companies. These plans attempt to manage the access, cost and quality of health care by pro
moting early detection and preventive care under the supervision of a primary care physician (PCP) who participates in the managed care plan’s network.
Q. How does the Department get its information for this Report Card? A. The Department sends a series of surveys to the companies. Their answers to our questions are summarized and included in this Report Card.
Q. Who can I call if I have questions about the information contained in this Report Card? A. The Insurance Department’s Consumer Affairs Division at 1-800-203-3447.
Q. Does this Report Card evaluate all benefit options? A. No. Because different plans provide different benefits, it would be nearly impossible to do so. Also, many benefits are mandated by law and therefore would
be the same across plans.
Q. Who can I call if I have questions about specific benefit options? A. Your employer, your insurer, or your independent agent.
Q. Does this Report Card include information regarding Medicare, Medicaid and other entitlement programs? A. No.
Consider the following factors when evaluating your options:
• Does the participating network include your current physicians, hospitals, or pharmacies? • Are the plan’s participating providers convenient in location to your home or office? • Does the plan include an option for seeing a provider outside of the plan’s network? • Does the plan provide the health services that you are most likely to need? • What copayments, coinsurance, or deductibles will you be responsible for paying? • What is the premium or employee contribution?
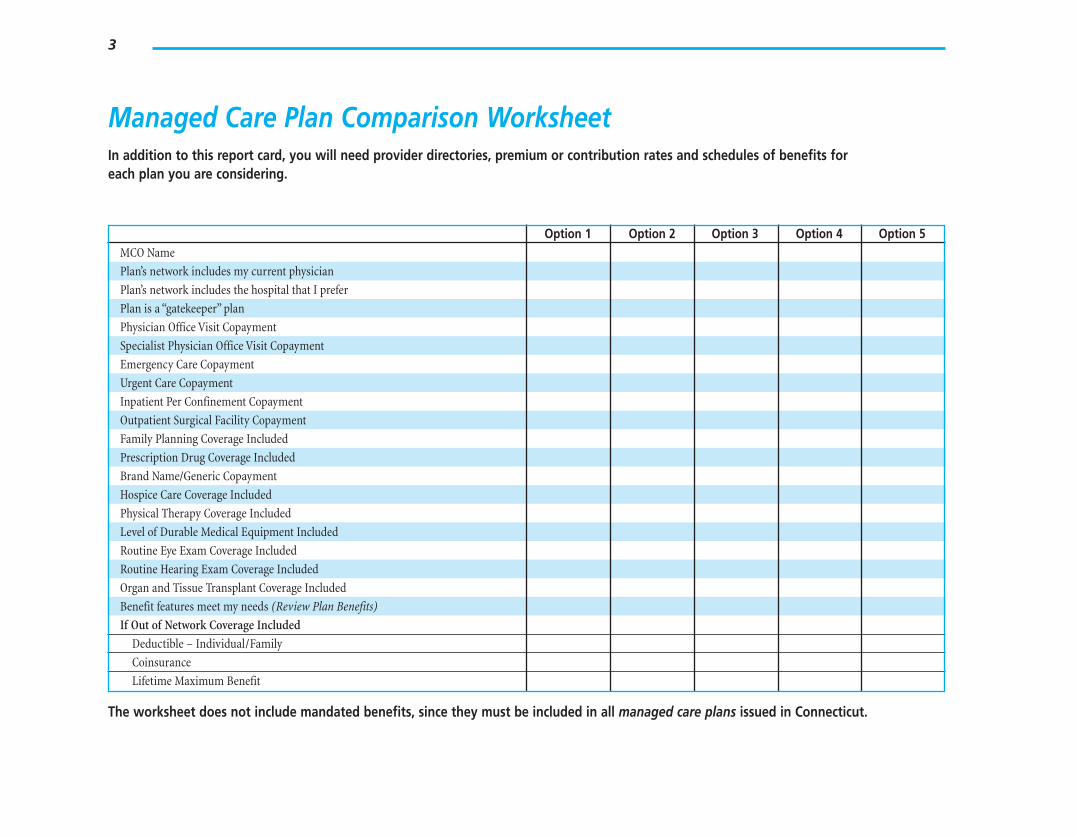
3
Managed Care Plan Comparison Worksheet In addition to this report card, you will need provider directories, premium or contribution rates and schedules of benefits for each plan you are considering.
Option 1 Option 2 Option 3 Option 4 Option 5 MCO Name
Plan’s network includes my current physician
Plan’s network includes the hospital that I prefer
Plan is a “gatekeeper” plan
Physician Office Visit Copayment
Specialist Physician Office Visit Copayment
Emergency Care Copayment
Urgent Care Copayment
Inpatient Per Confinement Copayment
Outpatient Surgical Facility Copayment
Family Planning Coverage Included
Prescription Drug Coverage Included
Brand Name/Generic Copayment
Hospice Care Coverage Included
Physical Therapy Coverage Included
Level of Durable Medical Equipment Included
Routine Eye Exam Coverage Included
Routine Hearing Exam Coverage Included
Organ and Tissue Transplant Coverage Included
Benefit features meet my needs (Review Plan Benefits)
If Out of Network Coverage Included
Deductible – Individual/Family
Coinsurance
Lifetime Maximum Benefit
The worksheet does not include mandated benefits, since they must be included in all managed care plans issued in Connecticut.
4
Health Benefit Plan Statutes INDIVIDUAL GROUP INDIVIDUAL GROUP
SUBJECT STATUTE STATUTE SUBJECT STATUTE STATUTE
Pre-authorized benefits paid unless 3 days Bone Marrow Testing 38a-492o 38a-518o prior notification to adm/serv/proc 38a-472g 38a-472g Home Health Care 38a-493 38a-520 Pre-Existing Condition Waiver 38a-476 38a-476 Blood screening added to preventive pediatric 38a-490d 38a-535(b) Post-claims underwriting 38a-477b 38a-477b Definition of dependent child to 26 38a-497 38a-512b Applications must include state and federal MLR 38a-477c 38a-477c Ambulance Service 38a-498 38a-525 Medical necessity 38a-482a 38a-513c Extend isolation & emergency services to mobile Regulating limited benefit medical plans 38a-482b 38a-513d field hospitals 38a-498b 38a-525b No Lifetime max. on "essential benefits"/defined Health Care Services to Residents with Elevated Blood lifetime on non-essential benefits 38a-482c 38a-512c Alcohol Levels 38a-498c 38a-525c
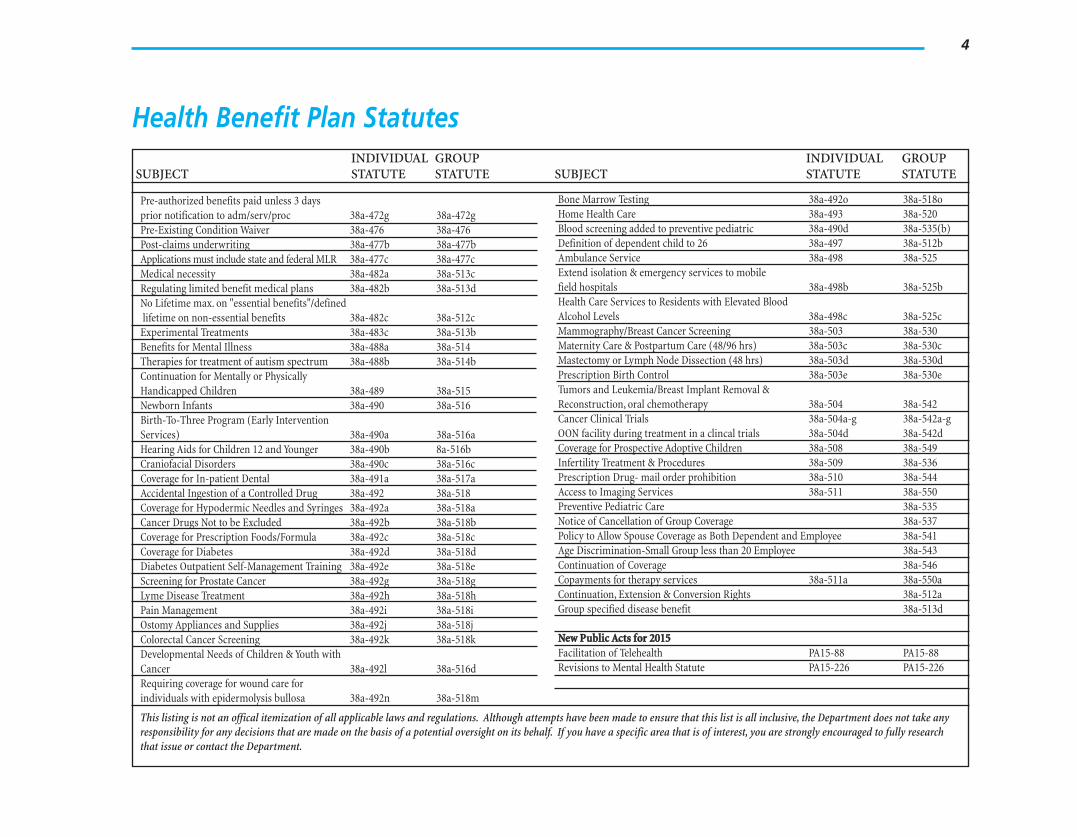
Experimental Treatments 38a-483c 38a-513b Mammography/Breast Cancer Screening 38a-503 38a-530 Benefits for Mental Illness 38a-488a 38a-514 Maternity Care & Postpartum Care (48/96 hrs) 38a-503c 38a-530c Therapies for treatment of autism spectrum 38a-488b 38a-514b Mastectomy or Lymph Node Dissection (48 hrs) 38a-503d 38a-530d Continuation for Mentally or Physically Prescription Birth Control 38a-503e 38a-530e Handicapped Children 38a-489 38a-515 Tumors and Leukemia/Breast Implant Removal & Newborn Infants 38a-490 38a-516 Reconstruction, oral chemotherapy 38a-504 38a-542 Birth-To-Three Program (Early Intervention Cancer Clinical Trials 38a-504a-g 38a-542a-g Services) 38a-490a 38a-516a OON facility during treatment in a clincal trials 38a-504d 38a-542d Hearing Aids for Children 12 and Younger 38a-490b 8a-516b Coverage for Prospective Adoptive Children 38a-508 38a-549 Craniofacial Disorders 38a-490c 38a-516c Infertility Treatment & Procedures 38a-509 38a-536 Coverage for In-patient Dental 38a-491a 38a-517a Prescription Drug- mail order prohibition 38a-510 38a-544 Accidental Ingestion of a Controlled Drug 38a-492 38a-518 Access to Imaging Services 38a-511 38a-550 Coverage for Hypodermic Needles and Syringes 38a-492a 38a-518a Preventive Pediatric Care 38a-535 Cancer Drugs Not to be Excluded 38a-492b 38a-518b Notice of Cancellation of Group Coverage 38a-537 Coverage for Prescription Foods/Formula 38a-492c 38a-518c Policy to Allow Spouse Coverage as Both Dependent and Employee 38a-541 Coverage for Diabetes 38a-492d 38a-518d Age Discrimination-Small Group less than 20 Employee 38a-543 Diabetes Outpatient Self-Management Training 38a-492e 38a-518e Continuation of Coverage 38a-546 Screening for Prostate Cancer 38a-492g 38a-518g Copayments for therapy services 38a-511a 38a-550a Lyme Disease Treatment 38a-492h 38a-518h Continuation, Extension & Conversion Rights 38a-512a Pain Management 38a-492i 38a-518i Group specified disease benefit 38a-513d Ostomy Appliances and Supplies 38a-492j 38a-518j Colorectal Cancer Screening 38a-492k 38a-518k NNeeww PPuubblliicc AAccttss ffoorr 22001155 Developmental Needs of Children & Youth with Facilitation of Telehealth PA15-88 PA15-88 Cancer 38a-492l 38a-516d Revisions to Mental Health Statute PA15-226 PA15-226 Requiring coverage for wound care for individuals with epidermolysis bullosa 38a-492n 38a-518m
This listing is not an offical itemization of all applicable laws and regulations. Although attempts have been made to ensure that this list is all inclusive, the Department does not take any responsibility for any decisions that are made on the basis of a potential oversight on its behalf. If you have a specific area that is of interest, you are strongly encouraged to fully research that issue or contact the Department.
5
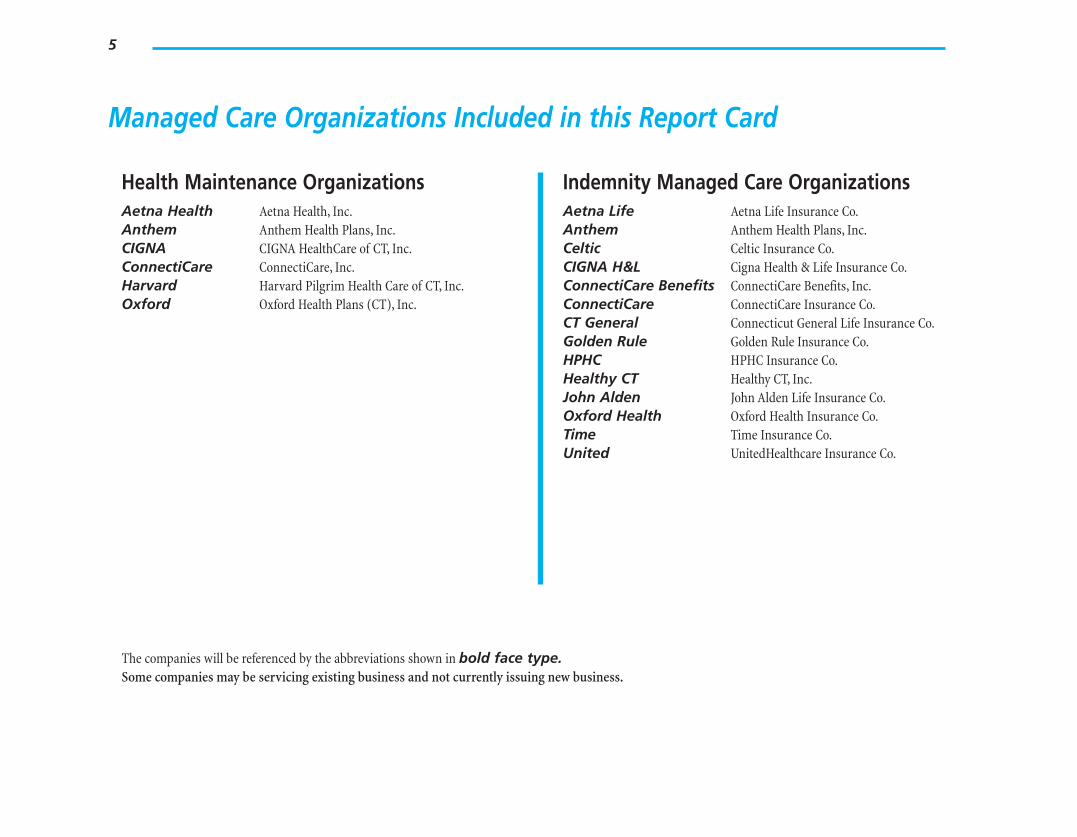
Managed Care Organizations Included in this Report Card
Health Maintenance Organizations Aetna Health Aetna Health, Inc. Anthem Anthem Health Plans, Inc. CIGNA CIGNA HealthCare of CT, Inc. ConnectiCare ConnectiCare, Inc. Harvard Har vard Pilgrim Health Care of CT, Inc. Oxford Oxford Health Plans (CT), Inc.
Indemnity Managed Care Organizations Aetna Life Aetna Life Insurance Co. Anthem Anthem Health Plans, Inc. Celtic Celtic Insurance Co. CIGNA H&L Cigna Health & Life Insurance Co. ConnectiCare Benefits ConnectiCare Benefits, Inc. ConnectiCare ConnectiCare Insurance Co. CT General Connecticut General Life Insurance Co. Golden Rule Golden Rule Insurance Co. HPHC HPHC Insurance Co. Healthy CT Healthy CT, Inc. John Alden John Alden Life Insurance Co. Oxford Health Oxford Health Insurance Co. Time Time Insurance Co. United UnitedHealthcare Insurance Co.
The companies will be referenced by the abbreviations shown in bold face type. Some companies may be servicing existing business and not currently issuing new business.
6
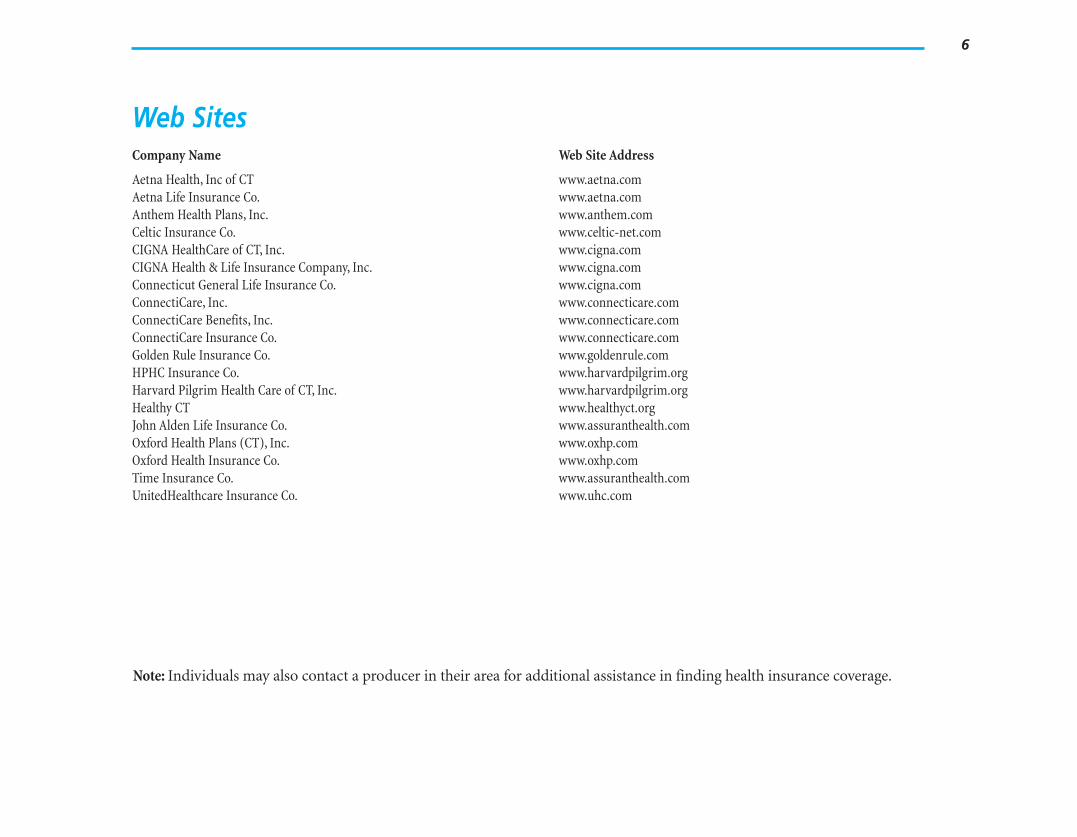
Web Sites Company Name Web Site Address
Aetna Health, Inc of CT www.aetna.com Aetna Life Insurance Co. www.aetna.com Anthem Health Plans, Inc. www.anthem.com Celtic Insurance Co. www.celtic-net.com CIGNA HealthCare of CT, Inc. www.cigna.com CIGNA Health & Life Insurance Company, Inc. www.cigna.com Connecticut General Life Insurance Co. www.cigna.com ConnectiCare, Inc. www.connecticare.com ConnectiCare Benefits, Inc. www.connecticare.com ConnectiCare Insurance Co. www.connecticare.com Golden Rule Insurance Co. www.goldenrule.com HPHC Insurance Co. www.harvardpilgrim.org Har vard Pilgrim Health Care of CT, Inc. www.harvardpilgrim.org Healthy CT www.healthyct.org John Alden Life Insurance Co. www.assuranthealth.com Oxford Health Plans (CT), Inc. www.oxhp.com Oxford Health Insurance Co. www.oxhp.com Time Insurance Co. www.assuranthealth.com UnitedHealthcare Insurance Co. www.uhc.com
Note: Individuals may also contact a producer in their area for additional assistance in finding health insurance coverage.
7
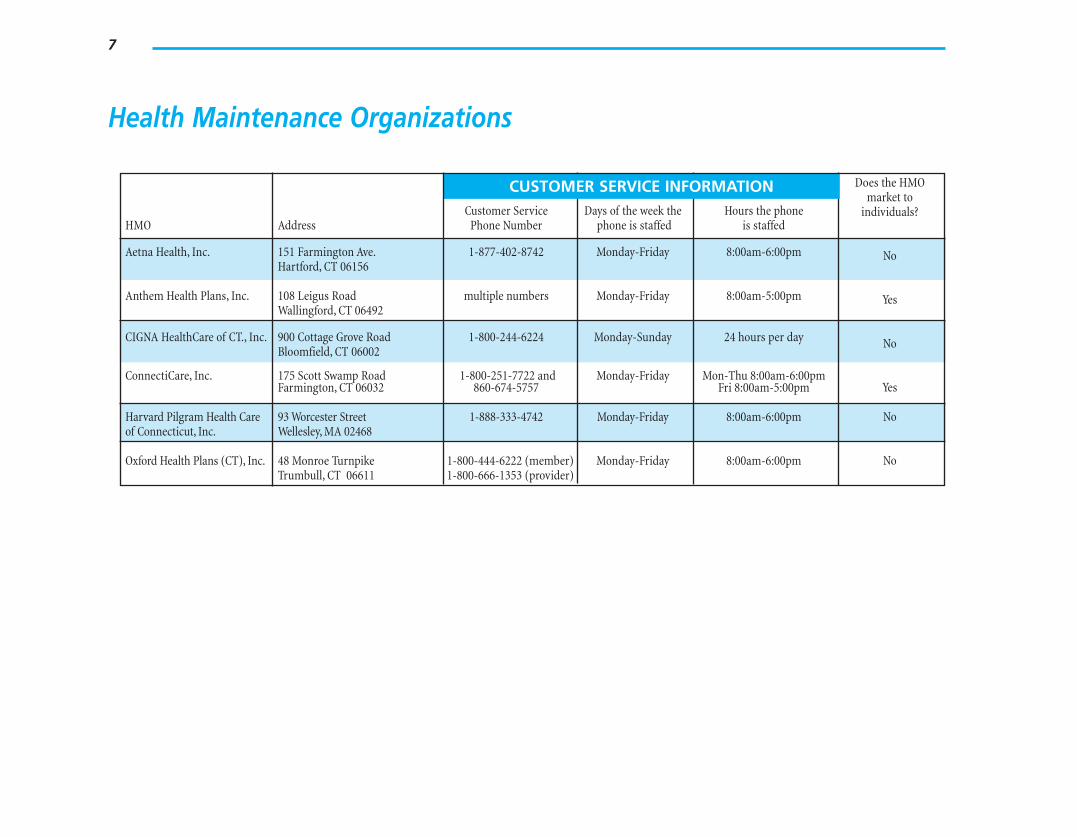
Health Maintenance Organizations
HMO Address
CUSTOMCustomer Service
Phone Number
ER SERVICE INFORMATION Days of the week the
phone is staffed Hours the phone
is staffed
Does the HMO market to
individuals?
Aetna Health, Inc.
Anthem Health Plans, Inc.
151 Farmington Ave. Hartford, CT 06156
108 Leigus Road Wallingford, CT 06492
1-877-402-8742
multiple numbers
Monday-Friday
Monday-Friday
8:00am-6:00pm
8:00am-5:00pm
No
Yes
CIGNA HealthCare of CT., Inc.
ConnectiCare, Inc.
900 Cottage Grove Road Bloomfield, CT 06002
175 Scott Swamp Road Farmington, CT 06032
1-800-244-6224
1-800-251-7722 and 860-674-5757
Monday-Sunday
Monday-Friday
24 hours per day
Mon-Thu 8:00am-6:00pm Fri 8:00am-5:00pm
No
Yes
Harvard Pilgram Health Care of Connecticut, Inc.
93 Worcester Street Wellesley, MA 02468
1-888-333-4742 Monday-Friday 8:00am-6:00pm No
Oxford Health Plans (CT), Inc. 48 Monroe Turnpike Trumbull, CT 06611
1-800-444-6222 (member) 1-800-666-1353 (provider)
Monday-Friday 8:00am-6:00pm No
8
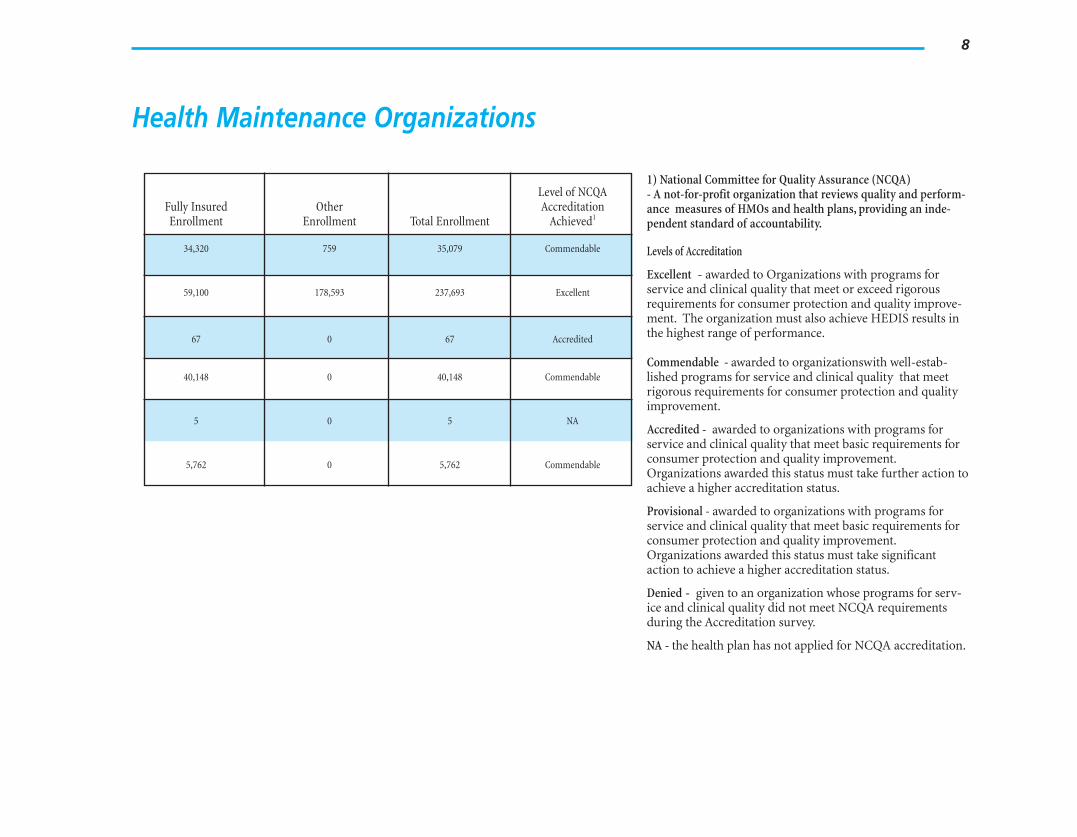
Health Maintenance Organizations
Fully Insured Enrollment
Other Enrollment Total Enrollment
Level of NCQA Accreditation
Achieved1
34,320 759 35,079 Commendable
59,100 178,593 237,693 Excellent
67 0 67 Accredited
40,148 0 40,148 Commendable
5
5,762
0
0
5
5,762
NA
Commendable
1) National Committee for Quality Assurance (NCQA) - A not-for-profit organization that reviews quality and performance measures of HMOs and health plans, providing an independent standard of accountability.
Levels of Accreditation
Excellent - awarded to Organizations with programs for service and clinical quality that meet or exceed rigorous requirements for consumer protection and quality improvement. The organization must also achieve HEDIS results in the highest range of performance.
Commendable - awarded to organizationswith well-established programs for service and clinical quality that meet rigorous requirements for consumer protection and quality improvement.
Accredited - awarded to organizations with programs for service and clinical quality that meet basic requirements for consumer protection and quality improvement. Organizations awarded this status must take further action to achieve a higher accreditation status.
Provisional - awarded to organizations with programs for service and clinical quality that meet basic requirements for consumer protection and quality improvement. Organizations awarded this status must take significant action to achieve a higher accreditation status.
Denied - given to an organization whose programs for service and clinical quality did not meet NCQA requirements during the Accreditation sur vey.
NA - the health plan has not applied for NCQA accreditation.
9
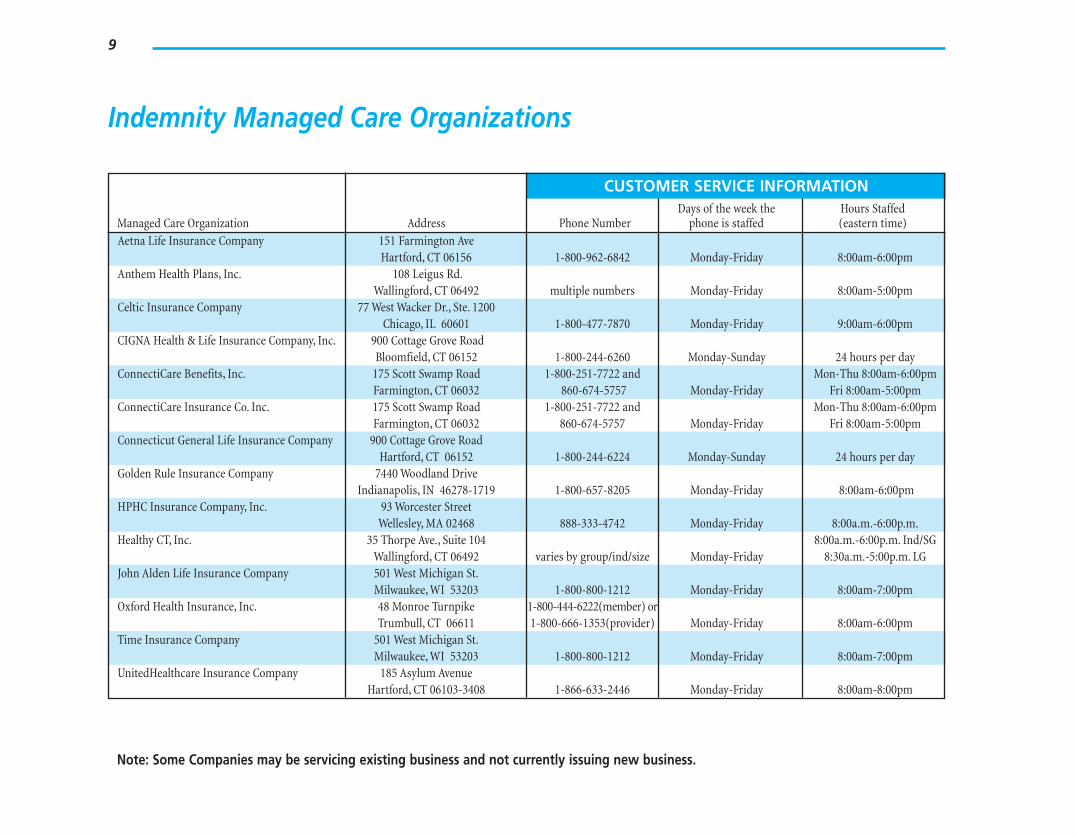
Indemnity Managed Care Organizations
Managed Care Organization Address
CUSTO
Phone Number
MER SERVICE INFORMATION Days of the week the
phone is staffed Hours Staffed (eastern time)
Aetna Life Insurance Company 151 Farmington Ave
Anthem Health Plans, Inc. Hartford, CT 06156
108 Leigus Rd. 1-800-962-6842 Monday-Friday 8:00am-6:00pm
Celtic Insurance Company Wallingford, CT 06492
77 West Wacker Dr., Ste. 1200 multiple numbers Monday-Friday 8:00am-5:00pm
CIGNA Health & Life Insurance Company, Inc. Chicago, IL 60601
900 Cottage Grove Road 1-800-477-7870 Monday-Friday 9:00am-6:00pm
Bloomfield, CT 06152 1-800-244-6260 Monday-Sunday 24 hours per day ConnectiCare Benefits, Inc. 175 Scott Swamp Road 1-800-251-7722 and Mon-Thu 8:00am-6:00pm
Farmington, CT 06032 860-674-5757 Monday-Friday Fri 8:00am-5:00pm ConnectiCare Insurance Co. Inc. 175 Scott Swamp Road 1-800-251-7722 and Mon-Thu 8:00am-6:00pm
Connecticut General Life Insurance Company Farmington, CT 06032
900 Cottage Grove Road 860-674-5757 Monday-Friday Fri 8:00am-5:00pm
Golden Rule Insurance Company Hartford, CT 06152
7440 Woodland Drive 1-800-244-6224 Monday-Sunday 24 hours per day
HPHC Insurance Company, Inc. Indianapolis, IN 46278-1719
93 Worcester Street 1-800-657-8205 Monday-Friday 8:00am-6:00pm
Wellesley, MA 02468 888-333-4742 Monday-Friday 8:00a.m.-6:00p.m. Healthy CT, Inc. 35 Thorpe Ave., Suite 104 8:00a.m.-6:00p.m. Ind/SG
John Alden Life Insurance Company Wallingford, CT 06492 501 West Michigan St.
varies by group/ind/size Monday-Friday 8:30a.m.-5:00p.m. LG
Oxford Health Insurance, Inc. Milwaukee, WI 53203 48 Monroe Turnpike
1-800-800-1212 1-800-444-6222(member) or
Monday-Friday 8:00am-7:00pm
Time Insurance Company Trumbull, CT 06611
501 West Michigan St. 1-800-666-1353(provider) Monday-Friday 8:00am-6:00pm
UnitedHealthcare Insurance Company Milwaukee, WI 53203
185 Asylum Avenue 1-800-800-1212 Monday-Friday 8:00am-7:00pm
Hartford, CT 06103-3408 1-866-633-2446 Monday-Friday 8:00am-8:00pm
Note: Some Companies may be servicing existing business and not currently issuing new business.
10
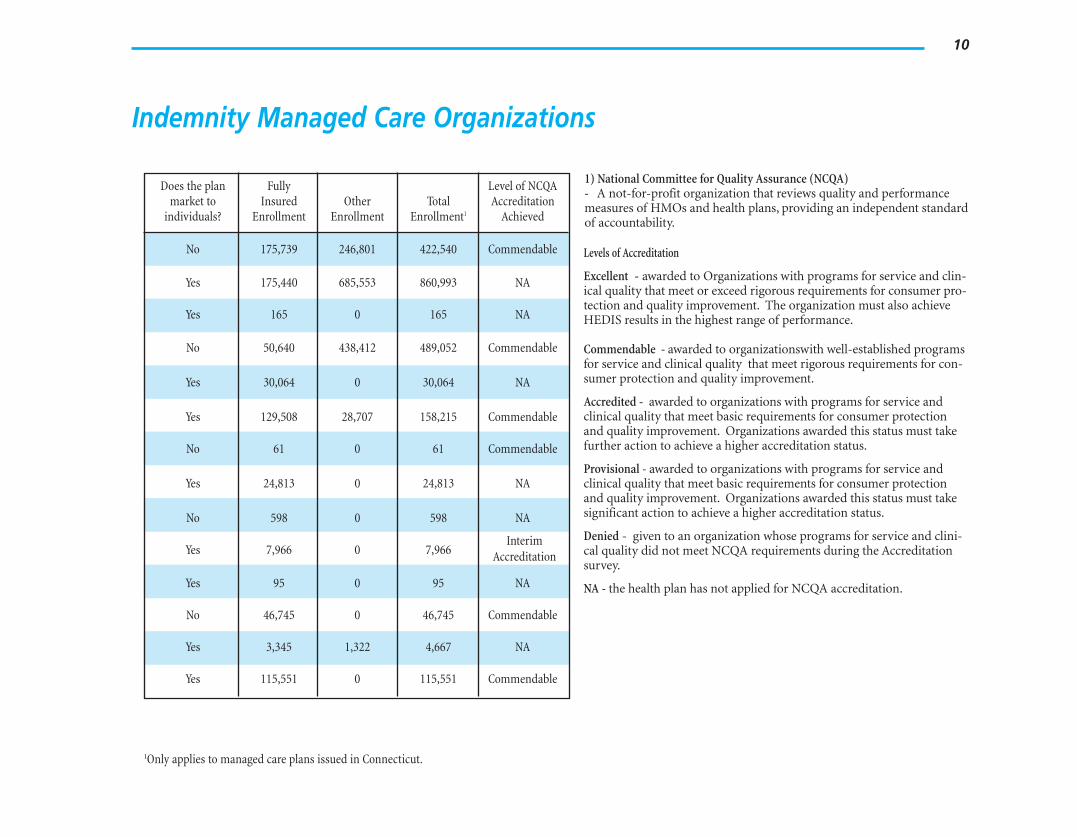
Indemnity Managed Care Organizations
Does the plan market to
individuals?
Fully Insured
Enrollment Other
Enrollment Total
Enrollment1
Level of NCQA Accreditation
Achieved
No 175,739 246,801 422,540 Commendable
Yes 175,440 685,553 860,993 NA
Yes 165 0 165 NA
No 50,640 438,412 489,052 Commendable
Yes 30,064 0 30,064 NA
Yes 129,508 28,707 158,215 Commendable
No 61 0 61 Commendable
Yes 24,813 0 24,813 NA
No 598 0 598 NA
Interim Yes 7,966 0 7,966 Accreditation
Yes 95 0 95 NA
No 46,745 0 46,745 Commendable
Yes 3,345 1,322 4,667 NA
Yes 115,551 0 115,551 Commendable
1) National Committee for Quality Assurance (NCQA) - A not-for-profit organization that reviews quality and performance measures of HMOs and health plans, providing an independent standard of accountability.
Levels of Accreditation
Excellent - awarded to Organizations with programs for service and clinical quality that meet or exceed rigorous requirements for consumer protection and quality improvement. The organization must also achieve HEDIS results in the highest range of performance.
Commendable - awarded to organizationswith well-established programs for service and clinical quality that meet rigorous requirements for consumer protection and qualit y improvement.
Accredited - awarded to organizations with programs for service and clinical quality that meet basic requirements for consumer protection and quality improvement. Organizations awarded this status must take further action to achieve a higher accreditation status.
Provisional - awarded to organizations with programs for service and clinical quality that meet basic requirements for consumer protection and quality improvement. Organizations awarded this status must take significant action to achieve a higher accreditation status.
Denied - given to an organization whose programs for service and clinical quality did not meet NCQA requirements during the Accreditation survey.
NA - the health plan has not applied for NCQA accreditation.
1Only applies to managed care plans issued in Connecticut.
11
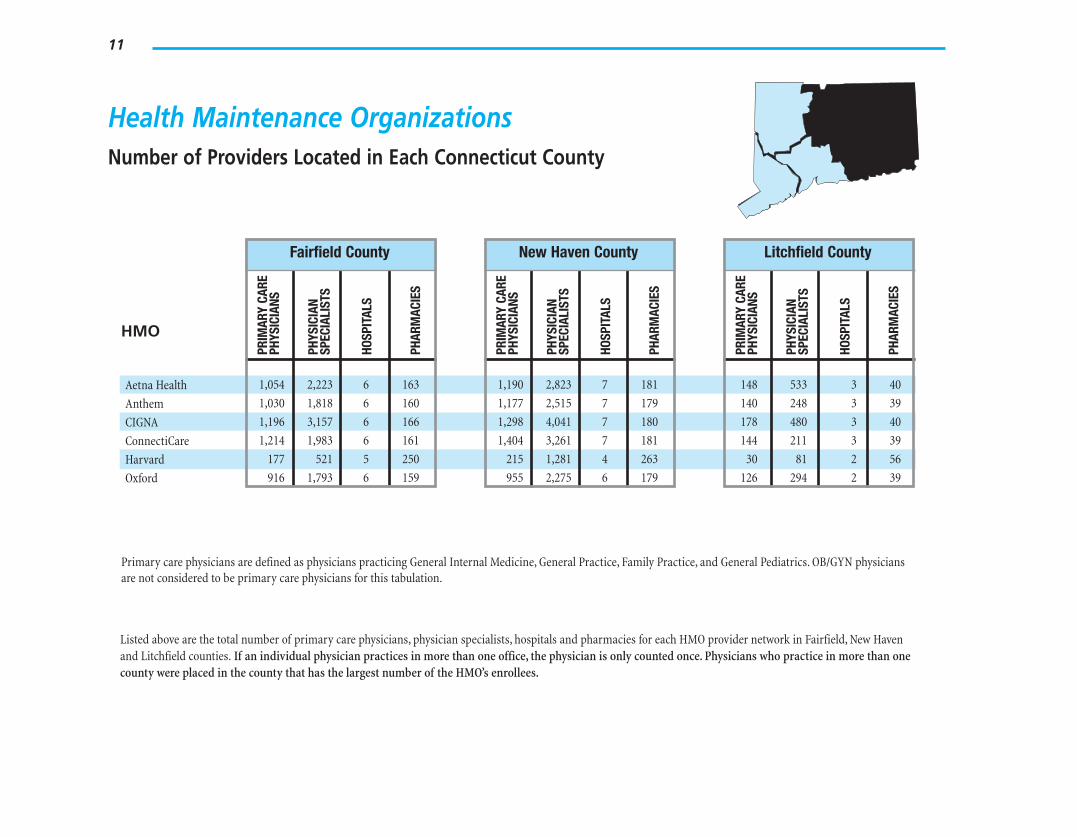
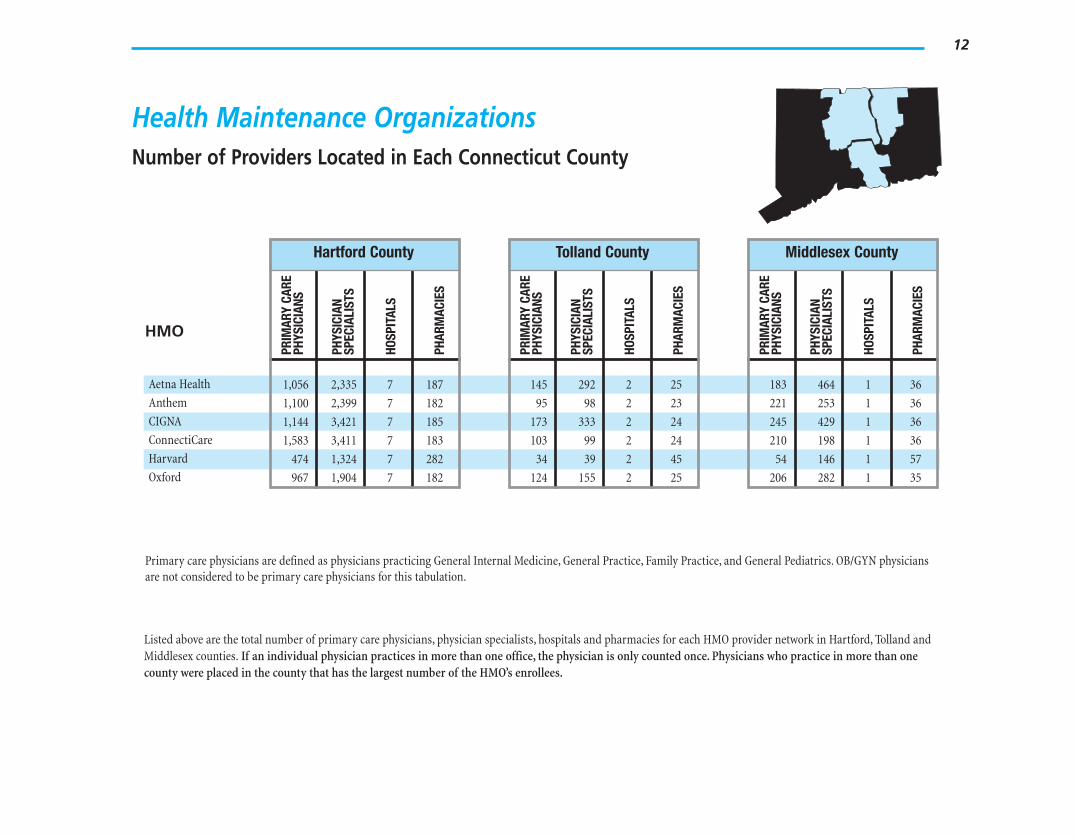
Health Maintenance Organizations Number of Providers Located in Each Connecticut County
HMO
Aetna Health
Anthem
CIGNA
ConnectiCare
Harvard
Oxford
Fairfield County PR
IMAR
Y CA
REPH
YSIC
IANS
PHYS
ICIA
NSP
ECIA
LIST
S
HOSP
ITAL
S
PHAR
MAC
IES
1,054 2,223 6 163
1,030 1,818 6 160
1,196 3,157 6 166
1,214 1,983 6 161
177 521 5 250
916 1,793 6 159
New Haven County
PRIM
ARY
CARE
PHYS
ICIA
NS
PHYS
ICIA
NSP
ECIA
LIST
S
HOSP
ITAL
S
PHAR
MAC
IES
1,190 2,823 7 181
1,177 2,515 7 179
1,298 4,041 7 180
1,404 3,261 7 181
215 1,281 4 263
955 2,275 6 179
Litchfield County
PRIM
ARY
CARE
PHYS
ICIA
NS
PHYS
ICIA
NSP
ECIA
LIST
S
HOSP
ITAL
S
PHAR
MAC
IES
148 533 3 40
140 248 3 39
178 480 3 40
144 211 3 39
30 81 2 56
126 294 2 39
Primary care physicians are defined as physicians practicing General Internal Medicine, General Practice, Family Practice, and General Pediatrics. OB/GYN physicians are not considered to be primary care physicians for this tabulation.
Listed above are the total number of primary care physicians, physician specialists, hospitals and pharmacies for each HMO provider network in Fairfield, New Haven and Litchfield counties. If an individual physician practices in more than one office, the physician is only counted once. Physicians who practice in more than one county were placed in the county that has the largest number of the HMO’s enrollees.
12
Health Maintenance Organizations Number of Providers Located in Each Connecticut County
HMO
Aetna Health
Anthem
CIGNA
ConnectiCare
Harvard
Oxford
Hartford County
PRIM
ARY
CARE
PHYS
ICIA
NS
PHYS
ICIA
NSP
ECIA
LIST
S
HOSP
ITAL
S
PHAR
MAC
IES
1,056 2,335 7 187
1,100 2,399 7 182
1,144 3,421 7 185
1,583 3,411 7 183
474 1,324 7 282
967 1,904 7 182
Tolland County
PRIM
ARY
CARE
PHYS
ICIA
NS
PHYS
ICIA
NSP
ECIA
LIST
S
HOSP
ITAL
S
PHAR
MAC
IES
145 292 2 25
95 98 2 23
173 333 2 24
103 99 2 24
34 39 2 45
124 155 2 25
Middlesex County
PRIM
ARY
CARE
PHYS
ICIA
NS
PHYS
ICIA
NSP
ECIA
LIST
S
HOSP
ITAL
S
PHAR
MAC
IES
183 464 1 36
221 253 1 36
245 429 1 36
210 198 1 36
54 146 1 57
206 282 1 35
Primary care physicians are defined as physicians practicing General Internal Medicine, General Practice, Family Practice, and General Pediatrics. OB/GYN physicians are not considered to be primary care physicians for this tabulation.
Listed above are the total number of primary care physicians, physician specialists, hospitals and pharmacies for each HMO provider network in Hartford, Tolland and Middlesex counties. If an individual physician practices in more than one office, the physician is only counted once. Physicians who practice in more than one county were placed in the county that has the largest number of the HMO’s enrollees.
13
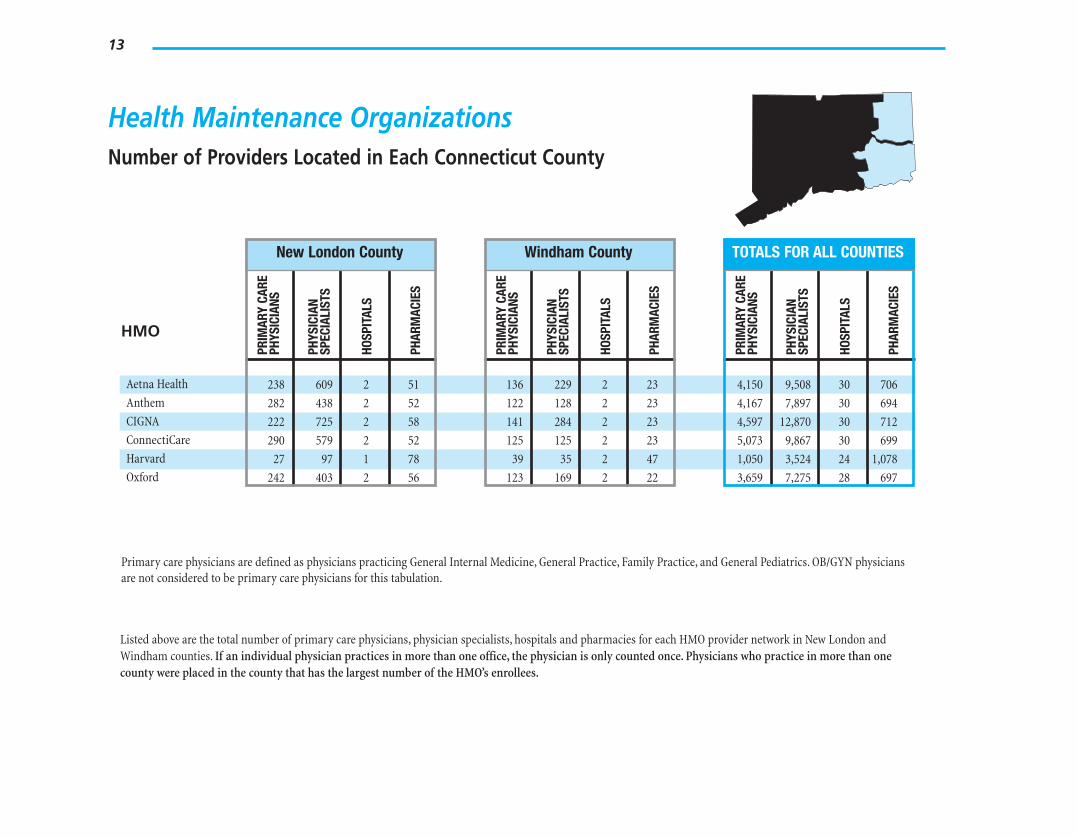
Health Maintenance Organizations Number of Providers Located in Each Connecticut County
HMO
Aetna Health
Anthem
CIGNA
ConnectiCare
Harvard
Oxford
New London County PR
IMAR
Y CA
REPH
YSIC
IANS
PHYS
ICIA
NSP
ECIA
LIST
S
HOSP
ITAL
S
PHAR
MAC
IES
238 609 2 51
282 438 2 52
222 725 2 58
290 579 2 52
27 97 1 78
242 403 2 56
Windham County
PRIM
ARY
CARE
PHYS
ICIA
NS
PHYS
ICIA
NSP
ECIA
LIST
S
HOSP
ITAL
S
PHAR
MAC
IES
136 229 2 23
122 128 2 23
141 284 2 23
125 125 2 23
39 35 2 47
123 169 2 22
TOTALS FOR ALL COUNTIES
PRIM
ARY
CARE
PHYS
ICIA
NS
PHYS
ICIA
NSP
ECIA
LIST
S
HOSP
ITAL
S
PHAR
MAC
IES
4,150
4,167
4,597
5,073
1,050
3,659
9,508
7,897
12,870
9,867
3,524
7,275
30
30
30
30
24
28
706
694
712
699
1,078
697
Primary care physicians are defined as physicians practicing General Internal Medicine, General Practice, Family Practice, and General Pediatrics. OB/GYN physicians are not considered to be primary care physicians for this tabulation.
Listed above are the total number of primary care physicians, physician specialists, hospitals and pharmacies for each HMO provider network in New London and Windham counties. If an individual physician practices in more than one office, the physician is only counted once. Physicians who practice in more than one county were placed in the county that has the largest number of the HMO’s enrollees.
14
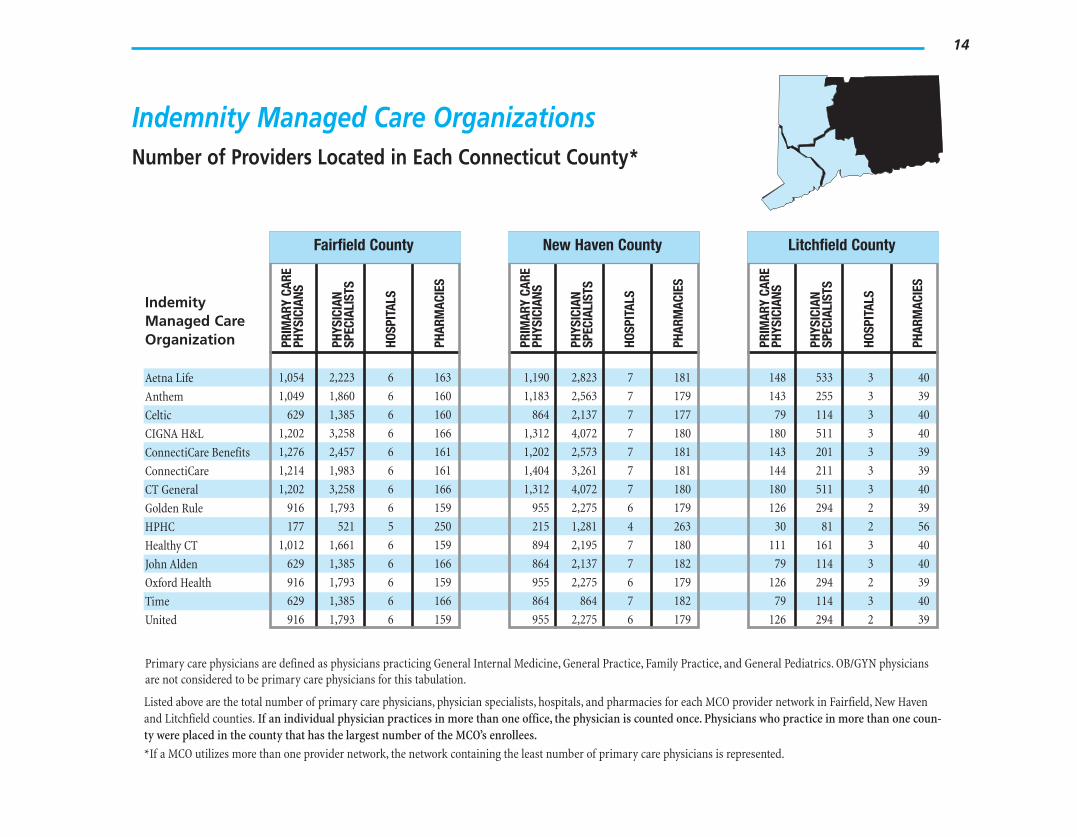
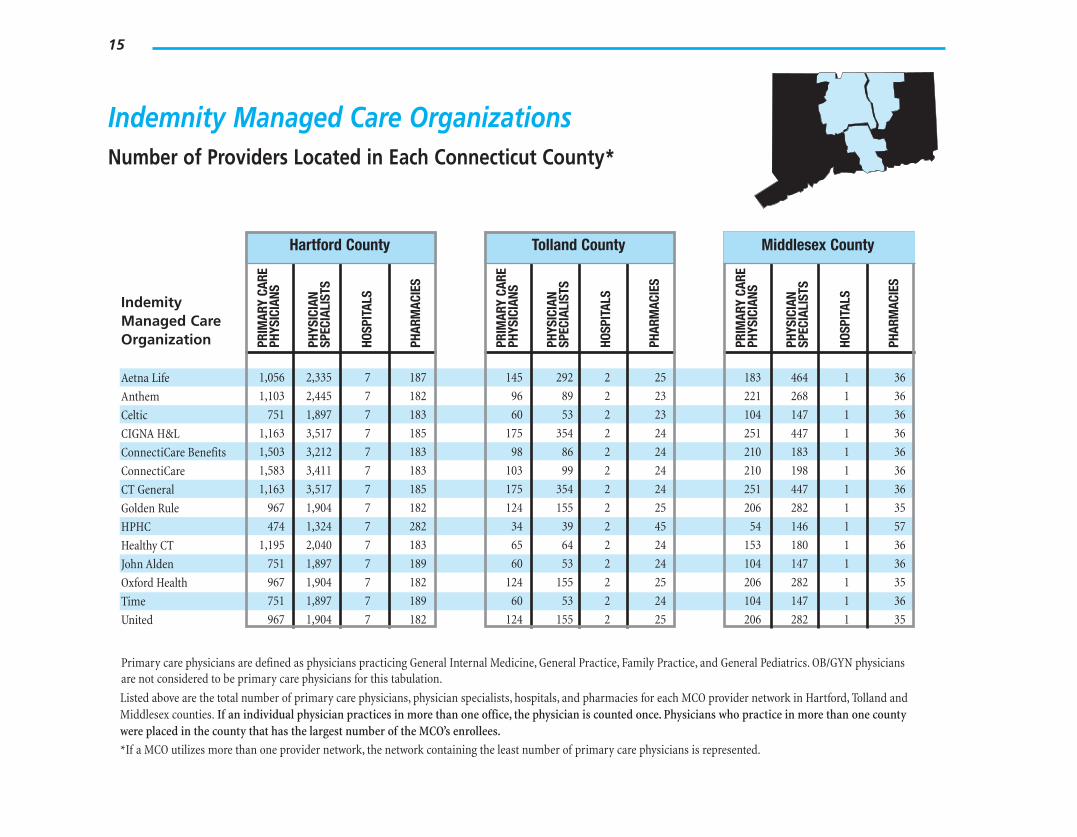
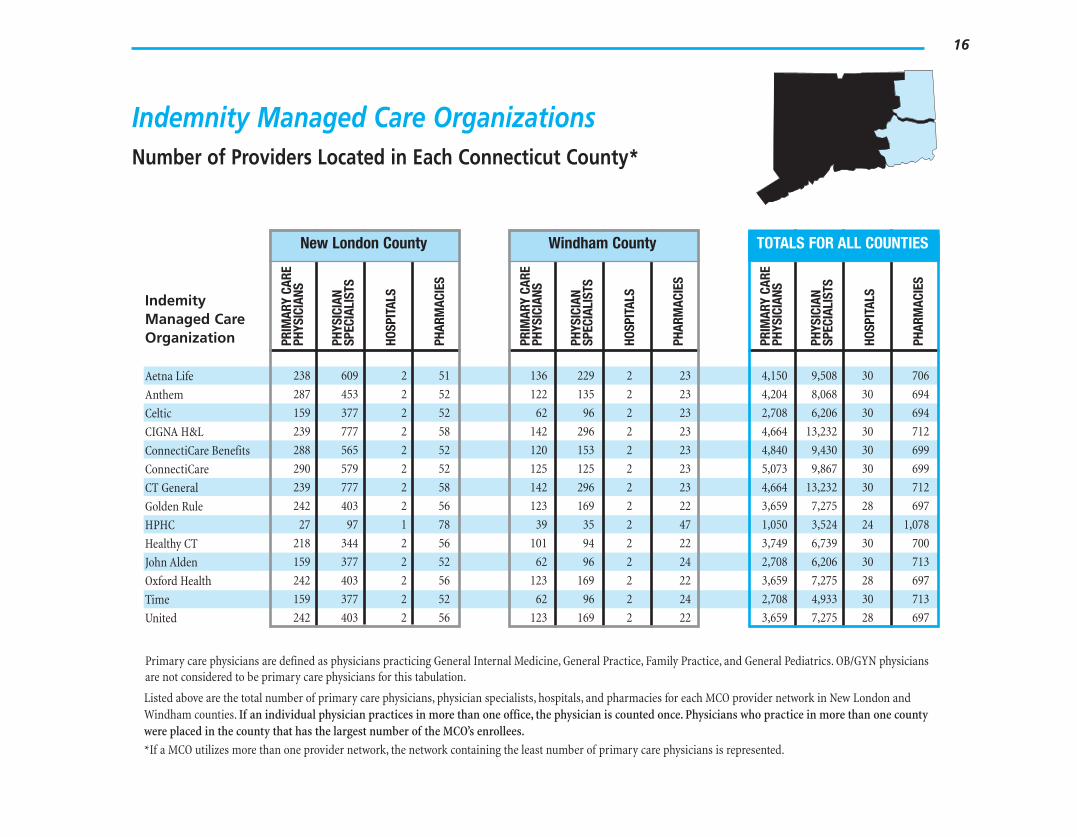
Indemnity Managed Care Organizations Number of Providers Located in Each Connecticut County*
Fairfield County
PRIM
ARY
CARE
PHYS
ICIA
NS
PHYS
ICIA
NSP
ECIA
LIST
S
HOSP
ITAL
S
PHAR
MAC
IES
1,054 2,223 6 163
1,049 1,860 6 160
629 1,385 6 160
1,202 3,258 6 166
1,276 2,457 6 161
1,214 1,983 6 161
1,202 3,258 6 166
916 1,793 6 159
177 521 5 250
1,012 1,661 6 159
629 1,385 6 166
916 1,793 6 159
629 1,385 6 166
916 1,793 6 159
New Haven County
PRIM
ARY
CARE
PHYS
ICIA
NS
PHYS
ICIA
NSP
ECIA
LIST
S
HOSP
ITAL
S
PHAR
MAC
IES
1,190 2,823 7 181
1,183 2,563 7 179
864 2,137 7 177
1,312 4,072 7 180
1,202 2,573 7 181
1,404 3,261 7 181
1,312 4,072 7 180
955 2,275 6 179
215 1,281 4 263
894 2,195 7 180
864 2,137 7 182
955 2,275 6 179
864 864 7 182
955 2,275 6 179
Litchfield County
PRIM
ARY
CARE
PHYS
ICIA
NS
PHYS
ICIA
NSP
ECIA
LIST
S
HOSP
ITAL
S
PHAR
MAC
IES
148 533 3 40
143 255 3 39
79 114 3 40
180 511 3 40
143 201 3 39
144 211 3 39
180 511 3 40
126 294 2 39
30 81 2 56
111 161 3 40
79 114 3 40
126 294 2 39
79 114 3 40
126 294 2 39
Indemity Managed Care Organization
Anthem
Aetna Life
Celtic
CIGNA H&L
ConnectiCare Benefits
ConnectiCare
CT General
Golden Rule
HPHC
Healthy CT
John Alden
Oxford Health
Time
United
Primary care physicians are defined as physicians practicing General Internal Medicine, General Practice, Family Practice, and General Pediatrics. OB/GYN physicians are not considered to be primary care physicians for this tabulation.
Listed above are the total number of primary care physicians, physician specialists, hospitals, and pharmacies for each MCO provider network in Fairfield, New Haven and Litchfield counties. If an individual physician practices in more than one office, the physician is counted once. Physicians who practice in more than one county were placed in the county that has the largest number of the MCO’s enrollees.
*If a MCO utilizes more than one provider network, the network containing the least number of primary care physicians is represented.
15
Indemnity Managed Care Organizations Number of Providers Located in Each Connecticut County*
Indemity Managed Care Organization
Aetna Life
Anthem
Celtic
CIGNA H&L
ConnectiCare Benefits
ConnectiCare
CT General
Golden Rule
HPHC
Healthy CT
John Alden
Oxford Health
Time
United
Hartford County PR
IMAR
Y CA
REPH
YSIC
IANS
PHYS
ICIA
NSP
ECIA
LIST
S
HOSP
ITAL
S
PHAR
MAC
IES
1,056 2,335 7 187
1,103 2,445 7 182
751 1,897 7 183
1,163 3,517 7 185
1,503 3,212 7 183
1,583 3,411 7 183
1,163 3,517 7 185
967 1,904 7 182
474 1,324 7 282
1,195 2,040 7 183
751 1,897 7 189
967 1,904 7 182
751 1,897 7 189
967 1,904 7 182
Tolland County
PRIM
ARY
CARE
PHYS
ICIA
NS
PHYS
ICIA
NSP
ECIA
LIST
S
HOSP
ITAL
S
PHAR
MAC
IES
145 292 2 25
96 89 2 23
60 53 2 23
175 354 2 24
98 86 2 24
103 99 2 24
175 354 2 24
124 155 2 25
34 39 2 45
65 64 2 24
60 53 2 24
124 155 2 25
60 53 2 24
124 155 2 25
Middlesex County
PRIM
ARY
CARE
PHYS
ICIA
NS
PHYS
ICIA
NSP
ECIA
LIST
S
HOSP
ITAL
S
PHAR
MAC
IES
183 464 1 36
221 268 1 36
104 147 1 36
251 447 1 36
210 183 1 36
210 198 1 36
251 447 1 36
206 282 1 35
54 146 1 57
153 180 1 36
104 147 1 36
206 282 1 35
104 147 1 36
206 282 1 35
Primary care physicians are defined as physicians practicing General Internal Medicine, General Practice, Family Practice, and General Pediatrics. OB/GYN physicians are not considered to be primary care physicians for this tabulation.
Listed above are the total number of primary care physicians, physician specialists, hospitals, and pharmacies for each MCO provider network in Hartford, Tolland and Middlesex counties. If an individual physician practices in more than one office, the physician is counted once. Physicians who practice in more than one county were placed in the county that has the largest number of the MCO’s enrollees.
*If a MCO utilizes more than one provider network, the network containing the least number of primary care physicians is represented.
16
Indemnity Managed Care Organizations Number of Providers Located in Each Connecticut County*
Indemity Managed Care Organization
Aetna Life
Anthem
Celtic
CIGNA H&L
ConnectiCare Benefits
ConnectiCare
CT General
Golden Rule
HPHC
Healthy CT
John Alden
Oxford Health
Time
United
New London County
PRIM
ARY
CARE
PHYS
ICIA
NS
PHYS
ICIA
NSP
ECIA
LIST
S
HOSP
ITAL
S
PHAR
MAC
IES
238 609 2 51
287 453 2 52
159 377 2 52
239 777 2 58
288 565 2 52
290 579 2 52
239 777 2 58
242 403 2 56
27 97 1 78
218 344 2 56
159 377 2 52
242 403 2 56
159 377 2 52
242 403 2 56
Windham County
PRIM
ARY
CARE
PHYS
ICIA
NS
PHYS
ICIA
NSP
ECIA
LIST
S
HOSP
ITAL
S
PHAR
MAC
IES
136 229 2 23
122 135 2 23
62 96 2 23
142 296 2 23
120 153 2 23
125 125 2 23
142 296 2 23
123 169 2 22
39 35 2 47
101 94 2 22
62 96 2 24
123 169 2 22
62 96 2 24
123 169 2 22
TOTALS FOR ALL COUNTIES
PRIM
ARY
CARE
PHYS
ICIA
NS
PHYS
ICIA
NSP
ECIA
LIST
S
HOSP
ITAL
S
PHAR
MAC
IES
4,150 9,508 30 706
4,204 8,068 30 694
2,708 6,206 30 694
4,664 13,232 30 712
4,840 9,430 30 699
5,073 9,867 30 699
4,664 13,232 30 712
3,659 7,275 28 697
1,050 3,524 24 1,078
3,749 6,739 30 700
2,708 6,206 30 713
3,659 7,275 28 697
2,708 4,933 30 713
3,659 7,275 28 697
Primary care physicians are defined as physicians practicing General Internal Medicine, General Practice, Family Practice, and General Pediatrics. OB/GYN physicians are not considered to be primary care physicians for this tabulation.
Listed above are the total number of primary care physicians, physician specialists, hospitals, and pharmacies for each MCO provider network in New London and Windham counties. If an individual physician practices in more than one office, the physician is counted once. Physicians who practice in more than one county were placed in the county that has the largest number of the MCO’s enrollees.
*If a MCO utilizes more than one provider network, the network containing the least number of primary care physicians is represented.
17
Quality Measures
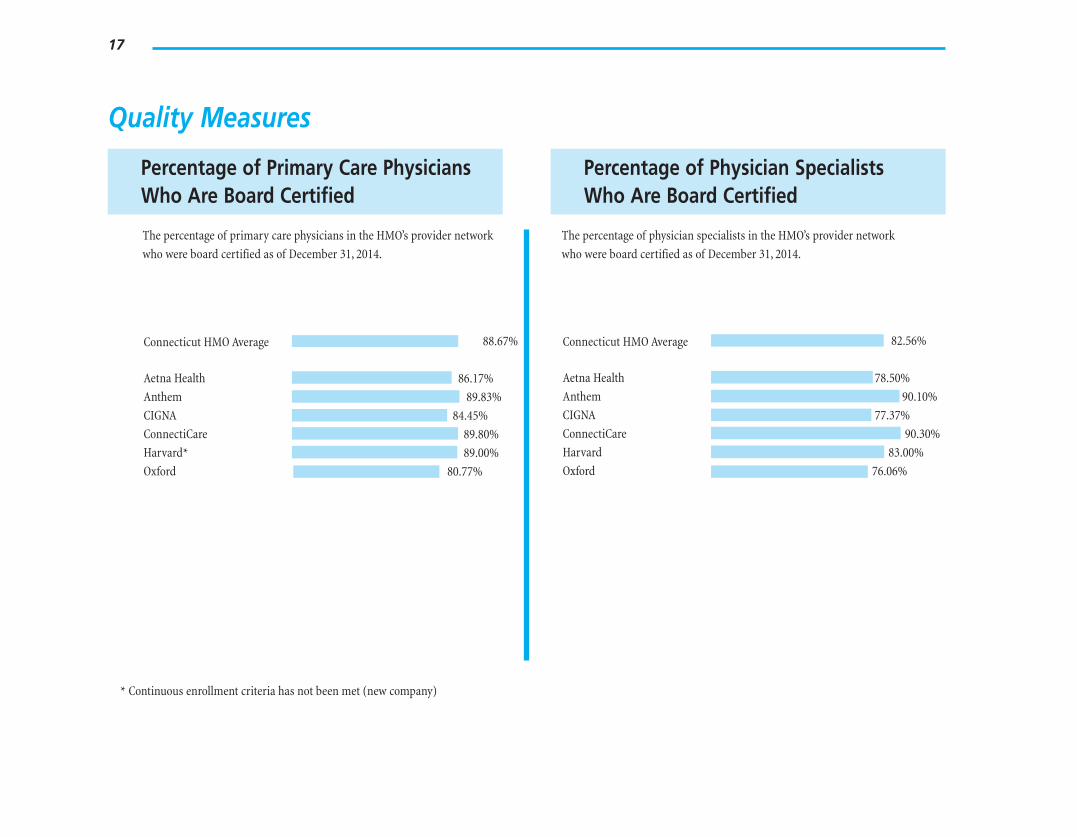
Percentage of Primary Care Physicians Who Are Board Certified
The percentage of primary care physicians in the HMO’s provider network
who were board certified as of December 31, 2014.
Connecticut HMO Average 88.67%
Aetna Health 86.17%
Anthem 89.83%
CIGNA 84.45%
ConnectiCare 89.80%
Harvard* 89.00%
Oxford 80.77%
Percentage of Physician Specialists Who Are Board Certified
The percentage of physician specialists in the HMO’s provider network
who were board certified as of December 31, 2014.
Connecticut HMO Average 82.56%
Aetna Health
Anthem
CIGNA
ConnectiCare
Harvard
Oxford
78.50%
90.10%
77.37%
90.30%
83.00%
76.06%
* Continuous enrollment criteria has not been met (new company)
18
Quality Measures
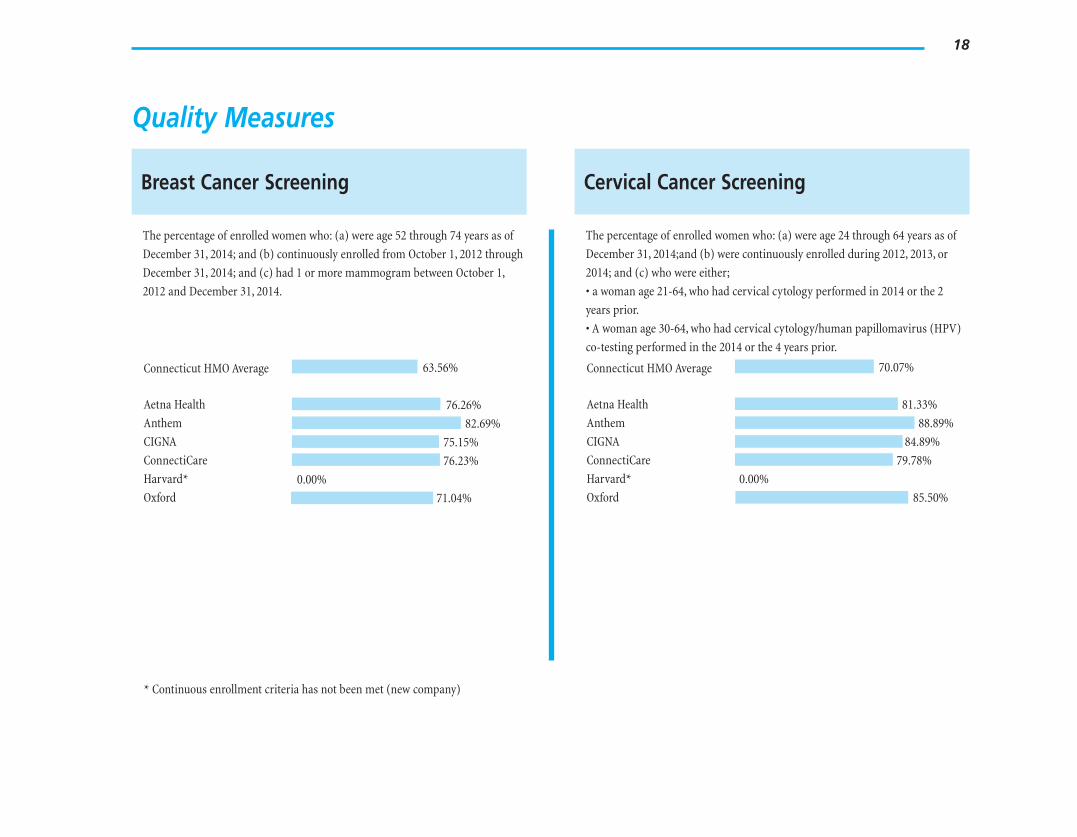
Breast Cancer Screening
The percentage of enrolled women who: (a) were age 52 through 74 years as of
December 31, 2014; and (b) continuously enrolled from October 1, 2012 through
December 31, 2014; and (c) had 1 or more mammogram between October 1,
2012 and December 31, 2014.
Connecticut HMO Average 63.56%
Aetna Health 76.26%
Anthem 82.69%
CIGNA 75.15%
ConnectiCare 76.23%
Harvard* 0.00%
Oxford 71.04%
* Continuous enrollment criteria has not been met (new company)
Cervical Cancer Screening
The percentage of enrolled women who: (a) were age 24 through 64 years as of
December 31, 2014;and (b) were continuously enrolled during 2012, 2013, or
2014; and (c) who were either;
• a woman age 21-64, who had cervical cytology performed in 2014 or the 2
years prior.
• A woman age 30-64, who had cervical cytology/human papillomavirus (HPV)
co-testing performed in the 2014 or the 4 years prior.
Connecticut HMO Average 70.07%
Aetna Health 81.33%
Anthem 88.89%
CIGNA 84.89%
ConnectiCare 79.78%
Harvard* 0.00%
Oxford 85.50%
19
Quality Measures
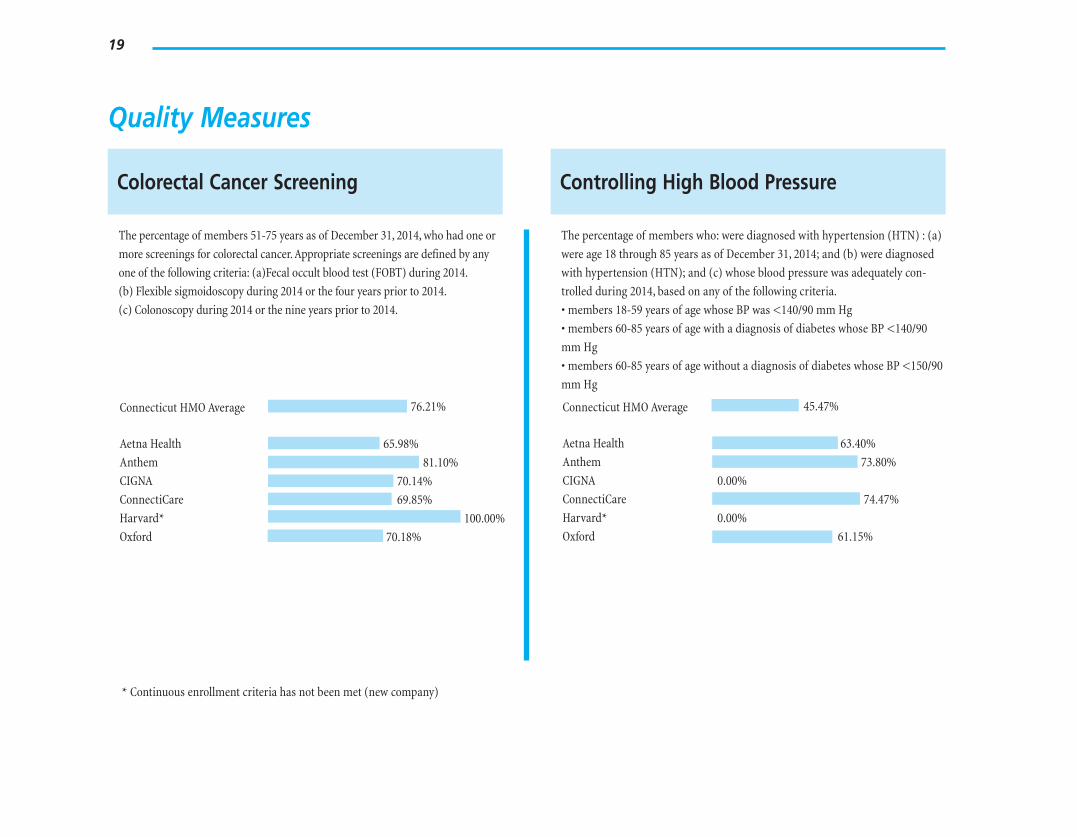
Colorectal Cancer Screening
The percentage of members 51-75 years as of December 31, 2014, who had one or
more screenings for colorectal cancer. Appropriate screenings are defined by any
one of the following criteria: (a)Fecal occult blood test (FOBT) during 2014.
(b) Flexible sigmoidoscopy during 2014 or the four years prior to 2014.
(c) Colonoscopy during 2014 or the nine years prior to 2014.
Connecticut HMO Average 76.21%
Aetna Health 65.98%
Anthem 81.10%
CIGNA 70.14%
ConnectiCare 69.85%
Harvard* 100.00%
Oxford 70.18%
* Continuous enrollment criteria has not been met (new company)
Controlling High Blood Pressure
The percentage of members who: were diagnosed with hypertension (HTN) : (a)
were age 18 through 85 years as of December 31, 2014; and (b) were diagnosed
with hypertension (HTN); and (c) whose blood pressure was adequately con
trolled during 2014, based on any of the following criteria.
• members 18-59 years of age whose BP was <140/90 mm Hg
• members 60-85 years of age with a diagnosis of diabetes whose BP <140/90
mm Hg
• members 60-85 years of age without a diagnosis of diabetes whose BP <150/90
mm Hg
Connecticut HMO Average 45.47%
Aetna Health 63.40%
Anthem 73.80%
CIGNA 0.00%
ConnectiCare 74.47%
Harvard* 0.00%
Oxford 61.15%
20
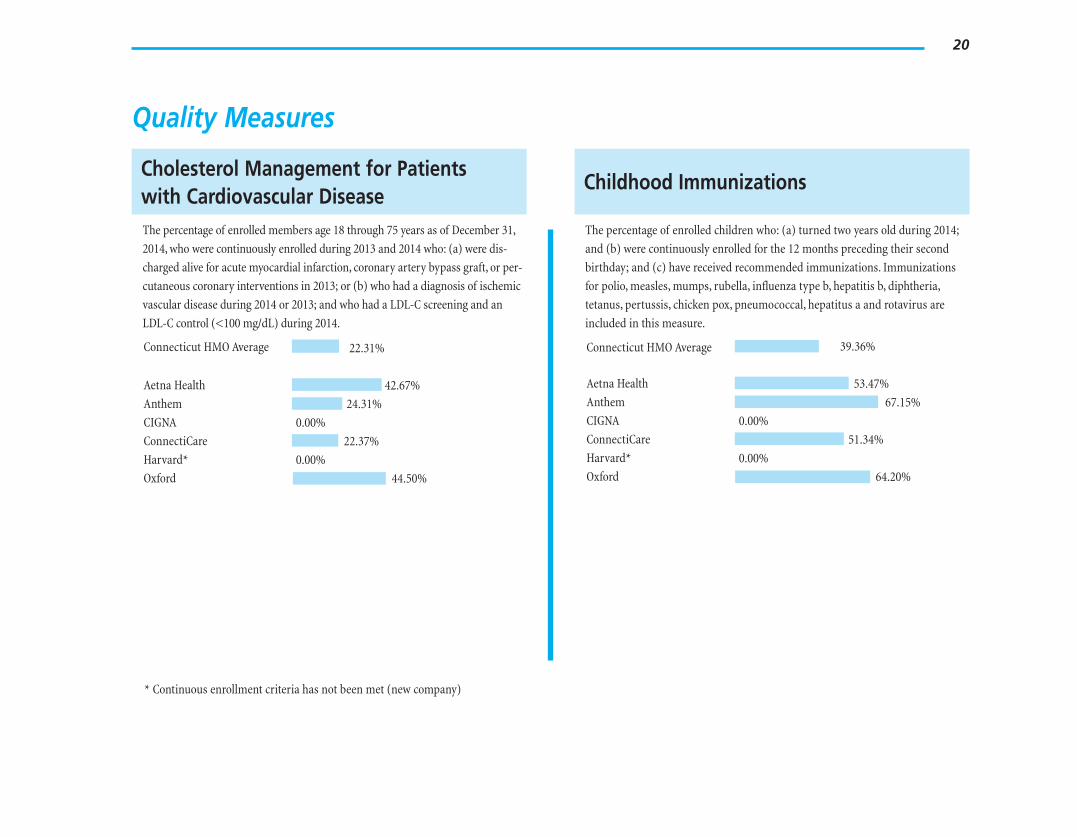
Quality Measures
Cholesterol Management for Patients with Cardiovascular Disease The percentage of enrolled members age 18 through 75 years as of December 31,
2014, who were continuously enrolled during 2013 and 2014 who: (a) were dis
charged alive for acute myocardial infarction, coronary artery bypass graft, or per-
cutaneous coronary interventions in 2013; or (b) who had a diagnosis of ischemic
vascular disease during 2014 or 2013; and who had a LDL-C screening and an
LDL-C control (<100 mg/dL) during 2014.
Connecticut HMO Average 22.31%
Aetna Health 42.67%
Anthem 24.31%
CIGNA 0.00%
ConnectiCare 22.37%
Harvard* 0.00%
Oxford 44.50%
Childhood Immunizations
The percentage of enrolled children who: (a) turned two years old during 2014;
and (b) were continuously enrolled for the 12 months preceding their second
birthday; and (c) have received recommended immunizations. Immunizations
for polio, measles, mumps, rubella, influenza type b, hepatitis b, diphtheria,
tetanus, pertussis, chicken pox, pneumococcal, hepatitus a and rotavirus are
included in this measure.
Connecticut HMO Average 39.36%
Aetna Health 53.47%
Anthem 67.15%
CIGNA 0.00%
ConnectiCare 51.34%
Harvard* 0.00%
Oxford 64.20%
* Continuous enrollment criteria has not been met (new company)
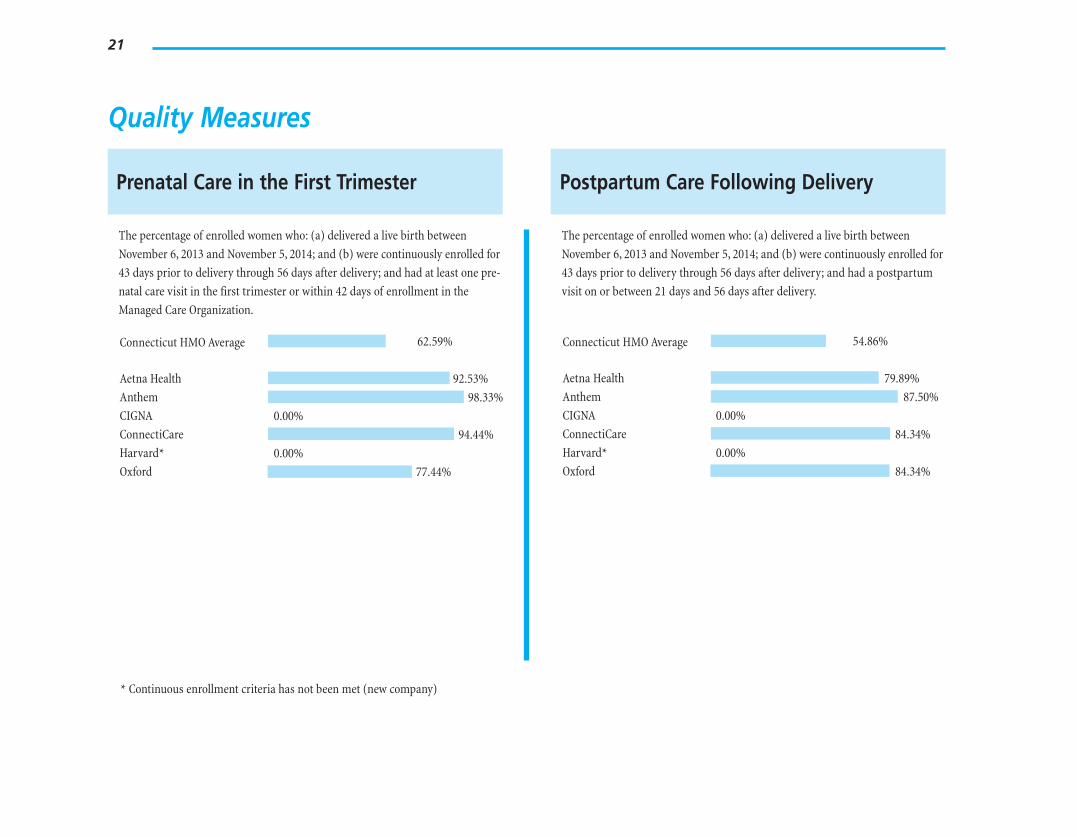
Connecticut HMO Average 62.59%
Aetna Health 92.53%
Anthem 98.33%
CIGNA 0.00%
ConnectiCare 94.44%
Harvard* 0.00%
Oxford 77.44%
Connecticut HMO Average 54.86%
Aetna Health 79.89%
Anthem 87.50%
CIGNA 0.00%
ConnectiCare 84.34%
Harvard* 0.00%
Oxford 84.34%
21
Quality Measures
Prenatal Care in the First Trimester
The percentage of enrolled women who: (a) delivered a live birth between
November 6, 2013 and November 5, 2014; and (b) were continuously enrolled for
43 days prior to delivery through 56 days after delivery; and had at least one pre
natal care visit in the first trimester or within 42 days of enrollment in the
Managed Care Organization.
Postpartum Care Following Delivery
The percentage of enrolled women who: (a) delivered a live birth between
November 6, 2013 and November 5, 2014; and (b) were continuously enrolled for
43 days prior to delivery through 56 days after delivery; and had a postpartum
visit on or between 21 days and 56 days after delivery.
* Continuous enrollment criteria has not been met (new company)
22
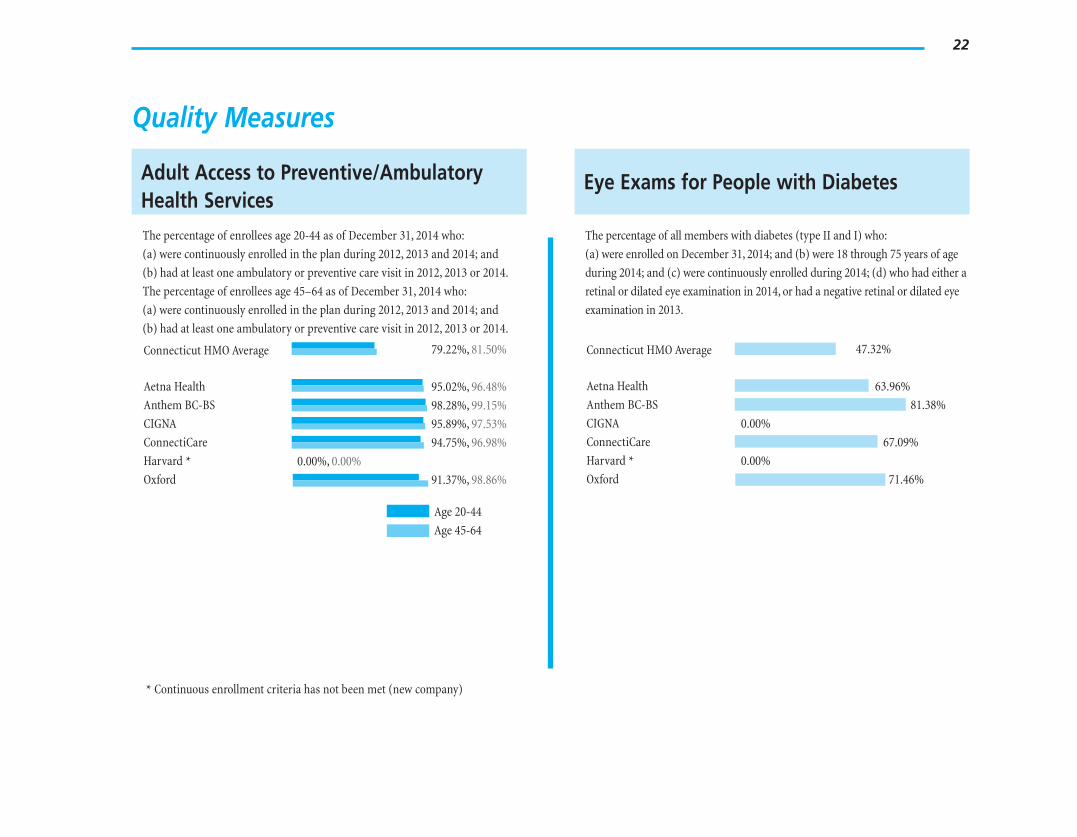
Quality Measures
Adult Access to Preventive/Ambulatory Health Services The percentage of enrollees age 20-44 as of December 31, 2014 who:
(a) were continuously enrolled in the plan during 2012, 2013 and 2014; and
(b) had at least one ambulatory or preventive care visit in 2012, 2013 or 2014.
The percentage of enrollees age 45–64 as of December 31, 2014 who:
(a) were continuously enrolled in the plan during 2012, 2013 and 2014; and
(b) had at least one ambulatory or preventive care visit in 2012, 2013 or 2014.
Connecticut HMO Average 79.22%, 81.50%
Aetna Health 95.02%, 96.48%
Anthem BC-BS 98.28%, 99.15%
CIGNA 95.89%, 97.53%
ConnectiCare 94.75%, 96.98%
Harvard * 0.00%, 0.00%
Oxford 91.37%, 98.86%
Age 20-44
Age 45-64
* Continuous enrollment criteria has not been met (new company)
Eye Exams for People with Diabetes
The percentage of all members with diabetes (type II and I) who:
(a) were enrolled on December 31, 2014; and (b) were 18 through 75 years of age
during 2014; and (c) were continuously enrolled during 2014; (d) who had either a
retinal or dilated eye examination in 2014, or had a negative retinal or dilated eye
examination in 2013.
Connecticut HMO Average 47.32%
Aetna Health 63.96%
Anthem BC-BS 81.38%
CIGNA 0.00%
ConnectiCare 67.09%
Harvard * 0.00%
Oxford 71.46%
23
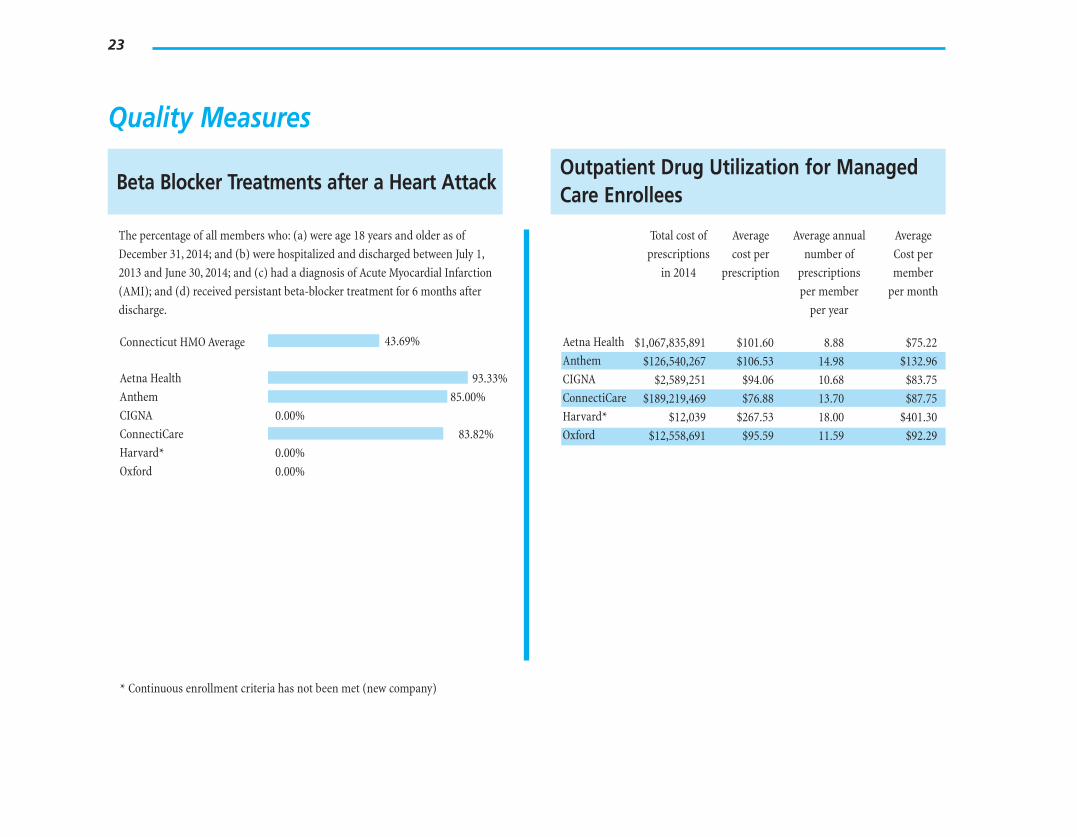
Quality Measures
Beta Blocker Treatments after a Heart Attack
The percentage of all members who: (a) were age 18 years and older as of
December 31, 2014; and (b) were hospitalized and discharged between July 1,
2013 and June 30, 2014; and (c) had a diagnosis of Acute Myocardial Infarction
(AMI); and (d) received persistant beta-blocker treatment for 6 months after
discharge.
Connecticut HMO Average 43.69%
Aetna Health 93.33%
Anthem 85.00%
CIGNA 0.00%
ConnectiCare 83.82%
Harvard* 0.00%
Oxford 0.00%
Outpatient Drug Utilization for Managed Care Enrollees
Total cost of Average Average annual Average
prescriptions cost per number of Cost per
in 2014 prescription prescriptions member
per member per month
per year
Aetna Health $1,067,835,891 $101.60 8.88 $75.22 Anthem $126,540,267 $106.53 14.98 $132.96 CIGNA $2,589,251 $94.06 10.68 $83.75 ConnectiCare $189,219,469 $76.88 13.70 $87.75 Harvard* $12,039 $267.53 18.00 $401.30 Oxford $12,558,691 $95.59 11.59 $92.29
* Continuous enrollment criteria has not been met (new company)
24
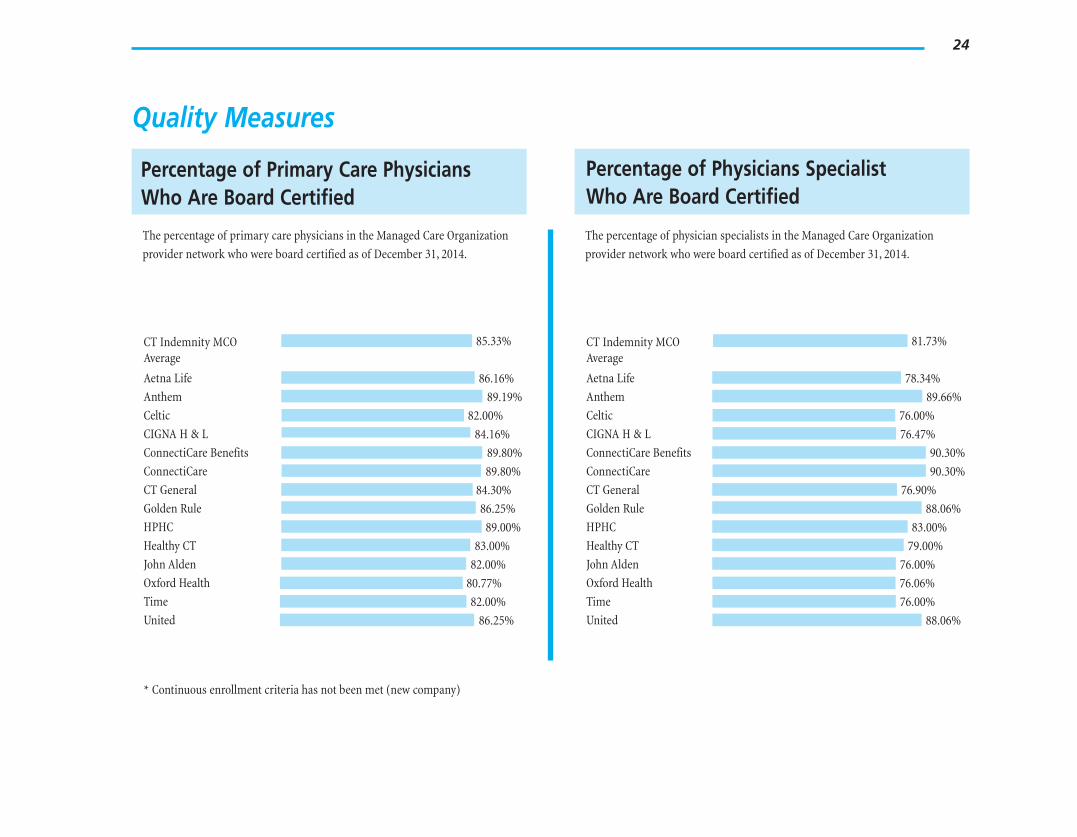
Quality Measures
Percentage of Primary Care Physicians Who Are Board Certified
The percentage of primary care physicians in the Managed Care Organization
provider network who were board certified as of December 31, 2014.
CT Indemnity MCO 85.33% Average
Aetna Life 86.16%
Anthem 89.19%
Celtic 82.00%
CIGNA H & L 84.16%
ConnectiCare Benefits 89.80%
ConnectiCare 89.80%
CT General 84.30%
Golden Rule 86.25%
HPHC 89.00%
Healthy CT 83.00%
John Alden 82.00%
Oxford Health 80.77%
Time 82.00%
United 86.25%
* Continuous enrollment criteria has not been met (new company)
Percentage of Physicians Specialist Who Are Board Certified
The percentage of physician specialists in the Managed Care Organization
provider network who were board certified as of December 31, 2014.
CT Indemnity MCO 81.73% Average
Aetna Life 78.34%
Anthem 89.66%
Celtic 76.00%
CIGNA H & L 76.47%
ConnectiCare Benefits 90.30%
ConnectiCare 90.30%
CT General 76.90%
Golden Rule 88.06%
HPHC 83.00%
Healthy CT 79.00%
John Alden 76.00%
Oxford Health 76.06%
Time 76.00%
United 88.06%
25
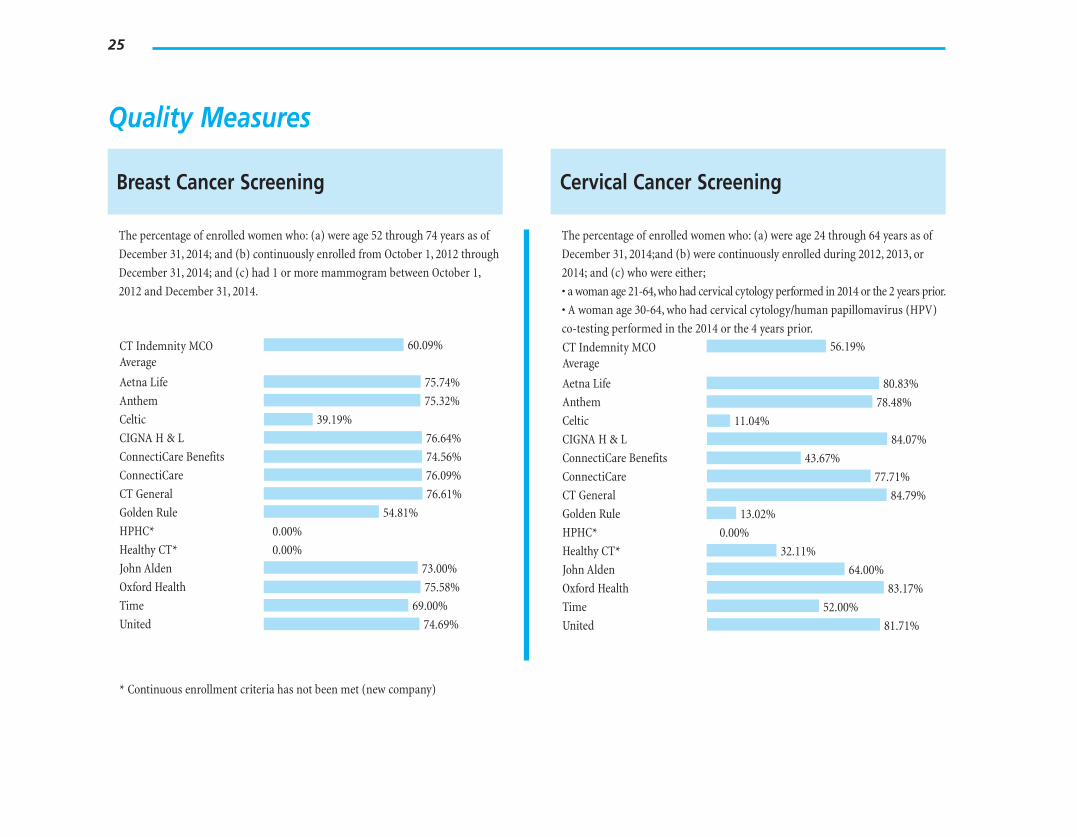
Quality Measures
Breast Cancer Screening
The percentage of enrolled women who: (a) were age 52 through 74 years as of
December 31, 2014; and (b) continuously enrolled from October 1, 2012 through
December 31, 2014; and (c) had 1 or more mammogram between October 1,
2012 and December 31, 2014.
CT Indemnity MCO 60.09% Average
Aetna Life 75.74%
Anthem 75.32%
Celtic 39.19%
CIGNA H & L 76.64%
ConnectiCare Benefits 74.56%
ConnectiCare 76.09%
CT General 76.61%
Golden Rule 54.81%
HPHC* 0.00%
Healthy CT* 0.00%
John Alden 73.00%
Oxford Health 75.58%
Time 69.00%
United 74.69%
* Continuous enrollment criteria has not been met (new company)
Cervical Cancer Screening
The percentage of enrolled women who: (a) were age 24 through 64 years as of
December 31, 2014;and (b) were continuously enrolled during 2012, 2013, or
2014; and (c) who were either;
• a woman age 21-64, who had cervical cytology performed in 2014 or the 2 years prior.
• A woman age 30-64, who had cervical cytology/human papillomavirus (HPV)
co-testing performed in the 2014 or the 4 years prior.
CT Indemnity MCO 56.19% Average
Aetna Life 80.83%
Anthem 78.48%
Celtic 11.04%
CIGNA H & L 84.07%
ConnectiCare Benefits 43.67%
ConnectiCare 77.71%
CT General 84.79%
Golden Rule 13.02%
HPHC* 0.00%
Healthy CT* 32.11%
John Alden 64.00%
Oxford Health 83.17%
Time 52.00%
United 81.71%
26
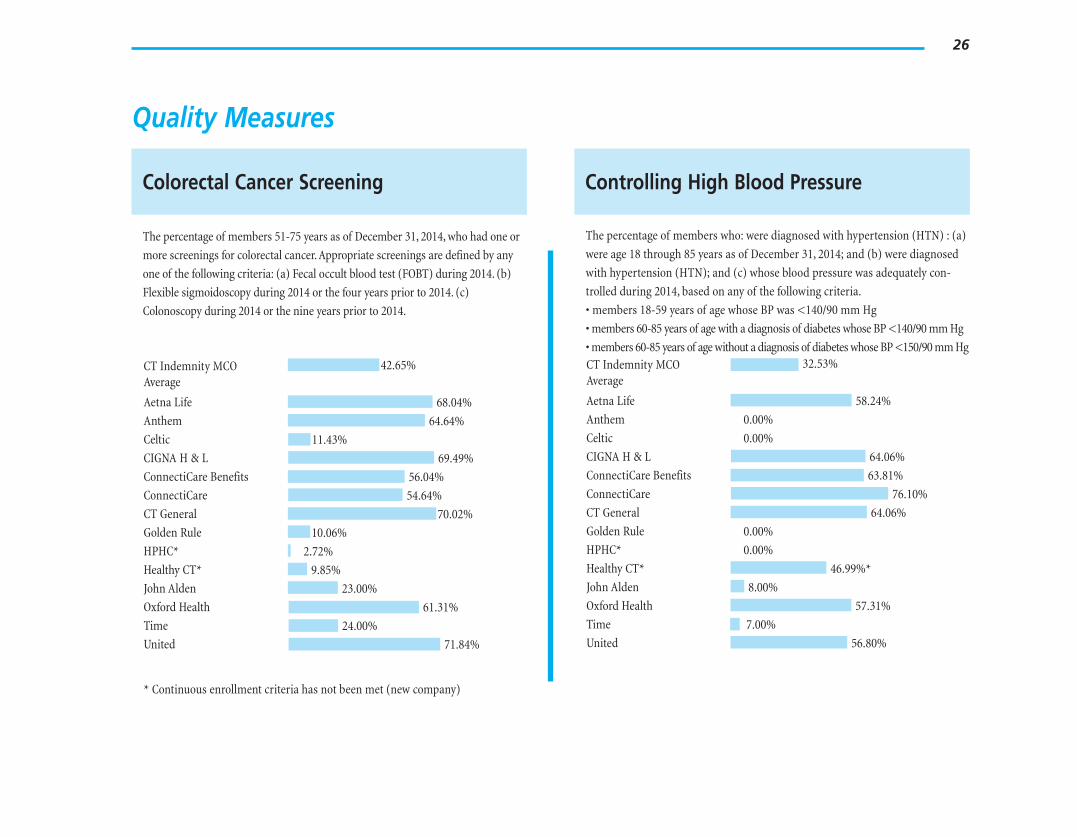
Quality Measures
Colorectal Cancer Screening
The percentage of members 51-75 years as of December 31, 2014, who had one or
more screenings for colorectal cancer. Appropriate screenings are defined by any
one of the following criteria: (a) Fecal occult blood test (FOBT) during 2014. (b)
Flexible sigmoidoscopy during 2014 or the four years prior to 2014. (c)
Colonoscopy during 2014 or the nine years prior to 2014.
CT Indemnity MCO 42.65% Average
Aetna Life 68.04%
Anthem 64.64%
Celtic 11.43%
CIGNA H & L 69.49%
ConnectiCare Benefits 56.04%
ConnectiCare 54.64%
CT General 70.02%
Golden Rule 10.06%
HPHC* 2.72%
Healthy CT* 9.85%
John Alden 23.00%
Oxford Health 61.31%
Time 24.00%
United 71.84%
* Continuous enrollment criteria has not been met (new company)
Controlling High Blood Pressure
The percentage of members who: were diagnosed with hypertension (HTN) : (a)
were age 18 through 85 years as of December 31, 2014; and (b) were diagnosed
with hypertension (HTN); and (c) whose blood pressure was adequately con
trolled during 2014, based on any of the following criteria.
• members 18-59 years of age whose BP was <140/90 mm Hg
• members 60-85 years of age with a diagnosis of diabetes whose BP <140/90 mm Hg
• members 60-85 years of age without a diagnosis of diabetes whose BP <150/90 mm Hg CT Indemnity MCO 32.53% Average
Aetna Life 58.24%
Anthem 0.00%
Celtic 0.00%
CIGNA H & L 64.06%
ConnectiCare Benefits 63.81%
ConnectiCare 76.10%
CT General 64.06%
Golden Rule 0.00%
HPHC* 0.00%
Healthy CT* 46.99%*
John Alden 8.00%
Oxford Health 57.31%
Time 7.00%
United 56.80%
27
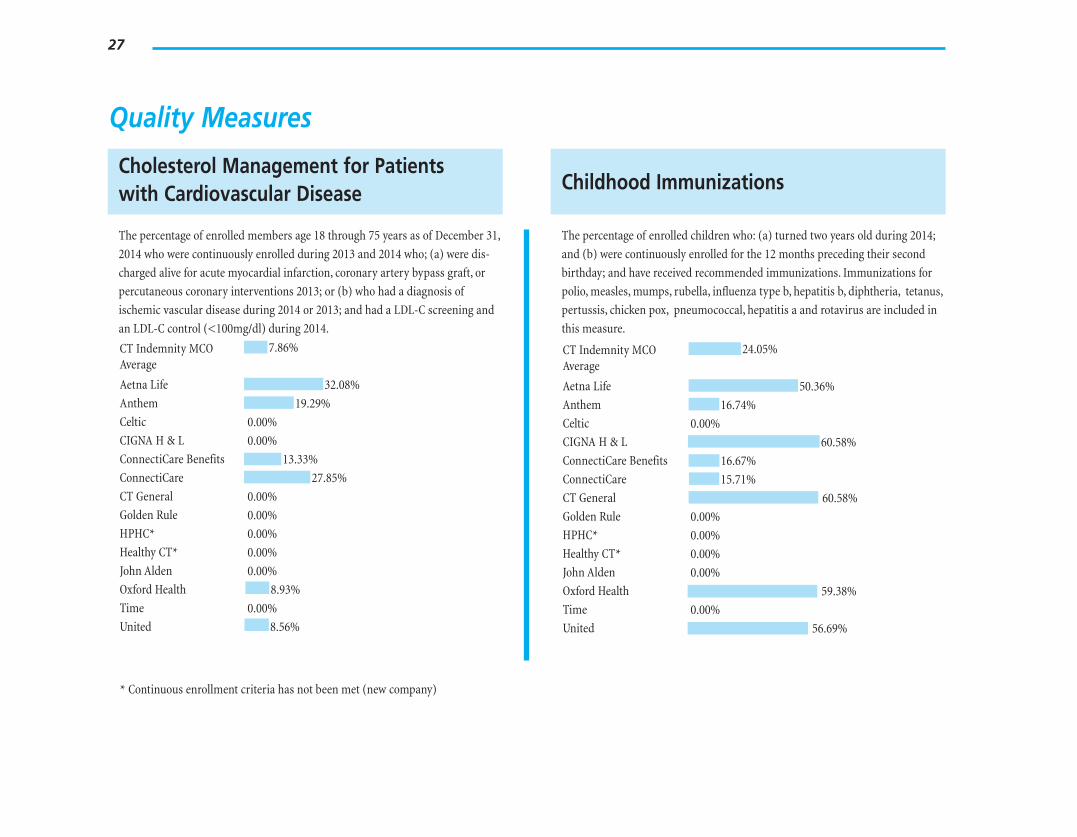
Quality Measures
Cholesterol Management for Patients with Cardiovascular Disease
The percentage of enrolled members age 18 through 75 years as of December 31,
2014 who were continuously enrolled during 2013 and 2014 who; (a) were dis
charged alive for acute myocardial infarction, coronar y artery bypass graft, or
percutaneous coronary interventions 2013; or (b) who had a diagnosis of
ischemic vascular disease during 2014 or 2013; and had a LDL-C screening and
an LDL-C control (<100mg/dl) during 2014.
CT Indemnity MCO 7.86% Average
Aetna Life 32.08%
Anthem 19.29%
Celtic 0.00%
CIGNA H & L 0.00%
ConnectiCare Benefits 13.33%
ConnectiCare 27.85%
CT General 0.00%
Golden Rule 0.00%
HPHC* 0.00%
Healthy CT* 0.00%
John Alden 0.00%
Oxford Health 8.93%
Time 0.00%
United 8.56%
* Continuous enrollment criteria has not been met (new company)
Childhood Immunizations
The percentage of enrolled children who: (a) turned two years old during 2014;
and (b) were continuously enrolled for the 12 months preceding their second
birthday; and have received recommended immunizations. Immunizations for
polio, measles, mumps, rubella, influenza type b, hepatitis b, diphtheria, tetanus,
pertussis, chicken pox, pneumococcal, hepatitis a and rotavirus are included in
this measure.
CT Indemnity MCO 24.05% Average
Aetna Life 50.36%
Anthem 16.74%
Celtic 0.00%
CIGNA H & L 60.58%
ConnectiCare Benefits 16.67%
ConnectiCare 15.71%
CT General 60.58%
Golden Rule 0.00%
HPHC* 0.00%
Healthy CT* 0.00%
John Alden 0.00%
Oxford Health 59.38%
Time 0.00%
United 56.69%
28
Quality Measures
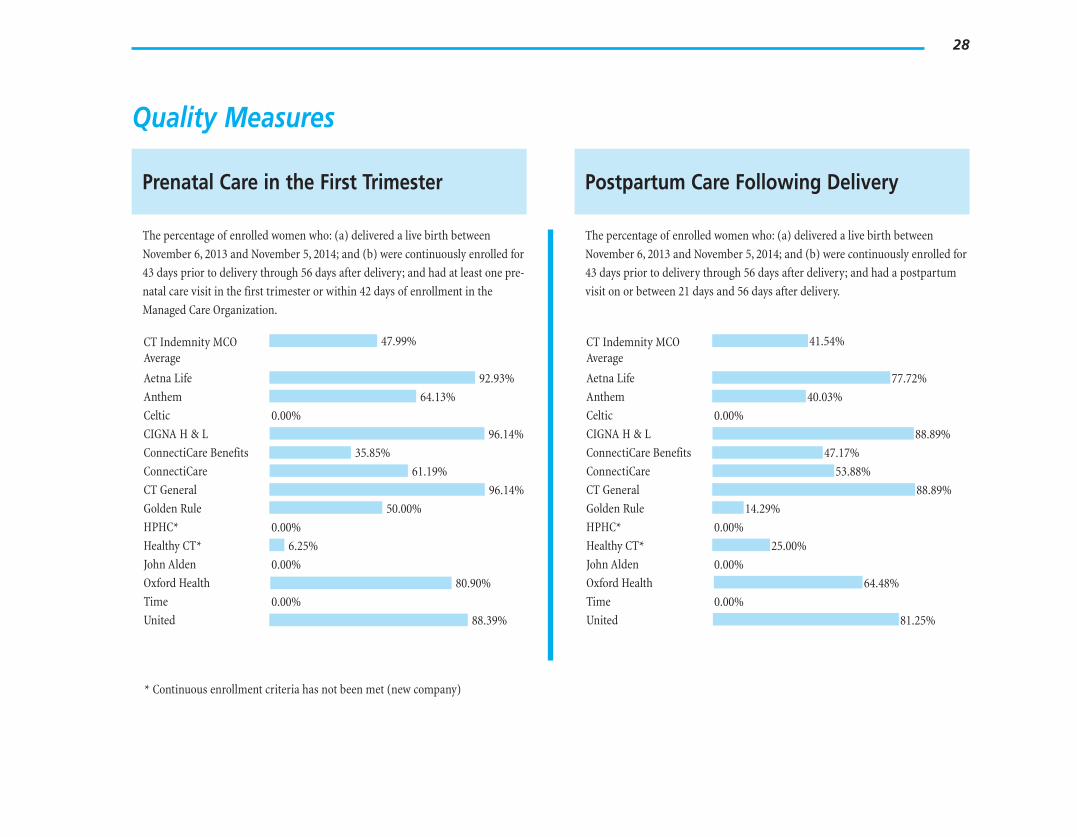
Prenatal Care in the First Trimester
The percentage of enrolled women who: (a) delivered a live birth between
November 6, 2013 and November 5, 2014; and (b) were continuously enrolled for
43 days prior to delivery through 56 days after delivery; and had at least one pre
natal care visit in the first trimester or within 42 days of enrollment in the
Managed Care Organization.
CT Indemnity MCO 47.99% Average
Aetna Life 92.93%
Anthem 64.13%
Celtic 0.00%
CIGNA H & L 96.14%
ConnectiCare Benefits 35.85%
ConnectiCare 61.19%
CT General 96.14%
Golden Rule 50.00%
HPHC* 0.00%
Healthy CT* 6.25%
John Alden 0.00%
Oxford Health 80.90%
Time 0.00%
United 88.39%
* Continuous enrollment criteria has not been met (new company)
Postpartum Care Following Delivery
The percentage of enrolled women who: (a) delivered a live birth between
November 6, 2013 and November 5, 2014; and (b) were continuously enrolled for
43 days prior to delivery through 56 days after delivery; and had a postpartum
visit on or between 21 days and 56 days after delivery.
CT Indemnity MCO 41.54% Average
Aetna Life 77.72%
Anthem 40.03%
Celtic 0.00%
CIGNA H & L 88.89%
ConnectiCare Benefits 47.17%
ConnectiCare 53.88%
CT General 88.89%
Golden Rule 14.29%
HPHC* 0.00%
Healthy CT* 25.00%
John Alden 0.00%
Oxford Health 64.48%
Time 0.00%
United 81.25%
29
Quality Measures
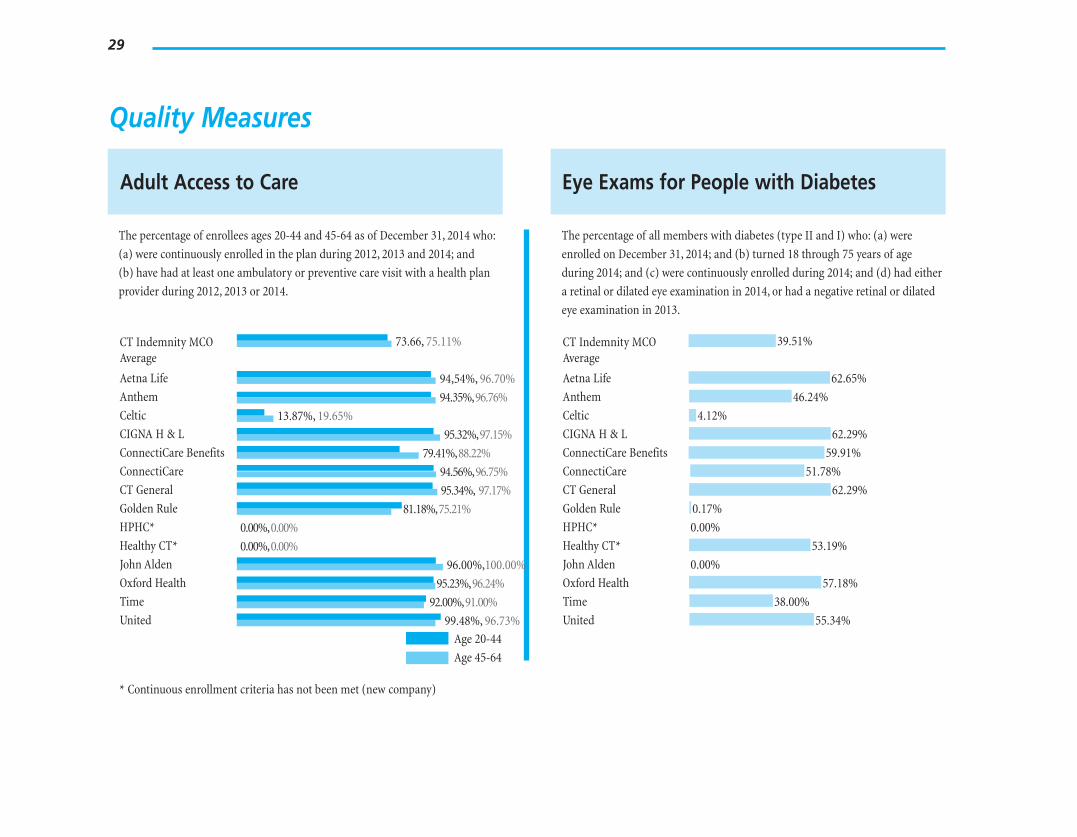
Adult Access to Care
The percentage of enrollees ages 20-44 and 45-64 as of December 31, 2014 who:
(a) were continuously enrolled in the plan during 2012, 2013 and 2014; and
(b) have had at least one ambulator y or preventive care visit with a health plan
provider during 2012, 2013 or 2014.
CT Indemnity MCO 73.66, 75.11% Average
Aetna Life 94,54%, 96.70% Anthem 94.35%,96.76% Celtic 13.87%, 19.65% CIGNA H & L 95.32%,97.15% ConnectiCare Benefits 79.41%,88.22% ConnectiCare 94.56%,96.75% CT General 95.34%, 97.17% Golden Rule 81.18%,75.21% HPHC* 0.00%,0.00% Healthy CT* 0.00%,0.00% John Alden 96.00%,100.00% Oxford Health 95.23%,96.24% Time 92.00%,91.00% United 99.48%, 96.73%
Age 20-44
Age 45-64
* Continuous enrollment criteria has not been met (new company)
Eye Exams for People with Diabetes
The percentage of all members with diabetes (type II and I) who: (a) were
enrolled on December 31, 2014; and (b) turned 18 through 75 years of age
during 2014; and (c) were continuously enrolled during 2014; and (d) had either
a retinal or dilated eye examination in 2014, or had a negative retinal or dilated
eye examination in 2013.
CT Indemnity MCO Average
39.51%
Aetna Life 62.65%
Anthem 46.24%
Celtic 4.12%
CIGNA H & L 62.29%
ConnectiCare Benefits 59.91%
ConnectiCare 51.78%
CT General 62.29%
Golden Rule 0.17%
HPHC* 0.00%
Healthy CT* 53.19%
John Alden 0.00%
Oxford Health 57.18%
Time 38.00%
United 55.34%
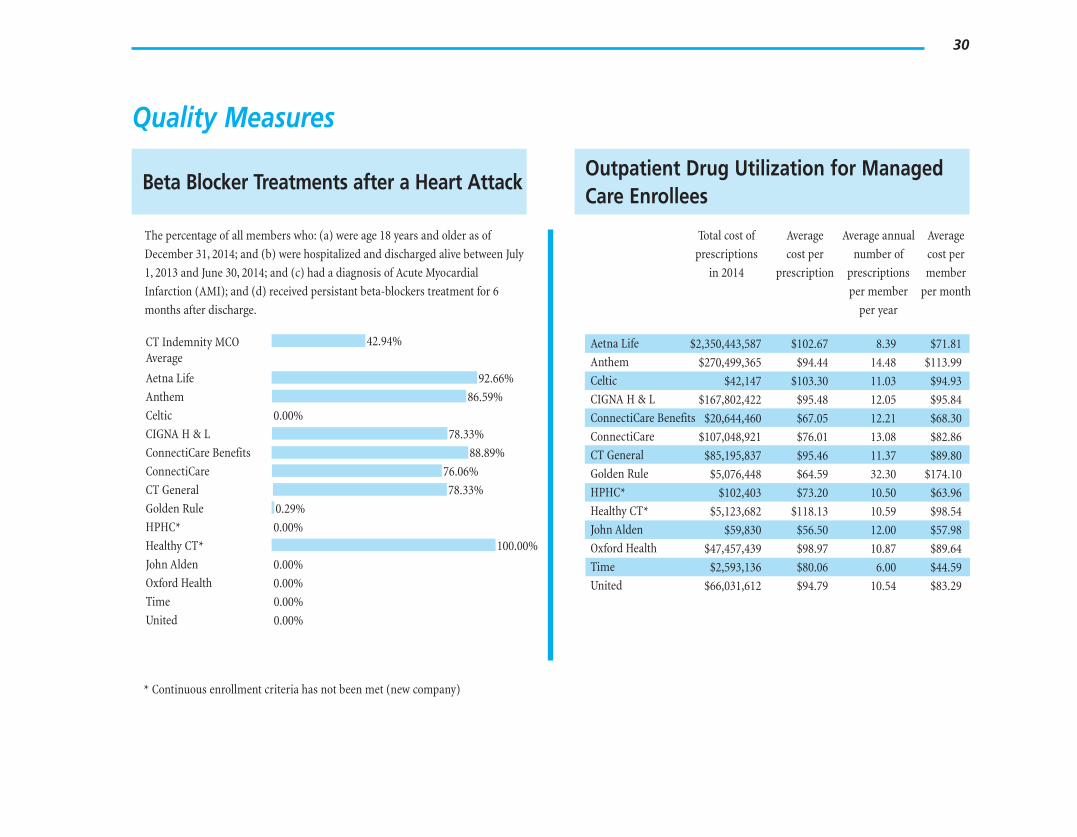
Total cost of Average Average annual Average
prescriptions cost per number of cost per
in 2014 prescription prescriptions member
per member per month
per year
Aetna Life $2,350,443,587 $102.67 8.39 $71.81
Anthem $270,499,365 $94.44 14.48 $113.99
Celtic $42,147 $103.30 11.03 $94.93
CIGNA H & L $167,802,422 $95.48 12.05 $95.84
ConnectiCare Benefits $20,644,460 $67.05 12.21 $68.30
ConnectiCare $107,048,921 $76.01 13.08 $82.86
CT General $85,195,837 $95.46 11.37 $89.80
Golden Rule $5,076,448 $64.59 32.30 $174.10
HPHC* $102,403 $73.20 10.50 $63.96
Healthy CT* $5,123,682 $118.13 10.59 $98.54
John Alden $59,830 $56.50 12.00 $57.98
Oxford Health $47,457,439 $98.97 10.87 $89.64
Time $2,593,136 $80.06 6.00 $44.59
United $66,031,612 $94.79 10.54 $83.29
30
Quality Measures
Beta Blocker Treatments after a Heart Attack
The percentage of all members who: (a) were age 18 years and older as of
December 31, 2014; and (b) were hospitalized and discharged alive between July
1, 2013 and June 30, 2014; and (c) had a diagnosis of Acute Myocardial
Infarction (AMI); and (d) received persistant beta-blockers treatment for 6
months after discharge.
CT Indemnity MCO Average
42.94%
Aetna Life 92.66%
Anthem 86.59%
Celtic 0.00%
CIGNA H & L 78.33%
ConnectiCare Benefits 88.89%
ConnectiCare 76.06%
CT General 78.33%
Golden Rule 0.29%
HPHC* 0.00%
Healthy CT* 100.00%
John Alden 0.00%
Oxford Health 0.00%
Time 0.00%
United 0.00%
* Continuous enrollment criteria has not been met (new company)
Outpatient Drug Utilization for Managed Care Enrollees
31
Health Maintenance Organizations Utilization Review Measures
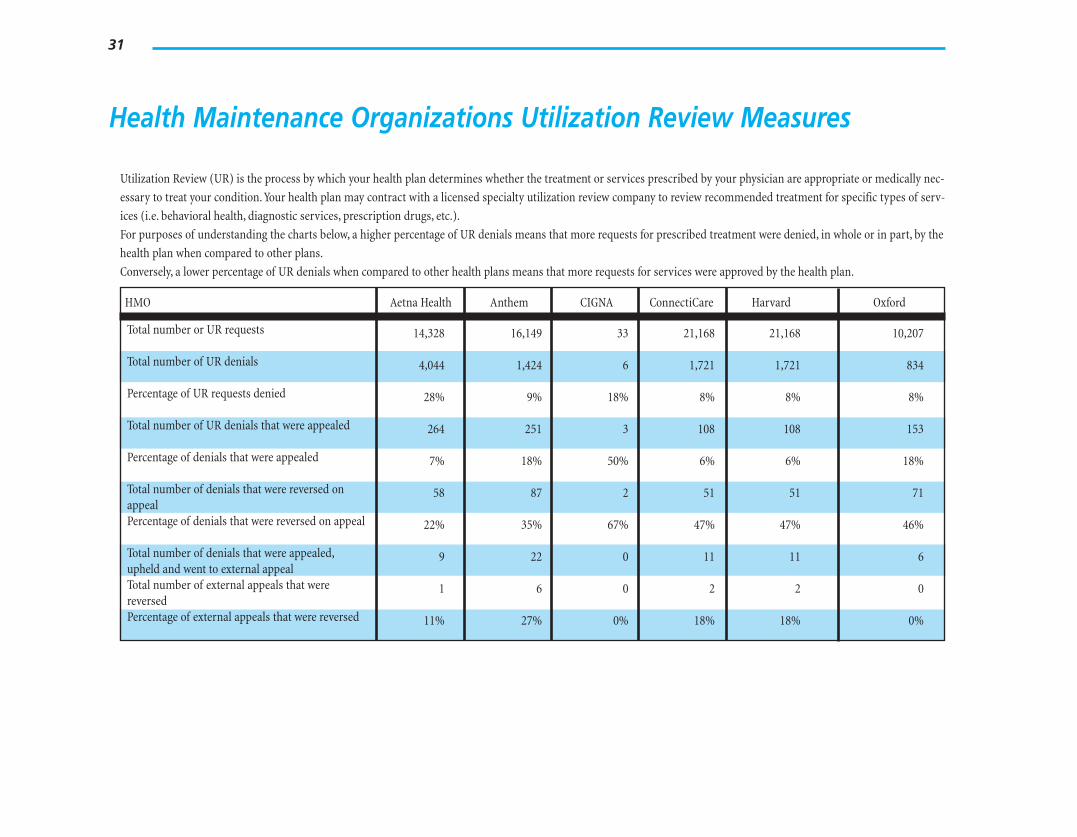
Utilization Review (UR) is the process by which your health plan determines whether the treatment or services prescribed by your physician are appropriate or medically nec
essary to treat your condition. Your health plan may contract with a licensed specialty utilization review company to review recommended treatment for specific types of serv
ices (i.e. behavioral health, diagnostic services, prescription drugs, etc.).
For purposes of understanding the charts below, a higher percentage of UR denials means that more requests for prescribed treatment were denied, in whole or in part, by the
health plan when compared to other plans.
Conversely, a lower percentage of UR denials when compared to other health plans means that more requests for services were approved by the health plan.
HMO Aetna Health Anthem CIGNA ConnectiCare Harvard Oxford
Total number or UR requests 14,328 16,149 33 21,168 21,168 10,207
Total number of UR denials 4,044 1,424 6 1,721 1,721 834
Percentage of UR requests denied 28% 9% 18% 8% 8% 8%
Total number of UR denials that were appealed 264 251 3 108 108 153
Percentage of denials that were appealed 7% 18% 50% 6% 6% 18%
Total number of denials that were reversed on appeal
58 87 2 51 51 71
Percentage of denials that were reversed on appeal 22% 35% 67% 47% 47% 46%
Total number of denials that were appealed, upheld and went to external appeal
9 22 0 11 11 6
Total number of external appeals that were reversed
1 6 0 2 2 0
Percentage of external appeals that were reversed 11% 27% 0% 18% 18% 0%
32
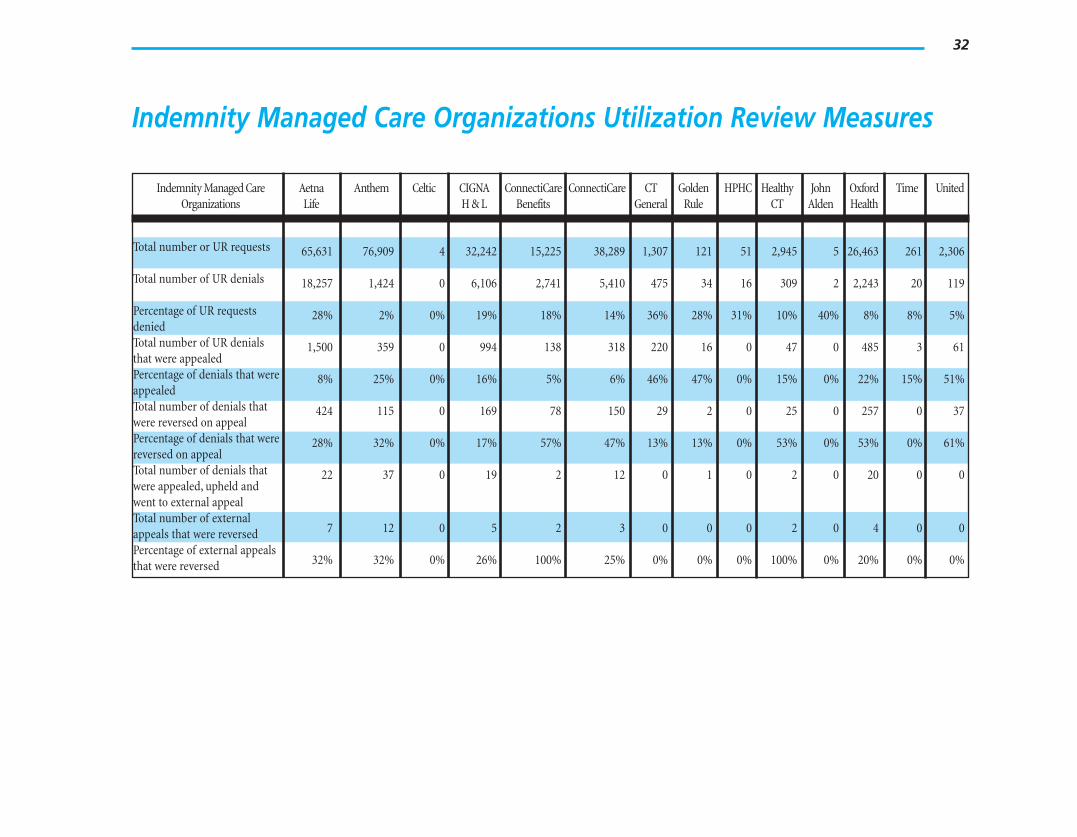
Indemnity Managed Care Organizations Utilization Review Measures
Indemnity Managed Care Organizations
Aetna Life
Anthem Celtic CIGNA H & L
ConnectiCare Benefits
ConnectiCare CT General
Golden Rule
HPHC Healthy CT
John Alden
Oxford Health
Time United
Total number or UR requests 65,631 76,909 4 32,242 15,225 38,289 1,307 121 51 2,945 5 26,463 261 2,306
Total number of UR denials 18,257 1,424 0 6,106 2,741 5,410 475 34 16 309 2 2,243 20 119
Percentage of UR requests denied
28% 2% 0% 19% 18% 14% 36% 28% 31% 10% 40% 8% 8% 5%
Total number of UR denials that were appealed
1,500 359 0 994 138 318 220 16 0 47 0 485 3 61
Percentage of denials that were appealed
8% 25% 0% 16% 5% 6% 46% 47% 0% 15% 0% 22% 15% 51%
Total number of denials that were reversed on appeal
424 115 0 169 78 150 29 2 0 25 0 257 0 37
Percentage of denials that were reversed on appeal
28% 32% 0% 17% 57% 47% 13% 13% 0% 53% 0% 53% 0% 61%
Total number of denials that were appealed, upheld and went to external appeal Total number of external
22 37 0 19 2 12 0 1 0 2 0 20 0 0
appeals that were reversed Percentage of external appeals
7 12 0 5 2 3 0 0 0 2 0 4 0 0
that were reversed 32% 32% 0% 26% 100% 25% 0% 0% 0% 100% 0% 20% 0% 0%
33
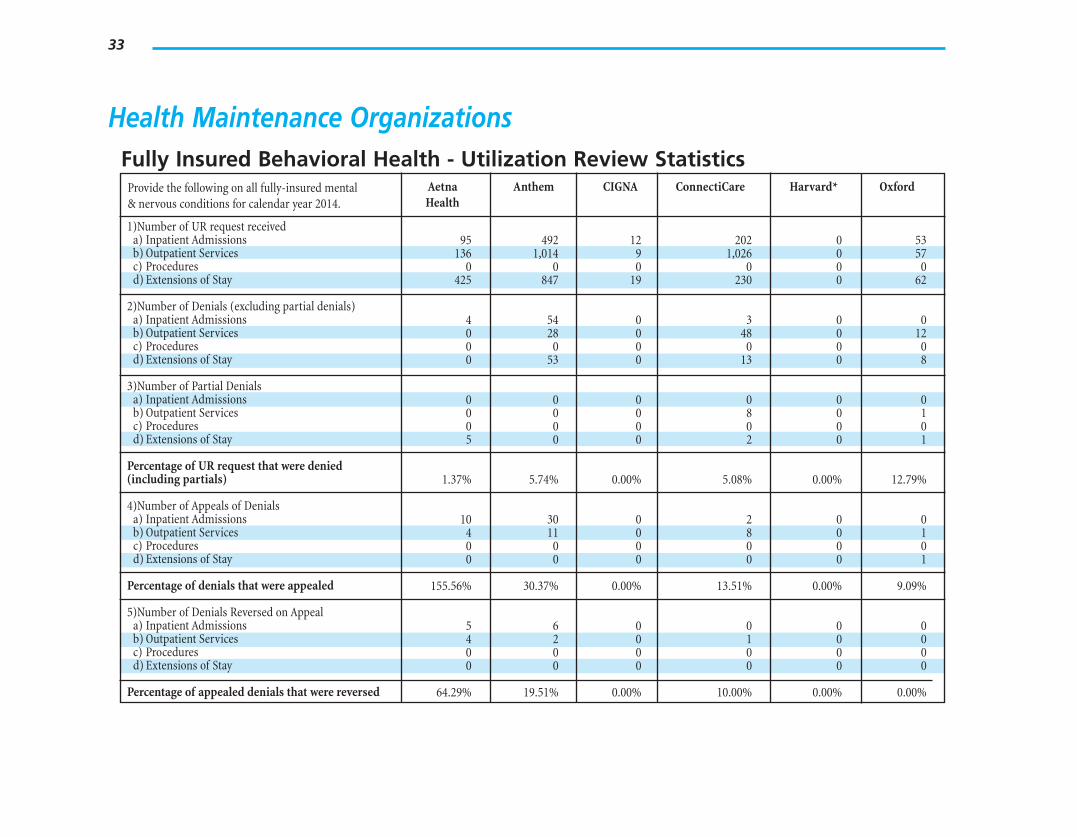
Health Maintenance Organizations Fully Insured Behavioral Health - Utilization Review Statistics
Provide the following on all fully-insured mental & nervous conditions for calendar year 2014.
Aetna Health
Anthem CIGNA ConnectiCare Harvard* Oxford
1)Number of UR request received a) Inpatient Admissions 95 492 12 202 0 53 b) Outpatient Services 136 1,014 9 1,026 0 57 c) Procedures 0 0 0 0 0 0 d) Extensions of Stay 425 847 19 230 0 62
2)Number of Denials (excluding partial denials) a) Inpatient Admissions 4 54 0 3 0 0 b) Outpatient Services 0 28 0 48 0 12 c) Procedures 0 0 0 0 0 0 d) Extensions of Stay 0 53 0 13 0 8
3)Number of Partial Denials a) Inpatient Admissions 0 0 0 0 0 0 b) Outpatient Services 0 0 0 8 0 1 c) Procedures 0 0 0 0 0 0 d) Extensions of Stay 5 0 0 2 0 1
Percentage of UR request that were denied (including partials) 1.37% 5.74% 0.00% 5.08% 0.00% 12.79%
4)Number of Appeals of Denials a) Inpatient Admissions 10 30 0 2 0 0 b) Outpatient Services 4 11 0 8 0 1 c) Procedures 0 0 0 0 0 0 d) Extensions of Stay 0 0 0 0 0 1
Percentage of denials that were appealed 155.56% 30.37% 0.00% 13.51% 0.00% 9.09%
5)Number of Denials Reversed on Appeal a) Inpatient Admissions 5 6 0 0 0 0 b) Outpatient Services 4 2 0 1 0 0 c) Procedures 0 0 0 0 0 0 d) Extensions of Stay 0 0 0 0 0 0
Percentage of appealed denials that were reversed 64.29% 19.51% 0.00% 10.00% 0.00% 0.00%
34
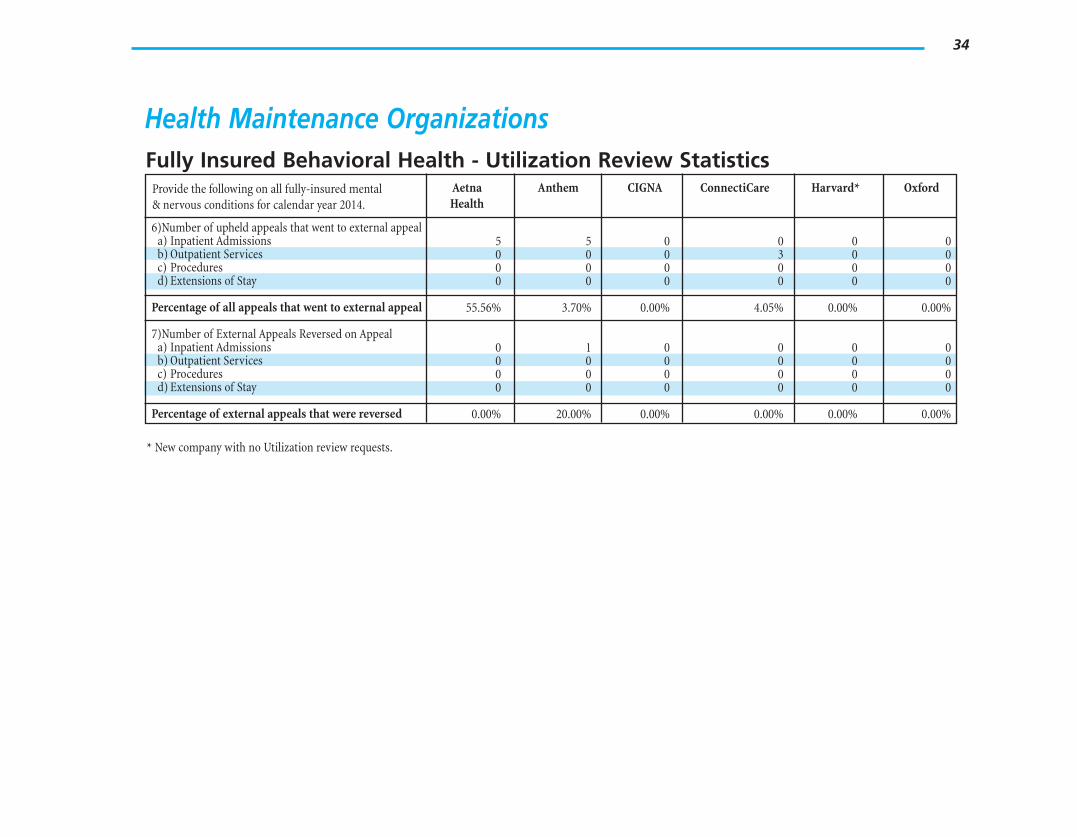
Health Maintenance Organizations Fully Insured Behavioral Health - Utilization Review Statistics
Provide the following on all fully-insured mental & nervous conditions for calendar year 2014.
Aetna Health
Anthem CIGNA ConnectiCare Harvard* Oxford
6)Number of upheld appeals that went to external appeal a) Inpatient Admissions 5 5 0 0 0 0 b) Outpatient Services 0 0 0 3 0 0 c) Procedures 0 0 0 0 0 0 d) Extensions of Stay 0 0 0 0 0 0
Percentage of all appeals that went to external appeal 55.56% 3.70% 0.00% 4.05% 0.00% 0.00%
7)Number of External Appeals Reversed on Appeal a) Inpatient Admissions 0 1 0 0 0 0 b) Outpatient Services 0 0 0 0 0 0 c) Procedures 0 0 0 0 0 0 d) Extensions of Stay 0 0 0 0 0 0
Percentage of external appeals that were reversed 0.00% 20.00% 0.00% 0.00% 0.00% 0.00%
* New company with no Utilization review requests.
35
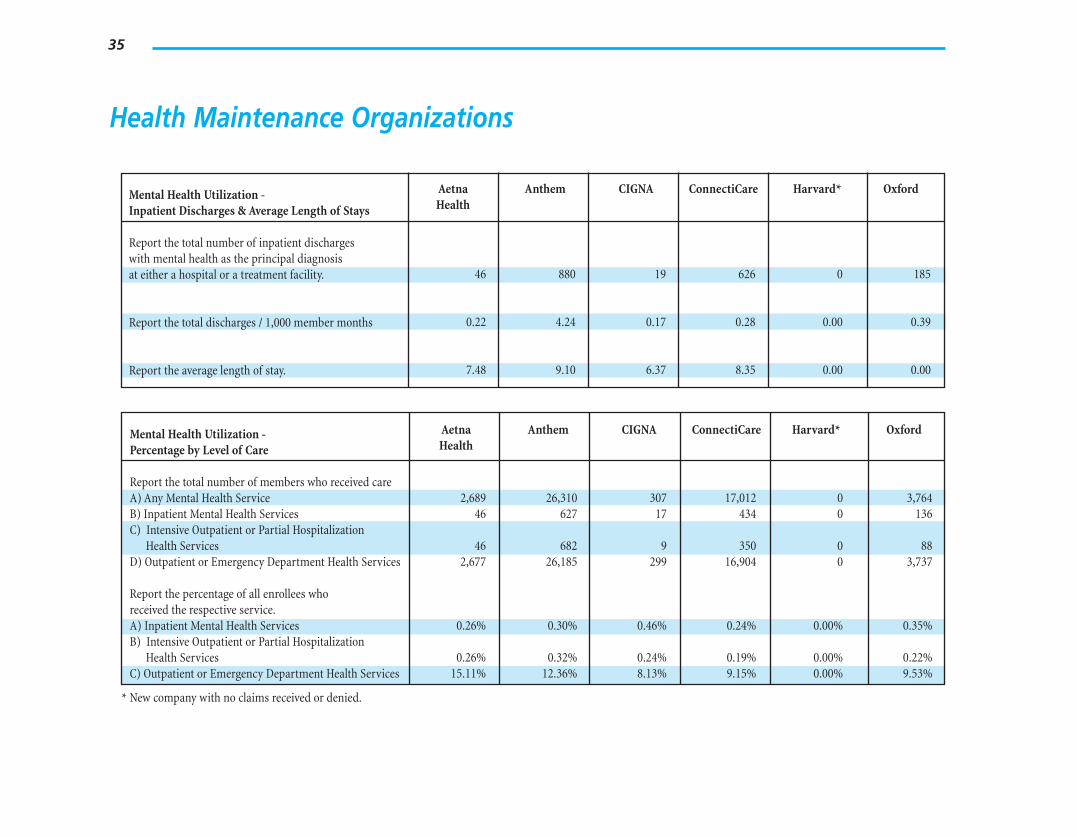
Health Maintenance Organizations
Mental Health Utilization Inpatient Discharges & Average Length of Stays
Aetna Health
Anthem CIGNA ConnectiCare Harvard* Oxford
Report the total number of inpatient discharges with mental health as the principal diagnosis at either a hospital or a treatment facility. 46 880 19 626 0 185
Report the total discharges / 1,000 member months 0.22 4.24 0.17 0.28 0.00 0.39
Report the average length of stay. 7.48 9.10 6.37 8.35 0.00 0.00
Mental Health Utilization Percentage by Level of Care
Aetna Health
Anthem CIGNA ConnectiCare Harvard* Oxford
Report the total number of members who received care A) Any Mental Health Service 2,689 26,310 307 17,012 0 3,764 B) Inpatient Mental Health Services C) Intensive Outpatient or Partial Hospitalization
46 627 17 434 0 136
Health Services 46 682 9 350 0 88 D) Outpatient or Emergency Department Health Services
Report the percentage of all enrollees who received the respective service.
2,677 26,185 299 16,904 0 3,737
A) Inpatient Mental Health Services B) Intensive Outpatient or Partial Hospitalization
0.26% 0.30% 0.46% 0.24% 0.00% 0.35%
Health Services 0.26% 0.32% 0.24% 0.19% 0.00% 0.22% C) Outpatient or Emergency Department Health Services 15.11% 12.36% 8.13% 9.15% 0.00% 9.53%
* New company with no claims received or denied.
36
Health Maintenance Organizations
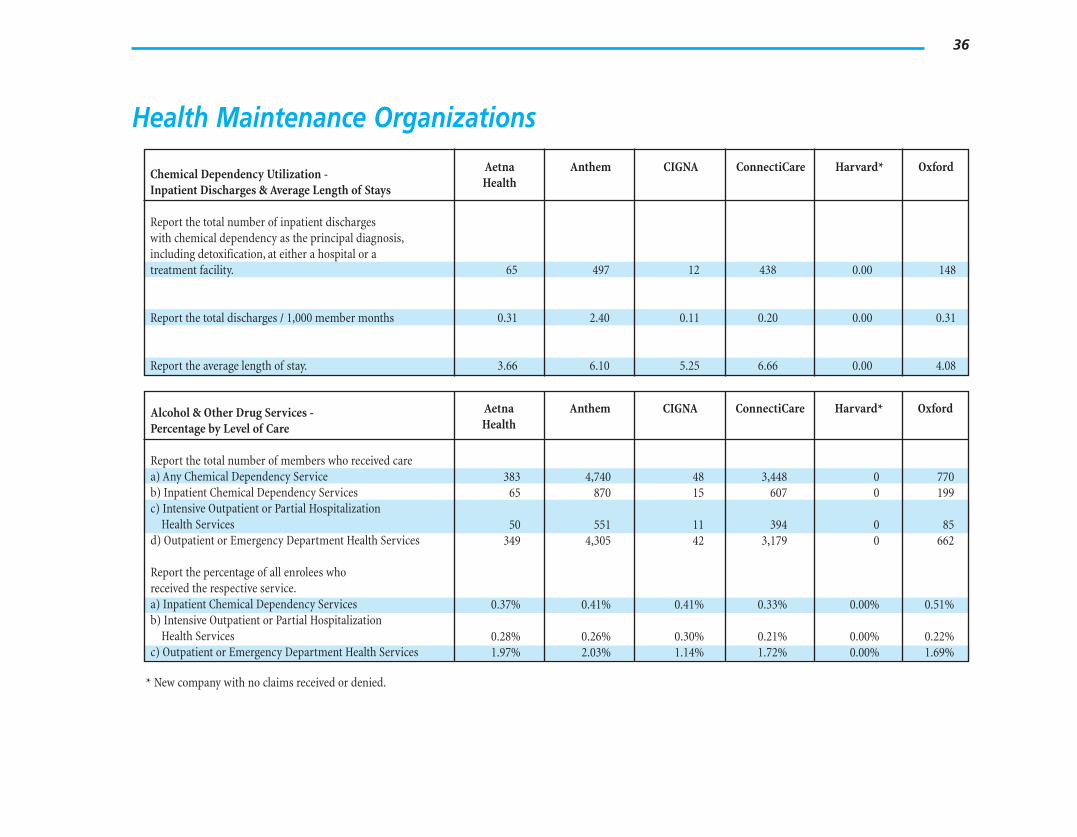
Chemical Dependency Utilization Inpatient Discharges & Average Length of Stays
Aetna Health
Anthem CIGNA ConnectiCare Harvard* Oxford
Report the total number of inpatient discharges with chemical dependency as the principal diagnosis, including detoxification, at either a hospital or a treatment facility. 65 497 12 438 0.00 148
Report the total discharges / 1,000 member months 0.31 2.40 0.11 0.20 0.00 0.31
Report the average length of stay. 3.66 6.10 5.25 6.66 0.00 4.08
Alcohol & Other Drug Services Percentage by Level of Care
Aetna Health
Anthem CIGNA ConnectiCare Harvard* Oxford
Report the total number of members who received care a) Any Chemical Dependency Service 383 4,740 48 3,448 0 770 b) Inpatient Chemical Dependency Services c) Intensive Outpatient or Partial Hospitalization
65 870 15 607 0 199
Health Services 50 551 11 394 0 85 d) Outpatient or Emergency Department Health Services
Report the percentage of all enrolees who received the respective service.
349 4,305 42 3,179 0 662
a) Inpatient Chemical Dependency Services b) Intensive Outpatient or Partial Hospitalization
0.37% 0.41% 0.41% 0.33% 0.00% 0.51%
Health Services 0.28% 0.26% 0.30% 0.21% 0.00% 0.22% c) Outpatient or Emergency Department Health Services 1.97% 2.03% 1.14% 1.72% 0.00% 1.69%
* New company with no claims received or denied.
37
Health Maintenance Organizations
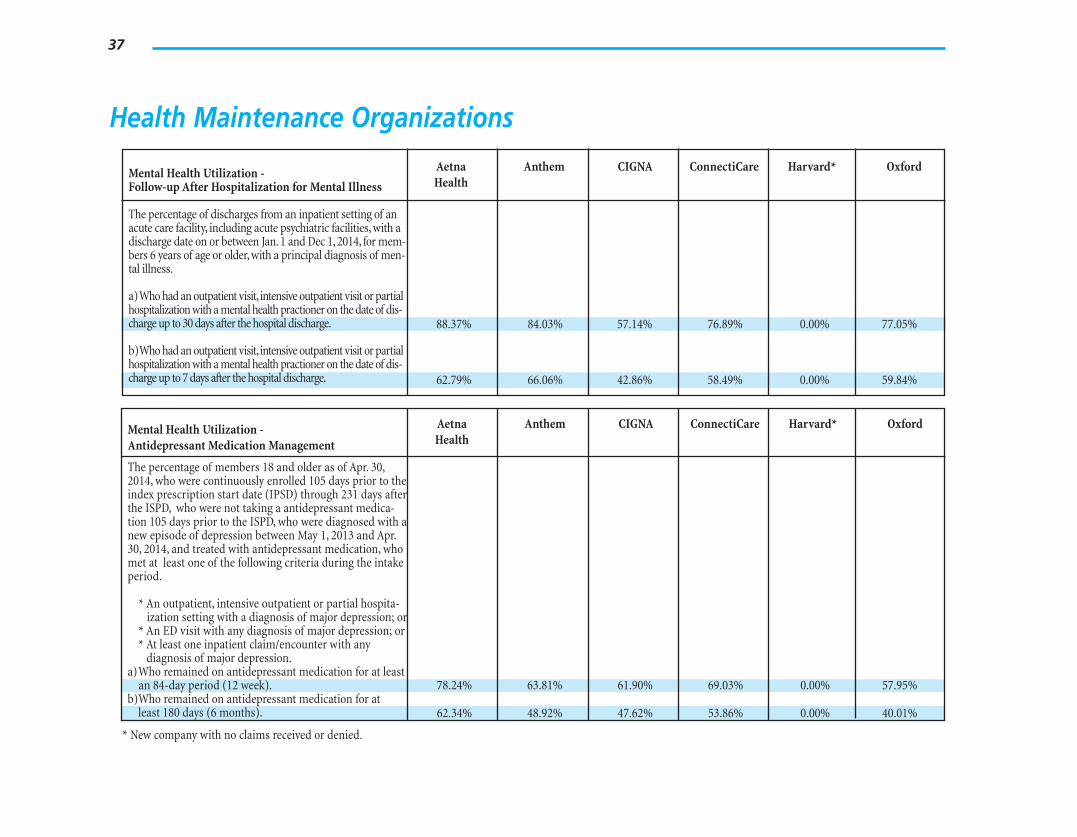
Mental Health Utilization Follow-up After Hospitalization for Mental Illness
Aetna Health
Anthem CIGNA ConnectiCare Harvard* Oxford
The percentage of discharges from an inpatient setting of an acute care facility, including acute psychiatric facilities, with a discharge date on or between Jan. 1 and Dec 1, 2014, for members 6 years of age or older, with a principal diagnosis of mental illness.
a) Who had an outpatient visit, intensive outpatient visit or partial hospitalization with a mental health practioner on the date of discharge up to 30 days after the hospital discharge. 88.37% 84.03% 57.14% 76.89% 0.00% 77.05%
b)Who had an outpatient visit, intensive outpatient visit or partial hospitalization with a mental health practioner on the date of discharge up to 7 days after the hospital discharge. 62.79% 66.06% 42.86% 58.49% 0.00% 59.84%
Mental Health Utilization Antidepressant Medication Management
Aetna Health
Anthem CIGNA ConnectiCare Harvard* Oxford
The percentage of members 18 and older as of Apr. 30, 2014, who were continuously enrolled 105 days prior to the index prescription start date (IPSD) through 231 days after the ISPD, who were not taking a antidepressant medication 105 days prior to the ISPD, who were diagnosed with a new episode of depression between May 1, 2013 and Apr. 30, 2014, and treated with antidepressant medication, who met at least one of the following criteria during the intake period.
* An outpatient, intensive outpatient or partial hospitaization setting with a diagnosis of major depression; or
* An ED visit with any diagnosis of major depression; or * At least one inpatient claim/encounter with any
diagnosis of major depression. a) Who remained on antidepressant medication for at least
an 84-day period (12 week). 78.24% 63.81% 61.90% 69.03% 0.00% 57.95% b)Who remained on antidepressant medication for at
least 180 days (6 months). 62.34% 48.92% 47.62% 53.86% 0.00% 40.01%
* New company with no claims received or denied.
38
Health Maintenance Organizations
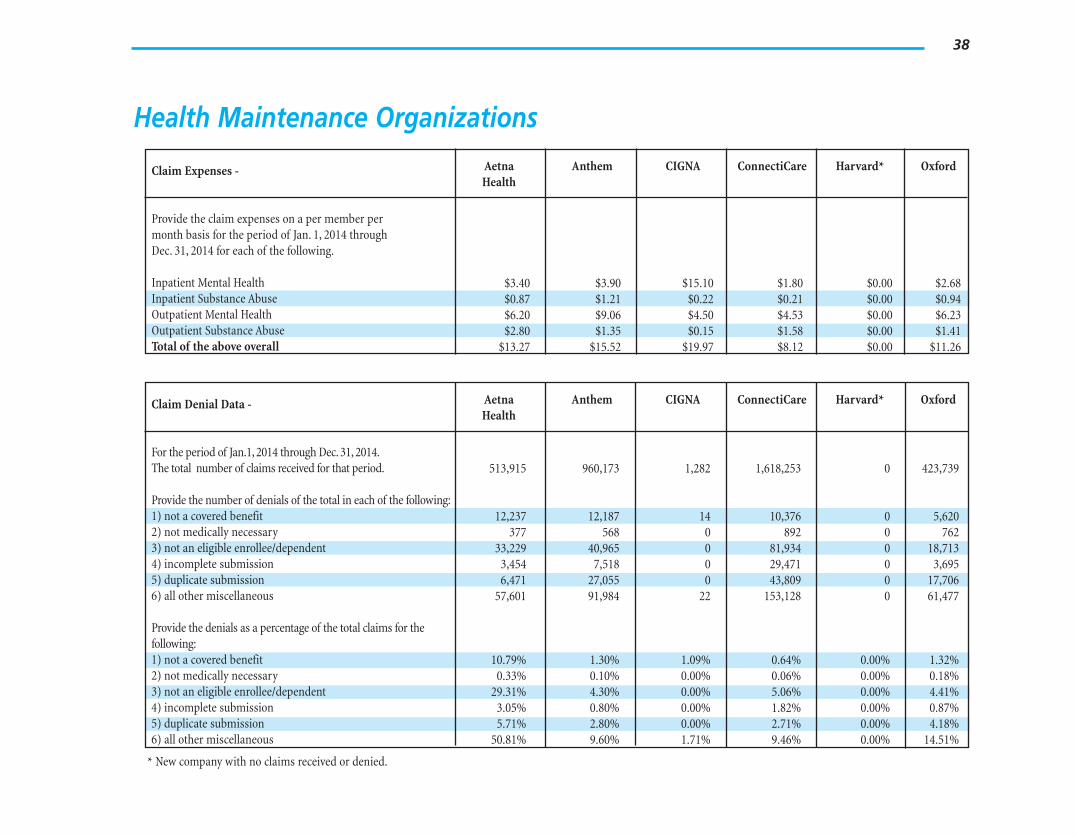
Claim Expenses - Aetna Health
Anthem CIGNA ConnectiCare Harvard* Oxford
Provide the claim expenses on a per member per month basis for the period of Jan. 1, 2014 through Dec. 31, 2014 for each of the following.
Inpatient Mental Health $3.40 $3.90 $15.10 $1.80 $0.00 $2.68 Inpatient Substance Abuse $0.87 $1.21 $0.22 $0.21 $0.00 $0.94 Outpatient Mental Health $6.20 $9.06 $4.50 $4.53 $0.00 $6.23 Outpatient Substance Abuse $2.80 $1.35 $0.15 $1.58 $0.00 $1.41 Total of the above overall $13.27 $15.52 $19.97 $8.12 $0.00 $11.26
Claim Denial Data - Aetna Health
Anthem CIGNA ConnectiCare Harvard* Oxford
For the period of Jan.1, 2014 through Dec. 31, 2014. The total number of claims received for that period.
Provide the number of denials of the total in each of the following:
513,915 960,173 1,282 1,618,253 0 423,739
1) not a covered benefit 12,237 12,187 14 10,376 0 5,620 2) not medically necessary 377 568 0 892 0 762 3) not an eligible enrollee/dependent 33,229 40,965 0 81,934 0 18,713 4) incomplete submission 3,454 7,518 0 29,471 0 3,695 5) duplicate submission 6,471 27,055 0 43,809 0 17,706 6) all other miscellaneous
Provide the denials as a percentage of the total claims for the following:
57,601 91,984 22 153,128 0 61,477
1) not a covered benefit 10.79% 1.30% 1.09% 0.64% 0.00% 1.32% 2) not medically necessary 0.33% 0.10% 0.00% 0.06% 0.00% 0.18% 3) not an eligible enrollee/dependent 29.31% 4.30% 0.00% 5.06% 0.00% 4.41% 4) incomplete submission 3.05% 0.80% 0.00% 1.82% 0.00% 0.87% 5) duplicate submission 5.71% 2.80% 0.00% 2.71% 0.00% 4.18% 6) all other miscellaneous 50.81% 9.60% 1.71% 9.46% 0.00% 14.51%
* New company with no claims received or denied.
39
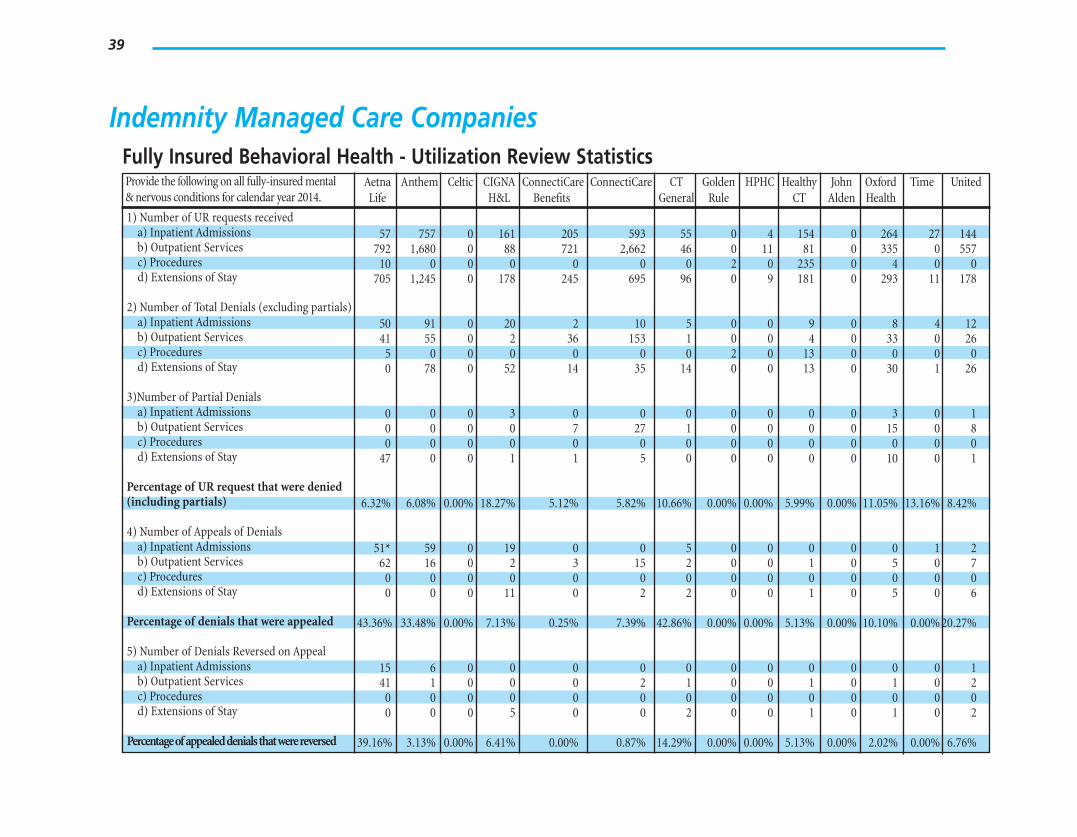
Indemnity Managed Care Companies Fully Insured Behavioral Health - Utilization Review Statistics Provide the following on all fully-insured mental & nervous conditions for calendar year 2014.
Aetna Life
Anthem Celtic CIGNA H&L
ConnectiCare Benefits
ConnectiCare CT General
Golden Rule
HPHC Healthy CT
John Alden
Oxford Health
Time United
1) Number of UR requests received a) Inpatient Admissions 57 757 0 161 205 593 55 0 4 154 0 264 27 144 b) Outpatient Services 792 1,680 0 88 721 2,662 46 0 11 81 0 335 0 557 c) Procedures 10 0 0 0 0 0 0 2 0 235 0 4 0 0 d) Extensions of Stay
2) Number of Total Denials (excluding partials)
705 1,245 0 178 245 695 96 0 9 181 0 293 11 178
a) Inpatient Admissions 50 91 0 20 2 10 5 0 0 9 0 8 4 12 b) Outpatient Services 41 55 0 2 36 153 1 0 0 4 0 33 0 26 c) Procedures 5 0 0 0 0 0 0 2 0 13 0 0 0 0 d) Extensions of Stay
3)Number of Partial Denials
0 78 0 52 14 35 14 0 0 13 0 30 1 26
a) Inpatient Admissions 0 0 0 3 0 0 0 0 0 0 0 3 0 1 b) Outpatient Services 0 0 0 0 7 27 1 0 0 0 0 15 0 8 c) Procedures 0 0 0 0 0 0 0 0 0 0 0 0 0 0 d) Extensions of Stay
Percentage of UR re quest that were den ied
47 0 0 1 1 5 0 0 0 0 0 10 0 1
(including partials)
4) Number of Appeals of Denials
6.32% 6.08% 0.00% 18.27% 5.12% 5.82% 10.66% 0.00% 0.00% 5.99% 0.00% 11.05% 13.16% 8.42%
a) Inpatient Admissions 51* 59 0 19 0 0 5 0 0 0 0 0 1 2 b) Outpatient Services 62 16 0 2 3 15 2 0 0 1 0 5 0 7 c) Procedures 0 0 0 0 0 0 0 0 0 0 0 0 0 0 d) Extensions of Stay 0 0 0 11 0 2 2 0 0 1 0 5 0 6
Percentage of denials that were appea led
5) Number of Denials Reversed on Appeal
43.36% 33.48% 0.00% 7.13% 0.25% 7.39% 42.86% 0.00% 0.00% 5.13% 0.00% 10.10% 0.00% 20.27%
a) Inpatient Admissions 15 6 0 0 0 0 0 0 0 0 0 0 0 1 b) Outpatient Services 41 1 0 0 0 2 1 0 0 1 0 1 0 2 c) Procedures 0 0 0 0 0 0 0 0 0 0 0 0 0 0 d) Extensions of Stay 0 0 0 5 0 0 2 0 0 1 0 1 0 2
Percentage of appealed denials that were reversed 39.16% 3.13% 0.00% 6.41% 0.00% 0.87% 14.29% 0.00% 0.00% 5.13% 0.00% 2.02% 0.00% 6.76%
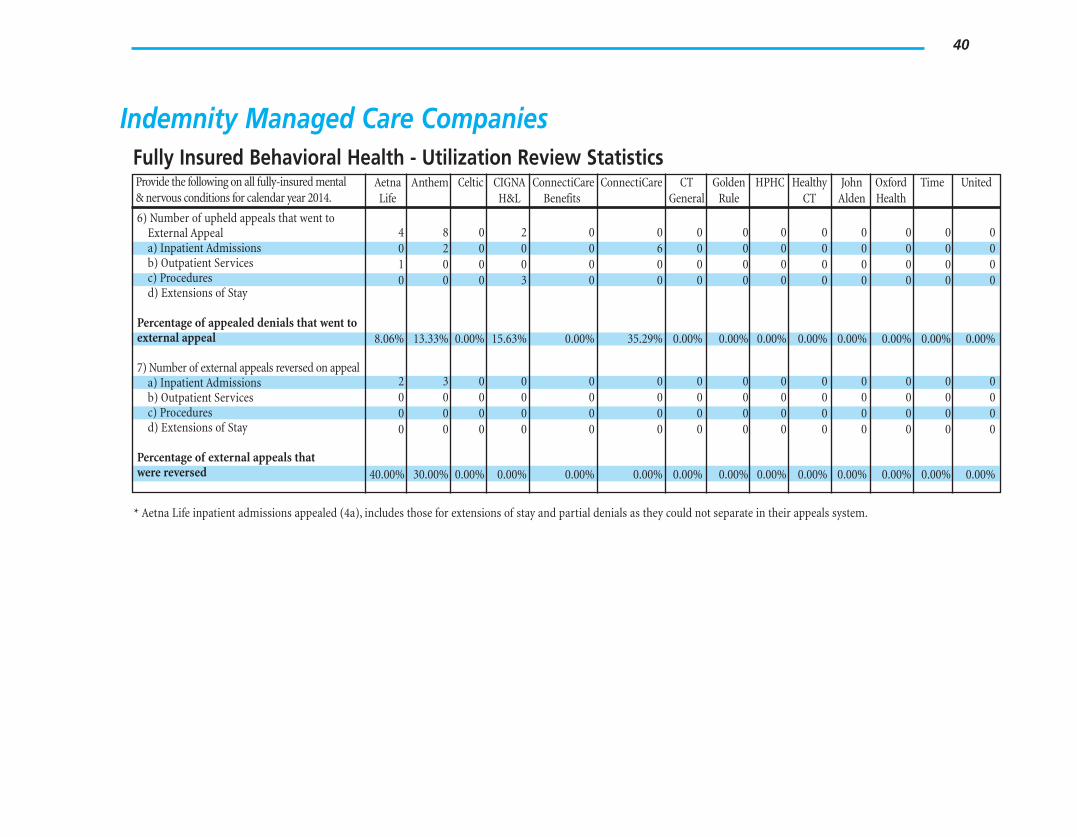
40
Indemnity Managed Care Companies Fully Insured Behavioral Health - Utilization Review Statistics Provide the following on all fully-insured mental & nervous conditions for calendar year 2014.
Aetna Life
Anthem Celtic CIGNA H&L
ConnectiCare Benefits
ConnectiCare CT General
Golden Rule
HPHC Healthy CT
John Alden
Oxford Health
Time United
6) Number of upheld appeals that went to External Appeal 4 8 0 2 0 0 0 0 0 0 0 0 0 0 a) Inpatient Admissions 0 2 0 0 0 6 0 0 0 0 0 0 0 0 b) Outpatient Services 1 0 0 0 0 0 0 0 0 0 0 0 0 0 c) Procedures d) Extensions of Stay
Percentage of appealed denials that went to
0 0 0 3 0 0 0 0 0 0 0 0 0 0
external appeal
7) Number of external appeals reversed on appeal
8.06% 13.33% 0.00% 15.63% 0.00% 35.29% 0.00% 0.00% 0.00% 0.00% 0.00% 0.00% 0.00% 0.00%
a) Inpatient Admissions 2 3 0 0 0 0 0 0 0 0 0 0 0 0 b) Outpatient Services 0 0 0 0 0 0 0 0 0 0 0 0 0 0 c) Procedures 0 0 0 0 0 0 0 0 0 0 0 0 0 0 d) Extensions of Stay
Percentage of external appeals that
0 0 0 0 0 0 0 0 0 0 0 0 0 0
were reversed 40.00% 30.00% 0.00% 0.00% 0.00% 0.00% 0.00% 0.00% 0.00% 0.00% 0.00% 0.00% 0.00% 0.00%
* Aetna Life inpatient admissions appealed (4a), includes those for extensions of stay and partial denials as they could not separate in their appeals system.
41
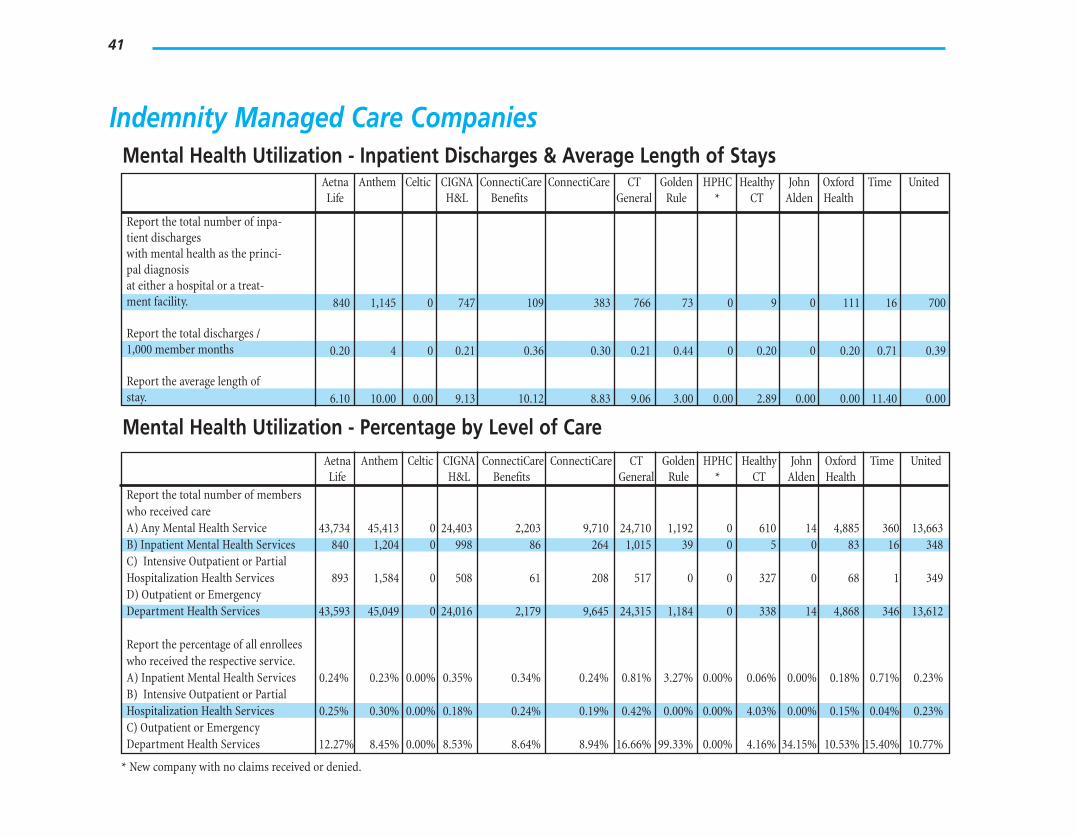
Indemnity Managed Care Companies Mental Health Utilization - Inpatient Discharges & Average Length of Stays
Aetna Anthem Celtic CIGNA ConnectiCare ConnectiCare CT Golden HPHC Healthy John Oxford Time United Life H&L Benefits General Rule * CT Alden Health
Report the total number of inpatient discharges with mental health as the principal diagnosis at either a hospital or a treatment facility. 840 1,145 0 747 109 383 766 73 0 9 0 111 16 700
Report the total discharges / 1,000 member months 0.20 4 0 0.21 0.36 0.30 0.21 0.44 0 0.20 0 0.20 0.71 0.39
Report the average length of stay. 6.10 10.00 0.00 9.13 10.12 8.83 9.06 3.00 0.00 2.89 0.00 0.00 11.40 0.00
Mental Health Utilization - Percentage by Level of Care Aetna Life
Anthem Celtic CIGNA H&L
ConnectiCare Benefits
ConnectiCare CT General
Golden Rule
HPHC *
Healthy CT
John Alden
Oxford Health
Time United
Report the total number of members who received care A) Any Mental Health Service 43,734 45,413 0 24,403 2,203 9,710 24,710 1,192 0 610 14 4,885 360 13,663 B) Inpatient Mental Health Services C) Intensive Outpatient or Partial
840 1,204 0 998 86 264 1,015 39 0 5 0 83 16 348
Hospitalization Health Services D) Outpatient or Emergency
893 1,584 0 508 61 208 517 0 0 327 0 68 1 349
Department Health Services
Report the percentage of all enrollees who received the respective service.
43,593 45,049 0 24,016 2,179 9,645 24,315 1,184 0 338 14 4,868 346 13,612
A) Inpatient Mental Health Services B) Intensive Outpatient or Partial
0.24% 0.23% 0.00% 0.35% 0.34% 0.24% 0.81% 3.27% 0.00% 0.06% 0.00% 0.18% 0.71% 0.23%
Hospitalization Health Services C) Outpatient or Emergency
0.25% 0.30% 0.00% 0.18% 0.24% 0.19% 0.42% 0.00% 0.00% 4.03% 0.00% 0.15% 0.04% 0.23%
Department Health Services 12.27% 8.45% 0.00% 8.53% 8.64% 8.94% 16.66% 99.33% 0.00% 4.16% 34.15% 10.53% 15.40% 10.77%
* New company with no claims received or denied.
42
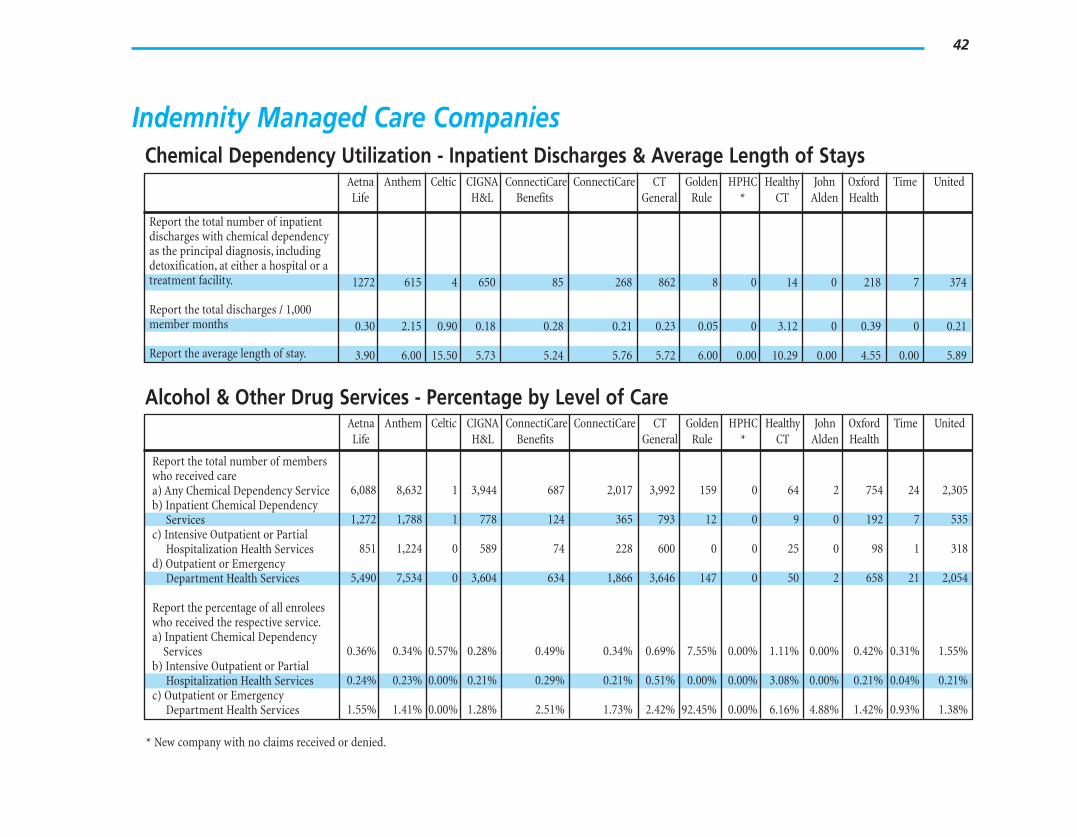
Indemnity Managed Care Companies Chemical Dependency Utilization - Inpatient Discharges & Average Length of Stays
Aetna Anthem Celtic CIGNA ConnectiCare ConnectiCare CT Golden HPHC Healthy John Oxford Time United Life H&L Benefits General Rule * CT Alden Health
Report the total number of inpatient discharges with chemical dependency as the principal diagnosis, including detoxification, at either a hospital or a treatment facility. 1272 615 4 650 85 268 862 8 0 14 0 218 7 374
Report the total discharges / 1,000 member months 0.30 2.15 0.90 0.18 0.28 0.21 0.23 0.05 0 3.12 0 0.39 0 0.21
Report the average length of stay. 3.90 6.00 15.50 5.73 5.24 5.76 5.72 6.00 0.00 10.29 0.00 4.55 0.00 5.89
Alcohol & Other Drug Services - Percentage by Level of Care Aetna Life
Anthem Celtic CIGNA H&L
ConnectiCare Benefits
ConnectiCare CT General
Golden Rule
HPHC *
Healthy CT
John Alden
Oxford Health
Time United
Report the total number of members who received care a) Any Chemical Dependency Service b) Inpatient Chemical Dependency
6,088 8,632 1 3,944 687 2,017 3,992 159 0 64 2 754 24 2,305
Services c) Intensive Outpatient or Partial
1,272 1,788 1 778 124 365 793 12 0 9 0 192 7 535
Hospitalization Health Services d) Outpatient or Emergency
851 1,224 0 589 74 228 600 0 0 25 0 98 1 318
Department Health Services
Report the percentage of all enrolees who received the respective service. a) Inpatient Chemical Dependency
5,490 7,534 0 3,604 634 1,866 3,646 147 0 50 2 658 21 2,054
Services b) Intensive Outpatient or Partial
0.36% 0.34% 0.57% 0.28% 0.49% 0.34% 0.69% 7.55% 0.00% 1.11% 0.00% 0.42% 0.31% 1.55%
Hospitalization Health Services c) Outpatient or Emergency
0.24% 0.23% 0.00% 0.21% 0.29% 0.21% 0.51% 0.00% 0.00% 3.08% 0.00% 0.21% 0.04% 0.21%
Department Health Services 1.55% 1.41% 0.00% 1.28% 2.51% 1.73% 2.42% 92.45% 0.00% 6.16% 4.88% 1.42% 0.93% 1.38%
* New company with no claims received or denied.
43
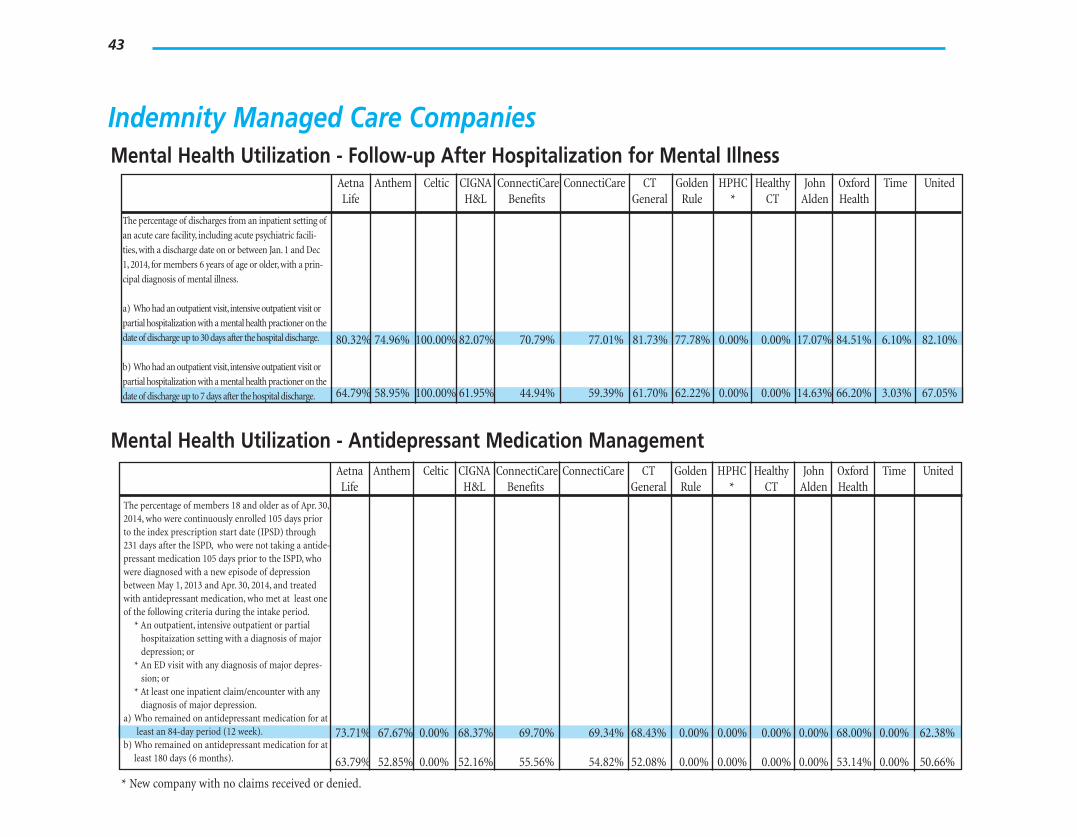
Indemnity Managed Care Companies Mental Health Utilization - Follow-up After Hospitalization for Mental Illness
Aetna Anthem Celtic CIGNA ConnectiCare ConnectiCare CT Golden HPHC Healthy John Oxford Time United Life H&L Benefits General Rule * CT Alden Health
The percentage of discharges from an inpatient setting of
an acute care facility, including acute psychiatric facili
ties, with a discharge date on or between Jan. 1 and Dec
1, 2014, for members 6 years of age or older, with a prin
cipal diagnosis of mental illness.
a) Who had an outpatient visit, intensive outpatient visit or
partial hospitalization with a mental health practioner on the
date of discharge up to 30 days after the hospital discharge.
b) Who had an outpatient visit, intensive outpatient visit or
partial hospitalization with a mental health practioner on the
date of discharge up to 7 days after the hospital discharge.
80.32%
64.79%
74.96%
58.95%
100.00% 82.07%
100.00% 61.95%
70.79%
44.94%
77.01%
59.39%
81.73%
61.70%
77.78%
62.22%
0.00%
0.00%
0.00%
0.00%
17.07%
14.63%
84.51%
66.20%
6.10%
3.03%
82.10%
67.05%
Mental Health Utilization - Antidepressant Medication Management Aetna Anthem Celtic CIGNA ConnectiCare ConnectiCare CT Golden HPHC Healthy John Oxford Time United Life H&L Benefits General Rule * CT Alden Health
The percentage of members 18 and older as of Apr. 30, 2014, who were continuously enrolled 105 days prior to the index prescription start date (IPSD) through 231 days after the ISPD, who were not taking a antidepressant medication 105 days prior to the ISPD, who were diagnosed with a new episode of depression between May 1, 2013 and Apr. 30, 2014, and treated with antidepressant medication, who met at least one of the following criteria during the intake period.
* An outpatient, intensive outpatient or partial hospitaization setting with a diagnosis of major depression; or
* An ED visit with any diagnosis of major depression; or
* At least one inpatient claim/encounter with any diagnosis of major depression.
a) Who remained on antidepressant medication for at least an 84-day period (12 week). 73.71% 67.67% 0.00% 68.37% 69.70% 69.34% 68.43% 0.00% 0.00% 0.00% 0.00% 68.00% 0.00% 62.38%
b) Who remained on antidepressant medication for at least 180 days (6 months). 63.79% 52.85% 0.00% 52.16% 55.56% 54.82% 52.08% 0.00% 0.00% 0.00% 0.00% 53.14% 0.00% 50.66%
* New company with no claims received or denied.
44
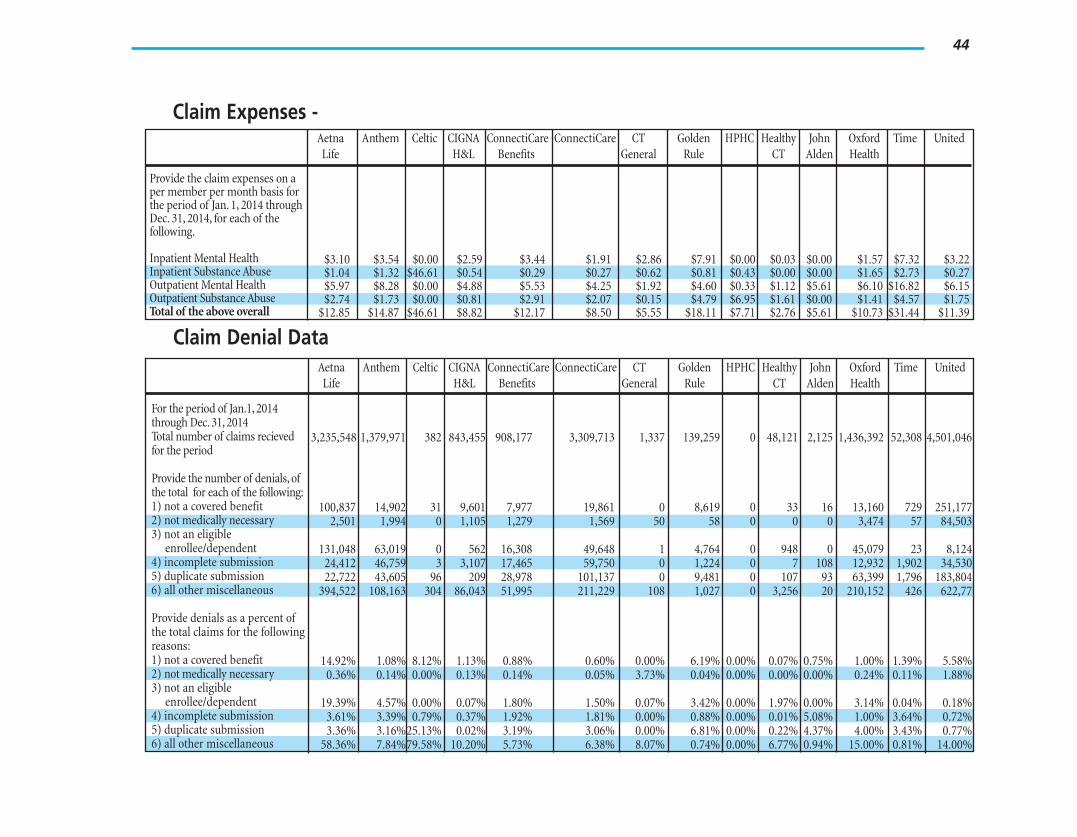
Claim Expenses -Aetna Anthem Celtic CIGNA ConnectiCare ConnectiCare CT Golden HPHC Healthy John Oxford Time United Life H&L Benefits General Rule CT Alden Health
Provide the claim expenses on a per member per month basis for the period of Jan. 1, 2014 through Dec. 31, 2014, for each of the following.
Inpatient Mental Health $3.10 $3.54 $0.00 $2.59 $3.44 $1.91 $2.86 $7.91 $0.00 $0.03 $0.00 $1.57 $7.32 $3.22 Inpatient Substance Abuse $1.04 $1.32 $46.61 $0.54 $0.29 $0.27 $0.62 $0.81 $0.43 $0.00 $0.00 $1.65 $2.73 $0.27 Outpatient Mental Health $5.97 $8.28 $0.00 $4.88 $5.53 $4.25 $1.92 $4.60 $0.33 $1.12 $5.61 $6.10 $16.82 $6.15 Outpatient Substance Abuse $2.74 $1.73 $0.00 $0.81 $2.91 $2.07 $0.15 $4.79 $6.95 $1.61 $0.00 $1.41 $4.57 $1.75 Total of the above overall $12.85 $14.87 $46.61 $8.82 $12.17 $8.50 $5.55 $18.11 $7.71 $2.76 $5.61 $10.73 $31.44 $11.39
Claim Denial Data Aetna Life
Anthem Celtic CIGNA H&L
ConnectiCare Benefits
ConnectiCare CT General
Golden Rule
HPHC Healthy CT
John Alden
Oxford Health
Time United
For the period of Jan.1, 2014 through Dec. 31, 2014 Total number of claims recieved for the period
Provide the number of denials, of the total for each of the following:
3,235,548 1,379,971 382 843,455 908,177 3,309,713 1,337 139,259 0 48,121 2,125 1,436,392 52,308 4,501,046
1) not a covered benefit 100,837 14,902 31 9,601 7,977 19,861 0 8,619 0 33 16 13,160 729 251,177 2) not medically necessary 3) not an eligible
2,501 1,994 0 1,105 1,279 1,569 50 58 0 0 0 3,474 57 84,503
enrollee/dependent 131,048 63,019 0 562 16,308 49,648 1 4,764 0 948 0 45,079 23 8,124 4) incomplete submission 24,412 46,759 3 3,107 17,465 59,750 0 1,224 0 7 108 12,932 1,902 34,530 5) duplicate submission 22,722 43,605 96 209 28,978 101,137 0 9,481 0 107 93 63,399 1,796 183,804 6) all other miscellaneous
Provide denials as a percent of the total claims for the following reasons:
394,522 108,163 304 86,043 51,995 211,229 108 1,027 0 3,256 20 210,152 426 622,77
1) not a covered benefit 14.92% 1.08% 8.12% 1.13% 0.88% 0.60% 0.00% 6.19% 0.00% 0.07% 0.75% 1.00% 1.39% 5.58% 2) not medically necessary 3) not an eligible
0.36% 0.14% 0.00% 0.13% 0.14% 0.05% 3.73% 0.04% 0.00% 0.00% 0.00% 0.24% 0.11% 1.88%
enrollee/dependent 19.39% 4.57% 0.00% 0.07% 1.80% 1.50% 0.07% 3.42% 0.00% 1.97% 0.00% 3.14% 0.04% 0.18% 4) incomplete submission 3.61% 3.39% 0.79% 0.37% 1.92% 1.81% 0.00% 0.88% 0.00% 0.01% 5.08% 1.00% 3.64% 0.72% 5) duplicate submission 3.36% 3.16%25.13% 0.02% 3.19% 3.06% 0.00% 6.81% 0.00% 0.22% 4.37% 4.00% 3.43% 0.77% 6) all other miscellaneous 58.36% 7.84%79.58% 10.20% 5.73% 6.38% 8.07% 0.74% 0.00% 6.77% 0.94% 15.00% 0.81% 14.00%
45
Member Satisfaction Survey – Health Maintenance Organizations
HMO Aetna Health Anthem CIGNA ConnectiCare Harvard* Oxford
Percentage of Managed Care members surveyed. 3.69% 2.42% 20.00% 0.80% 40.00% 27.00% The percentage of those surveyed who responded. 20.05% 25.98% 20.50% 24.00% 8.90% 29.61%
Q. In the last 12 months, how often did you get an appointment with a specialist as soon as you needed? Never 2.20% 1.79% 1.00% 2.00% 10.00% 2.36% Sometimes 11.80% 12.11% 11.60% 2.00% 20.00% 9.76% Usually 34.40% 29.15% 33.20% 36.00% 20.00% 29.97% Always 51.60% 56.95% 54.20% 60.00% 50.00% 57.91%
Q. In the last 12 months, how often did you get an appointment for a check-up or routine care at a doctor's office or clinic as soon as you needed? Never 0.80% 0.00% 1.50% 0.00% 0.00% 1.55% Sometimes 14.40% 10.21% 14.60% 20.00% 10.50% 10.05% Usually 24.80% 26.76% 29.50% 18.00% 31.60% 27.58% Always 60.00% 63.03% 54.40% 62.00% 57.90% 60.82%
Q. In the last 12 months, when you needed care right away, how often did you get care as soon as you needed? Never 0.00% 0.00% 0.80% 0.00% 0.00% 1.08% Sometimes 8.80% 10.40% 10.60% 11.00% 12.50% 4.84% Usually 19.30% 12.80% 22.00% 25.00% 25.00% 19.35% Always 71.90% 76.80% 66.60% 64.00% 62.50% 74.73%
Q. In the last 12 months, how often was it easy to get care, tests or treatment, you needed through your health plan? Never 0.80% 0.34% 0.70% 0.00% 14.30% 0.53% Sometimes 13.60% 5.84% 8.60% 8.00% 9.50% 6.10% Usually 29.60% 27.15% 36.80% 29.00% 23.80% 29.44% Always 56.00% 66.67% 53.90% 63.00% 52.40% 63.93%
Q. In the last 12 months, how often did the written materials or Internet provide the information you needed about how your health plan works? Never 0.00% 7.78% 1.10% 0.00% 28.60% 3.41% Sometimes 38.80% 25.56% 30.10% 36.00% 28.60% 27.27% Usually 42.90% 43.33% 50.50% 32.00% 19.00% 43.65% Always 18.40% 23.33% 18.30% 32.00% 23.80% 25.00%
* New company to the market Totals may not add to 100% due to rounding, or failure of some respondents to answer all questions.
46
HMO Aetna Health Anthem CIGNA ConnectiCare Harvard* Oxford
Q. In the last 12 months, how often did your health plan's customer service give you the information or help you needed? Never 8.30% 3.30% 0.90% 0.00% 23.80% 3.23% Sometimes 20.80% 8.79% 13.40% 22.00% 23.80% 14.52% Usually 18.80% 39.56% 34.80% 14.00% 19.00% 26.61% Always 52.10% 48.35% 50.90% 64.00% 33.30% 55.65% Q. In the last 12 months, how often were you satisfied with your prescription drug coverage? Never 7.90% 0.00% 0.70% 10.00% 14.30% 0.77% Sometimes 9.90% 13.00% 11.00% 8.00% 14.30% 4.08% Usually 24.80% 28.00% 45.50% 47.00% 23.80% 24.74% Always 57.40% 60.00% 42.80% 35.00% 47.60% 70.41%
Q. If you weren’t satisfied with your prescription drug coverage as stated in the above question, which one of these items would most closely identify your greatest area of concern? Copayments too high / percentage paid too low 27.50% 52.00% 49.60% 48.00% 27.30% 46.81% Deductible too high 30.00% 8.00% 8.40% 32.00% 45.50% 2.13% Cost of the benefit coverage too high 10.00% 0.00% 7.60% 10.00% 0.00% 4.26% Managed care guidelines too restrictive (i.e. prior authorization) 12.50% 20.00% 14.60% 0.00% 18.20% 21.28% Drug not included on the formulary 20.00% 0.00% 19.80% 10.00% 9.10% 25.53%
Q. Use any number from 0 to 10 where 0 is the worst health plan possible and 10 is the best health plan possible. How would you rate your health plan now?
(worst possible) 0 1.50% 0.00% 0.30% 0.00% 9.50% 0.24% 1 0.70% 0.00% 0.00% 1.00% 4.80% 0.72% 2 2.20% 0.33% 0.70% 1.00% 0.00% 0.72% 3 0.70% 0.00% 0.30% 1.00% 4.80% 0.72% 4 2.20% 0.33% 1.00% 0.00% 4.80% 0.72% 5 11.80% 3.91% 5.70% 6.00% 9.50% 6.28% 6 9.60% 2.93% 9.10% 14.00% 4.80% 4.59% 7 16.20% 8.14% 20.10% 14.00% 4.80% 5.56% 8 27.20% 23.78% 25.50% 29.00% 38.10% 22.71% 9 14.70% 23.78% 18.80% 18.00% 19.00% 21.01%
(best possible) 10 13.20% 36.81% 18.50% 16.00% 0.00% 36.71%
* New company to the market
47
Member Satisfaction Survey – Indemnity Managed Care Organizations Carrier Aetna Life Anthem Celtic CIGNA H & L ConnectiCare
Benefits* Percentage of Managed Care members surveyed. 0.72% 0.82% 100.00% 24.00% 3.30% The percentage of those surveyed who responded. 20.98% 25.82% 5.33% 24.20% 23.00%
Q. In the last 12 months, how often did you get an appointment with a specialist as soon as you needed.
Never 0.80% 2.47% 28.00% 0.80% 2.00% Sometimes 5.90% 6.79% 0.00% 9.20% 14.00% Usually 33.90% 32.10% 43.00% 33.80% 31.00% Always 59.30% 58.64% 29.00% 56.20% 53.00%
Q. In the last 12 months, how often did you get an appointment for a check-up or routine care at a doctor's office or clinic as soon as you needed? Never 2.40% 2.60% 12.00% 1.30% 4.00% Sometimes 8.90% 13.02% 0.00% 13.10% 26.00% Usually 26.60% 27.60% 38.00% 30.80% 21.00% Always 62.10% 56.77% 50.00% 54.80% 49.00%
Q. In the last 12 months, when you needed care right away, how often did you get care as soon as you needed?
Never 0.00% 0.00% 12.00% 0.00% 0.00% Sometimes 6.30% 10.00% 0.00% 9.80% 0.00% Usually 20.30% 23.33% 38.00% 24.80% 0.00% Always 73.40% 66.67% 50.00% 65.40% 71.00%
Q In the last 12 months, how often was it easy to get care, tests or treatment, you needed through your health plan?
Never 0.60% 2.03% 0.00% 0.30% 4.00% Sometimes 3.40% 7.11% 12.00% 5.50% 10.00% Usually 35.80% 31.47% 38.00% 36.80% 25.00% Always 60.20% 59.39% 50.00% 57.40% 61.00%
Q. In the last 12 months, how often did the written materials or Internet provide the information you needed about how your health plan works?
Never 0.00% 5.97% 0.00% 2.60% 8.00% Sometimes 31.80% 35.82% 22.00% 35.90% 34.00% Usually 48.90% 38.81% 33.00% 41.90% 33.00% Always 19.30% 19.40% 45.00% 19.60% 25.00%
* New companies to the market.
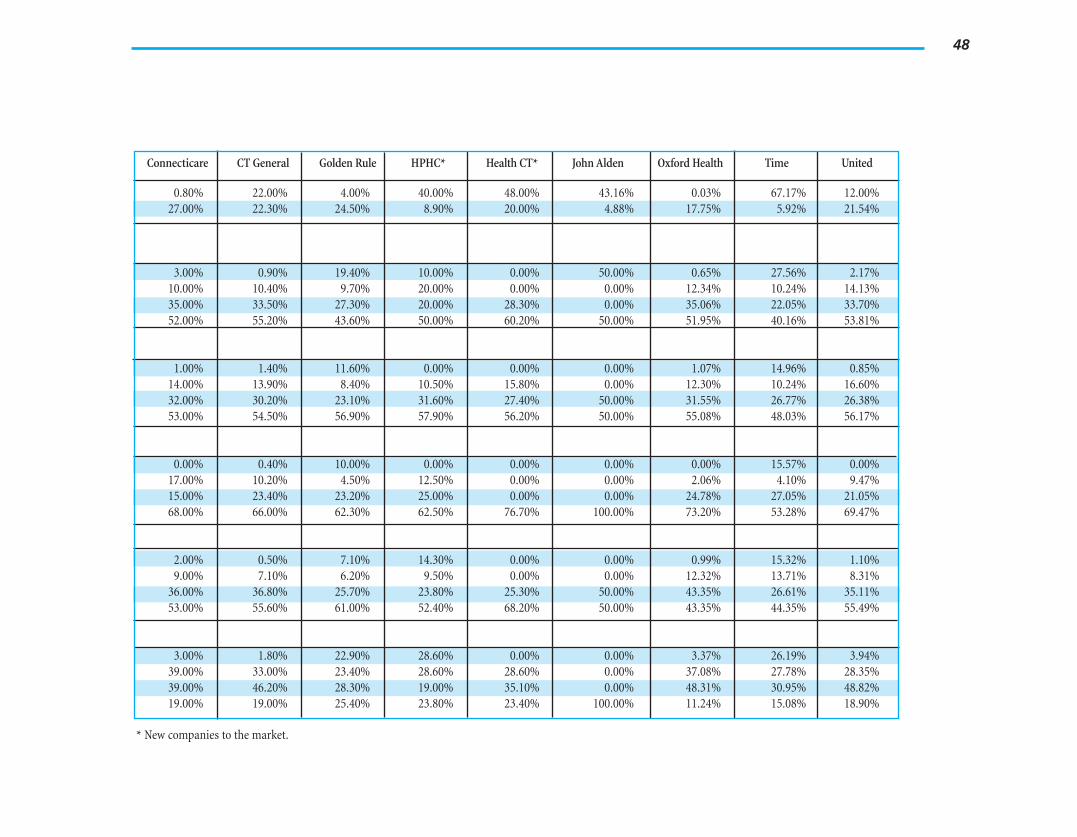
48
Connecticare CT General Golden Rule HPHC* Health CT* John Alden Oxford Health Time United
0.80% 27.00%
22.00% 22.30%
4.00% 24.50%
40.00% 8.90%
48.00% 20.00%
43.16% 4.88%
0.03% 17.75%
67.17% 5.92%
12.00% 21.54%
3.00% 10.00% 35.00% 52.00%
0.90% 10.40% 33.50% 55.20%
19.40% 9.70%
27.30% 43.60%
10.00% 20.00% 20.00% 50.00%
0.00% 0.00%
28.30% 60.20%
50.00% 0.00% 0.00%
50.00%
0.65% 12.34% 35.06% 51.95%
27.56% 10.24% 22.05% 40.16%
2.17% 14.13% 33.70% 53.81%
1.00% 14.00% 32.00% 53.00%
1.40% 13.90% 30.20% 54.50%
11.60% 8.40%
23.10% 56.90%
0.00% 10.50% 31.60% 57.90%
0.00% 15.80% 27.40% 56.20%
0.00% 0.00%
50.00% 50.00%
1.07% 12.30% 31.55% 55.08%
14.96% 10.24% 26.77% 48.03%
0.85% 16.60% 26.38% 56.17%
0.00% 17.00% 15.00% 68.00%
0.40% 10.20% 23.40% 66.00%
10.00% 4.50%
23.20% 62.30%
0.00% 12.50% 25.00% 62.50%
0.00% 0.00% 0.00%
76.70%
0.00% 0.00% 0.00%
100.00%
0.00% 2.06%
24.78% 73.20%
15.57% 4.10%
27.05% 53.28%
0.00% 9.47%
21.05% 69.47%
2.00% 9.00%
36.00% 53.00%
0.50% 7.10%
36.80% 55.60%
7.10% 6.20%
25.70% 61.00%
14.30% 9.50%
23.80% 52.40%
0.00% 0.00%
25.30% 68.20%
0.00% 0.00%
50.00% 50.00%
0.99% 12.32% 43.35% 43.35%
15.32% 13.71% 26.61% 44.35%
1.10% 8.31%
35.11% 55.49%
3.00% 39.00% 39.00% 19.00%
1.80% 33.00% 46.20% 19.00%
22.90% 23.40% 28.30% 25.40%
28.60% 28.60% 19.00% 23.80%
0.00% 28.60% 35.10% 23.40%
0.00% 0.00% 0.00%
100.00%
3.37% 37.08% 48.31% 11.24%
26.19% 27.78% 30.95% 15.08%
3.94% 28.35% 48.82% 18.90%
* New companies to the market.
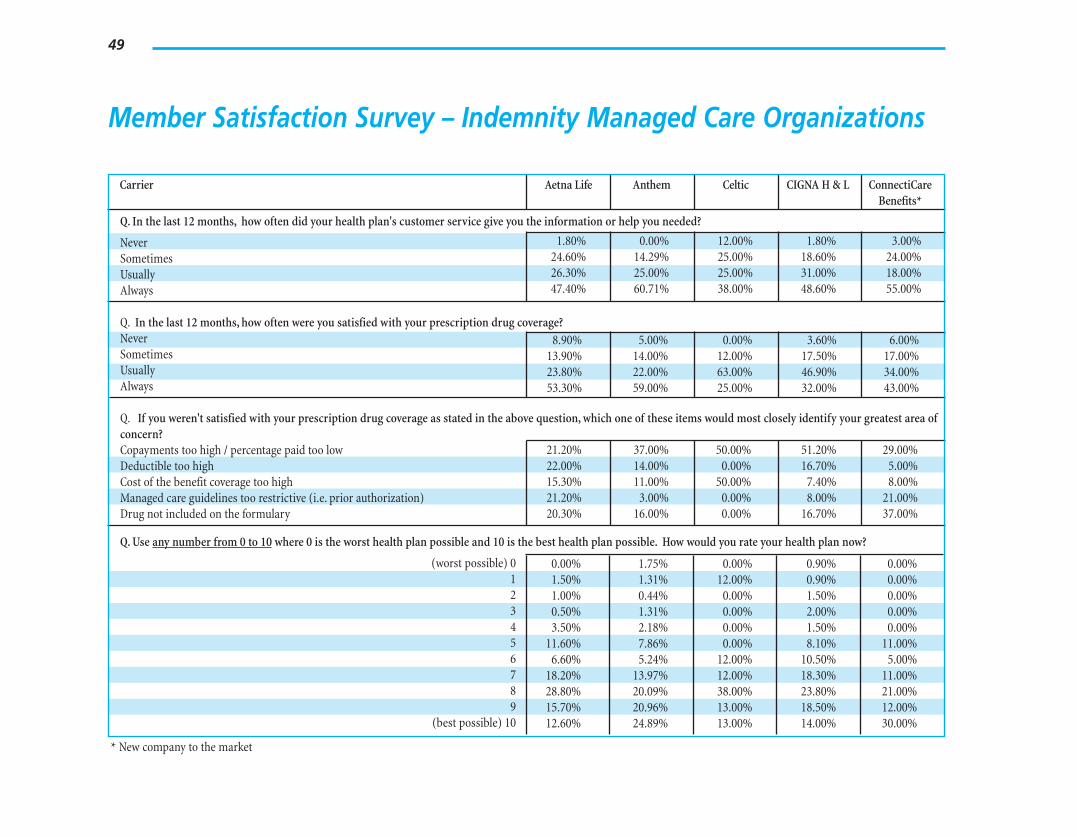
49
Member Satisfaction Survey – Indemnity Managed Care Organizations
Carrier Aetna Life Anthem Celtic CIGNA H & L ConnectiCare Benefits*
Q. In the last 12 months, how often did your health plan's customer service give you the information or help you needed?
Never 1.80% 0.00% 12.00% 1.80% 3.00% Sometimes 24.60% 14.29% 25.00% 18.60% 24.00% Usually 26.30% 25.00% 25.00% 31.00% 18.00% Always 47.40% 60.71% 38.00% 48.60% 55.00%
Q. In the last 12 months, how often were you satisfied with your prescription drug coverage? Never 8.90% 5.00% 0.00% 3.60% 6.00% Sometimes 13.90% 14.00% 12.00% 17.50% 17.00% Usually 23.80% 22.00% 63.00% 46.90% 34.00% Always 53.30% 59.00% 25.00% 32.00% 43.00%
Q. If you weren't satisfied with your prescription drug coverage as stated in the above question, which one of these items would most closely identify your greatest area of concern? Copayments too high / percentage paid too low 21.20% 37.00% 50.00% 51.20% 29.00% Deductible too high 22.00% 14.00% 0.00% 16.70% 5.00% Cost of the benefit coverage too high 15.30% 11.00% 50.00% 7.40% 8.00% Managed care guidelines too restrictive (i.e. prior authorization) 21.20% 3.00% 0.00% 8.00% 21.00% Drug not included on the formulary 20.30% 16.00% 0.00% 16.70% 37.00%
Q. Use any number from 0 to 10 where 0 is the worst health plan possible and 10 is the best health plan possible. How would you rate your health plan now?
(worst possible) 0 0.00% 1.75% 0.00% 0.90% 0.00% 1 1.50% 1.31% 12.00% 0.90% 0.00% 2 1.00% 0.44% 0.00% 1.50% 0.00% 3 0.50% 1.31% 0.00% 2.00% 0.00% 4 3.50% 2.18% 0.00% 1.50% 0.00% 5 11.60% 7.86% 0.00% 8.10% 11.00% 6 6.60% 5.24% 12.00% 10.50% 5.00% 7 18.20% 13.97% 12.00% 18.30% 11.00% 8 28.80% 20.09% 38.00% 23.80% 21.00% 9 15.70% 20.96% 13.00% 18.50% 12.00%
(best possible) 10 12.60% 24.89% 13.00% 14.00% 30.00%
* New company to the market
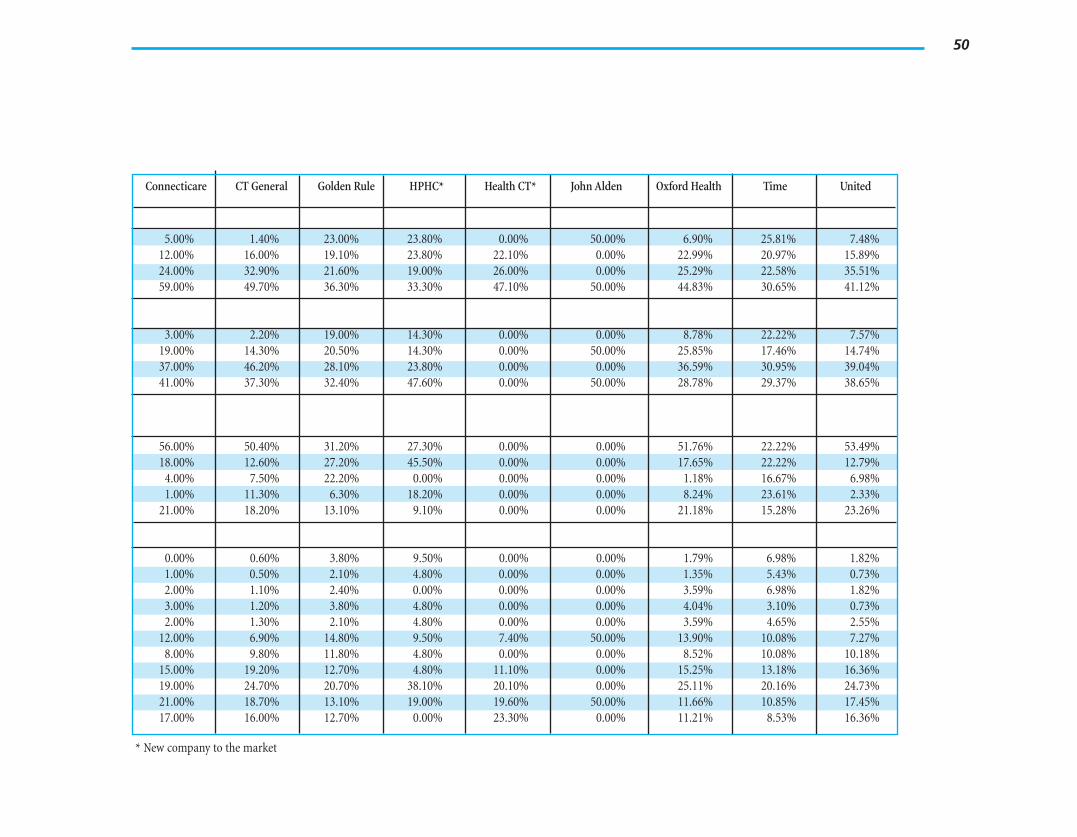
50
Connecticare CT General Golden Rule HPHC* Health CT* John Alden Oxford Health Time United
5.00% 1.40% 23.00% 23.80% 0.00% 50.00% 6.90% 25.81% 7.48% 12.00% 16.00% 19.10% 23.80% 22.10% 0.00% 22.99% 20.97% 15.89% 24.00% 32.90% 21.60% 19.00% 26.00% 0.00% 25.29% 22.58% 35.51% 59.00% 49.70% 36.30% 33.30% 47.10% 50.00% 44.83% 30.65% 41.12%
3.00% 2.20% 19.00% 14.30% 0.00% 0.00% 8.78% 22.22% 7.57% 19.00% 14.30% 20.50% 14.30% 0.00% 50.00% 25.85% 17.46% 14.74% 37.00% 46.20% 28.10% 23.80% 0.00% 0.00% 36.59% 30.95% 39.04% 41.00% 37.30% 32.40% 47.60% 0.00% 50.00% 28.78% 29.37% 38.65%
56.00% 50.40% 31.20% 27.30% 0.00% 0.00% 51.76% 22.22% 53.49% 18.00% 12.60% 27.20% 45.50% 0.00% 0.00% 17.65% 22.22% 12.79%
4.00% 7.50% 22.20% 0.00% 0.00% 0.00% 1.18% 16.67% 6.98% 1.00% 11.30% 6.30% 18.20% 0.00% 0.00% 8.24% 23.61% 2.33%
21.00% 18.20% 13.10% 9.10% 0.00% 0.00% 21.18% 15.28% 23.26%
0.00% 0.60% 3.80% 9.50% 0.00% 0.00% 1.79% 6.98% 1.82% 1.00% 0.50% 2.10% 4.80% 0.00% 0.00% 1.35% 5.43% 0.73% 2.00% 1.10% 2.40% 0.00% 0.00% 0.00% 3.59% 6.98% 1.82% 3.00% 1.20% 3.80% 4.80% 0.00% 0.00% 4.04% 3.10% 0.73% 2.00% 1.30% 2.10% 4.80% 0.00% 0.00% 3.59% 4.65% 2.55%
12.00% 6.90% 14.80% 9.50% 7.40% 50.00% 13.90% 10.08% 7.27% 8.00% 9.80% 11.80% 4.80% 0.00% 0.00% 8.52% 10.08% 10.18%
15.00% 19.20% 12.70% 4.80% 11.10% 0.00% 15.25% 13.18% 16.36% 19.00% 24.70% 20.70% 38.10% 20.10% 0.00% 25.11% 20.16% 24.73% 21.00% 18.70% 13.10% 19.00% 19.60% 50.00% 11.66% 10.85% 17.45% 17.00% 16.00% 12.70% 0.00% 23.30% 0.00% 11.21% 8.53% 16.36%
* New company to the market
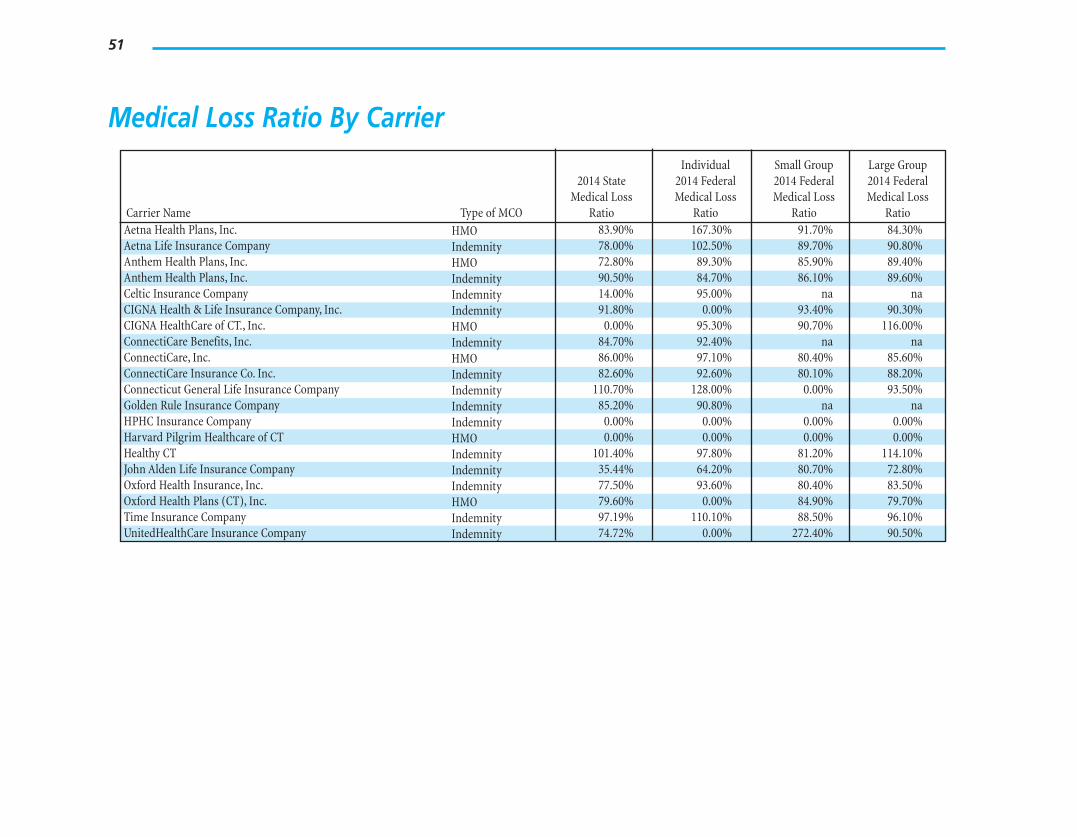
51
Medical Loss Ratio By Carrier
Carrier Name Type of MCO
2014 State Medical Loss
Ratio
Individual 2014 Federal Medical Loss
Ratio
Small Group 2014 Federal Medical Loss
Ratio
Large Group 2014 Federal Medical Loss
Ratio Aetna Health Plans, Inc. HMO 83.90% 167.30% 91.70% 84.30% Aetna Life Insurance Company Indemnity 78.00% 102.50% 89.70% 90.80% Anthem Health Plans, Inc. HMO 72.80% 89.30% 85.90% 89.40% Anthem Health Plans, Inc. Indemnity 90.50% 84.70% 86.10% 89.60% Celtic Insurance Company Indemnity 14.00% 95.00% na na CIGNA Health & Life Insurance Company, Inc. Indemnity 91.80% 0.00% 93.40% 90.30% CIGNA HealthCare of CT., Inc. HMO 0.00% 95.30% 90.70% 116.00% ConnectiCare Benefits, Inc. Indemnity 84.70% 92.40% na na ConnectiCare, Inc. HMO 86.00% 97.10% 80.40% 85.60% ConnectiCare Insurance Co. Inc. Indemnity 82.60% 92.60% 80.10% 88.20% Connecticut General Life Insurance Company Indemnity 110.70% 128.00% 0.00% 93.50% Golden Rule Insurance Company Indemnity 85.20% 90.80% na na HPHC Insurance Company Indemnity 0.00% 0.00% 0.00% 0.00% Harvard Pilgrim Healthcare of CT HMO 0.00% 0.00% 0.00% 0.00% Healthy CT Indemnity 101.40% 97.80% 81.20% 114.10% John Alden Life Insurance Company Indemnity 35.44% 64.20% 80.70% 72.80% Oxford Health Insurance, Inc. Indemnity 77.50% 93.60% 80.40% 83.50% Oxford Health Plans (CT), Inc. HMO 79.60% 0.00% 84.90% 79.70% Time Insurance Company Indemnity 97.19% 110.10% 88.50% 96.10% UnitedHealthCare Insurance Company Indemnity 74.72% 0.00% 272.40% 90.50%
52
Glossary Adverse determination: Any prospective review, concurrent review or retrospective review determination that denies, reduces or terminates or fails to provide or make payment, in whole or in part, for a benefit under the health carrier's health benefit plan requested by a covered person or a covered person's treating health care professional. "Adverse determination" includes a rescission of coverage determination for grievance purposes.
Board certified physician: A physician who has passed an examination given by a medical board for a particular specialty.
Capitation: A provider payment method in which a MCO pays a fixed amount per month for each enrollee regardless of the number of services performed.
Case management: A process whereby enrollees with specific health needs are identified by the MCO and a plan of treatment is set up and monitored to achieve optimum patient outcome in a cost effective manner.
Center for Medicare & Medicaid Services (CMS): The federal agency responsible for administering the Medicare program, including Medicare risk contracts with HMOs, and overseeing each state’s administration of the Medicaid program.
Coinsurance: A fixed percentage of the eligible medical expenses the enrollee is required to pay, in excess of any deductible.
Copayment: A flat fee that an enrollee is required to pay each time a specified service is rendered, in excess of any deductible.
Credentialing: A process of review to include and maintain a provider as a participating provider in the MCO’s network.
Deductible: The portion of eligible medical expenses in a calendar or contract year that an enrollee must pay before any benefits are paid.
Drug formulary: A listing of prescription drugs that are preferred for use by the MCO. The physician is encouraged to prescribe formulary drugs unless there is a valid medical reason to use a nonformulary drug. There may be higher cost sharing for nonformulary drugs.
Emergency medical treatment: Treatment for a condition a prudent layperson reasonably believes requires immediate medical attention. Coverage is determined based on either the presenting symptoms or the final diagnosis, whichever reasonably indicates an emergency medical condition.
Employee Retirement Income Security Act of 1974 (ERISA): Federal law that sets regulatory standards for employer plans.
Fee for service: A provider payment method in which a MCO pays a fee for each service provided.
Fully insured plan: A plan that is backed by an insurance policy that provides benefits for a premium.
53
Gatekeeper plan: A plan that requires an enrollee to first seek treatment from a chosen primar y care physician before seeing a specialist. The primar y care physician must make referrals to specialists for the services to be covered under the plan.
Health maintenance organization (HMO): A company that provides, offers or arranges for coverage of health services needed by plan members for a fixed, prepaid premium. In Connecticut, such organizations are licensed as health care centers.
Indemnity MCO: A licensed non-HMO insurer that offers a managed care plan in Connecticut.
Indemnity plan: An insurance plan in which the enrollee is reimbursed at a specified level for covered expenses.
Individual practice association (IPA): An association of physicians that contracts with a MCO to provide health services.
Managed care: A system of health care delivery that attempts to manage the access, cost and quality of health care by monitoring how and in what manner services are provided.
Managed care organization (MCO): An insurer, health care center, hospital or other organization delivering a managed care plan.
Managed care plan: An insured health plan that uses UR and a network of participating providers.
Mandated benefit: Policy benefits that are required to be provided by statute.
Medical loss ratio: The ratio of incurred claims to earned premium, which represents the percent of the premium that is applied to medical expenses.
NCQA accreditation: National Committee on Quality Assurance is a not for profit organization that reviews quality and performance measures of HMOs and health plans thereby providing an external standard of accountability.
Network plan: A plan that requires an enrollee to seek care from a provider who is under contract with the MCO to receive the highest level of benefits. This would also include a plan that provides additional coverage for services by providers outside the network. The out of network option generally provides coverage at a lower level of benefits.
Participating provider: A provider who has a contract with the MCO to deliver medical services to enrollees for an agreed upon fee.
Point of service plan (POS): A network plan that allows an enrollee to seek treatment from a non-participating provider at a lower level of benefits.
Preferred provider organization (PPO): An independent network of providers that contracts with a MCO to provide health services. A PPO cannot market insured health insurance policies on its own unless it obtains a license as an insurer or health care center.
Preferred provider organization plan: A network plan that allows an enrollee to seek treatment from a non-participating provider at a lower level of benefits.
54
Primary care physician (PCP): A physician chosen by an enrollee to provide primary care. The plan may require the PCP to make referrals to specialists for the services to be covered under the plan.
Preauthorization: The process whereby the MCO requires services or plans of treatment to be approved before given.
Precertification: The process whereby the MCO requires services or plans of treatment to be approved before given.
Prior authorization: The process whereby the MCO requires services or plans of treatment to be approved before given.
Provider: A physician, hospital, nursing home, pharmacy, lab or any individual or group that provides a health care service.
Reasonable and customar y fee: The commonly charged or prevailing fees for health services in a specific geographic area. Indemnity plans generally provide coverage for services based on the reasonable and customary fees. In addition to any deductible or coinsurance amount, an enrollee would be responsible for paying the provider the difference between the billed charge and the reasonable and customary charge if the billed charge was higher.
Referral: The request to the MCO by a primary care physician for an enrollee to receive care from a specialist, a non-participating provider or facility.
Self insured plan: A group plan in which the employer takes on the risk of claims. The employer will generally contract with a third party, often an insurance company, to handle the administration of the plan. Such plans are not regulated by the Insurance Department, but are subject to federal ERISA guidelines.
Utilization review (UR): The use of a set of formal techniques designed to monitor the use of, or evaluate the medical necessity, appropriateness, efficacy or efficiency of, health care services, health care procedures or health care settings. Such techniques may include the monitoring of or evaluation of (A) health care services performed or provided in an outpatient setting, (B) the formal process for determining, prior to discharge from a facility, the coordination and management of the care that a patient receives following discharge from a facility, (C) opportunities or requirements to obtain a clinical evaluation by a health care professional other than the one originally making a recommendation for a proposed health care service, (D) coordinated sets of activities conducted for individual patient management of serious, complicated, protracted or other health conditions, or (E) prospective review, concurrent review, retrospective review or certification.
Utilization review company (URC): A company, organization or other entity licensed in Connecticut to perform UR. Agencies of the federal and state government are not considered URC under Connecticut General Statutes.
55
Additional licensed companies that offer a managed care plan in Connecticut but were not included in this guide. The same information found in this guide, is available directly from the companies or at the offices of the Insurance Department.
Trustmark Insurance Company 400 Field Drive Lake Forest, IL 60045 1-800-366-6663
Note: Some companies may be servicing existing business and not currently issuing new business.
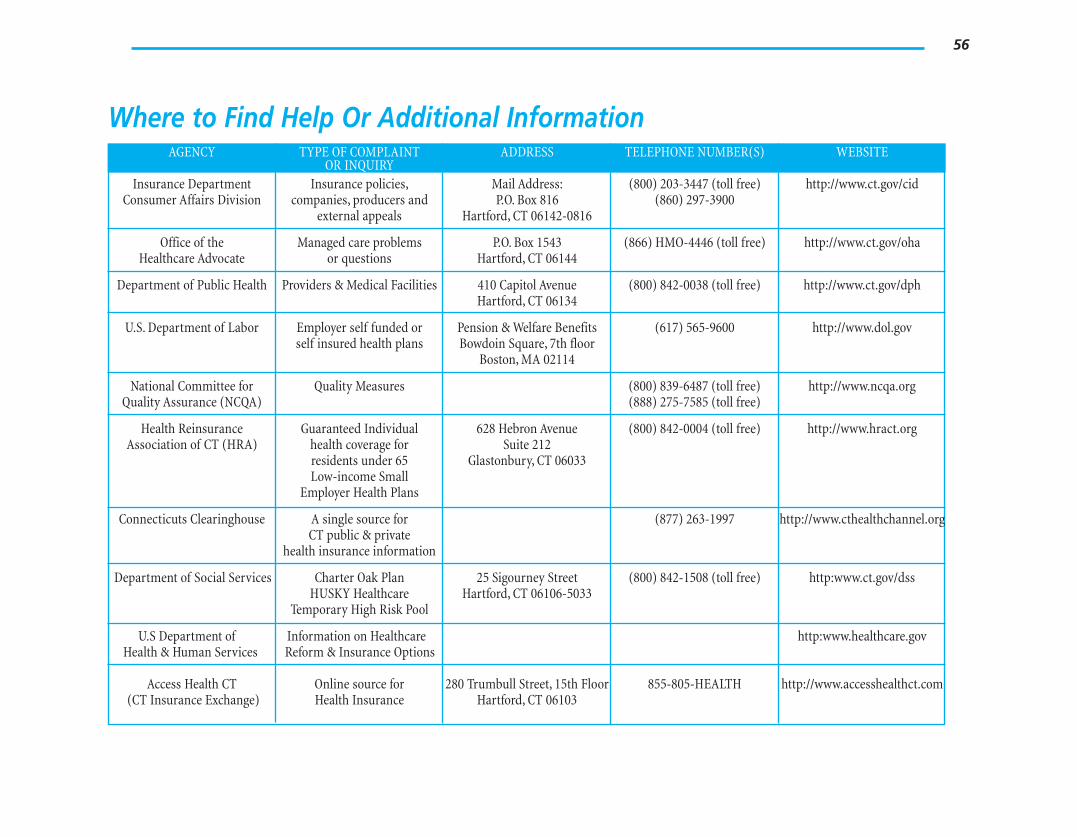
56
Where to Find Help Or Additional Information AGENCY
Insurance Department Consumer Affairs Division
TYPE OF COMPLAINT OR INQUIRY
Insurance policies, companies, producers and
external appeals
ADDRESS
Mail Address: P.O. Box 816
Hartford, CT 06142-0816
TELEPHONE NUMBER(S)
(800) 203-3447 (toll free) (860) 297-3900
WEBSITE
http://www.ct.gov/cid
Office of the Managed care problems P.O. Box 1543 (866) HMO-4446 (toll free) http://www.ct.gov/oha Healthcare Advocate or questions Hartford, CT 06144
Department of Public Health Providers & Medical Facilities 410 Capitol Avenue Hartford, CT 06134
(800) 842-0038 (toll free) http://www.ct.gov/dph
U.S. Department of Labor Employer self funded or Pension & Welfare Benefits (617) 565-9600 http://www.dol.gov self insured health plans Bowdoin Square, 7th floor
Boston, MA 02114
National Committee for Quality Measures (800) 839-6487 (toll free) http://www.ncqa.org Quality Assurance (NCQA) (888) 275-7585 (toll free)
Health Reinsurance Association of CT (HRA)
Guaranteed Individual health coverage for residents under 65 Low-income Small
628 Hebron Avenue Suite 212
Glastonbury, CT 06033
(800) 842-0004 (toll free) http://www.hract.org
Employer Health Plans
Connecticuts Clearinghouse A single source for (877) 263-1997 http://www.cthealthchannel.org CT public & private
health insurance information
Department of Social Services Charter Oak Plan 25 Sigourney Street (800) 842-1508 (toll free) http:www.ct.gov/dss HUSKY Healthcare Hartford, CT 06106-5033
Temporar y High Risk Pool
U.S Department of Information on Healthcare http:www.healthcare.gov Health & Human Services Reform & Insurance Options
Access Health CT Online source for 280 Trumbull Street, 15th Floor 855-805-HEALTH http://www.accesshealthct.com (CT Insurance Exchange) Health Insurance Hartford, CT 06103

57
Notes