Embed Size (px)
DESCRIPTION
Â
Citation preview
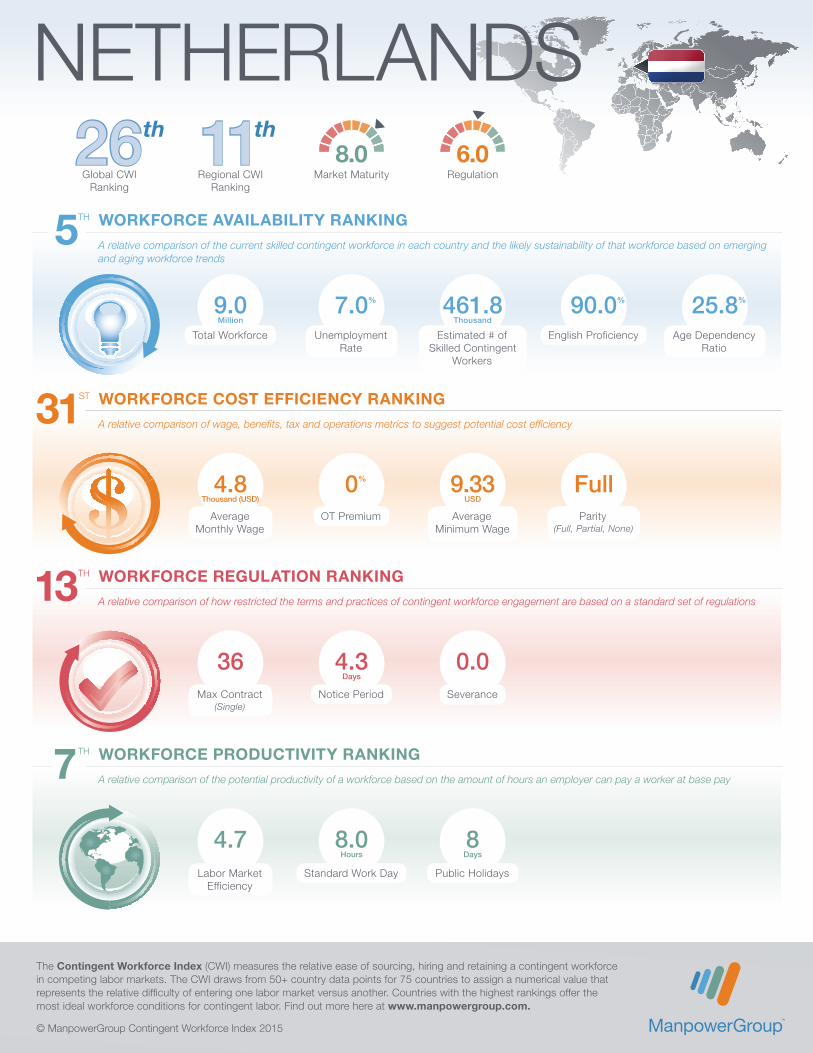
Global CWI Ranking
Regional CWI Ranking
26th 11th
The Contingent Workforce Index (CWI) measures the relative ease of sourcing, hiring and retaining a contingent workforce in competing labor markets. The CWI draws from 50+ country data points for 75 countries to assign a numerical value that represents the relative difficulty of entering one labor market versus another. Countries with the highest rankings offer the most ideal workforce conditions for contingent labor. Find out more here at www.manpowergroup.com.
© ManpowerGroup Contingent Workforce Index 2015
A relative comparison of how restricted the terms and practices of contingent workforce engagement are based on a standard set of regulations
WORKFORCE REGULATION RANKING
A relative comparison of the potential productivity of a workforce based on the amount of hours an employer can pay a worker at base pay
WORKFORCE PRODUCTIVITY RANKING
A relative comparison of wage, benefits, tax and operations metrics to suggest potential cost efficiency
WORKFORCE COST EFFICIENCY RANKING
A relative comparison of the current skilled contingent workforce in each country and the likely sustainability of that workforce based on emerging and aging workforce trends
5TH
31ST
13TH
7TH
WORKFORCE AVAILABILITY RANKING
Max Contract (Single)
Labor Market Efficiency
Average Minimum Wage
Severance
Public Holidays
OT Premium
Notice Period
Standard Work Day
Parity (Full, Partial, None)
Average Monthly Wage
Total Workforce
9.0Million
4.8Thousand (USD)
36
4.7
Unemployment Rate
7.0%
0%
4.3Days
8.0Hours
Estimated # of Skilled Contingent
Workers
461.8Thousand
9.33USD
0.0
8Days
English Proficiency
90.0%
Full
Age Dependency Ratio
25.8%
5 +5+5+5+5+5+5+5+5+5+5+I
8.0Market Maturity
5 +5+5+5+5+5+5+5+5+5+5+I
6.0Regulation
NETHERLANDS