Embed Size (px)
Citation preview
1300 734 318 www.corelogic.com.au
4005
Infill Developer Report January 2015 Edition
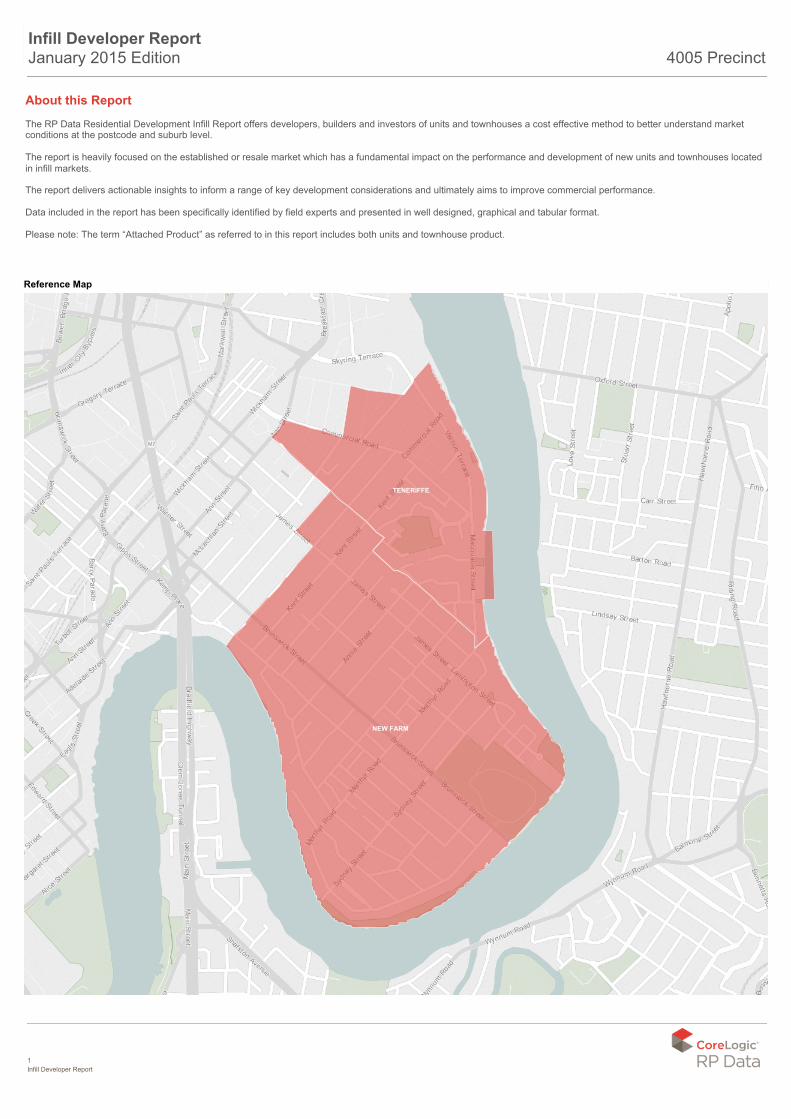
About this Report The RP Data Residential Development Infill Report offers developers, builders and investors of units and townhouses a cost effective method to better understand market conditions at the postcode and suburb level. The report is heavily focused on the established or resale market which has a fundamental impact on the performance and development of new units and townhouses locatedin infill markets. The report delivers actionable insights to inform a range of key development considerations and ultimately aims to improve commercial performance. Data included in the report has been specifically identified by field experts and presented in well designed, graphical and tabular format. Please note: The term “Attached Product” as referred to in this report includes both units and townhouse product.
1 Infill Developer Report
4005 Precinct
TENERIFFE
NEW FARM
Reference Map
Infill Developer Report January 2015 Edition
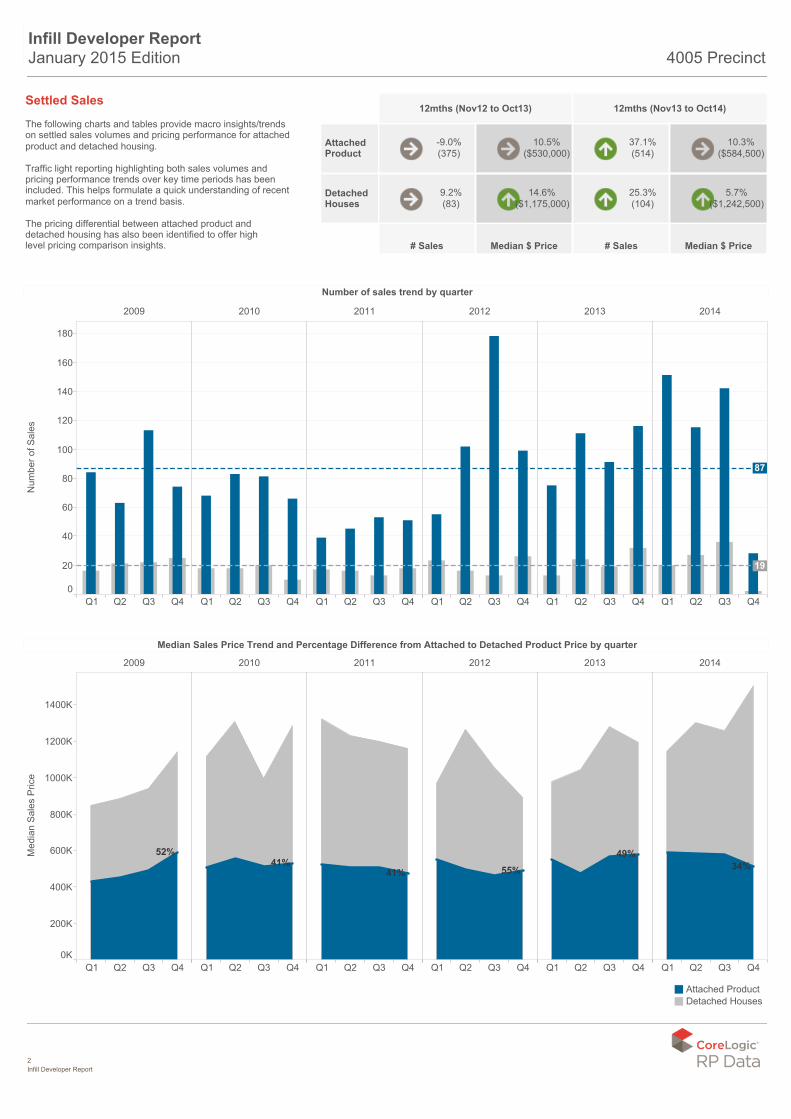
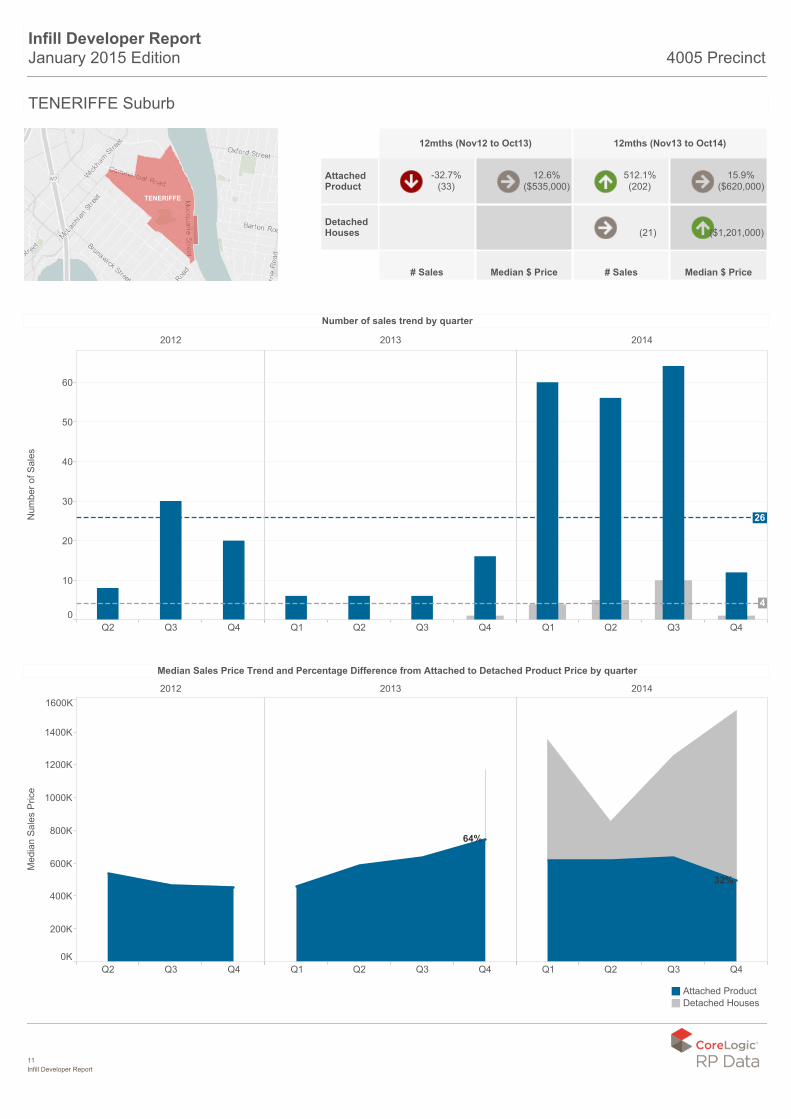
Settled Sales The following charts and tables provide macro insights/trendson settled sales volumes and pricing performance for attachedproduct and detached housing. Traffic light reporting highlighting both sales volumes and pricing performance trends over key time periods has beenincluded. This helps formulate a quick understanding of recentmarket performance on a trend basis. The pricing differential between attached product and detached housing has also been identified to offer highlevel pricing comparison insights.
2 Infill Developer Report
4005 Precinct
12mths (Nov12 to Oct13) 12mths (Nov13 to Oct14)
# Sales Median $ Price # Sales Median $ Price
AttachedProduct
DetachedHouses
9.2%(83)
-9.0%(375)
14.6%($1,175,000)
10.5%($530,000)
25.3%(104)
37.1%(514)
5.7%($1,242,500)
10.3%($584,500)
2009 2010 2011 2012 2013 2014
Q1 Q2 Q3 Q4 Q1 Q2 Q3 Q4 Q1 Q2 Q3 Q4 Q1 Q2 Q3 Q4 Q1 Q2 Q3 Q4 Q1 Q2 Q3 Q40
20
40
60
80
100
120
140
160
180
Number of Sales
19
87
Number of sales trend by quarter
2009 2010 2011 2012 2013 2014
Q1 Q2 Q3 Q4 Q1 Q2 Q3 Q4 Q1 Q2 Q3 Q4 Q1 Q2 Q3 Q4 Q1 Q2 Q3 Q4 Q1 Q2 Q3 Q40K
200K
400K
600K
800K
1000K
1200K
1400K
Median Sales Price
52%41%
41% 55%
49%34%
Median Sales Price Trend and Percentage Difference from Attached to Detached Product Price by quarter
Attached ProductDetached Houses
Infill Developer Report January 2015 Edition
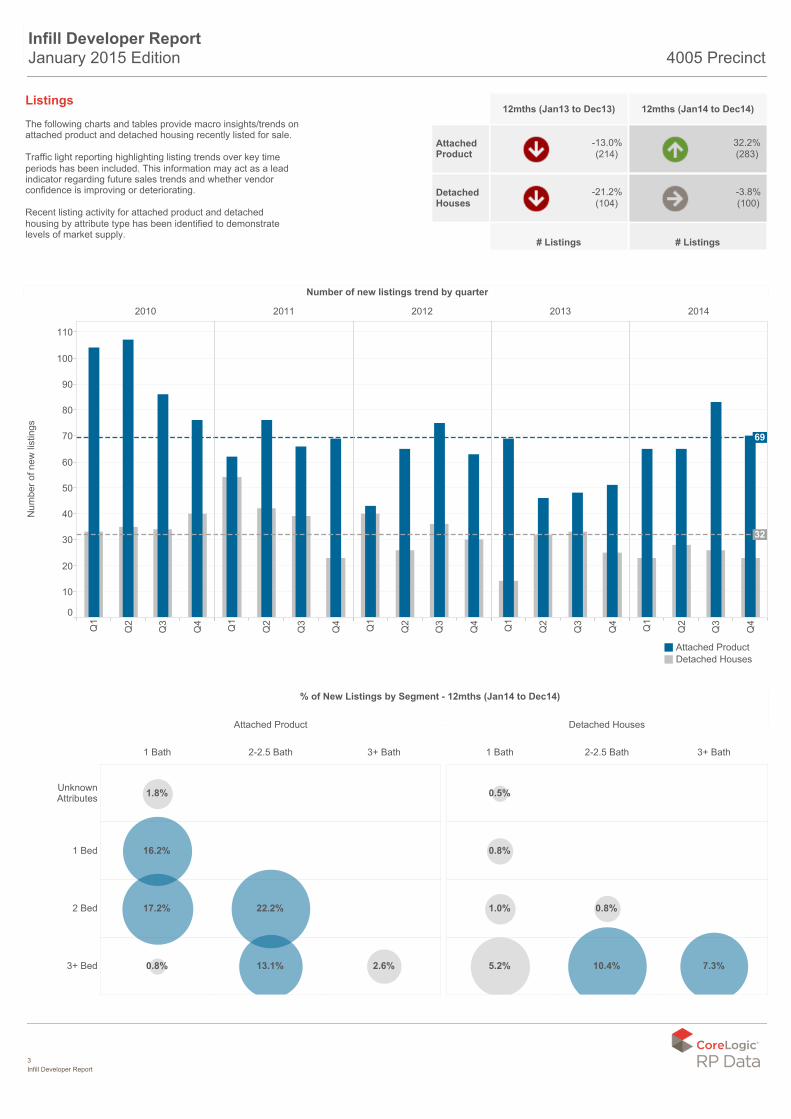
Listings The following charts and tables provide macro insights/trends onattached product and detached housing recently listed for sale. Traffic light reporting highlighting listing trends over key time periods has been included. This information may act as a lead indicator regarding future sales trends and whether vendor confidence is improving or deteriorating. Recent listing activity for attached product and detached housing by attribute type has been identified to demonstrate levels of market supply.
3 Infill Developer Report
4005 Precinct
Infill Developer Report January 2015 Edition
12mths (Jan13 to Dec13) 12mths (Jan14 to Dec14)
# Listings # Listings
AttachedProduct
DetachedHouses
-13.0%(214)
-21.2%(104)
32.2%(283)
-3.8%(100)
2010 2011 2012 2013 2014
Q1
Q2
Q3
Q4
Q1
Q2
Q3
Q4
Q1
Q2
Q3
Q4
Q1
Q2
Q3
Q4
Q1
Q2
Q3
Q4
0
10
20
30
40
50
60
70
80
90
100
110
Number of new listings
32
69
Number of new listings trend by quarter
Attached ProductDetached Houses
% of New Listings by Segment - 12mths (Jan14 to Dec14)
Detached Houses
1 Bath 2-2.5 Bath 3+ Bath
0.5%
0.8%
1.0%
5.2% 10.4%
0.8%
7.3%
Attached Product
1 Bath 2-2.5 Bath 3+ Bath
UnknownAttributes
1 Bed
2 Bed
3+ Bed
16.2%
17.2%
1.8%
0.8%
22.2%
13.1% 2.6%
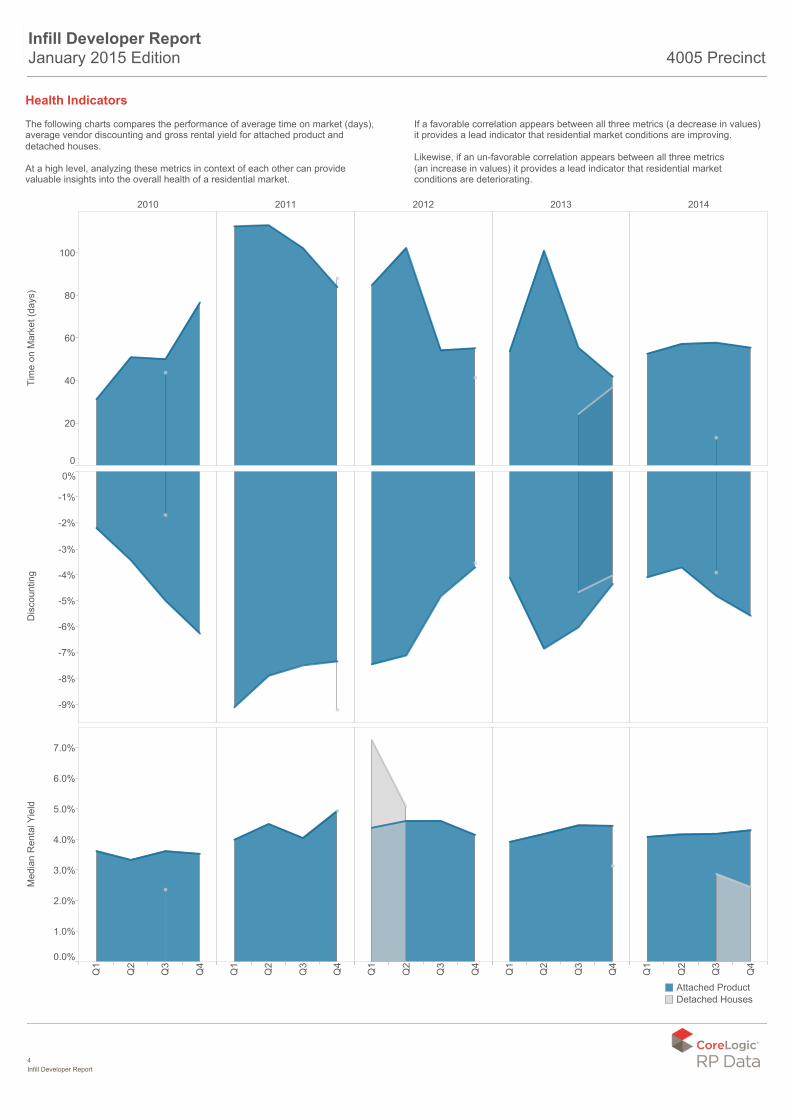
Health Indicators The following charts compares the performance of average time on market (days),average vendor discounting and gross rental yield for attached product anddetached houses. At a high level, analyzing these metrics in context of each other can provide valuable insights into the overall health of a residential market.
4 Infill Developer Report
4005 Precinct
Infill Developer Report January 2015 Edition
2010 2011 2012 2013 2014
0
20
40
60
80
100
Time on Market (days)
Attached ProductDetached Houses
-9%
-8%
-7%
-6%
-5%
-4%
-3%
-2%
-1%
0%
Discounting
Q1
Q2
Q3
Q4
Q1
Q2
Q3
Q4
Q1
Q2
Q3
Q4
Q1
Q2
Q3
Q4
Q1
Q2
Q3
Q4
0.0%
1.0%
2.0%
3.0%
4.0%
5.0%
6.0%
7.0%
Median Rental Yield
If a favorable correlation appears between all three metrics (a decrease in values)it provides a lead indicator that residential market conditions are improving. Likewise, if an un-favorable correlation appears between all three metrics (an increase in values) it provides a lead indicator that residential market conditions are deteriorating.
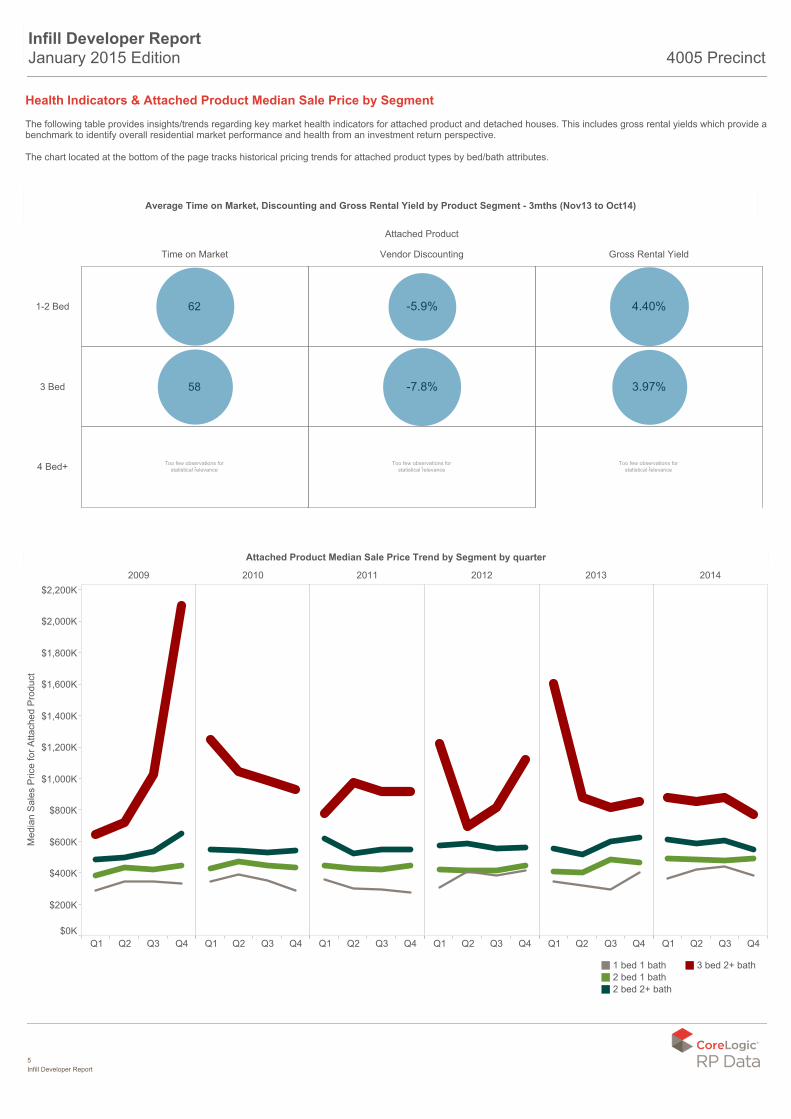
Health Indicators & Attached Product Median Sale Price by Segment The following table provides insights/trends regarding key market health indicators for attached product and detached houses. This includes gross rental yields which provide abenchmark to identify overall residential market performance and health from an investment return perspective. The chart located at the bottom of the page tracks historical pricing trends for attached product types by bed/bath attributes.
5 Infill Developer Report
4005 Precinct
Infill Developer Report January 2015 Edition
Average Time on Market, Discounting and Gross Rental Yield by Product Segment - 3mths (Nov13 to Oct14)
2009 2010 2011 2012 2013 2014
Q1 Q2 Q3 Q4 Q1 Q2 Q3 Q4 Q1 Q2 Q3 Q4 Q1 Q2 Q3 Q4 Q1 Q2 Q3 Q4 Q1 Q2 Q3 Q4$0K
$200K
$400K
$600K
$800K
$1,000K
$1,200K
$1,400K
$1,600K
$1,800K
$2,000K
$2,200K
Median Sales Price for Attached Product
Attached Product Median Sale Price Trend by Segment by quarter
1 bed 1 bath2 bed 1 bath2 bed 2+ bath
3 bed 2+ bath
Attached Product
Time on Market Vendor Discounting Gross Rental Yield
1-2 Bed
3 Bed
4 Bed+ Too few observations forstatistical relevance
58
62
Too few observations forstatistical relevance
-7.8%
-5.9%
Too few observations forstatistical relevance
3.97%
4.40%
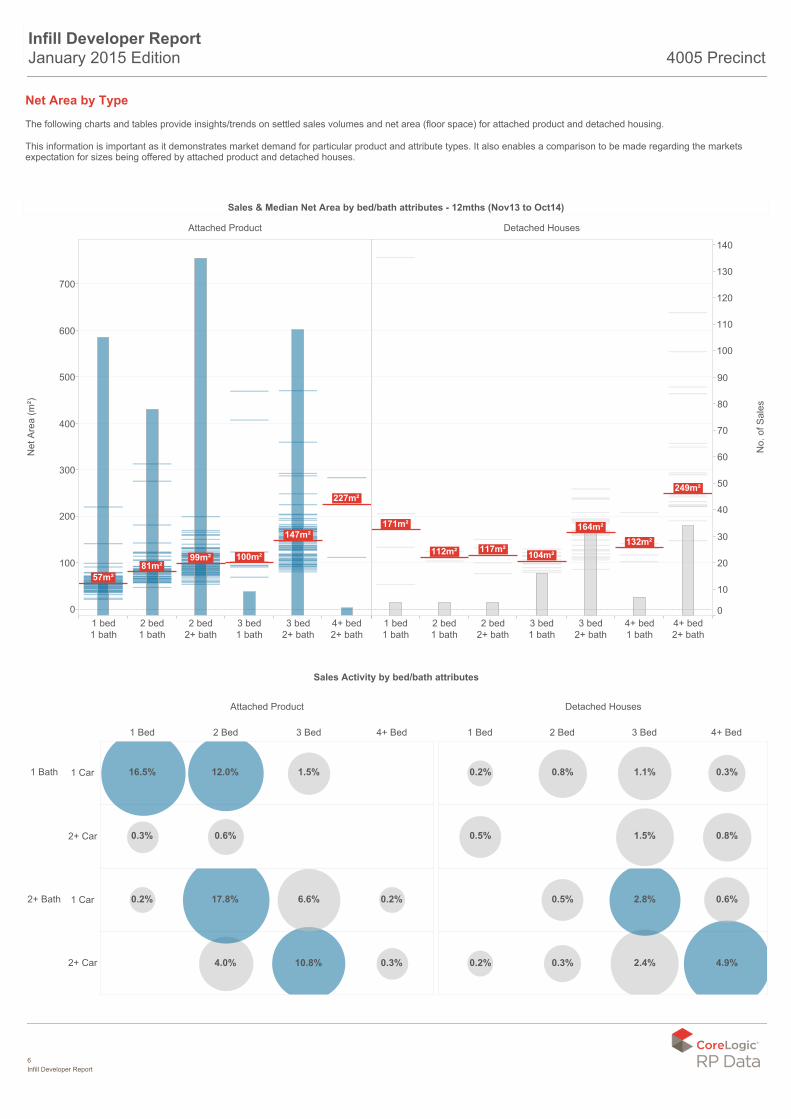
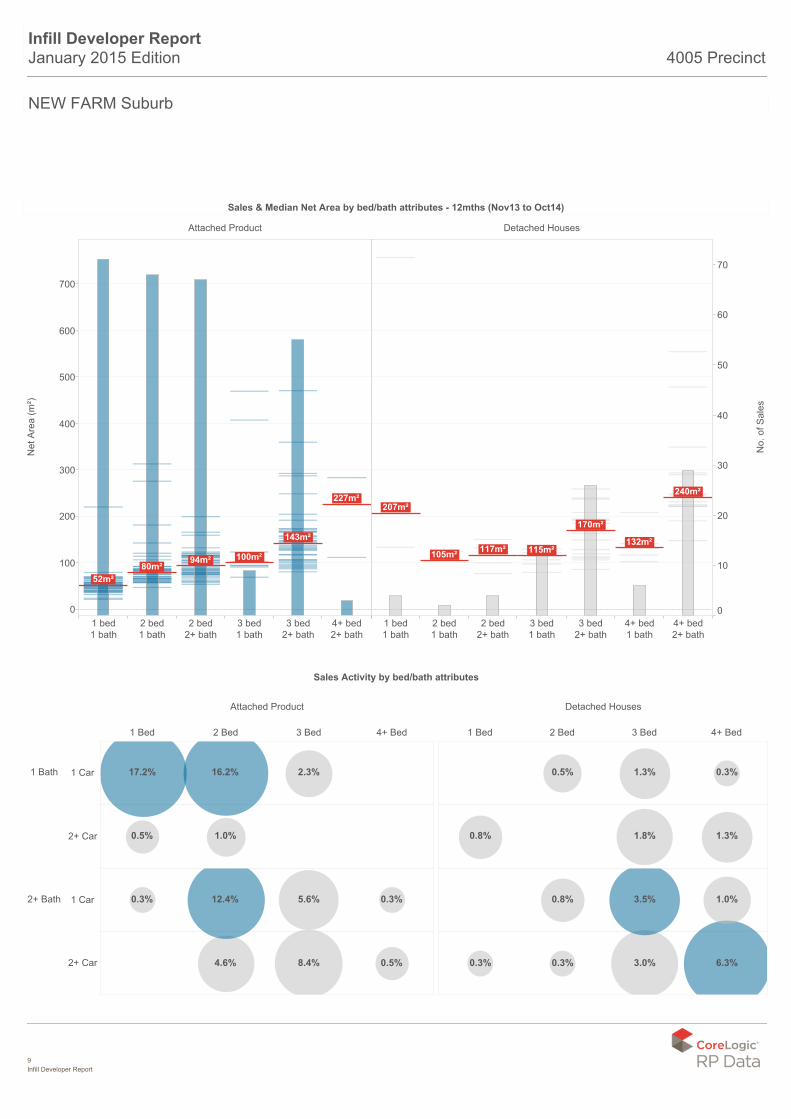
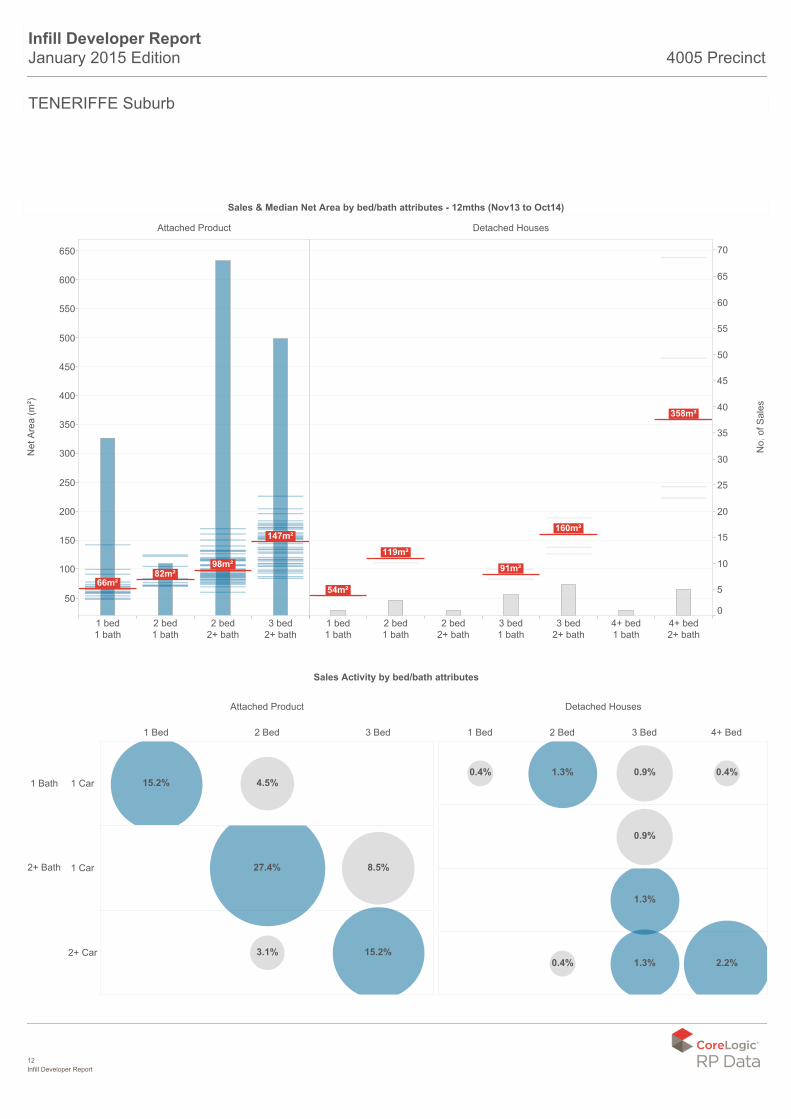
Net Area by Type The following charts and tables provide insights/trends on settled sales volumes and net area (floor space) for attached product and detached housing. This information is important as it demonstrates market demand for particular product and attribute types. It also enables a comparison to be made regarding the markets expectation for sizes being offered by attached product and detached houses.
6 Infill Developer Report
4005 Precinct
Infill Developer Report January 2015 Edition
Attached Product Detached Houses
1 bed1 bath
2 bed1 bath
2 bed2+ bath
3 bed1 bath
3 bed2+ bath
4+ bed2+ bath
1 bed1 bath
2 bed1 bath
2 bed2+ bath
3 bed1 bath
3 bed2+ bath
4+ bed1 bath
4+ bed2+ bath
0
100
200
300
400
500
600
700
Net Area (m²)
0
10
20
30
40
50
60
70
80
90
100
110
120
130
140
No. of Sales
57m²81m²
99m² 100m²
147m²
227m²
171m²
112m² 117m²104m²
164m²
132m²
249m²
Sales & Median Net Area by bed/bath attributes - 12mths (Nov13 to Oct14)
Attached Product
1 Bed 2 Bed 3 Bed 4+ Bed
1 Bath 1 Car
2+ Car
2+ Bath 1 Car
2+ Car
1.5%
0.6%
12.0%
0.3%
16.5%
0.3%
0.2%
10.8%
6.6%
4.0%
17.8%0.2%
Sales Activity by bed/bath attributes
Detached Houses
1 Bed 2 Bed 3 Bed 4+ Bed
0.8%
0.3%
1.5%
1.1%0.8%
0.5%
0.2%
4.9%
0.6%
2.4%
2.8%
0.3%
0.5%
0.2%
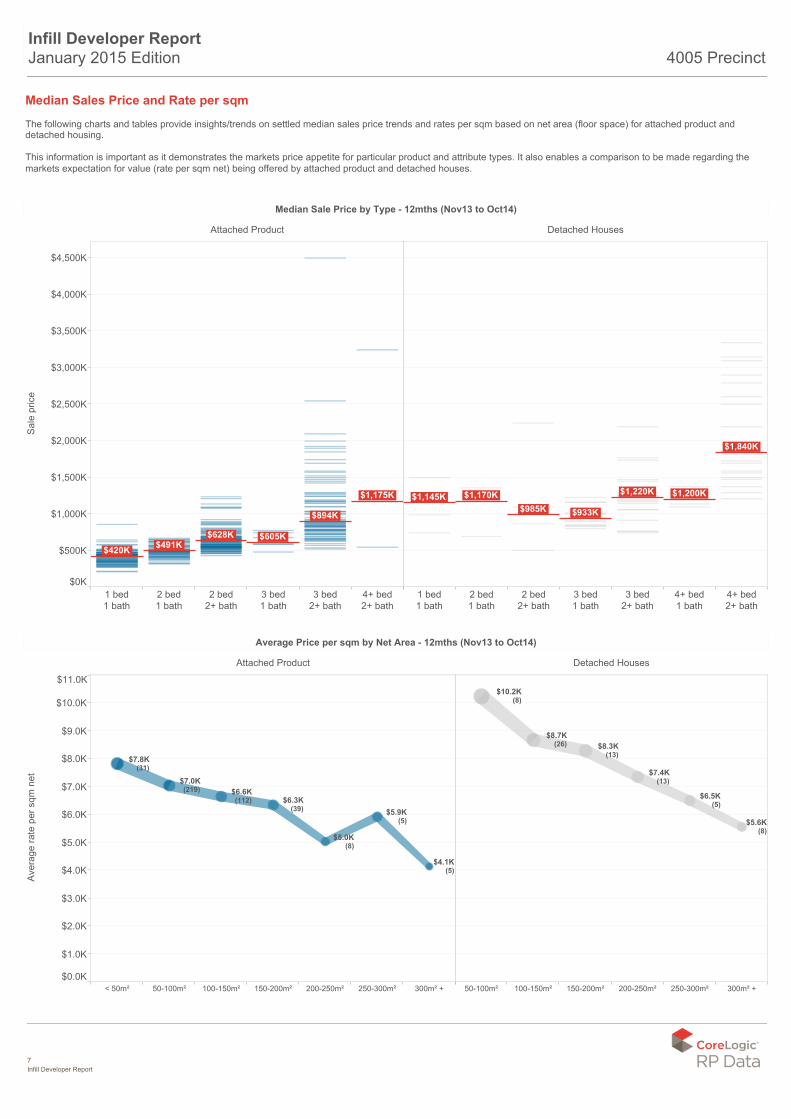
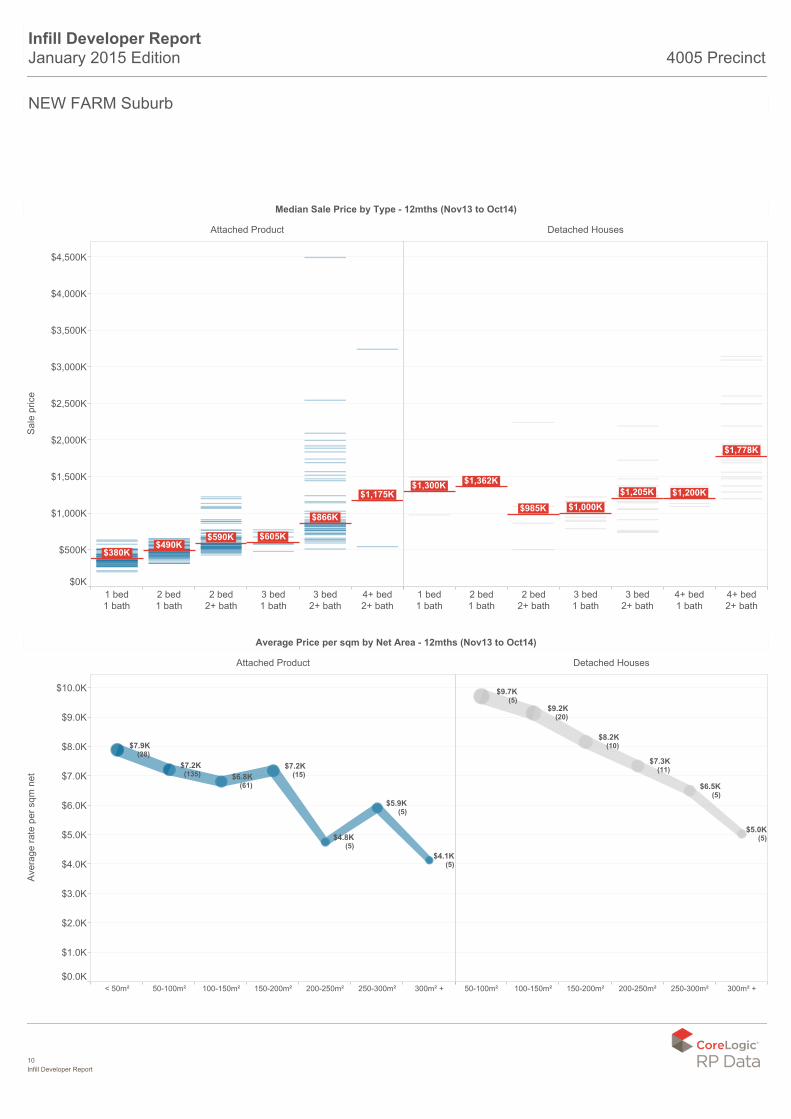
Median Sales Price and Rate per sqm The following charts and tables provide insights/trends on settled median sales price trends and rates per sqm based on net area (floor space) for attached product and detached housing. This information is important as it demonstrates the markets price appetite for particular product and attribute types. It also enables a comparison to be made regarding themarkets expectation for value (rate per sqm net) being offered by attached product and detached houses.
7 Infill Developer Report
4005 Precinct
Infill Developer Report January 2015 Edition
Attached Product Detached Houses
1 bed1 bath
2 bed1 bath
2 bed2+ bath
3 bed1 bath
3 bed2+ bath
4+ bed2+ bath
1 bed1 bath
2 bed1 bath
2 bed2+ bath
3 bed1 bath
3 bed2+ bath
4+ bed1 bath
4+ bed2+ bath
$0K
$500K
$1,000K
$1,500K
$2,000K
$2,500K
$3,000K
$3,500K
$4,000K
$4,500K
Sale price
$420K $491K$628K $605K
$894K
$1,175K $1,145K $1,170K$985K $933K
$1,220K $1,200K
$1,840K
Median Sale Price by Type - 12mths (Nov13 to Oct14)
Attached Product Detached Houses
< 50m² 50-100m² 100-150m² 150-200m² 200-250m² 250-300m² 300m² + 50-100m² 100-150m² 150-200m² 200-250m² 250-300m² 300m² +$0.0K
$1.0K
$2.0K
$3.0K
$4.0K
$5.0K
$6.0K
$7.0K
$8.0K
$9.0K
$10.0K
$11.0K
Average rate per sqm net
$6.3K(39) $5.9K
(5)
$4.1K(5)
$6.6K(112)
$7.8K(31)
$7.0K(219)
$5.0K(8)
$7.4K(13)
$8.3K(13)
$10.2K(8)
$8.7K(26)
$5.6K(8)
$6.5K(5)
Average Price per sqm by Net Area - 12mths (Nov13 to Oct14)
8 Infill Developer Report
4005 Precinct
12mths (Nov12 to Oct13) 12mths (Nov13 to Oct14)
# Sales Median $ Price # Sales Median $ Price
AttachedProduct
DetachedHouses
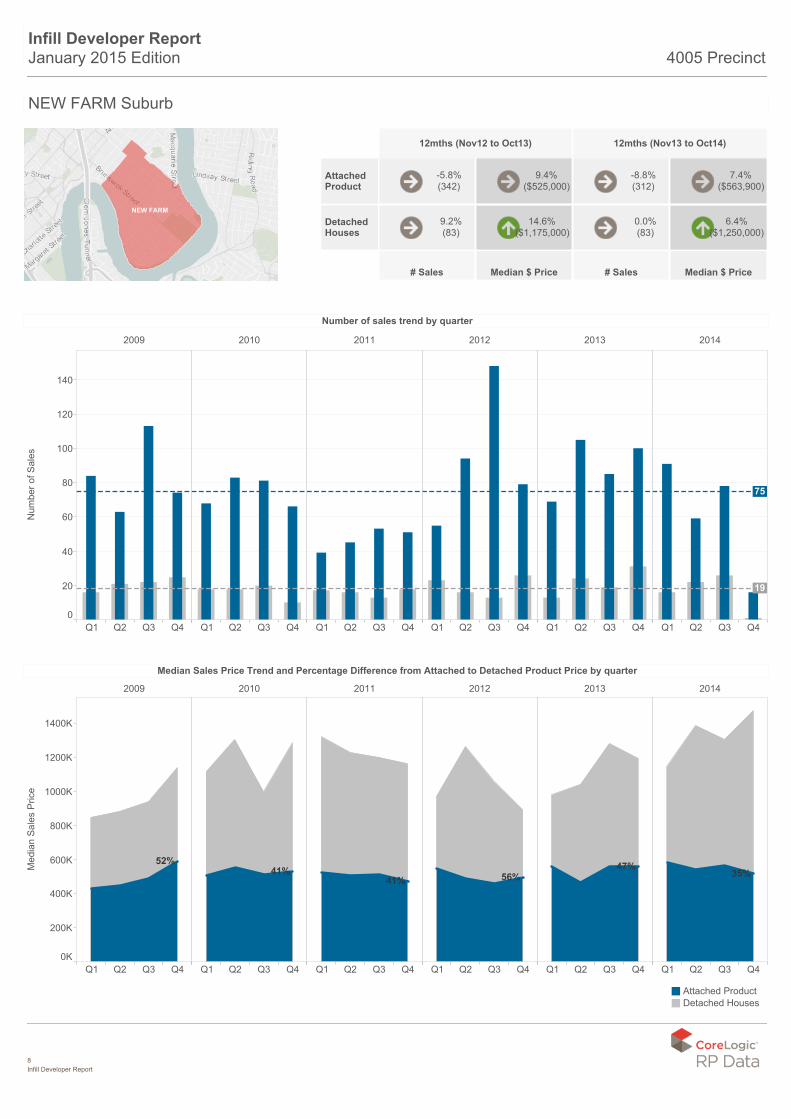
9.2%(83)
-5.8%(342)
14.6%($1,175,000)
9.4%($525,000)
0.0%(83)
-8.8%(312)
6.4%($1,250,000)
7.4%($563,900)
2009 2010 2011 2012 2013 2014
Q1 Q2 Q3 Q4 Q1 Q2 Q3 Q4 Q1 Q2 Q3 Q4 Q1 Q2 Q3 Q4 Q1 Q2 Q3 Q4 Q1 Q2 Q3 Q40
20
40
60
80
100
120
140
Number of Sales
19
75
Number of sales trend by quarter
2009 2010 2011 2012 2013 2014
Q1 Q2 Q3 Q4 Q1 Q2 Q3 Q4 Q1 Q2 Q3 Q4 Q1 Q2 Q3 Q4 Q1 Q2 Q3 Q4 Q1 Q2 Q3 Q40K
200K
400K
600K
800K
1000K
1200K
1400K
Median Sales Price
52%41%
41% 56%47%
35%
Median Sales Price Trend and Percentage Difference from Attached to Detached Product Price by quarter
Attached ProductDetached Houses
Infill Developer Report January 2015 Edition
NEW FARM
Abc
NEW FARM Suburb
9 Infill Developer Report
4005 Precinct
Infill Developer Report January 2015 Edition
Attached Product Detached Houses
1 bed1 bath
2 bed1 bath
2 bed2+ bath
3 bed1 bath
3 bed2+ bath
4+ bed2+ bath
1 bed1 bath
2 bed1 bath
2 bed2+ bath
3 bed1 bath
3 bed2+ bath
4+ bed1 bath
4+ bed2+ bath
0
100
200
300
400
500
600
700
Net Area (m²)
0
10
20
30
40
50
60
70
No. of Sales
52m²80m²
94m² 100m²
143m²
227m²207m²
105m² 117m² 115m²
170m²
132m²
240m²
Sales & Median Net Area by bed/bath attributes - 12mths (Nov13 to Oct14)
Attached Product
1 Bed 2 Bed 3 Bed 4+ Bed
1 Bath 1 Car
2+ Car
2+ Bath 1 Car
2+ Car
2.3%
1.0%
16.2%
0.5%
17.2%
0.5%
0.3%
8.4%
5.6%
4.6%
12.4%0.3%
Sales Activity by bed/bath attributes
Detached Houses
1 Bed 2 Bed 3 Bed 4+ Bed
1.3%
0.3%
1.8%
1.3%0.5%
0.8%
6.3%
1.0%
3.0%
3.5%
0.3%
0.8%
0.3%
Abc
NEW FARM Suburb
10 Infill Developer Report
4005 Precinct
Infill Developer Report January 2015 Edition
Attached Product Detached Houses
1 bed1 bath
2 bed1 bath
2 bed2+ bath
3 bed1 bath
3 bed2+ bath
4+ bed2+ bath
1 bed1 bath
2 bed1 bath
2 bed2+ bath
3 bed1 bath
3 bed2+ bath
4+ bed1 bath
4+ bed2+ bath
$0K
$500K
$1,000K
$1,500K
$2,000K
$2,500K
$3,000K
$3,500K
$4,000K
$4,500K
Sale price
$380K$490K
$590K $605K
$866K
$1,175K$1,300K $1,362K
$985K $1,000K
$1,205K $1,200K
$1,778K
Median Sale Price by Type - 12mths (Nov13 to Oct14)
Attached Product Detached Houses
< 50m² 50-100m² 100-150m² 150-200m² 200-250m² 250-300m² 300m² + 50-100m² 100-150m² 150-200m² 200-250m² 250-300m² 300m² +$0.0K
$1.0K
$2.0K
$3.0K
$4.0K
$5.0K
$6.0K
$7.0K
$8.0K
$9.0K
$10.0K
Average rate per sqm net
$5.9K(5)
$6.8K(61)
$4.1K(5)
$7.2K(15)
$7.2K(135)
$7.9K(28)
$4.8K(5)
$7.3K(11)
$8.2K(10)
$5.0K(5)
$6.5K(5)
$9.7K(5)
$9.2K(20)
Average Price per sqm by Net Area - 12mths (Nov13 to Oct14)
Abc
NEW FARM Suburb
11 Infill Developer Report
4005 Precinct
12mths (Nov12 to Oct13) 12mths (Nov13 to Oct14)
# Sales Median $ Price # Sales Median $ Price
AttachedProduct
DetachedHouses
-32.7%(33)
12.6%($535,000)
(21)
512.1%(202)
($1,201,000)
15.9%($620,000)
2012 2013 2014
Q2 Q3 Q4 Q1 Q2 Q3 Q4 Q1 Q2 Q3 Q40
10
20
30
40
50
60
Number of Sales
4
26
Number of sales trend by quarter
2012 2013 2014
Q2 Q3 Q4 Q1 Q2 Q3 Q4 Q1 Q2 Q3 Q40K
200K
400K
600K
800K
1000K
1200K
1400K
1600K
Median Sales Price
64%
32%
Median Sales Price Trend and Percentage Difference from Attached to Detached Product Price by quarter
Attached ProductDetached Houses
Infill Developer Report January 2015 Edition
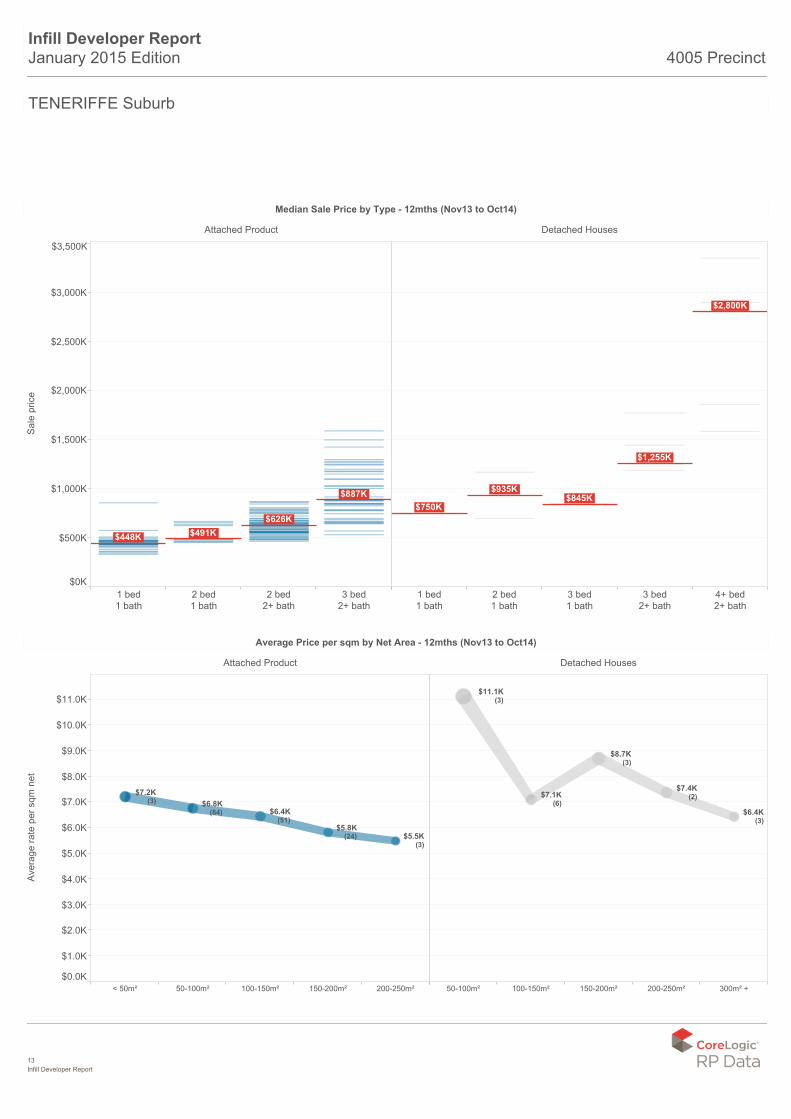
TENERIFFE
Abc
TENERIFFE Suburb
12 Infill Developer Report
4005 Precinct
Infill Developer Report January 2015 Edition
Attached Product Detached Houses
1 bed1 bath
2 bed1 bath
2 bed2+ bath
3 bed2+ bath
1 bed1 bath
2 bed1 bath
2 bed2+ bath
3 bed1 bath
3 bed2+ bath
4+ bed1 bath
4+ bed2+ bath
50
100
150
200
250
300
350
400
450
500
550
600
650
Net Area (m²)
0
5
10
15
20
25
30
35
40
45
50
55
60
65
70
No. of Sales
66m²82m²
98m²
147m²
54m²
119m²
91m²
160m²
358m²
Sales & Median Net Area by bed/bath attributes - 12mths (Nov13 to Oct14)
Attached Product
1 Bed 2 Bed 3 Bed
1 Bath 1 Car
2+ Bath 1 Car
2+ Car
4.5%15.2%
15.2%
8.5%
3.1%
27.4%
Sales Activity by bed/bath attributes
Detached Houses
1 Bed 2 Bed 3 Bed 4+ Bed
0.4%
0.9%
0.9%1.3%0.4%
2.2%1.3%
1.3%
0.4%
Abc
TENERIFFE Suburb
13 Infill Developer Report
4005 Precinct
Infill Developer Report January 2015 Edition
Attached Product Detached Houses
1 bed1 bath
2 bed1 bath
2 bed2+ bath
3 bed2+ bath
1 bed1 bath
2 bed1 bath
3 bed1 bath
3 bed2+ bath
4+ bed2+ bath
$0K
$500K
$1,000K
$1,500K
$2,000K
$2,500K
$3,000K
$3,500K
Sale price
$448K $491K$626K
$887K$750K
$935K$845K
$1,255K
$2,800K
Median Sale Price by Type - 12mths (Nov13 to Oct14)
Attached Product Detached Houses
< 50m² 50-100m² 100-150m² 150-200m² 200-250m² 50-100m² 100-150m² 150-200m² 200-250m² 300m² +$0.0K
$1.0K
$2.0K
$3.0K
$4.0K
$5.0K
$6.0K
$7.0K
$8.0K
$9.0K
$10.0K
$11.0K
Average rate per sqm net
$6.4K(51)
$6.8K(84)
$5.8K(24)
$7.2K(3)
$5.5K(3)
$8.7K(3)
$11.1K(3)
$7.4K(2)$7.1K
(6)$6.4K(3)
Average Price per sqm by Net Area - 12mths (Nov13 to Oct14)
Abc
TENERIFFE Suburb
Infill Developer Report
4005 Precinct
Infill Developer Report January 2015 Edition
Contact For more information on the information in this report or to order this report for another precinct, please contact Corelogic sales: 1300 734 318 http://www.corelogic.com.au/developers/ To discuss the practical implications of this report on your project, please contact Urban Supply Intelligence: 0466 779 502 http://www.urbansupplyintell.com.au Corelogic and Urban Supply Intelligence (USI) have partnered to deliver the Infill Developer Report. The report combines Corelogic’s strength of being Australia’s largestprovider of property information with USI’s intimate knowledge of the development sector. This partnership provides access to a powerful knowledge platform that takescredible property data and delivers this in a highly visual, whilst structured format, to directly inform development decisions. Disclaimers, Analysis Assumptions & Methods Product TypesFor the purpose of this report, detached houses are defined as house dwellings and attached product is defined as all unit and townhouse dwellings as determined from theland use attribute from government valuer general data sources. Net area (floor size)For the purpose of this report, net area is defined as the internal area of a dwelling as usually used in a valuation. Not expected to include garages or balconies. Sales and Listings CountsSales volumes are calculated on all house, unit and townhouse sales, excluding non-standard sales. Listings volumes are calculated on all new house, unit and townhouse listings created during the given period. Current and Prior periods are based on a rolling 12 month window as indicated in the footer of each page. Time PeriodsCurrent period sales include all sales received by Corelogic at the time this report was generated. This may not be a full representation of the entire market for this period. Vendor Discounting and Time on Market StatisticsVendor Discounting is the average percentage difference between the last listed price and the sale price.Time on Market is the number of days between the first time the property was listed and when it went under contract.Aggregated statistics are calculated for the precinct, using a rolling 3 month window to the reported date. Statistic is reported when there are more than 10 observations in thegiven period. Sales and listings below $10,000 or above $100,000,000 are excluded. Excludes records with sale price above list price and sale price less than 50% of list pricein discount calculation. Excludes records with time on market greater than 360 or less than 0 (reported sold before last listing date). Time on market for SA & NT is reduced by28 days to estimate contract date from provided settlement date. CoreLogic Disclaimers In compiling this publication, RP Data Pty Ltd trading as CoreLogic has relied upon information supplied by a number of external sources. CoreLogic does not warrant itsaccuracy or completeness and to the full extent allowed by law excludes liability in contract, tort or otherwise, for any loss or damage sustained by subscribers, or by any other person or body corporate arising from or in connection with the supply or use of the whole or any part of the information in this publication through any cause whatsoeverand limits any liability it may have to the amount paid to CoreLogic for the supply of such information. Queensland DataBased on or contains data provided by the State of Queensland (Department of Natural Resources and Mines) 2015. In consideration of the State permitting use of this datayou acknowledge and agree that the State gives no warranty in relation to the data (including accuracy, reliability, completeness, currency or suitability) and accepts no liability(including without limitation, liability in negligence) for any loss, damage or costs (including consequential damage) relating to any use of the data. Data must not be used for direct marketing or be used in breach of the privacy laws. South Australian DataThis information is based on data supplied by the South Australian Government and is published by permission. The South Australian Government does not accept any responsibility for the accuracy or completeness of the published information or suitability for any purpose of the published information or the underlying data. New South Wales DataContains property sales information provided under licence from the Land and Property Information (“LPI”). CoreLogic is authorised as a Property Sales Information providerby the LPI. Victorian DataThe State of Victoria owns the copyright in the Property Sales Data which constitutes the basis of this report and reproduction of that data in any way without the consent ofthe State of Victoria will constitute a breach of the Copyright Act 1968 (Cth). The State of Victoria does not warrant the accuracy or completeness of the information containedin this report and any person using or relying upon such information does so on the basis that the State of Victoria accepts no responsibility or liability whatsoever for any errors, faults, defects or omissions in the information supplied. Western Australian DataBased on information provided by and with the permission of the Western Australian Land Information Authority (2015) trading as Landgate. Australian Capital Territory DataThe Territory Data is the property of the Australian Capital Territory. No part of it may in any form or by any means (electronic, mechanical, microcopying, photocopying,recording or otherwise) be reproduced, stored in a retrieval system or transmitted without prior written permission. Enquiries should be directed to: Director, Customer Services ACT Planning and Land Authority GPO Box 1908 Canberra ACT 2601. Tasmanian DataThis product incorporates data that is copyright owned by the Crown in Right of Tasmania. The data has been used in the product with the permission of the Crown in Right ofTasmania. The Crown in Right of Tasmania and its employees and agents: a) give no warranty regarding the data's accuracy, completeness, currency or suitability for any particular purpose; and b) do not accept liability howsoever arising, including but not limited to negligence for any loss resulting from the use of or reliance upon the data.Base data from the LIST © State of Tasmania http://www.thelist.tas.gov.au