Embed Size (px)
Citation preview
2015 Embedded Value Results OverviewFocus on SwitzerlandAugust 2016
Embedded Value 2015—Swiss Overview 2
Foreword from the authors 3
1 Global Life Insurance 4
2 Switzerland Life Insurance 10
3 Group Embedded Value 13
4 Methodology and Disclosures 14
5 Appendix: Financial Markets 21
Contents
Embedded Value 2015—Swiss Overview 3
Welcome back to the Swiss edition of our Embedded Value Results Overview
Foreword from the authors
Similarly to last year, we have selected the seven insurance groups with the largest direct life insurance operations in Switzerland who publish Embedded Value (EV) disclosures (Allianz, AXA, Baloise, Generali, Helvetia, Swiss Life and Zurich) and analysed their 2015 results and methodologies.
As a result of the Solvency II Directive that came into force on 1 January 2016 in the European Economic Area (EEA), we noticed a considerable change in the methodologies and information published between the 2014 and 2015 EV disclosures. Four out of seven insurers amended their valuation methodologies with regard to reference rates and required capital to follow the new Solvency II requirements. The pioneer of our sample, Allianz, even applied a Solvency II Market Value Balance Sheet (“MVBS”) approach. On the other hand, Swiss Life and Zurich still follow the methodology of the CFO Forum from October 2009 (equivalent to the QIS5 requirements) while Helvetia uses the traditional EV approach. By the time of these disclosures, the European Insurance CFO Forum had published additional guidance for those companies that aim to align their MCEV with Solvency II methods.
The picture for 2015 is blurred for most companies with a change in their EV varying from -6% to +8% between 2014 and 2015. This is due to lower than expected interest rates in Switzerland and the USA, leading to negative economic variances as well as the impact from changes in the methodology from the application of the Solvency II requirements. All insurers reported a positive but decreasing New Business value in comparison to last year, with slightly decreasing margins on average.
Almost concurrent with the implementation of Solvency II came the announcement from the IASB that drafting of the IFRS 4 Phase II Standard had been approved, paving the way for an expected go-live date of 2020 or 2021. As well as representing a significant programme of work for insurers, it will mark a material shift in how profit is measured and reported and we expect companies to adapt their disclosures over the coming years to reflect this.
The following report presents the results of our analysis, which is based solely on publicly available information. Although we aim to provide as many relevant comparisons as possible, we wish to emphasize that EV disclosures have significantly changed for year-end 2015, in particular in the cases of AXA and Allianz. Not all information required for a complete like-for-like comparison was publicly available from all companies. We have also assumed that the reader is already familiar with EV. All results are presented in Swiss Francs (CHF), even when it is not the original reference currency of the EV publication.
We hope you will find the following report interesting, and we look forward to discuss it with you. Please feel free to contact us.
Stefan RechtsteinerSenior ManagerDeloitte Consulting AG
Delphine SavatierConsultantDeloitte Consulting AG
Embedded Value 2015—Swiss Overview 4
1 Global Life Insurance
In this section, we analyse the total EV results across all regions (here referred to as Global Life) for the seven insurers in our sample. Later sections will focus on Swiss EV results and on Group MCEV results (which include non-covered business such as non-life as well).
Global Life Embedded Value
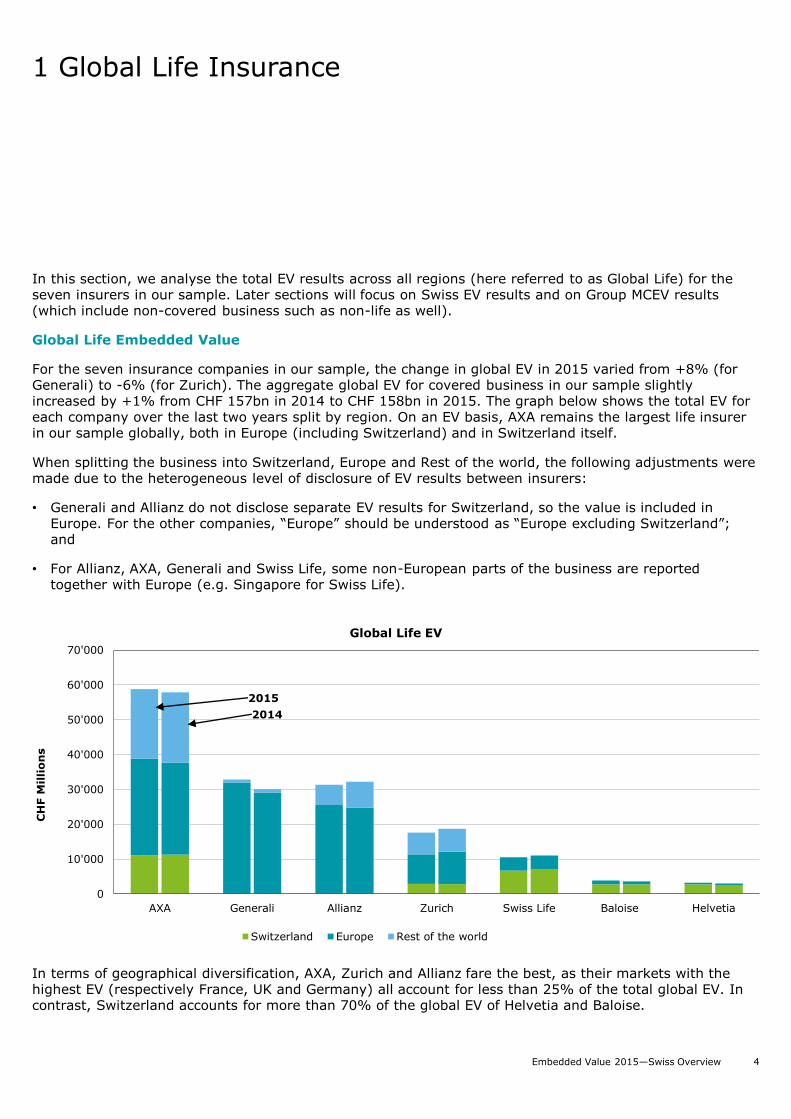
For the seven insurance companies in our sample, the change in global EV in 2015 varied from +8% (for Generali) to -6% (for Zurich). The aggregate global EV for covered business in our sample slightly increased by +1% from CHF 157bn in 2014 to CHF 158bn in 2015. The graph below shows the total EV for each company over the last two years split by region. On an EV basis, AXA remains the largest life insurer in our sample globally, both in Europe (including Switzerland) and in Switzerland itself.
When splitting the business into Switzerland, Europe and Rest of the world, the following adjustments were made due to the heterogeneous level of disclosure of EV results between insurers:
• Generali and Allianz do not disclose separate EV results for Switzerland, so the value is included in Europe. For the other companies, “Europe” should be understood as “Europe excluding Switzerland”; and
• For Allianz, AXA, Generali and Swiss Life, some non-European parts of the business are reported together with Europe (e.g. Singapore for Swiss Life).
In terms of geographical diversification, AXA, Zurich and Allianz fare the best, as their markets with the highest EV (respectively France, UK and Germany) all account for less than 25% of the total global EV. In contrast, Switzerland accounts for more than 70% of the global EV of Helvetia and Baloise.
AXA Generali Allianz Zurich Swiss Life Baloise Helvetia
0
10'000
20'000
30'000
40'000
50'000
60'000
70'000
CH
F M
illi
on
s
Global Life EV
Switzerland Europe Rest of the world
2015
2014
Embedded Value 2015—Swiss Overview 5
1 Global Life Insurance (cont.)
Embedded Value split by component
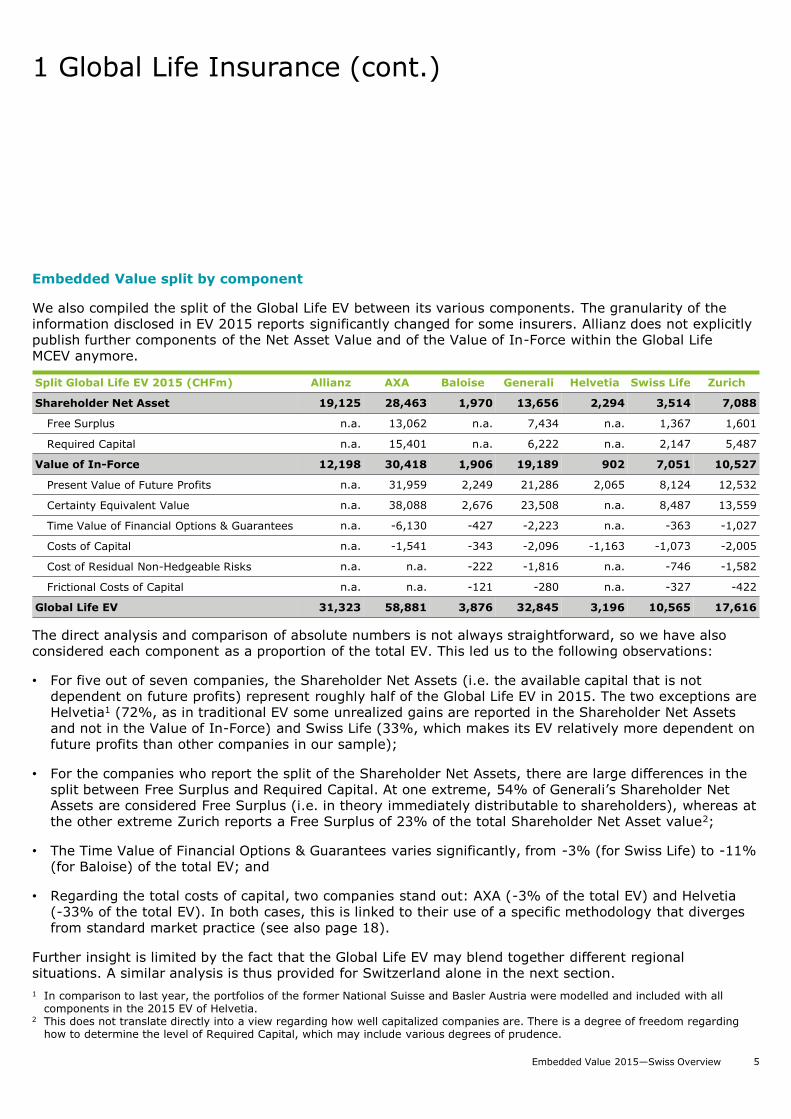
We also compiled the split of the Global Life EV between its various components. The granularity of the information disclosed in EV 2015 reports significantly changed for some insurers. Allianz does not explicitly publish further components of the Net Asset Value and of the Value of In-Force within the Global Life MCEV anymore.
The direct analysis and comparison of absolute numbers is not always straightforward, so we have also considered each component as a proportion of the total EV. This led us to the following observations:
• For five out of seven companies, the Shareholder Net Assets (i.e. the available capital that is not dependent on future profits) represent roughly half of the Global Life EV in 2015. The two exceptions are Helvetia1 (72%, as in traditional EV some unrealized gains are reported in the Shareholder Net Assets and not in the Value of In-Force) and Swiss Life (33%, which makes its EV relatively more dependent on future profits than other companies in our sample);
• For the companies who report the split of the Shareholder Net Assets, there are large differences in the split between Free Surplus and Required Capital. At one extreme, 54% of Generali’s Shareholder Net Assets are considered Free Surplus (i.e. in theory immediately distributable to shareholders), whereas at the other extreme Zurich reports a Free Surplus of 23% of the total Shareholder Net Asset value2;
• The Time Value of Financial Options & Guarantees varies significantly, from -3% (for Swiss Life) to -11% (for Baloise) of the total EV; and
• Regarding the total costs of capital, two companies stand out: AXA (-3% of the total EV) and Helvetia (-33% of the total EV). In both cases, this is linked to their use of a specific methodology that diverges from standard market practice (see also page 18).
Further insight is limited by the fact that the Global Life EV may blend together different regional situations. A similar analysis is thus provided for Switzerland alone in the next section.
1 In comparison to last year, the portfolios of the former National Suisse and Basler Austria were modelled and included with all components in the 2015 EV of Helvetia.
2 This does not translate directly into a view regarding how well capitalized companies are. There is a degree of freedom regarding how to determine the level of Required Capital, which may include various degrees of prudence.
Split Global Life EV 2015 (CHFm) Allianz AXA Baloise Generali Helvetia Swiss Life Zurich
Shareholder Net Asset 19,125 28,463 1,970 13,656 2,294 3,514 7,088
Free Surplus n.a. 13,062 n.a. 7,434 n.a. 1,367 1,601
Required Capital n.a. 15,401 n.a. 6,222 n.a. 2,147 5,487
Value of In-Force 12,198 30,418 1,906 19,189 902 7,051 10,527
Present Value of Future Profits n.a. 31,959 2,249 21,286 2,065 8,124 12,532
Certainty Equivalent Value n.a. 38,088 2,676 23,508 n.a. 8,487 13,559
Time Value of Financial Options & Guarantees n.a. -6,130 -427 -2,223 n.a. -363 -1,027
Costs of Capital n.a. -1,541 -343 -2,096 -1,163 -1,073 -2,005
Cost of Residual Non-Hedgeable Risks n.a. n.a. -222 -1,816 n.a. -746 -1,582
Frictional Costs of Capital n.a. n.a. -121 -280 n.a. -327 -422
Global Life EV 31,323 58,881 3,876 32,845 3,196 10,565 17,616
Embedded Value 2015—Swiss Overview 6
1 Global Life Insurance (cont.)
Analysis of Embedded Value Earnings
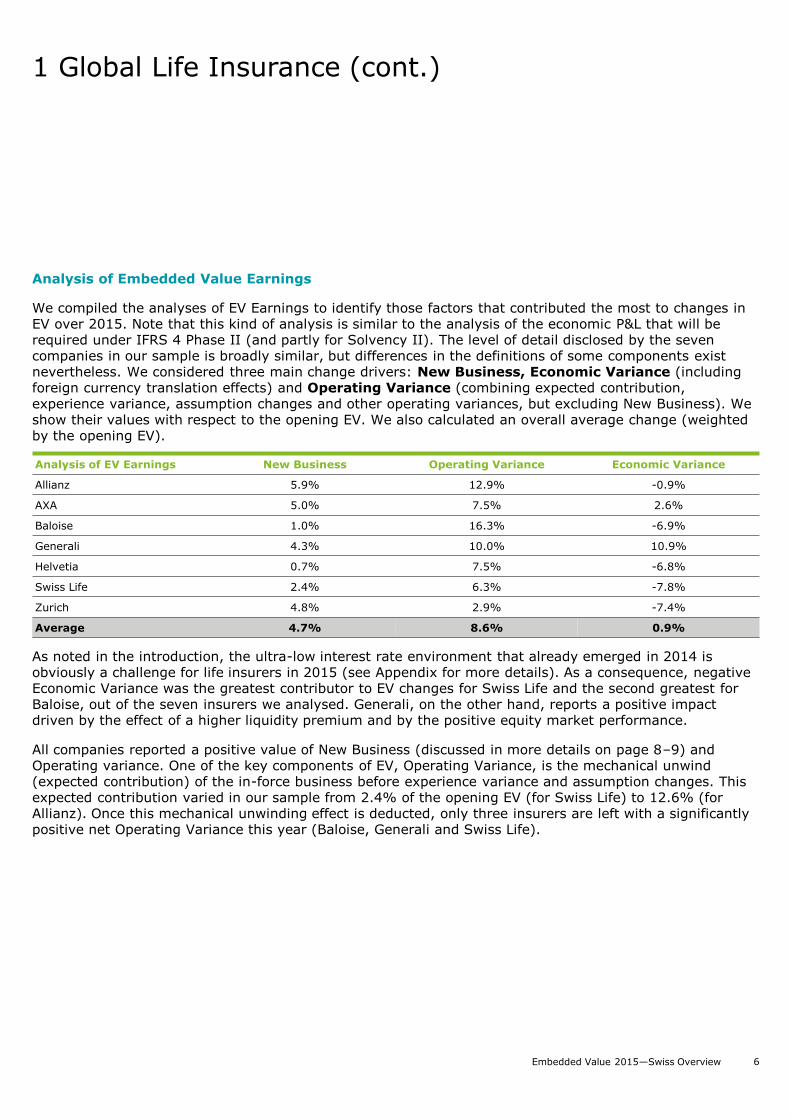
We compiled the analyses of EV Earnings to identify those factors that contributed the most to changes in EV over 2015. Note that this kind of analysis is similar to the analysis of the economic P&L that will be required under IFRS 4 Phase II (and partly for Solvency II). The level of detail disclosed by the seven companies in our sample is broadly similar, but differences in the definitions of some components exist nevertheless. We considered three main change drivers: New Business, Economic Variance (including foreign currency translation effects) and Operating Variance (combining expected contribution, experience variance, assumption changes and other operating variances, but excluding New Business). We show their values with respect to the opening EV. We also calculated an overall average change (weighted by the opening EV).
As noted in the introduction, the ultra-low interest rate environment that already emerged in 2014 is obviously a challenge for life insurers in 2015 (see Appendix for more details). As a consequence, negative Economic Variance was the greatest contributor to EV changes for Swiss Life and the second greatest for Baloise, out of the seven insurers we analysed. Generali, on the other hand, reports a positive impact driven by the effect of a higher liquidity premium and by the positive equity market performance.
All companies reported a positive value of New Business (discussed in more details on page 8–9) and Operating variance. One of the key components of EV, Operating Variance, is the mechanical unwind (expected contribution) of the in-force business before experience variance and assumption changes. This expected contribution varied in our sample from 2.4% of the opening EV (for Swiss Life) to 12.6% (for Allianz). Once this mechanical unwinding effect is deducted, only three insurers are left with a significantly positive net Operating Variance this year (Baloise, Generali and Swiss Life).
Analysis of EV Earnings New Business Operating Variance Economic Variance
Allianz 5.9% 12.9% -0.9%
AXA 5.0% 7.5% 2.6%
Baloise 1.0% 16.3% -6.9%
Generali 4.3% 10.0% 10.9%
Helvetia 0.7% 7.5% -6.8%
Swiss Life 2.4% 6.3% -7.8%
Zurich 4.8% 2.9% -7.4%
Average 4.7% 8.6% 0.9%
Embedded Value 2015—Swiss Overview 7
1 Global Life Insurance (cont.)
Sensitivities
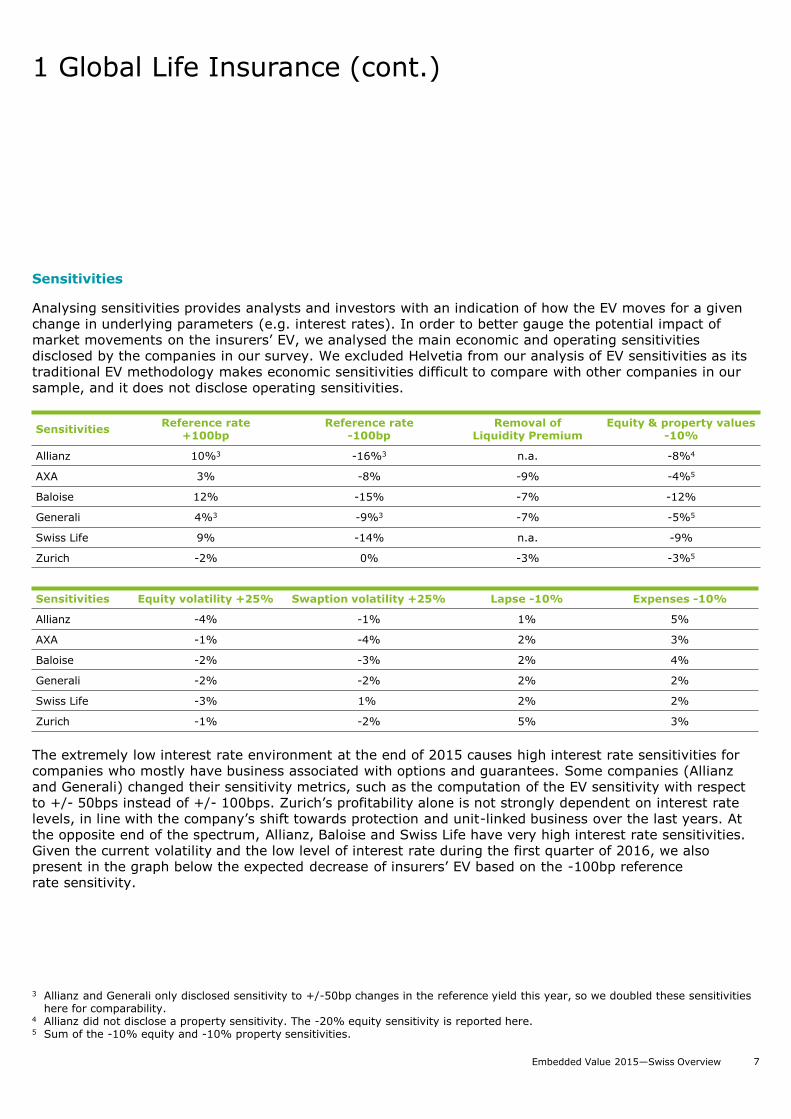
Analysing sensitivities provides analysts and investors with an indication of how the EV moves for a given change in underlying parameters (e.g. interest rates). In order to better gauge the potential impact of market movements on the insurers’ EV, we analysed the main economic and operating sensitivities disclosed by the companies in our survey. We excluded Helvetia from our analysis of EV sensitivities as its traditional EV methodology makes economic sensitivities difficult to compare with other companies in our sample, and it does not disclose operating sensitivities.
The extremely low interest rate environment at the end of 2015 causes high interest rate sensitivities for companies who mostly have business associated with options and guarantees. Some companies (Allianz and Generali) changed their sensitivity metrics, such as the computation of the EV sensitivity with respect to +/- 50bps instead of +/- 100bps. Zurich’s profitability alone is not strongly dependent on interest rate levels, in line with the company’s shift towards protection and unit-linked business over the last years. At the opposite end of the spectrum, Allianz, Baloise and Swiss Life have very high interest rate sensitivities. Given the current volatility and the low level of interest rate during the first quarter of 2016, we also present in the graph below the expected decrease of insurers’ EV based on the -100bp reference rate sensitivity.
SensitivitiesReference rate
+100bpReference rate
-100bpRemoval of
Liquidity PremiumEquity & property values
-10%
Allianz 10%3 -16%3 n.a. -8%4
AXA 3% -8% -9% -4%5
Baloise 12% -15% -7% -12%
Generali 4%3 -9%3 -7% -5%5
Swiss Life 9% -14% n.a. -9%
Zurich -2% 0% -3% -3%5
3 Allianz and Generali only disclosed sensitivity to +/-50bp changes in the reference yield this year, so we doubled these sensitivities here for comparability.
4 Allianz did not disclose a property sensitivity. The -20% equity sensitivity is reported here.5 Sum of the -10% equity and -10% property sensitivities.
Sensitivities Equity volatility +25% Swaption volatility +25% Lapse -10% Expenses -10%
Allianz -4% -1% 1% 5%
AXA -1% -4% 2% 3%
Baloise -2% -3% 2% 4%
Generali -2% -2% 2% 2%
Swiss Life -3% 1% 2% 2%
Zurich -1% -2% 5% 3%
Embedded Value 2015—Swiss Overview 8
1 Global Life Insurance (cont.)
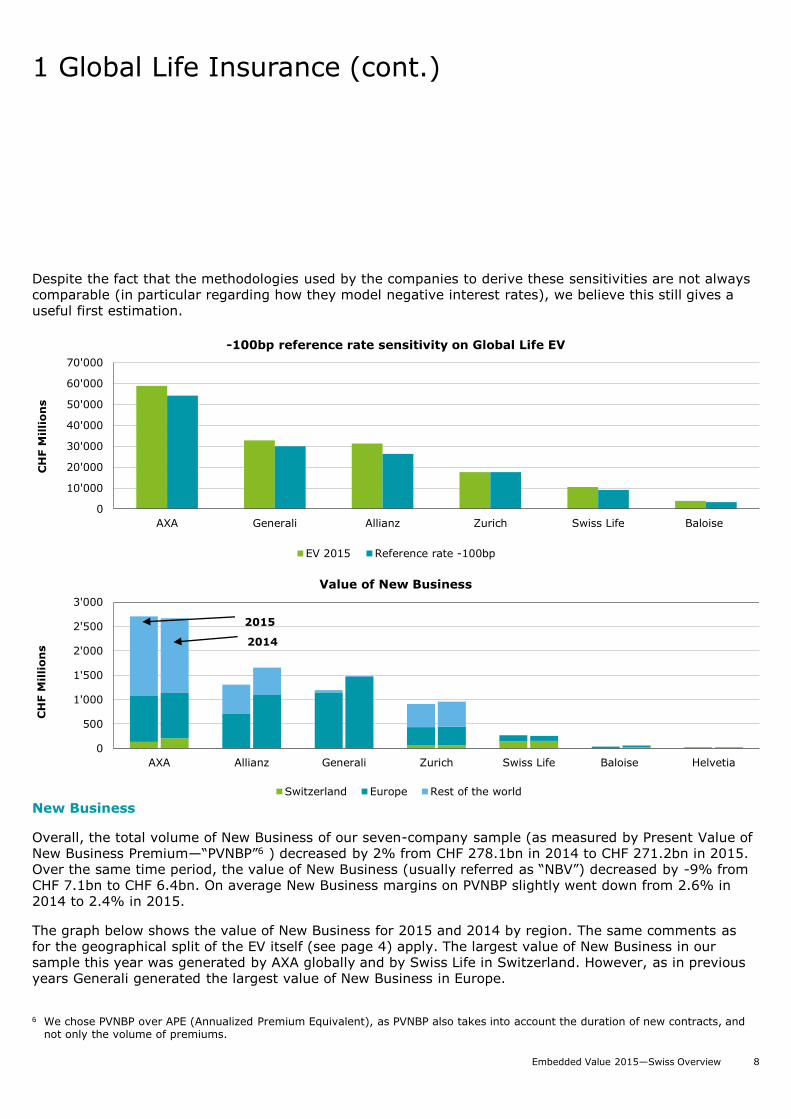
Despite the fact that the methodologies used by the companies to derive these sensitivities are not always comparable (in particular regarding how they model negative interest rates), we believe this still gives a useful first estimation.
New Business
Overall, the total volume of New Business of our seven-company sample (as measured by Present Value of New Business Premium—“PVNBP”6 ) decreased by 2% from CHF 278.1bn in 2014 to CHF 271.2bn in 2015. Over the same time period, the value of New Business (usually referred as “NBV”) decreased by -9% from CHF 7.1bn to CHF 6.4bn. On average New Business margins on PVNBP slightly went down from 2.6% in 2014 to 2.4% in 2015.
The graph below shows the value of New Business for 2015 and 2014 by region. The same comments as for the geographical split of the EV itself (see page 4) apply. The largest value of New Business in our sample this year was generated by AXA globally and by Swiss Life in Switzerland. However, as in previous years Generali generated the largest value of New Business in Europe.
6 We chose PVNBP over APE (Annualized Premium Equivalent), as PVNBP also takes into account the duration of new contracts, and not only the volume of premiums.
0
10'000
20'000
30'000
40'000
50'000
60'000
70'000
AXA Generali Allianz Zurich Swiss Life Baloise
CH
F M
illi
on
s
-100bp reference rate sensitivity on Global Life EV
EV 2015 Reference rate -100bp
AXA Allianz Generali Zurich Swiss Life Baloise Helvetia
0
500
1'000
1'500
2'000
2'500
3'000
CH
F M
illi
on
s
Value of New Business
Switzerland Europe Rest of the world
2015
2014
Embedded Value 2015—Swiss Overview 9
1 Global Life Insurance (cont.)
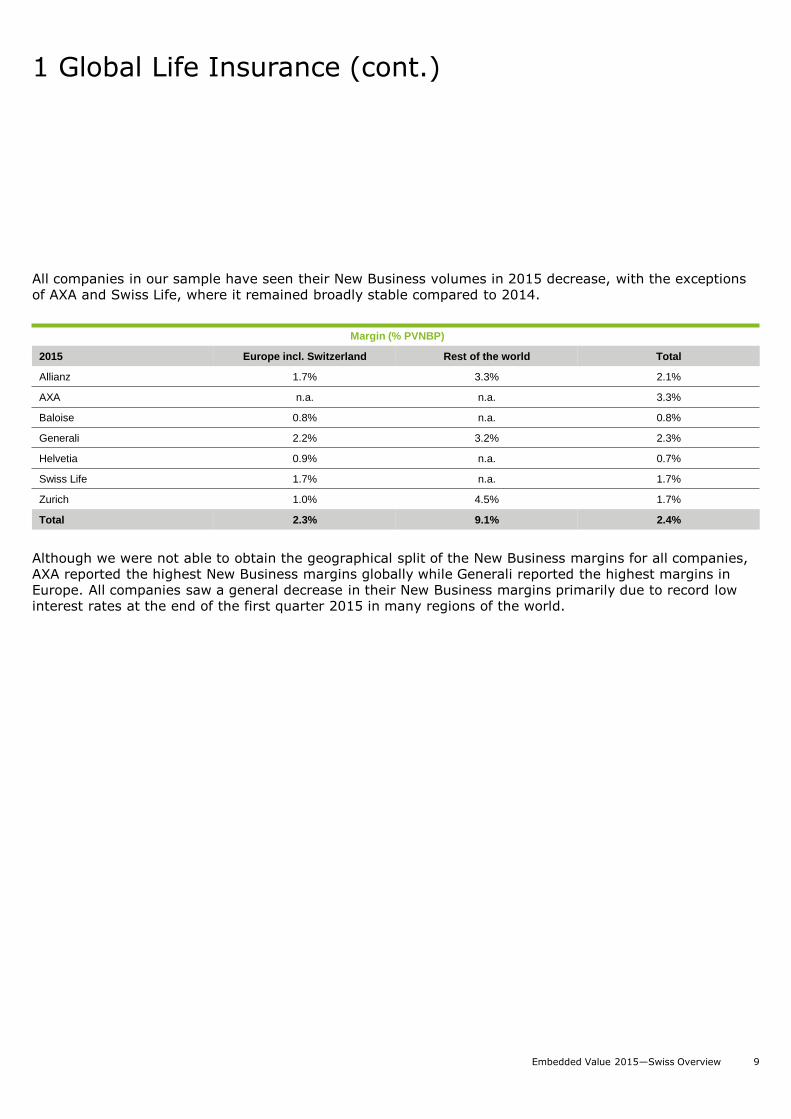
All companies in our sample have seen their New Business volumes in 2015 decrease, with the exceptions of AXA and Swiss Life, where it remained broadly stable compared to 2014.
Although we were not able to obtain the geographical split of the New Business margins for all companies, AXA reported the highest New Business margins globally while Generali reported the highest margins in Europe. All companies saw a general decrease in their New Business margins primarily due to record low interest rates at the end of the first quarter 2015 in many regions of the world.
Margin (% PVNBP)
2015 Europe incl. Switzerland Rest of the world Total
Allianz 1.7% 3.3% 2.1%
AXA n.a. n.a. 3.3%
Baloise 0.8% n.a. 0.8%
Generali 2.2% 3.2% 2.3%
Helvetia 0.9% n.a. 0.7%
Swiss Life 1.7% n.a. 1.7%
Zurich 1.0% 4.5% 1.7%
Total 2.3% 9.1% 2.4%
Embedded Value 2015—Swiss Overview 10
2 Switzerland Life Insurance
In this section, we analyze the EV results in Switzerland for the five insurers in our sample who publish separate Swiss EV results (both Allianz and Generali report Switzerland combined with other groups of countries within Europe, so they are not included here). Sensitivities are generally not disclosed on a regional level, so no Swiss sensitivities are discussed in this section.
Please note that individual business and group pension business are segregated in Switzerland, and are subject to very different regulation (group pensions in particular has a legal minimum profit sharing requirement, and guarantees that can be amended based on political decisions). However, no company discloses a split of its EV between individual and group, and no information on the detailed assumptions made for the future guarantees of group pensions business (which are key to determining the EV of this very long-term business) is publicly available.
Switzerland Embedded Value
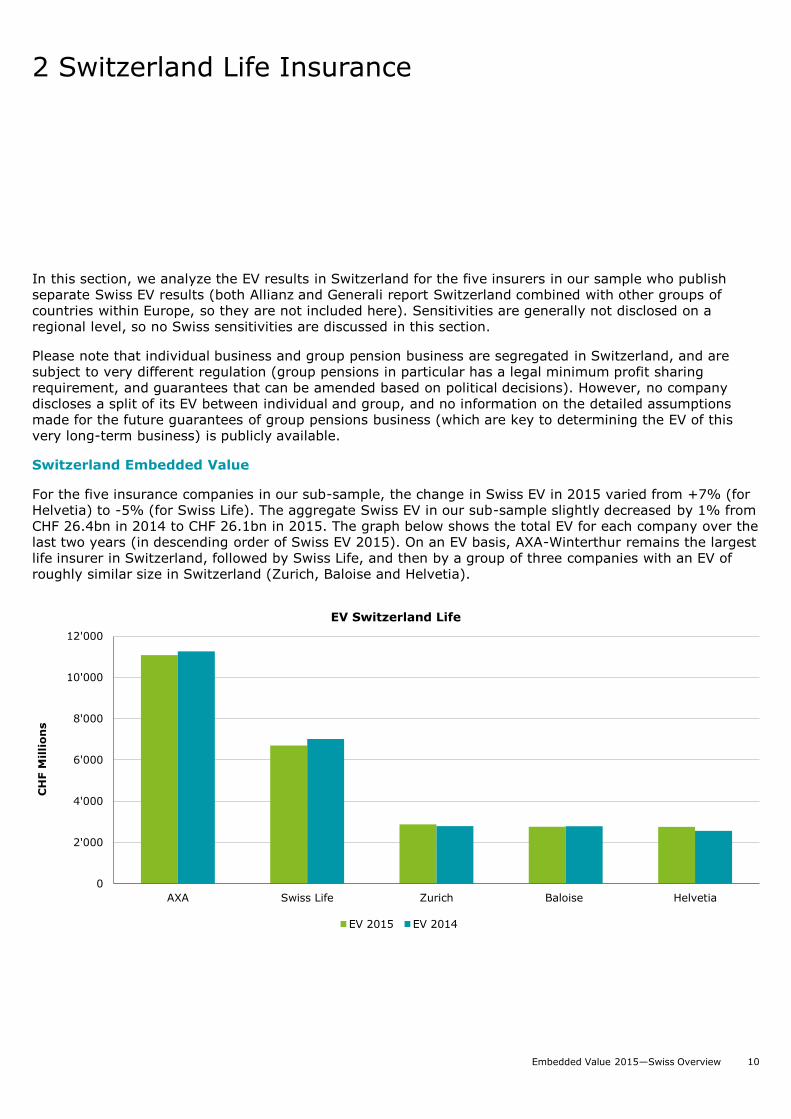
For the five insurance companies in our sub-sample, the change in Swiss EV in 2015 varied from +7% (for Helvetia) to -5% (for Swiss Life). The aggregate Swiss EV in our sub-sample slightly decreased by 1% from CHF 26.4bn in 2014 to CHF 26.1bn in 2015. The graph below shows the total EV for each company over the last two years (in descending order of Swiss EV 2015). On an EV basis, AXA-Winterthur remains the largest life insurer in Switzerland, followed by Swiss Life, and then by a group of three companies with an EV of roughly similar size in Switzerland (Zurich, Baloise and Helvetia).
0
2'000
4'000
6'000
8'000
10'000
12'000
AXA Swiss Life Zurich Baloise Helvetia
CH
F M
illi
on
s
EV Switzerland Life
EV 2015 EV 2014
Embedded Value 2015—Swiss Overview 11
2 Switzerland Life Insurance (cont.)
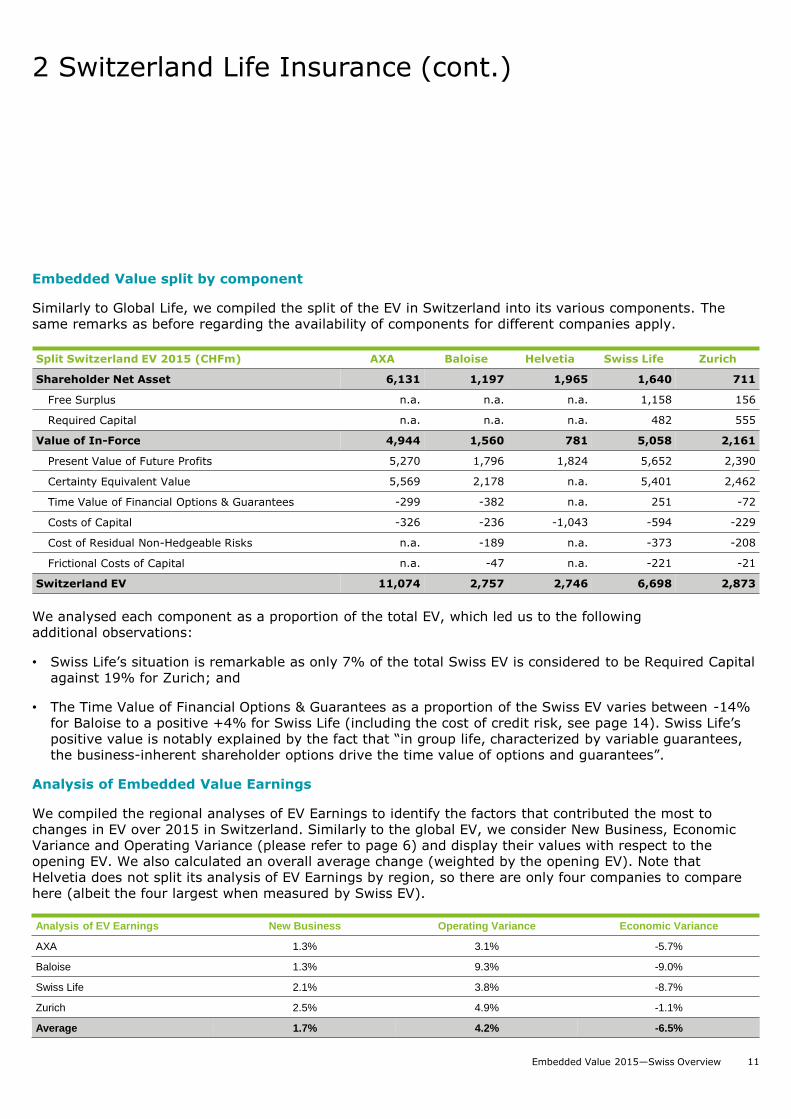
Embedded Value split by component
Similarly to Global Life, we compiled the split of the EV in Switzerland into its various components. The same remarks as before regarding the availability of components for different companies apply.
We analysed each component as a proportion of the total EV, which led us to the following additional observations:
• Swiss Life’s situation is remarkable as only 7% of the total Swiss EV is considered to be Required Capital against 19% for Zurich; and
• The Time Value of Financial Options & Guarantees as a proportion of the Swiss EV varies between -14% for Baloise to a positive +4% for Swiss Life (including the cost of credit risk, see page 14). Swiss Life’s positive value is notably explained by the fact that “in group life, characterized by variable guarantees, the business-inherent shareholder options drive the time value of options and guarantees”.
Analysis of Embedded Value Earnings
We compiled the regional analyses of EV Earnings to identify the factors that contributed the most to changes in EV over 2015 in Switzerland. Similarly to the global EV, we consider New Business, Economic Variance and Operating Variance (please refer to page 6) and display their values with respect to the opening EV. We also calculated an overall average change (weighted by the opening EV). Note that Helvetia does not split its analysis of EV Earnings by region, so there are only four companies to compare here (albeit the four largest when measured by Swiss EV).
Analysis of EV Earnings New Business Operating Variance Economic Variance
AXA 1.3% 3.1% -5.7%
Baloise 1.3% 9.3% -9.0%
Swiss Life 2.1% 3.8% -8.7%
Zurich 2.5% 4.9% -1.1%
Average 1.7% 4.2% -6.5%
Split Switzerland EV 2015 (CHFm) AXA Baloise Helvetia Swiss Life Zurich
Shareholder Net Asset 6,131 1,197 1,965 1,640 711
Free Surplus n.a. n.a. n.a. 1,158 156
Required Capital n.a. n.a. n.a. 482 555
Value of In-Force 4,944 1,560 781 5,058 2,161
Present Value of Future Profits 5,270 1,796 1,824 5,652 2,390
Certainty Equivalent Value 5,569 2,178 n.a. 5,401 2,462
Time Value of Financial Options & Guarantees -299 -382 n.a. 251 -72
Costs of Capital -326 -236 -1,043 -594 -229
Cost of Residual Non-Hedgeable Risks n.a. -189 n.a. -373 -208
Frictional Costs of Capital n.a. -47 n.a. -221 -21
Switzerland EV 11,074 2,757 2,746 6,698 2,873
Embedded Value 2015—Swiss Overview 12
2 Switzerland Life Insurance (cont.)
New Business
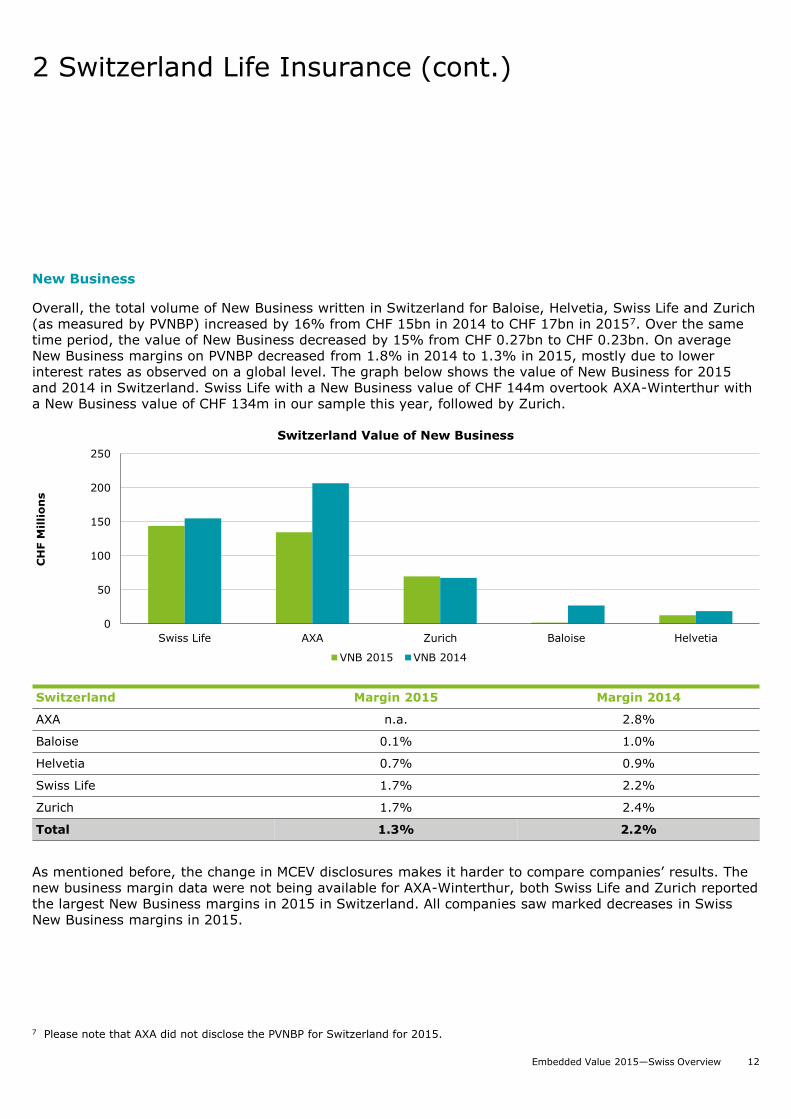
Overall, the total volume of New Business written in Switzerland for Baloise, Helvetia, Swiss Life and Zurich (as measured by PVNBP) increased by 16% from CHF 15bn in 2014 to CHF 17bn in 20157. Over the same time period, the value of New Business decreased by 15% from CHF 0.27bn to CHF 0.23bn. On average New Business margins on PVNBP decreased from 1.8% in 2014 to 1.3% in 2015, mostly due to lower interest rates as observed on a global level. The graph below shows the value of New Business for 2015 and 2014 in Switzerland. Swiss Life with a New Business value of CHF 144m overtook AXA-Winterthur with a New Business value of CHF 134m in our sample this year, followed by Zurich.
As mentioned before, the change in MCEV disclosures makes it harder to compare companies’ results. The new business margin data were not being available for AXA-Winterthur, both Swiss Life and Zurich reported the largest New Business margins in 2015 in Switzerland. All companies saw marked decreases in Swiss New Business margins in 2015.
Switzerland Margin 2015 Margin 2014
AXA n.a. 2.8%
Baloise 0.1% 1.0%
Helvetia 0.7% 0.9%
Swiss Life 1.7% 2.2%
Zurich 1.7% 2.4%
Total 1.3% 2.2%
7 Please note that AXA did not disclose the PVNBP for Switzerland for 2015.
0
50
100
150
200
250
Swiss Life AXA Zurich Baloise Helvetia
CH
F M
illi
on
s
Switzerland Value of New Business
VNB 2015 VNB 2014
Embedded Value 2015—Swiss Overview 13
3 Group Embedded Value
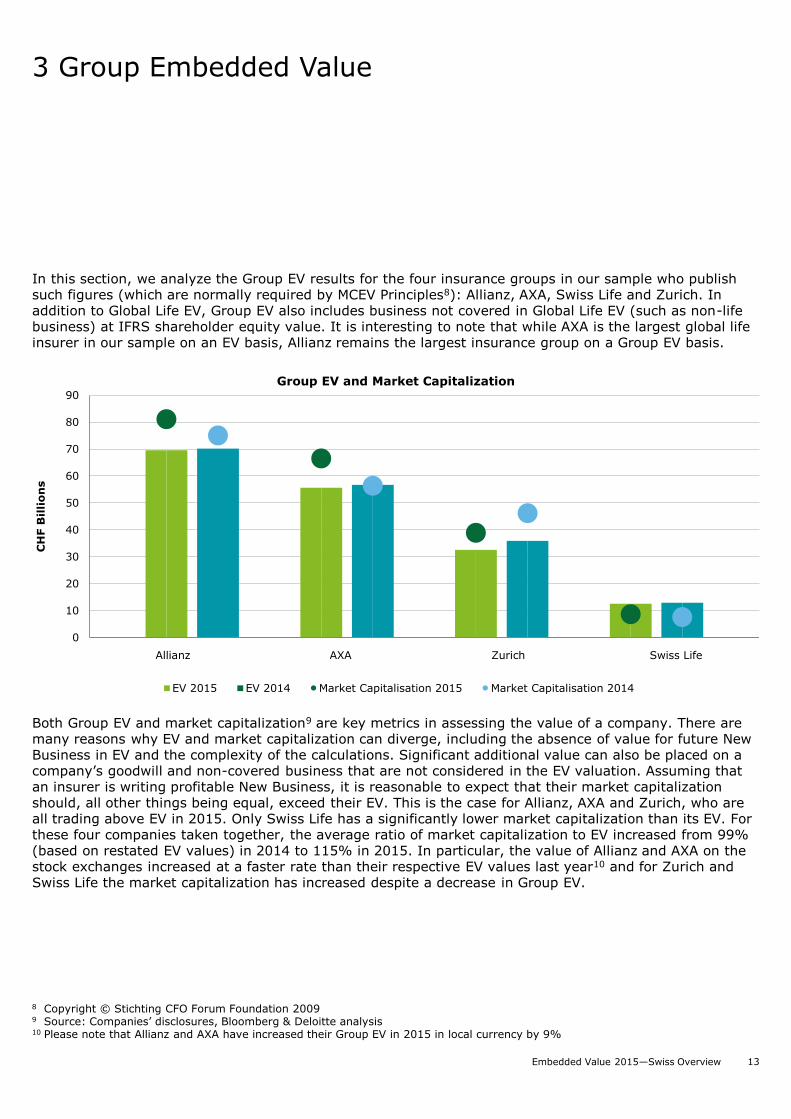
In this section, we analyze the Group EV results for the four insurance groups in our sample who publish such figures (which are normally required by MCEV Principles8): Allianz, AXA, Swiss Life and Zurich. In addition to Global Life EV, Group EV also includes business not covered in Global Life EV (such as non-life business) at IFRS shareholder equity value. It is interesting to note that while AXA is the largest global life insurer in our sample on an EV basis, Allianz remains the largest insurance group on a Group EV basis.
Both Group EV and market capitalization9 are key metrics in assessing the value of a company. There are many reasons why EV and market capitalization can diverge, including the absence of value for future New Business in EV and the complexity of the calculations. Significant additional value can also be placed on a company’s goodwill and non-covered business that are not considered in the EV valuation. Assuming that an insurer is writing profitable New Business, it is reasonable to expect that their market capitalization should, all other things being equal, exceed their EV. This is the case for Allianz, AXA and Zurich, who are all trading above EV in 2015. Only Swiss Life has a significantly lower market capitalization than its EV. For these four companies taken together, the average ratio of market capitalization to EV increased from 99% (based on restated EV values) in 2014 to 115% in 2015. In particular, the value of Allianz and AXA on the stock exchanges increased at a faster rate than their respective EV values last year10 and for Zurich and Swiss Life the market capitalization has increased despite a decrease in Group EV.
8 Copyright © Stichting CFO Forum Foundation 20099 Source: Companies’ disclosures, Bloomberg & Deloitte analysis10 Please note that Allianz and AXA have increased their Group EV in 2015 in local currency by 9%
Allianz AXA Zurich Swiss Life
0
10
20
30
40
50
60
70
80
90
CH
F B
illi
on
s
Group EV and Market Capitalization
EV 2015 EV 2014 Market Capitalisation 2015 Market Capitalisation 2014
Embedded Value 2015—Swiss Overview 14
4 Methodology and Disclosures
In this section, we analyse and compare the methodologies and assumptions of the insurers in our sample, highlighting how their approaches converge or diverge. We also provide a list of the additional non-mandatory disclosures that a number of companies are providing to investors and analysts.
Methodology
On 1 January 2016, the Solvency II directive came into force in all the 28 Member States. This resulted in a noticeable convergence in many insurers’ disclosures towards this directive. Four out of seven insurance companies published their 2015 EV results using Solvency II metrics. As in former years, Helvetia is still using a traditional EV approach, while all other companies in our sample use a market consistent EV methodology (although AXA elects to call it market-consistent European EV, there are no material differences with MCEV except for CRNHR calculations, see page 18).
Liquidity Premiums and Volatility Adjustment less Credit Risk Adjustment
One of the biggest impact of the methodology convergence towards the Solvency II Directive is the change in the reference rate methodology. While most of the companies still applied liquidity premiums to their reference rates for the 2014 EV valuation, four companies decided to apply the new Solvency II requirements using a Volatility Adjustment (VA) less a Credit Risk Adjustment (CRA) for their 2015 EV disclosures. For these four companies, both of these adjustments were applied as fixed adjustments to the spot rates of the risk-free curve in the liquid part of the curve only. Moreover, the interpolation, where needed, and the extrapolation after the Last Liquid Point (LLP) of interest rates were based on the Smith-Wilson methodology. An Ultimate Forward Rate (UFR) was then applied to reflect a long term equilibrium forward rate after a convergence period of 40 years for Generali and AXA, and of 60 years for Baloise (not disclosed for Allianz). We display these metrics in the following table:
Company Methodology Reference Rates Economic Scenario Generator
Allianz MCEV As per EOIPA Guidelines In-house model
AXA EEV (Market consistent) As per EOIPA Guidelines Barrie & Hibbert
Baloise MCEV As per EOIPA Guidelines Deloitte XSG
Generali MCEV As per EOIPA Guidelines (except for
Hungary and Poland11)
Moody’s Analytics (FG&Os) and
LMM+ (IRs) 12
Helvetia TEV (i.e. deterministic & real-world) n.a. n.a.
Swiss Life MCEV As per QIS5 Guidelines Barrie & Hibbert
Zurich MCEV As per QIS5 Guidelines Barrie & Hibbert
11 The local swap curve for these two countries is not considered by EIOPA as a robust basis for producing reference rates and the government bond adjusted for CRA rates have been used instead (source: Generali’s disclosure)
12 Referred to as Moody’s Analytics (Barrie & Hibbert’s parent company) in Generali’s disclosures
Embedded Value 2015—Swiss Overview 15
4 Methodology and Disclosures (cont.)
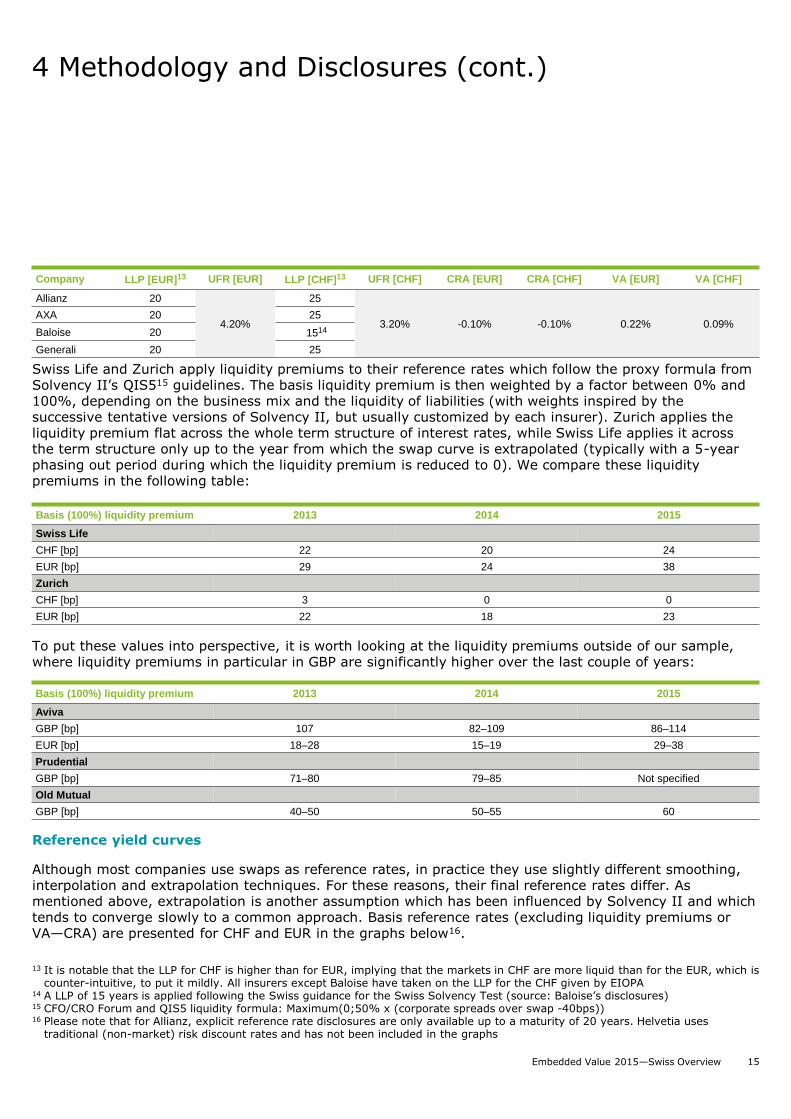
Swiss Life and Zurich apply liquidity premiums to their reference rates which follow the proxy formula from Solvency II’s QIS515 guidelines. The basis liquidity premium is then weighted by a factor between 0% and 100%, depending on the business mix and the liquidity of liabilities (with weights inspired by the successive tentative versions of Solvency II, but usually customized by each insurer). Zurich applies the liquidity premium flat across the whole term structure of interest rates, while Swiss Life applies it across the term structure only up to the year from which the swap curve is extrapolated (typically with a 5-year phasing out period during which the liquidity premium is reduced to 0). We compare these liquidity premiums in the following table:
To put these values into perspective, it is worth looking at the liquidity premiums outside of our sample, where liquidity premiums in particular in GBP are significantly higher over the last couple of years:
Reference yield curves
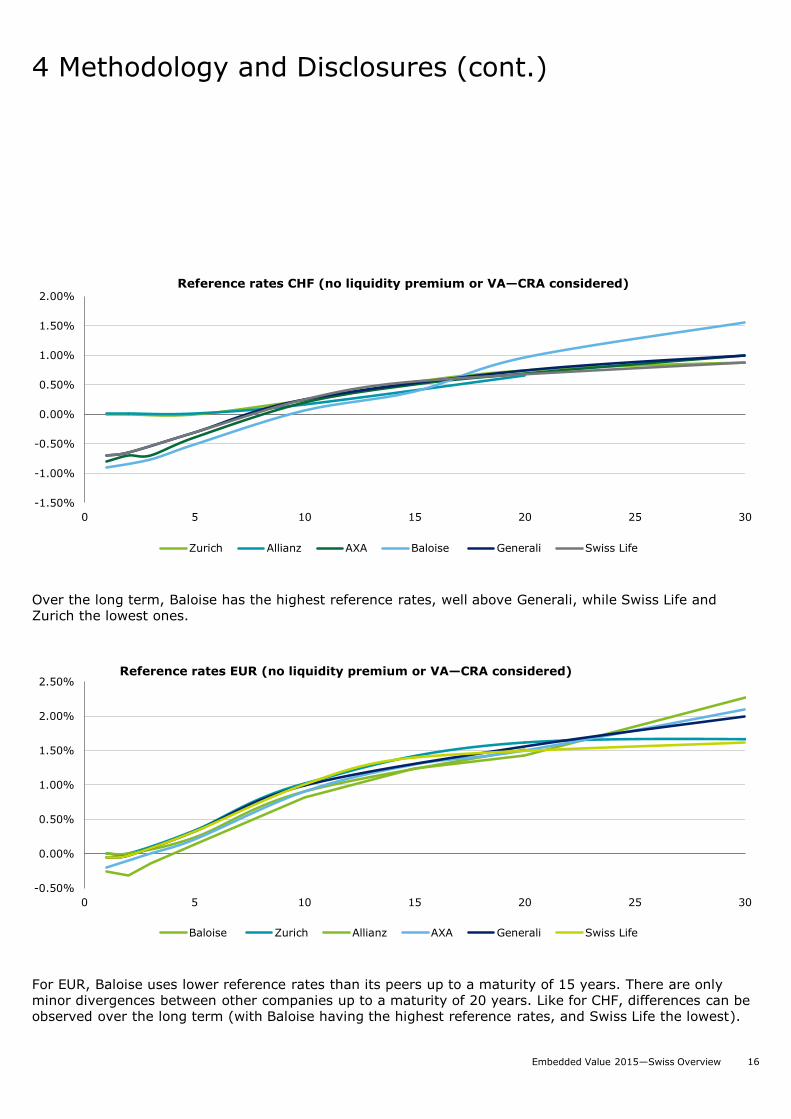
Although most companies use swaps as reference rates, in practice they use slightly different smoothing, interpolation and extrapolation techniques. For these reasons, their final reference rates differ. As mentioned above, extrapolation is another assumption which has been influenced by Solvency II and which tends to converge slowly to a common approach. Basis reference rates (excluding liquidity premiums or VA—CRA) are presented for CHF and EUR in the graphs below16.
Company LLP [EUR]13 UFR [EUR] LLP [CHF]13 UFR [CHF] CRA [EUR] CRA [CHF] VA [EUR] VA [CHF]
Allianz 20
4.20%
25
3.20% -0.10% -0.10% 0.22% 0.09%AXA 20 25
Baloise 20 1514
Generali 20 25
13 It is notable that the LLP for CHF is higher than for EUR, implying that the markets in CHF are more liquid than for the EUR, which is counter-intuitive, to put it mildly. All insurers except Baloise have taken on the LLP for the CHF given by EIOPA
14 A LLP of 15 years is applied following the Swiss guidance for the Swiss Solvency Test (source: Baloise’s disclosures)15 CFO/CRO Forum and QIS5 liquidity formula: Maximum(0;50% x (corporate spreads over swap -40bps))16 Please note that for Allianz, explicit reference rate disclosures are only available up to a maturity of 20 years. Helvetia uses
traditional (non-market) risk discount rates and has not been included in the graphs
Basis (100%) liquidity premium 2013 2014 2015
Swiss Life
CHF [bp] 22 20 24
EUR [bp] 29 24 38
Zurich
CHF [bp] 3 0 0
EUR [bp] 22 18 23
Basis (100%) liquidity premium 2013 2014 2015
Aviva
GBP [bp] 107 82–109 86–114
EUR [bp] 18–28 15–19 29–38
Prudential
GBP [bp] 71–80 79–85 Not specified
Old Mutual
GBP [bp] 40–50 50–55 60
Embedded Value 2015—Swiss Overview 16
Over the long term, Baloise has the highest reference rates, well above Generali, while Swiss Life and Zurich the lowest ones.
4 Methodology and Disclosures (cont.)
For EUR, Baloise uses lower reference rates than its peers up to a maturity of 15 years. There are only minor divergences between other companies up to a maturity of 20 years. Like for CHF, differences can be observed over the long term (with Baloise having the highest reference rates, and Swiss Life the lowest).
-1.50%
-1.00%
-0.50%
0.00%
0.50%
1.00%
1.50%
2.00%
0 5 10 15 20 25 30
Reference rates CHF (no liquidity premium or VA—CRA considered)
Zurich Allianz AXA Baloise Generali Swiss Life
-0.50%
0.00%
0.50%
1.00%
1.50%
2.00%
2.50%
0 5 10 15 20 25 30
Reference rates EUR (no liquidity premium or VA—CRA considered)
Baloise Zurich Allianz AXA Generali Swiss Life
Embedded Value 2015—Swiss Overview 17
4 Methodology and Disclosures (cont.)
Volatilities
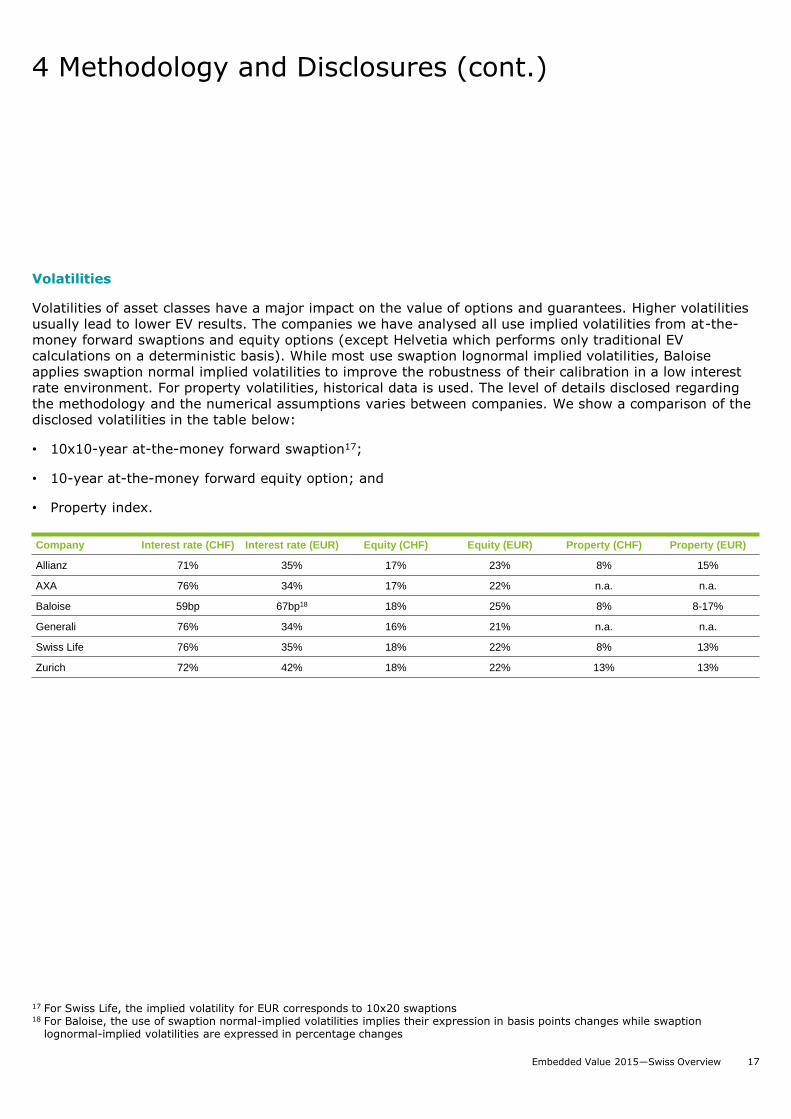
Volatilities of asset classes have a major impact on the value of options and guarantees. Higher volatilities usually lead to lower EV results. The companies we have analysed all use implied volatilities from at-the-money forward swaptions and equity options (except Helvetia which performs only traditional EV calculations on a deterministic basis). While most use swaption lognormal implied volatilities, Baloise applies swaption normal implied volatilities to improve the robustness of their calibration in a low interest rate environment. For property volatilities, historical data is used. The level of details disclosed regarding the methodology and the numerical assumptions varies between companies. We show a comparison of the disclosed volatilities in the table below:
• 10x10-year at-the-money forward swaption17;
• 10-year at-the-money forward equity option; and
• Property index.
Company Interest rate (CHF) Interest rate (EUR) Equity (CHF) Equity (EUR) Property (CHF) Property (EUR)
Allianz 71% 35% 17% 23% 8% 15%
AXA 76% 34% 17% 22% n.a. n.a.
Baloise 59bp 67bp18 18% 25% 8% 8-17%
Generali 76% 34% 16% 21% n.a. n.a.
Swiss Life 76% 35% 18% 22% 8% 13%
Zurich 72% 42% 18% 22% 13% 13%
17 For Swiss Life, the implied volatility for EUR corresponds to 10x20 swaptions18 For Baloise, the use of swaption normal-implied volatilities implies their expression in basis points changes while swaption
lognormal-implied volatilities are expressed in percentage changes
Embedded Value 2015—Swiss Overview 18
4 Methodology and Disclosures (cont.)
Cost of Residual Non-Hedgeable Risks
In contrast to the methodology used for the reference rate, only one insurer, namely Allianz, calculates the Risk Margin (RM) as used under Solvency II and the SST, and which is comparable to the Cost of Residual Non-Hedgeable Risks (CRNHR) of MCEV. According to the MCEV Principles, an allowance should be made for the Cost of Residual Non-Hedgeable Risks not already captured explicitly in the value of options and guarantees in the projection model. Residual non-hedgeable risks can be either non-financial risks (e.g. biometric, persistency, expenses and operational) or financial non-hedgeable risks. Although CRNHR and RM are based on a cost of capital approach, there are differences between individual companies regarding the annual cost of capital, the risks covered and the diversification taken into account.
We first consider Allianz, Baloise, Generali, Swiss Life and Zurich. Within this sub-sample:
• The majority of companies (Baloise, Generali, Swiss Life and Zurich) assume a 4% cost of Capital rate (CoC) per annum while Allianz applies the Solvency II/SST prescribed CoC of 6%,
• All insurers cover insurance risks in their CRNHR/RM calculations. Some also cover operational risk (this is mentioned by Allianz, Generali and Zurich) or credit risk (this is notably mentioned by Baloise, Zurich and Swiss Life19); and
• Zurich, Baloise and Generali explicitly state that an allowance is made for diversification across risk types and across geographical regions. However, Swiss Life does not apply any diversification at Group level.
Helvetia uses a traditional EV approach, whereby costs of capital are based on the risk discount rates and not explicitly split between CRNHR/RM and Frictional Costs of Capital.
AXA applies a methodology conceptually more comparable to traditional EV, whereby the cost of capital is the cost of locked-in minimum required capital, namely the economic cost incurred through the payment of investment expenses and taxes on investment income earned from assets held in excess of the policyholder reserves. Similarly, the cost of capital for non-financial risk is the excess between the target local hard capital and the minimum local hard capital. Numerically this leads to comparatively low costs of capital for AXA (see page 6).
Additional disclosures
Although the MCEV Principles only require the disclosure of an analysis of MCEV Earnings, many companies also publish an analysis of the changes for the value of New Business. This was the case this year for Allianz, AXA, Generali and Swiss Life.
MCEV requires that profits or losses from managing covered business incurred in service companies (such as administrative support or asset management for example) are measured on a “look-through” basis, i.e. that they are incorporated into the EV and Value of New Business (VNB). In our sample:
• Allianz does not include look-through profits (linked to fund management companies within the group) in its EV and VNB, but provides the potential positive impact as additional information; and
• Baloise, Generali, Swiss Life and Zurich all include look-through profits, but the numerical impact on EV and VNB is not disclosed.
Many companies also publish a profit maturity profile over the projection horizon. In our sample, this is the case for Allianz, AXA, Generali and Zurich. Although disclaimers rightly note that this does not directly correspond to future distributable cash-flows, it allows knowledgeable investors to form an opinion on the timing of future profits (which in life insurance can be very long-term).
19 Swiss Life calculates the cost of credit risk using a CRNHR-like approach, but actually chooses to report it under the Time Value of Financial Options and Guarantees instead of CRNHR.
Embedded Value 2015—Swiss Overview 19
4 Methodology and Disclosures (cont.)
In accordance with the MCEV Principles, all companies in our sample except Baloise and Allianz publish a split of their Shareholder Net Assets between Required Capital and Free Surplus (although Baloise calculates Frictional Cost of Capital based on the whole Shareholder Net Assets and not just Required Capital). Some companies (Generali and Zurich) go further and publish detailed information regarding the generation of distributable profits (Free Surplus) during the reporting period.
AXA and Generali publish Internal Rates of Return (IRR) for New Business, corresponding to the discount rate that equals the value of New Business to zero. They also publish equivalent Implied risk Discount Rates (IDR, for the in-force as well as for the New Business), corresponding to the discount rate that would reproduce a traditional EV calculation. Both the IDR and the IRR provide indicators regarding the expected real-world profitability.
Market Value Balance Sheet Approach
As stated in the introduction, Allianz is the pioneer in applying the Solvency II requirements not only on the main assumptions, such as the reference rates methodology, but also in adopting a balance sheet approach. This differs from the so-called distributable earnings approach underlying the MCEV Principles. We highlight the main differences we observed in the following:
• Split of the Net Asset Value and the Value of In-Force: the balance sheet approach does not provide a further split of these two values;
• The Frictional Costs of Capital: these represent the investment costs of managing the assets backing the required capital and the tax on the returns of the assets backing the required capital. They are no longer calculated under the balance sheet approach;
• The Cost of Residual Non Hedgeable Risks (CRNHR): this value is replaced by the Risk Margin required under Solvency II. As mentioned above, these two values are equivalent in that they both must reflect the cost of holding capital to buffer non-hedgeable risk. However, one important difference between these two is that interest risk is explicitly excluded from the calculation of the Risk Margin of Solvency II;
• Contract Boundaries under Solvency II restrict future cash flows recognition on specific contracts. There are no such restrictions under the MCEV Principles.
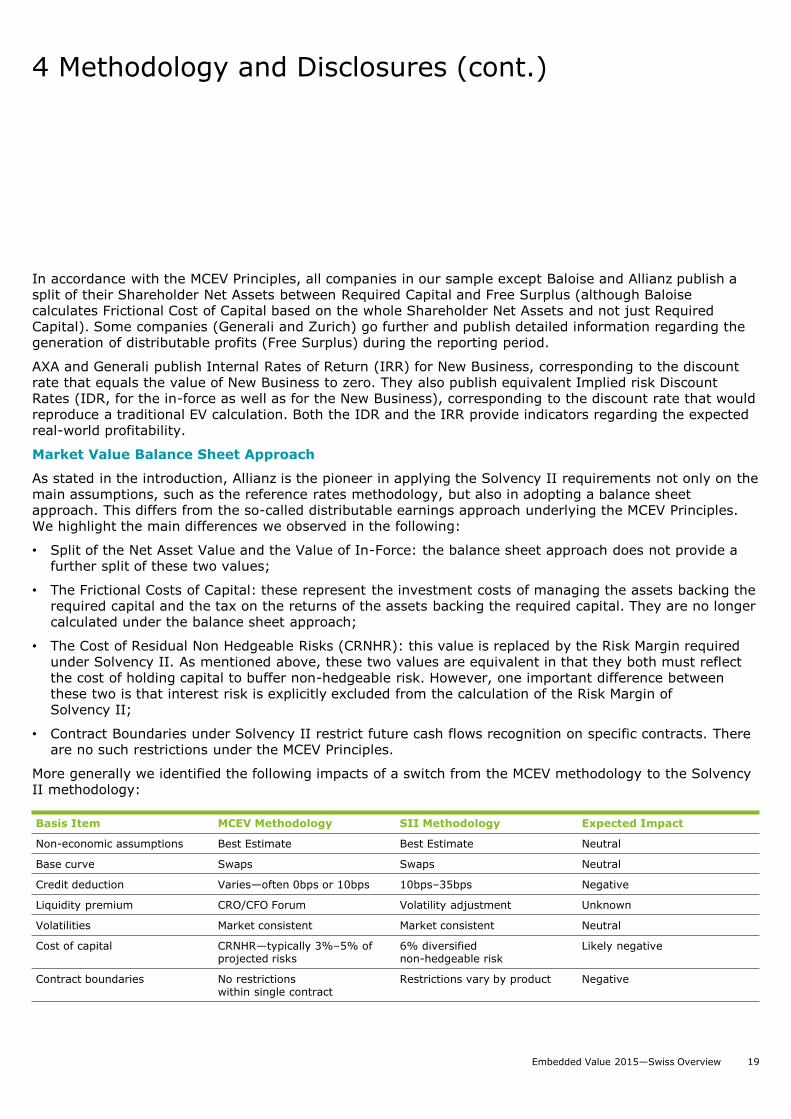
More generally we identified the following impacts of a switch from the MCEV methodology to the Solvency II methodology:
Basis Item MCEV Methodology SII Methodology Expected Impact
Non-economic assumptions Best Estimate Best Estimate Neutral
Base curve Swaps Swaps Neutral
Credit deduction Varies—often 0bps or 10bps 10bps–35bps Negative
Liquidity premium CRO/CFO Forum Volatility adjustment Unknown
Volatilities Market consistent Market consistent Neutral
Cost of capital CRNHR—typically 3%–5% of projected risks
6% diversified non-hedgeable risk
Likely negative
Contract boundaries No restrictionswithin single contract
Restrictions vary by product Negative
Embedded Value 2015—Swiss Overview 20
4 Methodology and Disclosures (cont.)
The future of Embedded Value
As we expected last year, Solvency II Requirements are slowly replacing the disclosure of Embedded Values. In addition, we see a number of areas which could cause challenges for the life insurance industry over the coming years and could also influence the way insurers will report their EV:
• With the global economic outlook failing to pick up and the uncertainty of the UK leaving (likely) the EU, there remains a high risk that low rates will remain a feature over at least the short to medium term. Negative interest rates are already present in some countries and Switzerland actually observed negative interest rates up to 42 years early July. Insurers will need to consider the operational and financial implications of this.
• Following the announcement from the IASB in February that drafting of the IFRS 4 Phase II Standard was to commence, we expect to see a go-live date of 2020 or 2021. Although there are similarities with Solvency II, there are also crucial presentational and computational differences, bringing more challenging implementation activities to the fore.
• Given the term structure of interest rates, the current high level of the UFR might eventually be seen as not tenable anymore. A reduction of the UFR would significantly increase exposure to long-term guarantees (although the impact will likely be staggered), potentially making such markets relatively less attractive.
Finally, specifically in relation to external reporting, we expect the trend away from EV towards Solvency II metrics to persist, with more insurers joining companies like Munich Re, Aviva, L&G and Standard Life in ceasing to report EV.
Guidance from the CFO Forum will shape developments in this area, but we appear to be entering a transitional phase for supplementary reporting. Already today, companies retaining EV use divergent methodologies. Some companies base their reporting on modified own funds and others move to Solvency II based methodology. This is unlikely to resolve itself in the short term. The lack of comparability will have a direct bearing on investors, analysts and prospective purchasers. Whichever path companies adopt, there will remain a requirement for concise, meaningful supplementary disclosures to meet the needs of a range of stakeholders.
Embedded Value 2015—Swiss Overview 21
Appendix: Financial Markets
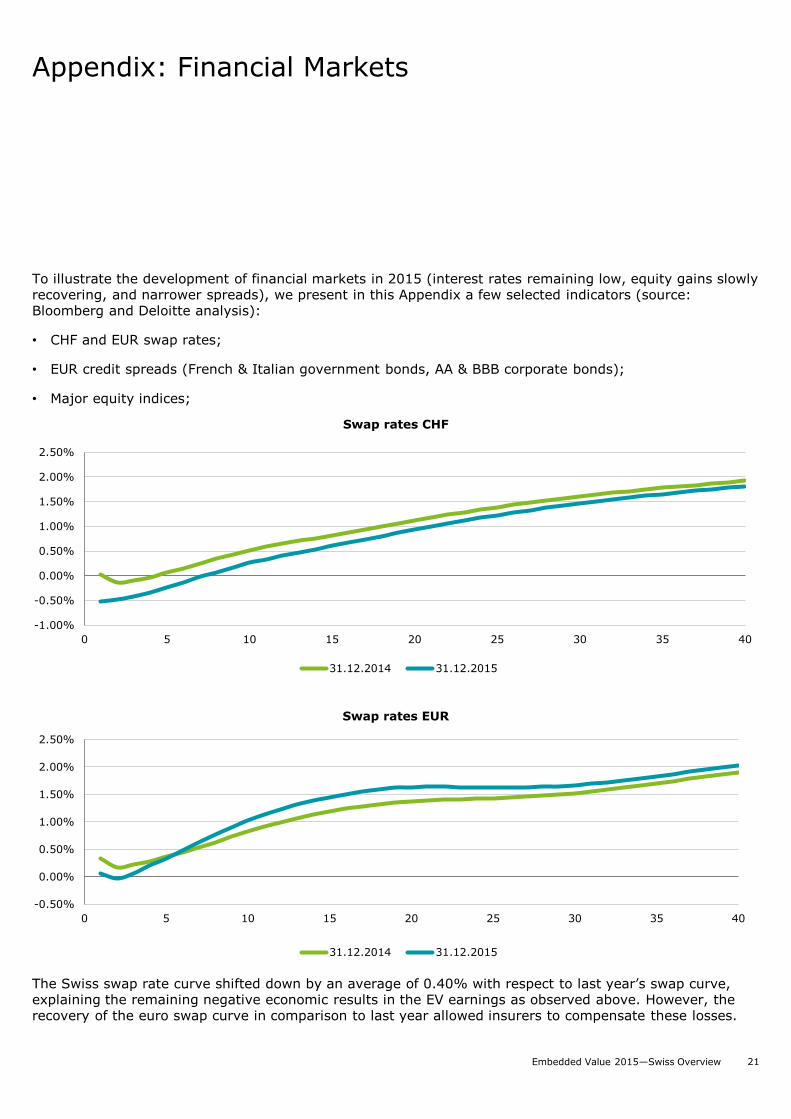
To illustrate the development of financial markets in 2015 (interest rates remaining low, equity gains slowly recovering, and narrower spreads), we present in this Appendix a few selected indicators (source: Bloomberg and Deloitte analysis):
• CHF and EUR swap rates;
• EUR credit spreads (French & Italian government bonds, AA & BBB corporate bonds);
• Major equity indices;
The Swiss swap rate curve shifted down by an average of 0.40% with respect to last year’s swap curve, explaining the remaining negative economic results in the EV earnings as observed above. However, the recovery of the euro swap curve in comparison to last year allowed insurers to compensate these losses.
-1.00%
-0.50%
0.00%
0.50%
1.00%
1.50%
2.00%
2.50%
0 5 10 15 20 25 30 35 40
Swap rates CHF
31.12.2014 31.12.2015
-0.50%
0.00%
0.50%
1.00%
1.50%
2.00%
2.50%
0 5 10 15 20 25 30 35 40
Swap rates EUR
31.12.2014 31.12.2015
Embedded Value 2015—Swiss Overview 22
Appendix: Financial Markets (cont.)
0.00%
0.20%
0.40%
0.60%
0.80%
1.00%
1.20%
1.40%
1.60%
1.80%
Jan-15 Apr-15 Jul-15 Oct-15 Jan-16
Credit Spreads vs. German government bonds
France gov. Italy gov. EUR Corporate AA EUR Corporate BBB
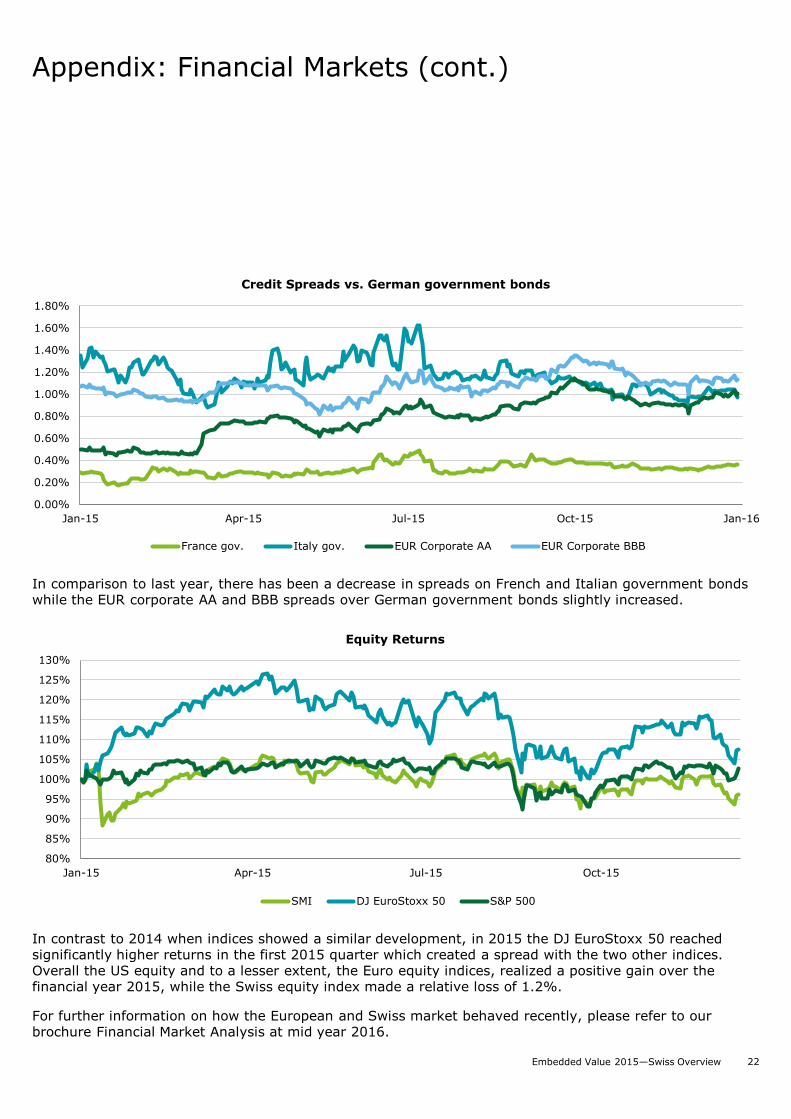
In comparison to last year, there has been a decrease in spreads on French and Italian government bonds while the EUR corporate AA and BBB spreads over German government bonds slightly increased.
In contrast to 2014 when indices showed a similar development, in 2015 the DJ EuroStoxx 50 reached significantly higher returns in the first 2015 quarter which created a spread with the two other indices. Overall the US equity and to a lesser extent, the Euro equity indices, realized a positive gain over the financial year 2015, while the Swiss equity index made a relative loss of 1.2%.
For further information on how the European and Swiss market behaved recently, please refer to our brochure Financial Market Analysis at mid year 2016.
80%
85%
90%
95%
100%
105%
110%
115%
120%
125%
130%
Jan-15 Apr-15 Jul-15 Oct-15
Equity Returns
SMI DJ EuroStoxx 50 S&P 500

Embedded Value 2015—Swiss Overview 23
Stefan Rechtsteiner
Senior Manager
+41 58 279 6796
Delphine Savatier
Consultant
+41 58 279 6165
Contacts
Philipp Keller
Partner
+41 58 279 6290
Deloitte refers to one or more of Deloitte Touche Tohmatsu Limited ("DTTL"), a UK private company limited by guarantee, and its network of member firms, each of which is a legally separate and independent entity. Please see www.deloitte.com/ch/about for a detailed description of the legal structure of DTTL and its member firms.
Deloitte Consulting AG is a subsidiary of Deloitte LLP, the United Kingdom member firm of DTTL.
This publication has been written in general terms and therefore cannot be relied on to cover specific situations; application of the principles set out will depend upon the particular circumstances involved and we recommend that you obtain professional advice before acting or refraining from acting on any of the contents of this publication. Deloitte Consulting AG would be pleased to advise readers on how to apply the principles set out in this publication to their specific circumstances. Deloitte Consulting AG accepts no duty of care or liability for any loss occasioned to any person acting or refraining from action as a result of any material in this publication.
© 2016 Deloitte Consulting AG. All rights reserved