Embed Size (px)
Citation preview

Round_3
Master_version_2015 TRA Templates 26102015Bank Name Banco Popolare Società Cooperativa
Name_of_submitted_file_Name_of_submitted_file_ITS_IT_5493006P8PDBI8LC0O96.xlsx_08/09/2015 10:00:45LEI Code 5493006P8PDBI8LC0O96
ITS_update_09_Nov_2015 at 09:13:14Country Code IT
Merge_manual_input_09_Nov_2015 at 09:50:15 Ba
2015 EU-wide Transparency Exercise

2015 EU-wide Transparency Exercise 201412 201506
Capital
Banco Popolare Società Cooperativa
CRR / CRDIV DEFINITION OF CAPITALAs of
31/12/2014
As of
30/06/2015COREP CODE REGULATION
OWN FUNDS 7,017 6,833 CA1 {1} Articles 4(118) and 72 of CRR
COMMON EQUITY TIER 1 CAPITAL (net of deductions and after applying
transitional adjustments)5,694 5,889 CA1 {1.1.1} Article 50 of CRR
Capital instruments eligible as CET1 Capital (including share premium and net own capital
instruments)7,562 6,091 CA1 {1.1.1.1} Articles 26(1) points (a) and (b), 27 to 29, 36(1) point (f) and 42 of CRR
Retained earnings -1,940 290 CA1 {1.1.1.2} Articles 26(1) point (c), 26(2) and 36 (1) points (a) and (l) of CRR
Accumulated other comprehensive income 1,372 278 CA1 {1.1.1.3} Articles 4(100), 26(1) point (d) and 36 (1) point (l) of CRR
Other Reserves 1,018 1,702 CA1 {1.1.1.4} Articles 4(117) and 26(1) point (e) of CRR
Funds for general banking risk 0 0 CA1 {1.1.1.5} Articles 4(112), 26(1) point (f) and 36 (1) point (l) of CRR
Minority interest given recognition in CET1 capital 0 0 CA1 {1.1.1.7} Article 84 of CRR
Adjustments to CET1 due to prudential filters -33 -18 CA1 {1.1.1.9} Articles 32 to 35 and 36 (1) point (l) of CRR
(-) Intangible assets (including Goodwill) -1,891 -1,891 CA1 {1.1.1.10 + 1.1.1.11}Articles 4(113), 36(1) point (b) and 37 of CRR. Articles 4(115), 36(1) point (b) and 37 point (a) of
CCR
(-) DTAs that rely on future profitability and do not arise from temporary differences net of
associated DTLs 0 -24 CA1 {1.1.1.12} Articles 36(1) point (c) and 38 of CRR
(-) IRB shortfall of credit risk adjustments to expected losses 0 0 CA1 {1.1.1.13} Articles 36(1) point (d), 40 and 159 of CRR
(-) Defined benefit pension fund assets 0 0 CA1 {1.1.1.14} Articles 4(109), 36(1) point (e) and 41 of CRR
(-) Reciprocal cross holdings in CET1 Capital 0 0 CA1 {1.1.1.15} Articles 4(122), 36(1) point (g) and 44 of CRR
(-) Excess deduction from AT1 items over AT1 Capital 0 -54 CA1 {1.1.1.16} Article 36(1) point (j) of CRR
(-) Deductions related to assets which can alternatively be subject to a 1.250% risk weight 0 0 CA1 {1.1.1.17 to 1.1.1.21}
Articles 4(36), 36(1) point (k) (i) and 89 to 91 of CRR; Articles 36(1) point (k) (ii), 243(1) point (b),
244(1) point (b) and 258 of CRR; Articles 36(1) point k) (iii) and 379(3) of CRR; Articles 36(1) point
k) (iv) and 153(8) of CRR and Articles 36(1) point k) (v) and 155(4) of CRR.
Of which: from securitisation positions (-) 0 0 CA1 {1.1.1.18} Articles 36(1) point (k) (ii), 243(1) point (b), 244(1) point (b) and 258 of CRR
(-) Holdings of CET1 capital instruments of financial sector entities where the institiution does
not have a significant investment0 -72 CA1 {1.1.1.22} Articles 4(27), 36(1) point (h); 43 to 46, 49 (2) and (3) and 79 of CRR
(-) Deductible DTAs that rely on future profitability and arise from temporary differences 0 0 CA1 {1.1.1.23} Articles 36(1) point (c) and 38; Articles 48(1) point (a) and 48(2) of CRR
(-) Holdings of CET1 capital instruments of financial sector entities where the institiution has a
significant investment-615 -814 CA1 {1.1.1.24} Articles 4(27); 36(1) point (i); 43, 45; 47; 48(1) point (b); 49(1) to (3) and 79 of CRR
(-) Amount exceding the 17.65% threshold -47 -129 CA1 {1.1.1.25} Article 470 of CRR
Other CET1 capital elements and deductions 0 0CA1 {1.1.1.27} + CA1
{1.1.1.28}-
Transitional adjustments 268 531CA1 {1.1.1.6 + 1.1.1.8 +
1.1.1.26}-
Transitional adjustments due to grandfathered CET1 Capital instruments (+/-) 0 0 CA1 {1.1.1.6}
Articles 483(1) to (3), and 484 to 487 of CRR
Transitional adjustments due to additional minority interests (+/-) 8 38 CA1 {1.1.1.8}
Articles 479 and 480 of CRR
Other transitional adjustments to CET1 Capital (+/-) 260 493 CA1 {1.1.1.26}
Articles 469 to 472, 478 and 481 of CRR
ADDITIONAL TIER 1 CAPITAL (net of deductions and after transitional adjustments) 188 0 CA1 {1.1.2} Article 61 of CRR
Additional Tier 1 Capital instruments (including grandfathered amounts) 453 247CA1 {1.1.2.1} + CA1
{1.1.2.2} + CA1 {1.1.2.3} +
CA1 {1.1.2.4}
Other additional Tier 1 Capital components and deductions (after transitional adjustments) -265 -247CA1 {1.1.2} - (CA1 {1.1.2.1}
+ CA1 {1.1.2.2} + CA1
{1.1.2.3} + CA1 {1.1.2.4})
TIER 1 CAPITAL (net of deductions and after transitional adjustments) 5,882 5,889 CA1 {1.1} Article 25 of CRR
TIER 2 CAPITAL (net of deductions and after transitional adjustments) 1,135 944 CA1 {1.2} Article 71 of CRR
Tier 2 Capital instruments (including grandfathered amounts) 1,264 1,203CA1 {1.2.1} + CA1 {1.2.2} +
CA1 {1.2.3} + CA1 {1.2.4}
Other Tier 2 Capital components and deductions (after transitional adjustments) -128 -259CA1 {1.2} - (CA1 {1.2.1} +
CA1 {1.2.2} + CA1 {1.2.3} +
CA1 {1.2.4})
TOTAL RISK EXPOSURE AMOUNT 47,987 48,080 CA2 {1} Articles 92(3), 95, 96 and 98 of CRR
Common Equity Tier 1 Capital ratio 11.87% 12.25% CA3 {1} -
Tier 1 Capital ratio 12.26% 12.25% CA3 {3} -
Total Capital ratio 14.62% 14.21% CA3 {5} -
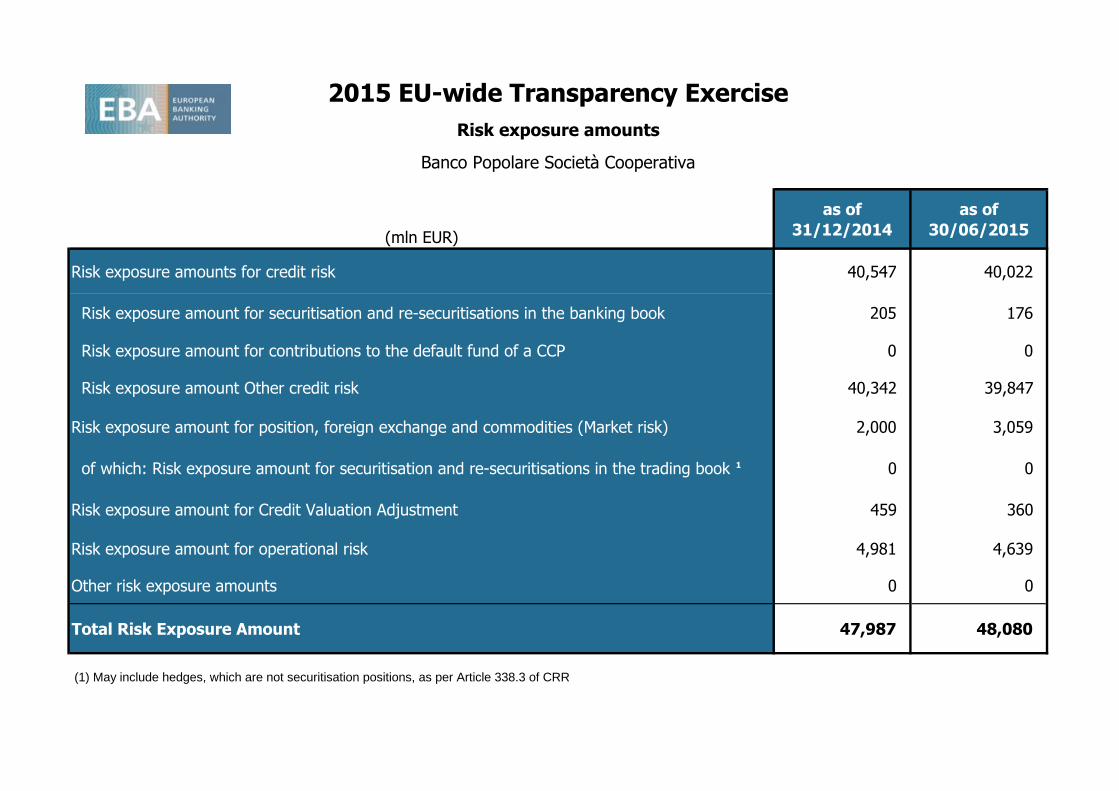
(mln EUR)
as of
31/12/2014
as of
30/06/2015
Risk exposure amounts for credit risk 40,547 40,022
Risk exposure amount for securitisation and re-securitisations in the banking book 205 176
Risk exposure amount for contributions to the default fund of a CCP 0 0
Risk exposure amount Other credit risk 40,342 39,847
Risk exposure amount for position, foreign exchange and commodities (Market risk) 2,000 3,059
of which: Risk exposure amount for securitisation and re-securitisations in the trading book 1 0 0
Risk exposure amount for Credit Valuation Adjustment 459 360
Risk exposure amount for operational risk 4,981 4,639
Other risk exposure amounts 0 0
Total Risk Exposure Amount 47,987 48,080
(1) May include hedges, which are not securitisation positions, as per Article 338.3 of CRR
2015 EU-wide Transparency Exercise
Risk exposure amounts
Banco Popolare Società Cooperativa

201412 201506
(mln EUR)
Interest income 3,256 1,448
Of which debt securities income 588 280
Of which loans and advances income 2,515 1,093
Interest expenses 1,696 657
(Of which deposits expenses) 357 127
(Of which debt securities issued expenses) 1,312 501
(Expenses on share capital repayable on demand) 0 0
Dividend income 35 24
Net Fee and commission income 1,395 774
Gains or (-) losses on derecognition of financial assets and liabilities not measured at fair value through profit or loss, and of non financial assets, net 42 78
Gains or (-) losses on financial assets and liabilities held for trading, net 177 0
Gains or (-) losses on financial assets and liabilities designated at fair value through profit or loss, net -43 70
Gains or (-) losses from hedge accounting, net -5 0
Exchange differences [gain or (-) loss], net -41 -15
Net other operating income /(expenses) 324 146
TOTAL OPERATING INCOME, NET 3,444 1,869
(Administrative expenses) 2,259 1,109
(Depreciation) 139 64
(Provisions or (-) reversal of provisions) 109 30
(Commitments and guarantees given) 71 -20
(Other provisions) 38 50
Of which pending legal issues and tax litigation1 52
Of which restructuring1 0
(Impairment or (-) reversal of impairment on financial assets not measured at fair value through profit or loss) 3,516 440
(Loans and receivables) 3,476 429
(Held to maturity investments, AFS assets and financial assets measured at cost) 40 12
(Impairment or (-) reversal of impairment of investments in subsidaries, joint ventures and associates and on non-financial assets) 300 0
(of which Goodwill) 200 0
Negative goodwill recognised in profit or loss 0 0
Share of the profit or (-) loss of investments in subsidaries, joint ventures and associates 86 62
Profit or (-) loss from non-current assets and disposal groups classified as held for sale not qualifying as discontinued operations 0 0
PROFIT OR (-) LOSS BEFORE TAX FROM CONTINUING OPERATIONS -2,794 288
PROFIT OR (-) LOSS AFTER TAX FROM CONTINUING OPERATIONS -1,979 293
Profit or (-) loss after tax from discontinued operations 0 -8
PROFIT OR (-) LOSS FOR THE YEAR -1,979 285
Of which attributable to owners of the parent -1,940 290 (1)
Information available only as of end of the year
2015 EU-wide Transparency ExerciseP&L
Banco Popolare Società Cooperativa
As of
31/12/2014
As of
30/06/2015
201412 201506 201412 201412 201412 201412 201412 201412 201412 201412 201412 201412 201506 201506 201506 201506 201506 201506 201506 201506 201506 201506
As of
31/12/2014
As of
30/06/2015
(mln EUR)
MULTIPLICATION
FACTOR (mc) x
AVERAGE OF
PREVIOUS 60
WORKING DAYS
(VaRavg)
PREVIOUS
DAY (VaRt-1)
MULTIPLICATION
FACTOR (ms) x
AVERAGE OF
PREVIOUS 60
WORKING DAYS
(SVaRavg)
LATEST
AVAILABLE
(SVaRt-1)
12 WEEKS
AVERAGE
MEASURE
LAST
MEASUREFLOOR
12 WEEKS
AVERAGE
MEASURE
LAST
MEASURE
MULTIPLICATION
FACTOR (mc) x
AVERAGE OF
PREVIOUS 60
WORKING DAYS
(VaRavg)
PREVIOUS
DAY (VaRt-1)
MULTIPLICATION
FACTOR (ms) x
AVERAGE OF
PREVIOUS 60
WORKING DAYS
(SVaRavg)
LATEST
AVAILABLE
(SVaRt-1)
12 WEEKS
AVERAGE
MEASURE
LAST
MEASUREFLOOR
12 WEEKS
AVERAGE
MEASURE
LAST
MEASURE
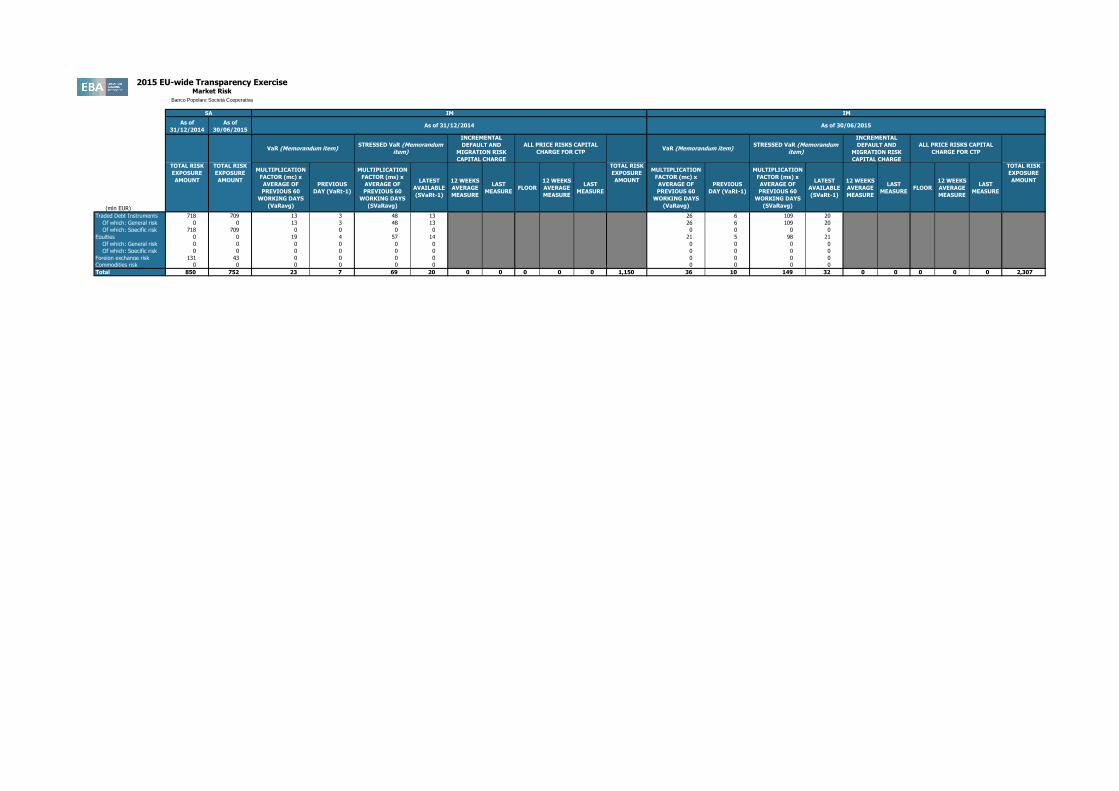
Traded Debt Instruments 718 709 13 3 48 13 26 6 109 20
Of which: General risk 0 0 13 3 48 13 26 6 109 20
Of which: Specific risk 718 709 0 0 0 0 0 0 0 0
Equities 0 0 19 4 57 14 21 5 98 21
Of which: General risk 0 0 0 0 0 0 0 0 0 0
Of which: Specific risk 0 0 0 0 0 0 0 0 0 0
Foreign exchange risk 131 43 0 0 0 0 0 0 0 0
Commodities risk 0 0 0 0 0 0 0 0 0 0
Total 850 752 23 7 69 20 0 0 0 0 0 1,150 36 10 149 32 0 0 0 0 0 2,307
STRESSED VaR (Memorandum
item)
INCREMENTAL
DEFAULT AND
MIGRATION RISK
CAPITAL CHARGE
ALL PRICE RISKS CAPITAL
CHARGE FOR CTP
TOTAL RISK
EXPOSURE
AMOUNT
As of 31/12/2014 As of 30/06/2015
ALL PRICE RISKS CAPITAL
CHARGE FOR CTP
TOTAL RISK
EXPOSURE
AMOUNT
VaR (Memorandum item)
TOTAL RISK
EXPOSURE
AMOUNT
TOTAL RISK
EXPOSURE
AMOUNT
VaR (Memorandum item)STRESSED VaR (Memorandum
item)
INCREMENTAL
DEFAULT AND
MIGRATION RISK
CAPITAL CHARGE
IM
2015 EU-wide Transparency ExerciseMarket Risk
Banco Popolare Società Cooperativa
SA IM

201412 201412 201412 201412 201506 201506 201506 201506
2015 EU-wide Transparency Exercise
Credit Risk - Standardised Approach
Banco Popolare Società Cooperativa
Original Exposure1
Original Exposure1
(mln EUR, %)
Central governments or central banks 21,254 21,629 3,824 21,162 21,582 3,172
Regional governments or local authorities 671 245 49 730 253 50
Public sector entities 997 274 83 934 324 94
Multilateral Development Banks 97 130 0 93 146 0
International Organisations 0 0 0 0 0 0
Institutions 30,054 8,036 2,677 28,653 8,286 3,153
Corporates 6,277 4,907 4,785 6,196 4,881 4,778
of which: SME 5,083 3,893 3,788 4,571 3,803 3,711
Retail 392 276 183 447 320 212
of which: SME 161 153 88 203 189 108
Secured by mortgages on immovable property 1,077 1,046 467 966 948 416
of which: SME 576 560 255 517 512 226
Exposures in default 6,114 3,741 4,550 2,243 6,147 3,741 4,423 2,285
Items associated with particularly high risk 65 65 98 60 60 89
Covered bonds 295 295 110 134 134 27
Claims on institutions and corporates with a ST credit assessment 0 0 0 0 0 0
Collective investments undertakings (CIU) 1,202 539 539 1,329 597 597
Equity 1,302 1,302 2,175 1,314 1,300 2,241
Securitisation 335 81 84 254 75 75
Other exposures 4,471 4,466 3,854 4,358 4,354 3,775
Standardised Total 74,603 47,032 23,478 2,365 72,776 47,000 23,102 2,410 (1)
Original exposure, unlike Exposure value, is reported before taking into account any effect due to credit conversion factors or credit risk mitigation techniques (e.g. substitution effects).
Consolidated data
Standardised Approach
As of 31/12/2014 As of 30/06/2015
Exposure
Value1
Risk exposure
amount
Value
adjustments
and
provisions
Exposure
Value1
Risk exposure
amount
Value
adjustments
and provisions

201412 201412 201412 201412 201412 201412 201506 201506 201506 201506 201506 201506
2015 EU-wide Transparency Exercise
Credit Risk - IRB Approach
Banco Popolare Società Cooperativa
(mln EUR, %)Of which:
defaulted
Of which:
defaulted
Of which:
defaulted
Of which:
defaulted
Central banks and central governments 0 0 0 0 0 0 0 0
Institutions 0 0 0 0 0 0 0 0
Corporates 66,312 42,955 11,499 7,920 66,342 43,622 11,421 7,879
Corporates - Of Which: Specialised Lending 0 0 0 0 0 0 0 0
Corporates - Of Which: SME 39,337 29,320 6,259 6,758 40,246 30,131 6,081 7,054
Retail 37,287 31,536 5,448 1,791 37,315 31,604 5,399 1,830
Retail - Secured on real estate property 20,492 20,384 3,290 534 20,201 20,093 3,198 582
Retail - Secured on real estate property - Of Which: SME 3,482 3,426 855 104 3,410 3,356 821 116
Retail - Secured on real estate property - Of Which: non-SME 17,009 16,958 2,435 429 16,791 16,737 2,377 467
Retail - Qualifying Revolving 879 301 122 9 881 302 123 9
Retail - Other Retail 15,916 10,850 2,036 1,248 16,233 11,208 2,077 1,239
Retail - Other Retail - Of Which: SME 13,375 8,677 1,709 850 13,455 8,836 1,668 883
Retail - Other Retail - Of Which: non-SME 2,540 2,173 327 398 2,778 2,372 409 356
Equity 0 0
Securitisation 45 45 121 0 48 48 101 0
Other non credit-obligation assets 0 0
IRB Total 17,069 16,920 (1)
Original exposure, unlike Exposure value, is reported before taking into account any effect due to credit conversion factors or credit risk mitigation techniques (e.g. substitution effects).
Consolidated data
IRB Approach
As of 31/12/2014 As of 30/06/2015
Original Exposure1
Exposure
Value1
Risk exposure amount Value
adjustments
and provisions
Original Exposure1
Exposure
Value1
Risk exposure amount Value
adjustments
and provisions

(mln EUR)
[ 0 - 3M [[ 3M - 1Y [[ 1Y - 2Y [[ 2Y - 3Y [ 2 2[3Y - 5Y [
[5Y - 10Y [[10Y - more
Total 2 0 2 0 0 0 0 0 0 0 0 0 0 0
[ 0 - 3M [[ 3M - 1Y [[ 1Y - 2Y [[ 2Y - 3Y [[3Y - 5Y [
[5Y - 10Y [[10Y - more
Total 0 0 0 0 0 0 0 0 0 0 0 0 0 0
[ 0 - 3M [[ 3M - 1Y [[ 1Y - 2Y [[ 2Y - 3Y [[3Y - 5Y [
[5Y - 10Y [[10Y - more
Total 0 0 0 0 0 0 0 0 0 0 0 0 0 0
[ 0 - 3M [[ 3M - 1Y [[ 1Y - 2Y [[ 2Y - 3Y [[3Y - 5Y [
[5Y - 10Y [[10Y - more
Total 0 0 0 0 0 0 0 0 0 0 0 0 0 0
[ 0 - 3M [[ 3M - 1Y [[ 1Y - 2Y [[ 2Y - 3Y [[3Y - 5Y [
[5Y - 10Y [[10Y - more
Total 0 0 0 0 0 0 0 0 0 0 0 0 0 0
[ 0 - 3M [[ 3M - 1Y [[ 1Y - 2Y [[ 2Y - 3Y [[3Y - 5Y [
[5Y - 10Y [[10Y - more
Total 0 0 0 0 0 0 0 0 0 0 0 0 0 0
[ 0 - 3M [[ 3M - 1Y [[ 1Y - 2Y [[ 2Y - 3Y [[3Y - 5Y [
[5Y - 10Y [[10Y - more
Total 0 0 0 0 0 0 0 0 0 0 0 0 0 0
[ 0 - 3M [[ 3M - 1Y [[ 1Y - 2Y [[ 2Y - 3Y [[3Y - 5Y [
[5Y - 10Y [[10Y - more
Total 0 0 0 0 0 0 0 0 0 0 0 0 0 0
[ 0 - 3M [[ 3M - 1Y [[ 1Y - 2Y [[ 2Y - 3Y [[3Y - 5Y [
[5Y - 10Y [[10Y - more
Total 0 0 0 0 0 0 0 0 0 0 0 0 0 0
Belgium
Bulgaria
Cyprus
Czech Republic
Denmark
Estonia
Finland
France
Austria
Fair-value (-) Notional value Fair-value (+) Notional value Fair-value (-)
INDIRECT SOVEREIGN EXPOSURES (3) (on and off balance sheet)
Derivatives with positive fair valueDerivatives with negative fair
value
2015 EU-wide Transparency Exercise
Sovereign Exposure
Banco Popolare Società Cooperativa
As of 31/12/2014
Residual Maturity Country / Region
GROSS DIRECT LONG
EXPOSURES (accounting value
gross of provisions)
(1)
NET DIRECT POSITIONS (gross exposures (long) net of cash short
positions of sovereign debt to other counterpaties only where there
is a maturity matching)
(1)
DIRECT SOVEREIGN EXPOSURES IN DERIVATIVES (1)
of which: loans
and advances
of which: AFS
banking book
of which: FVO
(designated at fair
value through
profit&loss)
banking book
of which: Financial
assets held for
trading
(2)
Notional value Fair-value (+) Notional value
Derivatives with positive fair value Derivatives with negative fair value

(mln EUR)
Austria
Fair-value (-) Notional value Fair-value (+) Notional value Fair-value (-)
INDIRECT SOVEREIGN EXPOSURES (3) (on and off balance sheet)
Derivatives with positive fair valueDerivatives with negative fair
value
2015 EU-wide Transparency Exercise
Sovereign Exposure
Banco Popolare Società Cooperativa
As of 31/12/2014
Residual Maturity Country / Region
GROSS DIRECT LONG
EXPOSURES (accounting value
gross of provisions)
(1)
NET DIRECT POSITIONS (gross exposures (long) net of cash short
positions of sovereign debt to other counterpaties only where there
is a maturity matching)
(1)
DIRECT SOVEREIGN EXPOSURES IN DERIVATIVES (1)
of which: loans
and advances
of which: AFS
banking book
of which: FVO
(designated at fair
value through
profit&loss)
banking book
of which: Financial
assets held for
trading
(2)
Notional value Fair-value (+) Notional value
Derivatives with positive fair value Derivatives with negative fair value
[ 0 - 3M [ -52 -64[ 3M - 1Y [[ 1Y - 2Y [[ 2Y - 3Y [[3Y - 5Y [
[5Y - 10Y [[10Y - more
Total 0 0 0 0 0 0 0 0 -52 -64 0 0 0 0
[ 0 - 3M [[ 3M - 1Y [[ 1Y - 2Y [[ 2Y - 3Y [[3Y - 5Y [
[5Y - 10Y [[10Y - more
Total 0 0 0 0 0 0 0 0 0 0 0 0 0 0
[ 0 - 3M [[ 3M - 1Y [[ 1Y - 2Y [[ 2Y - 3Y [[3Y - 5Y [
[5Y - 10Y [[10Y - more
Total 0 0 0 0 0 0 0 0 0 0 0 0 0 0
[ 0 - 3M [[ 3M - 1Y [[ 1Y - 2Y [[ 2Y - 3Y [[3Y - 5Y [
[5Y - 10Y [[10Y - more
Total 0 0 0 0 0 0 0 0 0 0 0 0 0 0
[ 0 - 3M [[ 3M - 1Y [[ 1Y - 2Y [[ 2Y - 3Y [[3Y - 5Y [
[5Y - 10Y [[10Y - more
Total 0 0 0 0 0 0 0 0 0 0 0 0 0 0
[ 0 - 3M [ 858 858 858 1 -77 -96[ 3M - 1Y [ 2,753 2,753 2,013 740[ 1Y - 2Y [ 3,669 3,669 2,295 202[ 2Y - 3Y [ 2,562 2,562 680 410[3Y - 5Y [ 4,301 4,301 2,505 27
[5Y - 10Y [ 1,021 1,021 473 31[10Y - more 1,281 1,281 1,275 6
Total 16,445 0 16,445 10,098 0 1,416 0 0 -77 -96 0 0 0 0
[ 0 - 3M [[ 3M - 1Y [[ 1Y - 2Y [[ 2Y - 3Y [[3Y - 5Y [
[5Y - 10Y [[10Y - more
Total 0 0 0 0 0 0 0 0 0 0 0 0 0 0
[ 0 - 3M [[ 3M - 1Y [[ 1Y - 2Y [[ 2Y - 3Y [[3Y - 5Y [
[5Y - 10Y [[10Y - more
Total 0 0 0 0 0 0 0 0 0 0 0 0 0 0
[ 0 - 3M [[ 3M - 1Y [[ 1Y - 2Y [[ 2Y - 3Y [[3Y - 5Y [
[5Y - 10Y [[10Y - more
Total 0 0 0 0 0 0 0 0 0 0 0 0 0 0
Ireland
Italy
Latvia
Lithuania
Luxembourg
Hungary
Germany
Croatia
Greece

(mln EUR)
Austria
Fair-value (-) Notional value Fair-value (+) Notional value Fair-value (-)
INDIRECT SOVEREIGN EXPOSURES (3) (on and off balance sheet)
Derivatives with positive fair valueDerivatives with negative fair
value
2015 EU-wide Transparency Exercise
Sovereign Exposure
Banco Popolare Società Cooperativa
As of 31/12/2014
Residual Maturity Country / Region
GROSS DIRECT LONG
EXPOSURES (accounting value
gross of provisions)
(1)
NET DIRECT POSITIONS (gross exposures (long) net of cash short
positions of sovereign debt to other counterpaties only where there
is a maturity matching)
(1)
DIRECT SOVEREIGN EXPOSURES IN DERIVATIVES (1)
of which: loans
and advances
of which: AFS
banking book
of which: FVO
(designated at fair
value through
profit&loss)
banking book
of which: Financial
assets held for
trading
(2)
Notional value Fair-value (+) Notional value
Derivatives with positive fair value Derivatives with negative fair value
[ 0 - 3M [[ 3M - 1Y [[ 1Y - 2Y [[ 2Y - 3Y [[3Y - 5Y [
[5Y - 10Y [[10Y - more
Total 0 0 0 0 0 0 0 0 0 0 0 0 0 0
[ 0 - 3M [[ 3M - 1Y [[ 1Y - 2Y [[ 2Y - 3Y [ 2 2[3Y - 5Y [
[5Y - 10Y [[10Y - more
Total 2 0 2 0 0 0 0 0 0 0 0 0 0 0
[ 0 - 3M [[ 3M - 1Y [[ 1Y - 2Y [[ 2Y - 3Y [[3Y - 5Y [
[5Y - 10Y [[10Y - more
Total 0 0 0 0 0 0 0 0 0 0 0 0 0 0
[ 0 - 3M [[ 3M - 1Y [[ 1Y - 2Y [[ 2Y - 3Y [[3Y - 5Y [
[5Y - 10Y [[10Y - more
Total 0 0 0 0 0 0 0 0 0 0 0 0 0 0
[ 0 - 3M [[ 3M - 1Y [[ 1Y - 2Y [[ 2Y - 3Y [[3Y - 5Y [
[5Y - 10Y [[10Y - more
Total 0 0 0 0 0 0 0 0 0 0 0 0 0 0
[ 0 - 3M [[ 3M - 1Y [[ 1Y - 2Y [[ 2Y - 3Y [[3Y - 5Y [
[5Y - 10Y [[10Y - more
Total 0 0 0 0 0 0 0 0 0 0 0 0 0 0
[ 0 - 3M [[ 3M - 1Y [[ 1Y - 2Y [[ 2Y - 3Y [[3Y - 5Y [
[5Y - 10Y [[10Y - more
Total 0 0 0 0 0 0 0 0 0 0 0 0 0 0
[ 0 - 3M [ 52 52 52[ 3M - 1Y [ 51 51 51[ 1Y - 2Y [[ 2Y - 3Y [[3Y - 5Y [
[5Y - 10Y [ 1 1 1[10Y - more
Total 104 0 104 103 0 1 0 0 0 0 0 0 0 0
[ 0 - 3M [[ 3M - 1Y [[ 1Y - 2Y [[ 2Y - 3Y [[3Y - 5Y [
[5Y - 10Y [[10Y - more
Total 0 0 0 0 0 0 0 0 0 0 0 0 0 0
Spain
Sweden
Slovenia
Malta
Netherlands
Poland
Portugal
Romania
Slovakia

(mln EUR)
Austria
Fair-value (-) Notional value Fair-value (+) Notional value Fair-value (-)
INDIRECT SOVEREIGN EXPOSURES (3) (on and off balance sheet)
Derivatives with positive fair valueDerivatives with negative fair
value
2015 EU-wide Transparency Exercise
Sovereign Exposure
Banco Popolare Società Cooperativa
As of 31/12/2014
Residual Maturity Country / Region
GROSS DIRECT LONG
EXPOSURES (accounting value
gross of provisions)
(1)
NET DIRECT POSITIONS (gross exposures (long) net of cash short
positions of sovereign debt to other counterpaties only where there
is a maturity matching)
(1)
DIRECT SOVEREIGN EXPOSURES IN DERIVATIVES (1)
of which: loans
and advances
of which: AFS
banking book
of which: FVO
(designated at fair
value through
profit&loss)
banking book
of which: Financial
assets held for
trading
(2)
Notional value Fair-value (+) Notional value
Derivatives with positive fair value Derivatives with negative fair value
[ 0 - 3M [[ 3M - 1Y [[ 1Y - 2Y [[ 2Y - 3Y [[3Y - 5Y [
[5Y - 10Y [[10Y - more
Total 0 0 0 0 0 0 0 0 0 0 0 0 0 0
[ 0 - 3M [[ 3M - 1Y [[ 1Y - 2Y [[ 2Y - 3Y [[3Y - 5Y [
[5Y - 10Y [[10Y - more
Total 0 0 0 0 0 0 0 0 0 0 0 0 0 0
[ 0 - 3M [[ 3M - 1Y [[ 1Y - 2Y [[ 2Y - 3Y [[3Y - 5Y [
[5Y - 10Y [[10Y - more
Total 0 0 0 0 0 0 0 0 0 0 0 0 0 0
[ 0 - 3M [[ 3M - 1Y [[ 1Y - 2Y [[ 2Y - 3Y [[3Y - 5Y [
[5Y - 10Y [[10Y - more
Total 0 0 0 0 0 0 0 0 0 0 0 0 0 0
[ 0 - 3M [[ 3M - 1Y [[ 1Y - 2Y [[ 2Y - 3Y [[3Y - 5Y [
[5Y - 10Y [[10Y - more
Total 0 0 0 0 0 0 0 0 0 0 0 0 0 0
[ 0 - 3M [[ 3M - 1Y [[ 1Y - 2Y [[ 2Y - 3Y [[3Y - 5Y [
[5Y - 10Y [[10Y - more
Total 0 0 0 0 0 0 0 0 0 0 0 0 0 0
[ 0 - 3M [[ 3M - 1Y [[ 1Y - 2Y [[ 2Y - 3Y [[3Y - 5Y [
[5Y - 10Y [[10Y - more
Total 0 0 0 0 0 0 0 0 0 0 0 0 0 0
[ 0 - 3M [[ 3M - 1Y [[ 1Y - 2Y [[ 2Y - 3Y [[3Y - 5Y [
[5Y - 10Y [[10Y - more
Total 0 0 0 0 0 0 0 0 0 0 0 0 0 0
[ 0 - 3M [ -12 0[ 3M - 1Y [ 23 23 23 16 19[ 1Y - 2Y [ 7 7 7[ 2Y - 3Y [[3Y - 5Y [
[5Y - 10Y [[10Y - more
Total 30 0 30 30 0 0 5 20 0 0 0 0 0 0
United Kingdom
Iceland
Liechtenstein
Norway
Australia
Canada
Hong Kong
Japan
U.S.

(mln EUR)
Austria
Fair-value (-) Notional value Fair-value (+) Notional value Fair-value (-)
INDIRECT SOVEREIGN EXPOSURES (3) (on and off balance sheet)
Derivatives with positive fair valueDerivatives with negative fair
value
2015 EU-wide Transparency Exercise
Sovereign Exposure
Banco Popolare Società Cooperativa
As of 31/12/2014
Residual Maturity Country / Region
GROSS DIRECT LONG
EXPOSURES (accounting value
gross of provisions)
(1)
NET DIRECT POSITIONS (gross exposures (long) net of cash short
positions of sovereign debt to other counterpaties only where there
is a maturity matching)
(1)
DIRECT SOVEREIGN EXPOSURES IN DERIVATIVES (1)
of which: loans
and advances
of which: AFS
banking book
of which: FVO
(designated at fair
value through
profit&loss)
banking book
of which: Financial
assets held for
trading
(2)
Notional value Fair-value (+) Notional value
Derivatives with positive fair value Derivatives with negative fair value
[ 0 - 3M [[ 3M - 1Y [[ 1Y - 2Y [[ 2Y - 3Y [[3Y - 5Y [
[5Y - 10Y [[10Y - more
Total 0 0 0 0 0 0 0 0 0 0 0 0 0 0
[ 0 - 3M [[ 3M - 1Y [[ 1Y - 2Y [[ 2Y - 3Y [[3Y - 5Y [
[5Y - 10Y [[10Y - more
Total 0 0 0 0 0 0 0 0 0 0 0 0 0 0
[ 0 - 3M [[ 3M - 1Y [[ 1Y - 2Y [[ 2Y - 3Y [[3Y - 5Y [
[5Y - 10Y [[10Y - more
Total 0 0 0 0 0 0 0 0 0 0 0 0 0 0
[ 0 - 3M [[ 3M - 1Y [[ 1Y - 2Y [[ 2Y - 3Y [[3Y - 5Y [
[5Y - 10Y [[10Y - more
Total 0 0 0 0 0 0 0 0 0 0 0 0 0 0
[ 0 - 3M [[ 3M - 1Y [[ 1Y - 2Y [[ 2Y - 3Y [[3Y - 5Y [
[5Y - 10Y [[10Y - more
Total 0 0 0 0 0 0 0 0 0 0 0 0 0 0
[ 0 - 3M [[ 3M - 1Y [[ 1Y - 2Y [[ 2Y - 3Y [[3Y - 5Y [
[5Y - 10Y [[10Y - more
Total 0 0 0 0 0 0 0 0 0 0 0 0 0 0
[ 0 - 3M [[ 3M - 1Y [[ 1Y - 2Y [[ 2Y - 3Y [[3Y - 5Y [
[5Y - 10Y [[10Y - more
Total 0 0 0 0 0 0 0 0 0 0 0 0 0 0
[ 0 - 3M [
[ 3M - 1Y [
[ 1Y - 2Y [
[ 2Y - 3Y [
[3Y - 5Y [
[5Y - 10Y [
[10Y - more
Total 0 0 0 0 0 0 0 0 0 0 0 0 0 0
Notes and definitions(1) The exposures reported cover only exposures to central, regional and local governments on immediate borrower basis, and do not include exposures to other counterparts with full or partial government guarantees (2) The banks disclose the exposures in the "Financial assets held for trading" portfolio after offsetting the cash short positions having the same maturities. (3) The exposures reported include the positions towards counterparts (other than sovereign) on sovereign credit risk (i.e. CDS, financial guarantees) booked in all the accounting portfolio (on-off balance sheet). Irrespective of the denomination and or accounting classification of the positions the economic substance over the form must be used as a criteria for the identification of the exposures to be included in this column. This item does not include exposures to counterparts (other than sovereign) with full or partial government guarantees by central, regional and local governments
Others
Switzerland
Other advanced economies
non EEA
Other Central and eastern
Europe countries non EEA
Middle East
Latin America and the
Caribbean
Africa
China

(mln EUR)
[ 0 - 3M [[ 3M - 1Y [[ 1Y - 2Y [[ 2Y - 3Y [[3Y - 5Y [
[5Y - 10Y [[10Y - more
Total
[ 0 - 3M [[ 3M - 1Y [[ 1Y - 2Y [[ 2Y - 3Y [[3Y - 5Y [
[5Y - 10Y [[10Y - more
Total
[ 0 - 3M [[ 3M - 1Y [[ 1Y - 2Y [[ 2Y - 3Y [[3Y - 5Y [
[5Y - 10Y [[10Y - more
Total
[ 0 - 3M [[ 3M - 1Y [[ 1Y - 2Y [[ 2Y - 3Y [[3Y - 5Y [
[5Y - 10Y [[10Y - more
Total
[ 0 - 3M [[ 3M - 1Y [[ 1Y - 2Y [[ 2Y - 3Y [[3Y - 5Y [
[5Y - 10Y [[10Y - more
Total
[ 0 - 3M [[ 3M - 1Y [[ 1Y - 2Y [[ 2Y - 3Y [[3Y - 5Y [
[5Y - 10Y [[10Y - more
Total
[ 0 - 3M [[ 3M - 1Y [[ 1Y - 2Y [[ 2Y - 3Y [[3Y - 5Y [
[5Y - 10Y [[10Y - more
Total
[ 0 - 3M [[ 3M - 1Y [[ 1Y - 2Y [[ 2Y - 3Y [[3Y - 5Y [
[5Y - 10Y [[10Y - more
Total
[ 0 - 3M [[ 3M - 1Y [[ 1Y - 2Y [[ 2Y - 3Y [[3Y - 5Y [
[5Y - 10Y [[10Y - more
Total
Belgium
Bulgaria
Cyprus
Czech Republic
Denmark
Estonia
Finland
France
Austria
2015 EU-wide Transparency Exercise
Sovereign Exposure
Banco Popolare Società Cooperativa
Residual Maturity Country / Region
2 2
2 0 2 0 0 0 0 0 0 0 0 0 0 0
0 0 0 0 0 0 0 0 0 0 0 0 0 0
0 0 0 0 0 0 0 0 0 0 0 0 0 0
0 0 0 0 0 0 0 0 0 0 0 0 0 0
0 0 0 0 0 0 0 0 0 0 0 0 0 0
0 0 0 0 0 0 0 0 0 0 0 0 0 0
0 0 0 0 0 0 0 0 0 0 0 0 0 0
0 0 0 0 0 0 0 0 0 0 0 0 0 0
0 0 0 0 0 0 0 0 0 0 0 0 0 0
Fair-value (-) Notional value Fair-value (+) Notional value Fair-value (-)of which: AFS
banking book
of which: FVO
(designated at fair
value through
profit&loss)
banking book
of which: Financial
assets held for
trading
(2)
Notional value Fair-value (+) Notional valueof which: loans
and advances
GROSS DIRECT LONG
EXPOSURES (accounting value
gross of provisions)
(1)
NET DIRECT POSITIONS (gross exposures (long) net of cash short
positions of sovereign debt to other counterpaties only where there
is a maturity matching)
(1)
DIRECT SOVEREIGN EXPOSURES IN DERIVATIVES (1) INDIRECT SOVEREIGN EXPOSURES (3) (on and off balance sheet)
Derivatives with positive fair value Derivatives with negative fair value Derivatives with positive fair valueDerivatives with negative fair
value
As of 30/06/2015

(mln EUR)
[ 0 - 3M [
Austria
2015 EU-wide Transparency Exercise
Sovereign Exposure
Banco Popolare Società Cooperativa
Residual Maturity Country / Region
[ 0 - 3M [[ 3M - 1Y [[ 1Y - 2Y [[ 2Y - 3Y [[3Y - 5Y [
[5Y - 10Y [[10Y - more
Total
[ 0 - 3M [[ 3M - 1Y [[ 1Y - 2Y [[ 2Y - 3Y [[3Y - 5Y [
[5Y - 10Y [[10Y - more
Total
[ 0 - 3M [[ 3M - 1Y [[ 1Y - 2Y [[ 2Y - 3Y [[3Y - 5Y [
[5Y - 10Y [[10Y - more
Total
[ 0 - 3M [[ 3M - 1Y [[ 1Y - 2Y [[ 2Y - 3Y [[3Y - 5Y [
[5Y - 10Y [[10Y - more
Total
[ 0 - 3M [[ 3M - 1Y [[ 1Y - 2Y [[ 2Y - 3Y [[3Y - 5Y [
[5Y - 10Y [[10Y - more
Total
[ 0 - 3M [[ 3M - 1Y [[ 1Y - 2Y [[ 2Y - 3Y [[3Y - 5Y [
[5Y - 10Y [[10Y - more
Total
[ 0 - 3M [[ 3M - 1Y [[ 1Y - 2Y [[ 2Y - 3Y [[3Y - 5Y [
[5Y - 10Y [[10Y - more
Total
[ 0 - 3M [[ 3M - 1Y [[ 1Y - 2Y [[ 2Y - 3Y [[3Y - 5Y [
[5Y - 10Y [[10Y - more
Total
[ 0 - 3M [[ 3M - 1Y [[ 1Y - 2Y [[ 2Y - 3Y [[3Y - 5Y [
[5Y - 10Y [[10Y - more
Total
Ireland
Italy
Latvia
Lithuania
Luxembourg
Hungary
Germany
Croatia
Greece
Fair-value (-) Notional value Fair-value (+) Notional value Fair-value (-)of which: AFS
banking book
of which: FVO
(designated at fair
value through
profit&loss)
banking book
of which: Financial
assets held for
trading
(2)
Notional value Fair-value (+) Notional valueof which: loans
and advances
GROSS DIRECT LONG
EXPOSURES (accounting value
gross of provisions)
(1)
NET DIRECT POSITIONS (gross exposures (long) net of cash short
positions of sovereign debt to other counterpaties only where there
is a maturity matching)
(1)
DIRECT SOVEREIGN EXPOSURES IN DERIVATIVES (1) INDIRECT SOVEREIGN EXPOSURES (3) (on and off balance sheet)
Derivatives with positive fair value Derivatives with negative fair value Derivatives with positive fair valueDerivatives with negative fair
value
As of 30/06/2015
2 3 -86 -64
19 19 19
13 13 1331 0 31 0 0 31 2 3 -86 -64 0 0 0 0
0 0 0 0 0 0 0 0 0 0 0 0 0 0
0 0 0 0 0 0 0 0 0 0 0 0 0 0
0 0 0 0 0 0 0 0 0 0 0 0 0 0
0 0 0 0 0 0 0 0 0 0 0 0 0 0
0 0 0 0 -288 -3243,162 3,162 2,067 7245,769 5,769 3,383 1,0814,375 4,375 2,702 4043,957 3,957 2,390 1211,384 1,384
18,647 0 18,647 10,542 0 2,330 0 0 -288 -324 0 0 0 0
0 0 0 0 0 0 0 0 0 0 0 0 0 0
0 0 0 0 0 0 0 0 0 0 0 0 0 0
0 0 0 0 0 0 0 0 0 0 0 0 0 0

(mln EUR)
[ 0 - 3M [
Austria
2015 EU-wide Transparency Exercise
Sovereign Exposure
Banco Popolare Società Cooperativa
Residual Maturity Country / Region
[ 0 - 3M [[ 3M - 1Y [[ 1Y - 2Y [[ 2Y - 3Y [[3Y - 5Y [
[5Y - 10Y [[10Y - more
Total
[ 0 - 3M [[ 3M - 1Y [[ 1Y - 2Y [[ 2Y - 3Y [[3Y - 5Y [
[5Y - 10Y [[10Y - more
Total
[ 0 - 3M [[ 3M - 1Y [[ 1Y - 2Y [[ 2Y - 3Y [[3Y - 5Y [
[5Y - 10Y [[10Y - more
Total
[ 0 - 3M [[ 3M - 1Y [[ 1Y - 2Y [[ 2Y - 3Y [[3Y - 5Y [
[5Y - 10Y [[10Y - more
Total
[ 0 - 3M [[ 3M - 1Y [[ 1Y - 2Y [[ 2Y - 3Y [[3Y - 5Y [
[5Y - 10Y [[10Y - more
Total
[ 0 - 3M [[ 3M - 1Y [[ 1Y - 2Y [[ 2Y - 3Y [[3Y - 5Y [
[5Y - 10Y [[10Y - more
Total
[ 0 - 3M [[ 3M - 1Y [[ 1Y - 2Y [[ 2Y - 3Y [[3Y - 5Y [
[5Y - 10Y [[10Y - more
Total
[ 0 - 3M [[ 3M - 1Y [[ 1Y - 2Y [[ 2Y - 3Y [[3Y - 5Y [
[5Y - 10Y [[10Y - more
Total
[ 0 - 3M [[ 3M - 1Y [[ 1Y - 2Y [[ 2Y - 3Y [[3Y - 5Y [
[5Y - 10Y [[10Y - more
Total
Spain
Sweden
Slovenia
Malta
Netherlands
Poland
Portugal
Romania
Slovakia
Fair-value (-) Notional value Fair-value (+) Notional value Fair-value (-)of which: AFS
banking book
of which: FVO
(designated at fair
value through
profit&loss)
banking book
of which: Financial
assets held for
trading
(2)
Notional value Fair-value (+) Notional valueof which: loans
and advances
GROSS DIRECT LONG
EXPOSURES (accounting value
gross of provisions)
(1)
NET DIRECT POSITIONS (gross exposures (long) net of cash short
positions of sovereign debt to other counterpaties only where there
is a maturity matching)
(1)
DIRECT SOVEREIGN EXPOSURES IN DERIVATIVES (1) INDIRECT SOVEREIGN EXPOSURES (3) (on and off balance sheet)
Derivatives with positive fair value Derivatives with negative fair value Derivatives with positive fair valueDerivatives with negative fair
value
As of 30/06/2015
0 0 0 0 0 0 0 0 0 0 0 0 0 0
0 0 0 0 0 0 0 0 0 0 0 0 0 0
0 0 0 0 0 0 0 0 0 0 0 0 0 0
0 0 0 0 0 0 0 0 0 0 0 0 0 0
0 0 0 0 0 0 0 0 0 0 0 0 0 0
0 0 0 0 0 0 0 0 0 0 0 0 0 0
0 0 0 0 0 0 0 0 0 0 0 0 0 0
0 0 0 0 0 0 0 0 0 0 0 0 0 0
0 0 0 0 0 0 0 0 0 0 0 0 0 0

(mln EUR)
[ 0 - 3M [
Austria
2015 EU-wide Transparency Exercise
Sovereign Exposure
Banco Popolare Società Cooperativa
Residual Maturity Country / Region
[ 0 - 3M [[ 3M - 1Y [[ 1Y - 2Y [[ 2Y - 3Y [[3Y - 5Y [
[5Y - 10Y [[10Y - more
Total
[ 0 - 3M [[ 3M - 1Y [[ 1Y - 2Y [[ 2Y - 3Y [[3Y - 5Y [
[5Y - 10Y [[10Y - more
Total
[ 0 - 3M [[ 3M - 1Y [[ 1Y - 2Y [[ 2Y - 3Y [[3Y - 5Y [
[5Y - 10Y [[10Y - more
Total
[ 0 - 3M [[ 3M - 1Y [[ 1Y - 2Y [[ 2Y - 3Y [[3Y - 5Y [
[5Y - 10Y [[10Y - more
Total
[ 0 - 3M [[ 3M - 1Y [[ 1Y - 2Y [[ 2Y - 3Y [[3Y - 5Y [
[5Y - 10Y [[10Y - more
Total
[ 0 - 3M [[ 3M - 1Y [[ 1Y - 2Y [[ 2Y - 3Y [[3Y - 5Y [
[5Y - 10Y [[10Y - more
Total
[ 0 - 3M [[ 3M - 1Y [[ 1Y - 2Y [[ 2Y - 3Y [[3Y - 5Y [
[5Y - 10Y [[10Y - more
Total
[ 0 - 3M [[ 3M - 1Y [[ 1Y - 2Y [[ 2Y - 3Y [[3Y - 5Y [
[5Y - 10Y [[10Y - more
Total
[ 0 - 3M [[ 3M - 1Y [[ 1Y - 2Y [[ 2Y - 3Y [[3Y - 5Y [
[5Y - 10Y [[10Y - more
Total
United Kingdom
Iceland
Liechtenstein
Norway
Australia
Canada
Hong Kong
Japan
U.S.
Fair-value (-) Notional value Fair-value (+) Notional value Fair-value (-)of which: AFS
banking book
of which: FVO
(designated at fair
value through
profit&loss)
banking book
of which: Financial
assets held for
trading
(2)
Notional value Fair-value (+) Notional valueof which: loans
and advances
GROSS DIRECT LONG
EXPOSURES (accounting value
gross of provisions)
(1)
NET DIRECT POSITIONS (gross exposures (long) net of cash short
positions of sovereign debt to other counterpaties only where there
is a maturity matching)
(1)
DIRECT SOVEREIGN EXPOSURES IN DERIVATIVES (1) INDIRECT SOVEREIGN EXPOSURES (3) (on and off balance sheet)
Derivatives with positive fair value Derivatives with negative fair value Derivatives with positive fair valueDerivatives with negative fair
value
As of 30/06/2015
0 0 0 0 0 0 0 0 0 0 0 0 0 0
0 0 0 0 0 0 0 0 0 0 0 0 0 0
0 0 0 0 0 0 0 0 0 0 0 0 0 0
0 0 0 0 0 0 0 0 0 0 0 0 0 0
0 0 0 0 0 0 0 0 0 0 0 0 0 0
0 0 0 0 0 0 0 0 0 0 0 0 0 0
0 0 0 0 0 0 0 0 0 0 0 0 0 0
0 0 0 0 0 0 0 0 0 0 0 0 0 0
8 8 8 20 25
8 0 8 8 0 0 20 25 0 0 0 0 0 0
(mln EUR)
[ 0 - 3M [
Austria
2015 EU-wide Transparency Exercise
Sovereign Exposure
Banco Popolare Società Cooperativa
Residual Maturity Country / Region
[ 0 - 3M [[ 3M - 1Y [[ 1Y - 2Y [[ 2Y - 3Y [[3Y - 5Y [
[5Y - 10Y [[10Y - more
Total
[ 0 - 3M [[ 3M - 1Y [[ 1Y - 2Y [[ 2Y - 3Y [[3Y - 5Y [
[5Y - 10Y [[10Y - more
Total
[ 0 - 3M [[ 3M - 1Y [[ 1Y - 2Y [[ 2Y - 3Y [[3Y - 5Y [
[5Y - 10Y [[10Y - more
Total
[ 0 - 3M [[ 3M - 1Y [[ 1Y - 2Y [[ 2Y - 3Y [[3Y - 5Y [
[5Y - 10Y [[10Y - more
Total
[ 0 - 3M [[ 3M - 1Y [[ 1Y - 2Y [[ 2Y - 3Y [[3Y - 5Y [
[5Y - 10Y [[10Y - more
Total
[ 0 - 3M [[ 3M - 1Y [[ 1Y - 2Y [[ 2Y - 3Y [[3Y - 5Y [
[5Y - 10Y [[10Y - more
Total
[ 0 - 3M [[ 3M - 1Y [[ 1Y - 2Y [[ 2Y - 3Y [[3Y - 5Y [
[5Y - 10Y [[10Y - more
Total
[ 0 - 3M [
[ 3M - 1Y [
[ 1Y - 2Y [
[ 2Y - 3Y [
[3Y - 5Y [
[5Y - 10Y [
[10Y - more
Total
Others
Switzerland
Other advanced economies
non EEA
Other Central and eastern
Europe countries non EEA
Middle East
Latin America and the
Caribbean
Africa
China
Fair-value (-) Notional value Fair-value (+) Notional value Fair-value (-)of which: AFS
banking book
of which: FVO
(designated at fair
value through
profit&loss)
banking book
of which: Financial
assets held for
trading
(2)
Notional value Fair-value (+) Notional valueof which: loans
and advances
GROSS DIRECT LONG
EXPOSURES (accounting value
gross of provisions)
(1)
NET DIRECT POSITIONS (gross exposures (long) net of cash short
positions of sovereign debt to other counterpaties only where there
is a maturity matching)
(1)
DIRECT SOVEREIGN EXPOSURES IN DERIVATIVES (1) INDIRECT SOVEREIGN EXPOSURES (3) (on and off balance sheet)
Derivatives with positive fair value Derivatives with negative fair value Derivatives with positive fair valueDerivatives with negative fair
value
As of 30/06/2015
0 0 0 0 0 0 0 0 0 0 0 0 0 0
0 0 0 0 0 0 0 0 0 0 0 0 0 0
0 0 0 0 0 0 0 0 0 0 0 0 0 0
0 0 0 0 0 0 0 0 0 0 0 0 0 0
0 0 0 0 0 0 0 0 0 0 0 0 0 0
0 0 0 0 0 0 0 0 0 0 0 0 0 0
0 0 0 0 0 0 0 0 0 0 0 0 0 0
0 0 0 0 0 0 0 0 0 0 0 0 0 0
Notes and definitions(1) The exposures reported cover only exposures to central, regional and local governments on immediate borrower basis, and do not include exposures to other counterparts with full or partial government guarantees (2) The banks disclose the exposures in the "Financial assets held for trading" portfolio after offsetting the cash short positions having the same maturities. (3) The exposures reported include the positions towards counterparts (other than sovereign) on sovereign credit risk (i.e. CDS, financial guarantees) booked in all the accounting portfolio (on-off balance sheet). Irrespective of the denomination and or accounting classification of the positions the economic substance over the form must be used as a criteria for the identification of the exposures to be included in this column. This item does not include exposures to counterparts (other than sovereign) with full or partial government guarantees by central, regional and local governments
201412 201412 201412 201412 201412 201412 201412 201506 201506 201506 201506 201506 201506 201506
(mln EUR, %)
Of which:
defaulted
Of which:
defaulted
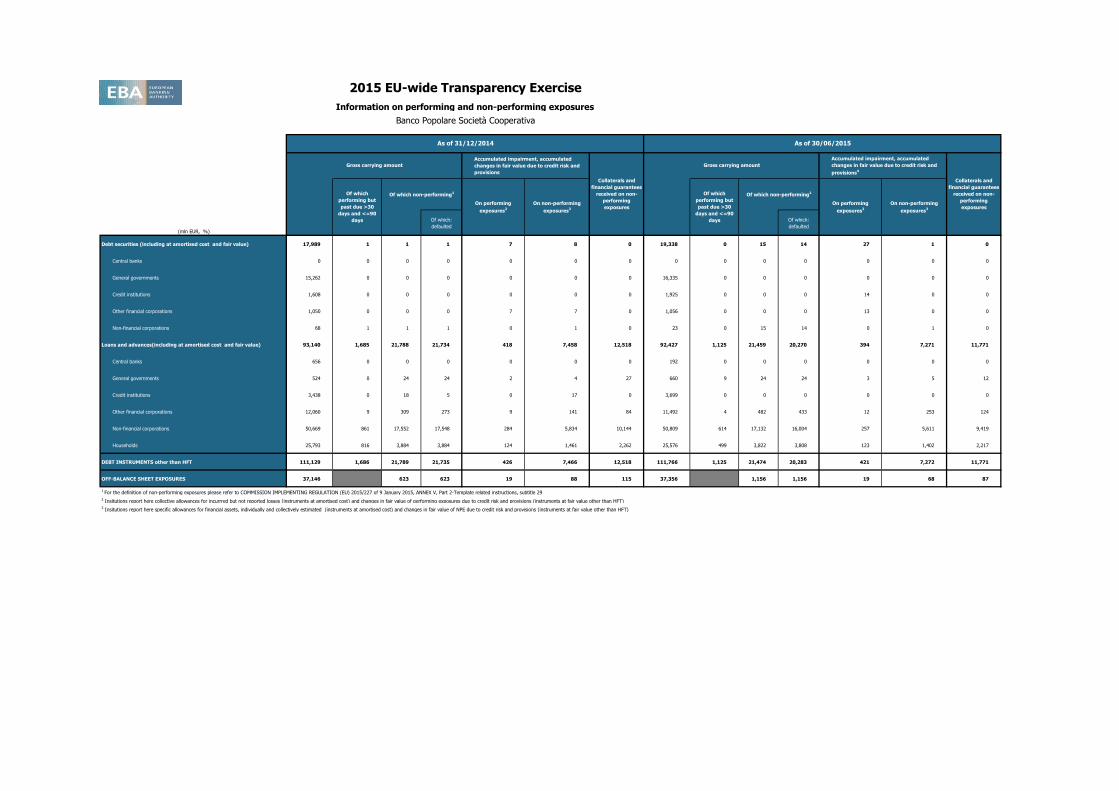
Debt securities (including at amortised cost and fair value) 17,989 1 1 1 7 8 0 19,338 0 15 14 27 1 0
Central banks 0 0 0 0 0 0 0 0 0 0 0 0 0 0
General governments 15,262 0 0 0 0 0 0 16,335 0 0 0 0 0 0
Credit institutions 1,608 0 0 0 0 0 0 1,925 0 0 0 14 0 0
Other financial corporations 1,050 0 0 0 7 7 0 1,056 0 0 0 13 0 0
Non-financial corporations 68 1 1 1 0 1 0 23 0 15 14 0 1 0
Loans and advances(including at amortised cost and fair value) 93,140 1,685 21,788 21,734 418 7,458 12,518 92,427 1,125 21,459 20,270 394 7,271 11,771
Central banks 656 0 0 0 0 0 0 192 0 0 0 0 0 0
General governments 524 0 24 24 2 4 27 660 9 24 24 3 5 12
Credit institutions 3,438 0 18 5 0 17 0 3,699 0 0 0 0 0 0
Other financial corporations 12,060 9 309 273 9 141 84 11,492 4 482 433 12 253 124
Non-financial corporations 50,669 861 17,552 17,548 284 5,834 10,144 50,809 614 17,132 16,004 257 5,611 9,419
Households 25,793 816 3,884 3,884 124 1,461 2,262 25,576 499 3,822 3,808 123 1,402 2,217
DEBT INSTRUMENTS other than HFT 111,129 1,686 21,789 21,735 426 7,466 12,518 111,766 1,125 21,474 20,283 421 7,272 11,771
OFF-BALANCE SHEET EXPOSURES 37,146 623 623 19 88 115 37,356 1,156 1,156 19 68 87
1 For the definition of non-performing exposures please refer to COMMISSION IMPLEMENTING REGULATION (EU) 2015/227 of 9 January 2015, ANNEX V, Part 2-Template related instructions, subtitle 29
2 Insitutions report here collective allowances for incurrred but not reported losses (instruments at amortised cost) and changes in fair value of performing exposures due to credit risk and provisions (instruments at fair value other than HFT)
3 Insitutions report here specific allowances for financial assets, individually and collectively estimated (instruments at amortised cost) and changes in fair value of NPE due to credit risk and provisions (instruments at fair value other than HFT)
On non-performing
exposures3
Of which
performing but
past due >30
days and <=90
days
Of which non-performing1
On performing
exposures2
On non-performing
exposures3
Collaterals and
financial guarantees
received on non-
performing
exposures
Gross carrying amount
Accumulated impairment, accumulated
changes in fair value due to credit risk and
provisions
Collaterals and
financial guarantees
received on non-
performing
exposures
Gross carrying amount
Accumulated impairment, accumulated
changes in fair value due to credit risk and
provisions4
Of which
performing but
past due >30
days and <=90
days
Of which non-performing1
On performing
exposures2
2015 EU-wide Transparency Exercise
Information on performing and non-performing exposures
Banco Popolare Società Cooperativa
As of 31/12/2014 As of 30/06/2015

201412 201412 201412 201412 201412 201506 201506 201506 201506 201506
(mln EUR, %)
Debt securities (including at amortised cost and fair value) 0 0 0 0 0 0 0 0 0 0
Central banks 0 0 0 0 0 0 0 0 0 0
General governments 0 0 0 0 0 0 0 0 0 0
Credit institutions 0 0 0 0 0 0 0 0 0 0
Other financial corporations 0 0 0 0 0 0 0 0 0 0
Non-financial corporations 0 0 0 0 0 0 0 0 0 0
Loans and advances (including at amortised cost and fair value) 3,697 3,096 796 778 1,969 6,197 3,268 924 868 4,643
Central banks 0 0 0 0 0 0 0 0 0 0
General governments 0 0 0 0 0 0 0 0 0 0
Credit institutions 0 0 0 0 0 0 0 0 0 0
Other financial corporations 101 101 38 38 0 210 173 94 94 35
Non-financial corporations 3,383 2,931 749 735 1,769 5,084 2,976 803 764 3,753
Households 213 63 9 4 200 903 119 27 11 856
DEBT INSTRUMENTS other than HFT 3,697 3,096 796 778 1,969 6,197 3,268 924 868 4,643
Loan commitments given 41 38 0 0 12 120 71 0 0 23
1 For the definition of forborne exposures please refer to COMMISSION IMPLEMENTING REGULATION (EU) 2015/227 of 9 January 2015, ANNEX V, Part 2-Template related instructions, subtitle 30
Collateral and financial
guarantees received on
exposures with
forbearance measures
Of which non-
performing exposures
with forbearance
measures
Of which on non-
performing exposures
with forbearance
measures
Of which non-
performing exposures
with forbearance
measures
Of which on non-
performing exposures
with forbearance
measures
Gross carrying amount of exposures with
forbearance measures
Accumulated impairment, accumulated
changes in fair value due to credit risk and
provisions for exposures with forbearance
measures Collateral and financial
guarantees received on
exposures with
forbearance measures
Gross carrying amount of exposures with
forbearance measures
Accumulated impairment, accumulated
changes in fair value due to credit risk and
provisions for exposures with forbearance
measures2
2015 EU-wide Transparency Exercise
Forborne Exposures
Banco Popolare Società Cooperativa
As of 31/12/2014 As of 30/06/2015

201412 201506
(mln EUR, %)As of
31/12/2014
As of
30/06/2015
Disclosure
Template CodeREGULATION
A Tier 1 capital 5,882 5,889 LRCom {20}
B Total leverage ratio exposures 123,164 121,506 LRCom {21}
C Leverage ratio 4.78% 4.85% A/B
2015 EU-wide Transparency ExerciseLeverage ratio
Banco Popolare Società Cooperativa
Article 429 of the CRR; Delegated Regulation (EU) 2015/62 of 10 October 2014 amending
CRR

201412 201412 201506 201506
(mln EUR, %)Carrying amount
Maximum amount of the
collateral that can be
considered1
Carrying amount
Maximum amount of the
collateral that can be
considered1
Loans and advances 37,767 37,644 37,035 36,897
of which: Other financial corporations 479 478 529 502
of which: Non-financial corporations 16,503 16,403 16,052 15,856
of which: Households 20,766 20,745 20,442 20,527
1This column includes information only on immovable property collaterals. In accordance with the ITS on supervisory reporting, the sum of the amounts of the collateral shall not exceed the carrying amount of the related loan.
Mortgage loans
[Loans collateralized by immovable property]
Mortgage loans
[Loans collateralized by immovable property]
2015 EU-wide Transparency ExerciseInformation on collaterals: Mortgage loans
Banco Popolare Società Cooperativa
As of 31/12/2014 As of 30/06/2015