Embed Size (px)
Citation preview
2015 full year results
9 March 2016

2015Outlook
2015Actual
2016Outlook
Solid delivery of full year 2015 outlook
Highlights
2015 outlook delivered, EBITDA at
upper end of outlook range
Dividend2 of 0.50 €/share as promised
No scrip dividend scheme for 2015
Outlook for 2016 is on pre-spin-off
basis3 and reflects recent commodity
prices & exchange rates
Reduction compared to 2015 due to
lower prices and volumes in generation
as well as disposal and FX effects
1
1. Adjusted for extraordinary effects
2. Proposed dividend
3. Legal notice: assuming a positive vote on the spin-off of a majority stake in Uniper at our AGM on June 8, 2016 and
assuming that the spin-off will become effective in 2016: 1. Our outlook for 2016 will have to be adjusted due to
changed scope of Future E.ON and accounting effects resulting from the spin-off. 2. In such case we expect our
outlook to be significantly lower. Further details will be communicated along with the publication of the spin-off
documents for the AGM. 3. Due to accounting effects this does not allow any conclusions on the expected EBITDA
and underlying net income for Uniper in 2016.
EBITDA1
€7.0-
7.6bn €7.6bn
€6.0-
6.5bn
Underlying net income1
2015Outlook
2015Actual
2016Outlook
€1.4-
1.8bn €1.6bn
€1.2-
1.6bn
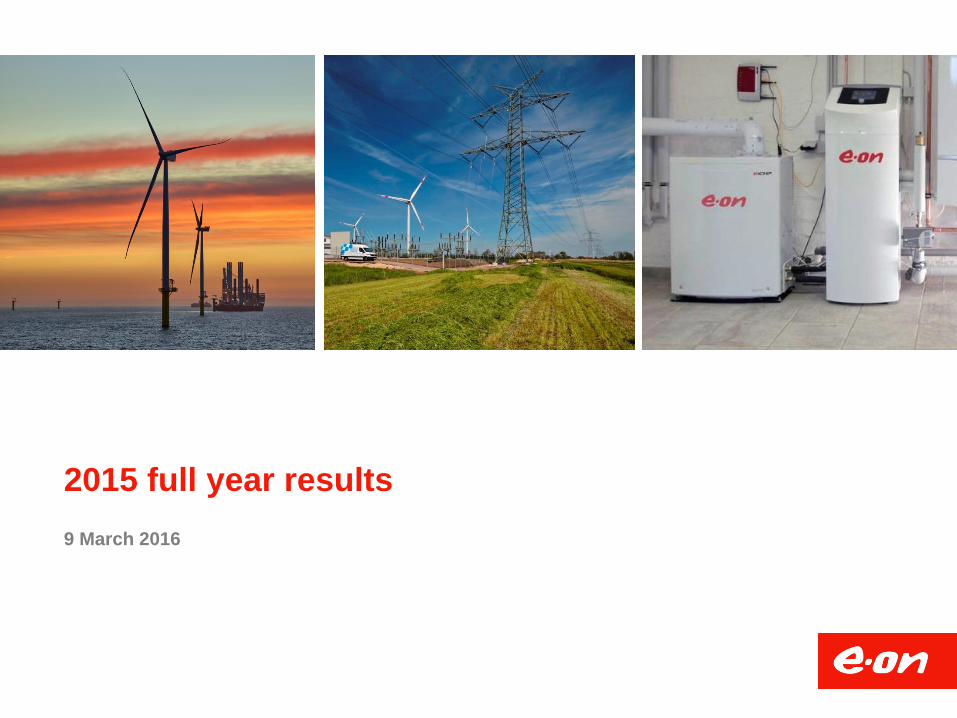
Spin-off update – Carve-out of Uniper delivered
2
E.ON and Uniper are organizationally
and legally separate companies
Delivery in quality, in time, and in budget, without hampering
business continuity, has been a major success
Carve-out and HR work streams
Q2 Q3 Q4
Carve-out implementation progress
>4,200
mile-
stones
Since 1 January 2016….
To operationally separate Future E.ON
and Uniper (so-called “day 1 readiness”)
more than 4,200 project milestones
needed to be achieved

Spin off – Key milestones
3
1 Jan 2016
E.ON and Uniper
organizational
separate
Carve-out
effective
Employees
allocated to
both
companies
Binding tax
rulings
obtained
26 Apr 2016
Apr/May 2016
8 Jun 2016
AGM decision H2 2016
Roadshows &
capital market
communication
BaFin approval
of Uniper
prospectus
Key milestones unchanged,
spin-off preparation stays on track
Capital market day
Equity story, incl.
strategy, KPIs,
dividend policy,
etc.
AGM invitation
Spin-off report:
detailed financial
& legal
documentation
Roadshows
Filing of Uniper
prospectus with
German
financial
regulator BaFin
H2 2
016
lis
tin
g
Focus has shifted towards the spin-off in a transaction sense

4
Adverse environment with significant impact
Strategic rationale intact,
but both companies have to adapt
Uniper Future E.ON
Investments and dividends in line with
financial means
Even stronger focus on financial discipline
and proper capital allocation
Measures to secure sustainable dividend
Maintain focus on operational excellence
and free cash flow generation
Strategic rationale to separate the two companies unchanged
Fundamental trends in technology and customer behaviors rather expedited
Deteriorating commodity price/FX environment
5
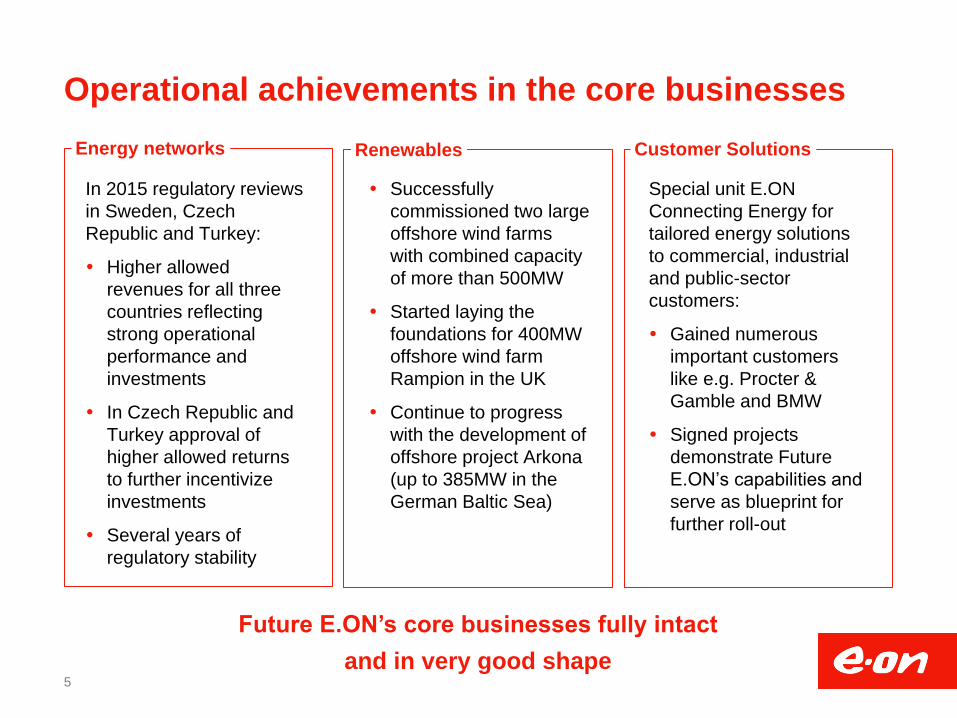
Operational achievements in the core businesses
Future E.ON’s core businesses fully intact
and in very good shape
Energy networks
In 2015 regulatory reviews
in Sweden, Czech
Republic and Turkey:
Higher allowed
revenues for all three
countries reflecting
strong operational
performance and
investments
In Czech Republic and
Turkey approval of
higher allowed returns
to further incentivize
investments
Several years of
regulatory stability
Customer Solutions Renewables
Successfully
commissioned two large
offshore wind farms
with combined capacity
of more than 500MW
Started laying the
foundations for 400MW
offshore wind farm
Rampion in the UK
Continue to progress
with the development of
offshore project Arkona
(up to 385MW in the
German Baltic Sea)
Special unit E.ON
Connecting Energy for
tailored energy solutions
to commercial, industrial
and public-sector
customers:
Gained numerous
important customers
like e.g. Procter &
Gamble and BMW
Signed projects
demonstrate Future
E.ON’s capabilities and
serve as blueprint for
further roll-out

Key takeaways
Amid continuously deteriorating commodity
environment and adverse FX developments,
2015 a year of some outstanding operational
achievements in the core businesses and in
preparing the spin-off of Uniper
Remain deeply convinced of our strategy and
spin-off of Uniper continues to be on track
Adverse environment with impact for the
set-up of Uniper
Even stronger focus on financial discipline
and proper capital allocation for Future E.ON
6
Visual of One2two project

2015 full year results
Michael Sen, CFO
March 9, 2016

40
50
60
70
80
90
100
110
120
01.01.2014 01.01.2015 01.01.2016
Nordpool
-37% EEX
-42% UK
-39%
Operating in a tough environment
8
0
20
40
60
80
100
120
01.01.2014 01.01.2015 01.01.2016
Oil
-61%
Coal
-57%
0
20
40
60
80
100
120
140
160
180
200
01.01.2014 01.01.2015 01.01.2016
CO2
-12%
Gas
-58%
0
20
40
60
80
100
120
01.01.2014 01.01.2015 01.01.2016
10Y Gov
-95% RUB/EUR
-55%

2015 accomplishments
Dividend confirmed & guidance achieved
9
FY15 FY14
EBITDA €7.0-7.6bn
€1.6
€7.6
UNI €1.4-1.8bn
€5.7bn
Economic net debt
DF1
3.7x
DF1 4.0x
Guidance met
2015 dividend confirmed: €0.5/ share
Economic net debt reduced: ~€5.7bn
Disposals: ~€4.5bn
Additional cost savings: €0.1bn
Cash conversion: 81%
1. Debt factor

EBITDA: commodity & disposals dominate 2015
10
FY 2015 7.6
Other -0.2
Disposals -0.5
E&P -0.2
Power portfolio -0.7
Region Germany 0.4
New capacities 0.3
FY 2014 8.4
Net cost savings 0.1
Full year 2015 (in €bn)
-0.8

UNI: D&A and taxes offset the EBITDA decline
11
€m 2014 2015 % YoY
EBITDA 1 8,376 7,557 -10
Depreciation/amortization recognized in EBIT 1 -3,681 -3,188 13
EBIT 1 4,695 4,369 -7
Economic interest expense (net) -1,613 -1,572 3
EBT 1 3,082 2,797 -9
Income taxes on EBT 1 -1,084 -776 -
% of EBT 1 35% 28% -
Non-controlling interests -352 -373 -
Underlying net income 1 1,646 1,648 0
1. Adjusted for extraordinary effects
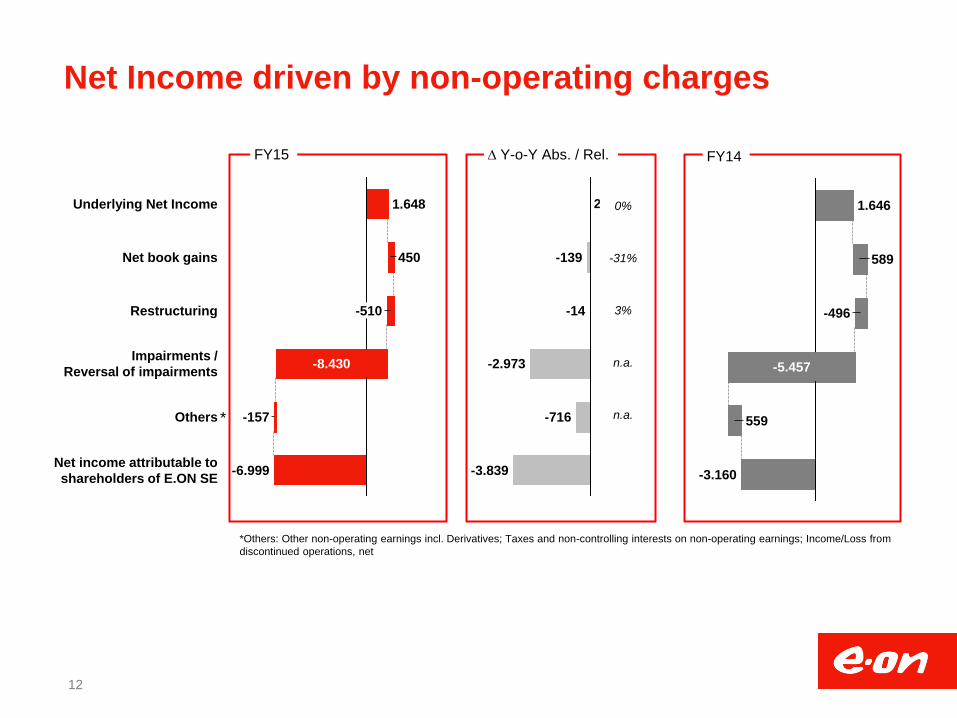
Net Income driven by non-operating charges
12
FY15 D Y-o-Y Abs. / Rel. FY14
Restructuring
450
Underlying Net Income 1.648
-510
Net book gains
Others
-8.430
Net income attributable to
shareholders of E.ON SE
-157
-6.999
Impairments /
Reversal of impairments
-3.160
559
-5.457
1.646
-496
589
2
-716
-3.839
-2.973
-14
-139
0%
-31%
3%
n.a.
n.a. *
*Others: Other non-operating earnings incl. Derivatives; Taxes and non-controlling interests on non-operating earnings; Income/Loss from
discontinued operations, net

Cash conversion rises to 81%
13
1. Adjusted for extraordinary effects 2. OCF from continuing operations 3. Cash Conversion Rate
9.7
Non-cash effective EBITDA items +2.1
Cash-effective EBITDA
6.1
Tax, interest & other -1.1
OCF after interest and tax
+0.1
Provision utilization -2.6
Working capital
movements
EBITDA 1 7.6
2
Full year 2015 (in €bn)
CCR3
81%

14
ARO= Asset retirement obligation; END = Economic net debt; NFP=Net financial position; B&S= Build and sell
+1.4
END
2015
+4.2
Dividend
-0.9
B&S
+0.3
Divest
+5.7
Provisions
-23.1
NFP
-4.6 -27.7
Others
-1.3
Pensions CAPEX
-4.2
OCF
+6.1
END
2014
-33.4
NFP
-8.8
Provisions
-24.6
Pensions
-5.6
ARO:
-19.0
Pensions:
-4.2
ARO:
-18.9
Cash Balance: +1.4
Economic net debt reduced by €5.7bn
Full Year 2015 (in €bn)

2016 segment outlook
15
€bn 2015A 2016E Comments
Generation 1.5 Significantly below: negative power prices, shut-
down of Grafenrheinfeld, disposals (Italy, Spain)
Renewables 1.3 Slightly below: lower hydro prices, disposals (Italy,
Spain), full-year contribution Humber & Amrumbank
Global Commodities 0.2 Significantly above: adjustment of transfer pricing
system
Exploration & Production 0.9 Significantly below: disposal of N.Sea portfolio,
negative BAFA price effects
Germany 2.2 Significantly below: absence of non-recurring
positive one-off effects
Other EU Countries 1.8 Significantly above: organic improvements; more
seasonally typical weather patterns
Non-EU Countries 0.3 Significantly below: lower Rubel exchange rate,
outage of Berezovskaja
EBITDA1 7.6 6.0 – 6.5
1. Adjusted for extraordinary effects

EBITDA
2016 Outlook: the challenges continue
UNI
€1.2-1.6bn
€6.0-6.5bn
Assuming a positive vote on the spin-off of a majority stake in Uniper at our AGM on June 8, 2016 and assuming
that the spin-off will become effective in 2016:
1. Our outlook for 2016 will have to be adjusted due to changed scope of future E.ON and accounting effects
resulting from the spin-off.
2. In such case we expect our outlook to be significantly lower. Further details will be communicated along with
the publication of the spin-off documents for the AGM.
3. Due to accounting effects this does not allow any conclusions on the expected EBITDA and underlying net
income for Uniper in 2016.
Legal notice
16

17
Commodity volatility is
unprecedented
Nuclear issues
remain unsolved
Our priorities
Focused Disciplined Striving
The challenges
Rating pressure
increases

Backup
18

Financial highlights
19
1. Adjusted for extraordinary effects
2. Operating cash flow from continuing activities
€m 2014 2015
Sales 113.095 116.218
EBITDA 1 8.376 7.557
EBIT 1 4.695 4.369
Underlying net income 1 1.646 1.648
Operating cash flow 2 6.354 6.133
Investments 4.637 4.174
Economic net debt -33.394 -27.714

EBITDA and EBIT by unit
20 1. Adjusted for extraordinary effects
€m
2014 2015 % YoY 2014 2015 % YoY
Generation 2,215 1,472 -34 1,201 745 -38
Renewables 1,500 1,346 -10 1,044 924 -11
Global Commodities 106 223 110 10 109 990
Exploration & Production 1,136 895 -21 498 389 -22
Germany 1,761 2,157 22 1,099 1,537 40
Other EU Countries 1,775 1,756 -1 1,166 1,119 -4
Non-EU Countries 439 322 -27 293 226 -23
Group Management /
Consolidation -556 -614 10 -616 -680 10
Total 8,376 7,557 -10 4,695 4,369 -7
EBITDA 1
EBIT 1

From EBITDA to Net Income
21 1. Adjusted for extraordinary effects
2014 2015 % YoY
EBITDA 1 8,376 7,557 -10
Depreciation/Amortization/Impairments -3,681 -3,188 -13
EBIT 1 4,695 4,369 -7
Economic interest expense (net) -1,613 -1,572 -3
Net book gains 589 450 -24
Restructuring -496 -510 3
Mark-to-market valuation of derivatives 540 533 -1
Impairments (net) -5,457 -8,430 54
Other non-operating earnings -656 -383 -42
Income/Loss from continuing operations before income taxes -2,398 -5,543 131
Income taxes -570 -835 46
Income/loss from discontinued operations, net -162 1 -101
Non-controlling interests -30 -622 1,973
Net income/loss attributable to shareholders of E.ON SE -3,160 -6,999 121
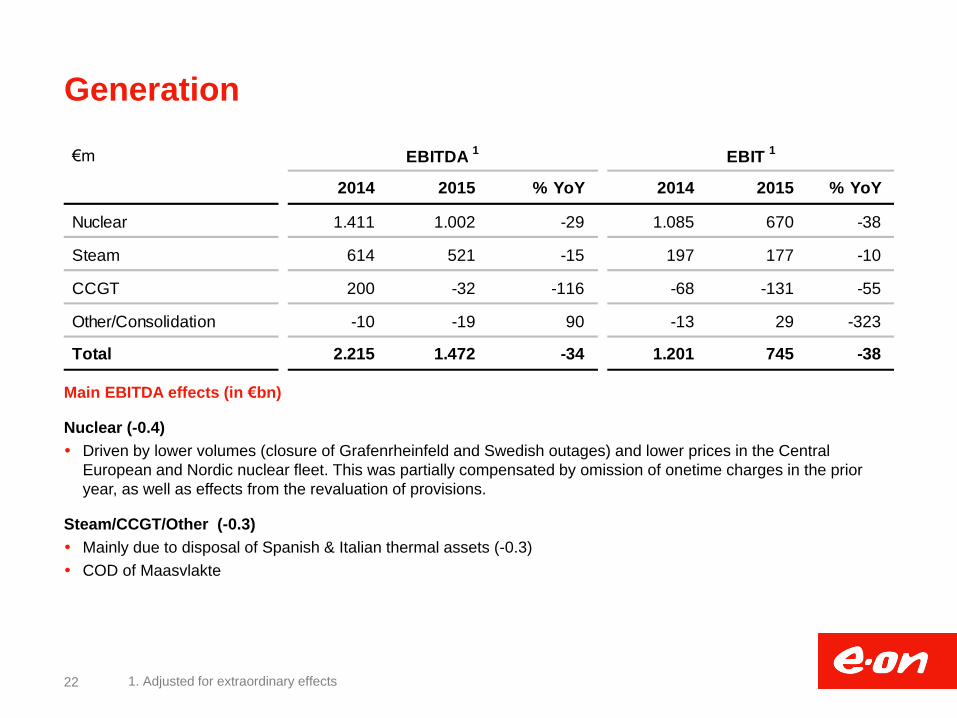
Generation
Main EBITDA effects (in €bn)
Nuclear (-0.4)
Driven by lower volumes (closure of Grafenrheinfeld and Swedish outages) and lower prices in the Central
European and Nordic nuclear fleet. This was partially compensated by omission of onetime charges in the prior
year, as well as effects from the revaluation of provisions.
Steam/CCGT/Other (-0.3)
Mainly due to disposal of Spanish & Italian thermal assets (-0.3)
COD of Maasvlakte
22 1. Adjusted for extraordinary effects
€m
2014 2015 % YoY 2014 2015 % YoY
Nuclear 1.411 1.002 -29 1.085 670 -38
Steam 614 521 -15 197 177 -10
CCGT 200 -32 -116 -68 -131 -55
Other/Consolidation -10 -19 90 -13 29 -323
Total 2.215 1.472 -34 1.201 745 -38
EBITDA 1
EBIT 1

Renewables
Main EBITDA effects (in €bn)
Hydro (-0.1)
Lower prices in all markets (-0.1)
Disposal of Spanish & Italian hydro assets
Wind/Solar/Other (-0.1)
Lower book gains from capital rotation mainly linked to disposal of Rødsand II offshore wind farm in Q1 2014 and
US Onshore disposal in Q4 2014 (-0.2)
COD of Humber and Amrumbank offshore wind farms (+0.1)
23 1. Adjusted for extraordinary effects
€m
2014 2015 % YoY 2014 2015 % YoY
Hydro 677 566 -16 551 509 -8
Wind/Solar/Other 823 780 -5 493 415 -16
Total 1.500 1.346 -10 1.044 924 -11
EBITDA 1
EBIT 1

Global Commodities
Main EBITDA effects (in €bn)
Power and Gas (0.1)
Unwind of CO2 phasing effect in Q4
Gas and power optimization (+0.1)
24 1. Adjusted for extraordinary effects
€m
2014 2015 % YoY 2014 2015 % YoY
Coal/Oil/Freight/LNG 29 29 0 29 29 0
Power and Gas -60 45 -175 -151 -63 -58
Infrastructure/Other 137 149 9 132 143 8
Total 106 223 110 10 109 990
EBITDA 1
EBIT 1

Exploration & Production
Main EBITDA effects (in €bn)
North Sea fields (-0.2)
Lower margins due to falling oil and gas prices partly compensated by slightly higher volumes and FX effects (-0.2)
Yushno Russkoje (-0.1)
Reduction mainly due lower BAFA price
25 1. Adjusted for extraordinary effects
€m
2014 2015 % YoY 2014 2015 % YoY
Total 1.136 895 -21 498 389 -22
EBITDA 1
EBIT 1

Germany
Main EBITDA effects (in €bn)
Distribution Networks (+0.2)
Positive onetime effects related to the release of provisions
Also due to higher volumes based on weather normalization compared to the warm winter last year
Non-regulated/Other (+0.2)
Improved gross margin in particular because of a comparatively colder winter and the resulting positive effects in
the sales and heating businesses
Earnings also benefited from positive non-recurring effects relating to a reduction in risk provisions
26 1. Adjusted for extraordinary effects
€m
2014 2015 % YoY 2014 2015 % YoY
Distribution 1.525 1.686 11 953 1.129 18
Non-regulated/Other 236 471 100 146 408 179
Total 1.761 2.157 22 1.099 1.537 40
EBITDA 1
EBIT 1

Other EU Countries
Main EBITDA effects (in €bn)
Distribution Networks (+/-0)
Mainly higher tariffs in gas segment Romania and lower network losses in Hungary
Sales (+/-0)
UK margin pressure offset by favorable FX development
Mainly lower margin in Hungary
27 1. Adjusted for extraordinary effects
€m
2014 2015 % YoY 2014 2015 % YoY
Distribution 1.002 1.031 3 641 669 4
Sales 551 507 -8 465 386 -17
Other/Consolidation 223 218 -2 60 64 7
Total 1.775 1.756 -1 1.166 1.119 -4
EBITDA 1
EBIT 1

Non-EU Countries
Main EBITDA effects (in €bn)
Russia (-0.2)
Mainly due to negative currency translation impact (-0.1)
Lower result in local currency mainly a result of lower profitability at the plant Surgutskaya due to an accident and
due to penalty payments for the delayed COD of Berezovskaya (-0.1)
Other Non-EU countries (+/-0)
28 1. Adjusted for extraordinary effects
€m
2014 2015 % YoY 2014 2015 % YoY
Russia 517 361 -30 371 266 -28
(in Mio Ruble) 26.361 24.570 -7 18.936 18.085 -5
Other Non-EU countries -78 -39 -50 -78 -40 -49
Total 439 322 -27 293 226 -23
EBITDA 1
EBIT 1

Cash effective investments by unit
29
€m 2014 2015 % YoY
Generation 862 563 -35
Renewables 1,222 1,106 -9
Global Commodities 115 113 -2
Exploration & Production 64 97 52
Germany 745 881 18
Other EU Countries 883 1,035 17
Non-EU Countries 703 294 -58
Group Management /
Consolidation 43 85 98
Investments 4,637 4,174 -10

Economic net debt
30
1. Net figure; does not include transactions relating to our operating business or asset management
2. Net of Swedish nuclear fund
€m 31 Dec 2014 31 Dec 2015
Liquid funds 6,067 8,190
Non-current securities 4,781 4,724
Financial liabilities -19,667 -17,742
Adjustment FX hedging 1 34 218
Net financial position -8,785 -4,610
Provisions for pensions -5,574 -4,210
Asset retirement obligations 2 -19,035 -18,894
Economic net debt -33,394 -27,714

Financial liabilities of the E.ON Group End of 2015 in € billion
Maturity profile (as of end of 2015)2 31 Dec 2015 31 Dec 2014
Bonds 13.8 14.3
in EUR 6.0 7.1
in GBP 4.7 4.4
in USD 2.8 2.5
in CHF 0.0 0.0
in SEK 0.0 0.0
in JPY 0.2 0.2
other currencies 0.1 0.1
Promissory notes 0.4 0.6
Commercial Paper 0.0 0.4
Other liabilities1 3.5 4.3
Total 17.7 19.7
1. Thereof other liabilities from units end 2015: 3.2 bn €
2. Bonds and promissory notes issued by E.ON SE, E.ON International Finance B.V. and E.ON
Beteiligungen GmbH (fully guaranteed by E.ON SE)
31
0,0
1,0
2,0
3,0
4,0
5,0
6,0
2016 2017 2018 2019 2020 2021 2022 2023 ≥2024
EUR GBP USD YEN Other

Economic interest expense (net)
32
€m YTD
2014
YTD
2015
Difference
(in €m)
Interest from financial assets/liabilities -818 -772 +46
Interest cost from provisions for pensions and similar provisions -92 -116 -24
Accretion of provisions for retirement obligation and other provisions -1.039 -904 +135
Capitalized interests 1 +162 +180 +18
Other 2 +174 +40 -134
Economic interest expense (net) -1.613 -1.572 +40
1. Borrowing cost that are directly attributable to the acquisition, construction or production of a qualified asset. Borrowing cost are (virtual)
interest costs incurred by an entity in connection with the borrowing of funds. (interest rate: 5,75%)
2. Includes mainly effects from market valuation of interest derivatives, Swedish Nuclear Fund, tax related interest and interest rate
changes of other long term provision

E&P - Oil & Gas production
33
m boe 2014 2015 % YoY
Skarv 13,5 13,6 1
Njord/Hyme 2,8 4,5 58
Elgin-Franklin 0,9 1,7 88
Babbage 1,4 1,3 -13
Huntington 1,2 1,4 8
Rita 0,7 0,3 -66
Total North Sea 22,4 23,7 6
Yuzhno Russkoje 37,3 37,2 -0
Total 59,6 60,9 2

0% 20% 40% 60% 80% 100%
Outright hedging (Central Europe & Nordic)
34
2016
2017
2018
Nordic Central Europe
~38
~33
~33
~27
~30
~25
€/MWh
E.ON Investor Relations Contact
35
Anke Groth T+49 (201) 184 28 01
Head of IR [email protected]
Marc Koebernick T +49 (201) 184 28 14
Dr. Stephan Schönefuß T +49 (201) 184 28 22
Carmen Schneider
Roadshow planning & management, T +49 (201) 184 28 04
Shareholder ID & Targeting [email protected]
Oliver Roeder T +49 (201) 184 28 83
Alexander Karnick T+49 (201) 184 2838

Reporting calendar & important links
Reporting calendar
March 9, 2016 Annual Report 2015
May 11, 2016 Interim Report I: January – March 2016
June 8, 2016 2016 Annual Shareholders Meeting
August 10, 2016 Interim Report II: January – June 2016
November 9, 2016 Interim Report III: January – December 2016
Important links
Capital Market Story http://www.eon.com/en/investors/presentations/capital-market-story.html
Other Presentations http://www.eon.com/en/investors/presentations/special-topics.html
Annual Reports http://www.eon.com/en/about-us/publications/annual-report.html
Interim Reports http://www.eon.com/en/about-us/publications/interim-report.html
Facts & Figures http://www.eon.com/en/about-us/publications/facts-and-figures.html
Creditor Relations http://www.eon.com/en/investors/presentations/bonds.html
36
This presentation may contain forward-looking statements based on current assumptions and forecasts made
by E.ON Group Management and other information currently available to E.ON. Various known and unknown
risks, uncertainties and other factors could lead to material differences between the actual future results,
financial situation, development or performance of the company and the estimates given here. E.ON SE does
not intend, and does not assume any liability whatsoever, to update these forward-looking statements or to
conform them to future events or developments.
Disclaimer