Embed Size (px)
Citation preview

Integrated Resource Plan 2 0 1 5
Public Input Meeting 6
January 29-30, 2015

Agenda
Day 1
– Confidential Coal Analysis
– Lunch Break (1/2 hour) 11:30 PT/12:30 MT
– Preferred Portfolio Overview
– PaR Modeling Update
Day 2
– Preferred Portfolio Selection
– Lunch Break (1/2 hour) 11:30 PT/12:30 MT
– Sensitivity Studies
2
Integrated Resource Plan 2 0 1 5
Public Input Meeting 6
January 29, 2015
REDACTED
VOLUME III DRAFT RESULTS

Agenda
• Introduction
– Findings
– Modeling Approach
• 2015 IRP Volume III Analysis
– Wyodak
– Naughton Unit 3
– Dave Johnston Unit 3
• September 2014 Special IRP Update
– Cholla Unit 4
4

Findings
• Wyodak – Inter-temporal and fleet trade-off analysis supports a strategy that avoids installation of SCR, consistent with
PacifiCorp’s on-going appeal of EPA’s final FIP action on the Wyoming SIP.
– With the stay on EPA’s final FIP action granted, PacifiCorp will provide an update on Wyodak in the 2015 IRP Update.
• Naughton Unit 3 – As compared to early retirement, natural gas conversion in 2018 remains the least cost alternative.
• Dave Johnston Unit 3 – Foregoing installation of SCR with a firm commitment to retire the unit by the end of 2027 will save
customers tens of millions in incremental capital expenditures and retains compliance planning flexibility associated with EPA’s draft 111(d) rule.
• Cholla Unit 4 – Inter-temporal and technology trade-off analysis supports a strategy that eliminates the compliance
obligation to install SCR with a commitment to cease operating the unit as a coal-fueled asset by the end of 2024.
– This strategy will maintain compliance flexibility and retains compliance planning flexibility associated with EPA’s draft 111(d) rule.
• Each of these findings have been incorporated in the draft 2015 IRP preferred portfolio and will inform coal related action items in the 2015 IRP action plan.
5

Modeling Approach
• System Optimizer simulations are produced for a range of compliance alternatives. – One simulation with a “base” compliance outcome (i.e. installation of SCR or gas conversion in the
case of Naughton 3)
– Additional simulations with alternative compliance outcomes (gas conversion, early retirement, fleet trade-off, inter-temporal trade-off, and technology trade-off, as applicable)
– Present value revenue requirement differential (PVRR(d)):
• Resource portfolios are optimized for each simulation – 13% planning reserve margin is maintained in each run.
• Transmission integration and reinforcement costs are incorporated into the PVRR of each simulation.
• Multiple scenarios analyzed for 2015 IRP Volume III studies – Fleet and inter-temporal trade-off analysis, as applicable
– Medium and low natural gas prices
– 111(d) compliance (flexible allocation of system renewables and re-dispatch as required)
6
PVRR(d) = PVRR of System Costs (base compliance) – PVRR of System Costs (alternative compliance)

2015 IRP Price Curve Assumptions
• PacifiCorp’s most current official forward price curve (December 2014) falls between the Medium and Low natural gas price scenarios locked down at the end of September 2014.
• Observed market forwards and current long-term fundamentals support the reduced price forecast relative to the official forward price curve from September 2014 (2015 IRP medium).
• Volume III studies focus on the medium and low price assumptions adopted for the 2015 IRP, and results indicate that the conclusions drawn from these studies would not change if analyzed using the December 2014 official forward price curve.
7
$0
$10
$20
$30
$40
$50
$60
$70
$80
201
5
201
6
201
7
201
8
201
9
202
0
202
1
202
2
202
3
202
4
202
5
202
6
202
7
202
8
202
9
203
0
203
1
203
2
203
3
203
4
$/M
Wh
Avg. MidC/PV HLH
Dec 2014 OFPC 2015 IRP Low 2015 IRP Med
$0
$10
$20
$30
$40
$50
$60
$70
$80
201
5
201
6
201
7
201
8
201
9
202
0
202
1
202
2
202
3
202
4
202
5
202
6
202
7
202
8
202
9
203
0
203
1
203
2
203
3
203
4
$/M
Wh
Avg. MidC/PV LLH
Dec 2014 OFPC 2015 IRP Low 2015 IRP Med
$0
$1
$2
$3
$4
$5
$6
$7
$8
$9
201
5
201
6
201
7
201
8
201
9
202
0
202
1
202
2
202
3
202
4
202
5
202
6
202
7
202
8
202
9
203
0
203
1
203
2
203
3
203
4
$/M
MB
tu
Henry Hub
Dec 2014 OFPC 2015 IRP Low 2015 IRP Med

Integrated Resource Plan 2 0 1 5
Volume III Analysis
Wyodak

Wyodak Regional Haze Update
• Effective March 3, 2014, the EPA disapproved the NOX portion of the Wyoming Regional Haze SIP and issued a FIP for the Wyodak plant, requiring the installation of SCR within five years (by 2019).
• PacifiCorp has appealed EPA’s final FIP action requiring SCR at Wyodak. Other parties have also filed appeals of EPA’s final FIP action under a variety of opposition points.
• PacifiCorp and other parties asked the court to stay EPA’s final FIP action pending the resolution of the appeals. The court has granted the requested stay.
• Final briefing on the appeal of EPA’s final FIP action is scheduled to be completed in March 2015. The court will schedule oral arguments after briefing is completed.
• The court is expected to make a final decision on the appeal of EPA’s final FIP action in 2016.
9

Wyodak Compliance Timeline
10
2014 2016 2017 2018 2019 2020 2021 2015
RH FIP Litigation Schedule
SCR Project Development
SCR Project Implementation
Final Briefing Court Order
Technical Specifications
Regulatory Filings/Review
DEQ Construction Permit
Oral Argument
EPC Contract Execution
Construction Period
EPC Contract Procurement
2015 IRP
2017 IRP
2019 IRP
Wyodak

Model Runs for Wyodak
11
Wyodak Dave Johnston 1 Dave Johnston 2 Dave Johnston 3 Dave Johnston 4
SCR SCR (3/4/2019) Retire (12/31/2027) Retire (12/31/2027) Retire (12/31/2027) Retire (12/31/2027)
Early Retirement Retire (3/4/2019) Retire (12/31/2027) Retire (12/31/2027) Retire (12/31/2027) Retire (12/31/2027)
Gas Conversion Conversion (6/1/2019) Retire (12/31/2027) Retire (12/31/2027) Retire (12/31/2027) Retire (12/31/2027)
Base Compliance Alternative Analysis
Wyodak Dave Johnston 1 Dave Johnston 2 Dave Johnston 3 Dave Johnston 4
IT-1 SNCR (3/4/2019),
Retire (12/31/2030) Retire (12/31/2027) Retire (12/31/2027) Retire (12/31/2027) Retire (12/31/2027)
IT-2 Conversion (6/1/2022) Retire (12/31/2027) Retire (12/31/2027) Retire (12/31/2027) Retire (12/31/2027)
IT-3 Retire (12/31/2027) Retire (12/31/2027) Retire (12/31/2027) Retire (12/31/2027) Retire (12/31/2027)
Inter-temporal (IT) Scenario Analysis
Wyodak Dave Johnston 1 Dave Johnston 2 Dave Johnston 3 Dave Johnston 4
FT-1 No SCR Retire (12/31/2027) Retire (12/31/2027) Retire (12/31/2027) Retire (12/31/2027)
FT-2 No SCR Conversion (6/1/2022),
Retire (12/31/2027)
Conversion (6/1/2022),
Retire (12/31/2027) Retire (12/31/2027) Retire (12/31/2027)
Fleet Trade-Off (FT) Scenario Analysis

Wyodak Environmental Capital & Asset Life
Assumptions* • Unit Rating = 268 MW (PacifiCorp share)
• Currently approved depreciable life = 2039 (2026 in Oregon)
• SCR – Up-front CapEx = (2019)
– Catalyst = (2023 – 2031)
• SNCR – Up-front CapEx = (2019)
• Wyodak Gas Conversion – Up-front CapEx = (2019), (2022)
– Fixed natural gas transport = per year (includes pipeline capital cost of )
• DJ 1&2 Gas Conversion – Up-front CapEx = per unit (2022)
– Fixed natural gas transport = per year (includes pipeline capital cost of per unit)
12 *All capital figures are PacifiCorp’s share and inclusive of AFUDC.

Wyodak PVRR(d) Summary
13
Scenario
PVRR(d) Benefit/(Cost) of SCR ($m)
Medium Natural Gas Low Natural Gas
Early Retirement (2019)
Gas Conversion (2019)
IT-1
IT-2
IT-3
FT-1
FT-2
• With medium natural gas price assumptions, SCR is favorable to 2019 early retirement, 2019 gas conversion, IT-1, and IT-2. IT-3, FT-1, and FT-2 are more favorable than installation of SCR. FT-1 is the least cost alternative.
• With low natural gas price assumptions, gross margins for coal assets are reduced, making installation of SCR less attractive relative to medium gas price results; however, FT-1 (avoiding SCR costs altogether) remains the least cost alternative.
• FT-1 PVRR(d) benefits align with the PVRR of avoided SCR costs. This alternative is consistent with PacifiCorp’s on-going appeal of EPA’s final FIP action on the Wyoming SIP.

Wyodak PVRR(d) Line Item Detail
14
Medium Natural Gas ($m) Low Natural Gas ($m)
PVRR System Costs with
Wyodak SCR PVRR System Costs of FT-1
PVRR(d) Benefit/(Cost) of SCR vs. FT-1
PVRR System Costs with
Wyodak SCR PVRR System Costs of FT-1
PVRR(d) Benefit/(Cost) of SCR vs. FT-1
Fuel/FOT Costs
Variable O&M
Net System Balancing
Total Variable
New Resource Capital/Run-rate
Existing Resource Capital/Run-rate
Decommissioning/Stranded Cost
Contracts
Incremental DSM
Transmission
Total Fixed
Total

Redacted
Benefit/(Cost) of SCR vs. FT-1
Existing Resource Fixed Costs New Resource Fixed CostsInc. DSM Decomissioning/Stranded CostTransmission Fuel/FOTsVOM Net System BalancingCumulative PVRR(d)
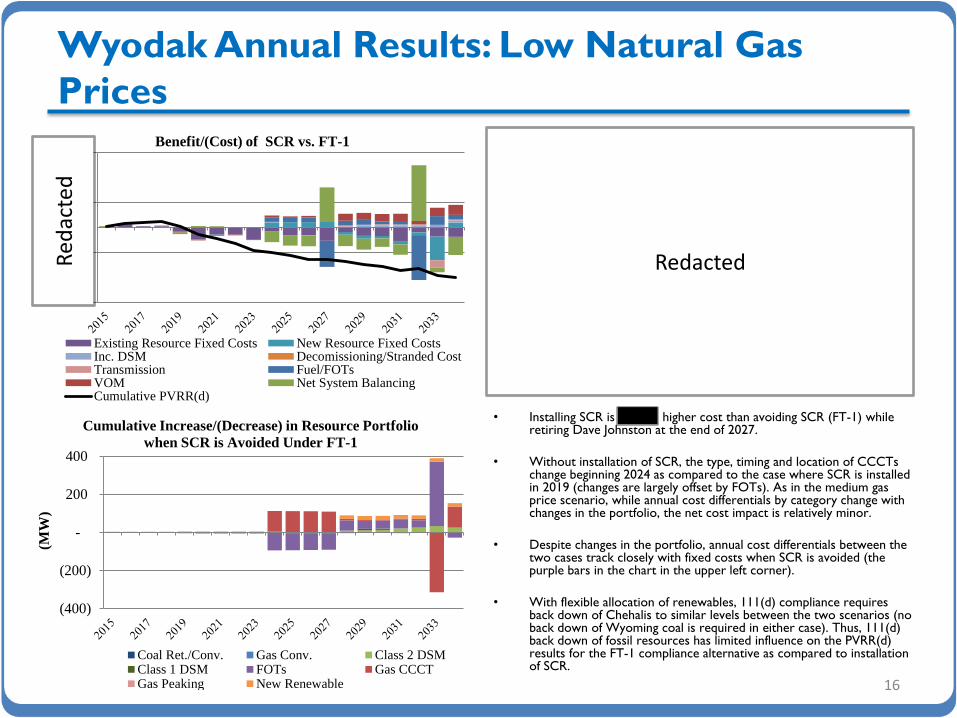
Wyodak Annual Results: Medium Natural Gas
Prices
15
• Installing SCR is higher cost than avoiding SCR (FT-1) while retiring Dave Johnston at the end of 2027.
• Without installation of SCR, a 423 MW CCCT in 2028 is deferred by two years, offset with FOTs. While annual cost differentials by category change considerably over this period, the net cost impact is relatively minor.
• Despite changes in the portfolio, annual cost differentials between the two cases track closely with fixed costs when SCR is avoided (the purple bars in the chart in the upper left corner).
• With flexible allocation of renewables, 111(d) compliance requires a moderate level of Wyoming coal back down in 2027; however back down levels are similar between the two compliance cases. Thus, 111(d) back down of fossil resources has limited influence on the PVRR(d) results for the FT-1 compliance alternative as compared to installation of SCR.
(600)
(400)
(200)
-
200
400
600
(MW
)
Cumulative Increase/(Decrease) in Resource Portfolio
when SCR is avoided under FT-1
Coal Ret./Conv. Gas Conv. Class 2 DSMClass 1 DSM FOTs Gas CCCTGas Peaking New Renewable
Red
acte
d
Wyodak Annual Results: Low Natural Gas
Prices
16
• Installing SCR is higher cost than avoiding SCR (FT-1) while retiring Dave Johnston at the end of 2027.
• Without installation of SCR, the type, timing and location of CCCTs change beginning 2024 as compared to the case where SCR is installed in 2019 (changes are largely offset by FOTs). As in the medium gas price scenario, while annual cost differentials by category change with changes in the portfolio, the net cost impact is relatively minor.
• Despite changes in the portfolio, annual cost differentials between the two cases track closely with fixed costs when SCR is avoided (the purple bars in the chart in the upper left corner).
• With flexible allocation of renewables, 111(d) compliance requires back down of Chehalis to similar levels between the two scenarios (no back down of Wyoming coal is required in either case). Thus, 111(d) back down of fossil resources has limited influence on the PVRR(d) results for the FT-1 compliance alternative as compared to installation of SCR.
(400)
(200)
-
200
400
(MW
)
Cumulative Increase/(Decrease) in Resource Portfolio
when SCR is Avoided Under FT-1
Coal Ret./Conv. Gas Conv. Class 2 DSMClass 1 DSM FOTs Gas CCCTGas Peaking New Renewable
Benefit/(Cost) of SCR vs. FT-1
Existing Resource Fixed Costs New Resource Fixed CostsInc. DSM Decomissioning/Stranded CostTransmission Fuel/FOTsVOM Net System BalancingCumulative PVRR(d)
Redacted Red
acte
d

Integrated Resource Plan 2 0 1 5
Volume III Analysis
Naughton Unit 3

Naughton 3 Regional Haze Update • Effective March 3, 2014, EPA approved Wyoming’s Regional Haze plans requiring the installation of SCR
and baghouse within five years of the effective date.
• A construction permit and a revised Regional Haze BART permit have been obtained from the state of Wyoming to convert the unit to natural gas in 2018 as an alternate compliance approach.
• EPA has confirmed support of the state of Wyoming’s approved alternate compliance approach in its final Regional Haze FIP action.
• Wyoming is yet to submit revised Regional Haze SIP incorporating the alternate compliance approach for EPA review and approval.
18

Naughton Unit 3 Compliance Timeline
19
2014 2016 2017 2018 2019 2020 2021 2015
RH FIP Litigation Schedule
Project Implementation
Final Briefing Court Order
Technical Specifications
Regulatory Filings/Review
Oral Argument
EPC Contract Execution
Construction Period
EPC Contract Procurement
2015 IRP
2017 IRP
2019 IRP
Naughton
Natural Gas Conversion Project Development

Naughton 3 Capital & Asset Life Assumptions*
• Unit Rating = 337 MW after conversion
• Currently approved depreciable life = 2029 (2028
in Oregon)
• Naughton 3 Gas Conversion
– Up-front CapEx = (2018)
– Fixed natural gas transport = per year
(includes meter upgrade cost of )
20 *All capital figures are inclusive of AFUDC.

Naughton 3 PVRR(d) Line Item Detail
21
Medium Natural Gas ($m) Low Natural Gas ($m)
PVRR System Costs with
2018 Conversion
PVRR System Costs with
2018 Retirement
PVRR(d) Benefit/(Cost) of Conversion vs. Retirement
PVRR System Costs with
2018 Conversion
PVRR System Costs with
2018 Retirement
PVRR(d) Benefit/(Cost) of Conversion vs. Retirement
Fuel/FOT Costs
Variable O&M
Net System Balancing
Total Variable
New Resource Capital/Run-rate
Existing Resource Capital/Run-rate
Decommissioning/Stranded Cost
Contracts
Incremental DSM
Transmission
Total Fixed
Total
Benefit/(Cost) of 2018 Conversion vs. Early Retirement
Existing Resource Fixed Costs New Resource Fixed CostsInc. DSM Decomissioning/Stranded CostTransmission Fuel/FOTsVOM Net System BalancingCumulative PVRR(d)
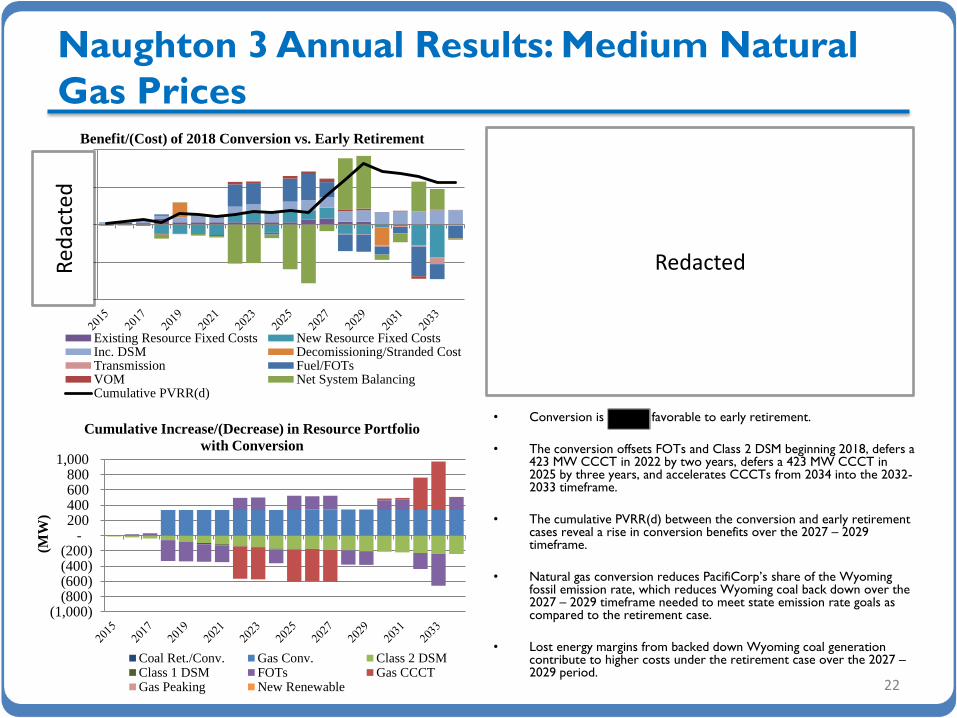
Naughton 3 Annual Results: Medium Natural
Gas Prices
22
• Conversion is favorable to early retirement.
• The conversion offsets FOTs and Class 2 DSM beginning 2018, defers a 423 MW CCCT in 2022 by two years, defers a 423 MW CCCT in 2025 by three years, and accelerates CCCTs from 2034 into the 2032-2033 timeframe.
• The cumulative PVRR(d) between the conversion and early retirement cases reveal a rise in conversion benefits over the 2027 – 2029 timeframe.
• Natural gas conversion reduces PacifiCorp’s share of the Wyoming fossil emission rate, which reduces Wyoming coal back down over the 2027 – 2029 timeframe needed to meet state emission rate goals as compared to the retirement case.
• Lost energy margins from backed down Wyoming coal generation contribute to higher costs under the retirement case over the 2027 – 2029 period.
(1,000) (800) (600) (400) (200)
- 200 400 600 800
1,000
(MW
)
Cumulative Increase/(Decrease) in Resource Portfolio
with Conversion
Coal Ret./Conv. Gas Conv. Class 2 DSMClass 1 DSM FOTs Gas CCCTGas Peaking New Renewable
Redacted Red
acte
d

Benefit/(Cost) of 2018 Conversion vs. Early Retirement
Existing Resource Fixed Costs New Resource Fixed CostsInc. DSM Decomissioning/Stranded CostTransmission Fuel/FOTsVOM Net System BalancingCumulative PVRR(d)
Naughton 3 Annual Results: Low Natural Gas
Prices
23
• Conversion is favorable to early retirement.
• Annual cost differentials between the conversion and early retirement cases are driven by cost savings from avoided new resources, partially offset by reduced system balancing benefits net of system fuel costs.
• The conversion primarily offsets FOTs and Class II DSM beginning 2018, defers a 423 MW CCCT in 2022 by two years, defers a 423 MW CCCT in 2025 by three years.
• Lower natural gas prices puts downward pressure on fossil generation, and eliminates the 111(d) coal back down requirements observed in the medium natural gas price scenario. With flexible allocation of renewables, 111(d) compliance requires back down of Chehalis with modest differences between the cases in the 2021 to 2024 timeframe. Differences in Chehalis dispatch limits between the two cases do not materially influence the PVRR(d) results under the low natural gas price scenario.
(1,000) (800) (600) (400) (200)
- 200 400 600 800
1,000
(MW
)
Cumulative Increase/(Decrease) in Resource Portfolio
with Conversion
Coal Ret./Conv. Gas Conv. Class 2 DSMClass 1 DSM FOTs Gas CCCTGas Peaking New Renewable
Redacted Red
acte
d

Integrated Resource Plan 2 0 1 5
Volume III Analysis
Dave Johnston Unit 3
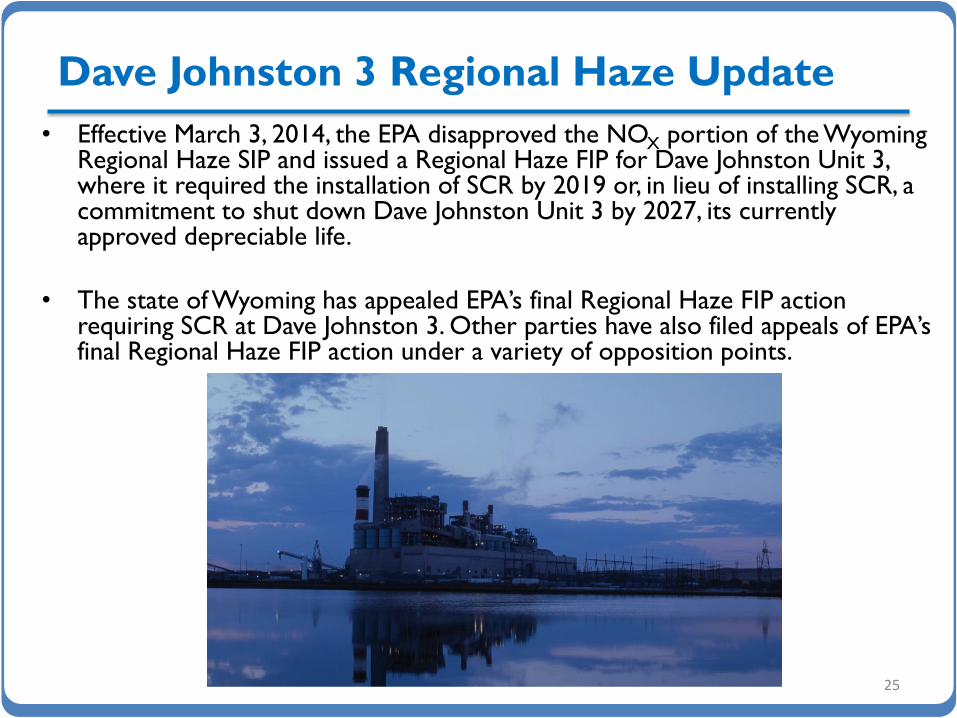
Dave Johnston 3 Regional Haze Update
• Effective March 3, 2014, the EPA disapproved the NOX portion of the Wyoming Regional Haze SIP and issued a Regional Haze FIP for Dave Johnston Unit 3, where it required the installation of SCR by 2019 or, in lieu of installing SCR, a commitment to shut down Dave Johnston Unit 3 by 2027, its currently approved depreciable life.
• The state of Wyoming has appealed EPA’s final Regional Haze FIP action requiring SCR at Dave Johnston 3. Other parties have also filed appeals of EPA’s final Regional Haze FIP action under a variety of opposition points.
25

Dave Johnston 3 Capital & Asset Life
Assumptions*
• Unit Rating = 220 MW
• Currently approved depreciable life = 2027 (2023
in Oregon)
• SCR
– Up-front CapEx = (2019)
– Catalyst = (2020 – 2023)
26 *All capital figures are inclusive of AFUDC.
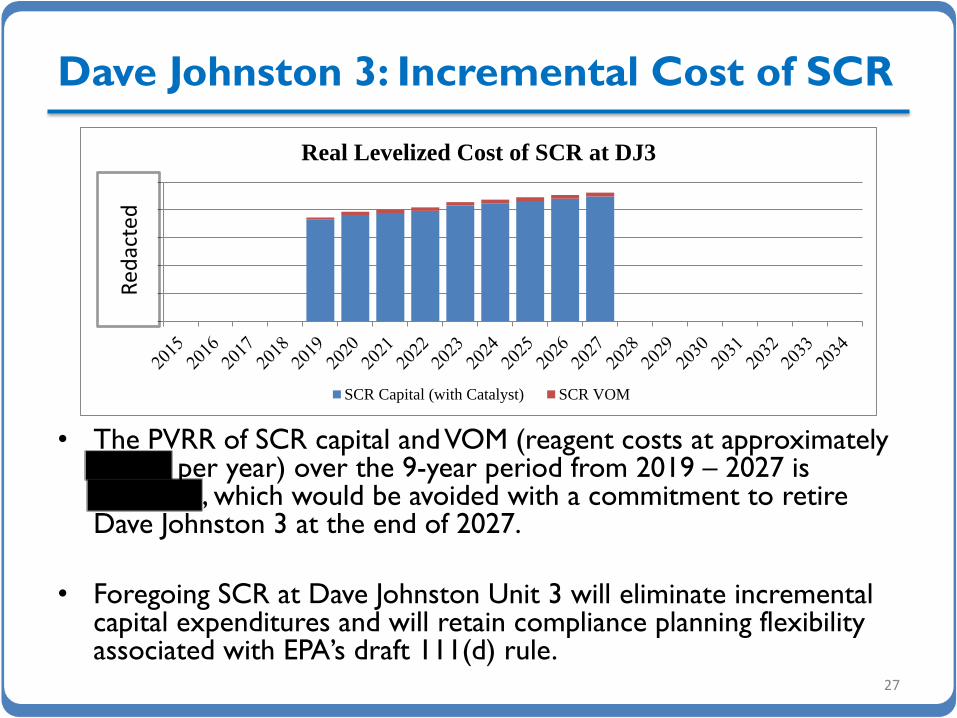
Real Levelized Cost of SCR at DJ3
SCR Capital (with Catalyst) SCR VOM
Dave Johnston 3: Incremental Cost of SCR
• The PVRR of SCR capital and VOM (reagent costs at approximately per year) over the 9-year period from 2019 – 2027 is , which would be avoided with a commitment to retire Dave Johnston 3 at the end of 2027.
• Foregoing SCR at Dave Johnston Unit 3 will eliminate incremental capital expenditures and will retain compliance planning flexibility associated with EPA’s draft 111(d) rule.
27
Red
acte
d

Integrated Resource Plan 2 0 1 5
September 2014 Special IRP Update
Cholla Unit 4

Cholla 4 Regional Haze Update
• Effective January 4, 2013, the EPA disapproved the NOX portion of the Arizona Regional Haze SIP and issued a Regional Haze FIP for Cholla Unit 4, requiring the installation of SCR within five years (i.e., by December 2017). EPA also imposed an SO2 removal efficiency requirement on Cholla Unit 4, which already has been implemented.
• PacifiCorp has appealed EPA’s action requiring SCR at Cholla Unit 4. Other parties have also filed appeals of EPA’s final action under a variety opposition points.
• PacifiCorp and other parties asked the court to stay EPA’s final action pending the resolution of the appeals. The court denied the requested stay.
• One party recently filed another motion to stay EPA’s final action based on asserted new information. The court has not yet responded to that motion.
• Final briefing on the appeal of EPA’s final action was completed in February 2014. The court has scheduled oral arguments in March 2015, and is expected to make a final decision in 2015.
• On January 16, 2015, Arizona Public Service Company and PacifiCorp submitted an application for amendment of the Cholla facility Title V permit that reflects the alternate Regional Haze compliance approach incorporated into PacifiCorp’s confidential IRP filing for Cholla Unit 4.
• If approved by Arizona, the Title V permit conditions will be incorporated into Arizona’s Regional Haze SIP and submitted for EPA review and approval. It is anticipated that the Title V review and approval process will be completed in early to mid 2015. The Regional Haze SIP review and approval process will likely proceed into late 2015 or early 2016.
29
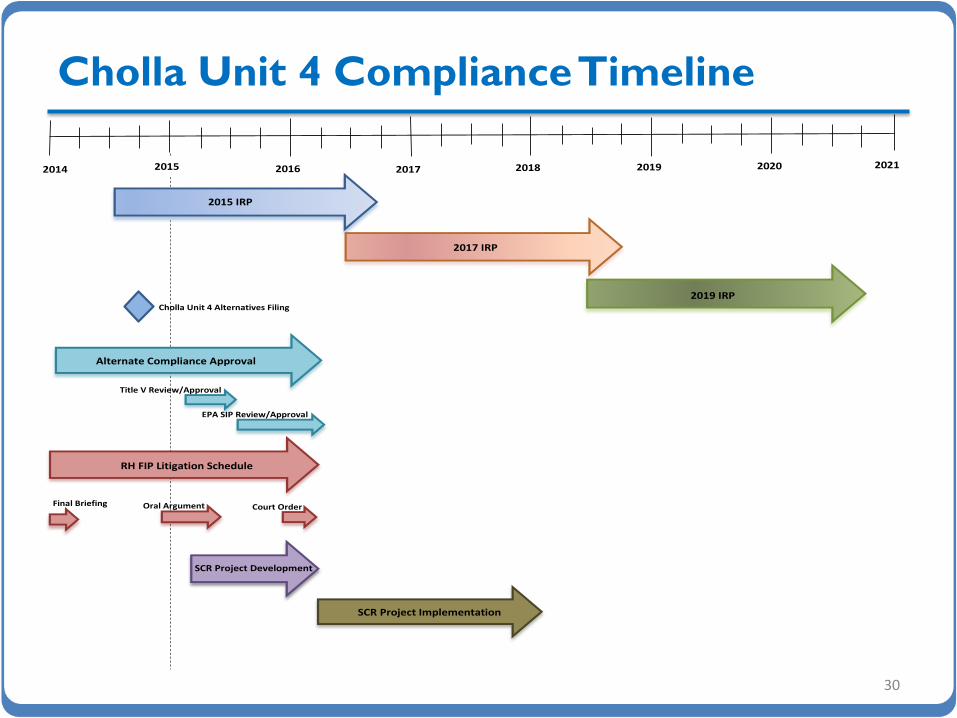
Cholla Unit 4 Compliance Timeline
30
2014 2016 2017 2018 2019 2020 2021 2015
RH FIP Litigation Schedule
SCR Project Development
SCR Project Implementation
Final Briefing Court Order
Alternate Compliance Approval
Title V Review/Approval
EPA SIP Review/Approval
2015 IRP
2017 IRP
2019 IRP
Oral Argument
Cholla Unit 4
Cholla Unit 4 Alternatives Filing

Cholla 4 – Analysis Assumptions
• Initial analysis completed using the March 2013 official forward price curve.
• Updated and expanded analysis completed using the September 2013 official forward price curve.
• The official forward price curves assumed CO2 prices starting in 2022
(pre-issuance of EPA’s draft 111(d) rule). Nonetheless, study results support a strategy that will maintain compliance flexibility and mitigate the risk of incremental stranded investment associated with EPA’s draft 111(d) rule.
31

Cholla 4 PVRR(d) Line Item Detail: Early
Retirement (2017) & Conversion (2018)
32
$ million
PVRR System Costs with 2018 SCR
PVRR System Costs with
2017 Retirement
PVRR(d) Benefit/(Cost)
of SCR vs. 2017
Retirement
PVRR System Costs with 2018 SCR
PVRR System Costs with
2018 Conversion
PVRR(d) Benefit/(Cost)
of SCR vs. 2018
Conversion
Fuel/FOT Costs
Variable O&M
Emissions
Net System Balancing
Total Variable
New Resource Capital/Run-rate
Existing Resource Capital/Run-rate
Decommissioning/Stranded Cost
Contracts
Incremental DSM
Transmission
Total Fixed
Total
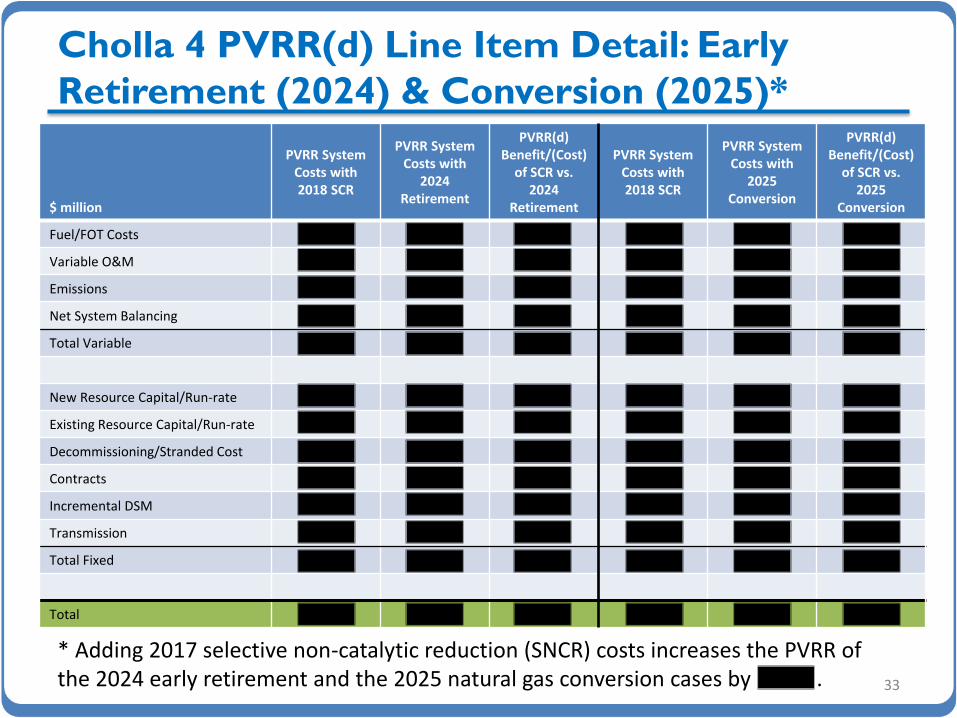
Cholla 4 PVRR(d) Line Item Detail: Early
Retirement (2024) & Conversion (2025)*
33
$ million
PVRR System Costs with 2018 SCR
PVRR System Costs with
2024 Retirement
PVRR(d) Benefit/(Cost)
of SCR vs. 2024
Retirement
PVRR System Costs with 2018 SCR
PVRR System Costs with
2025 Conversion
PVRR(d) Benefit/(Cost)
of SCR vs. 2025
Conversion
Fuel/FOT Costs
Variable O&M
Emissions
Net System Balancing
Total Variable
New Resource Capital/Run-rate
Existing Resource Capital/Run-rate
Decommissioning/Stranded Cost
Contracts
Incremental DSM
Transmission
Total Fixed
Total
* Adding 2017 selective non-catalytic reduction (SNCR) costs increases the PVRR of the 2024 early retirement and the 2025 natural gas conversion cases by .

Integrated Resource Plan 2 0 1 5
Preferred Portfolio Overview

Preferred Portfolio
• The draft preferred portfolio is case C05a-3, updated with executed qualifying facility PPAs with commercial operation dates in 2015 and 2016.
• Through the front ten-years of the planning horizon, PacifiCorp’s incremental resource needs can be met with DSM and short-term firm market purchases.*
35
*While not easily discernable in the figure above, the preferred portfolio contains the following Class 1 DSM resources in the front 10-years of the planning horizon: 5 MW of Oregon Irrigation (2022), 10.6 MW of Oregon commercial curtailment (2023).
(4,000)
(2,000)
0
2,000
4,000
6,000
8,000
10,000
Cu
mu
lati
ve
MW
Draft 2015 IRP Preferred Portfolio
(Cumulative Nameplate Capacity)
Class 1 DSM Class 2 DSM FOTs CCCT
New Wind/Solar QF Gas Conversion Existing Ret./Conv.

Preferred Portfolio: Class 2 DSM (Energy
Efficiency) • By 2024, cost effective Class 2 DSM exceeds energy efficiency
savings from the 2013 IRP preferred portfolio by approximately 59%.
• Initial analysis indicates increased energy efficiency is driven by lighting followed by cost-effective opportunities in heating, cooling, water heating, appliances and industrial process end-uses, both capital and non-capital (i.e., non-residential energy management).
36
0100200300400500600700800
20
15
20
16
20
17
20
18
20
19
20
20
20
21
20
22
20
23
20
24
20
15
20
16
20
17
20
18
20
19
20
20
20
21
20
22
20
23
20
24
2013 IRP Preferred Portfolio 2015 IRP Draft Preferred Portfolio
aM
W
Comparison of Class 2 DSM Resources
CA
ID
WY
WA
OR
UT

Preferred Portfolio: Front Office Transactions
• With increased energy efficiency, reliance on front office transactions (FOTs, or short-term firm market purchases) is reduced as compared to the 2013 IRP Preferred Portfolio.
• Over the 2015 – 2024 period, FOTs are approximately 30% lower when compared to the 2013 IRP preferred portfolio.
– West side market purchases are reduced at COB and MidC.
– East side market purchases are reduced at Mona (eliminated through the front ten-years of the planning horizon).
37
0200400600800
1,0001,2001,4001,600
2015
2016
2017
2018
2019
2020
2021
2022
2023
2024
2015
2016
2017
2018
2019
2020
2021
2022
2023
2024
2013 IRP Preferred Portfolio 2015 IRP Draft Preferred Portfolio
MW
Comparison of FOTs
Q3 Mona
Q3 NOB
Q3 COB
Q3 MidC

Preferred Portfolio: Existing Coal Resources
• Approximately 896 MW of existing coal-fired generation is assumed to be retired or otherwise cease operating as a coal-fired facility within the front 10-years of the planning horizon.
• By the end of the 20-year planning horizon, 2,527 MW of existing coal is assumed to retire or to have ceased operating as coal-fired generating assets.
• Avoiding selective catalytic reduction (SCR) capital costs at Dave Johnston 3, Wyodak, and Cholla 4 will save customers hundreds of millions of dollars and retains compliance planning flexibility associated with EPA’s draft 111(d) rule.
38
Coal Unit(s) PacifiCorp Share
of Capacity Assumptions in the Draft Preferred Portfolio
Carbon 1&2 172 MW Retires April 2015
Naughton 3 337 MW Converted to natural gas by summer 2018, end-of-life retirement year-end 2029
Cholla 4 387 MW Cease coal-fueled operation by April 2025
Dave Johnston 1 – 4 762 MW Assumed end-of-life retirement by the end of 2027
Naughton 1&2 357 MW Assumed end-of-life retirement by the end of 2029
Hayden 1&2 77 MW Assumed end-of-life retirement by the end of 2030
Hunter 2 269 MW Assumed early retirement by the end of 2032*
Craig 1&2 166 MW Assumed end-of-life retirement by the end of 2034
*Represents one of three different inter-temporal and fleet trade-off Regional Haze scenarios developed for planning purposes in the 2015 IRP. The state of Utah is completing additional analysis requested by EPA and has not required SCR on PacifiCorp’s Utah coal-fired units. Assumptions regarding Regional Haze compliance obligations and subsequent analysis pending EPA’s action on the Utah SIP will be revisited as appropriate in future IRPs and IRP Updates.

Preferred Portfolio: New Thermal Resources
• The first deferrable thermal resource, a Wyoming 423 MW J-class 1x1 combined cycle plant, appears in 2028, which coincides with the assumed end-of-life retirement of the Dave Johnston plant.
– Four years later than the 2024 combined cycle resource in the 2013
IRP.
– One year later than the 2027 combined cycle resource in the 2013 IRP
Update.
• With assumed retirements of existing resources over the long-term, additional CCCT resources are included in the out-years of the planning horizon. – 1,159 MW in 2030.
– 635 MW in 2033
– 635 MW in 2034.
39
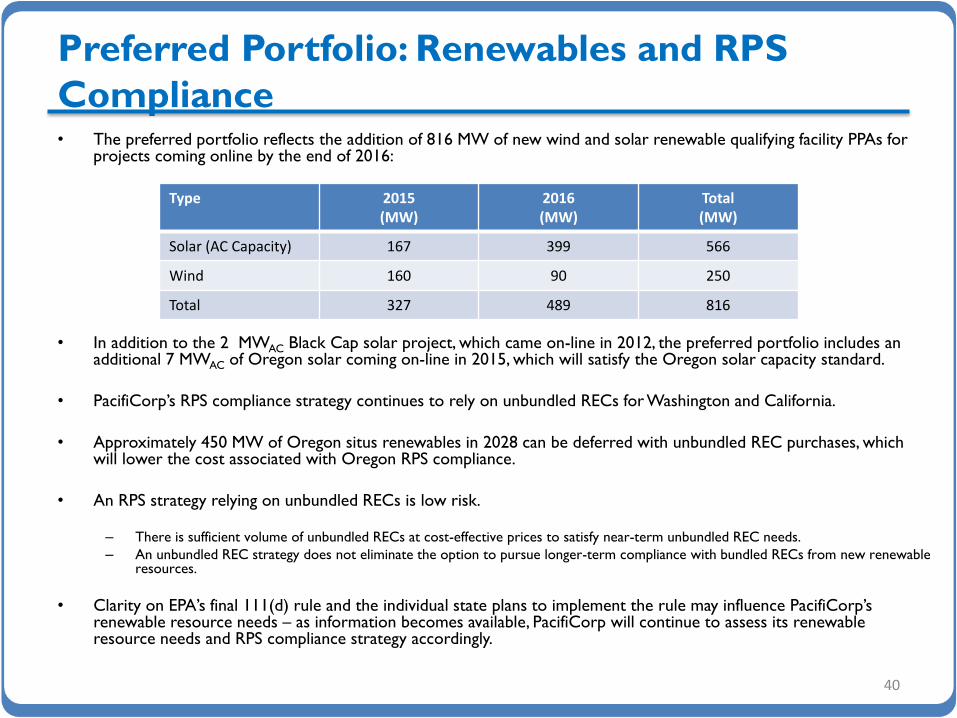
Preferred Portfolio: Renewables and RPS
Compliance • The preferred portfolio reflects the addition of 816 MW of new wind and solar renewable qualifying facility PPAs for
projects coming online by the end of 2016:
• In addition to the 2 MWAC Black Cap solar project, which came on-line in 2012, the preferred portfolio includes an additional 7 MWAC of Oregon solar coming on-line in 2015, which will satisfy the Oregon solar capacity standard.
• PacifiCorp’s RPS compliance strategy continues to rely on unbundled RECs for Washington and California.
• Approximately 450 MW of Oregon situs renewables in 2028 can be deferred with unbundled REC purchases, which will lower the cost associated with Oregon RPS compliance.
• An RPS strategy relying on unbundled RECs is low risk.
– There is sufficient volume of unbundled RECs at cost-effective prices to satisfy near-term unbundled REC needs.
– An unbundled REC strategy does not eliminate the option to pursue longer-term compliance with bundled RECs from new renewable resources.
• Clarity on EPA’s final 111(d) rule and the individual state plans to implement the rule may influence PacifiCorp’s renewable resource needs – as information becomes available, PacifiCorp will continue to assess its renewable resource needs and RPS compliance strategy accordingly.
40
Type 2015 (MW)
2016 (MW)
Total (MW)
Solar (AC Capacity) 167 399 566
Wind 160 90 250
Total 327 489 816

Integrated Resource Plan 2 0 1 5
PaR Modeling Update
• Sampling and Stochastic Iterations
• 111(d) Modeling
Sampling and Stochastic Iterations
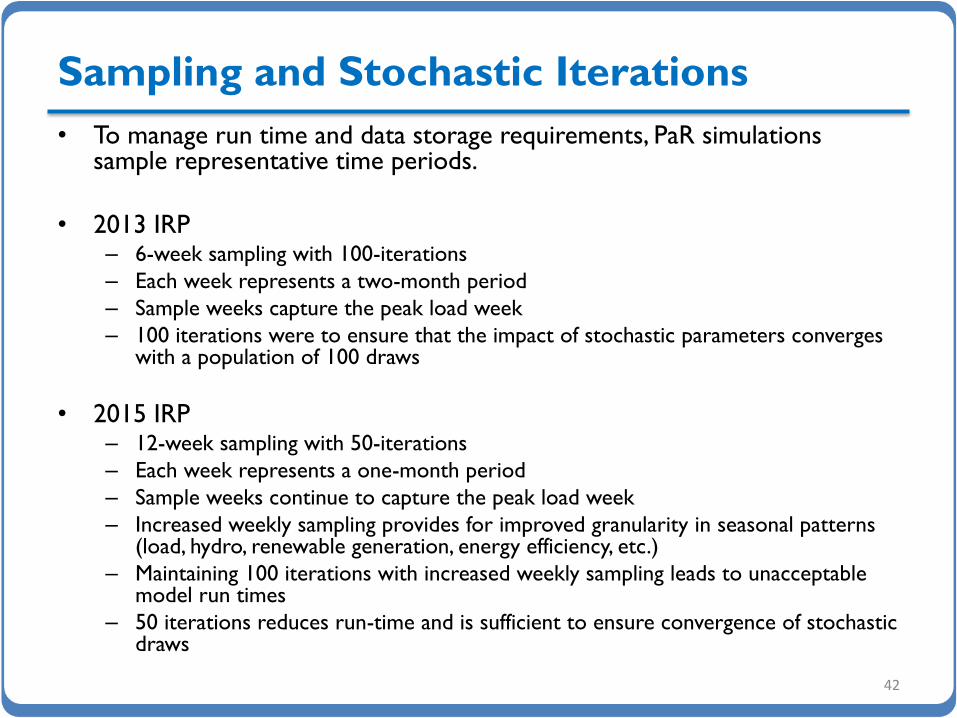
• To manage run time and data storage requirements, PaR simulations sample representative time periods.
• 2013 IRP – 6-week sampling with 100-iterations
– Each week represents a two-month period
– Sample weeks capture the peak load week
– 100 iterations were to ensure that the impact of stochastic parameters converges with a population of 100 draws
• 2015 IRP – 12-week sampling with 50-iterations
– Each week represents a one-month period
– Sample weeks continue to capture the peak load week
– Increased weekly sampling provides for improved granularity in seasonal patterns (load, hydro, renewable generation, energy efficiency, etc.)
– Maintaining 100 iterations with increased weekly sampling leads to unacceptable model run times
– 50 iterations reduces run-time and is sufficient to ensure convergence of stochastic draws
42

Testing of Sampling and Iteration
Selections • Prior to updating weekly sampling and number of iterations in PaR, the
impact on system PVRR results and model run time was studied.
• Three configurations were tested:
43
Sampling Iterations
6-weeks 100
12-weeks 100
12-weeks 50
• Test runs completed for three different resource portfolios (C05-1, C07-1, and C12-1) and results for the following metrics were compared: – Mean PVRR
– 95th and 5th Percentile PVRR
– PVRR distribution
– ENS (Energy not Served)
– Run-time and storage requirements

Comparison of PVRR
• While the magnitude of PVRR metrics is affected, the relative change
among cases does not alter the ranking of cases based on the expected
value PVRR and risk-adjusted PVRR.
• Changes in PVRR metrics relative to C05-1 are generally consistent across
sampling and iteration configurations.
44
Sampling 12-Week 12-Week 6-Week
Iteration 50 100 100
Study C05-1 C07-1 C12-1 C05-1 C07-1 C12-1 C05-1 C07-1 C12-1
Expected Value PVRR ($m) 27,900 29,912 27,810 27,962 29,973 27,890 28,158 30,152 28,059
Ranking 2 3 1 2 3 1 2 3 1
95% Percentile ($m) 28,363 30,350 28,312 28,555 30,576 28,635 28,815 30,775 28,721
5% Percentile ($m) 27,500 29,563 27,397 27,485 29,537 27,379 27,717 29,699 27,588
Risk Adjusted PVRR ($m) 29,319 31,429 29,226 29,390 31,501 29,321 29,599 31,691 29,495
Ranking 2 3 1 2 3 1 2 3 1
Sampling 12-Week 12-Week 6-Week
Iteration 50 100 100
Study C05-1 C07-1 C12-1 C05-1 C07-1 C12-1 C05-1 C07-1 C12-1
Expected Value PVRR ($m) --- 2,011 (90) --- 2,011 (72) --- 1,994 (99)
95% Percentile ($m) --- 1,987 (51) --- 2,021 80 --- 1,960 (94)
Risk Adjusted PVRR ($m) --- 2,111 (93) --- 2,112 (68) --- 2,092 (104)

Comparison of PVRR Distribution
• For comparability, every other iteration is plotted for the 100-iteration runs.
• Reduced iterations dampens upper tail costs; however, increased sampling yields comparable results across most iterations.
• As shown in the prior slide, the change in upper tail costs is relatively stable among portfolios and does not change the risk adjusted PVRR rank.
45
27,000
27,500
28,000
28,500
29,000
29,500
PV
RR
($
Mil
lio
ns)
C05-1
12-Week Sample, 50-Iteration 12-Week Sample, 100-Iteration
6-Week Sample, 100-Iteration
29,000
29,500
30,000
30,500
31,000
31,500
PV
RR
($
Mil
lio
ns)
C07-1
12-Week Sample, 50-Iteration 12-Week Sample, 100-Iteration
6-Week Sample, 100-Iteration
27,000
27,500
28,000
28,500
29,000
29,500
PV
RR
($
Mil
lio
ns)
C12-1
12-Week Sample, 50-Iteration 12-Week Sample, 100-Iteration
6-Week Sample, 100-Iteration

Comparison of Mean ENS
• More granular weekly sampling should improve accuracy of reported ENS
• Number of iterations has little impact on mean ENS
• Findings are consistent among the cases studied
46
0
20
40
60
80
100
120
EN
S (
GW
h)
C05-1
12-Week Sample, 50-Iteration 12-Week Sample, 100-Iteration
6-Week Sample, 100-Iteration
0
20
40
60
80
100
120
140
EN
S (
GW
h)
C07-1
12-Week Sample, 50-Iteration 12-Week Sample, 100-Iteration
6-Week Sample, 100-Iteration
0
50
100
150
200
250
EN
S (
GW
h)
C12-1
12-Week Sample, 50-Iteration 12-Week Sample, 100-Iteration
6-Week Sample, 100-Iteration

Comparison of Run Time and Storage
Requirements • Model run times and storage requirements are an important consideration given the
number of studies required for the IRP.
• Run times and storage requirements are significantly higher for runs with 12-week sampling/100-iteration.
– Average run time is 98% longer relative to 12-week sampling/50-iteration runs and 74% relative to 6-
week sampling/100-iteration runs.
– Average storage requirements are 99% higher relative to 12-week sampling/50 iteration runs and 90% higher relative to 6-week sampling/100-iteration runs.
• Run times and storage requirements are lowest among the 12-week sampling/50-iteration runs.
47
Sampling 12-Week 12-Week 6-Week
Iteration 50 100 100
Study C05-1 C07-1 C12-1 C05-1 C07-1 C12-1 C05-1 C07-1 C12-1
Run Time (hours) 15 17 15 29 34 30 17 20 17
Storage (GB) 73 86 77 144 171 153 76 90 80
PaR Sampling & Iteration Conclusions
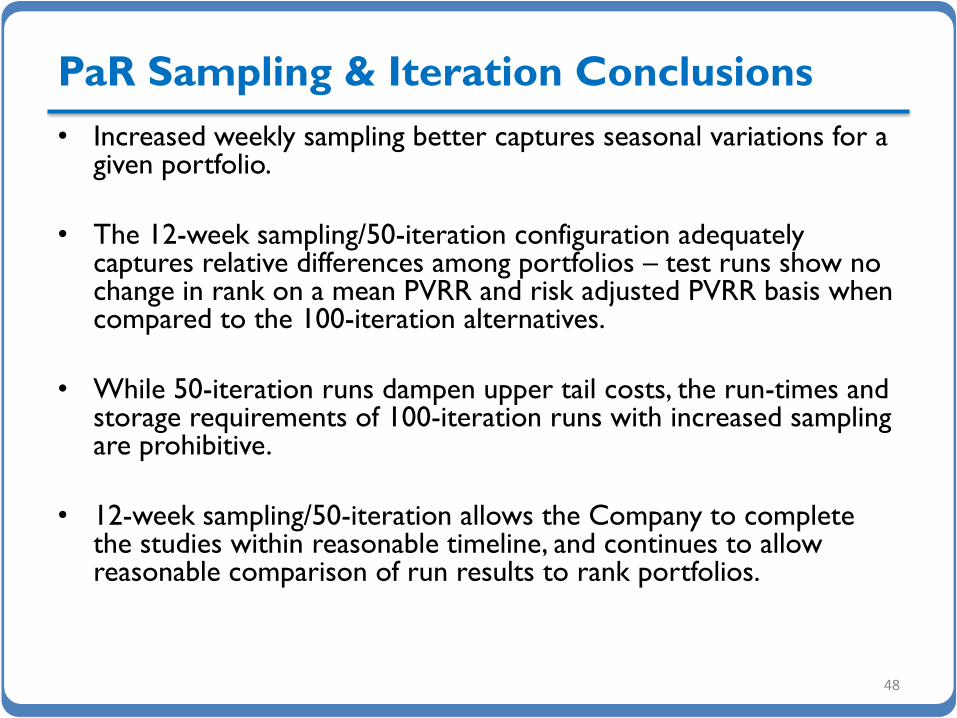
• Increased weekly sampling better captures seasonal variations for a given portfolio.
• The 12-week sampling/50-iteration configuration adequately captures relative differences among portfolios – test runs show no change in rank on a mean PVRR and risk adjusted PVRR basis when compared to the 100-iteration alternatives.
• While 50-iteration runs dampen upper tail costs, the run-times and storage requirements of 100-iteration runs with increased sampling are prohibitive.
• 12-week sampling/50-iteration allows the Company to complete the studies within reasonable timeline, and continues to allow reasonable comparison of run results to rank portfolios.
48

111(d) Modeling
• 111(d) compliance, under a range of scenarios and compliance strategies, is captured in the portfolio development process. – Initial System Optimizer resource portfolio without 111(d)
– 111(d) Scenario Maker identifies compliance actions
– Final System Optimizer resource portfolio with 111(d)
• The PaR stochastic risk modeling process is not conducive to the 111(d) modeling framework used in the portfolio development process. – Unit commitment and dispatch in PaR is chronological.
– With chronological dispatch, PaR does not have foresight to account for how “current” dispatch decisions might influence future dispatch restrictions needed to meet emission rate targets in a given year.
– Consequently, optimized dispatch within annual dispatch limits cannot be enforced in PaR.
– Further, it is not feasible to impose manual dispatch limits for a stochastic PaR run, considering there are 50 iterations (with varying combinations of load, hydro generation, thermal unit outages, natural gas prices, and wholesale power prices).
– Each iteration produces different emission rates for each year, among 32 portfolios, analyzed across 4 different natural gas/CO2 policy scenarios, which would require 6,400 111(d) Scenario Maker files to calculate thermal dispatch limits by unit and time period for input back into PaR before initiating a second round of PaR simulations.
49
111(d) Modeling (Cont’d)
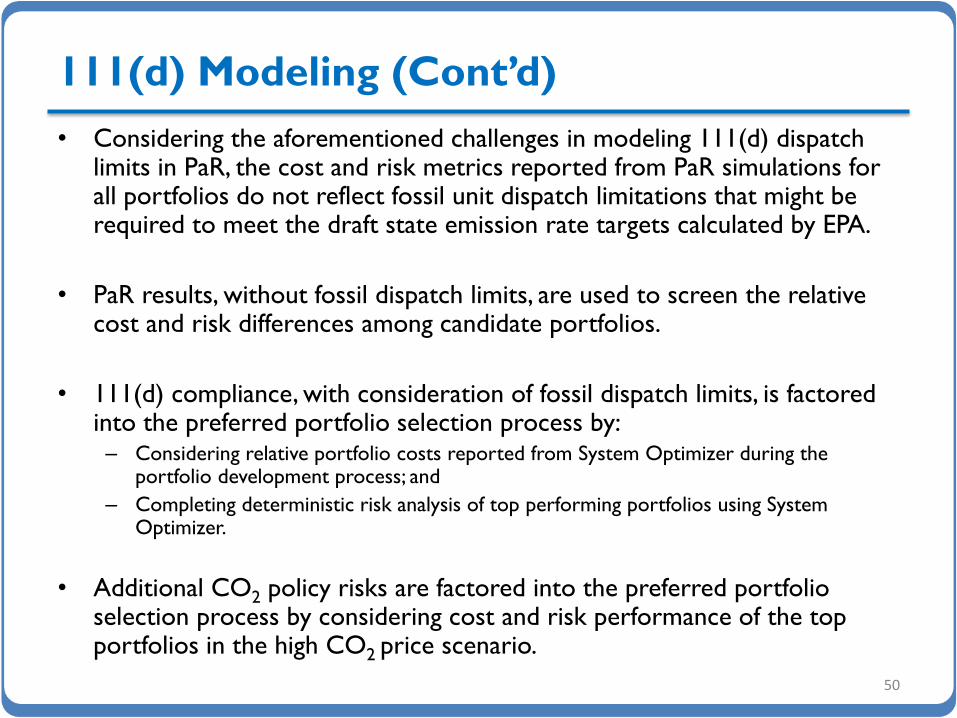
• Considering the aforementioned challenges in modeling 111(d) dispatch limits in PaR, the cost and risk metrics reported from PaR simulations for all portfolios do not reflect fossil unit dispatch limitations that might be required to meet the draft state emission rate targets calculated by EPA.
• PaR results, without fossil dispatch limits, are used to screen the relative cost and risk differences among candidate portfolios.
• 111(d) compliance, with consideration of fossil dispatch limits, is factored into the preferred portfolio selection process by: – Considering relative portfolio costs reported from System Optimizer during the
portfolio development process; and
– Completing deterministic risk analysis of top performing portfolios using System Optimizer.
• Additional CO2 policy risks are factored into the preferred portfolio selection process by considering cost and risk performance of the top portfolios in the high CO2 price scenario.
50

Integrated Resource Plan 2 0 1 5
Preferred Portfolio Selection
Initial and Pre-Screens

Core Case Definitions: Overview
52
Case 111(d) Rule 111(d) Compliance
Priority CO2 Price FOTs Price Curve RH Scenarios
C01 None None None Base Base/No 111(d) R, 1, 2
C02 All States, Emis. Rate Re-dispatch + Base EE None Base Sep 2014 OFPC 1, 2
C03 All States, Emis. Rate Re-dispatch + Inc. EE None Base Sep 2014 OFPC 1, 2
C04 All States, Emis. Rate Renewable + Inc. EE None Base Sep 2014 OFPC 1, 2
C05 Retail States, Emis. Rate Re-dispatch + Base EE None Base Sep 2014 OFPC 1, 2
C05a Retail States, Emis. Rate Re-dispatch + Base EE None Base Sep 2014 OFPC 1, 2, 3
C05b Retail States, Emis. Rate Re-dispatch + Base EE None Base Sep 2014 OFPC 1, 3
C06 Retail States, Emis. Rate Re-dispatch + Inc. EE None Base Sep 2014 OFPC 1, 2
C07 Retail States, Emis. Rate Re-dispatch + Inc. EE None Base Sep 2014 OFPC 1, 2
C09 Retail States, Emis. Rate Re-dispatch + Base EE None Limited Sep 2014 OFPC 1, 2
C11 Retail States, Emis. Rate Re-dispatch + Acc. EE None Base Sep 2014 OFPC 1, 2
C12 Mass Cap, New+Existing None None Base Sep 2014 OFPC 1, 2
C13 Mass Cap, Existing None None Base Sep 2014 OFPC 1, 2
C14 Retail States, Emis. Rate Re-dispatch + Base EE Yes Base Base/CO2 Adjusted 1, 2
C14a Retail States Emis. Rate Re-dispatch + Base EE Yes Base Base/CO2 Adjusted 1, 2
C05a eliminates situs Oregon RPS resources. C05b includes situs Oregon RPS resources when the existing bundled REC bank is expected to expire (2028).

Regional Haze Scenarios
53
Coal Unit Reference RH-1 RH-2 RH-3
Dave Johnston 1 Shut Down Dec 2027 Shut Down Mar 2019 Shut Down Mar 2019 Shut Down Dec 2027
Dave Johnston 2 Shut Down Dec 2027 Shut Down Dec 2027 Shut Down Dec 2023 Shut Down Dec 2027
Dave Johnston 3 SCR by Mar 2019;
Shut Down Dec 2027 Shut Down Dec 2027 Shut Down Dec 2027 Shut Down Dec 2027
Dave Johnston 4 Shut Down Dec 2027 Shut Down Dec 2032 Shut Down Dec 2032 Shut Down Dec 2027
Hunter 2 SCR by Dec 2021 Shut Down by Dec 2032 Shut Down by Dec 2024 Shut Down by Dec 2032
Huntington 1 SCR by Dec 2022 Shut Down by Dec 2036 Shut Down by Dec 2024 SCR by Dec 2022
Huntington 2 SCR by Dec 2022 Shut Down by Dec 2021 Shut Down by Dec 2021 Shut Down by Dec 2029
Jim Bridger 1 SCR by Dec 2022 Shut Down by Dec 2023 Shut Down by Dec 2023 SCR by Dec 2022
Jim Bridger 2 SCR by Dec 2021 Shut Down by Dec 2032 Shut Down by Dec 2028 SCR by Dec 2021
Wyodak SCR by Mar 2019 Shut Down by Dec 2039 Shut Down by Dec 2032 Shut Down by Dec 2039
Common to All Scenarios: Carbon 1&2 shutdown 2015; Cholla 4 gas conversion 2025; Colstrip 3&4 SCR 2023/2022, respectively; Craig 1&2 SCR 2021/2018, respectively; Hayden 1&2 SCR 2015/2016, respectively; Naughton 1&2 shutdown 2029; Naughton 3 gas conversion 2018, shutdown 2029; Hunter 1&3 SCR 2021/2024, respectively; and Bridger 3&4 SCR 2015/2016, respectively

Price Scenarios
54
$-
$1
$2
$3
$4
$5
$6
$7
$8
$9
$10
$11
2015
2016
2017
2018
2019
2020
2021
2022
2023
2024
2025
2026
2027
2028
2029
2030
2031
2032
2033
2034
Nom
inal
$ /
MM
Btu
Henry Hub
Medium High Low Medium with High CO2
$-
$20
$40
$60
$80
$100
$120
$140
$160
$180
2015
2016
2017
2018
2019
2020
2021
2022
2023
2024
2025
2026
2027
2028
2029
2030
2031
2032
2033
2034
Nom
inal
$ /
Sh
ort
Ton
High CO2 Price
2015 High IRP CO2
• PaR runs were completed for four different scenarios: – Low natural gas
– Medium natural gas
– High natural gas
– Medium natural gas with high CO2 prices
• Initial screening performed using low, medium, and high natural gas prices.
• Final screening compares how top portfolios perform in the high CO2 price scenario, which will also be used to inform the 2015 IRP acquisition path analysis.

PaR Pre-Screen: Regional Haze Scenario 1
and Scenario 3
• Outlier cases (those above or to the right of the dashed red line) are excluded from further screening
• Cases excluded in this step: – C03-1
– C04-1
– C06-1
– C07-1
– C14-1
– C14a-1
55
$17.5
$18.0
$18.5
$19.0
$19.5
$20.0
$20.5
$21.0
$25.5 $26.5 $27.5 $28.5 $29.5 $30.5
Up
per
Ta
il M
ean
PV
RR
Les
s F
ixed
Co
sts
($ b
illi
on
)
Stochastic Mean PVRR($ billion)
Low Gas
C02-1 C03-1 C04-1 C05-1 C05a-1 C05b-1
C06-1 C07-1 C09-1 C11-1 C12-1 C13-1
C14-1 C14a-1 C05-3 C05a-3 C05b-3
$19.0
$19.5
$20.0
$20.5
$21.0
$21.5
$22.0
$22.5
$27.5 $28.0 $28.5 $29.0 $29.5 $30.0 $30.5 $31.0
Up
per
Ta
il M
ean
PV
RR
Les
s F
ixed
Co
sts
($ b
illi
on
)
Stochastic Mean PVRR($ billion)
Medium Gas
C02-1 C03-1 C04-1 C05-1 C05a-1 C05b-1
C06-1 C07-1 C09-1 C11-1 C12-1 C13-1
C14-1 C14a-1 C05-3 C05a-3 C05b-3
$20.5
$21.0
$21.5
$22.0
$22.5
$23.0
$23.5
$24.0
$24.5
$29.0 $29.5 $30.0 $30.5 $31.0 $31.5 $32.0 $32.5
Up
per
Ta
il M
ean
PV
RR
Les
s F
ixed
Co
sts
($ b
illi
on
)
Stochastic Mean PVRR($ billion)
High Gas
C02-1 C03-1 C04-1 C05-1 C05a-1 C05b-1
C06-1 C07-1 C09-1 C11-1 C12-1 C13-1
C14-1 C14a-1 C05-3 C05a-3 C05b-3
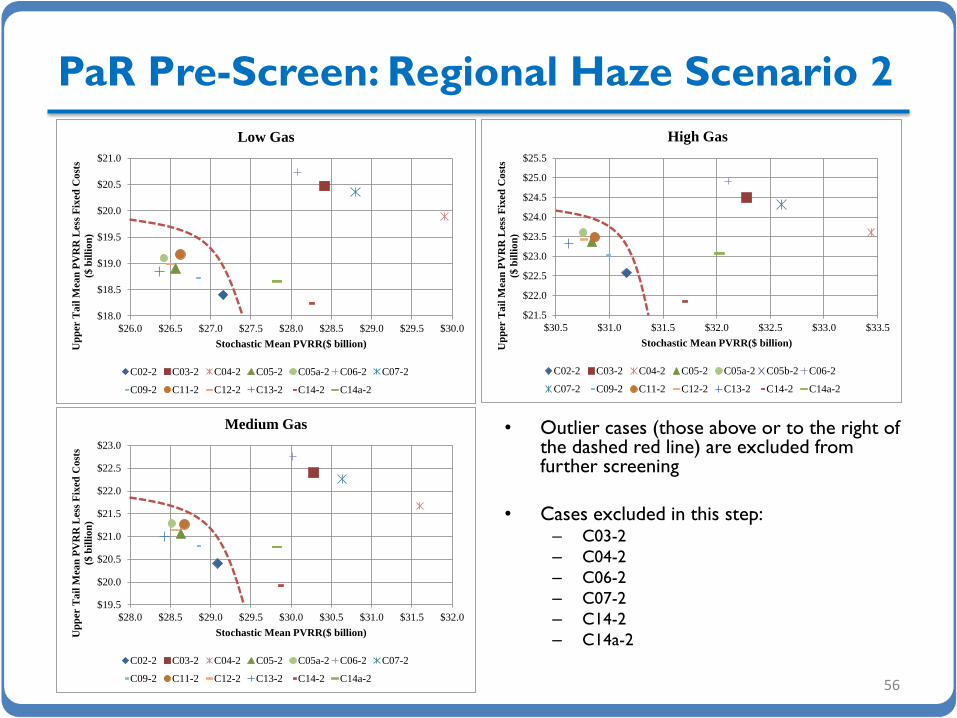
PaR Pre-Screen: Regional Haze Scenario 2
• Outlier cases (those above or to the right of the dashed red line) are excluded from further screening
• Cases excluded in this step: – C03-2
– C04-2
– C06-2
– C07-2
– C14-2
– C14a-2
56
$18.0
$18.5
$19.0
$19.5
$20.0
$20.5
$21.0
$26.0 $26.5 $27.0 $27.5 $28.0 $28.5 $29.0 $29.5 $30.0
Up
per
Ta
il M
ean
PV
RR
Les
s F
ixed
Co
sts
($ b
illi
on
)
Stochastic Mean PVRR($ billion)
Low Gas
C02-2 C03-2 C04-2 C05-2 C05a-2 C06-2 C07-2
C09-2 C11-2 C12-2 C13-2 C14-2 C14a-2
$19.5
$20.0
$20.5
$21.0
$21.5
$22.0
$22.5
$23.0
$28.0 $28.5 $29.0 $29.5 $30.0 $30.5 $31.0 $31.5 $32.0
Up
per
Ta
il M
ean
PV
RR
Les
s F
ixed
Co
sts
($ b
illi
on
)
Stochastic Mean PVRR($ billion)
Medium Gas
C02-2 C03-2 C04-2 C05-2 C05a-2 C06-2 C07-2
C09-2 C11-2 C12-2 C13-2 C14-2 C14a-2
$21.5
$22.0
$22.5
$23.0
$23.5
$24.0
$24.5
$25.0
$25.5
$30.5 $31.0 $31.5 $32.0 $32.5 $33.0 $33.5
Up
per
Ta
il M
ean
PV
RR
Les
s F
ixed
Co
sts
($ b
illi
on
)
Stochastic Mean PVRR($ billion)
High Gas
C02-2 C03-2 C04-2 C05-2 C05a-2 C05b-2 C06-2
C07-2 C09-2 C11-2 C12-2 C13-2 C14-2 C14a-2
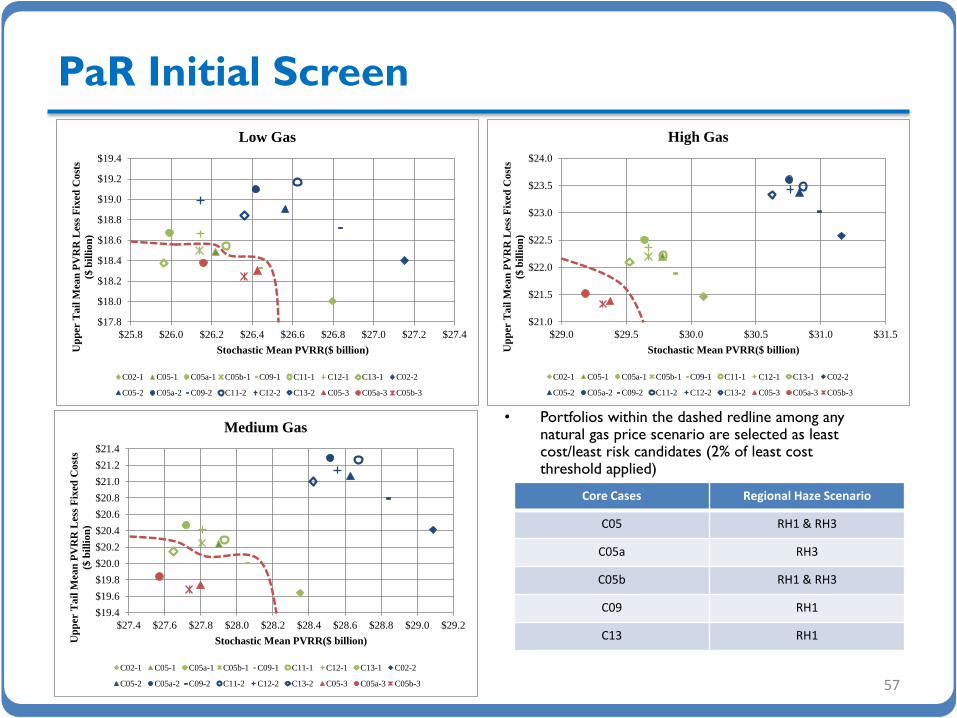
PaR Initial Screen
• Portfolios within the dashed redline among any natural gas price scenario are selected as least cost/least risk candidates (2% of least cost threshold applied)
57
Core Cases Regional Haze Scenario
C05 RH1 & RH3
C05a RH3
C05b RH1 & RH3
C09 RH1
C13 RH1
$17.8
$18.0
$18.2
$18.4
$18.6
$18.8
$19.0
$19.2
$19.4
$25.8 $26.0 $26.2 $26.4 $26.6 $26.8 $27.0 $27.2 $27.4
Up
per
Ta
il M
ean
PV
RR
Les
s F
ixed
Co
sts
($ b
illi
on
)
Stochastic Mean PVRR($ billion)
Low Gas
C02-1 C05-1 C05a-1 C05b-1 C09-1 C11-1 C12-1 C13-1 C02-2
C05-2 C05a-2 C09-2 C11-2 C12-2 C13-2 C05-3 C05a-3 C05b-3
$19.4
$19.6
$19.8
$20.0
$20.2
$20.4
$20.6
$20.8
$21.0
$21.2
$21.4
$27.4 $27.6 $27.8 $28.0 $28.2 $28.4 $28.6 $28.8 $29.0 $29.2
Up
per
Ta
il M
ean
PV
RR
Les
s F
ixed
Co
sts
($ b
illi
on
)
Stochastic Mean PVRR($ billion)
Medium Gas
C02-1 C05-1 C05a-1 C05b-1 C09-1 C11-1 C12-1 C13-1 C02-2
C05-2 C05a-2 C09-2 C11-2 C12-2 C13-2 C05-3 C05a-3 C05b-3
$21.0
$21.5
$22.0
$22.5
$23.0
$23.5
$24.0
$29.0 $29.5 $30.0 $30.5 $31.0 $31.5
Up
per
Ta
il M
ean
PV
RR
Les
s F
ixed
Co
sts
($ b
illi
on
)
Stochastic Mean PVRR($ billion)
High Gas
C02-1 C05-1 C05a-1 C05b-1 C09-1 C11-1 C12-1 C13-1 C02-2
C05-2 C05a-2 C09-2 C11-2 C12-2 C13-2 C05-3 C05a-3 C05b-3

Comparison of Top Portfolios (2015 – 2024)
58
(4,000)
(3,000)
(2,000)
(1,000)
-
1,000
2,000
3,000
4,000
5,000
6,000
7,000
8,000
9,000C
05-
3C
05a
-3C
05b
-3C
05-
1C
05b
-1C
09-
1C
13-
1
C0
5-3
C0
5a-3
C0
5b-3
C0
5-1
C0
5b-1
C0
9-1
C1
3-1
C0
5-3
C0
5a-3
C0
5b-3
C0
5-1
C0
5b-1
C0
9-1
C1
3-1
C0
5-3
C0
5a-3
C0
5b-3
C0
5-1
C0
5b-1
C0
9-1
C1
3-1
C0
5-3
C0
5a-3
C0
5b-3
C0
5-1
C0
5b-1
C0
9-1
C1
3-1
C0
5-3
C0
5a-3
C0
5b-3
C0
5-1
C0
5b-1
C0
9-1
C1
3-1
C0
5-3
C0
5a-3
C0
5b-3
C0
5-1
C0
5b-1
C0
9-1
C1
3-1
C0
5-3
C0
5a-3
C0
5b-3
C0
5-1
C0
5b-1
C0
9-1
C1
3-1
C0
5-3
C0
5a-3
C0
5b-3
C0
5-1
C0
5b-1
C0
9-1
C1
3-1
C0
5-3
C0
5a-3
C0
5b-3
C0
5-1
C0
5b-1
C0
9-1
C1
3-1
2015 2016 2017 2018 2019 2020 2021 2022 2023 2024
Cu
mu
lati
ve C
apac
ity
(MW
)
Final Screening Portfolio Comparison (2015 - 2024)
Gas Conversion DSM CCCT FOTs Renewable Other Early Retirement End of Life Retirement
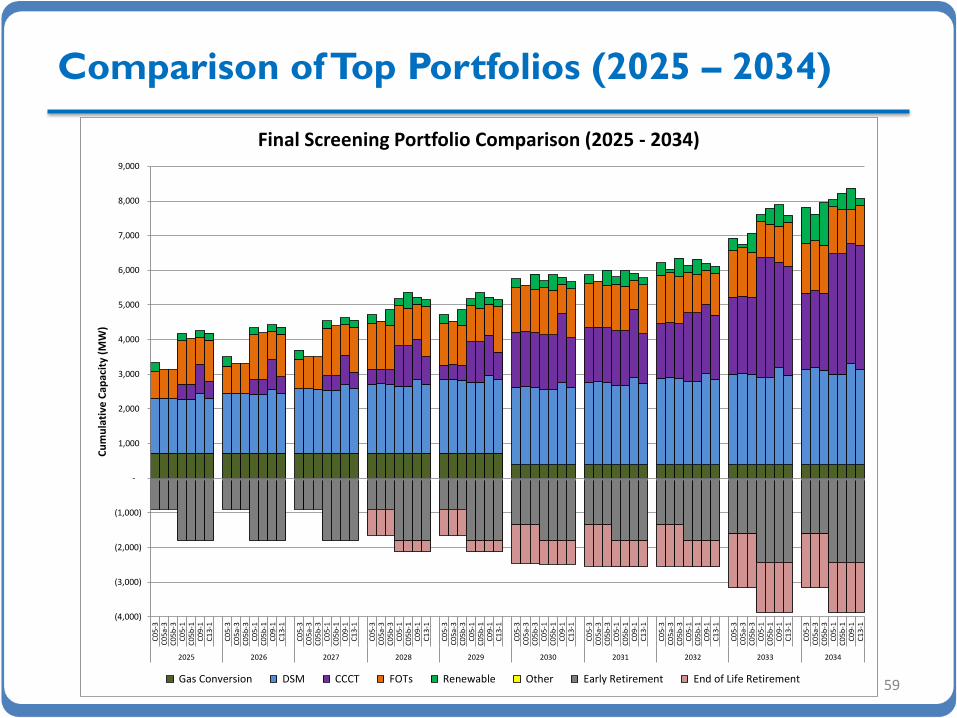
Comparison of Top Portfolios (2025 – 2034)
59
(4,000)
(3,000)
(2,000)
(1,000)
-
1,000
2,000
3,000
4,000
5,000
6,000
7,000
8,000
9,000C
05-
3C
05a
-3C
05b
-3C
05-
1C
05b
-1C
09-
1C
13-
1
C0
5-3
C0
5a-3
C0
5b-3
C0
5-1
C0
5b-1
C0
9-1
C1
3-1
C0
5-3
C0
5a-3
C0
5b-3
C0
5-1
C0
5b-1
C0
9-1
C1
3-1
C0
5-3
C0
5a-3
C0
5b-3
C0
5-1
C0
5b-1
C0
9-1
C1
3-1
C0
5-3
C0
5a-3
C0
5b-3
C0
5-1
C0
5b-1
C0
9-1
C1
3-1
C0
5-3
C0
5a-3
C0
5b-3
C0
5-1
C0
5b-1
C0
9-1
C1
3-1
C0
5-3
C0
5a-3
C0
5b-3
C0
5-1
C0
5b-1
C0
9-1
C1
3-1
C0
5-3
C0
5a-3
C0
5b-3
C0
5-1
C0
5b-1
C0
9-1
C1
3-1
C0
5-3
C0
5a-3
C0
5b-3
C0
5-1
C0
5b-1
C0
9-1
C1
3-1
C0
5-3
C0
5a-3
C0
5b-3
C0
5-1
C0
5b-1
C0
9-1
C1
3-1
2025 2026 2027 2028 2029 2030 2031 2032 2033 2034
Cu
mu
lati
ve C
apac
ity
(MW
)
Final Screening Portfolio Comparison (2025 - 2034)
Gas Conversion DSM CCCT FOTs Renewable Other Early Retirement End of Life Retirement

Integrated Resource Plan 2 0 1 5
Preferred Portfolio Selection
Final Screening
PaR: Risk Adjusted PVRR
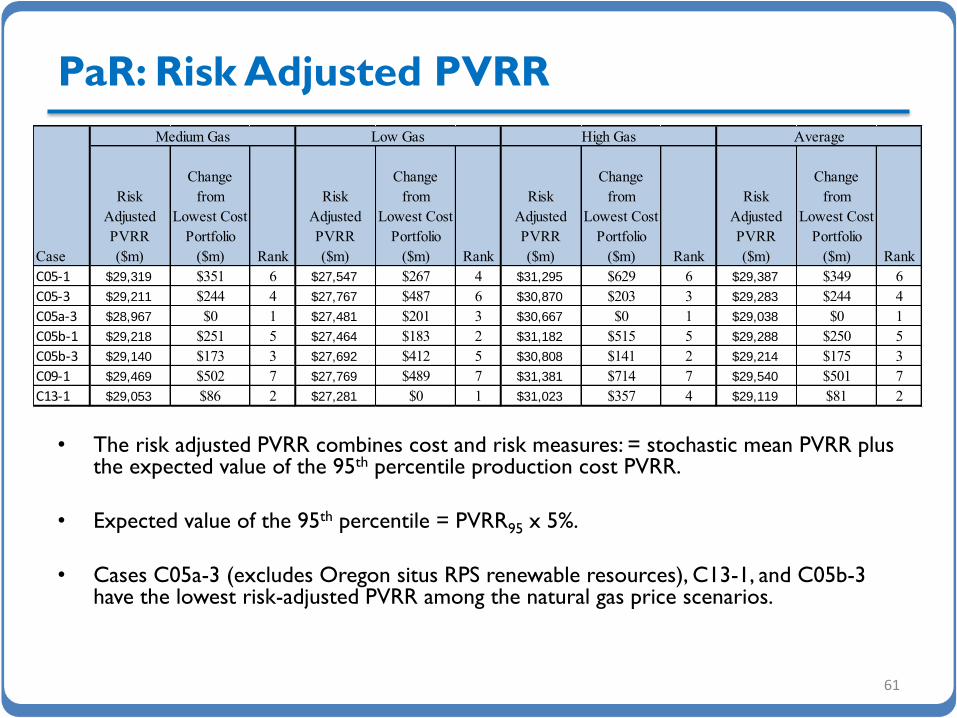
• The risk adjusted PVRR combines cost and risk measures: = stochastic mean PVRR plus the expected value of the 95th percentile production cost PVRR.
• Expected value of the 95th percentile = PVRR95 x 5%.
• Cases C05a-3 (excludes Oregon situs RPS renewable resources), C13-1, and C05b-3 have the lowest risk-adjusted PVRR among the natural gas price scenarios.
61
Risk
Adjusted
PVRR
($m)
Change
from
Lowest Cost
Portfolio
($m) Rank
Risk
Adjusted
PVRR
($m)
Change
from
Lowest Cost
Portfolio
($m) Rank
Risk
Adjusted
PVRR
($m)
Change
from
Lowest Cost
Portfolio
($m) Rank
Risk
Adjusted
PVRR
($m)
Change
from
Lowest Cost
Portfolio
($m) Rank
C05-1 $29,319 $351 6 $27,547 $267 4 $31,295 $629 6 $29,387 $349 6
C05-3 $29,211 $244 4 $27,767 $487 6 $30,870 $203 3 $29,283 $244 4
C05a-3 $28,967 $0 1 $27,481 $201 3 $30,667 $0 1 $29,038 $0 1
C05b-1 $29,218 $251 5 $27,464 $183 2 $31,182 $515 5 $29,288 $250 5
C05b-3 $29,140 $173 3 $27,692 $412 5 $30,808 $141 2 $29,214 $175 3
C09-1 $29,469 $502 7 $27,769 $489 7 $31,381 $714 7 $29,540 $501 7
C13-1 $29,053 $86 2 $27,281 $0 1 $31,023 $357 4 $29,119 $81 2
Case
Medium Gas Low Gas High Gas Average

Oregon RPS Compliance: C05a-3 vs.
C05b-3
• Portfolio costs decline with the removal of 448 MW of west wind (situs assigned for Oregon RPS compliance), representing the difference between cases C05b-3 and C05a-3.
• When these situs renewable resources are removed in C05a-3, approximately 467,000 annual unbundled REC purchases over the 2018 – 2034 timeframe would be needed to achieve the same level of Oregon RPS compliance by 2034 as achieved in Case C05b-3.
• Based on PaR results, which do not reflect 111(d) thermal back down differences between the two cases, unbundled REC prices below $37/REC to $55/REC, depending upon natural gas price assumptions, would favor Case C05a-3 over Case C05b-3.
• Based on System Optimizer results, which reflect 111(d) thermal back down differences between the two cases, unbundled REC prices below $18/REC, using medium natural gas price assumptions applied during the portfolio development process), would favor Case C05a-3 over Case C05b-3.
• There is sufficient volume and unbundled RECs at prices falling below those shown above to satisfy near-term unbundled REC needs.
• An unbundled REC strategy does not eliminate the option to pursue longer-term compliance with bundled RECs from new renewable resources, which are not needed until 2028.
62
PaR Risk Adjusted PVRR System Optimizer
Reduction in System PVRR with Removal of OR Situs Renewables
($m)
Nominal Levelized Reduction in System
PVRR per MWh of OR Unbundled RECs
Reduction in System PVRR with Removal of OR Situs Renewables
($m)
Nominal Levelized Reduction in System
PVRR per MWh of OR Unbundled RECs
Low Natural Gas $211 $55/REC n/a
Medium Natural Gas $173 $45/REC $71 $18/REC
High Natural Gas $141 $37/REC n/a

Deterministic Risk Analysis
• Portfolios are locked-down and analyzed under assumptions that differ from those used to develop the portfolio. The analysis is performed using System Optimizer. – Portfolios from Cases C05a-3 and C05b-3 are analyzed under a PacifiCorp system mass cap as assumed
when developing C13-1 (mass cap applicable to existing fossil generation).
– Portfolio from Case C13-1 is analyzed under a state emission rate requirement, allowing for flexible allocation of system renewables.
• Case C05a-3 is lower cost than Cases C05b-3 and C-13 under both the state emission rate requirement with flexible allocation of renewables scenario and the hard cap imposed on existing fossil generation scenario.
63
Case
State Emission Rate Targets with Flexible Allocation of Renewables
Hard Cap Applicable to Existing Fossil Units
PVRR ($m) Increase from Lowest
Cost Portfolio ($m) PVRR ($m) Increase from Lowest
Cost Portfolio ($m)
C05a-3 $26,578 n/a $26,879 n/a
C05b-3 $26,649 $71 $27,023 $144
C13-1 $27,042 $465 $26,902 $23
Portfolio Differences Between C13-1 and
C05a-3 • The Case C13-1 resource portfolio was developed assuming states in which PacifiCorp owns
111(d)-affected fossil generation develop plans allowing PacifiCorp to meet EPA’s 111(d) targets via a PacifiCorp system mass cap applied to existing resources used to calculate state emission rate targets by EPA (excludes new units).
• Given the underlying 111(d) assumptions applied in developing Case C-13, new natural gas combined cycle (NGCC) units in the west side of PacifiCorp’s system were made available for selection in the Case C13-1 portfolio.
– 2023 = 477 MW NGCC unit in the Willamette Valley
– 2033 = 454 MW NGCC unit in Southern Oregon
– 2034 = 454 MW NGCC unit in Southern Oregon
• Assuming new NGCC units will be covered under 111(d), these new NGCC units would increase Oregon’s 111(d) compliance obligations if a PacifiCorp system hard cap solution is not implemented as assumed when developing Case C13-1. – The new NGCC units may need to be backed down to below economic dispatch levels to mitigate
compliance costs.
– Additional low operating cost fossil generation may need to be backed down to offset the incremental emissions obligations from these west side NGCC units.
• Case C05a-3, developed assuming PacifiCorp meets its share of state emission rate targets, does not contain west side NGCC units.
64

System Optimizer Cost Comparisons
• Case C05a-3 is the lowest cost portfolio based on PVRR results from System Optimizer.
• As discussed above, with unbundled REC purchases below $18/REC, Case C05a-3 would remain lower cost relative to C05b-3 (which has similar costs relative to cases C05b-1 and C05-1) given the medium natural gas price assumptions used to model portfolios in System Optimizer.
65
$0.0 $37.5 $64.9 $68.3 $71.0 $231.3 $324.2$0
$50
$100
$150
$200
$250
$300
$350
C05a-3 C05-3 C05b-1 C05-1 C05b-3 C09-1 C13-1
$ M
illi
on
Change in System PVRR From Lowest Cost Portfolio

Stochastic Mean ENS
• This metric helps to identify potential portfolio outliers with regard to ENS.
• Portfolios are ranked by the average annual mean ENS over the twenty year planning period.
• The difference between top and bottom ranked portfolios is approximately 0.03% of forecasted load for years 2015-2034 (i.e. 23GWh/69,512 GWh).
• Each of the portfolios summarized above exhibit similar stochastic mean ENS results.
66
Average
Annual
ENS, 2015-
2034
(GWh)
Change
from
Lowest
ENS
Portfolio Rank
Average
Annual
ENS, 2015-
2034
(GWh)
Change
from
Lowest
ENS
Portfolio Rank
Average
Annual
ENS, 2015-
2034
(GWh)
Change
from
Lowest
ENS
Portfolio Rank
Average
Annual
ENS, 2015-
2034
(GWh)
Change
from
Lowest
ENS
Portfolio Rank
C05-1 61 18 4 60 18 4 62 18 3 61 18 4
C05-3 65 22 7 64 22 7 67 22 7 65 22 7
C05a-3 62 19 5 61 19 5 64 19 5 62 19 5
C05b-1 60 17 3 60 18 3 62 18 4 61 18 3
C05b-3 64 21 6 63 21 6 65 21 6 64 21 6
C09-1 56 13 2 55 13 2 57 13 2 56 13 2
C13-1 43 0 1 42 0 1 44 0 1 43 0 1
Case
Medium Gas Low Gas High Gas Average
Upper Tail ENS
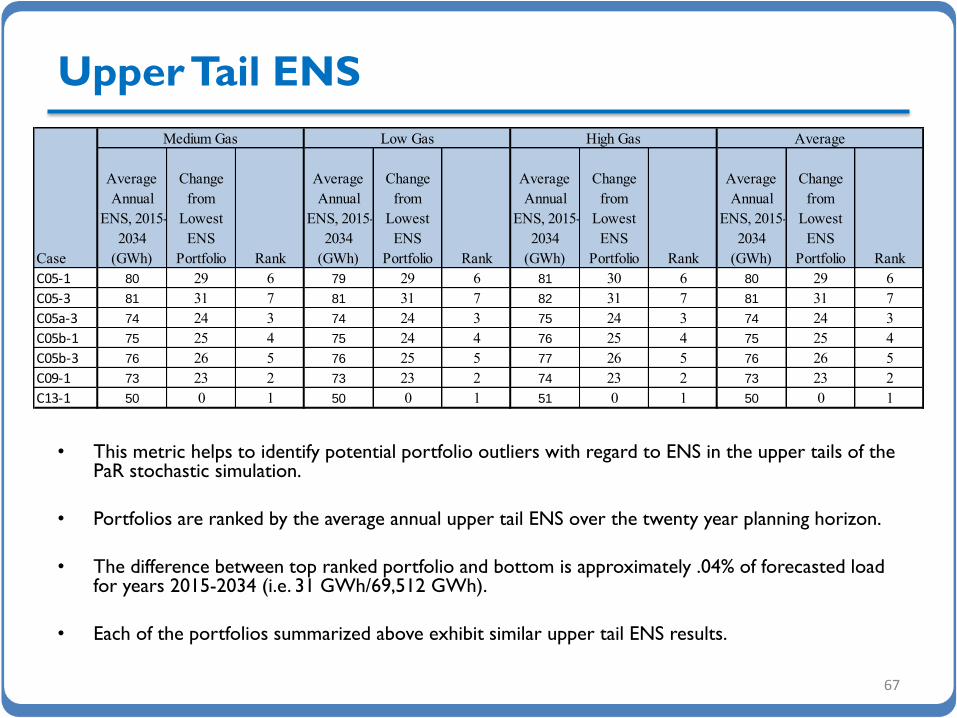
• This metric helps to identify potential portfolio outliers with regard to ENS in the upper tails of the PaR stochastic simulation.
• Portfolios are ranked by the average annual upper tail ENS over the twenty year planning horizon.
• The difference between top ranked portfolio and bottom is approximately .04% of forecasted load for years 2015-2034 (i.e. 31 GWh/69,512 GWh).
• Each of the portfolios summarized above exhibit similar upper tail ENS results.
67
Average
Annual
ENS, 2015-
2034
(GWh)
Change
from
Lowest
ENS
Portfolio Rank
Average
Annual
ENS, 2015-
2034
(GWh)
Change
from
Lowest
ENS
Portfolio Rank
Average
Annual
ENS, 2015-
2034
(GWh)
Change
from
Lowest
ENS
Portfolio Rank
Average
Annual
ENS, 2015-
2034
(GWh)
Change
from
Lowest
ENS
Portfolio Rank
C05-1 80 29 6 79 29 6 81 30 6 80 29 6
C05-3 81 31 7 81 31 7 82 31 7 81 31 7
C05a-3 74 24 3 74 24 3 75 24 3 74 24 3
C05b-1 75 25 4 75 24 4 76 25 4 75 25 4
C05b-3 76 26 5 76 25 5 77 26 5 76 26 5
C09-1 73 23 2 73 23 2 74 23 2 73 23 2
C13-1 50 0 1 50 0 1 51 0 1 50 0 1
Case
Medium Gas Low Gas High Gas Average

CO2 Emissions
• This metric helps identifies potential emission outliers among portfolios.
• Portfolios are ranked by accumulated annual emissions over the twenty year planning horizon.
• Portfolios developed under Regional Haze Scenario 1 (with higher assumed coal unit retirements) have lower emissions than portfolios developed under Regional Haze Scenario 3. However, each of the portfolios achieve notable emission reductions by the end of the 20-year IRP planning horizon.
68
Total CO2
Emissions,
2014-2034
(Thousand
Tons)
Change
from
Lowest
Emitting
Portfolio Rank
Total CO2
Emissions,
2014-2034
(Thousand
Tons)
Change
from
Lowest
Emitting
Portfolio Rank
Total CO2
Emissions,
2014-2034
(Thousand
Tons)
Change
from
Lowest
Emitting
Portfolio Rank
Total CO2
Emissions,
2014-2034
(Thousand
Tons)
Change
from
Lowest
Emitting
Portfolio Rank
C05-1 889,576 - 1 882,521 2,021 2 885,516 - 1 885,871 350 2
C05-3 929,133 39,557 5 920,425 39,926 5 925,789 40,273 5 925,116 39,595 5
C05a-3 929,808 40,232 7 920,690 40,191 7 926,533 41,017 7 925,677 40,156 7
C05b-1 892,956 3,380 4 885,615 5,116 4 889,002 3,486 4 889,191 3,670 4
C05b-3 929,146 39,569 6 920,445 39,946 6 925,797 40,281 6 925,129 39,608 6
C09-1 891,909 2,333 3 883,946 3,447 3 887,727 2,211 3 887,861 2,340 3
C13-1 889,921 345 2 880,500 - 1 886,142 626 2 885,521 - 1
Case
Medium Gas Low Gas High Gas Average

Annual CO2 Emissions
• Regional Haze Scenario 1 portfolios accelerate emission reductions relative to Regional Haze Scenario 3 portfolios.
• However, comparable Regional Haze Scenario 3 portfolios generally show lower average risk adjusted PVRR system costs across natural gas price scenarios.
69
30
35
40
45
50
55
2015 2016 2017 2018 2019 2020 2021 2022 2023 2024 2025 2026 2027 2028 2029 2030 2031 2032 2033 2034
Mill
ion
To
ns
Medium GasCO2 Levels
C05-1 C05-3 C05a-3 C05b-1 C05b-3 C09-1 C13-1
30.0
35.0
40.0
45.0
50.0
55.0
2015 2016 2017 2018 2019 2020 2021 2022 2023 2024 2025 2026 2027 2028 2029 2030 2031 2032 2033 2034
Mill
ion
To
ns
Low GasCO2 Levels
C05-1 C05-3 C05a-3 C05b-1 C05b-3 C09-1 C13-1
30.0
35.0
40.0
45.0
50.0
55.0
2015 2016 2017 2018 2019 2020 2021 2022 2023 2024 2025 2026 2027 2028 2029 2030 2031 2032 2033 2034
Mill
ion
To
ns
High GasCO2 Levels
C05-1 C05-3 C05a-3 C05b-1 C05b-3 C09-1 C13-1

Portfolio Performance in the Medium
Natural Gas High CO2 Price Scenario
• With high CO2 prices, Regional Haze Scenario 1 portfolios exhibit lower risk adjusted PVRR costs and lower emissions.
• Each portfolio produces similar ENS results under the high CO2 price scenario as applied in PaR.
• Comparative analysis of portfolios under the high CO2 price scenario will be informative to the acquisition path analysis for the 2015 IRP.
70
Risk
Adjusted
PVRR
($m)
Change
from
Lowest
Cost
Portfolio
($m) Rank
Average
Annual
ENS, 2015-
2034
(GWh)
Change
from
Lowest
ENS
Portfolio Rank
Average
Annual
ENS, 2015-
2034
(GWh)
Change
from
Lowest
ENS
Portfolio Rank
Total CO2
Emissions,
2014-2034
(Thousand
Tons)
Change
from
Lowest
Emitting
Portfolio Rank
C05-1 50,869$ 570$ 4 64 11 4 81 30 6 737,760 9,810 2
C05-3 51,916$ 1,617$ 7 68 15 7 82 31 7 767,639 39,689 6
C05a-3 51,799$ 1,501$ 5 64 11 5 75 24 3 766,612 38,662 5
C05b-1 50,754$ 455$ 3 64 10 3 76 25 4 742,050 14,100 3
C05b-3 51,839$ 1,540$ 6 67 14 6 77 26 5 767,936 39,986 7
C09-1 50,299$ -$ 1 58 5 2 74 23 2 727,950 - 1
C13-1 50,327$ 28$ 2 53 0 1 51 0 1 752,923 24,973 4
CO2 EmissionsRisk Adjusted PVRR Stochastic Mean ENS Upper Tail ENS
Case

Portfolio Selection: Conclusions
• Based on comparative analysis among alternative portfolios, PacifiCorp has selected Case C05a-3 as the least cost, least risk portfolio.
• Case C05a-3 is among the highest ranking portfolios on a risk adjusted PVRR basis, assuming unbundled REC purchases beginning 2018 can be acquired below $18/REC as required to achieve Oregon RPS compliance when the existing bundled REC bank is expected to expire in 2028.
• Deterministic risk analysis shows that Case C05a-3 is the least cost portfolio when compared to both C05b-3 and C13-1.
• The first deferrable thermal resource is needed in 2028, with additional long-term combined cycle resources added to replace up to 2,527 MW of coal generation that could retire by the end of the planning horizon contributing to significant emission reductions.
• Over the front ten years of the planning horizon, PacifiCorp can meets its needs with incremental DSM and FOT resources.
• Differences among the top performing portfolios would not materially impact the 2015 IRP Action Plan (focusing on resource actions in the front 2 – 4 years of the planning horizon).
71
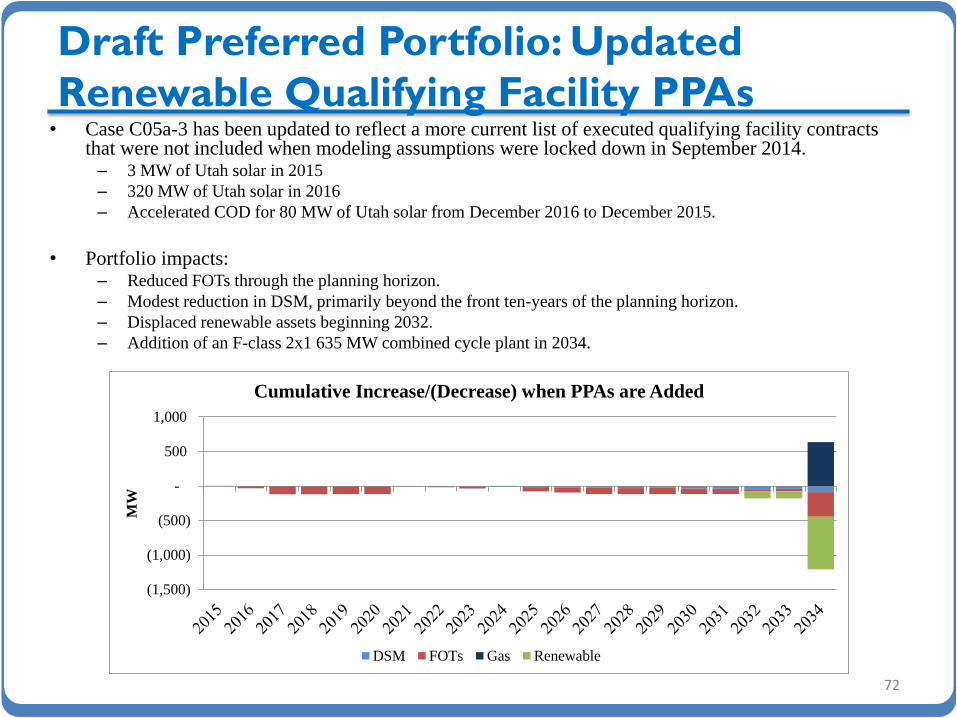
Draft Preferred Portfolio: Updated
Renewable Qualifying Facility PPAs • Case C05a-3 has been updated to reflect a more current list of executed qualifying facility contracts
that were not included when modeling assumptions were locked down in September 2014. – 3 MW of Utah solar in 2015
– 320 MW of Utah solar in 2016
– Accelerated COD for 80 MW of Utah solar from December 2016 to December 2015.
• Portfolio impacts: – Reduced FOTs through the planning horizon.
– Modest reduction in DSM, primarily beyond the front ten-years of the planning horizon.
– Displaced renewable assets beginning 2032.
– Addition of an F-class 2x1 635 MW combined cycle plant in 2034.
72
(1,500)
(1,000)
(500)
-
500
1,000
MW
Cumulative Increase/(Decrease) when PPAs are Added
DSM FOTs Gas Renewable

Integrated Resource Plan 2 0 1 5
Sensitivity Analysis Results

Sensitivity Case Definitions
74
Case # Benchmark
Case # Description Natural Gas Load DG PTC/ITC 111(d)
S-01 C05-1 Low Load Forecast Medium Low Base Expired Flexible System Allocation
S-02 C05-1 High Load Forecast Medium High Base Expired Flexible System Allocation
S-03 C05-1 1 in 20 Load Medium 1 in 20 Base Expired Flexible System Allocation
S-04 C05-1 Low Distributed Generation Medium Base Low Expired Flexible System Allocation
S-05 C05-1 High Distributed Generation Medium Base High Expired Flexible System Allocation
S-06 C05-1 Pumped Storage Medium Base Base Expired Flexible System Allocation
S-07 C07-1 Energy Gateway 2 Medium Base Base Expired Flexible System Allocation
S-08 C07-1 Energy Gateway 5 Medium Base Base Expired Flexible System Allocation
S-09 C05-1 PTC Extension Medium Base Base Through Study
Period Flexible System Allocation
S-10 C05-1 East/West BAAs Medium Base Base Expired Flexible System Allocation
S-11 C05-1 111(d) and High CO2 Price Medium/High CO2 Base Base Expired Flexible System Allocation
S-12 C05-1 Stakeholder Solar Cost Proposal Medium Base High Expired Flexible System Allocation
S-13 C05-1 Compressed Air Storage Medium Base Base Expired Flexible System Allocation
S-14 C05-1 Class 3 DSM Medium Base Base Expired Flexible System Allocation
S-15 C05-1 Restricted 111(d) Attributes Medium Base Base Expired 111(d) and REC Attributes
Must be Used Simultaneously

Sensitivities: Status
75
• The following sensitivity cases have been modeled in System Optimizer, and preliminary findings are summarized in the following slides:
– S-01, S-02, and S-03 (load)
– S-04 and S-05 (distributed generation)
– S-10 (Western Control Area)
• PaR runs have not yet been completed for any of the sensitivity cases.
• Work on remaining sensitivities is on-going.
• Final sensitivity study results will be reviewed at the February 26, 2015 public input meeting.

Load Sensitivities: S-01 to S-03
76
10,000
10,500
11,000
11,500
12,000
12,500
13,000
20
15
20
16
20
17
20
18
20
19
20
20
2021
20
22
20
23
20
24
20
25
20
26
20
27
20
28
2029
20
30
20
31
20
32
20
33
20
34
MW
Coincident System Peak Load
Base Low High 1 in 20
60,000
65,000
70,000
75,000
80,000
85,000
20
15
20
16
20
17
20
18
20
19
20
20
20
21
20
22
20
23
20
24
20
25
20
26
20
27
20
28
20
29
20
30
20
31
20
32
20
33
20
34
Net
GW
h
Load Forecast
Base Low High 1 in 20
System Optimizer PVRR
Base Load C05-1
Low Load S-01
High Load S-02
1 in 20 S-03
PVRR ($m)
$26,646 $24,715 $28,334 $27,709
Increase/(Decrease) from Base
($m) n/a ($1,931) $1,688 $1,063
Nom. Lev. Increase/(Decrease)
from Base ($/kW-mo)
n/a ($43) $39 $15
Nom. Lev. Increase/(Decrease)
from Base ($/MWh)
n/a ($55) $58 $13,057
• Changes to the timing of the first deferrable thermal resource and change in total deferrable thermal resources by 2034 are as follows :
– Low Load = deferred by 4 years, reduced by 423 MW by 2034
– High Load = accelerated by 4 years, increased by 635 MW by 2034
– 1 in 20 Load = accelerated by 5 years, increased by 203 MW by 2034
• The 1 in 20 sensitivity selects more peaking capacity resources.
– 101 MW of IC Aero, 18 MW of battery storage, earlier acquisition of Class 1 DSM, increased reliance on FOTs and Class 2 DSM.
• Nominal levelized results are calculated as the change in the PVRR of system costs divided by the present value change in coincident system peak ($/kW-mo) or the present value change in load ($/MWh).

DG Sensitivities: S-04 to S-05
77
• DG penetration levels are taken from the Navigant study.
• Changes to the timing of the first deferrable thermal resource and change in total deferrable thermal resources by 2034 are as follows:
– Low DG = no change, increased by 212 MW by 2034
– High DG = deferred by 3 years, decreased by 423 MW by 2034
• Nominal levelized results are calculated as the change in the PVRR of system costs divided by the present value change in coincident system peak ($/kW-mo) orthe present value change in load ($/MWh).
System Optimizer PVRR
Base Load C05-1
Low DG S-04
High DG S-05
PVRR ($m)
$26,646 $26,885 $26,016
Increase/(Decrease) from Base
($m) n/a $239 ($630)
Nom. Lev. Increase/(Decrease)
from Base ($/kW-mo)
n/a $26 ($31)
Nom. Lev. Increase/(Decrease)
from Base ($/MWh)
n/a $74 ($74)
0
100
200
300
400
500
600
2015
2016
2017
2018
2019
2020
2021
2022
2023
2024
2025
2026
2027
2028
2029
2030
2031
2032
2033
2034
MW
a
Base DG
UT OR WA WY ID CA
0
100
200
300
400
500
600
2015
2016
2017
2018
2019
2020
2021
2022
2023
2024
2025
2026
2027
2028
2029
2030
2031
2032
2033
2034
MW
a
Low DG
UT OR WA WY ID CA
0
100
200
300
400
500
600
2015
2016
2017
2018
2019
2020
2021
2022
2023
2024
2025
2026
2027
2028
2029
2030
2031
2032
2033
2034
MW
a
High DG
UT OR WA WY ID CA

West Control Area (WCA) Sensitivity: S-10
78
• WCA Portfolio developed with System Optimizer. – Winter peak, maintain 13% planning reserve margin.
– Allow January on-peak FOTs, maintaining limits at MidC (775 MW), COB (300 MW), and NOB (100 MW)
– Class 2 DSM capacity contribution updated to align with a winter peak.
– Two 111(d) compliance alternatives (no reliance on reallocation of system renewables): • Operate Chehalis at 1x1 minimum, and add incremental renewables.
• Eliminate 111(d) compliance obligation with a year-end early retirement of Chehalis.
• Combined WCA/system portfolio developed with System Optimizer. – Resources from the WCA portfolio are locked down.
– Summer peak, maintain 13% planning reserve margin.
– Summer on-peak FOTs, same limits as above with inclusion of Mona (300 MW).
– Class 2 DSM capacity contribution updated to align with a summer peak.
• Comparison to benchmark system Portfolio developed with System Optimizer that allows flexible allocation of renewables under 111(d). – Portfolio impacts.
– System cost impacts.

WCA Sensitivity: S-10 (Portfolio Results)
79
• January west side FOTs are added in each WCA/System portfolio.
• Notable Portfolio Changes: Before 111(d) – Incremental west side gas peaking resources added in 2019,
2026, and 2034.
– Reduced Q3 summer FOTs with changes in timing and need of east side CCCTs.
• Notable Portfolio Changes After 111(d) with Chehalis Re-dispatch & Renewables – 1,148 MW of renewables by 2021, with an additional 145 MW
in 2030.
– Incremental west side gas peaking resources in 2019 and 2023.
– Reduced CCCT capacity beginning 2024.
• Notable Portfolio Changes After 111(d) with Chehalis Retirement – Incremental west side gas peaking resources in 2019, 2020,
2026, and 2033.
– Acceleration of east side natural gas CCCT resources.
– More DSM and increase in flat FOTs (displacing Q3 summer FOTs).
(1,000)
(500)
0
500
1,000
1,500
2,000
2,500
201
5
201
6
201
7
201
8
201
9
202
0
202
1
202
2
202
3
202
4
202
5
202
6
202
7
202
8
202
9
203
0
203
1
203
2
203
3
203
4
MW
Cumulative Increase/(Decrease) Under WCA/System:
Before 111(d)
Q3 Sum FOT Flat FOT Jan FOT
Class 2 DSM Class 1 DSM CCCT
Gas Peaking Renewable Retire
(2,000)
(1,000)
0
1,000
2,000
3,000
4,000
201
5
201
6
201
7
201
8
201
9
202
0
202
1
202
2
202
3
202
4
202
5
202
6
202
7
202
8
202
9
203
0
203
1
203
2
203
3
203
4
MW
Cumulative Increase/(Decrease) Under WCA/System:
After 111(d) - Re-dispatch/Renewables
Q3 Sum FOT Flat FOT Jan FOT
Class 2 DSM Class 1 DSM CCCT
Gas Peaking Renewable Retire
(2,000)
(1,000)
0
1,000
2,000
3,000
201
5
201
6
201
7
201
8
201
9
202
0
202
1
202
2
202
3
202
4
202
5
202
6
202
7
202
8
202
9
203
0
203
1
203
2
203
3
203
4
MW
Cumulative Increase/(Decrease) Under WCA/System:
After 111(d) - Retire Chehalis
Q3 Sum FOT Flat FOT Jan FOT
Class 2 DSM Class 1 DSM CCCT
Gas Peaking Renewable Retire

WCA Sensitivity: S-10 (System Costs)
80
• Net changes to system costs increase under a WCA/System portfolio.
• Increased system costs under a WCA/System portfolio increase significantly when overlaid with111(d).
• Under a WCA/System portfolio, eliminating PacifiCorp’s 111(d) compliance obligation in Washington by retiring Chehalis is lower cost than reducing Chehalis dispatch and offsetting its emissions with new renewable resources.
WCA/System PVRR ($m) Benchmark System PVRR
($m)
Increase in WCA/System PVRR ($m)
Before 111(d) $26,678 $26,463 $215
After 111(d) (Re-dispatch & Renewables)
$27,829 $26,646 $1,183
After 111(d) (Retire Chehalis)
$27,314 $26,646 $668

Reminder - Upcoming Meeting
• February 26, 2015
– Sensitivity Study Update
– 2015 IRP Draft Action Plan
– Wrap-up discussion
• March 31, 2015
– Target filing date
81


![Public Input No. 197-NFPA 99-2015 [ Global Input ] … Input No. 412-NFPA 99-2015 [ Global Input ] Type your content here ... Additional Proposed Changes File Name Description Approved](https://img.pdfslide.net/doc/110x75/5ae7b38c7f8b9a8b2b8ef3f4/public-input-no-197-nfpa-99-2015-global-input-input-no-412-nfpa-99-2015.jpg)