Embed Size (px)
Citation preview

The 2015 Kitwanga River Salmon Smolt Assessment
Submitted to: Gitanyow Hereditary Chiefs Pacific Salmon Foundation Fisheries and Oceans Canada (Prince Rupert – Stock Assessment)
Prepared by: Mike McCarthy, HBSc. Derek Kingston, BSc, RPBio Gitanyow Fisheries Authority
P.O. Box 148 Kitwanga, BC, V0J 2A0
Date: March 15, 2016
Gitanyow Fisheries
Authority

The 2015 Kitwanga River Salmon Smolt Assessment
_____________________________________________________________________ Gitanyow Fisheries Authority
ii
Table of Contents
1. Introduction and Background...................................................................................................1
2. Methods....................................................................................................................................2
2.1 Coho Coded Wire Tag (CWT) Program ..........................................................................7
2.2 Vaki Bioscanner unit (Vaki) ............................................................................................8
3. Results ....................................................................................................................................10
3.1 Sockeye Salmon .............................................................................................................10
3.1.1 Sockeye Run Timing ..............................................................................................10
3.1.2 Sockeye Age and Size Structure.............................................................................12
3.1.3 Sockeye Smolt Population Estimates and Smolt Production .................................14
3.1.4 Vaki Bioscanner Results ........................................................................................15
3.2 Coho Salmon ..................................................................................................................15
3.2.1 Coho Run Timing...................................................................................................15
3.2.2 Coho Age and Size Structure .................................................................................17
3.2.3 Coho Wire Tag Program ........................................................................................19
3.3 Run Timing of Other Species.........................................................................................19
4. Discussion and Recommendations.........................................................................................20
5. References ..............................................................................................................................21
List of Tables
Table 1: Number of fish by salmonid species (salmon/trout/char) counted through the KSF from
April 2nd and June 23rd, 2015. .............................................................................................10
Table 2: 2015 sockeye run timing highlights compared to 2001 to 2014 results.........................11
Table 3: Length and weight statistics for 1-year-old sockeye sampled in 2015 (n=505). ...........12
Table 4: Lengths and weight statistics for one-year-old sockeye sampled since 2008 at the KsF.
..............................................................................................................................................13
Table 5: Kitwanga River sockeye smolt population estimate from 2008 – 2015. .......................14
Table 6: Sockeye smolt production in 2015 compared to results from the KsF from 2008 to 2015.
..............................................................................................................................................15
Table 7: 2015 coho run timing highlights compared to 2009 to 2014 results..............................16
Table 8: 2014 coho smolt age results. ..........................................................................................17
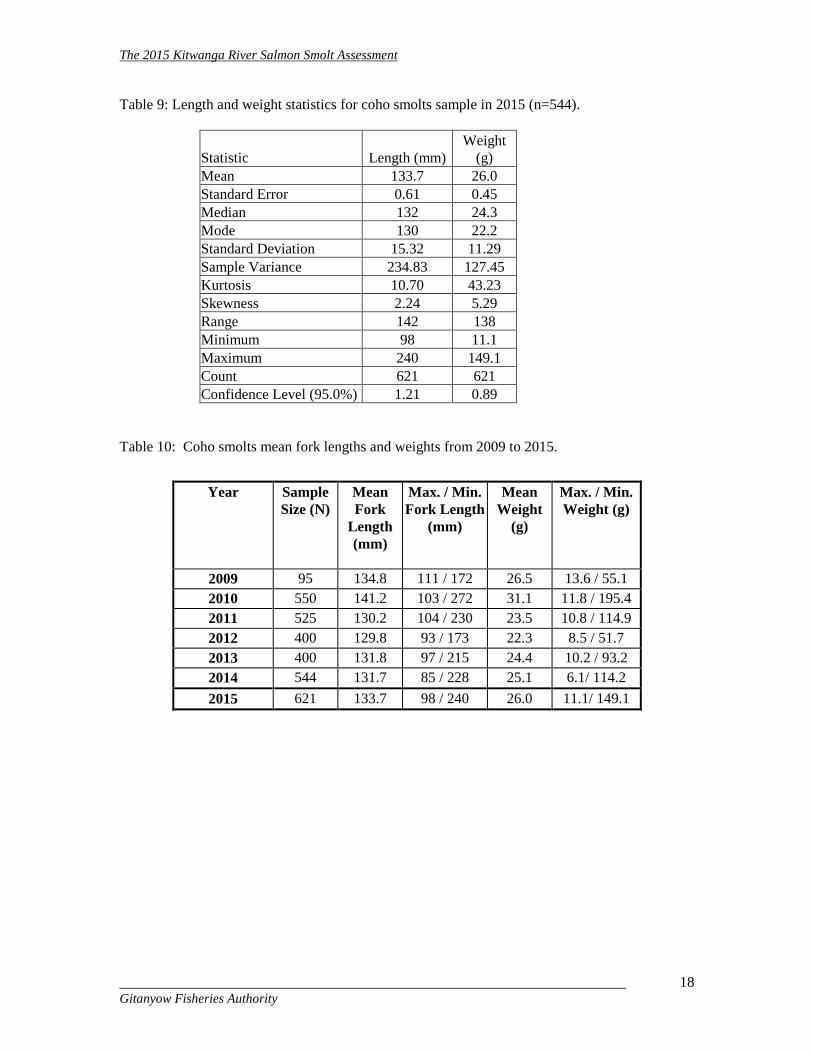
Table 9: Length and weight statistics for coho smolts sample in 2015 (n=544). ........................18
Table 10: Coho smolts mean fork lengths and weights from 2009 to 2015................................18

The 2015 Kitwanga River Salmon Smolt Assessment
_____________________________________________________________________ Gitanyow Fisheries Authority
iii
Table 11: Coho CWT estimates for tag mortality, tag loss, and total CWT’s released in 2015 at
the KsF. ................................................................................................................................19
List of Figures and Photos
Figure 1: Location of the Kitwanga River Smolt Enumeration Facility (KsF).............................3
showing reference to Gitanyow Lake outlet and Highway 37N (Image supplied from
www.googleearth.com). .........................................................................................................3
Figure 2: Completed aluminum weir installed in 2013 with new non-skid walkway and safety
railings....................................................................................................................................5
Figure 3: Photo of smolt trap box showing dewatering screen. .....................................................5
Figure 4: Photo of large holding boxes attached to smolt trap boxes with 6” hose.......................6
Figure 5: Photo of smolt fence installed showing smolt traps, 6” hose, stop-logs and walkway. .6
Figure 6: Photo of smolt holding box with captured sockeye smolts. ...........................................7
Figure 7: Photo of Coded Wire Tag (CWT) machine, Quality Control Device (QCD) and
sampling station set-up...........................................................................................................8
Figure 8: Photo series of the Vaki Bioscanner trough design, digital counter, and instream
operation.................................................................................................................................9
Figure 9: Daily run timing for sockeye smolt emigrating through the KsF in 2015 (n=12,165). 11
Figure 10: Length distribution (5mm class intervals) for 1-year-old sockeye sampled in 2015 at
the KsF (n=505). ..................................................................................................................13
Figure 11: Daily run timing for coho smolt emigrating through the KsF in 2015 (n=4,517). .....16
Figure 12: Length distribution (5mm class intervals) for coho sampled in 2015 at the KsF
(N=544). ...............................................................................................................................19
Appendix I: Letter from Carol Lidstone of Birkenhead Scale Analyses regarding 2015
sockeye smolt aging results.

The 2015 Kitwanga River Salmon Smolt Assessment
_____________________________________________________________________ Gitanyow Fisheries Authority
iv
Abstract
In 2015, the Gitanyow Fisheries Authority (GFA) operated the Kitwanga River Smolt
Enumeration Facility (KsF) for the 8th consecutive year since initiated in 2008 to enumerate
sockeye and coho salmon smolts, and other resident trout and char species. The KsF was
operated from April 2nd to June 23rd, 2015. The 2015 sockeye smolt population estimate was
12,165 fish (lowest count recorded since 2008) and was comprised mostly of 1-Yr old smolts
(99%). The peak run of 4,114 sockeye smolts occurred on May 2nd when 34% of the entire run
migrated past the KsF on that day. This is comparable to previous years when peak runs
generally occur in the 1st or 2nd week of May (Figure 9). The midpoint of the run occurred on
May 20th and is also comparable to previous years results. Approximately 99% of the sockeye
smolts migrated through the weir in a 24-day period from April 18th to May 11th, 2015, which is
also comparable to previous years. Freshwater production estimates for Gitanyow Lake sockeye
in 2014 were estimated at 44 sockeye smolts per female spawner from the 2013 adult run, which
was the third lowest recorded since 2008. A Vaki Bioscanner was used for a portion of the peak
sockeye run and will be used in future years to assist fence staff during peak run periods. Coho
smolt counts totaled 4,517 fish during the 2015 KsF operation, however coho smolts were still
passing through in relatively high numbers at fence closure. Budget constraints did not allow for
the full capture of the coho smolt run. A total of 2,029 coho affixed with a CWT were
successfully released downstream in 2015 (out of 4,517 smolts or 45 % of the run to June 23rd,
2015). The 2014 age results, not presented in 2014 report, were available for this report. Scales
from 545 coho smolts from 2014 were submitted to DFO for age analysis and of these, 374 scales
were deemed readable (7.2% of the total run of 5,222 fish). The majority of the coho were 1-
year old fish (74%; originating from the 2012 adult run of 2,691 fish), followed by 2-year old
coho (26%; originating from the 2011 adult run of 1,422 fish). Based on previous years, 1-year-
old smolts are most abundant, followed by 2-year-old smolts, then incidental 3-year-old smolts.

The 2015 Kitwanga River Salmon Smolt Assessment
_____________________________________________________________________ Gitanyow Fisheries Authority
v
Acknowledgements
The GFA would like to thank Fisheries and Oceans Canada (Prince Rupert – Stock Assessment
division), Pacific Salmon Foundation and the Gitanyow Hereditary Chiefs AFS program for
jointly funding the operation of the KsF in 2015. GFA would also like to acknowledge the hard
work of the GFA smolt fence staff whose dedication made the operations a success including:
Les McLean, Earl McLean, Vern Russell, Phillip Johnson, Brenton Williams, Johnny Martin,
Owen Russell, Morgan Douse, Mark Cleveland, Derek Kingston, Gregory Rush and Kevin Koch.

The 2015 Kitwanga River Salmon Smolt Assessment
_____________________________________________________________________ Gitanyow Fisheries Authority
1
1. INTRODUCTION AND BACKGROUND
In this report, emigration (downstream flow) for the 2015 spring smolt run of anadromous
sockeye (Oncorhynchus nerka) and coho (O. kisutch) salmon smolts and resident trout and char
species passing through the KsF from Gitanyow Lake will be discussed. The 2015 smolt
sampling season represents the 8th consecutive year that this project has been implemented.
Historically, the Gitanyow fished salmon in the Kitwanga River for food, social and ceremonial
purposes with sockeye being the main salmon species of choice. In the early 1900’s sockeye
stocks were thriving and Gitanyow Elders spoke of the lakeshores of Gitanyow Lake turning red
every fall as the sockeye congregated to spawn on their respective spawning grounds. However,
by the 1920’s the Elders talked of the noticeable declines in the returns of the Kitwanga sockeye
stock. By the 1960’s most fishing sites along the Kitwanga River were abandoned and aboriginal
fishing for sockeye had ceased due to low run numbers and concerns for the unique stock
(Cleveland 2005, Kingston 2013).
One of the largest contributors to sockeye decline is suspected to be over-exploitation of the
stock in commercial ocean fisheries. Past fishery re-constructions for the last 40 years show the
average exploitation on Kitwanga sockeye has often been over 50% and reaching as high as 70%
in some years (Cox-Rogers, DFO, Pers. comm., 2010). Other factors likely contributed to the
declines such as sockeye spawning habitat destruction in the Kitwanga Watershed due to poor
forest harvesting practices, which include sedimentation, disruption of water flow patterns, and
changes in water quality of Gitanyow Lake tributary streams (Cleveland 2006, Kingston 2013).
Accurate Kitwanga adult salmon escapement data has been ongoing since the construction and
continual operation of the Kitwanga River Salmon Enumeration Facility (KSEF) in 2003 near the
mouth of the Skeena River and the construction and continual operation of the Kitwanga River
Smolt Enumeration Facility (KsF) in 2008. In 1999, GFA initiated a Kitwanga sockeye-
rebuilding program to conserve, protect and recover the stock. One of the highest rebuilding
priorities for the Kitwanga Sockeye Salmon Recovery Plan (KSRP), which was initiated in 2006,
was to continue monitoring the yearly abundance of Kitwanga sockeye salmon smolts emigrating
from Gitanyow Lake (Cleveland et al. 2006, Kingston 2013). Annual KsF reports from 2009 to
2014 can be viewed on http://www.gitanyowfisheries.com/kitwanga-smolt-fence-enumeration .

The 2015 Kitwanga River Salmon Smolt Assessment
_____________________________________________________________________ Gitanyow Fisheries Authority
2
The KsF plays a critical role in allowing GFA to monitor Kitwanga sockeye smolt production
from Gitanyow Lake on a yearly basis. Assessing smolt production is important to the Gitanyow
because it helps gauge the effectiveness of sockeye-rebuilding programs currently being carried
out in the Kitwanga watershed. Since 1998, the GFA have been working diligently throughout
the Kitwanga watershed to restore the sockeye stock to historical levels.
From 2000 to 2007, GFA experimented with different weir and trap designs in an effort to
accurately count Kitwanga sockeye smolts on a yearly basis. For the most part, these trap
designs were unusable on the Kitwanga River when an unknown number of smolts passed though
undetected (Kingston 2013). In 2007 and 2008, the GFA were successful in acquiring funding to
construct a permanent smolt fence on the Kitwanga River below Gitanyow Lake. The KsF
became operational in April 2008 and since then has annually counted all salmonids emigrating
downstream from Gitanyow Lake.
In 2009, GFA initiated a coho coded wire tagging (CWT) program, which are counted at the
KSEF or captured and reported ideally in whole but realistically in part by Alaskan and Canadian
fisheries. Tag recovery information helps fisheries managers determine coho survival rates and
fisheries specific exploitation of yearly cohorts, which represent a portion of Skeena coho stocks
with similar life history traits.
This report summarizes the results and findings for the KsF program in 2015.
2. METHODS
Counts at the KsF started on April 2nd, 2015 and continued until June 23rd, 2015. All of the
aluminum components were installed then pulled from the river outside this period allowing free-
flow of fish. The KsF is located on the Kitwanga River approximately 600m downstream from
the outlet of Gitanyow Lake (UTM’s 9U 557014E; 6131839N - Figure 1). The design of the KsF
consists of an aluminum-based weir that passively diverts emigrating smolts and other resident
trout species into one of three trap boxes where they can be easily enumerated, sampled and
released (Figure 2).

The 2015 Kitwanga River Salmon Smolt Assessment
_____________________________________________________________________ Gitanyow Fisheries Authority
3
Figure 1: Location of the Kitwanga River Smolt Enumeration Facility (KsF) showing reference to Gitanyow Lake outlet and Highway 37N (Image supplied from
www.googleearth.com).
The aluminum weir and smolt trap boxes were attached to preformed concrete aprons that were
placed in the riverbed during the construction of the smolt fence completion project (Kingston,
2008). The weir is constructed of prefabricated smolt panels, trap boxes and transoms that can
be easily installed and removed by the GFA fisheries technicians. The aluminum weir is
designed to mimic the physical features of a beaver dam where water is backed-up, forming a
head of water upstream of the weir which spills over in a desired location. Traps boxes are
installed at the spill locations and easily capture downstream moving fish that key in on the area.
The weir is installed at a 45º angle to the rivers flow, which naturally moves fish to the left bank
of the river where the trap boxes are installed.

The 2015 Kitwanga River Salmon Smolt Assessment
_____________________________________________________________________ Gitanyow Fisheries Authority
4
The trap boxes were designed with dewatering screens that funneled the smolts into a small
holding box where they remained trapped (see Figures 2-6 for photos of fence design). Once the
fish were committed to entering the dewatering screens, the fish are then transported down the V-
shaped grooves where the water velocity was too great for them to swim back upstream. From
the small holding boxes that are attached to the dewatering screens, fish continue to move
downstream through a 6” rigid plastic hose to a large covered 8’ X 4’ X 4’ holding box where
they remain until they are sampled each day. The KsF consisted of three smolt traps that were
connected to three large holding boxes. Four to five rows of 6” X 6’ stop-logs were placed at the
back of each transom to create a damming effect upstream of the fence. The stop-logs created a
6” to 12” head effect upstream of the fence at each of the smolt traps, which allowed them to
work effectively to catch fish.
Crews of two or three GFA fisheries technicians would check the trap first thing in the morning
and conduct fish sampling and smolt enumeration work. The fence site was visited again just
before dark daily to clean debris off the fence and ensure the traps were fishing at the proper
water level. Trap adjustments could be made so the optimum amount of water was flowing
through each trap area. This ensured the fish were captured in a passive, harmless manner. Sub
samples of all sockeye smolts caught daily were measured to determine their lengths and weights.
Fork lengths were taken to the nearest 1 mm and weights to the nearest 0.1 grams.

The 2015 Kitwanga River Salmon Smolt Assessment
_____________________________________________________________________ Gitanyow Fisheries Authority
5
Figure 2: Completed aluminum weir installed in 2013 with new non-skid walkway and safety railings.
Figure 3: Photo of smolt trap box showing dewatering screen.
Dewatering screen

The 2015 Kitwanga River Salmon Smolt Assessment
_____________________________________________________________________ Gitanyow Fisheries Authority
6
Figure 4: Photo of large holding boxes attached to smolt trap boxes with 6” hose.
Figure 5: Photo of smolt fence installed showing smolt traps, 6” hose, stop-logs and walkway.
Walkway
Smolt traps
Hose
Stop-logs

The 2015 Kitwanga River Salmon Smolt Assessment
_____________________________________________________________________ Gitanyow Fisheries Authority
7
Figure 6: Photo of smolt holding box with captured sockeye smolts.
2.1 Coho Coded Wire Tag (CWT) Program
Since 2009, but excluding 2012, GFA implemented a Kitwanga coho smolt CWT program in
conjunction with the operation of the KsF. As in other years nearly half or more of all coho
captured in 2015 were implanted with a CWT. In addition to tagging, scales were taken from
approximately 14% of the run (623 out of 4,517 fish) for age determination. For all submitted
age samples, fork lengths were taken to the nearest 1 mm and weights to the nearest 0.1 grams.
Coho implanted with a CWT were first anaesthetized using a bath of river water and clove oil.
All tagged coho were given an adipose fin clip to make them recognizable by commercial fishers
and the KSEF counting crew upon return. Once anaesthetized, the CWT’s were implanted into
the nose of the coho with a Mark II automated tag injector (see Figure 7 for installation set-up).
Tagged coho were then released down a Quality Control Device (QCD) to detect whether the
tags had been properly implanted into the fish. All coho found to have not retained their tag were
re-tagged. As an added quality control measure approximately 10% of each days tagged group
were held for 24-hrs and passed through the QCD for a second time to determine tag loss and
mortality. Following all sampling and tagging operations, coho smolts were placed back into
large holding boxes in the Kitwanga River and released at nightfall.

The 2015 Kitwanga River Salmon Smolt Assessment
_____________________________________________________________________ Gitanyow Fisheries Authority
8
Figure 7: Photo of Coded Wire Tag (CWT) machine, Quality Control Device (QCD) and sampling station set-up.
2.2 Vaki Bioscanner unit (Vaki)
In March 2014, the GFA received funding from the Pacific Salmon Commission Northern Fund,
which allowed us to purchase an electronic single-channel Vaki Bioscanner unit (Vaki) from PR
Aqua Supplies Ltd. in Nanaimo, BC (See Figure 8 for trough design, digital counter, and
instream operation). An aluminum stand and fish holding basin were fabricated to hold the Vaki.
In April 2014, the Vaki was secured to a wooden floating platform and tested during the regular
smolt enumeration program. The Vaki consists of an electronic control unit, V-channel and
scanner. The control unit gathers and displays data from the scanner. The control unit also
supplies power to the scanner. The V-channel regulates the flow of fish and water, and separates
the fish through the scanner, making it possible to count them. The scanner counts the fish as
they pass through the V-channel, and relays data to the control unit via the connector lead. The
Bioscanner is very gentle as no mechanical parts touch the fish when counted, and the fish are in
water at all times (Kingston 2014).
A water source was attached to the Vaki, which supplied a flow rate of 5.0 – 6.5 Liters/minute
and was powered by a gas powered generator. Smolts were placed into the holding basin of Vaki

The 2015 Kitwanga River Salmon Smolt Assessment
_____________________________________________________________________ Gitanyow Fisheries Authority
9
and allowed to swim down the V-channel at their leisure. As the fish come out of the holding
basin they are close together, therefore require separation to be counted accurately. The V-form
ensures that the fish cannot turn around, and also that they are not crowded together. The curved
form accelerates the fish down the channel. If two fish are close together in the beginning the
one that is little bit ahead will accelerate faster and this causes a separation of the fish (Kingston
2014).
Once the fish swim down the V-channel they are dropped into a holding bucket with water.
When approximately 100 fish have been logged through the control unit a manual count is
performed to calibrate the accuracy of the unit. Several accuracy calibrations are completed at
the start of each day to make sure the unit is accurately counting smolts. Once several
calibrations have been completed the control unit is re-zeroed and the smolts are placed into the
holding basin 20-30 at a time until all smolts have been run through the Vaki (Kingston 2014).
Figure 8: Photo series of the Vaki Bioscanner trough design, digital counter, and instream operation.

The 2015 Kitwanga River Salmon Smolt Assessment
_____________________________________________________________________ Gitanyow Fisheries Authority
10
3. RESULTS
Five species of salmonids were enumerated through the KsF between April 2nd and June 23rd,
2015: sockeye and coho salmon, cutthroat (Oncorhynchus clarkii) and rainbow (O. mykiss) trout
and bull trout char (Salvelinus confluentus; Table 1). Sockeye smolts were stratified into 1 and 2
year old fish based on visual observations in the field. Dolly Varden char (Salvelinus malma)
may be mixed in with the juvenile bull trout samples in Table 1, as these were not differentiated
in the field. Other species counted include mountain whitefish (Prosopium williamsoni, 133
fish), sculpin (Cottidae sp., 4,046 fish), northern pikeminnow (Ptychocheilus oregonensis, 50
fish), and redside shiner (Richardsonius balteatus, 10 fish).
Table 1: Number of fish by salmonid species (salmon/trout/char) counted through the KSF from April 2nd and June 23rd, 2015.
1-YR Old SX
2-YR Old SX
Total Sx Smolts
Total Coho
Smolts
CT Adult BT (>
300mm)
Juv. BT (<
300mm)
RBT
12,063 102 12,165 4,517 492 278 267 97
The following sections will describe run timing, and age and size distribution/statistics for
sockeye and coho smolts, and also, sockeye smolt production and details of the coho coded-wire
tagging (CWT) program.
3.1 Sockeye Salmon
3.1.1 Sockeye Run Timing
In 2015, 12,165 sockeye smolts were counted migrating downstream though the KsF. The first
sockeye smolt was counted on April 4th and the last on June 7th (Table 2). The peak run of 4,114
sockeye smolts occurred on May 2nd when 34% of the entire run migrated past the KsF on that
day. This is comparable to previous years when peak runs generally occur in the 1st or 2nd week
of May (Figure 9). The midpoint of the run occurred on May 20th and is also comparable to
previous years results. Approximately 99% of the sockeye smolts migrated through the weir in a
24-day period from April 18th to May 11th, 2015, which is also comparable to previous years.
Based on the above, the KsF was operational essentially during the entire sockeye smolt run.

The 2015 Kitwanga River Salmon Smolt Assessment
_____________________________________________________________________ Gitanyow Fisheries Authority
11
Table 2: 2015 sockeye run timing highlights compared to 2001 to 2014 results.
2015 Sockeye Smolt Run
0
1,000
2,000
3,000
4,000
5,000
3-A
pr
10-A
pr
17-A
pr
24-A
pr
1-M
ay
8-M
ay
15-M
ay
22-M
ay
29-M
ay
5-Ju
n
Date
Dai
ly R
un
Figure 9: Daily run timing for sockeye smolt emigrating through the KsF in 2015 (n=12,165).
Year Run Start Run End
Run Peak
Run Midpoint
2001 April 29th May 27th May 6th May 13th
2002 April 27th June 1st May 12th May 11th
2003 April 23rd June 2nd May 2nd May 13th
2004 April 19th May 20th
April 30th
May 5th
2005 April 17th May 19th May 2nd May 3rd
2006 April 22nd May 25th May 4th May 9th
2007 May 1st May 30th May 10th May 15th
2008 April 30th May 28th May 11th May 14th
2009 May 1st June 7th May 18th May 19th
2010 April 21st June 11th May 3rd May 17th
2011 April 25th June 23rd May 14th May 25th
2012 April 26th June 7th May 9th May 17th
2013 April 24th June17th May 7th May 22nd 2014 April 12th June17th May 2nd May 20th
2015 April 4 th June 7th May 2nd May 5th

The 2015 Kitwanga River Salmon Smolt Assessment
_____________________________________________________________________ Gitanyow Fisheries Authority
12
3.1.2 Sockeye Age and Size Structure
Scales from 550 sockeye smolts were submitted to Birkenhead Scale Analyses for age analysis
and of these, 511 fish were deemed readable (4.2% of the total run). A total of 505 smolts were
identified as 1-year-old fish (99% of the sample) and 6 smolts were identified as 2-year-old fish.
The 2015 mean length of 1-year-old smolts (112 mm) and weight (13.5 g) was the largest mean
size recorded since 2008 at the KsF (Tables 3 and 4). Fork length distribution for 1-year-old
smolts, grouped into 5mm intervals, was unimodal with the majority of fish falling into the 110 -
115 mm length class (Figure 10). Two-year old smolts (n=6) averaged 157mm (ranged from 147
to 177mm) and 39g (ranged from 32.9 to 51.6g).
Data from age 1-year-old Gitanyow Lake sockeye smolts shows that average lengths and weights
are relatively large when compared to three other high-profile BC sockeye producing lakes
(approximately 20 years of data for Babine, Cultus, and Chilko Lakes; in Groot and Margolis
1991). The 2015 results (112mm, 13.5g) and averages from 2008 to 2015 (105mm, 11.2g)
compares to Babine Lake (79mm, 4.9g), Cultus Lake (82mm, 6.2g), and Chilko Lake (82mm,
6g).
Table 3: Length and weight statistics for 1-year-old sockeye sampled in 2015 (n=505).
Statistic Length (mm) Weight (g)
Mean 112.0 13.5
Standard Error 0.26 0.10
Median 112 13.5
Mode 115 13.7
Standard Deviation 5.74 2.17
Sample Variance 32.94 4.72
Kurtosis -0.14 -0.23
Skewness -0.31 0.05
Range 32 11.8
Minimum 94 7.2
Maximum 126 19
Count 505 505
Confidence Level (95.0%) 0.50 0.19

The 2015 Kitwanga River Salmon Smolt Assessment
_____________________________________________________________________ Gitanyow Fisheries Authority
13
Table 4: Lengths and weight statistics for one-year-old sockeye sampled since 2008 at the KsF.
Year Sample Size (N)
Mean Fork
Length (mm)
Max. / Min. Fork Length
(mm)
Mean Weight
(g)
Max. / Min. Weight (g)
2008 1,224 102.8 76 / 122 9.9 4.9 / 28.5 2009 320 112.1 86 / 132 13.4 5.7 / 21.3 2010 2,490 106.4 77 / 128 11.5 4.1 / 21.5 2011 740 106.6 85 / 151 11.8 6.1 / 32.7 2012 1,680 96.7 64 / 124 8.5 2.3 / 15.5 2013 684 101.3 71 / 123 10.1 3.5 / 17.8 2014 444 104.1 80 / 124 11.0 5.7 / 18.8 2015 505 112.0 94/126 13.5 7.2/ 19.0 Average 2008 -
2015 105.3 64 / 151 11.2 2.3/ 32.7
0
20
40
60
80
100
120
140
160
180
200
90 95 100
105
110
115
120
125
130
135
Bins (mm; 5mm intervals, upper class size)
Fre
quen
cy (
n=50
5)
Figure 10: Length distribution (5mm class intervals) for 1-year-old sockeye sampled in 2015 at the KsF (n=505).

The 2015 Kitwanga River Salmon Smolt Assessment
_____________________________________________________________________ Gitanyow Fisheries Authority
14
3.1.3 Sockeye Smolt Population Estimates and Smolt Production
A total of 12,165 sockeye smolts were counted in 2015 and was considered a complete account
of the run (Table 5). The 2015 smolt run was the lowest recorded since 2008, and was 91%
below the 2008 to 2014 running average of 142,094 smolts/year at the KsF, however this average
is skewed by the record 2012 count of 400,907 smolts. The running average since 2008 now
stands at 125,350 smolts/year. KsF counts prior to 2008 can be found in
http://www.gitanyowfisheries.com/kitwanga-smolt-fence-enumeration .
In 2015, an estimated average of 44 smolts were produced per female spawner (Table 6). This
estimate was generated by dividing the total number of 1-yr old smolts produced in 2015 by the
number of adult females that escaped to the river and presumed to have successfully spawned in
2013 (828 total spawners x 0.33 female ratio = 273 females; McCarthy 2014). The 2015
Kitwanga smolt production was the third lowest recorded since 2008.
Table 5: Kitwanga River sockeye smolt population estimate from 2008 – 2015.
Year Total Smolts
Captured
2-Yr. Old
Smolts
Hatchery Smolt
Population Estimate
Wild Smolt Population Estimate
2008 229,026 2,753 226,273
2009 36,554 311 1,273 35,281
2010 113,068 24 -- 113,068
2011 83,854 137 -- 83,854
2012 400,907 91 -- 400,907
2013 84,294 65 -- 84,294
2014 46,955 42 -- 46,955
2015 12,165 92 -- 12,165

The 2015 Kitwanga River Salmon Smolt Assessment
_____________________________________________________________________ Gitanyow Fisheries Authority
15
Table 6: Sockeye smolt production in 2015 compared to results from the KsF from 2008 to 2015.
Year Smolt Estimate
Female Spawners
Smolts per
Female 2008 226,273 2,643 86 2009 34,970 125 280 2010 113,044 684 165 2011 83,717 1,615 52 2012 400,907 9,778 41 2013 84,294 1,230 69 2014 46,955 2,574 18 2015 12,165 277 44
Average 125,291 2,366 94
3.1.4 Vaki Bioscanner Results
The Vaki Bioscanner was used in 2015 to assist the crew in counting sockeye smolts during their
peak run period. Due to the low 2015 smolt run this scanner was only needed for 2 days. Based
on previous years, peak runs may exceed 10,000+ sockeye/day, therefore the Vaki Bioscanner
will be of value during future smolt runs. As noted above, the low 2015 smolt run was mainly
due to a low 2013 adult return and smolt counts could likely increase in 2016 from the 2014
return of about 13,700 returning adults and again in 2017 from the 2015 return of about 4,500
returning adults.
3.2 Coho Salmon
3.2.1 Coho Run Timing
In 2015, 4,517 coho smolts were counted migrating downstream though the KsF. The first coho
smolt was counted on April 8th and the last on June 23rd when operations ceased (Table 7; Figure
11). The KsF ceased operations when coho smolts were still passing through in double and triple
digit numbers, therefore did not capture the entire run. This was due to budget constraints and
successfully achieving the primary goals of capturing the entire sockeye smolt run and
implanting coho smolts with a CWT for adult tracking purposes.
Two peak runs of coho smolts were observed on June 2nd (446 fish) and June 6th (311 fish),
which can be considered normal. Daily counts of 100+ fish began on May 18th and continued in
approximately the 100-400 fish/day range until closing.

The 2015 Kitwanga River Salmon Smolt Assessment
_____________________________________________________________________ Gitanyow Fisheries Authority
16
Table 7: 2015 coho run timing highlights compared to 2009 to 2014 results.
Year Run Start Run End Run Peak Run Midpoint
2009 April 19th July 13th June 26th June 1st
2010 April 17th June 25th May 31st May 22nd
2011 April 26th June 28th June 2nd May 28th
2012 April 25th June 8th May 28th May 18th
2013 April 10th N/a June 3rd and 12th
N/a
2014 April 25th N/a June 17th and 20th
N/a
2015 April 8th N/a June 2nd and 6th
N/a
2015 Coho Smolt Run
0
100
200
300
400
500
8-A
pr
15-A
pr
22-A
pr
29-A
pr
6-M
ay
13-M
ay
20-M
ay
27-M
ay
3-Ju
n
10-J
un
17-J
un
Date
Dai
ly R
un
Figure 11: Daily run timing for coho smolt emigrating through the KsF in 2015 (n=4,517).

The 2015 Kitwanga River Salmon Smolt Assessment
_____________________________________________________________________ Gitanyow Fisheries Authority
17
3.2.2 Coho Age and Size Structure
Scales from 623 coho smolts from the 2015 run were submitted to DFO for age analysis,
however unfortunately results were not available in time for this report and will be presented in
the 2016 Annual Report. The 2014 age results, not presented in 2014 report, were available for
this report. Scales from 545 coho smolts from 2014 were submitted to DFO for age analysis and
of these, 374 scales were deemed readable (7.2% of the total run of 5,222 fish; Table 8). The
majority of the coho were 1-year old fish (74%; originating from the 2012 adult run of 2,691
fish), followed by 2-year old coho (26%; originating from the 2011 adult run of 1,422 fish).
Based on previous years, 1-year-old smolts are most abundant, followed by 2-year-old smolts,
then incidental 3-year-old smolts.
Table 8: 2014 coho smolt age results.
European `Gilbert-Rich Brood Yr. Frequency Percent
20 33 2011 96 25.7%
10 22 2012 278 74.3%
Total 374 100%
The 2015 mean length (132mm) and weight (24.4g) for the entire 544 fish sample was
comparable to that found in previous years at the KsF (Tables 9 and 10). Fork length distribution
for coho, grouped into 5mm intervals, was unimodal with the majority of fish falling into the
125-135mm length class (Figure 12).
The 2015 Kitwanga River Salmon Smolt Assessment
_____________________________________________________________________ Gitanyow Fisheries Authority
18
Table 9: Length and weight statistics for coho smolts sample in 2015 (n=544).
Statistic Length (mm) Weight
(g) Mean 133.7 26.0 Standard Error 0.61 0.45 Median 132 24.3 Mode 130 22.2 Standard Deviation 15.32 11.29 Sample Variance 234.83 127.45 Kurtosis 10.70 43.23 Skewness 2.24 5.29 Range 142 138 Minimum 98 11.1 Maximum 240 149.1 Count 621 621 Confidence Level (95.0%) 1.21 0.89
Table 10: Coho smolts mean fork lengths and weights from 2009 to 2015.
Year Sample Size (N)
Mean Fork
Length (mm)
Max. / Min. Fork Length
(mm)
Mean Weight
(g)
Max. / Min. Weight (g)
2009 95 134.8 111 / 172 26.5 13.6 / 55.1 2010 550 141.2 103 / 272 31.1 11.8 / 195.4 2011 525 130.2 104 / 230 23.5 10.8 / 114.9 2012 400 129.8 93 / 173 22.3 8.5 / 51.7 2013 400 131.8 97 / 215 24.4 10.2 / 93.2 2014 544 131.7 85 / 228 25.1 6.1/ 114.2
2015 621 133.7 98 / 240 26.0 11.1/ 149.1

The 2015 Kitwanga River Salmon Smolt Assessment
_____________________________________________________________________ Gitanyow Fisheries Authority
19
0
20
40
60
80
100
120
140
95 100
105
110
115
120
125
130
135
140
145
150
155
160
165
170
175
180
185
190
195
200
205
210
215
220
225
230
235
240
Bins (mm; 5mm intervals, upper class size)
Fre
quen
cy (
n=62
1)
Figure 12: Length distribution (5mm class intervals) for coho sampled in 2015 at the KsF (N=544).
3.2.3 Coho Wire Tag Program
A total of 2,029 coho affixed with a CWT were successfully released downstream in 2015 (out of
4,517 smolts or 45 % of the sample; Table 10). This CWT total takes into account tag loss and
mortality.
Table 11: Coho CWT estimates for tag mortality, tag loss, and total CWT’s released in 2015 at the KsF.
CWT Tag Group Tag Loss # (%)
Mortality # (%)
Tag Loss + Mortality
%
Sample Size
# Coho Tagged
(Corrected for tag loss
and mortality)
A08 D03/60 26 (3.0%) 12 (1.4%) 4.40% 872 2,029
3.3 Run Timing of Other Species
The cutthroat emigration through the KsF (492 fish) was relatively condensed within a 24-day
period from April 17th to May 10th (338 fish or 69% of total count). No pattern was observed for
The 2015 Kitwanga River Salmon Smolt Assessment
_____________________________________________________________________ Gitanyow Fisheries Authority
20
bull trout/Dolly Varden char or rainbow trout in which counts were spread out and arrived in
single or low double-digit numbers throughout the KsF operation.
4. DISCUSSION AND RECOMMENDATIONS
Since 2008, GFA has accurately enumerated sockeye smolts migrating out of Gitanyow Lake at
the KsF for the past eight years, even during spring flood events. GFA will continue to monitor
the migration of sockeye smolts from Gitanyow Lake on a yearly basis as long as funding carries
forward. Kitwanga sockeye smolt production is of great interest to fisheries managers and along
with the KSEF is the highest assessment priorities currently undertaken by GFA in the Kitwanga
Watershed.
Sockeye run timing spread, peak run date, and size and age distribution was similar to previous
years. The 2015 sockeye smolt population estimate was 12,165, which were comprised almost
exclusively of 1-year-old smolts. The 2015 smolt run was the lowest recorded since 2008, and
was 91% below the 2008 to 2014 running average of 142,094 smolts at the KsF. This low smolt
run and low freshwater production is of concern to GFA. The 2015 Kitwanga sockeye freshwater
production estimate from Gitanyow Lake was 44 sockeye smolts were produced per adult female
from the 2013 brood year (273 females), which remains low compared to previous years.
Kitwanga 1-year-old smolts were on average the largest size recorded since 2008 and continue to
be relatively larger in both length and weight compared to the size of 1-year-old smolts from
three other high-profile BC sockeye producing lakes (Babine, Cultus, and Chilko Lakes; Groot
and Margolis 1991).
As in most years, the majority of coho smolts were 1-year old fish (1-year post-hatch in
Gitanyow Lake). Since 2009, but excluding 2012, the GFA have implemented a CWT program
on the Kitwanga River to assess survival and harvest rates on coho to track commercial fishing
pressure on this stock in both Alaska and BC waters. GFA will resume this worthwhile program
in 2016 where the plan is to mark most of the coho smolts in order to obtain sufficient numbers
of recoveries from marine fisheries and escapement through the KSEF thereby estimating an
exploitation rate.

The 2015 Kitwanga River Salmon Smolt Assessment
_____________________________________________________________________ Gitanyow Fisheries Authority
21
5. REFERENCES
Cleveland, M.C. 2005. The Kitwanga River Sockeye Salmon Enumeration, 2004. Gitanyow Fisheries Authority, Kitwanga, B.C. 32 pp. Cleveland, M., S. Cox-Rodgers and K. Rabnett. 2006. Kitwanga Sockeye Salmon Recovery Plan (KSRP). A plan to preserve genetic diversity and rebuild an important race of sockeye salmon. Gitanyow Fisheries Authority, Kitwanga, BC; Department of Fisheries and Oceans Canada, Prince Rupert, BC; Skeena Fisheries Commission, Hazelton, BC. Cleveland, M. 2008. Kitwanga Sockeye Enhancement Program, 2006/07. Unpublished Report. Gitanyow Fisheries Authority, Kitwanga, BC. 56 pp. Groot, C. and L. Margolis, 1991. Pacific Salmon Life Histories. UBC Press. 543 pp. Hall, P. 2009. Personal Communications, Stock Assessment Biologist – DFO, Prince Rupert, BC. Kingston, D. 2006. The 2005 Kitwanga River Sockeye Smolt Survey. Unpublished Report. Gitanyow Fisheries Authority, Kitwanga, BC. 11pp. Kingston, D. 2008. Kitwanga River Smolt Fence Completion Project – 2008. Unpublished Report. Gitanyow Fisheries Authority, Kitwanga, BC. 19 pp. Kingston, D. 2009. The 2008 Kitwanga River Sockeye Smolt Assessment. Unpublished Report. Gitanyow Fisheries Authority, Kitwanga, BC. 16 pp. Kingston, D. 2010. The 2009 Kitwanga River Salmon Smolt Assessment. Unpublished Report. Gitanyow Fisheries Authority, Kitwanga, BC. 22 pp. Kingston, D. 2011. The 2010 Kitwanga River Salmon Smolt Assessment. Unpublished Report. Gitanyow Fisheries Authority, Kitwanga, BC. 23 pp. Kingston, D. 2011. Kitwanga River Salmon Enumeration Facility – 2010 Annual Report Unpublished Report. Gitanyow Fisheries Authority, Kitwanga, BC. 31 pp. Kingston, D. 2012. The 2011 Kitwanga River Salmon Smolt Assessment. Unpublished Report. Gitanyow Fisheries Authority, Kitwanga, BC. 25 pp. Kingston, D. 2013. The 2012 Kitwanga River Salmon Smolt Assessment. Unpublished Report. Gitanyow Fisheries Authority, Kitwanga, BC. 24 pp. Kingston, D. 2014. Fish Count Modernization at the Kitwanga River Smolt Enumeration Facility. Unpublished Report. Gitanyow Fisheries Authority, Kitwanga, BC. 5 pp. Koch, K. and D. Kingston 2008. The 2006 and 2007 Kitwanga River Sockeye Smolt Assessments Unpublished Report. Gitanyow Fisheries Authority, Kitwanga, BC. 31 pp.

The 2015 Kitwanga River Salmon Smolt Assessment
_____________________________________________________________________ Gitanyow Fisheries Authority
22
Koch, K. and M. Cleveland 2009. Kitwanga River Salmon enumeration Facility – 2008 Annual Report. Unpublished Report. Gitanyow Fisheries Authority, Kitwanga, BC. 45 pp. Koch, K. and M. McCarthy. 2010. Kitwanga River Salmon Enumeration Facility – 2010 Annual Report. Gitanyow Fisheries Authority, Kitwanga, B.C. 32 pp. McCarthy, M. 2005. The Sockeye Smolt Enumeration Program, 2004. Unpublished Report. Gitanyow Fisheries Authority, Kitwanga, BC. 10pp. McCarthy, M. 2014. The 2013 Kitwanga River Salmon Smolt Assessment. Unpublished Report. Gitanyow Fisheries Authority, Kitwanga, BC. 25 pp. McCarthy, M. and D. Kingston 2015. The 2014 Kitwanga River Salmon Smolt Assessment. Unpublished Report. Gitanyow Fisheries Authority, Kitwanga, BC. 28 pp. Williams, B. and P. Halliday. 2002. The 2001 Kitwanga River Sockeye Salmon (Oncorhynchus nerka) Smolt Sampling Program. Gitanyow Fisheries Authority. 21pp.

The 2015 Kitwanga River Salmon Smolt Assessment
_____________________________________________________________________ Gitanyow Fisheries Authority
23
Appendix 1
Letter from Carol Lidstone of Birkenhead Scale Analyses regarding 2015 sockeye smolt aging results

The 2015 Kitwanga River Salmon Smolt Assessment
_____________________________________________________________________ Gitanyow Fisheries Authority
24
Birkenhead Scale Analyses
�����
6195 Lone Butte Horse Lake Road, Lone Butte, B.C. V0K 1X3
Phone (250) 395-3880
E-mail: [email protected]
February 4, 2016
Derek Kingston, Fisheries Biologist Gitanyow Fisheries Authority P.O. Box 148, Kitwanga, B.C. V0J 2A0 Re: 2015 Kitwanga River Smolt Sockeye Scale Analysis
Hi Derek, Attached is the analysis for the sockeye smolt scales collected from the Kitwanga River from April 20 - May 12, 2015. The updated version of the Excel file includes the scale age, condition code, circuli counts, location of freshwater stresses, and relevant comments. The total sample size is 550 sockeye, mounted on 22 books. Of the 22 books, 11 have been fully analyzed to include age, circuli counts, location of freshwater stress and relevant comments. The other 11 books have been partially analyzed, by scanning the scales quickly to provide age and ensure the typical Kitwanga pattern is exhibited. If any scales from the partial analysis exhibit anything out of the ordinary, the circuli counts and comments are provided. I alternated between full and partial analysis to provide data for the entire sampling period. Please see the inventory sheet on the Excel file which shows which books are fully and partially analyzed. Of the 550 fish sampled, 18 are unreadable as follows: Condition Code: 5 Lateral Line n= 4 (although 2 of these are readable enough to confirm the scales
exhibit the typical Kitwanga growth pattern of a 1 year old). 7 Unreadable (grooved side facing down, smooth side up) n = 11 8 Missing n= 1 9 Regenerated n = 2 Of the 532 readable scales, 525 are age 1 (98.7%) and 7 are age 2 (1.3%). None of the scales in this sample exhibit plus growth.
The 2015 Kitwanga River Salmon Smolt Assessment
_____________________________________________________________________ Gitanyow Fisheries Authority
25
Age One Sockeye (n=525): Lengths range from 94 - 126 mm; weights range from 7.2 - 19.0 grams. The 18 unreadable samples that have corresponding length and weight data range from 100 - 123 mm, and 11.4 - 18.1 grams, respectively. Circuli counts are provided for 257 of the age 1 smolts. All of the scales exhibit the typical Kitwanga freshwater stress, including the 268 sockeye that were partially analyzed. As usual, the freshwater stress ranges from moderate to strong. Of the 257 age 1 samples, the circuli counts from the focus to the freshwater stress range from 6 -15, stress to annulus 6 - 16, for a total circuli count of 16 - 26. Age Two Sockeye (n=7): Lengths range from 147 - 177 mm; weights range from 31.4 – 51.6 grams. They all exhibit similar growth patterns in the first year with small growth for Kitwanga sockeye, the absence of a freshwater stress, and circuli counts ranging from 8 to 11. The second year growth includes 3 samples with one freshwater stress, and 4 samples with two freshwater stresses; with the 2nd year circuli counts ranging from 17-23. The total circuli counts for the age 2 sockeye range from 27-34. Please let me know if you have any questions or concerns regarding the results. I will return the scales and results to you via Xpress Post. Once again, thank you very much for the opportunity to complete this work for you. Sincerely, Carol Lidstone Birkenhead Scale Analyses