Embed Size (px)
Citation preview

2015 Maine Lodging Study
Prepared by
June 2015

Table of Contents
Introduction and Methodology 3
Profile of Responding Properties 7
Maine Lodging Metrics 14
Maine Lodging Guest Metrics 27
Summary Points 32
2

Introduction and Methodology

Background
• The Maine Office of Tourism commissioned Davidson-Peterson Associates to conduct an annual research study to assess the health of the tourism industry in Maine and monitor trends over time.
• The first wave of this study was completed in April/May 2013 and a subsequent wave the following year. This is the third wave of this lodging study, and the expectation is to continue conducting the research on an annual basis in future years.
• The study gathered the following data from Maine’s lodging properties:
– Property type, size, and seasonality,
– Occupancy rates,
– Average daily rates,
– Average party size,
– Average length of stay,
– Origin of visitors, and
– Reservation methods.
4

Methodology
• The Maine Office of Tourism provided the database of lodging properties used for their website, VisitMaine.com, to serve as the sample universe for the Maine Lodging Survey. In total 1,527 properties were included in the sample of properties to be contacted.
• The Maine Lodging Survey was conducted primarily by telephone interview, with an option for participating properties to complete a self-administered survey online if they preferred. One-third of the participating properties selected the online option (32%), representing a continual increase in the proportion of properties completing the survey online (19% in 2014 and 8% in 2013).
• A total of 380 properties participated in this study between April 29 and June 8, 2015:
– 257 completed the survey over the telephone, and
– 123 completed the survey online.
• Data was gathered for three separate seasons during the year, defined as follows:
5
Season Months
Summer 2014 May 2014 – August 2014
Fall 2014 September 2014 – November 2014
Winter 2015 December 2014 – April 2015

Reporting and Sampling Notes
• Throughout this report, the following abbreviations will be used when discussing the various types of lodging properties:
– HMR = Hotel, Motel, or Resort
– I/BB = Inn or Bed & Breakfast
– CCC = Condo, Cottage, Cabin, Sporting Camp, or Timeshare
– RV/CG = RV Park, Campground, or Trailer Park
• A statistically significant increase from the previous year is indicated throughout by green text, and a significant decrease from the previous year is indicated by red text.
• The sample of RV Park/Campground/Trailer Park properties in this study includes only 49 participating properties. In addition, due to the seasonality of this type of lodging, data for the Winter seasons is based on extremely small sample sizes of open/responding properties. Please note the number of responding properties when reviewing each data point, and use caution when interpreting data for this group.
6

Profile of Responding Properties

Type of Lodging Properties
33%
38%
28%
12%
33% 33% 32%
15%
35% 35%
28%
13%
Hotel, Motel, or Resort Inn or B&B Condo, Cottage, Cabin,Sporting Camp, or
Timeshare
RV Park, Campground, orTrailer Park
Type of Lodging Properties
2013 (N=419) 2014 (N=410) 2015 (N=380)
Q2. Is your property primarily a: 8
Of the responding lodging properties in the 2015 study, seven in ten are either hotels/motels/resorts (35%) or inns/bed & breakfast properties (35%). One-fourth categorize themselves as either a condo, cottage, cabin, sporting camp, or timeshare.

Hotel/Motel/Resort Category Types
49% 38%
32%
51%
62%
68%
2013(n=267)
2014(n=289)
2015(n=263)
Limited
Full
13% 15% 16%
29% 30% 29%
26% 23% 24%
23% 20% 21%
5% 6% 6%
3% 6% 4%
2013(n=267)
2014(n=289)
2015(n=263)
Luxury
Upper-upscale
Upscale
Mid-scale w/food & beverage
Mid-scale w/ofood & beverage
Economy
32%
53% 53%
31%
Q3. In what service category is your property? Q4. In what category level is your lodging property? 9
• Two-thirds of HMR respondents categorize their property as limited service (vs. full service). • Half of HMR respondents categorize their property as mid-scale, either with or without food and
beverage. One-third report they are upscale or luxury properties.
Upscale/ Luxury
31%
Mid-scale 55%

Seasonality of Lodging Properties
54% 57% 58% 51% 63%
58%
30% 30% 32%
8% 6% 12%
42% 39% 42% 37% 35%
42%
62% 65% 68%
86% 90% 88%
2013(n=138)
2014(n=137)
2015(n=133)
2013(n=158)
2014(n=136)
2015(n=134)
2013(n=117)
2014(n=132)
2015(n=105)
2013(n=49)
2014(n=63)
2015(n=49)
Seasonality of Maine Lodging Properties*
Open Full Year Open Seasonally
Inn or B&B
*Note: “Seasonal” is defined as the property being closed for at least three months out of the year Q5. During what month(s), if any, is your property typically closed? (Please check all that apply)
10
• The majority of HMR and I/BB properties surveyed are open year-round, while the vast majority of RV/CG properties are seasonal, as are two-thirds of CCC properties.
• Lodging properties in the Maine Beaches and the Mid-Coast regions are more likely to be open seasonally than are properties in most of the other regions.
Hotel, Motel, Resort Condo, Cottage, Cabin,
Sporting Camp RV Park, Campground,
or Trailer Park

Size of Lodging Properties
11% 7% 11% 8% 2%
8%
31%
25% 26%
4% 6%
8%
20% 33% 26%
22% 25% 18%
38% 36% 38%
65% 67% 65%
2013(n=138)
2014(n=137)
2015(n=133)
2013(n=49*)
2014(n=63*)
2015(n=49*)
50+ Rooms/Sites/Units
25-49 Rooms/Sites/Units
10-24 Rooms/Sites/Units
<10 Rooms/Sites/Units
*Please note small sample size. Data should be used for directional purposes only. Q7, 9. What is the total number of rooms/units/sites on your property? 11
Avg # of
Rooms/Sites
47 50 50
91 98 103
Responding HMR properties have an average of 50 rooms, with one-third having 50 or more rooms. RV/CG properties have an average of 103 available sites, with two-thirds having 50 or more sites.
Hotel, Motel, Resort RV Park, Campground, or Trailer Park

Size of Lodging Properties, Cont.
69% 63%
57%
74% 70% 80%
25% 30%
34%
26% 24%
13%
4% 4% 6% 4% 5% 2% 3% 2% 2% 2%
2013(n=158)
2014(n=136)
2015(n=134)
2013(n=117)
2014(n=132)
2015(n=105)
50+ Rooms/Sites/Units
25-49 Rooms/Sites/Units
10-24 Rooms/Sites/Units
<10 Rooms/Sites/Units
Q7, 9. What is the total number of rooms/units/sites on your property? 12
Avg # of
Rooms/Units
11 11 11
10 9 7
Responding I/BB and CCC properties are smaller, with most having less than 10 rooms/units. On average, I/BB properties have 11 rooms and CCC properties have 7 units.
Inn or B&B Condo, Cottage, Cabin, Sporting Camp
Lodging Properties by Region
19%
16%
8% 7%
22%
6% 6%
14%
25%
18% 19%
13%
6% 7% 7% 6%
24%
19% 17%
13%
8% 6% 6% 6%
Mid-Coast The MaineBeaches
The MaineHighlands
KennebecValley
Downeast &Acadia
GreaterPortland &Casco Bay
AroostookCounty
Lakes &Mountains
Maine Lodging Properties by Region
2013 (n=419) 2014 (n=410) 2015 (n=380)
Q1. In which region of Maine is your property located? (Please check one) 13
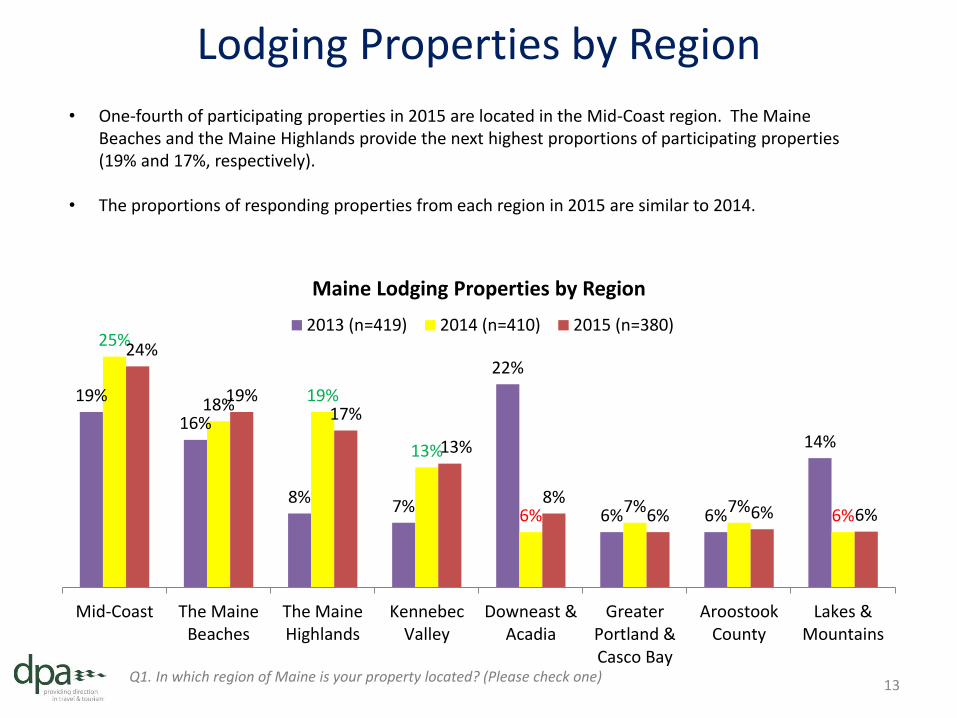
• One-fourth of participating properties in 2015 are located in the Mid-Coast region. The Maine Beaches and the Maine Highlands provide the next highest proportions of participating properties (19% and 17%, respectively).
• The proportions of responding properties from each region in 2015 are similar to 2014.

Maine Lodging Metrics

Note Regarding Data Collection and Sample Sizes
• For data on occupancy rates, average daily rates, average party size, and average length of stay, properties were asked to provide information on the most recent season (Winter 2015) and for the 2014 Summer and Fall seasons. This information will be compared to the information provided in last year’s study for 2012, 2013, and the 2014 Winter season.
• The sample size of responding properties differs by season and by property type due to several properties being open only on a seasonal basis. Please take note of the number of responding properties noted on each chart, as small sample sizes are present for some categories and seasons. Data for these categories/seasons should be viewed cautiously.
15

Occupancy and Daily Rates – Seasonally
16
77.8% 76.5% 76.6% 70.7% 57.0% 60.8%
54.0%
38.0% 41.6% 29.7%
44.6% 35.5%
Hotel, Motel, or Resort Inn or B&B Condo, Cabin, Cottage, Sporting Camp,or Timeshare
RV Park, Campground, or Trailer Park*
Average Occupancy Rate
Summer 2014 Fall 2014 Winter 2015
$135.83
$168.28
$129.56
$39.27
$104.57
$159.81
$115.05
$33.48
$91.77
$127.91 $117.83
$33.06
Hotel, Motel, or Resort Inn or B&B Condo, Cabin, Cottage, Sporting Camp,or Timeshare
RV Park, Campground, or Trailer Park*
Average Daily Rate
Summer 2014 Fall 2014 Winter 2015
*Please note small sample size. Data should be used for directional purposes only. Q13, 14, 15. What was your overall average occupancy rate for each of the following time periods? Q17, 18, 19. What was your average daily rate (ADR) for each of the following time periods?
• Similar to previous years, occupancy rates and average daily rates showed seasonal variations, with both occupancy rates and ADR highest during the summer months and lowest during the winter months.
• HMR and I/BB properties in the Maine Beaches region showed the highest average daily rates during the Summer 2014 season.
n=115 n=111 n=85 n=118 n=116 n=85 n=84 n=77 n=34* n=38* n=33* n=10*
n=116 n=111 n=87 n=124 n=123 n=102 n=82 n=75 n=41* n=45* n=40* n=16*

Occupancy and Daily Rates – Summer
17
74.7% 71.7%
66.4% 66.5%
79.2% 73.1%
67.0% 69.7%
77.8% 76.5% 76.6% 70.7%
Hotel, Motel, or Resort Inn or B&B Condo, Cabin, Cottage, Sporting Camp,or Timeshare
RV Park, Campground, or Trailer Park*
Average Occupancy Rate
Summer 2012 Summer 2013 Summer 2014
$123.38 $155.77
$126.74
$36.76
$138.80 $156.61
$129.28
$41.08
$135.83 $168.28
$129.56
$39.27
Hotel, Motel, or Resort Inn or B&B Condo, Cabin, Cottage, Sporting Camp,or Timeshare
RV Park, Campground, or Trailer Park*
Average Daily Rate
Summer 2012 Summer 2013 Summer 2014
*Please note small sample size. Data should be used for directional purposes only. Q13, 14, 15. What was your overall average occupancy rate for each of the following time periods? Q17, 18, 19. What was your average daily rate (ADR) for each of the following time periods?
• As mentioned, Summer 2014 occupancy rates were favorable, with all property types reporting occupancy rates of at least 70%. CCC properties showed a large increase in occupancy rates between Summer 2013 and Summer 2014, while I/BB properties showed a smaller increase.
• HMR and I/BB properties in the Maine Beaches region showed higher summer occupancy rates (85.4%) than properties in all other Maine regions, with the exception of the Mid-Coast and the Lakes & Mountains.
• Average daily rates were also highest in the summer, with I/BB properties showing an average daily rate of $168.28 during Summer 2014. Following their high occupancy rates, HMR and I/BB properties in the Maine Beaches region also had the highest average daily rates for the 2014 summer season ($189.85).
n=109 n=126 n=115 n=109 n=121 n=118 n=92 n=115 n=84 n=40* n=53* n=38*
n=118 n=125 n=116 n=135 n=127 n=124 n=93 n=118 n=82 n=42* n=60* n=45*

Occupancy and Daily Rates – Fall
18
56.8% 58.0% 49.1% 42.5%
59.6% 59.8% 53.6% 46.6% 57.0% 60.8% 54.0%
38.0%
Hotel, Motel, or Resort Inn or B&B Condo, Cabin, Cottage, Sporting Camp,or Timeshare
RV Park, Campground, or Trailer Park*
Average Occupancy Rate
Fall 2012 Fall 2013 Fall 2014
$100.76
$143.09 $113.66
$32.56
$108.93 $145.82
$116.56
$37.71
$104.57
$157.36
$115.05
$33.48
Hotel, Motel, or Resort Inn or B&B Condo, Cabin, Cottage, Sporting Camp,or Timeshare
RV Park, Campground, or Trailer Park*
Average Daily Rate
Fall 2012 Fall 2013 Fall 2014
*Please note small sample size. Data should be used for directional purposes only. Q13, 14, 15. What was your overall average occupancy rate for each of the following time periods? Q17, 18, 19. What was your average daily rate (ADR) for each of the following time periods?
• Occupancy rates during the fall season were generally lower than those in the summer season but higher than those in the winter season. I/BB properties brought in the highest Fall 2014 occupancy rates at nearly 61% and RV/CG properties came in with the lowest occupancy rates at 38%.
• Average daily rates also fell between the high summer rates and low winter rates, with I/BB properties charging a high of $157.36 during the Fall of 2014. Consistent increases in average daily rates were also seen for I/BB properties from Fall 2012 to Fall 2014.
n=98 n=126 n=111 n=107 n=120 n=116 n=78 n=107 n=77 n=30* n=48* n=33*
n=112 n=124 n=111 n=134 n=125 n=123 n=84 n=113 n=75 n=32* n=56* n=40*

40.1%
26.3%
48.6%
32.1% 39.1%
30.2% 40.1% 44.0% 41.6%
29.7%
44.6% 35.5%
Hotel, Motel, or Resort Inn or B&B Condo, Cabin, Cottage, Sporting Camp,or Timeshare*
RV Park, Campground, or Trailer Park*
Average Occupancy Rate
Winter 2013 Winter 2014 Winter 2015
n=96 n=90 n=54* n=20* n=34* n=85 n=65*
Occupancy and Daily Rates – Winter
19
$87.26
$117.60 $123.93
$33.10
$93.74
$125.65 $114.08
$38.92
$91.77
$127.91 $117.83
$33.06
Hotel, Motel, or Resort Inn or B&B Condo, Cabin, Cottage, Sporting Camp,or Timeshare*
RV Park, Campground, or Trailer Park*
Average Daily Rate
Winter 2013 Winter 2014 Winter 2015
n=103 n=102 n=78 n=36* n=87 n=41* n=16*
*Please note small sample size. Data should be used for directional purposes only. Q13, 14, 15. What was your overall average occupancy rate for each of the following time periods? Q17, 18, 19. What was your average daily rate (ADR) for each of the following time periods?
• Winter occupancy rates were relatively stable from 2013 to 2015, with the highest 2015 rates seen in the CCC category at nearly 45% and the lowest rates seen in the I/BB category at just under 30%.
• HMR and I/BB properties in the Lakes & Mountains region experienced winter occupancy rates in 2015 that were higher than most other regions.
• Winter average daily rates were highest in the I/BB and CCC categories. Annual increases in average daily rates were evident for I/BB properties from winter 2013 to 2015.
n=68* n=31* n=7*
n=82 n=92 n=44* n=10*
n=10* n=85
n=102

Party Size and Length of Stay – Seasonally
20
2.7 2.1
3.5 3.5
2.3 2.1
3.4 3.0
2.1 2.0
3.4 3.2
Hotel, Motel, or Resort Inn or B&B Condo, Cabin, Cottage, SportingCamp, or Timeshare
RV Park, Campground, or TrailerPark*
Average Party Size
Summer 2014 Fall 2014 Winter 2015
3.1 2.6
5.4 5.5
2.7 2.7
4.8 5.7
2.9 2.2
4.4
2.7
Hotel, Motel, or Resort Inn or B&B Condo, Cabin, Cottage, SportingCamp, or Timeshare
RV Park, Campground, or TrailerPark*
Average Length of Stay
Summer 2014 Fall 2014 Winter 2015
*Please note small sample size. Data should be used for directional purposes only. Q21, 22, 23. What is your average number of guests per room in each of the following time periods? Q24, 25, 26. What is your average length of stay (in nights) of your guests in each of the following time periods?
• Average party size did not differ greatly from season to season, ranging from a low of 2 people for the HMR and I/BB categories to a high of 3 or 4 people for the CCC and RV/CG categories.
• Similarly, average length of stay is relatively stable across seasons with the exception of the CCC and RV/CG categories, which shows more fluctuations (likely due to small sample of respondents, particularly in the winter season). On average, guests staying in HMR or I/BB properties stayed in Maine for 2 to 3 nights, while those staying in CCC properties stayed closer to a week.
n=119 n=114 n=90 n=129 n=127 n=103 n=86 n=77 n=37* n=42* n=38* n=17*
n=111 n=107 n=86 n=128 n=126 n=102 n=91 n=83 n=41* n=45* n=38* n=16*
2.8 2.1
3.5 3.5 2.7
2.2
3.6 3.7
2.7 2.1
3.5 3.5
Hotel, Motel, or Resort Inn or B&B Condo, Cabin, Cottage, SportingCamp, or Timeshare
RV Park, Campground, or TrailerPark*
Average Party Size
Summer 2012 Summer 2013 Summer 2014
3.2 2.7
6.5
3.9 3.1 2.7
5.5 5.9
3.1 2.6
5.4 5.5
Hotel, Motel, or Resort Inn or B&B Condo, Cabin, Cottage, SportingCamp, or Timeshare
RV Park, Campground, or TrailerPark*
Average Length of Stay
Summer 2012 Summer 2013 Summer 2014
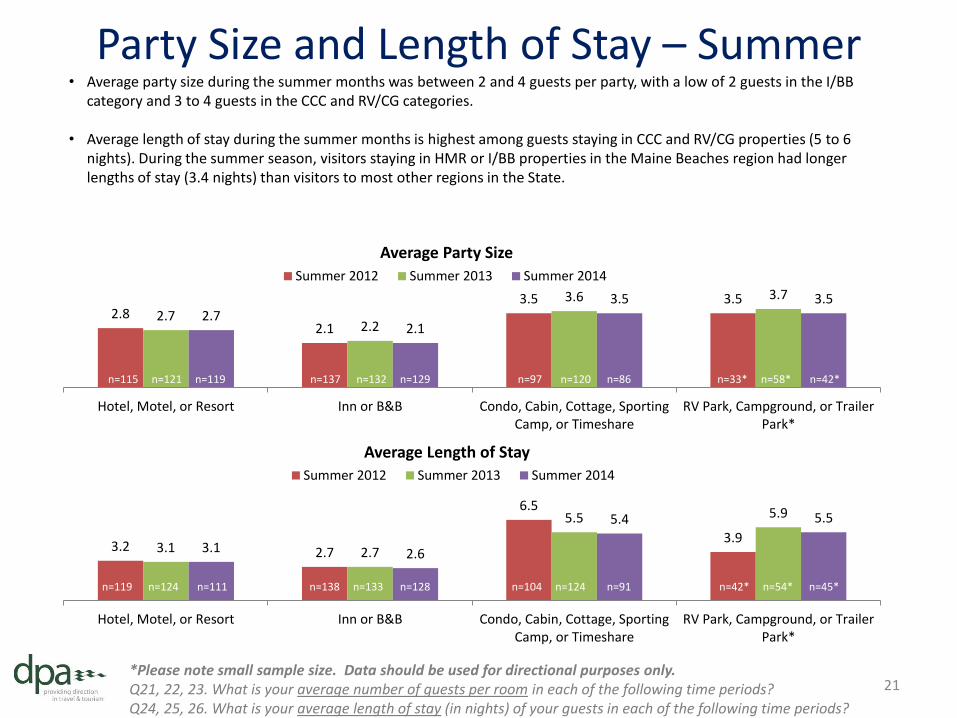
Party Size and Length of Stay – Summer
21 *Please note small sample size. Data should be used for directional purposes only. Q21, 22, 23. What is your average number of guests per room in each of the following time periods? Q24, 25, 26. What is your average length of stay (in nights) of your guests in each of the following time periods?
• Average party size during the summer months was between 2 and 4 guests per party, with a low of 2 guests in the I/BB category and 3 to 4 guests in the CCC and RV/CG categories.
• Average length of stay during the summer months is highest among guests staying in CCC and RV/CG properties (5 to 6 nights). During the summer season, visitors staying in HMR or I/BB properties in the Maine Beaches region had longer lengths of stay (3.4 nights) than visitors to most other regions in the State.
n=115 n=121 n=119 n=137 n=132 n=129 n=97 n=120 n=86 n=33* n=58* n=42*
n=119 n=124 n=111 n=138 n=133 n=128 n=104 n=124 n=91 n=42* n=54* n=45*

2.3 2.1
3.1 3.3
2.2 2.1
3.5 3.3
2.3 2.1
3.4 3.0
Hotel, Motel, or Resort Inn or B&B Condo, Cabin, Cottage, SportingCamp, or Timeshare
RV Park, Campground, or TrailerPark*
Average Party Size
Fall 2012 Fall 2013 Fall 2014
2.7 2.6
5.3
3.6 2.7 2.5
5.1 4.3
2.7 2.7
4.8 5.7
Hotel, Motel, or Resort Inn or B&B Condo, Cabin, Cottage, SportingCamp, or Timeshare
RV Park, Campground, or TrailerPark*
Average Length of Stay
Fall 2012 Fall 2013 Fall 2014
Party Size and Length of Stay – Fall
22 *Please note small sample size. Data should be used for directional purposes only. Q21, 22, 23. What is your average number of guests per room in each of the following time periods? Q24, 25, 26. What is your average length of stay (in nights) of your guests in each of the following time periods?
• Fall travel parties also average around 2 to 3 people, ranging from a low of 2.1 in the I/BB category and a high of 3.4 in the CCC category.
• Similar to summer, average length of stay during the Fall 2014 season is highest among guests staying in RV/CG properties (5.7 nights) and CCC properties (4.8 nights).
n=112 n=120 n=114 n=136 n=131 n=127 n=86 n=113 n=77 n=26* n=54* n=38*
n=115 n=125 n=107 n=139 n=132 n=126 n=91 n=117 n=83 n=32* n=51* n=38*

2.2 2.0
3.1 2.6 2.3 2.1
3.6 3.6
2.1 2.0
3.4 3.2
Hotel, Motel, or Resort Inn or B&B Condo, Cabin, Cottage, SportingCamp, or Timeshare*
RV Park, Campground, or TrailerPark*
Average Party Size
Winter 2013 Winter 2014 Winter 2015
2.8 2.4
6.7
2.1 3.1
2.2
4.8 4.0
2.9 2.2
4.4
2.7
Hotel, Motel, or Resort Inn or B&B Condo, Cabin, Cottage, SportingCamp, or Timeshare*
RV Park, Campground, or TrailerPark*
Average Length of Stay
Winter 2013 Winter 2014 Winter 2015
*Please note small sample size. Data should be used for directional purposes only. Q21, 22, 23. What is your average number of guests per room in each of the following time periods? Q24, 25, 26. What is your average length of stay (in nights) of your guests in each of the following time periods?
Party Size and Length of Stay – Winter
23
• Average party size during the winter months averages around 2 to 3 guests, with a low of 2 guests in the HMR and I/BB categories and 3 to 4 guests in the CCC and RV/CG categories.
• Average length of stay during the winter months ranges from 2 to 4 nights , with CCC guests staying the longest (4.4 nights) during the 2015 winter season.
n=77 n=100 n=90 n=96 n=106 n-103 n=44* n=74* n=37* n=7* n=33* n=17*
n=82 n=104 n=86 n=95 n=107 n=102 n=47* n=73* n=41* n=9* n=28* n=16*

Reservation Methods
36% 36%
11%
6% 6%
3%
33%
27%
16%bc
2%
10%bcd
7%bcd
34%
45%ad
8%
5% 6%cd
0%
37% 39%ad
6%
12%abd
2% 1%
54%abc
27%
16%bc
2% 0% 1%
Directly by phone Your own propertywebsite
Walk-ins/ Noreservations
Online VacationRental Marketplace
Online Travel Agents Your property'sbrand website
Lodging Reservation Methods
Total (n=380) HMR (n=133) [a] I/B&B (n=134) [b] CCC (n=105) [c] RV/CG (n=49*) [d]
*Please note small sample size. Data should be used for directional purposes only. Q34. Please tell us about the percentage of your reservations that are typically generate through each of the following methods? a,b,c,d indicate a significant difference at the 95% confidence level
24
• For most types of properties, the highest proportions of their reservations are generated directly by phone or through their own property website.
• Several differences can be seen in the reservation methods most frequently used by the various property types, as illustrated in the chart below.
Properties in the Lakes & Mountains tourism region have
a higher proportion of reservations coming in through their property’s brand website than any of the other regions.

Online Booking Capability
65%cd 66%cd
23% 18%
Hotel, Motel, or Resort(n=133)
[a]
Inn or B&B(n=134)
[b]
Condo, Cottage, Cabin, SportingCamp, or Timeshare
(n=105)[c]
RV Park, Campground, orTrailer Park
(n=49*)[d]
Percent Providing Direct Online Booking Capability
25 *Please note small sample size. Data should be used for directional purposes only. Q35. Does your property provide guests with the capability to directly book their stay online through your property website?
• Two-thirds of HMR and I/BB properties provide guests with the capability to directly book their stay online through their property website. Significantly fewer CCC properties (23%) and RV/CG properties (18%) offer this booking option.
• Among properties with this booking capability, the booking engines mentioned most frequently include Reservation Nexus, Webervations, and Rezovation.

Travel Agent/Tour Operator Commission
45%cd
34%cd
19%d
4%
Hotel, Motel, or Resort(n=133)
[a]
Inn or B&Bs(n=134)
[b]
Condo, Cottage, Cabin, SportingCamp, or Timeshare
(n=105)[c]
RV Park, Campground, orTrailer Park
(n=49*)[d]
26 *Please note small sample size. Data should be used for directional purposes only. Q37. Does your property offer a commission to travel agents or tour operators?
• Fewer than half of all properties surveyed say they offer commissions to travel agents or tour operators. HMR properties are the most likely to offer commissions (45%), followed by I/BB properties (34%).
• Among those offering commissions to travel agents or tour operators, the majority offer a 10% commission rate.
Percent Offering Commission

Maine Lodging Guest Metrics

Types of Travel
87%
4% 8%
85%
5% 10%
84%
4%
12%
83%
4%
13%
Leisure or vacation travel Travel for conferences ormeetings
Other business travel
Types of Travel as a % of Occupancy
2012 (n=419) 2013 (n=410) 2014 (n=380) 2015 (n=380)
28 Q28. What percentage of your annual occupancy was generated by:
Responding properties report that four-fifths of their annual occupancy is generated by leisure travelers. Of these leisure travelers, nearly all (97%) are traveling independently, as opposed to part of a tour group (3%).

Origin of Visitors
87%
13%
85%
15%
86%
14%
87%
13%
United States Ouside the U.S.
Visitor’s Origin as a % of Occupancy
2012 (n=419) 2013 (n=410) 2014 (n=380) 2015 (n=380)
29 Q29. What percentage of your visitors was from the following areas?
• Responding properties indicate that nearly nine in ten of their guests come from within the United States, with just over 10% visiting Maine from other countries.
• Properties in the Maine Beaches region indicated a higher proportion of visitors from outside the United States (22%) than any other region other than the Lakes & Mountains.
• HMR properties also reported a higher proportion of non-U.S. visitors as compared to other property types.

U.S. Visitor Origin
64%
14%
4% 3% 2%
13%
59%
17%
1% 1% 1%
28%
59%
15%
1% 1% 1%
23%
60%
15%
1% <1% 1%
22%
New England Mid-Atlantic Florida Texas California Other U.S. states
Visitor’s Origin as a % of Occupancy
2012 (n=419) 2013 (n=331) 2014 (n=380) 2015 (n=380)
Q30. Thinking just of visitors from the United States, what percentage was from each of the following states/regions?
30
• New England supplies three-fifths of U.S. visitors to Maine lodging properties, while the Mid-Atlantic region supplies 15%. Other US states outside of these regions make up the remaining one-fourth of visitors to Maine lodging properties, led by Florida, California, and Texas.
• The Maine Beaches region reports a higher proportion of US visitors from Massachusetts than any other region except
for the Greater Portland region (30% versus 18% for the State as a whole).
ME 21%
MA 18%
NH 6%
CT 5%
VT 4%
RI 2%
NY 6%
PA 3%
NJ 3%
VA 1%
DC 1%
DE 0.5%
WV 0.2%
MD 1%

International Visitor Origin
55%
11% 10%
3% 1%
20%
59%
11% 10%
4% 2%
15%
56%
11% 8%
3% 1%
21%
57%
10% 8%
3% 1%
21%
Canada U.K. Germany France Japan Other non-U.S.location
Visitor’s Origin as a % of Occupancy
2012 (n=367) 2013 (n=322) 2014 (n=336) 2015 (N=320)
Q31. Thinking just of foreign visitors, what percentage was from each of the following areas? 31
Among international visitors, more than half are from Canada, while one in ten are traveling from the United Kingdom or Germany. France (3%), Japan (1%), Italy (1%), China (1%), and Australia (1%) round out the remaining countries of origin mentioned.

Summary Points

Summary Points
• The sample of properties included in this study is mostly comprised of HMR and I/BB properties, followed by CCC properties. The Mid-Coast, Maine Beaches, and Maine Highlands are the most well-represented regions in the group of responding properties, followed by the Kennebec Valley.
• Maine’s lodging industry continues to be driven by the seasonal travel patterns of its visitors. Two-thirds of CCC properties and nine-tenths of RV/CG properties are closed for at least three months out of the year. Though fewer HMR and I/BB properties operate seasonally, two-fifths still report being closed for at least three months each year.
• Maine lodging properties continue to report their strongest occupancy rates and highest average daily rates during the summer season. In addition, average party size and average length of stay are also highest during the summer season. Summertime continues to be the Maine tourism product’s strongest seller.
33

Summary Points
• Similar to 2013 and 2014, Maine lodging properties continue to handle the bulk of their booking on their own, either directly on the phone or through their own property websites. These reservation methods are followed by walk-in customers with no advance reservations. Phone reservations are the primary reservation source for properties in both the HMR and RV/CG categories, while individual property websites supply the highest proportion of reservations for I/BB and CCC properties.
• Direct online booking (requiring no further contact with the property or
another website) is currently offered by two-thirds of HMR and I/BB properties. Far fewer CCC (23%) and RV/CG (18%) properties offer this service.
• The lodging properties surveyed are reporting a visitor base that is generally in
Maine for a leisure trip and traveling independently (as opposed to part of a tour group). The vast majority are from the United States, and most are from nearby New England states. Maine (21%) and Massachusetts (18%) supply two-fifths of lodging property visitors. International visitation is largely made up of Canadian visitors, with a significant minority arriving from the UK and Germany. 34

DPA
201 Lafayette Center Kennebunk, ME 04043
207.985.1790
www.digitalresearch.com
35