Embed Size (px)
Citation preview
U.S. Department of CommerceInternational Trade Administration
National Travel and Tourism Office
2015 Market Profile: U.S. Outbound to Overseas
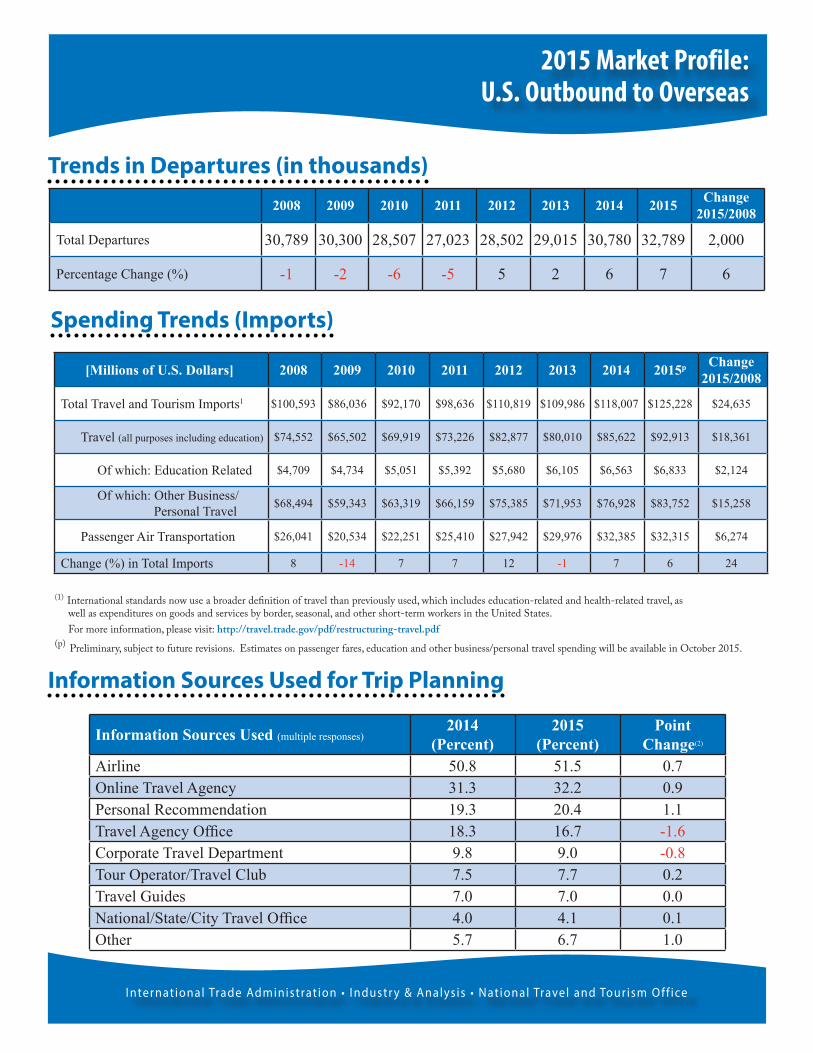
Trends in Departures (in thousands)
Spending Trends (Imports)
2008 2009 2010 2011 2012 2013 2014 2015 Change 2015/2008
Total Departures 30,789 30,300 28,507 27,023 28,502 29,015 30,780 32,789 2,000
Percentage Change (%) -1 -2 -6 -5 5 2 6 7 6
I nternat ional Trade Administrat ion • I ndustr y & Analys is • Nat ional Travel and Tour ism O ff ice
Information Sources Used for Trip Planning
Information Sources Used (multiple responses)2014
(Percent)2015
(Percent)Point
Change(2)
Airline 50.8 51.5 0.7Online Travel Agency 31.3 32.2 0.9Personal Recommendation 19.3 20.4 1.1Travel Agency Office 18.3 16.7 -1.6Corporate Travel Department 9.8 9.0 -0.8Tour Operator/Travel Club 7.5 7.7 0.2Travel Guides 7.0 7.0 0.0National/State/City Travel Office 4.0 4.1 0.1Other 5.7 6.7 1.0
2015 Market Profile:U.S. Outbound to Overseas
[Millions of U.S. Dollars] 2008 2009 2010 2011 2012 2013 2014 2015p Change 2015/2008
Total Travel and Tourism Imports1 $100,593 $86,036 $92,170 $98,636 $110,819 $109,986 $118,007 $125,228 $24,635
Travel (all purposes including education) $74,552 $65,502 $69,919 $73,226 $82,877 $80,010 $85,622 $92,913 $18,361
Of which: Education Related $4,709 $4,734 $5,051 $5,392 $5,680 $6,105 $6,563 $6,833 $2,124
Of which: Other Business/ Personal Travel $68,494 $59,343 $63,319 $66,159 $75,385 $71,953 $76,928 $83,752 $15,258
Passenger Air Transportation $26,041 $20,534 $22,251 $25,410 $27,942 $29,976 $32,385 $32,315 $6,274
Change (%) in Total Imports 8 -14 7 7 12 -1 7 6 24
(1) International standards now use a broader definition of travel than previously used, which includes education-related and health-related travel, as well as expenditures on goods and services by border, seasonal, and other short-term workers in the United States. For more information, please visit: http://travel.trade.gov/pdf/restructuring-travel.pdf (p) Preliminary, subject to future revisions. Estimates on passenger fares, education and other business/personal travel spending will be available in October 2015.
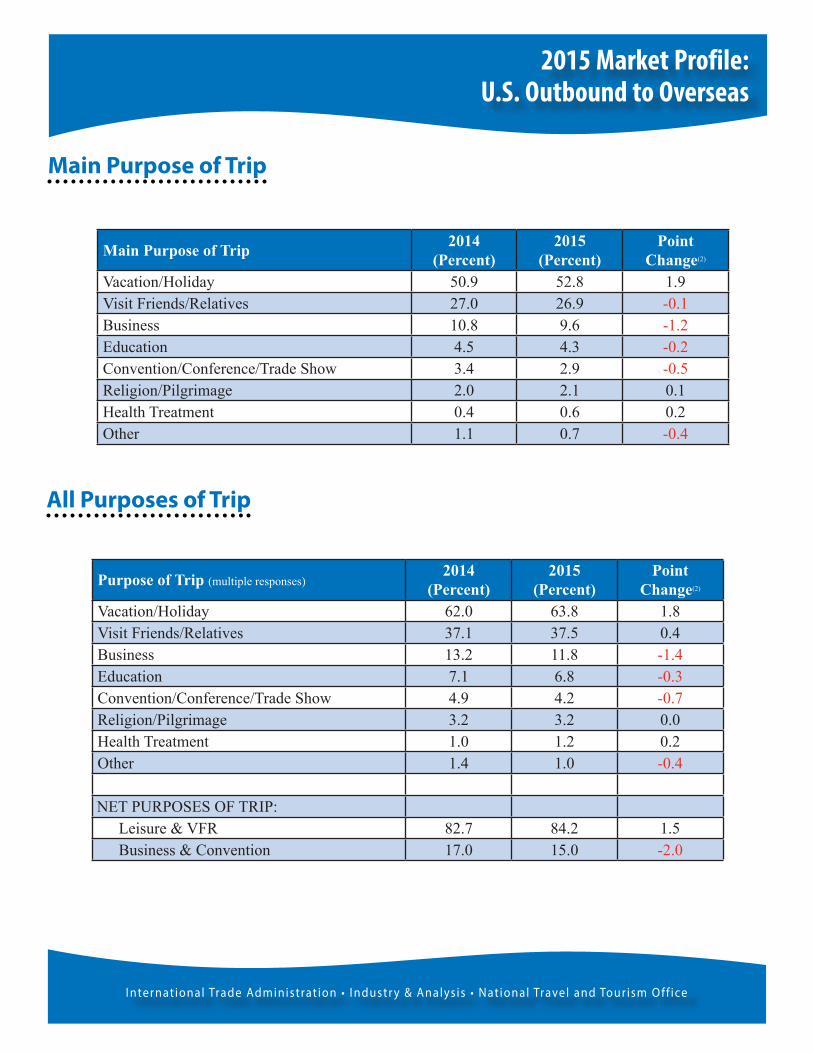
Main Purpose of Trip
Main Purpose of Trip 2014(Percent)
2015(Percent)
Point Change(2)
Vacation/Holiday 50.9 52.8 1.9Visit Friends/Relatives 27.0 26.9 -0.1Business 10.8 9.6 -1.2Education 4.5 4.3 -0.2Convention/Conference/Trade Show 3.4 2.9 -0.5Religion/Pilgrimage 2.0 2.1 0.1Health Treatment 0.4 0.6 0.2Other 1.1 0.7 -0.4
I nternat ional Trade Administrat ion • I ndustr y & Analys is • Nat ional Travel and Tour ism O ff ice
All Purposes of Trip
Purpose of Trip (multiple responses)2014
(Percent)2015
(Percent)Point
Change(2)
Vacation/Holiday 62.0 63.8 1.8Visit Friends/Relatives 37.1 37.5 0.4Business 13.2 11.8 -1.4Education 7.1 6.8 -0.3Convention/Conference/Trade Show 4.9 4.2 -0.7Religion/Pilgrimage 3.2 3.2 0.0Health Treatment 1.0 1.2 0.2Other 1.4 1.0 -0.4
NET PURPOSES OF TRIP:Leisure & VFR 82.7 84.2 1.5Business & Convention 17.0 15.0 -2.0
2015 Market Profile:U.S. Outbound to Overseas
I nternat ional Trade Administrat ion • I ndustr y & Analys is • Nat ional Travel and Tour ism O ff ice
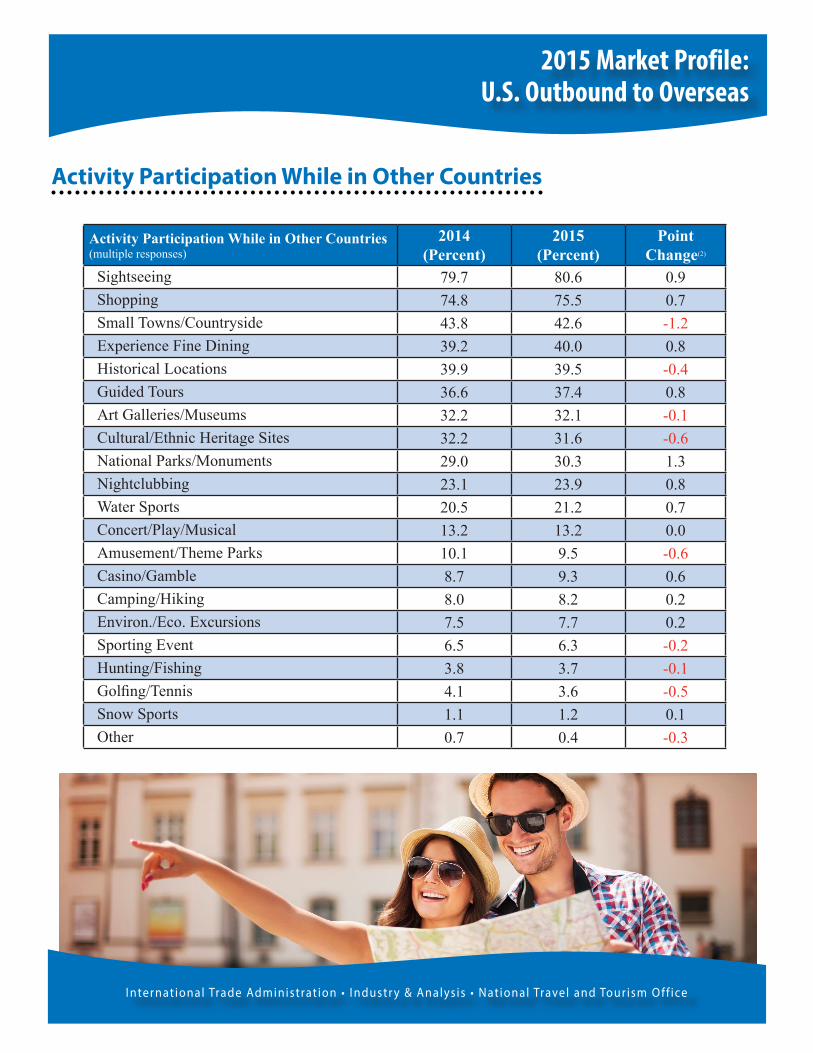
Activity Participation While in Other Countries
Activity Participation While in Other Countries(multiple responses)
2014(Percent)
2015(Percent)
Point Change(2)
Sightseeing 79.7 80.6 0.9Shopping 74.8 75.5 0.7Small Towns/Countryside 43.8 42.6 -1.2Experience Fine Dining 39.2 40.0 0.8Historical Locations 39.9 39.5 -0.4Guided Tours 36.6 37.4 0.8Art Galleries/Museums 32.2 32.1 -0.1Cultural/Ethnic Heritage Sites 32.2 31.6 -0.6National Parks/Monuments 29.0 30.3 1.3Nightclubbing 23.1 23.9 0.8Water Sports 20.5 21.2 0.7Concert/Play/Musical 13.2 13.2 0.0Amusement/Theme Parks 10.1 9.5 -0.6Casino/Gamble 8.7 9.3 0.6Camping/Hiking 8.0 8.2 0.2Environ./Eco. Excursions 7.5 7.7 0.2Sporting Event 6.5 6.3 -0.2Hunting/Fishing 3.8 3.7 -0.1Golfing/Tennis 4.1 3.6 -0.5Snow Sports 1.1 1.2 0.1Other 0.7 0.4 -0.3
2015 Market Profile:U.S. Outbound to Overseas
I nternat ional Trade Administrat ion • I ndustr y & Analys is • Nat ional Travel and Tour ism O ff ice
2015 Market Profile:U.S. Outbound to Overseas
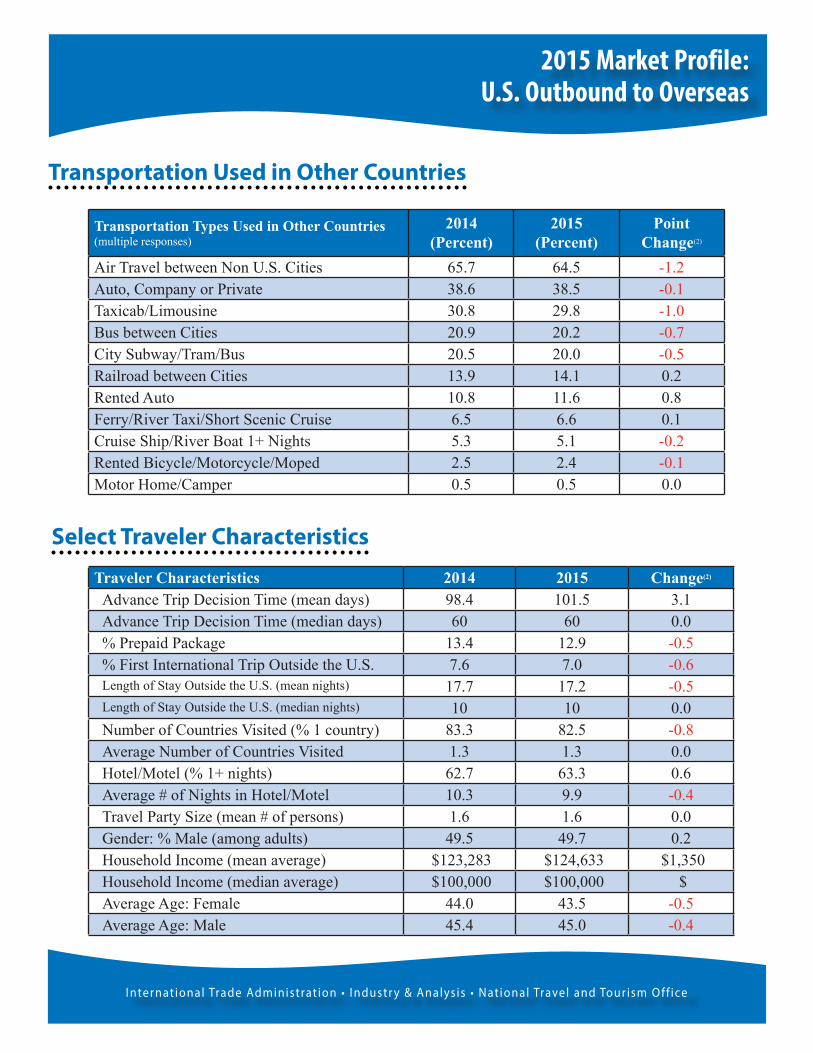
Traveler Characteristics 2014 2015 Change(2)
Advance Trip Decision Time (mean days) 98.4 101.5 3.1Advance Trip Decision Time (median days) 60 60 0.0% Prepaid Package 13.4 12.9 -0.5% First International Trip Outside the U.S. 7.6 7.0 -0.6Length of Stay Outside the U.S. (mean nights) 17.7 17.2 -0.5Length of Stay Outside the U.S. (median nights) 10 10 0.0Number of Countries Visited (% 1 country) 83.3 82.5 -0.8Average Number of Countries Visited 1.3 1.3 0.0Hotel/Motel (% 1+ nights) 62.7 63.3 0.6Average # of Nights in Hotel/Motel 10.3 9.9 -0.4Travel Party Size (mean # of persons) 1.6 1.6 0.0Gender: % Male (among adults) 49.5 49.7 0.2Household Income (mean average) $123,283 $124,633 $1,350 Household Income (median average) $100,000 $100,000 $ Average Age: Female 44.0 43.5 -0.5Average Age: Male 45.4 45.0 -0.4
Select Traveler Characteristics
Transportation Used in Other Countries
Transportation Types Used in Other Countries (multiple responses)
2014(Percent)
2015(Percent)
Point Change(2)
Air Travel between Non U.S. Cities 65.7 64.5 -1.2Auto, Company or Private 38.6 38.5 -0.1Taxicab/Limousine 30.8 29.8 -1.0Bus between Cities 20.9 20.2 -0.7City Subway/Tram/Bus 20.5 20.0 -0.5Railroad between Cities 13.9 14.1 0.2Rented Auto 10.8 11.6 0.8Ferry/River Taxi/Short Scenic Cruise 6.5 6.6 0.1Cruise Ship/River Boat 1+ Nights 5.3 5.1 -0.2Rented Bicycle/Motorcycle/Moped 2.5 2.4 -0.1Motor Home/Camper 0.5 0.5 0.0
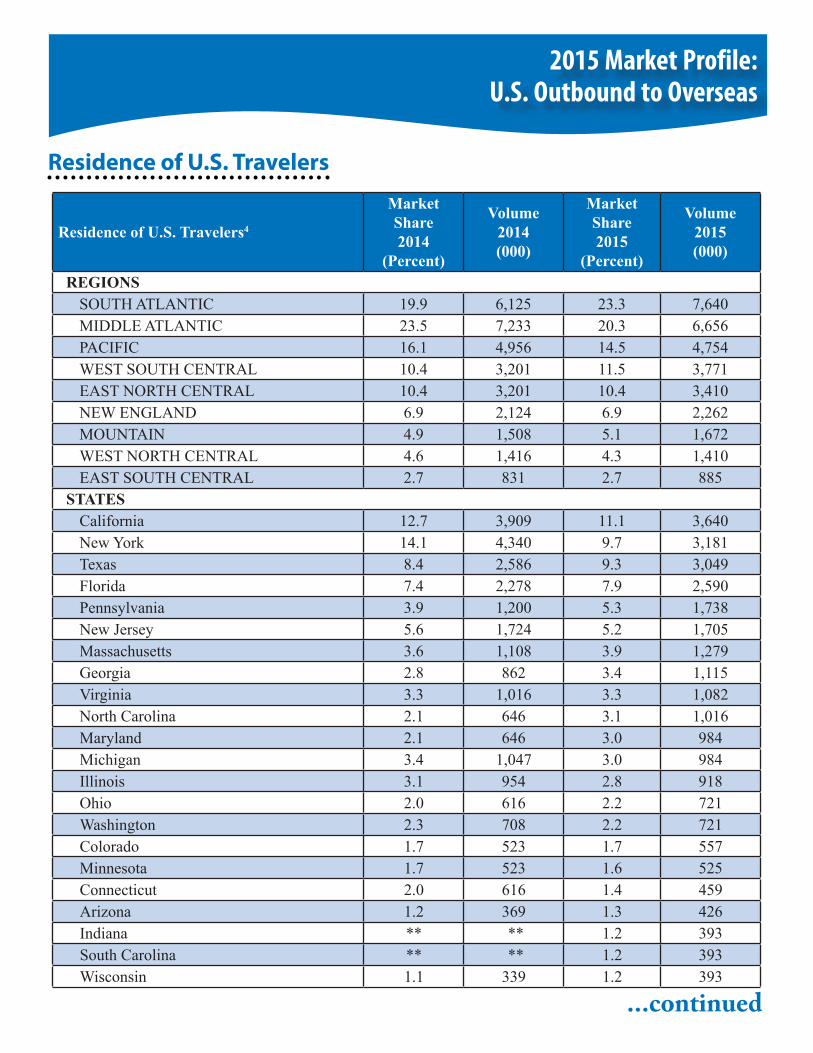
Residence of U.S. Travelers
Residence of U.S. Travelers4
MarketShare2014
(Percent)
Volume2014(000)
MarketShare2015
(Percent)
Volume2015(000)
REGIONSSOUTH ATLANTIC 19.9 6,125 23.3 7,640MIDDLE ATLANTIC 23.5 7,233 20.3 6,656PACIFIC 16.1 4,956 14.5 4,754WEST SOUTH CENTRAL 10.4 3,201 11.5 3,771EAST NORTH CENTRAL 10.4 3,201 10.4 3,410NEW ENGLAND 6.9 2,124 6.9 2,262MOUNTAIN 4.9 1,508 5.1 1,672WEST NORTH CENTRAL 4.6 1,416 4.3 1,410EAST SOUTH CENTRAL 2.7 831 2.7 885
STATESCalifornia 12.7 3,909 11.1 3,640New York 14.1 4,340 9.7 3,181Texas 8.4 2,586 9.3 3,049Florida 7.4 2,278 7.9 2,590Pennsylvania 3.9 1,200 5.3 1,738New Jersey 5.6 1,724 5.2 1,705Massachusetts 3.6 1,108 3.9 1,279Georgia 2.8 862 3.4 1,115Virginia 3.3 1,016 3.3 1,082North Carolina 2.1 646 3.1 1,016Maryland 2.1 646 3.0 984Michigan 3.4 1,047 3.0 984Illinois 3.1 954 2.8 918Ohio 2.0 616 2.2 721Washington 2.3 708 2.2 721Colorado 1.7 523 1.7 557Minnesota 1.7 523 1.6 525Connecticut 2.0 616 1.4 459Arizona 1.2 369 1.3 426Indiana ** ** 1.2 393South Carolina ** ** 1.2 393Wisconsin 1.1 339 1.2 393
2015 Market Profile:U.S. Outbound to Overseas
...continued
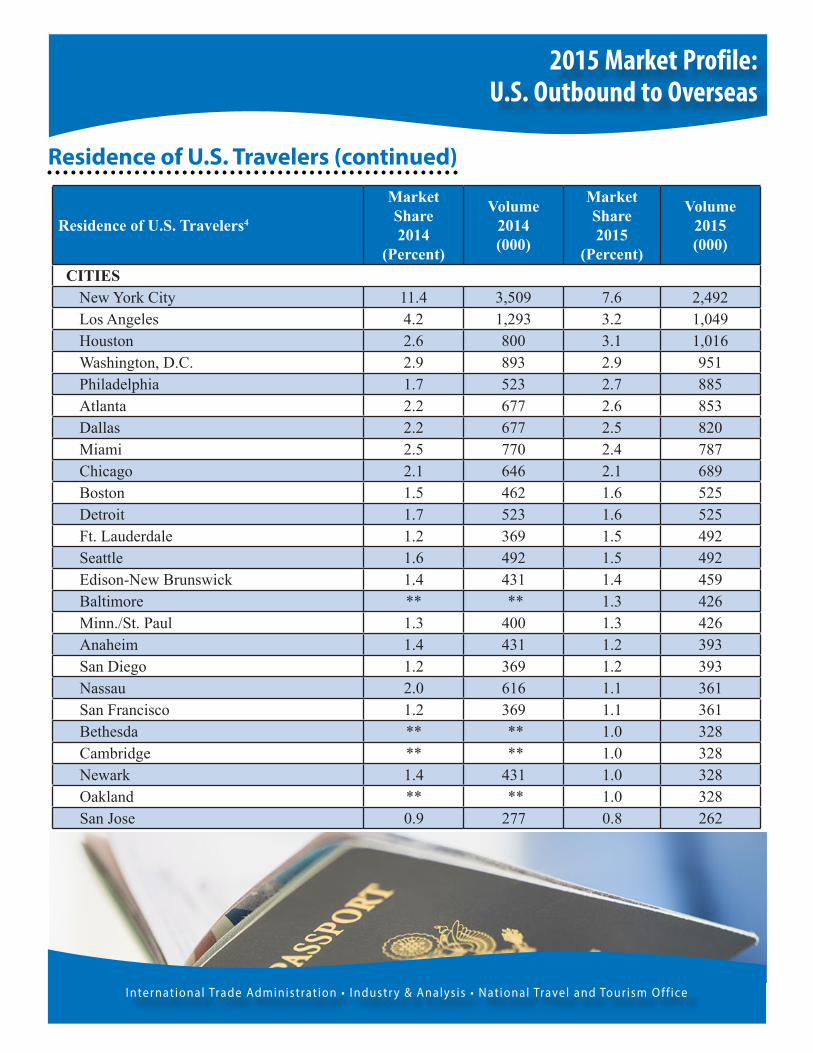
Residence of U.S. Travelers (continued)
Residence of U.S. Travelers4
MarketShare2014
(Percent)
Volume2014(000)
MarketShare2015
(Percent)
Volume2015(000)
CITIESNew York City 11.4 3,509 7.6 2,492Los Angeles 4.2 1,293 3.2 1,049Houston 2.6 800 3.1 1,016Washington, D.C. 2.9 893 2.9 951Philadelphia 1.7 523 2.7 885Atlanta 2.2 677 2.6 853Dallas 2.2 677 2.5 820Miami 2.5 770 2.4 787Chicago 2.1 646 2.1 689Boston 1.5 462 1.6 525Detroit 1.7 523 1.6 525Ft. Lauderdale 1.2 369 1.5 492Seattle 1.6 492 1.5 492Edison-New Brunswick 1.4 431 1.4 459Baltimore ** ** 1.3 426Minn./St. Paul 1.3 400 1.3 426Anaheim 1.4 431 1.2 393San Diego 1.2 369 1.2 393Nassau 2.0 616 1.1 361San Francisco 1.2 369 1.1 361Bethesda ** ** 1.0 328Cambridge ** ** 1.0 328Newark 1.4 431 1.0 328Oakland ** ** 1.0 328San Jose 0.9 277 0.8 262
2015 Market Profile:U.S. Outbound to Overseas
I nternat ional Trade Administrat ion • I ndustr y & Analys is • Nat ional Travel and Tour ism O ff ice
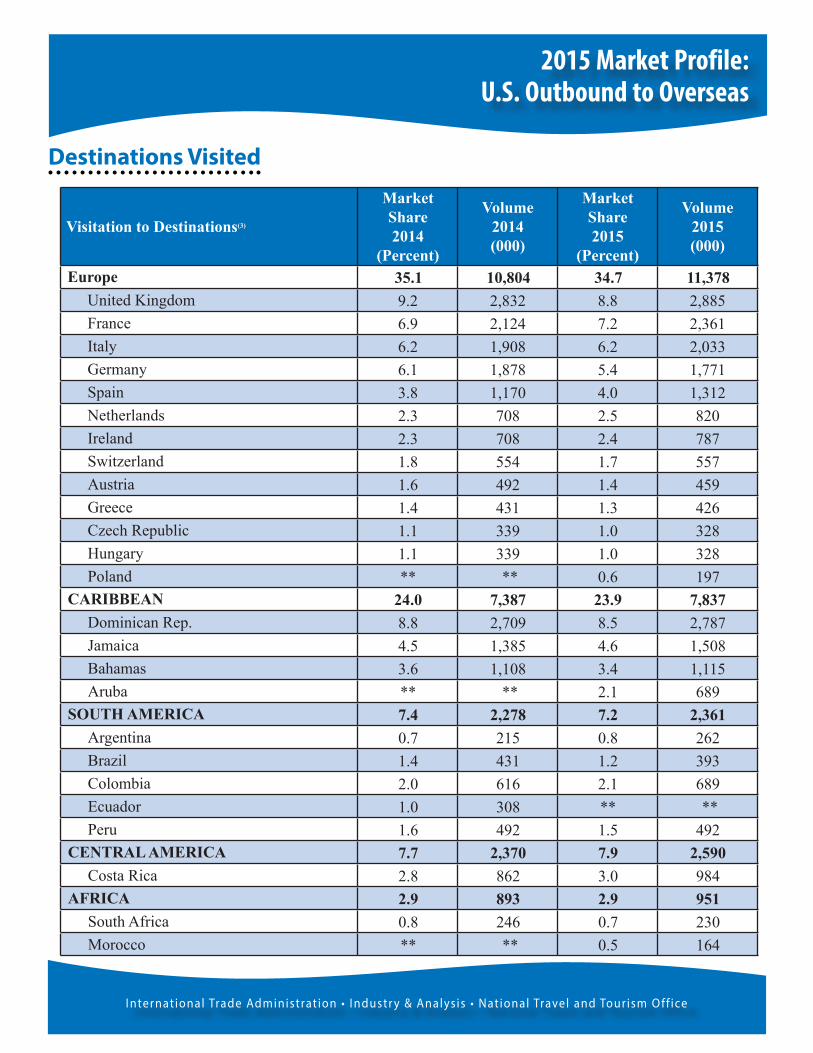
Destinations Visited
2015 Market Profile:U.S. Outbound to Overseas
Visitation to Destinations(3)
MarketShare2014
(Percent)
Volume2014(000)
MarketShare2015
(Percent)
Volume2015(000)
Europe 35.1 10,804 34.7 11,378United Kingdom 9.2 2,832 8.8 2,885France 6.9 2,124 7.2 2,361Italy 6.2 1,908 6.2 2,033Germany 6.1 1,878 5.4 1,771Spain 3.8 1,170 4.0 1,312Netherlands 2.3 708 2.5 820Ireland 2.3 708 2.4 787Switzerland 1.8 554 1.7 557Austria 1.6 492 1.4 459Greece 1.4 431 1.3 426Czech Republic 1.1 339 1.0 328Hungary 1.1 339 1.0 328Poland ** ** 0.6 197
CARIBBEAN 24.0 7,387 23.9 7,837Dominican Rep. 8.8 2,709 8.5 2,787Jamaica 4.5 1,385 4.6 1,508Bahamas 3.6 1,108 3.4 1,115Aruba ** ** 2.1 689
SOUTH AMERICA 7.4 2,278 7.2 2,361Argentina 0.7 215 0.8 262Brazil 1.4 431 1.2 393Colombia 2.0 616 2.1 689Ecuador 1.0 308 ** ** Peru 1.6 492 1.5 492
CENTRAL AMERICA 7.7 2,370 7.9 2,590Costa Rica 2.8 862 3.0 984
AFRICA 2.9 893 2.9 951South Africa 0.8 246 0.7 230Morocco ** ** 0.5 164
I nternat ional Trade Administrat ion • I ndustr y & Analys is • Nat ional Travel and Tour ism O ff ice
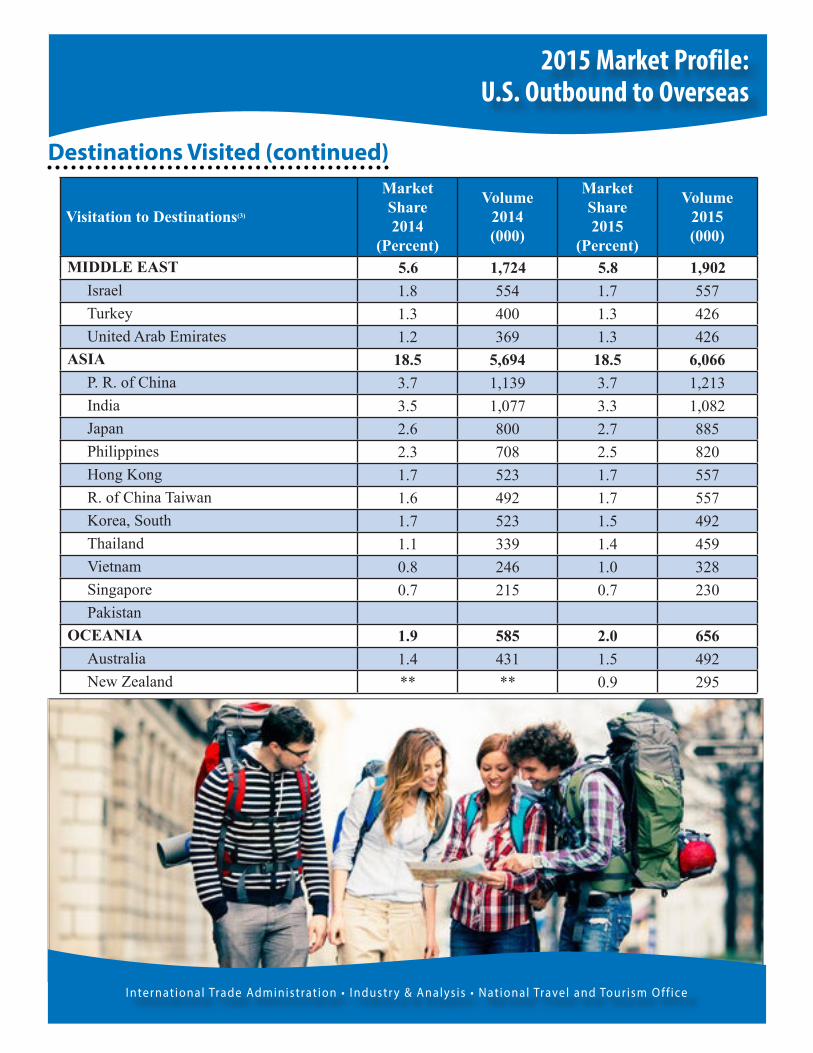
Destinations Visited (continued)
2015 Market Profile:U.S. Outbound to Overseas
Visitation to Destinations(3)
MarketShare2014
(Percent)
Volume2014(000)
MarketShare2015
(Percent)
Volume2015(000)
MIDDLE EAST 5.6 1,724 5.8 1,902Israel 1.8 554 1.7 557Turkey 1.3 400 1.3 426United Arab Emirates 1.2 369 1.3 426
ASIA 18.5 5,694 18.5 6,066P. R. of China 3.7 1,139 3.7 1,213India 3.5 1,077 3.3 1,082Japan 2.6 800 2.7 885Philippines 2.3 708 2.5 820Hong Kong 1.7 523 1.7 557R. of China Taiwan 1.6 492 1.7 557Korea, South 1.7 523 1.5 492Thailand 1.1 339 1.4 459Vietnam 0.8 246 1.0 328Singapore 0.7 215 0.7 230Pakistan
OCEANIA 1.9 585 2.0 656Australia 1.4 431 1.5 492New Zealand ** ** 0.9 295
I nternat ional Trade Administrat ion • I ndustr y & Analys is • Nat ional Travel and Tour ism O ff ice
(1) Total Travel & Tourism Imports = travel payments (purchase of travel and tourism-related goods and services, to include food, lodging, recreation, gifts, entertainment, local transportation in the country of travel, and other items incident to a foreign visit) + passenger fare payments (fares paid to foreign air carriers and vessel operators for travel between the United States and foreign countries and between two foreign points). (2) Percentage-point and percentage changes are based on non-rounded data. (3) Only country and world region destinations having a sample size of 400 or more are displayed. Due to quarterly data weighting by country and port of entry, some unreported destinations may have a higher proportion of total than those reported. (4) Only U.S. origin areas having a sample size of 400 or more are displayed. Due to quarterly data weighting by country and port of entry, some unreported destinations may have a higher proportion of total than those reported. (-) No estimate available. Note: This profile shows only a portion of the 40 travel characteristics data reported on international travel from the U.S. Additional information may be obtained for a fee. To learn more, please visit our website: http://tinet.ita.doc.gov/research/programs/ifs/index.html For a list of the states that comprise each census region, please visit: http://tinet.ita.goc.gov/outreachpages/census_regions.html Interested in data for your destination?: NTTO sells custom reports. To learn more, go to: http://travel.trade.gov/research/programs/ifs/customized.html Source: U.S. Department of Commerce, ITA, National Travel and Tourism Office Publication Date: October 2016
2015 Market Profile:U.S. Outbound to Overseas
I nternat ional Trade Administrat ion • I ndustr y & Analys is • Nat ional Travel and Tour ism O ff ice
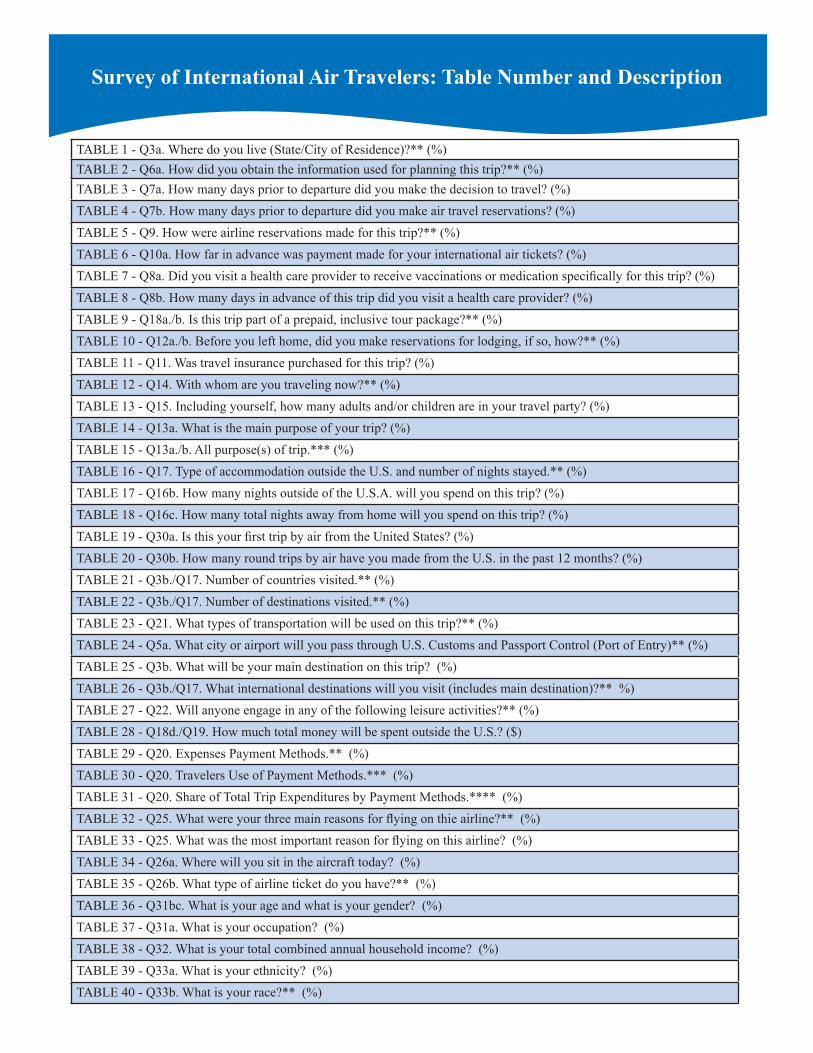
Survey of International Air Travelers: Table Number and Description
TABLE 1 - Q3a. Where do you live (State/City of Residence)?** (%)TABLE 2 - Q6a. How did you obtain the information used for planning this trip?** (%)TABLE 3 - Q7a. How many days prior to departure did you make the decision to travel? (%)TABLE 4 - Q7b. How many days prior to departure did you make air travel reservations? (%)TABLE 5 - Q9. How were airline reservations made for this trip?** (%)TABLE 6 - Q10a. How far in advance was payment made for your international air tickets? (%)TABLE 7 - Q8a. Did you visit a health care provider to receive vaccinations or medication specifically for this trip? (%)TABLE 8 - Q8b. How many days in advance of this trip did you visit a health care provider? (%)TABLE 9 - Q18a./b. Is this trip part of a prepaid, inclusive tour package?** (%)TABLE 10 - Q12a./b. Before you left home, did you make reservations for lodging, if so, how?** (%)TABLE 11 - Q11. Was travel insurance purchased for this trip? (%)TABLE 12 - Q14. With whom are you traveling now?** (%)TABLE 13 - Q15. Including yourself, how many adults and/or children are in your travel party? (%)TABLE 14 - Q13a. What is the main purpose of your trip? (%)TABLE 15 - Q13a./b. All purpose(s) of trip.*** (%)TABLE 16 - Q17. Type of accommodation outside the U.S. and number of nights stayed.** (%)TABLE 17 - Q16b. How many nights outside of the U.S.A. will you spend on this trip? (%)TABLE 18 - Q16c. How many total nights away from home will you spend on this trip? (%)TABLE 19 - Q30a. Is this your first trip by air from the United States? (%)TABLE 20 - Q30b. How many round trips by air have you made from the U.S. in the past 12 months? (%)TABLE 21 - Q3b./Q17. Number of countries visited.** (%)TABLE 22 - Q3b./Q17. Number of destinations visited.** (%)TABLE 23 - Q21. What types of transportation will be used on this trip?** (%)TABLE 24 - Q5a. What city or airport will you pass through U.S. Customs and Passport Control (Port of Entry)** (%)TABLE 25 - Q3b. What will be your main destination on this trip? (%)TABLE 26 - Q3b./Q17. What international destinations will you visit (includes main destination)?** %)TABLE 27 - Q22. Will anyone engage in any of the following leisure activities?** (%)TABLE 28 - Q18d./Q19. How much total money will be spent outside the U.S.? ($)TABLE 29 - Q20. Expenses Payment Methods.** (%)TABLE 30 - Q20. Travelers Use of Payment Methods.*** (%)TABLE 31 - Q20. Share of Total Trip Expenditures by Payment Methods.**** (%)TABLE 32 - Q25. What were your three main reasons for flying on thie airline?** (%)TABLE 33 - Q25. What was the most important reason for flying on this airline? (%)TABLE 34 - Q26a. Where will you sit in the aircraft today? (%)TABLE 35 - Q26b. What type of airline ticket do you have?** (%)TABLE 36 - Q31bc. What is your age and what is your gender? (%)TABLE 37 - Q31a. What is your occupation? (%)TABLE 38 - Q32. What is your total combined annual household income? (%)TABLE 39 - Q33a. What is your ethnicity? (%)TABLE 40 - Q33b. What is your race?** (%)
Interested in obtaining data for your organization?
One of the unique features of the Survey program is its ‘data-mining’ potential. The Sur-vey research data, collected from the questionnaire, is maintained in a computer data-base. Therefore, customized reports, special tables and data files are available.
To learn more, go to: http://travel.trade.gov/research/programs/ifs/index.html
U.S. Department of CommerceInternational Trade Administration
Industry & AnalysisNational Travel and Tourism Office
1401 Const i tut ion Ave, NWWashington, D.C. 20230Phone: (202) 482-0140
Fax: (202) [email protected]
http://travel.trade.govI nternat ional Trade Administrat ion • I ndustr y & Analys is • Nat ional Travel and Tour ism O ff ice
For NTTO programs of interest visit:http://travel.trade.gov/research/index.html
• Summary of International Travel to the United States (I-94)• U.S. International Air Traveler Statistics (APIS, formerly I-92)• Survey of International Air Travelers (SIAT )• Canadian Statistics• Forecast of International Arrivals to the United States• U.S. Travel and Tourism Exports, Imports and the Balance of Trade• U.S. Travel and Tourism Satellite Accounts