Embed Size (px)
Citation preview

Air Quality Bureau September 2, 2016
2015 Ozone NAAQS DESIGNATION RECOMMENDATION REPORT

1 | New Mexico’s 2015 Ozone NAAQS Designation Recommendation Report
Table of Contents
1 Introduction ............................................................................................................................. 2
2 Air Quality Data ...................................................................................................................... 4
3 Emissions and Emissions-Related Data .................................................................................. 6
3.1 NOx Emissions ................................................................................................................. 7
3.2 VOC Emissions .............................................................................................................. 10
3.3 Population and Degree of Urbanization ......................................................................... 12
3.4 Traffic and Commuting Patterns .................................................................................... 13
4 Meteorology........................................................................................................................... 15
5 Geography/Topography ......................................................................................................... 16
6 Jurisdictional Boundaries ...................................................................................................... 16
7 Recommended Nonattainment Area Boundary ..................................................................... 16
7.1 Alternative Boundary Recommendation ........................................................................ 18
8 Appendix A: Ozone Monitoring Data ................................................................................... 20
9 Appendix B: Sunland Park Area Traffic Flow Maps ............................................................ 21
10 Appendix C: Meteorological Data ..................................................................................... 24
10.1 Desert View ................................................................................................................ 25
10.2 Santa Teresa ................................................................................................................ 37

2 | New Mexico’s 2015 Ozone NAAQS Designation Recommendation Report
1 Introduction On October 1, 2015, the United States Environmental Protection Agency (EPA) revised the 2008 8-hour ozone National Ambient Air Quality Standard (NAAQS) from 0.075 parts per million to 0.070 parts per million (ppm) (80 FR 65291; October 26, 2015). Section 107(d)(1)(A) of the Federal Clean Air Act (CAA) requires states to submit to EPA recommendations on area designations no later than one year after the promulgation of a new or revised NAAQS. Areas are to be identified as attainment, nonattainment, or unclassifiable. The deadline for submitting these recommendations is October 1, 2016. The State of New Mexico recommends that the counties under the jurisdiction of the New Mexico Environment Department (NMED), exclusive of tribal lands and Bernalillo County, be designated as identified in Table 1-1 below. These recommendations rely on air quality monitoring data using the most recent three consecutive years of quality-assured data (2013-2015) and EPA’s February 25, 2016 Memorandum, Area Designations for the 2015 Ozone National Ambient Air Quality Standards (Guidance Memo), as the basis for its recommendations. The Guidance Memo can be found on EPA’s website at www.epa.gov/ozone-designations/ozone-designations-guidance-and-data. The data for 2013-2015 for all ozone monitors are presented in Appendix A. NMED conducted an analysis to determine whether New Mexico would recommend the presumptive boundary for Doña Ana County area designation, or propose an alternate boundary. EPA recommends that the Core Based Statistical Area (CBSA) serve as the presumptive boundary when considering the geographic boundaries of an ozone nonattainment area. Since the CBSA that covers Doña Ana County includes El Paso and Hudspeth Counties in Texas, NMED will use the Las Cruces Metropolitan Statistical Area (MSA). The Las Cruces MSA includes the entirety of Doña Ana County and serves as the presumptive boundary. To assist with the nonattainment boundary recommendation, NMED evaluated the 5 factors listed in Attachment 3 of the Guidance Memo, as follows:
• Air quality data; • Emissions and emissions-related data; • Meteorological data; • Geography/topography; and • Jurisdictional boundaries.
Based on the results of the analysis, NMED has decided to recommend an area smaller than the Las Cruces MSA as nonattainment.

3 | New Mexico’s 2015 Ozone NAAQS Designation Recommendation Report
Table 1-1: New Mexico County Designation Recommendations for the 2015 Ozone NAAQS.
County 2013-2015 Design Value (ppm) Designation Recommendation Bernalillo County Not in NMED’s jurisdiction Not in NMED’s jurisdiction Catron County No data Attainment/Unclassifiable Chaves County No data Attainment/Unclassifiable Cibola County No data Attainment/Unclassifiable Colfax County No data Attainment/Unclassifiable Curry County No data Attainment/Unclassifiable De Baca County No data Attainment/Unclassifiable Doña Ana County
La Union --- 0.066 Nonattainment - partial
Chaparral --- 0.067 Desert View --- 0.072 Santa Teresa --- 0.072 Solano --- 0.065
Eddy County Carlsbad --- 0.069 Attainment Grant County No data Attainment/Unclassifiable Guadalupe County No data Attainment/Unclassifiable Harding County No data Attainment/Unclassifiable Hidalgo County No data Attainment/Unclassifiable Lea County Hobbs --- 0.067 Attainment Lincoln County No data Attainment/Unclassifiable Los Alamos County No data Attainment/Unclassifiable Luna County No data Attainment/Unclassifiable McKinley County No data Attainment/Unclassifiable Mora County No data Attainment/Unclassifiable Otero County No data Attainment/Unclassifiable Quay County No data Attainment/Unclassifiable Rio Arriba County Coyote Ranger District --- 0.065 Attainment/Unclassifiable Roosevelt County No data Attainment/Unclassifiable Sandoval County Bernalillo --- 0.065 Attainment San Juan County
Bloomfield --- 0.064 Attainment Navajo Lake --- 0.067
Substation --- 0.063 San Miguel County No data Attainment/Unclassifiable Santa Fe County Santa Fe Airport --- 0.064 Attainment/Unclassifiable Sierra County No data Attainment/Unclassifiable Socorro County No data Attainment/Unclassifiable Taos County No data Attainment/Unclassifiable Torrance County No data Attainment/Unclassifiable Union County No data Attainment/Unclassifiable Valencia County Los Lunas --- .066 Attainment/Unclassifiable (Bold – exceeds NAAQS)

4 | New Mexico’s 2015 Ozone NAAQS Designation Recommendation Report
2 Air Quality Data The ozone monitoring network in Doña Ana County contains 5 federal regulatory design-value monitors operated and maintained in accordance with 40 CFR Parts 50, 53, and 58. Table 2-1 below contains information on the current ozone monitors in Doña Ana County. To determine compliance with the 2015 Ozone NAAQS, a design value must be calculated to compare to the level of the standard. The design value is determined by the 3-year average of the annual 4th highest 8-hour ozone average. Table 2-1: Doña Ana County Monitoring Data (ppm).
Site Name AQS ID # 4th Max 8-hour Average Design Value (2013 – 2015) 2013 2014 2015
Desert View 35-013-0021 .071 .072 .074 .072 Santa Teresa 35-013-0022 .080 .066 .070 .072
La Union 35-013-0008 .067 .065 .070 .066 Chaparral 35-013-0020 .069 .067 .065 .067
Solano Road 35-013-0023 .064 .066 .066 .065 (Bold – exceeds NAAQS)
Within the Doña Ana County monitoring network, two monitors have recorded levels that exceed the revised 8-hour ozone standard of 0.070 ppm for the years 2013-2015 (Figure 2-1). Both the Desert View and Santa Teresa monitors have a 2013-2015 design value of 0.072 ppm. Other monitors within Doña Ana County have design values between 0.065 and 0.067 ppm. Figure 2-2 below shows the location of ozone monitoring sites in Doña Ana County. Figure 2-1: Doña Ana County 2013-2015 Ozone Monitoring Data.

5 | New Mexico’s 2015 Ozone NAAQS Designation Recommendation Report
Figure 2-2: Doña Ana County Ozone Monitoring Network.

6 | New Mexico’s 2015 Ozone NAAQS Designation Recommendation Report
The two monitors that violate the NAAQS are both located in the southern-most portion of the county, north of Mexico and west of Texas. The monitors are located in the city of Sunland Park and the unincorporated area of Santa Teresa, New Mexico, near the international border with Mexico and the state line of Texas. Established in June 2004, the Desert View monitor is located at 5935 Valle Vista in Sunland Park, New Mexico at an elevation of 3860 feet. This monitoring site measures NO2, O3, PM10, PM2.5, and meteorological data. Also established in June 2004, the Santa Teresa monitor is located at 104-2 Santa Teresa International Blvd, west of Sunland Park, New Mexico at an elevation of 4100 feet. This monitoring site measures NO2, O3, and meteorological data. Historical 8-hr ozone design values for the Doña Ana County ozone monitors are shown in Figure 2-3 below. Figure 2-3: Historical ozone design values for Doña Ana County.
3 Emissions and Emissions-related Data Ozone is not emitted directly from specific sources, but rather is formed as the result of complex atmospheric processes of precursor gases. The primary precursor pollutants are nitrogen oxides (NOx) and Volatile Organic Compounds (VOC). To determine the sources and levels of NOx and VOC, NMED evaluated emissions data from Doña Ana County and nearby sources using the 2011 National Emissions Inventory (2011 NEIv2). For purposes of this analysis, NMED interpreted nearby sources to include those sources located in counties (U.S.) and municipalities (Mexico) surrounding the violating monitors within the El Paso-Las Cruces CBSA.

7 | New Mexico’s 2015 Ozone NAAQS Designation Recommendation Report
3.1 NOx Emissions Total NOx emissions in Doña Ana County were estimated at 11,506 tons/year for 2011. On-road mobile sources comprise the majority of NOx emissions, with 7,535 tons/year or 65% of all NOx emissions. Area sources account for the second largest amount of NOx emissions, with 2,278 tons/year. One point source in the county, the Rio Grande Generating Station, emitted more than 100 tons/year of NOx (717 tons/year), accounting for 84% of point source NOx emissions. The nearby counties have a similar emissions profile, as shown in Figure 3-1. Emissions data for Ciudad Juárez is coarser than that for the U.S. counties, being classified only by area, mobile, and point sources. For purposes of comparison, NMED classified emissions into these three source categories by including fire emissions into area sources and combining nonroad and onroad emissions into mobile sources. Although a similar pattern for Cd. Juárez emission sources is seen in Figure 3-2, point sources account for a much larger portion of total NOx emissions. Figure 3-1: NOx emissions by county and source category.

8 | New Mexico’s 2015 Ozone NAAQS Designation Recommendation Report
Figure 3-2: NOx emissions by county including Cd. Juárez.
The areas with the highest NOx emissions – Doña Ana County, El Paso County, and Cd. Juárez – comprise the Paso del Norte Airshed. El Paso County and Cd. Juárez account for 76% of total NOx emissions in the airshed (Figure 3-3). Facilities in El Paso County and Cd. Juárez account for 92% of point source NOx emissions in the airshed (Figure 3-4).

9 | New Mexico’s 2015 Ozone NAAQS Designation Recommendation Report
Figure 3-3: Percentage of total NOx emissions in the Paso del Norte Airshed.
Figure 3-4: Percentage of point source NOx emissions in the Paso del Norte Airshed.

10 | New Mexico’s 2015 Ozone NAAQS Designation Recommendation Report
3.2 VOC Emissions Total VOC emissions for Doña Ana County were 78,432 tons/year in 2011. Biogenic emissions from plants and soil account for the largest source of emissions, with 68,667 tons/year or approximately 88% of all emissions. On-road mobile and area sources account for nearly the same amount of VOC emissions, with 3,154 tons/year and 3,140 tons/year respectively, followed by fires, with 2,869 tons/year. Most of the nearby counties follow this pattern with the exception of Otero County, which had much higher VOC emissions from fire than the other counties. This is most likely due to the 2011 Donaldson wildfire in the Lincoln National Forest. Figure 3-5: VOC emissions by county and source category.
Similar to the NOx emissions profile, the data for Cd. Juárez was classified only by area, mobile, and point sources. To compare emissions from the U.S. and Mexico, NMED classified emissions into these three source categories, but did not include biogenic VOC emissions. Although a similar pattern for Cd. Juárez emission sources is seen in Figure 3-6, area sources account for a much larger portion of total VOC emissions, excluding Otero County where fire accounted for 94% of area source VOC emissions in 2011. In the Paso del Norte Airshed, El Paso County and Cd. Juárez account for 84% of total VOC emissions in the airshed (Figure 3-7). Facilities in El Paso County and Cd. Juárez account for 99% of point source VOC emissions in the airshed (Figure 3-8).

11 | New Mexico’s 2015 Ozone NAAQS Designation Recommendation Report
Figure 3-6: VOC emissions by county including Cd. Juárez.
Figure 3-7: Percentage of total VOC emissions in the Paso del Norte Airshed.

12 | New Mexico’s 2015 Ozone NAAQS Designation Recommendation Report
Figure 3-8: Percentage of point source VOC emissions in the Paso del Norte Airshed.
3.3 Population and Degree of Urbanization Population estimates and related data were obtained from the U.S. Census Bureau and the National Institute of Statistics and Geography in Mexico and are summarized in Table 3-1, below. Estimates for 2014 indicate that approximately 2.4 million people live in Doña Ana County, El Paso County and Cd. Juárez. The majority of the population in the airshed lives in the heavily urbanized areas in the city of El Paso and Cd. Juárez. Doña Ana County residents make up approximately 9% of this population with the majority living in and around the city of Las Cruces, nearly 40 miles to the north of the violating monitors. To estimate the population in Doña Ana County living near the violating monitors, NMED used 2014 U.S. Census estimates from the city of Sunland Park, and the Census Designated Places of La Union and Santa Teresa (Sunland Park Area). These areas cover approximately 26.5 mi2 with a population of 20,324. Although the resulting population density of 767 people/mi2 would classify this area as rural, the U.S. Census Bureau classifies them as urban due to the close proximity and interconnectedness to El Paso and Cd. Juárez. Table 3-1: Population and Population Density.
Doña Ana County El Paso County Cd. Juárez Sunland Park Area Population 212,942 823,862 1,341,717 20,324 Land Area (mi2) 3,808 1,013 73 26.5 Density (people/mi2) 56 813 18,380 767

13 | New Mexico’s 2015 Ozone NAAQS Designation Recommendation Report
After experiencing steady population growth of 4.2% annually throughout the 20th century, Doña Ana County, El Paso County, and Cd. Juárez saw slow to moderate growth from 2000 to 2010 with a 1.1% annual growth rate. This slowdown in growth continued from 2010 to 2014. Much of these population trends are driven by the core urban areas of El Paso and Cd. Juárez (Figure 3-9). From 2010 to 2014 the Sunland Park Area grew from 18,903 to 20,324 residents for an annual growth rate of 1.9%. Although this is much larger than the 0.79% growth rate for the entire area during this time, the absolute number of people is small. Figure 3-9: Population trends in the Paso del Norte Airshed.
3.4 Traffic and Commuting Patterns The major thoroughfares in Doña Ana County are Interstate 25 and Interstate 10. Most vehicular traffic in the county is concentrated in the central and southern parts of the county, in and around Las Cruces, as well as along Interstate 10 which connects to El Paso. Using the Vehicle Miles Traveled (VMT) spreadsheet provided by EPA, Doña Ana County had a total VMT of 2.3 billion miles in 2011. El Paso County had more than double this VMT in 2011 with a total of 5.6 billion miles. In the Sunland Park Area, the majority of vehicular traffic is limited to a few major thoroughfares, including but not limited to NM Hwy. 28, McNutt Rd., the Pete V. Domenici Memorial Hwy., Country Club Rd., Sunland Park Dr., and Racetrack Dr. Using average daily traffic (ADT) data provided by the El Paso Metropolitan Planning Organization (Appendix B),

14 | New Mexico’s 2015 Ozone NAAQS Designation Recommendation Report
NMED calculated the Sunland Park Area’s VMT to be 62.9 million or 2.7% of the total county VMT (Table 3-2). Table 3-2. VMT for the Sunland Park Area.
Road/Highway Distance in miles ADT VMT Hwy 225 3.35 4,560 5,575,740 Hwy 28 5.91 5,510 5,950,778 Hwy 183 1.00 1,080 394,200 Hwy 182 0.98 2,010 718,977
Alvarez Rd/Hwy 273 8.08 11,410 7,233,862 McNutt Rd/Hwy 273 6.69 34,050 20,331,814
Pete Domenici/Hwy 136 7.55 18,360 15,090,852 Airport Rd 1.55 2,920 1,651,990
Sunland Park Dr 0.5 15,390 2,808,675 Racetrack Dr 0.9 1,860 611,010
Country Club Rd 0.57 12,360 2,571,498 Total 37.08 109,510 62,939,396
According to U.S. Census Bureau’s 2009-2013 American Community Survey, 14,423 or 16.6% of Doña Ana County residents travel to another county for work (Table 3-3). Although only 5.8% of El Paso County residents travel to another county for work, the absolute number of commuters is the greatest at 18,901. For the remaining counties in New Mexico, 3,991 residents travel to another county for work. Table 3-3. Travel patterns to work by county.
County Name Total Workers Work in Another County Percent
Doña Ana County 86,740 14,423 16.6% Luna County 8,538 1,059 12.4% Otero County 24,232 2,827 11.7% Sierra County 3,740 105 2.8% El Paso County 326,519 18,901 5.7% Total 449,769 37,315 8.3%
Approximately 42% of all inter-county work trips originated in Doña Ana County with a final destination of El Paso County (Table 3-4). Trips originating in El Paso County with a destination of Doña Ana County comprise nearly 29% of all inter-county work trips. More than 70% of the work trips in the region occur between Doña Ana County and El Paso County. Approximately 14% of residents in the U.S. travel to Mexico for work with most of the commuters residing in El Paso County. Another 8.6% of inter-county work trips originate in Luna, Otero, or Sierra Counties with a final destination of Doña Ana County or El Paso County.

15 | New Mexico’s 2015 Ozone NAAQS Designation Recommendation Report
Table 3-4. Inter-county work trips.
Residence Place of Work Commuting Flow Percent of Total
Doña Ana County Luna County 372 1.3% Doña Ana County Otero County 528 1.9% Doña Ana County Sierra County 245 0.9% Doña Ana County El Paso County 11,941 42.0% Doña Ana County Mexico 105 0.4% Luna County Doña Ana County 339 1.2% Luna County El Paso County 55 0.2% Luna County Mexico 70 0.2% Otero County Doña Ana County 820 2.9% Otero County El Paso County 1,181 4.2% Sierra County Doña Ana County 21 0.1% El Paso County Doña Ana County 8,211 28.9% El Paso County Luna County 263 0.9% El Paso County Otero County 550 1.9% El Paso County Mexico 3,740 13.2%
4 Meteorology To determine the predominant wind patterns in the area, NMED used data from 2013 to 2015 to create wind rose charts for each violating monitor in Doña Ana County. In addition, the NMED ran HYSPLIT 24-hour back trajectory models for the two violating monitors in Doña Ana County. Figures 10-1a to 10-24b in Appendix C depict wind data for each violating monitor on the dates with the 4 highest 8-hr ozone averages from 2013-2015. These are arranged by monitoring site and date and include wind roses, which show the frequency of wind direction, and HYSPLIT 24-hour back trajectories, which show the air parcels’ likely origins before reaching the monitoring sites. Each trajectory image includes a close-up inset created as a Flash Map from the same kmz file as the Google Earth view. The majority of wind roses show that winds were relatively calm (below 10 mph) and blew from the east to west, east-southeast to west-northwest, or south-southeast to north-northwest direction. Likewise, the back trajectories show that air parcels moved from these directions to the monitoring sites during the hours contributing to the elevated ozone concentrations. This indicates that winds passed through El Paso and Cd. Juárez before reaching the monitoring sites in New Mexico. Figure 10-25 in Appendix C shows HYSPLIT back trajectories arriving at the El Paso, TX violating monitor using the EPA designations mapping tool. The trajectories similarly show that air parcels primarily originate from Texas and Mexico. The EPA designations mapping tool may be found at www.epa.gov/ozone-designations/ozone-designations-guidance-and-data.

16 | New Mexico’s 2015 Ozone NAAQS Designation Recommendation Report
5 Geography/Topography The Paso del Norte region lies along the Rio Grande Valley, encompassing El Paso County, TX; Doña Ana County, NM; and Municipio de Ciudad Juárez, Chihuahua, MX. The Rio Grande flows south through Doña Ana County and the Mesilla Valley, serving as a common boundary for the City of Sunland Park, NM, the City of El Paso, TX and Ciudad Juárez, Chihuahua, MX. As the Rio Grande exits New Mexico, the river bends around a large igneous formation named Mount Cristo Rey. The river continues through the valley in a southeasterly direction between El Paso and Ciudad Juárez into the Brad Valley of Texas. The topography of the Paso del Norte region plays an important part in the transportation of air pollution and is used as a starting point to define the region’s air basin boundaries. Elevations in the Paso del Norte region range from 3,773 feet above mean sea level at the valley floor to 6,070 feet above mean sea level at Ranger Peak in the Franklin Mountains. The Franklin Mountains lie to the east/northeast of the Sunland Park area in Texas and the Sierra Juárez range lies to the south in Mexico. Both the Franklin and Sierra Juárez ranges help to define airflow patterns in the Sunland Park area through the creation of downward wind flows off the mountains into the valley areas. 6 Jurisdictional Boundaries The Paso del Norte region is a unique bi-national, tristate community with shared air pollution problems. The Paso del Norte Air Basin is defined as El Paso County, TX, portions of Doña Ana County, NM and Cd. Juárez, Chihuahua. Within the state of New Mexico, NMED has jurisdictional authority to implement and enforce state and federal air quality regulations with the exception of Bernalillo County in central New Mexico and tribal lands. No tribal lands exist within Doña Ana County. Transportation planning and programing for the southern portion of Doña Ana County falls under the jurisdiction of the El Paso Metropolitan Planning Organization (MPO). The planning boundary for the MPO covers much of the Paso del Norte airshed in the U.S. For past and present nonattainment areas in the southern portion of Doña Ana County, the El Paso MPO conducts transportation conformity planning. 7 Recommended Nonattainment Area Boundary The Sunland Park Area was previously designated nonattainment for the 1-hour ozone NAAQS in 1995. At that time, the state of New Mexico maintained that the predominant sources contributing to the ozone exceedances at the violating monitors were not within Doña Ana County or NMED’s jurisdiction. Presently, the information provided above also supports this assertion. Although designations for nonattainment areas are presumptively based on the CBSA or MSA, basing the boundary on the Las Cruces MSA would result in limited emissions reductions outside of the Sunland Park Area. NMED recommends a nonattainment area shown in Figure 7-1 and described as follows:

17 | New Mexico’s 2015 Ozone NAAQS Designation Recommendation Report
1. Bounded on the north by latitude N31°49’30” (red line); 2. Bounded on the south by the international border between New Mexico and Mexico
(yellow line); 3. Bounded on the east by the New Mexico and Texas state line (gray line); and 4. Bounded on the west by longitude W106°42’ (red line).
Figure 7-1: Recommended nonattainment boundary for the Sunland Park Area.
Doña Ana County as a whole accounts for 24% of total NOx emissions (Figure 3-3) and 16% of total VOC emissions (Figure 3-7) in the region. Point sources within Doña Ana County contribute even less, accounting for 8% of NOx emissions (Figure 3-4) and 1% of VOC emissions (Figure 3-8) in the region. The largest and only major source for NOx in Doña Ana County, the Rio Grande Generating Station, accounts for 84% of point source NOx emissions and 80% of point source VOC emissions in the county. This facility is located in the Sunland Park Area and is included within the recommended nonattainment area. The violating monitors (Desert View and Santa Teresa) are located in the southern most portion of the county near El Paso and Cd. Juárez. These monitors are approximately 35 miles south of the Solano monitoring site in Las Cruces, the second largest metropolitan area in New Mexico. As Figure 2-3 shows, the design values for the violating monitors are 0.004 ppm and 0.006 ppm higher than the Solano and La Union monitoring sites, respectively. The design value for the nearest site to the violating monitors, La Union, has not exceeded 0.070 ppm since 2005. The design value for the Solano site has never exceeded 0.067 ppm (2006). In contrast, the 2013-

18 | New Mexico’s 2015 Ozone NAAQS Designation Recommendation Report
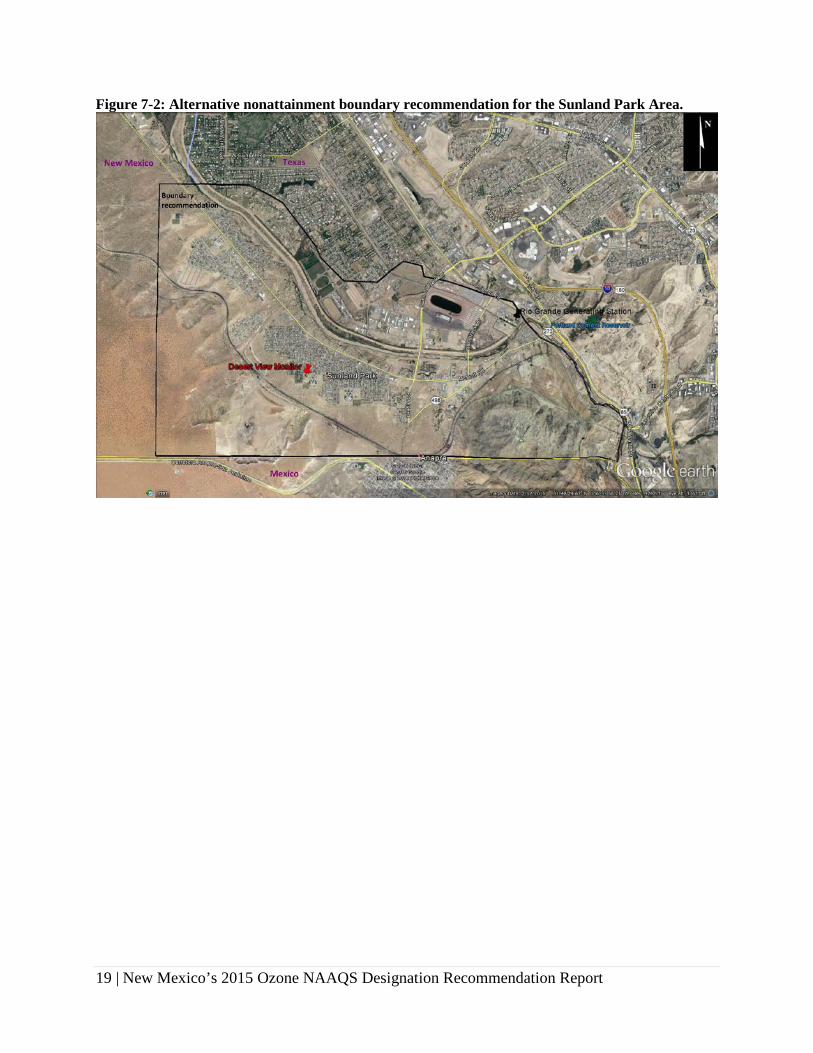
2015 design value for El Paso is 0.071 ppm, slightly lower than the violating monitors in the Sunland Park Area. This indicates that ozone concentrations at the violating monitors are more indicative of the level monitored in El Paso than the La Union, Chaparral and Solano monitoring sites. Based on the topography, prevailing winds, and close proximity to two major urban areas, it is evident that the violating monitors in the Sunland Park Area are not the result of emissions from New Mexico sources outside of the recommended nonattainment area. 7.1 Alternative Boundary Recommendation The Guidance Memo indicates that EPA will use data from 2014 to 2016 when determining final nonattainment boundaries. Preliminary data collected through August 2016 indicates that the Santa Teresa monitor will be in attainment of the standard. Although NMED will need to quality assure and validate this data before it can be used for a regulatory determination, the department would like to offer an alternative boundary recommendation for consideration should the current trend hold and the Santa Teresa monitor meets the standard. The alternative boundary recommendation would still include the majority of the population and emission sources in the Sunland Park Area while excluding uninhabited and largely undeveloped desert land. NMED recommends an alternative nonattainment area shown in Figure 7-2 and described as follows:
1. Bounded on the north by latitude N31°49’30” (red line); 2. Bounded on the south by the international border between New Mexico and Mexico
(yellow line); 3. Bounded on the east by the New Mexico and Texas state line (gray line); and 4. Bounded on the west by longitude W106°36’36” (red line).
19 | New Mexico’s 2015 Ozone NAAQS Designation Recommendation Report
Figure 7-2: Alternative nonattainment boundary recommendation for the Sunland Park Area.

20 | New Mexico’s 2015 Ozone NAAQS Designation Recommendation Report
8 Appendix A: Ozone Monitoring Data
County Site Name AQS ID # 4th Max ozone 8-hr average (ppm) Design Value (2013-2015) 2013 2014 2015
Doña Ana
La Union 35-013-0008 .064 .065 .070 .066 Chaparral 35-013-0020 .070 .067 .065 .067
Desert View 35-013-0021 .071 .072 .074 .072 Santa Teresa 35-013-0022 .080 .066 .070 .072
Solano 35-013-0023 .064 .066 .066 .065 Eddy Carlsbad 35-015-1005 .069 .072 .067 .069 Lea Hobbs 35-025-0008 .068 .068 .067 .067
Rio Arriba Coyote Ranger District 35-039-0026 .066 .065 .064 .065
Sandoval Bernalillo 35-043-1001 .067 .062 .066 .065
San Juan Bloomfield 35-045-0009 .069 .062 .061 .064
Navajo Lake 35-045-0018 .070 .063 .068 .067 Substation 35-045-1005 .065 .063 .061 .063
Santa Fe Santa Fe Airport 35-049-0021 .068 .064 .062 .064
Valencia Los Lunas 35-061-0008 .072 .064 .064 .066 (Bold – exceeds 2015 NAAQS)

21 | New Mexico’s 2015 Ozone NAAQS Designation Recommendation Report
9 Appendix B: Sunland Park Area Traffic Flow Maps The highlighted road segments in the maps below were used to estimate annual VMT.

22 | New Mexico’s 2015 Ozone NAAQS Designation Recommendation Report

23 | New Mexico’s 2015 Ozone NAAQS Designation Recommendation Report

24 | New Mexico’s 2015 Ozone NAAQS Designation Recommendation Report
10 Appendix C: Meteorological Data Wind roses were created by NMED using each NMED station’s meteorological data, at http://drdasnm1.alink.com/. HYSPLIT1 24-hour back trajectories were created by NMED on June 24, 2016 as follows:
• Model2 found at http://ready.arl.noaa.gov/hypub-bin/trajtype.pl?runtype=archive, modified January 5, 2016;
• Meteorological data: NAM 12 km (archive); GDAS 0.5 degree (archive) for 8/16/2013 only (NAM 12 data not available for this date);
• Desert View latitude: 31.79611, longitude: -106.58389; • Santa Teresa latitude: 31.78778, longitude: -106.68278; • Times are listed as UTC, which corresponds to Mountain Daylight Time (MDT) + 6 hrs.; • Contributing hours include the 8 hours from which the 8-hr average is calculated; • 2400 or 2500 hrs. UTC corresponds to 0000 hrs. and 0100 hrs., respectively, of the
following day.
1 Stein, A.F., Draxler, R.R, Rolph, G.D., Stunder, B.J.B., Cohen, M.D., and Ngan, F., (2015). NOAA's HYSPLIT atmospheric transport and dispersion modeling system, Bull. Amer. Meteor. Soc., 96, 2059-2077. 2 Rolph, G.D. (2016). Real-time Environmental Applications and Display sYstem (READY) Website (http://www.ready.noaa.gov). NOAA Air Resources Laboratory, College Park, MD.

25 | New Mexico’s 2015 Ozone NAAQS Designation Recommendation Report
10.1 Desert View Figure 10-1a: Desert View, April 28, 2013 (8-hr average maximum .071 ppm)
Figure 10-1b: Desert View, April 28, 2013 HYSPLIT Back trajectories.
Approximately 66% of the winds on this date blew from the direction of El Paso and Juárez.

26 | New Mexico’s 2015 Ozone NAAQS Designation Recommendation Report
Figure 10-2a: Desert View, July 3, 2013 (8-hr average maximum .076 ppm)
Figure 10-2b: Desert View, July 3, 2013 HYSPLIT Back trajectories.
Approximately 61% of the winds on this date blew from the direction of El Paso and Juárez.
27 | New Mexico’s 2015 Ozone NAAQS Designation Recommendation Report
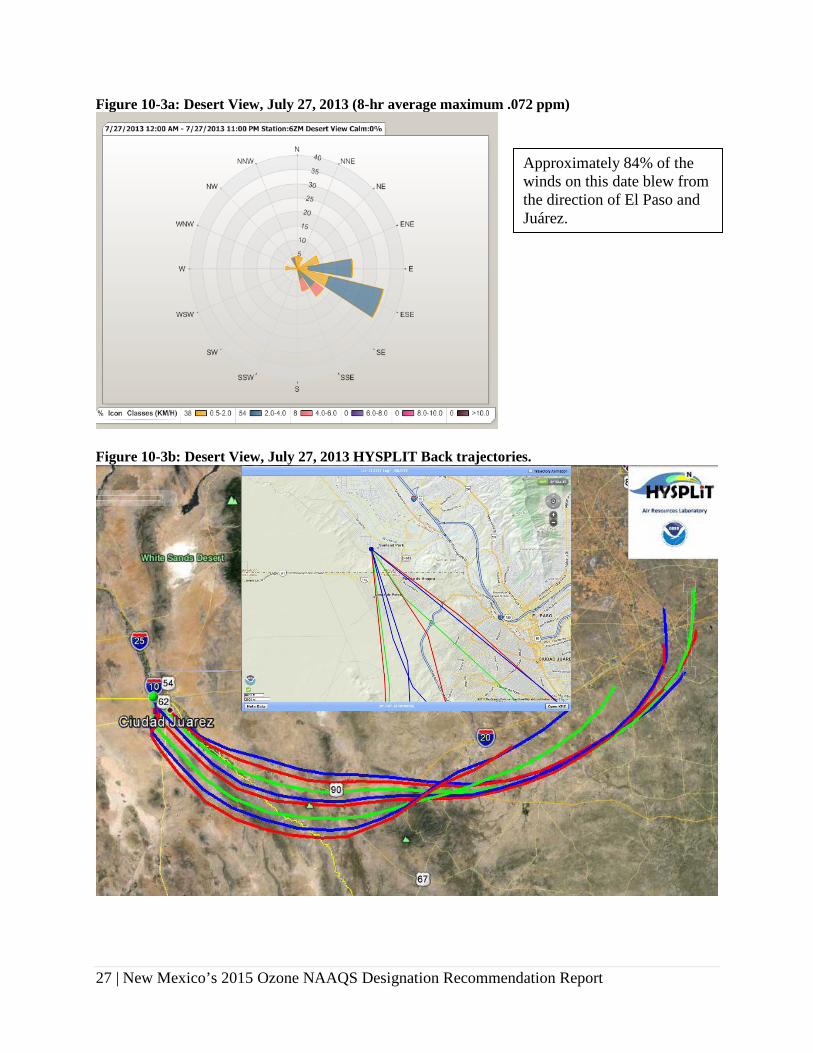
Figure 10-3a: Desert View, July 27, 2013 (8-hr average maximum .072 ppm)
Figure 10-3b: Desert View, July 27, 2013 HYSPLIT Back trajectories.
Approximately 84% of the winds on this date blew from the direction of El Paso and Juárez.
28 | New Mexico’s 2015 Ozone NAAQS Designation Recommendation Report
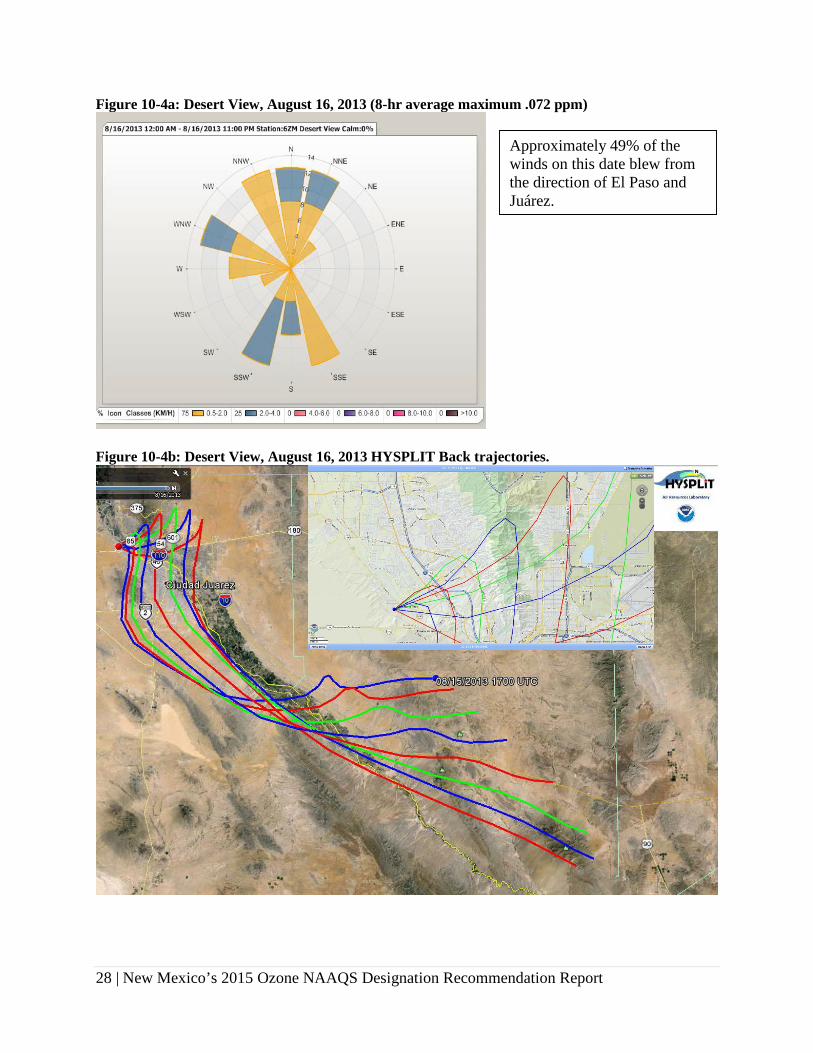
Figure 10-4a: Desert View, August 16, 2013 (8-hr average maximum .072 ppm)
Figure 10-4b: Desert View, August 16, 2013 HYSPLIT Back trajectories.
Approximately 49% of the winds on this date blew from the direction of El Paso and Juárez.

29 | New Mexico’s 2015 Ozone NAAQS Designation Recommendation Report
Figure 10-5a: Desert View, May 28, 2014 (8-hr average maximum .072 ppm)
Figure 10-5b: Desert View, May 28, 2014 HYSPLIT Back trajectories.
100% of the winds on this date blew from the direction of El Paso and Juárez.

30 | New Mexico’s 2015 Ozone NAAQS Designation Recommendation Report
Figure 10-6a: Desert View, May 29, 2014 (8-hr average maximum .072 ppm)
Figure 10-6b: Desert View, May 29, 2014 HYSPLIT Back trajectories.
Approximately 83% of the winds on this date blew from the direction of El Paso and Juárez.

31 | New Mexico’s 2015 Ozone NAAQS Designation Recommendation Report
Figure 10-7a: Desert View, June 10, 2014 (8-hr average maximum .076 ppm)
Figure 10-7b: Desert View, June 10, 2014 HYSPLIT Back trajectories.
Approximately 79% of the winds on this date blew from the direction of El Paso and Juárez.

32 | New Mexico’s 2015 Ozone NAAQS Designation Recommendation Report
Figure 10-8a: Desert View, July 15, 2014 (8-hr average maximum .072 ppm)
Figure 10-8b: Desert View, July 15, 2014 HYSPLIT Back trajectories.
Approximately 70% of the winds on this date blew from the direction of El Paso and Juárez.

33 | New Mexico’s 2015 Ozone NAAQS Designation Recommendation Report
Figure 10-9a: Desert View, June 17, 2015 (8-hr average maximum .077 ppm)
Figure 10-9b: Desert View, June 17, 2015 HYSPLIT Back trajectories.
Approximately 80% of the winds on this date blew from the direction of El Paso and Juárez.
34 | New Mexico’s 2015 Ozone NAAQS Designation Recommendation Report
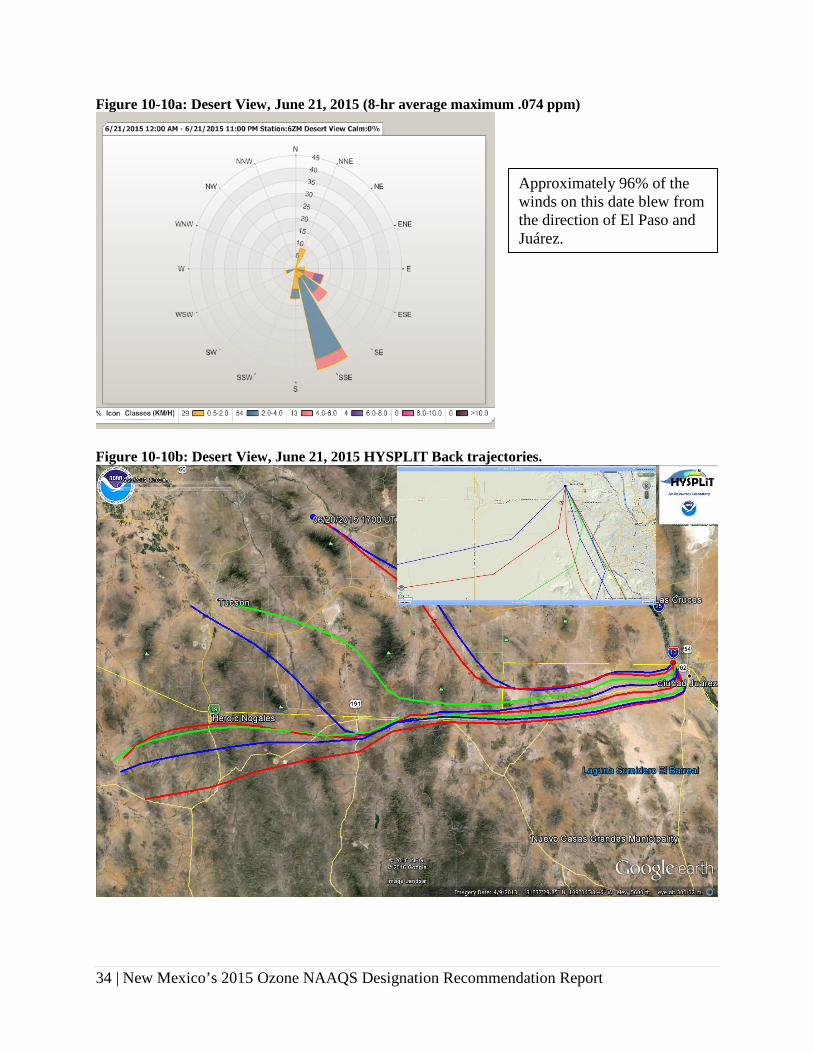
Figure 10-10a: Desert View, June 21, 2015 (8-hr average maximum .074 ppm)
Figure 10-10b: Desert View, June 21, 2015 HYSPLIT Back trajectories.
Approximately 96% of the winds on this date blew from the direction of El Paso and Juárez.

35 | New Mexico’s 2015 Ozone NAAQS Designation Recommendation Report
Figure 10-11a: Desert View, June 29, 2015 (8-hr average maximum .076 ppm)
Figure 10-11b: Desert View, June 29, 2015 HYSPLIT Back trajectories.
Approximately 96% of the winds on this date blew from the direction of El Paso and Juárez.

36 | New Mexico’s 2015 Ozone NAAQS Designation Recommendation Report
Figure 10-12a: Desert View, August 10, 2015 (8-hr average maximum .077 ppm)
Figure 10-12b: Desert View, August 10, 2015 HYSPLIT Back trajectories.
Approximately 74% of the winds on this date blew from the direction of El Paso and Juárez.

37 | New Mexico’s 2015 Ozone NAAQS Designation Recommendation Report
10.2 Santa Teresa Figure 10-13a: Santa Teresa, July 3, 2013 (8-hr average maximum .084 ppm)
Figure 10-13b: Santa Teresa, July 3, 2013 HYSPLIT Back trajectories.
Approximately 74% of the winds on this date blew from the direction of El Paso and Juárez.

38 | New Mexico’s 2015 Ozone NAAQS Designation Recommendation Report
Figure 10-14a: Santa Teresa, July 7, 2013 (8-hr average maximum 0.080 ppm)
Figure 10-14b: Santa Teresa, July 7, 2013 HYSPLIT Back trajectories.
Approximately 77% of the winds on this date blew from the direction of El Paso and Juárez.

39 | New Mexico’s 2015 Ozone NAAQS Designation Recommendation Report
Figure 10-15a: Santa Teresa, July 25, 2013 (8-hr average maximum .081 ppm)
Figure 10-15b: Santa Teresa, July 25, 2013 HYSPLIT Back trajectories.
Approximately 57% of the winds on this date blew from the direction of El Paso and Juárez.

40 | New Mexico’s 2015 Ozone NAAQS Designation Recommendation Report
Figure 10-16a: Santa Teresa, July 27, 2013 (8-hr average maximum .089 ppm)
Figure 10-16b: Santa Teresa, July 27, 2013 HYSPLIT Back trajectories.
Approximately 76% of the winds on this date blew from the direction of El Paso and Juárez.
41 | New Mexico’s 2015 Ozone NAAQS Designation Recommendation Report
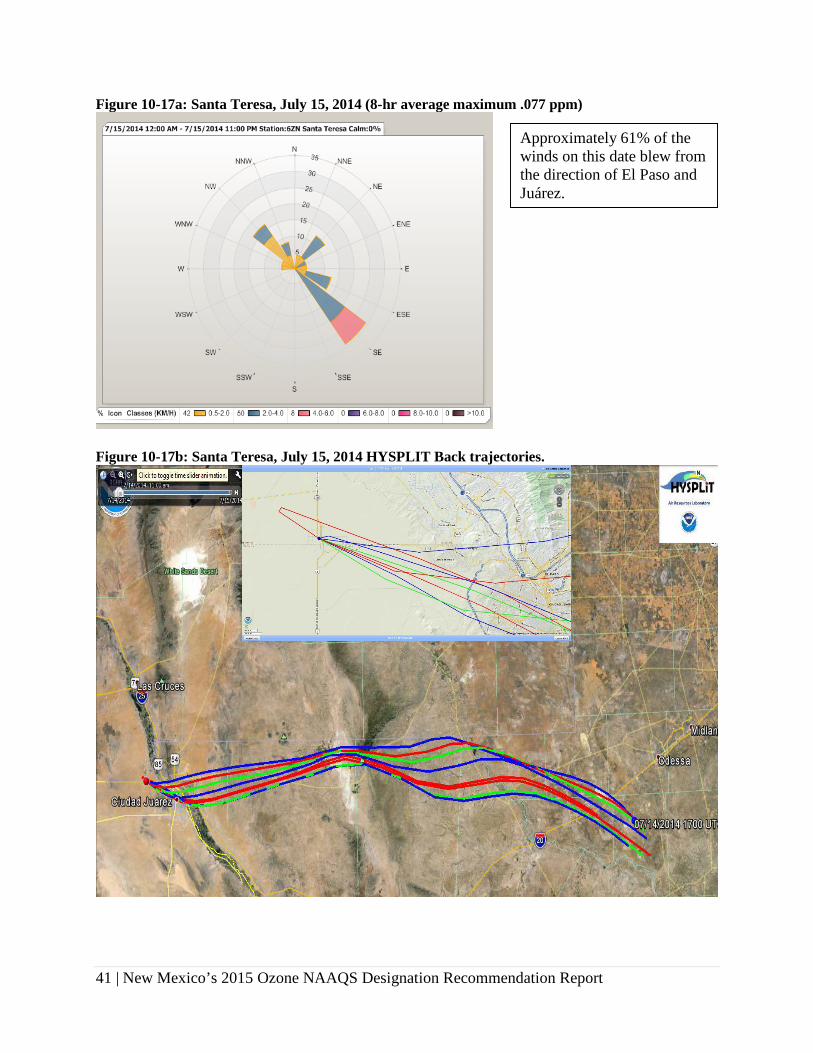
Figure 10-17a: Santa Teresa, July 15, 2014 (8-hr average maximum .077 ppm)
Figure 10-17b: Santa Teresa, July 15, 2014 HYSPLIT Back trajectories.
Approximately 61% of the winds on this date blew from the direction of El Paso and Juárez.

42 | New Mexico’s 2015 Ozone NAAQS Designation Recommendation Report
Figure 10-18a: Santa Teresa, July 25, 2014 (8-hr average maximum .064 ppm)
Figure 10-18b: Santa Teresa, July 25, 2014 HYSPLIT Back trajectories.
Approximately 96% of the winds on this date blew from the direction of El Paso and Juárez.

43 | New Mexico’s 2015 Ozone NAAQS Designation Recommendation Report
Figure 10-19a: Santa Teresa, July 31, 2014 (8-hr average maximum .068 ppm)
Figure 10-19b: Santa Teresa, July 31, 2014 HYSPLIT Back trajectories.
Approximately 72% of the winds on this date blew from the direction of El Paso and Juárez.

44 | New Mexico’s 2015 Ozone NAAQS Designation Recommendation Report
Figure 10-20a: Santa Teresa, August 18, 2014 (8-hr average maximum .069 ppm)
Figure 10-20b: Santa Teresa, August 18, 2014 HYSPLIT Back trajectories.
Approximately 92% of the winds on this date blew from the direction of El Paso and Juárez.

45 | New Mexico’s 2015 Ozone NAAQS Designation Recommendation Report
Figure 10-21a: Santa Teresa, April 29, 2015 (8-hr average maximum .070 ppm)
Figure 10-21b: Santa Teresa, April 29, 2015 HYSPLIT Back trajectories.
Approximately 77% of the winds on this date blew from the direction of El Paso and Juárez.

46 | New Mexico’s 2015 Ozone NAAQS Designation Recommendation Report
Figure 10-22a: Santa Teresa, June 17, 2015 (8-hr average maximum .070 ppm)
Figure 10-22b: Santa Teresa, June 17, 2015 HYSPLIT Back trajectories.
Approximately 66% of the winds on this date blew from the direction of El Paso and Juárez.

47 | New Mexico’s 2015 Ozone NAAQS Designation Recommendation Report
Figure 10-23a: Santa Teresa, June 29, 2015 (8-hr average maximum .074 ppm)
Figure 10-23b: Santa Teresa, June 29, 2015 HYSPLIT Back trajectories.
Approximately 84% of the winds on this date blew from the direction of El Paso and Juárez.

48 | New Mexico’s 2015 Ozone NAAQS Designation Recommendation Report
Figure 10-24a: Santa Teresa, August 10, 2015 (8-hr average maximum .072 ppm)
Figure 10-24b: Santa Teresa, August 10, 2015 HYSPLIT Back trajectories.
Approximately 70% of the winds on this date blew from the direction of El Paso and Juárez.

49 | New Mexico’s 2015 Ozone NAAQS Designation Recommendation Report
Figure 10-25: Ozone Mapping Tool, HYSPLIT back trajectories for El Paso, TX