Embed Size (px)
Citation preview
2015 Rehabilitation of Interstate 394
(Bryn Mawr Neighborhood MN)
NGCS Research Pays Off
Bernard Igbafen Izevbekhai, P.E. PhD
Research Operations Engineer
MnDOT Office of Materials & Road Research
Research Pays Off Colloquial Series

8000 BC Worlds First Major Town-
Jericho
5000 BC Wheel Invented
4000 BC Mesopotamia
800 BC Iron Tires Introduced
44 BC First Noise Regulation
1869 London Report
ARCHAIC PAVEMENT NOISE CHRONOLOGY

Oldest Paving: UR 4000BC
ROMAN WAGON 100BC
PAVEMENTS WERE DESIGNED TO CARRY TRAFFIC LOADS
Egyptian Segway 1900 BC (Chariot)
US INTERSTATE EDICT 1955 AD

PAVEMENT STRUCTURE VS FUNCTION
• Ride,
• Safety
• Low noise
• Drainability
• Dynamic Stability
• Static Stability
• Global (Overall Stability)
Functional Requirements Tend to Trigger Rehab and Replacement
Structural
Requirements Functional
Requirements

In 170 BC the earliest paved streets were built in Rome. Passable in all weather, but the
disadvantage of increasing traffic noise……
The first documented noise regulation in the world
“no wheeled vehicle whatsoever will be allowed within the precincts of the city, from sunrise until the hour before dusk..."
---Emperor Julius Caeser 44 BC
TRAFFIC NOISE: THE BANE OF CIVILIZATION

In 1996 After construction of a concrete pavement…A legislative document Mandated a Non-Concrete
surfacing…
A documented noise regulation in Minnesota
“1996 Legislative Doc.."
---Legislative Reference :
TRAFFIC NOISE: THE BANE OF CIVILIZATION
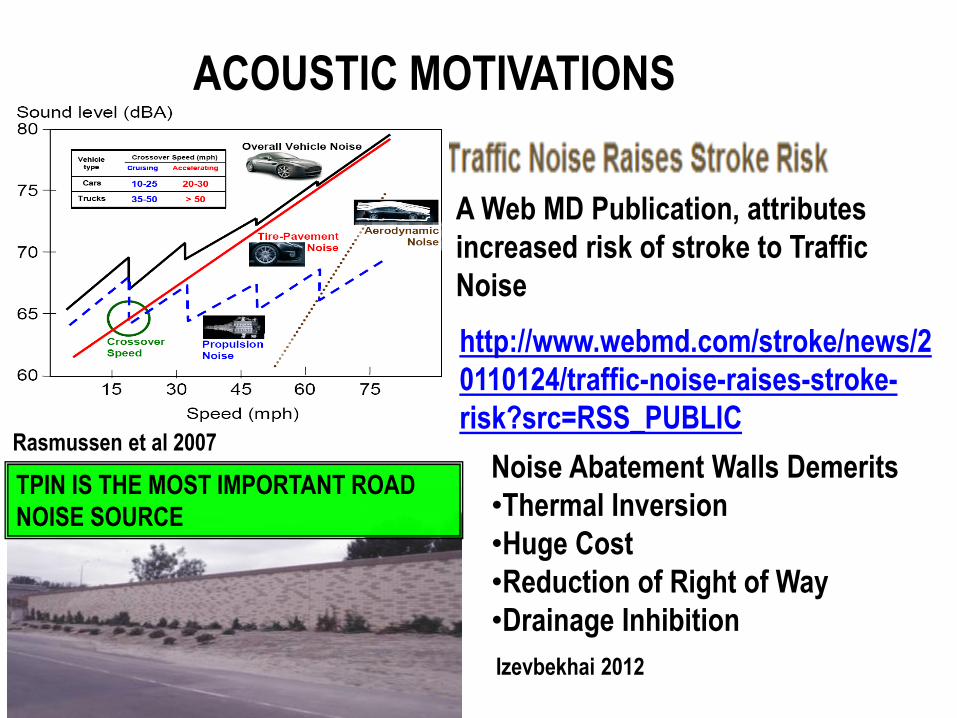
ACOUSTIC MOTIVATIONS
Noise Abatement Walls Demerits
•Thermal Inversion
•Huge Cost
•Reduction of Right of Way
•Drainage Inhibition
TPIN IS THE MOST IMPORTANT ROAD
NOISE SOURCE
Rasmussen et al 2007
A Web MD Publication, attributes
increased risk of stroke to Traffic
Noise
http://www.webmd.com/stroke/news/2
0110124/traffic-noise-raises-stroke-
risk?src=RSS_PUBLIC
Izevbekhai 2012

BRIEF INTERSTATE 394 TIMELINE • Original construction of Interstate highway 394 was performed in the
1987 SP 2789-48 construction project. SP2789 -18 1990 HOV.
• Transverse tining is associated with noisy tone from tire pavement resonance.
• Subsequently overlaid with an asphalt pavement that lasted for 10 years. In 1996 for noise reduction, the section received a 2 inch bituminous overlay.
• Sequel to this a 1 ¾ inch mill and a 5/8 inch overlay with an ultrathin bonded wearing course was performed in 2004.
• Prior to 2015 a concrete rehabilitation project was designed for this section and discussions were held over the acoustic implication of removing the bonded wearing course and replacing it with a concrete surface.
• 2015 Rehab and NGCS Grinding SP 2789-136

A STRONG CASE FOR REHAB

True Condition of Underlying Concrete
REPAIRS ON I-394
20% Partial Depth Repairs
80% Full Depth Repairs
Found Necessary
Anticipated
80% Partial Depth Repairs 20% Full Depth Repairs
Removal of UTBWC

REMOVAL OF UTBWB

TYPICAL AFTER UTBWC REMOVAL

FULL DEPTH REPAIRS ON I-394

FULL DEPTH REPAIRS

Concept To Deployment
NGCS TIMELINE

1
LAB
CONCEPTUALIZATION
(2005-2007)
o Purdue Lab Wheel
MNROAD FIELD
DEMONSTRATION
(2007-2010
oConventional Grind
oInnovative Grind
oUltimate grind
o2010 Ultimate Grind
NGCS TIMELINE

PROOF OF CONCEPT
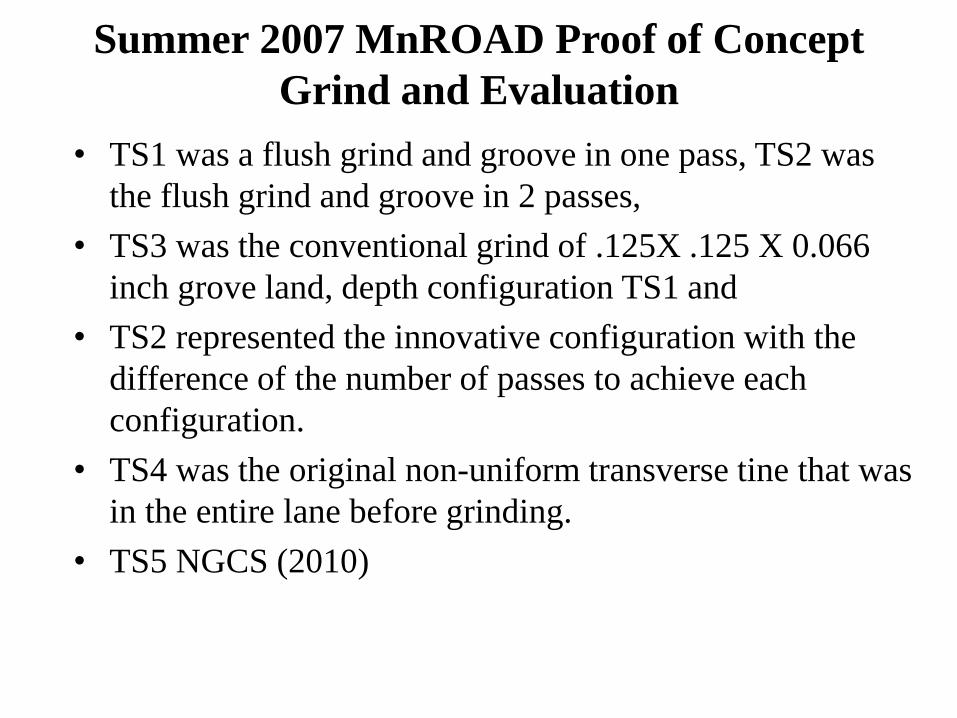
Summer 2007 MnROAD Proof of Concept
Grind and Evaluation
• TS1 was a flush grind and groove in one pass, TS2 was
the flush grind and groove in 2 passes,
• TS3 was the conventional grind of .125X .125 X 0.066
inch grove land, depth configuration TS1 and
• TS2 represented the innovative configuration with the
difference of the number of passes to achieve each
configuration.
• TS4 was the original non-uniform transverse tine that was
in the entire lane before grinding.
• TS5 NGCS (2010)

Cell 9 2008
Innovation
Cell 71 DL NGCS:
Corrugations on
landing 1/32 “
deep and 1/8”
Centers
Cell 9 Trans Tining
(Before Grinding)
Cell 7 2007 Innovation Cell 8 Conventional
Inch mm Inch mm Inch mm Inch Mm Inch mm
Mean Land Width 0.68 14 0.5 12.7 Transverse tine
0.5 to 1inch
(12.7-2.4mm)
variable
interval 1/8 inch
(3.108 mm) deep
0.50 12.7 0.125 3.18
Mean Groove Width 0.31 7.85 0.120 3.048 0.120 3.048 0.125 3.18
Mean Groove Depth 0.18 4.57 0.125 3.175 0.125 3.175 0.125 3.18
Mean Texture E-965 0.06 1.62 0.035
0.9
0.039 1.000 0.035
0.9
0.047
1.2
Mean Texture E-2157 0.06 1.45 0.035
0.88
0.035 0.900 0.035
0.88
0.047
1.2
OBSI (dBA) 101.0 98.7 103.0 98.7 102.7
Ribbed Friction E-274 53 47 50 47 68
Smooth Tire Friction 50 49 30 49 48
SUMMARY OF CONFIGURATIONS AT MNROAD

2007 TRADITIONAL GRIND
2008 INNOVATIVE GRIND
2007 INNOVATIVE GRIND
DIAMOND GRIND IMPROVEMENTS

DEPLOYMENT TH 94 MP 185 NEAR MONTICELLO

WESTWARD VIEW BEFORE FULL DEPTH REPAIR
Note Transition Point
UTBWC Transverse Tined

DIAMOND GRINDING BLADE STACKING

• Grinding Stages 1 Flush Grind • Grinding Stage 2 Conventional Grind • Grinding Stage 3: NGCS
GRINDING STAGES: REVERSED STAGING

UTBWC
FLUSH CONV
PROGRESSION: REMOVAL TO REPAIRS TO GRINDING
NGCS
TRANSVERSE TINE

MEASUREMENT AND ANALYSIS
OF OBSI BEFORE & AFTER
GRINDING
Theory without practice is empty, practice without theory is blind”
--- German Philosopher Immanuel Kant (1724-1804)
“Theory without practice is for geniuses, practice without theory is for fools and villains, but for most educators (Researchers) [there] is the profound, indissoluble union of both.” --- Dutch Pedagogue J.H. Gunning (1859-1951)

OBSI TESTING
• Pre Grind April 18: 6-9am
Window
• Post Grind Oct 25 6-9am Window
• 3 Loops Per Test
• 14 Contiguous Sections
• Calibration before Each Test
• Checked Coherence
AASHTO TP 76-11

TEMPERATURE CORRECTION
• Δ OBSI= 𝟐𝟎. 𝟏𝟔𝟒𝟐𝟗𝟑−𝐓𝒃
𝐓𝒃−
𝟐𝟗𝟑−𝐓𝒂
𝐓𝒂
(Equation 9)
• Pre-construction OBSI centered at 8 am temperature on April 18 (Tb)
• Post-construction OBSI centered at 7 am temperature on October 25 (Ta)
• Tb = 284.0 oK
• Ta = 276.9 oK
• Δ OBSI ≈ 0.7dB

If OBSI (1) - OBSI (2) = n where OBSI (1) and OBSI (2) respectively measured sound intensity before and after a pavement surface treatment and “n” is the difference in decibel (dB) then
10 log 𝑆𝐼2
𝑆𝐼0− 10 log
𝑆𝐼1
𝑆𝐼0= 𝑛 (Equation 5)
Where SI1 is the Post-Construction Noise level and SI2 is the Preconstruction noise level SI0 is the sound intensity at the threshold of human hearing, (10-12 Watts/m2) then
𝑆𝐼2
𝑆𝐼1= 10
𝑛
10 . (Equation 6)
Therefore the actual reduction in sound intensity (Watts/ m2)
Percentage reduction = 100 1 − 10−𝑛
10 .
Temp Correction ≅ 0.7 𝑑𝐵
INTERPRETATION OF OBSI DIFFERENCE

IMPLICATION OF OBSI DIFFERENCE

TIRE PAVEMENT NOISE RESULTS
PREVIOUS
→ UTBWC T. TINE
ALL
DATA
Mean 55.68 24.97 46.91
Standard Error 1.55 5.20 2.82
Median 56.80 23.25 53.23
Mode 63.70 48.70 63.69
Standard
Deviation 8.47 18.01 18.30
Kurtosis 0.55 -1.27 0.34
Skewness -0.87 0.39 -1.17
Range 35.90 50.90 67.52
Minimum 33.90 2.30 2.30
Maximum 69.80 53.20 69.80
Count 30.00 12.00 42.00
Largest 69.80 53.20 69.80
Smallest 33.90 2.30 2.30
0
0.005
0.01
0.015
0.02
0.025
0 50 100P
rob
abili
ty D
ensi
ty F
un
ctio
n
Percentage Reduction in Sound Intensity Due to Grinding

Core #2 a b c d 12.80 4.40 16.70 5.00 12.80 4.50 17.60 5.50 12.70 4.60 17.50 5.00 13.20 4.50 17.60 5.10 12.40 4.50 17.60 5.50
Mean 12.78 4.50 17.40 5.22
PROBABLE CAUSE
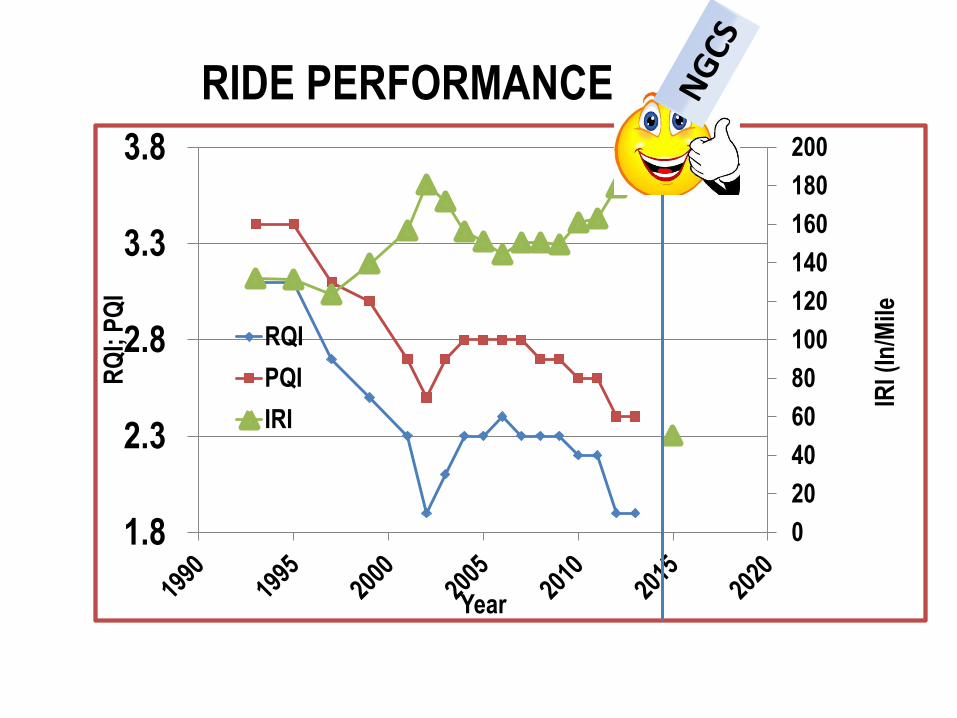
RIDE PERFORMANCE
0
20
40
60
80
100
120
140
160
180
200
1.8
2.3
2.8
3.3
3.8
IRI (
In/M
ile
RQ
I; P
QI
Year
RQI
PQI
IRI

JOINT, WARP N CURL EFFECTS REDUCED BY GRINDING
27 ft Panels Do not Show Up

CONCLUSION • NGCS at MnROAD 98 dB in the MnROAD test cells
(Izevbekhai & Wilde 2011).
• Significant Ride improvement
• I-394 NGCS OBSI (101 to 103 dBA) was not as quiet as typical NGCS.
• Grooves in the NGCS Depth >> 3 mm of typical NGCS design. Groove depths in some sections in this project were as high as 5 mm.
• Excessive Groove Depth but Still Much Quieter than UTBWC
• MnDOT’s Metro District Met Stated Goal
ACKNOWLEDGEMENTS
• This Research was Sponsored by a Huge
Federal Grant in the amount of ……..
• $0.00
• Chris Kufner, Glenn Engstrom and Dave Van
Deusen Approved My Time Sheet.
• Co-Authors: Eddie Johnson & Steve Olson
• Curtis Turgeon, Maria Masten & Gordon Bruhn
• Metro: Vanaki Nariman, Ron Rauchle, Peter Wasko
Chris Kufner, Tim Clyne , Jon Erickson

QUESTIONS
I THANK THEE
THE ENDLESS ROAD AKA RESEARCH