Embed Size (px)
Citation preview
American Intellectual Property Law Association241 18th Street South, Suite 700Arlington, Virginia 22202www.aipla.org
Prepared Under Direction ofLaw Practice Management Committee
2015 Report of the Economic Survey
Report of the Economic Survey
2015
Prepared Under Direction of the American Intellectual Property Law Association
Law Practice Management Committee
Richard W. Goldstein, Chair Donika P. Pentcheva, Vice Chair
June 2015
Prepared by:
910 Clopper Road, Suite 210N Gaithersburg, Maryland 20878 TEL: (240) 268-1262 [email protected]
Ashraf Abdul-Mohsen: ARI
Rhonda Bogart: Lee & Hayes
Meghan Donohoe: AIPLA
Jennifer Jedra: Myers Wolin
Megan Kirkegaard: ARI
Kevin Kirsch: Baker Hostetler
Douglas Nemec: Skadden, Arps,
Slate, Meagher & Flom LLP
John Shumaker: Lee & Hayes
©2015 AMERICAN INTELLECTUAL PROPERTY LAW ASSOCIATION
ALL RIGHTS RESERVED. NO PART OF THIS BOOK MAY BE REPRODUCED OR TRANSMITTED IN ANY FORM OR BY ANY MEANS, ELECTRONIC OR MECHANICAL, INCLUDING PHOTOCOPYING, RECORDING, OR BY AN INFORMATION STORAGE
AND RETRIEVAL SYSTEM, WITHOUT PERMISSION IN WRITING FROM THE PUBLISHER.
COPIES OF THIS REPORT ARE AVAILABLE FROM AIPLA AT A COST OF $45 PER COPY FOR MEMBERS AND $495 PER COPY FOR NON-MEMBERS.
AMERICAN INTELLECTUAL PROPERTY LAW ASSOCIATION 241 18TH STREET, SOUTH, SUITE 700
ARLINGTON VA 22202-3694 (703) 415-0780 WWW.AIPLA.ORG
AIPLA Law Practice Management 2015 Economic Survey Participants
We would like to thank those who helped put together and review this year’s AIPLA Economic Survey:
Richard Goldstein: Goldstein Patent Law – Chair of LPM Committee
Donika Pentcheva: Westman, Champlin & Koeher – Vice Chair of LPM Committee
David A. Divine: Lee & Hayes – Chair of Economic Survey Subcommittee
i
Table of Contents
INTRODUCTION ............................................................................................................................. 1 DATA COLLECTION ......................................................................................................................... 1 CHANGES TO THE SURVEY .............................................................................................................. 1 DESCRIPTION OF STATISTICS AND FORMATTING CONVENTIONS .................................................... 2 RESPONDENT BACKGROUND ......................................................................................................... 5 IP BUDGET FOR CORPORATE PRACTITIONERS ................................................................................ 7 INCOME RECEIVED IN 2014 AND PROJECTED FOR 2015, BILLING RATES, AND BILLABLE HOURS ............................................................................................................................ 9 SUMMARY OF SURVEY RESULTS BY PRACTICE TYPE ..................................................................... 13 SOLO PRACTITIONER ............................................................................................................................ 13 PRIVATE FIRM, PARTNER ....................................................................................................................... 16 PRIVATE FIRM, ASSOCIATE ..................................................................................................................... 19 PRIVATE FIRM, OF COUNSEL .................................................................................................................. 22 HEAD OF CORPORATE IP DEPARTMENT .................................................................................................... 25 CORPORATE IP DEPARTMENT, ATTORNEY ................................................................................................. 26 PRIVATE FIRM, PATENT AGENT ............................................................................................................... 27 CORPORATE IP DEPARTMENT, PATENT AGENT ........................................................................................... 28 TYPICAL CHARGES FOR IP LAW SERVICES ..................................................................................... 29 TYPICAL TYPE OF FEE FOR IP LAW SERVICE CHARGES ................................................................... 34 TYPICAL COSTS OF LITIGATION ..................................................................................................... 37
CHARACTERISTICS OF FIRMS ........................................................................................................ 50 NUMBER AND TYPE OF ATTORNEYS ......................................................................................................... 50 ASSOCIATE STARTING SALARY AND SUMMER MONTHLY PAY ........................................................................ 52 SUPPORT STAFF AND SERVICES ............................................................................................................... 54 BILLING RATES AND PRACTICES ............................................................................................................... 57 LIABILITY INSURANCE............................................................................................................................ 60 TRAINING AND MARKETING ................................................................................................................... 60 STATISTICAL TABLES ....................................................................................................... Appendix A INDIVIDUAL DATA .................................................................................................................. I-1 to I-177 FIRM DATA ........................................................................................................................... F-1 to F-34 SURVEY INSTRUMENTS .................................................................................................. Appendix B
AIPLA Report of the Economic Survey 2015
1
INTRODUCTION The AIPLA Economic Survey, developed and directed by the Law Practice Management Committee of the American Intellectual Property Law Association (AIPLA), reports the annual incomes and related professional and demographic characteristics of intellectual property (IP) law attorneys and associated patent agents. Conducted every other year by AIPLA, this survey also examines the economic aspects of intellectual property law practice, including individual billing rates and typical charges for representative IP law services. All AIPLA members were invited to participate. The Law Practice Management Committee took an active role in reviewing the Economic Survey with a goal of improving the usefulness and value of the data that are collected and analyzed. DATA COLLECTION An e-mail invitation to participate in the 2015 AIPLA Economic Survey was sent to a list of 8,860 AIPLA members; accounting for bounces and requests to be removed from the database, the actual sample surveyed was 8,485. The e-mail included an individualized direct link to the Web-based questionnaire along with an attached letter requesting additional participation in the Firm portion of the Economic Survey. The initial e-mail was followed up by several e-mail reminders. This year, additional efforts were made to collect the Firm Survey data. Contact information was collected directly from the Individual Survey respondents that was then used for distributing Firm Survey links directly to the appropriate people identified at each firm by the Individual Survey respondents. A total of 1,366 individuals responded by completing some or all of the Individual questionnaire, yielding a 16.1% response rate, slightly higher than 2013. This is the fifth time the survey has been conducted online. The additional efforts to gather data for the Firm portion of the survey garnered 223 responses—only slightly lower than in 2013, when 244 firm representatives completed the firm questionnaire. All data submitted by respondents were reviewed and evaluated for reasonableness and consistency; data anomalies and outliers were analyzed and corrected or deleted. In many cases, respondents did not answer every question, so the total counts for each table may vary. CHANGES TO THE SURVEY A number of enhancements were made to the 2015 Individual Survey instrument. The committee worked to streamline the survey while still including new questions that explored important new areas of interest to the profession. The following demographic type questions were removed from the Individual Survey this year: percent of time devoted to IP practice, change in employment, and change in the current employer status. Also removed were questions about employer contribution to all pension and capital accumulation plans, as well as gross income from the practice of law that was not included in the [previous] gross income question. The question about the percentage of time devoted to various types of work was revised which also allowed the question about time spent training new associates to be removed. In Part II, a follow-up question was added regarding the reasons for increases/decreases to the corporate budget. Also in this section, the question for the allocation of the annual corporate IP budget was revised to include more detail. In Part III (Private Practitioners), the percent of billable hours actually billed to clients was removed, and the question about business development was revised.
AIPLA Report of the Economic Survey 2015
2
In Part IV (Typical Charges), there was a slight change in the headings to the prosecution and client counseling questions that clarified that the data collected were charges in 2014. There were questions added to the litigation and related matters to collect mediation data, (the cost of the action up through mediation) for each of the at risk categories. Additional questions were added after the various litigation at risk questions, which required individuals to indicate if there was a strong correlation between the amount at risk and the overall attorney hours required to litigate the action. Individual respondents were also asked to report how the total cost of asserting various actions compared to the total cost of defending the actions. Two-Party Interference and Inter Partes Reexamination were removed, and data requests for Inter Partes Proceedings was added. Two questions at the end of the Individual Survey were added regarding arbitration. One compared the cost of resolving a dispute through arbitration to resolving a comparable dispute through litigation, and the other asked for the percentage of frequency that various means were initiated for mediation/arbitration. Finally, the business development section was swapped out from the 2015 Firm Survey instrument, and two new sections on training and marketing were added. The question about minor offices was removed this year as well from the Firm Survey instrument. The questions about the report format (paper vs. electronic) were removed this year from both surveys, however, new write-in questions were added that asked respondents to explain which data have been most useful, and what else could be added to future surveys. In the data tables in the report, a minimum of three responses was required to show composite values. The term “ISD” is used in the tables to show insufficient data. Similar to 2013, table rows with one or two respondents have been omitted to protect the anonymity of respondents and tables with no valid rows have likewise been omitted. Also, tables with less than 20 respondents overall were not shown in order to maintain statistical reliability of the data, however, the Corporate IP, Agent had only 15 respondents overall, so exceptions were made in this case. Additionally, for applicable tables, the 10th and 90th percentiles were added. These data could only be shown if there were 10 or more respondents. DESCRIPTION OF STATISTICS AND FORMATTING CONVENTIONS Quartiles: Quartiles are used to show distributions of real numbers, responses are described by three quartiles: the first quartile, the median, and the third quartile. Quartiles identify interpolated locations on a distribution of values and do not necessarily represent actual reported values. Another label for quartiles is percentiles; the first quartile is the same as the 25th percentile, the median is the 50th percentile, and the third quartile is the 75th percentile. For example, when all reported values are listed from highest to lowest, the third quartile identifies the point on the list that is equal to or greater than 75 percent (three quarters) of the reported values and equal to or less than 25 percent (one quarter). 10th Percentile: Also used to show distributions of real numbers, ninety percent of respondents reported this amount or more. 90th Percentile: Ten percent reported this amount or more. If there are fewer than 10 values, the 90th percentile cannot be calculated. Median (midpoint): The median identifies the point in the distribution of reported values that is equal to or larger than one-half of reported values and equal to or smaller than one-half—that is, the mid-point. A median is reported when three or more values were reported by respondents. The first and third quartiles are reported when five or more fee values were reported by respondents. Quartiles and medians based on values reported by survey respondents are estimates of the quartiles and medians that could be determined if the
AIPLA Report of the Economic Survey 2015
3
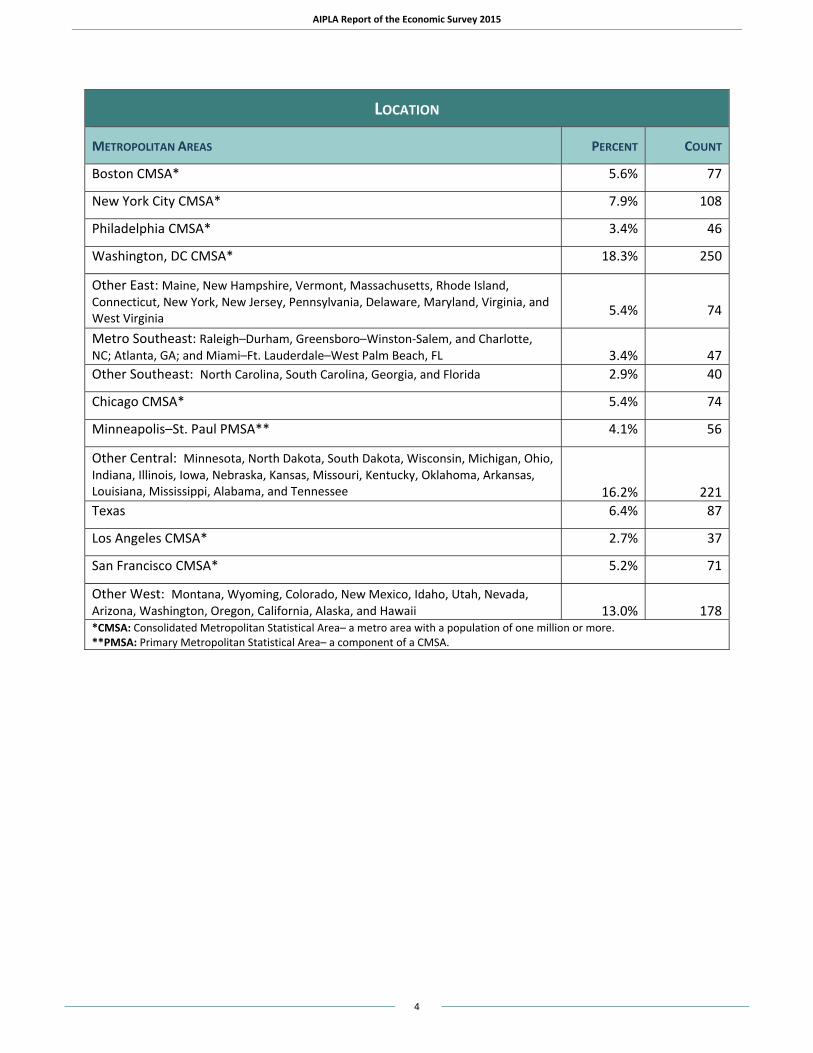
characteristics of the entire population represented by survey respondents were known. In general, the more values that are reported, the more accurately quartiles estimate the distribution of values among all AIPLA members. Mean (average): The sum of all values divided by the number of values. It should be noted that if the mean exceeds the median, it is because high values affect the calculations. It is also possible, especially with a small number of values, for the mean to exceed the third quartile. Percentages in some tables and some graphs may not sum to exactly 100% due to rounding. Other definitions useful in understanding tabular information presented in this report are: Income: Defined as “total gross income in calendar year 2014 from your primary practice…including any partnership income, cash bonus, share of profits, and similar income you received, and any deferred compensation in which you vested in 2014.” Typical Charges: Respondents were instructed to respond “only if you have been personally responsible for a representative sample of the type of work to which the question pertains, either as a service provider (an attorney in private practice) or as a purchaser of such services (corporate counsel).” In thinking of a typical charge, respondents were directed to assume “a typical case with no unusual complications,” and asked “what did you charge (or would have charged) or what were you charged (or would have expected to be charged), in 2014, for legal services only (including search fees, but not including copy costs, drawing fees or government fees) in each of the following types of US matters?” Respondents were also asked to indicate the type of fee primarily used in 2014 (i.e., fixed fee, hourly, other). Estimated Litigation Costs: Respondents were instructed to respond to these questions “only if you have personal knowledge either as a service provider (attorney in private practice) or as a purchaser of such services (corporate counsel) of the costs incurred within the relatively recent past, for the type of work to which the question pertains. In each of the questions, ‘total cost’ is all costs, including outside legal and paralegal services, local counsel, associates, paralegals, travel and living expenses, fees and costs for court reporters, photocopies, courier services, exhibit preparation, analytical testing, expert witnesses, translators, surveys, jury advisors, and similar expenses.” Respondents were further instructed to estimate these based on a single IP asset, such as one patent at issue or one trademark. Location: The metropolitan areas of Boston, New York City, Philadelphia, Washington (DC-MD-VA), Chicago, and Minneapolis–St. Paul include all localities—central city and surrounding areas—within the primary metropolitan statistical area. One state—Texas—had sufficiently large numbers of respondents to be reported separately. There were sufficient responses to breakout Los Angeles and San Francisco separately; California firms outside of those metro areas were included in “Other West.” Other categories exclude those named metropolitan areas.
AIPLA Report of the Economic Survey 2015
4
LOCATION
METROPOLITAN AREAS PERCENT COUNT
Boston CMSA* 5.6% 77
New York City CMSA* 7.9% 108
Philadelphia CMSA* 3.4% 46
Washington, DC CMSA* 18.3% 250
Other East: Maine, New Hampshire, Vermont, Massachusetts, Rhode Island, Connecticut, New York, New Jersey, Pennsylvania, Delaware, Maryland, Virginia, and West Virginia
5.4% 74
Metro Southeast: Raleigh–Durham, Greensboro–Winston-Salem, and Charlotte, NC; Atlanta, GA; and Miami–Ft. Lauderdale–West Palm Beach, FL
3.4% 47
Other Southeast: North Carolina, South Carolina, Georgia, and Florida 2.9% 40
Chicago CMSA* 5.4% 74
Minneapolis–St. Paul PMSA** 4.1% 56
Other Central: Minnesota, North Dakota, South Dakota, Wisconsin, Michigan, Ohio, Indiana, Illinois, Iowa, Nebraska, Kansas, Missouri, Kentucky, Oklahoma, Arkansas, Louisiana, Mississippi, Alabama, and Tennessee
16.2% 221Texas 6.4% 87
Los Angeles CMSA* 2.7% 37
San Francisco CMSA* 5.2% 71
Other West: Montana, Wyoming, Colorado, New Mexico, Idaho, Utah, Nevada, Arizona, Washington, Oregon, California, Alaska, and Hawaii
13.0% 178
*CMSA: Consolidated Metropolitan Statistical Area– a metro area with a population of one million or more. **PMSA: Primary Metropolitan Statistical Area– a component of a CMSA.
AIPLA Report of the Economic Survey 2015
5
GENDER (P. I-1, Q5)
Male79.8%
Female20.2%
ETHNICITY (P. I-1, Q6)
White/Caucasian87.8%
Black/African American1.7%
Hispanic/Latino2.3%
Asian/Pacific Islander5.9%
N.A. Indian/Native Canadian
0.2%
Blended1.2%
Other1.0%
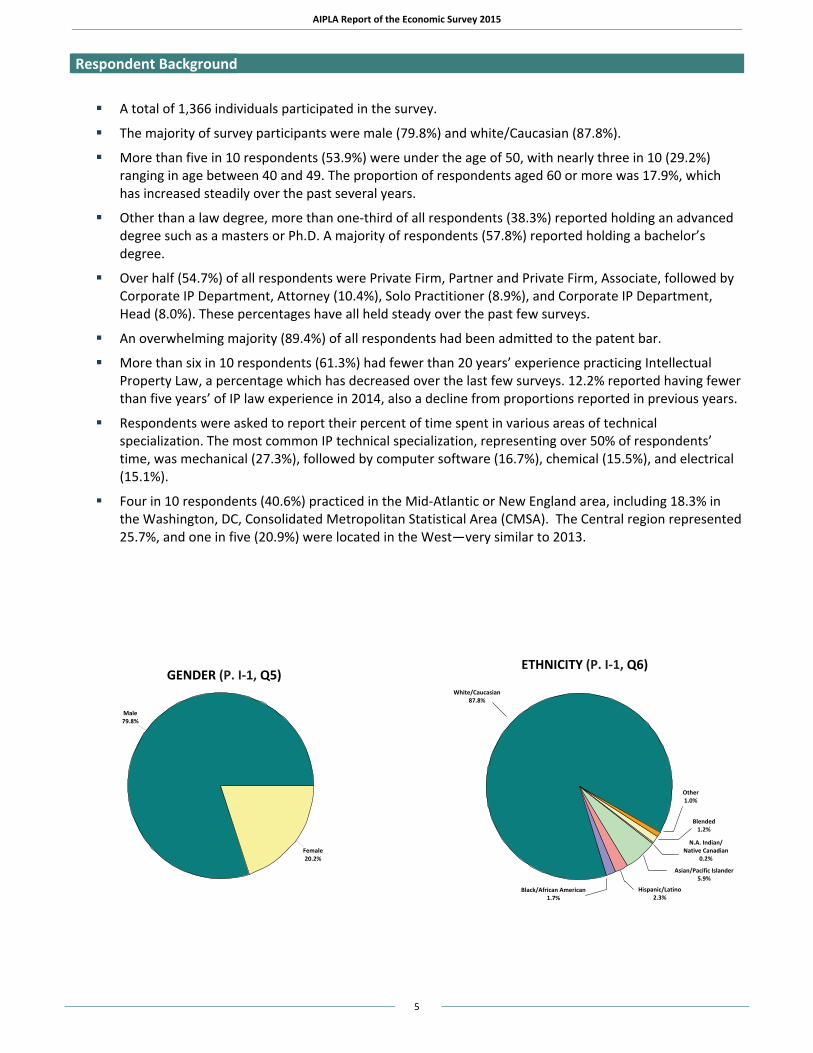
Respondent Background A total of 1,366 individuals participated in the survey.
The majority of survey participants were male (79.8%) and white/Caucasian (87.8%).
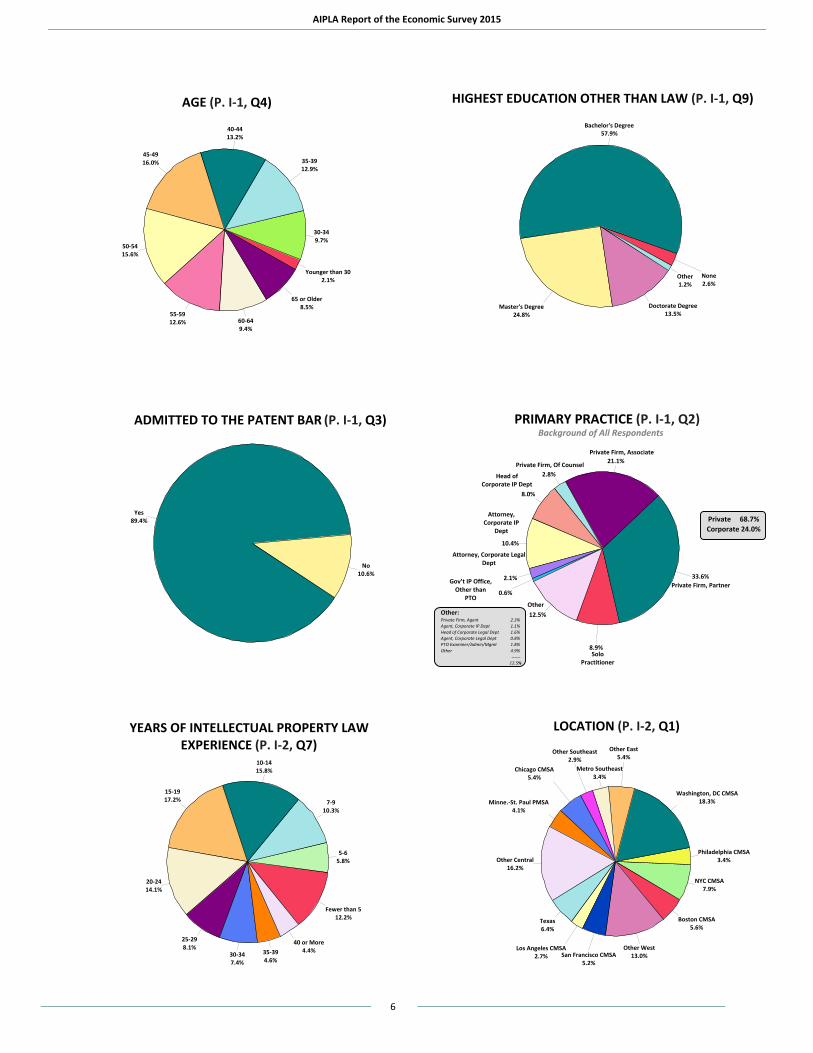
More than five in 10 respondents (53.9%) were under the age of 50, with nearly three in 10 (29.2%) ranging in age between 40 and 49. The proportion of respondents aged 60 or more was 17.9%, which has increased steadily over the past several years.
Other than a law degree, more than one-third of all respondents (38.3%) reported holding an advanced degree such as a masters or Ph.D. A majority of respondents (57.8%) reported holding a bachelor’s degree.
Over half (54.7%) of all respondents were Private Firm, Partner and Private Firm, Associate, followed by Corporate IP Department, Attorney (10.4%), Solo Practitioner (8.9%), and Corporate IP Department, Head (8.0%). These percentages have all held steady over the past few surveys.
An overwhelming majority (89.4%) of all respondents had been admitted to the patent bar.
More than six in 10 respondents (61.3%) had fewer than 20 years’ experience practicing Intellectual Property Law, a percentage which has decreased over the last few surveys. 12.2% reported having fewer than five years’ of IP law experience in 2014, also a decline from proportions reported in previous years.
Respondents were asked to report their percent of time spent in various areas of technical specialization. The most common IP technical specialization, representing over 50% of respondents’ time, was mechanical (27.3%), followed by computer software (16.7%), chemical (15.5%), and electrical (15.1%).
Four in 10 respondents (40.6%) practiced in the Mid-Atlantic or New England area, including 18.3% in the Washington, DC, Consolidated Metropolitan Statistical Area (CMSA). The Central region represented 25.7%, and one in five (20.9%) were located in the West—very similar to 2013.
AIPLA Report of the Economic Survey 2015
6
AGE (P. I-1, Q4)
Younger than 302.1%
30-349.7%
35-3912.9%
40-4413.2%
45-4916.0%
50-5415.6%
55-5912.6% 60-64
9.4%
65 or Older8.5%
PRIMARY PRACTICE (P. I-1, Q2)Background of All Respondents
8.9%
33.6%
21.1%
2.8%
8.0%
10.4%
2.1%
0.6%
12.5%
Private 68.7%Corporate 24.0%
Private Firm, Partner
Solo Practitioner
Other
Gov’t IP Office,Other than
PTO
Attorney, Corporate Legal Dept
Attorney, Corporate IP
Dept
Head ofCorporate IP Dept
Private Firm, Of Counsel
Private Firm, Associate
Other:Private Firm, Agent 2.3%Agent, Corporate IP Dept 1.1%Head of Corporate Legal Dept 1.6%Agent, Corporate Legal Dept 0.8%PTO Examiner/Admin/Mgmt 1.8%Other 4.9%
------ 12.5%
ADMITTED TO THE PATENT BAR (P. I-1, Q3)
Yes89.4%
No10.6%
YEARS OF INTELLECTUAL PROPERTY LAWEXPERIENCE (P. I-2, Q7)
Fewer than 512.2%
5-65.8%
7-910.3%
10-1415.8%
15-1917.2%
20-2414.1%
25-298.1%
30-347.4%
35-394.6%
40 or More4.4%
LOCATION (P. I-2, Q1)
Boston CMSA5.6%
NYC CMSA7.9%
Philadelphia CMSA3.4%
Washington, DC CMSA18.3%
Other East5.4%
Metro Southeast3.4%
Other Southeast2.9%
Chicago CMSA5.4%
Minne.-St. Paul PMSA4.1%
Other Central16.2%
Texas6.4%
Los Angeles CMSA2.7% San Francisco CMSA
5.2%
Other West13.0%
HIGHEST EDUCATION OTHER THAN LAW (P. I-1, Q9)
None2.6%
Bachelor's Degree57.9%
Master's Degree24.8%
Doctorate Degree13.5%
Other1.2%
AIPLA Report of the Economic Survey 2015
7
IP BUDGET FOR CORPORATE PRACTITIONERS
ANNUAL IP BUDGET FOR COMPANY (P. I-56, Q21) CORPORATE IP, HEAD
By Technology Focus
Biotech
Chemical
Electrical
Computer Software
Mechanical
Medical/Health Care
Pharmceutical
All Individuals
$0 $5,000,000 $10,000,000 $15,000,000 $20,000,000 $25,000,000
1st Quartile/3rd Quartile Median Mean
ANNUAL IP BUDGET PER FULL-TIME IP ATTORNEY OR AGENT(P. I-57, Q21) CORPORATE IP, HEAD
By Technology Focus
Biotech
Chemical
Electrical
Computer Software
Mechanical
Medical/Health Care
Pharmceutical
All Individuals
$0 $500,000 $1,000,000 $1,500,000 $2,000,000 $2,500,000 $3,000,000 $3,500,000
1st Quartile/3rd Quartile Median Mean
AIPLA Report of the Economic Survey 2015
8
CHANGE IN IP BUDGET FOR COMPANY:
2013-2014 (P. I-58, Q22)Reported by Corporate IP, Head
1-2
3-5
6-10
11-25
26-50
51-100
All Individuals
Num
b er o
f IP
Atto
rne y
s
0% 20% 40% 60% 80% 100%
Increase No Change Decrease
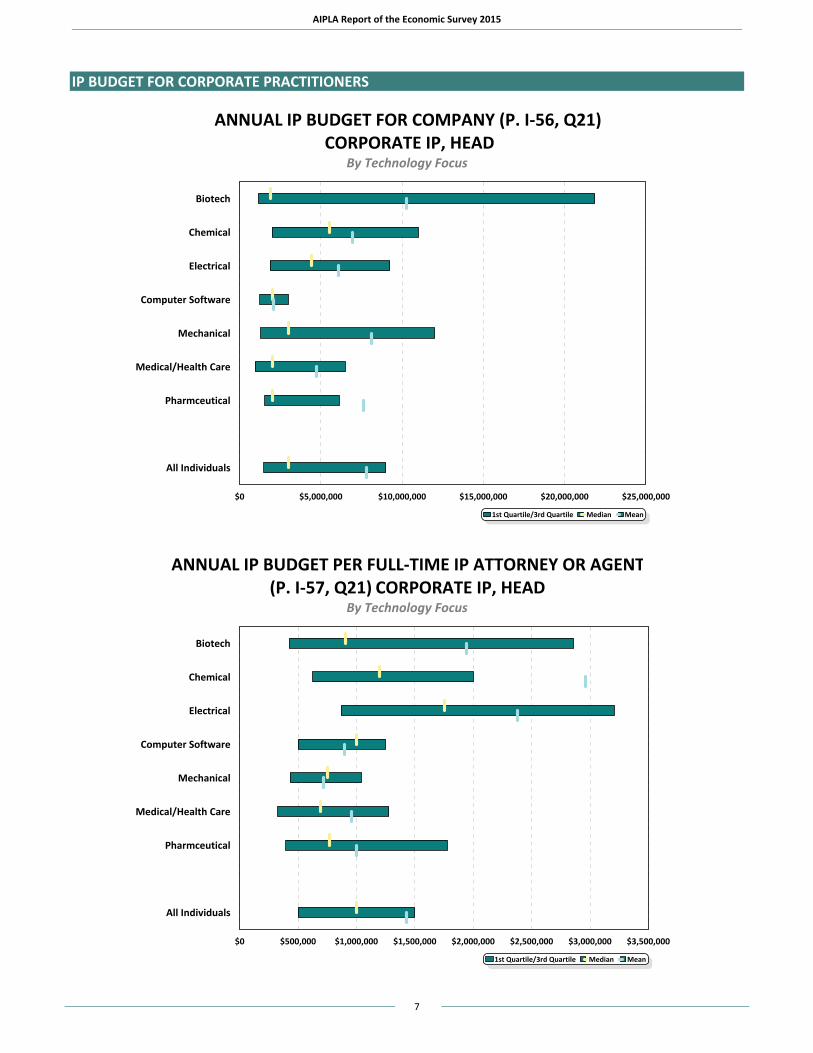
The median annual corporate IP budget for all respondents was $3,000,000. The median IP budget per full-time IP lawyer or agent was $1,000,000.
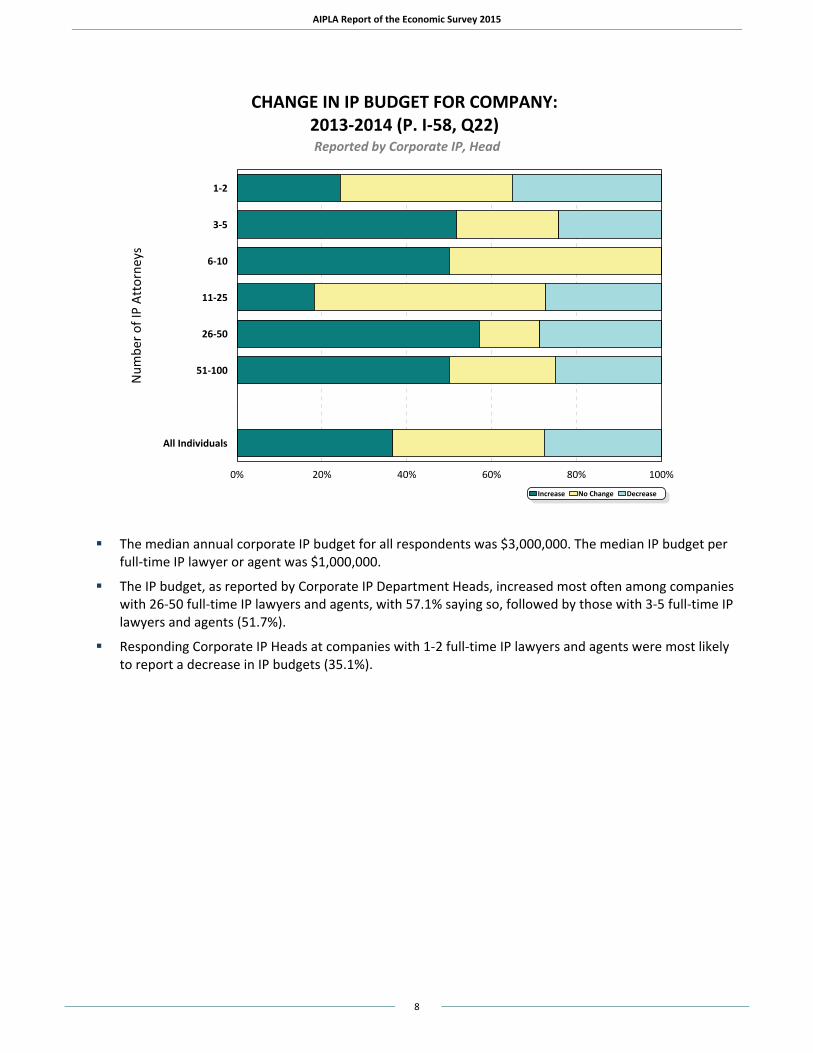
The IP budget, as reported by Corporate IP Department Heads, increased most often among companies with 26-50 full-time IP lawyers and agents, with 57.1% saying so, followed by those with 3-5 full-time IP lawyers and agents (51.7%).
Responding Corporate IP Heads at companies with 1-2 full-time IP lawyers and agents were most likely to report a decrease in IP budgets (35.1%).
AIPLA Report of the Economic Survey 2015
9
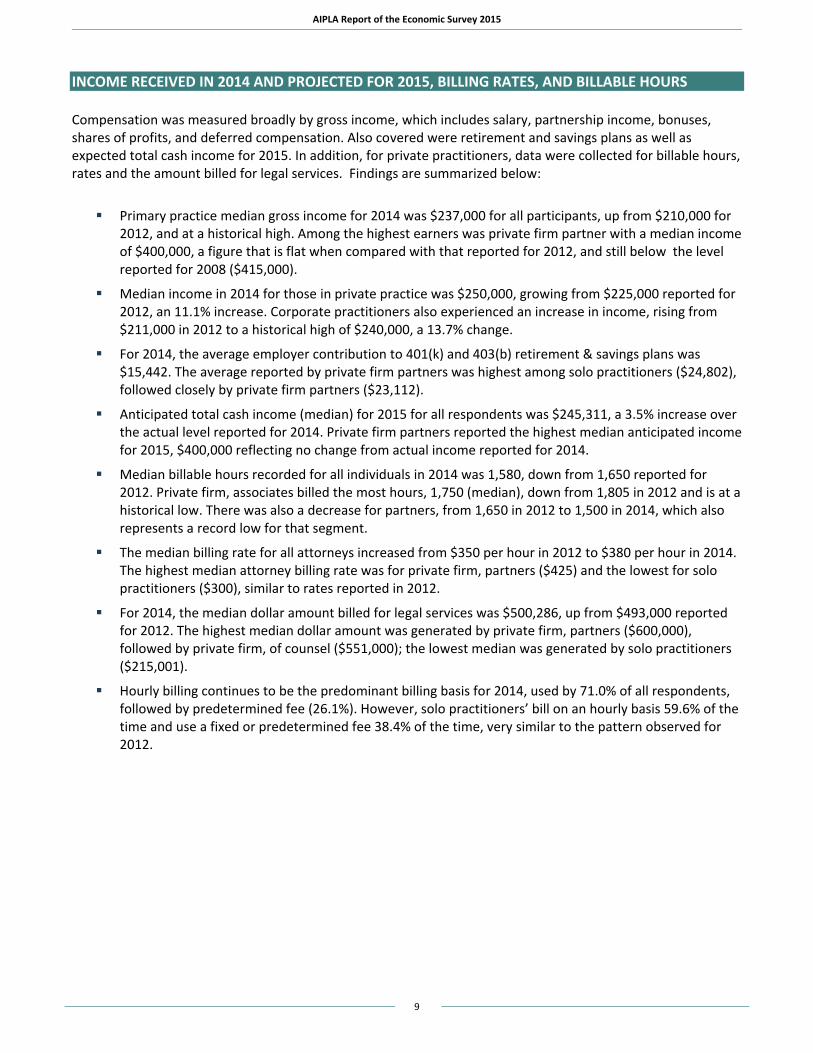
INCOME RECEIVED IN 2014 AND PROJECTED FOR 2015, BILLING RATES, AND BILLABLE HOURS Compensation was measured broadly by gross income, which includes salary, partnership income, bonuses, shares of profits, and deferred compensation. Also covered were retirement and savings plans as well as expected total cash income for 2015. In addition, for private practitioners, data were collected for billable hours, rates and the amount billed for legal services. Findings are summarized below:
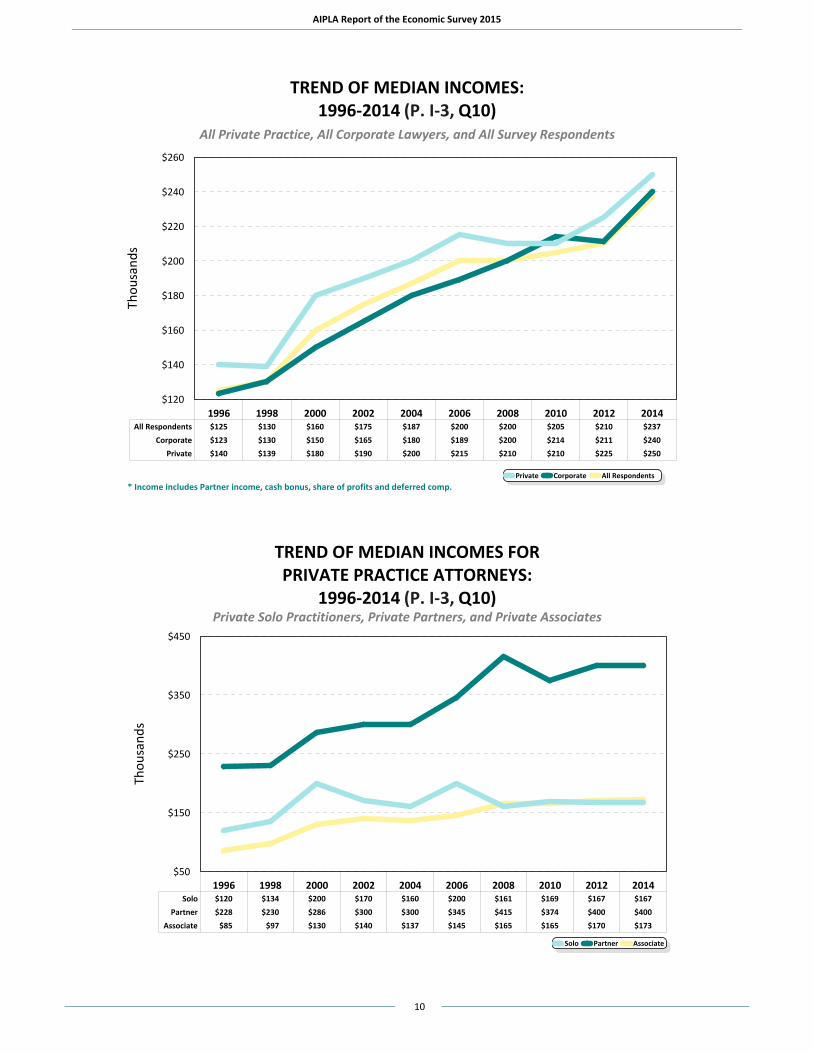
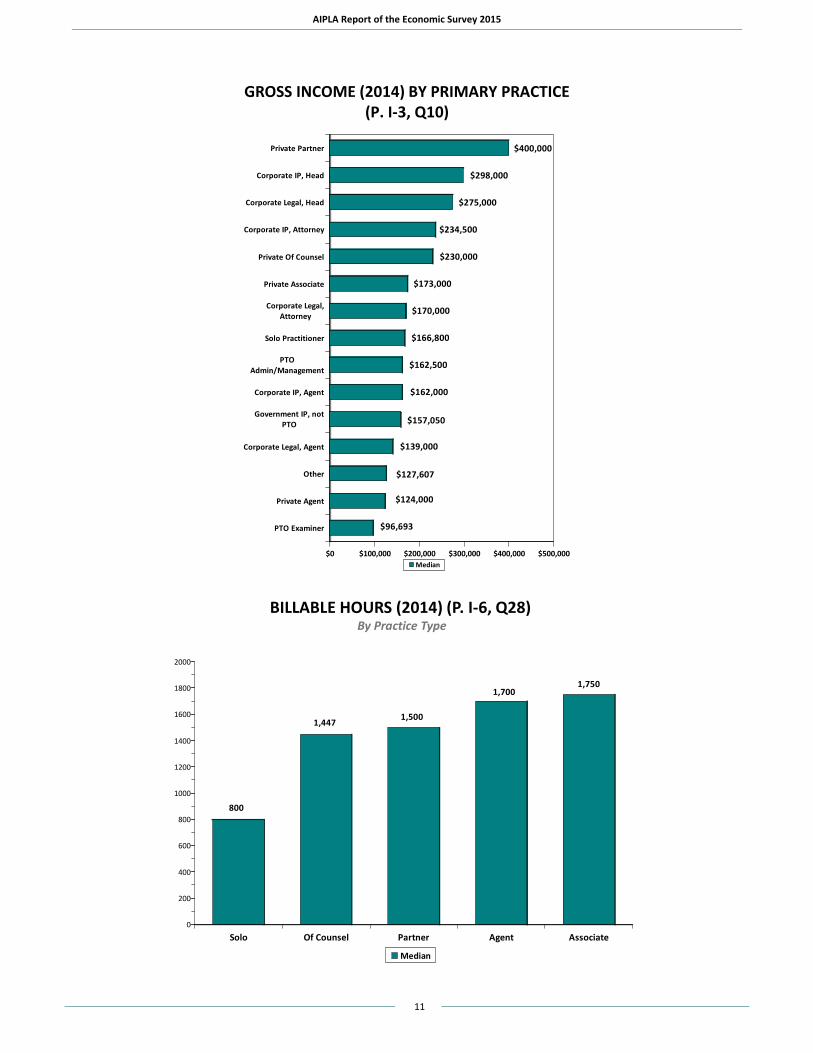
Primary practice median gross income for 2014 was $237,000 for all participants, up from $210,000 for 2012, and at a historical high. Among the highest earners was private firm partner with a median income of $400,000, a figure that is flat when compared with that reported for 2012, and still below the level reported for 2008 ($415,000).
Median income in 2014 for those in private practice was $250,000, growing from $225,000 reported for 2012, an 11.1% increase. Corporate practitioners also experienced an increase in income, rising from $211,000 in 2012 to a historical high of $240,000, a 13.7% change.
For 2014, the average employer contribution to 401(k) and 403(b) retirement & savings plans was $15,442. The average reported by private firm partners was highest among solo practitioners ($24,802), followed closely by private firm partners ($23,112).
Anticipated total cash income (median) for 2015 for all respondents was $245,311, a 3.5% increase over the actual level reported for 2014. Private firm partners reported the highest median anticipated income for 2015, $400,000 reflecting no change from actual income reported for 2014.
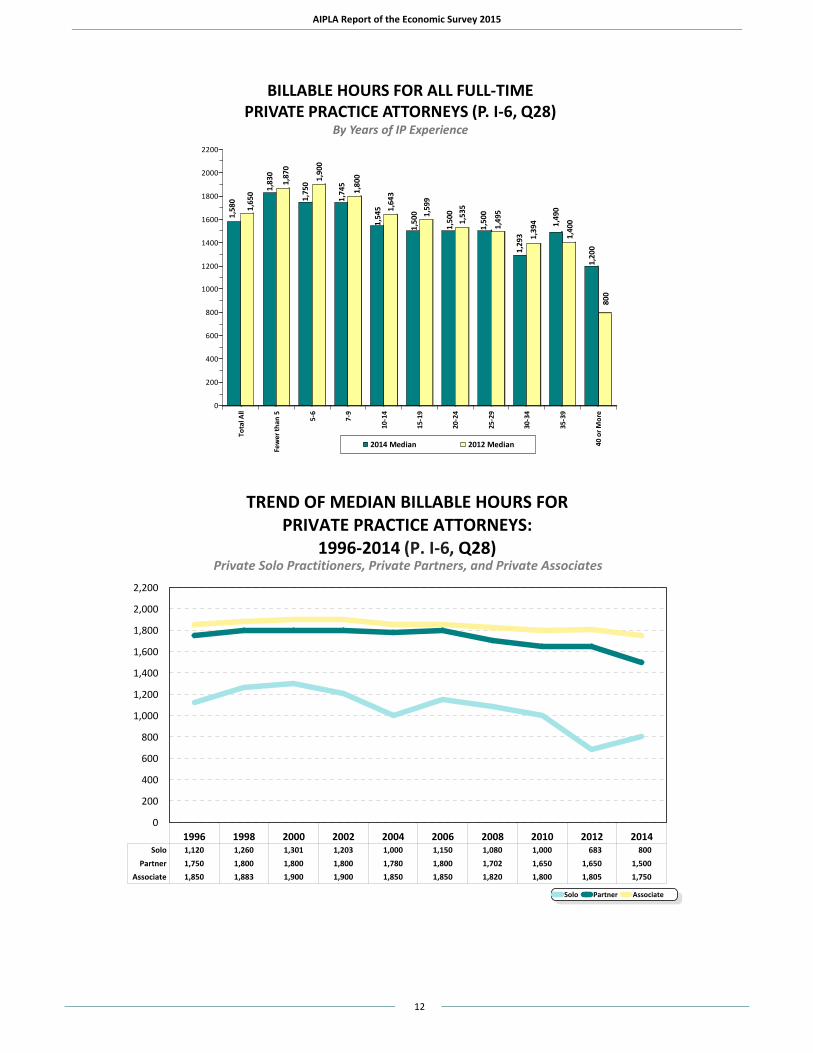
Median billable hours recorded for all individuals in 2014 was 1,580, down from 1,650 reported for 2012. Private firm, associates billed the most hours, 1,750 (median), down from 1,805 in 2012 and is at a historical low. There was also a decrease for partners, from 1,650 in 2012 to 1,500 in 2014, which also represents a record low for that segment.
The median billing rate for all attorneys increased from $350 per hour in 2012 to $380 per hour in 2014. The highest median attorney billing rate was for private firm, partners ($425) and the lowest for solo practitioners ($300), similar to rates reported in 2012.
For 2014, the median dollar amount billed for legal services was $500,286, up from $493,000 reported for 2012. The highest median dollar amount was generated by private firm, partners ($600,000), followed by private firm, of counsel ($551,000); the lowest median was generated by solo practitioners ($215,001).
Hourly billing continues to be the predominant billing basis for 2014, used by 71.0% of all respondents, followed by predetermined fee (26.1%). However, solo practitioners’ bill on an hourly basis 59.6% of the time and use a fixed or predetermined fee 38.4% of the time, very similar to the pattern observed for 2012.
AIPLA Report of the Economic Survey 2015
10
TREND OF MEDIAN INCOMES:1996-2014 (P. I-3, Q10)
All Private Practice, All Corporate Lawyers, and All Survey Respondents
'
'
'
'
'
'
' ''
'
&
&
&
&
&
&
&
&
& &
!
!
!
!
!
!
!! !
!
1996 1998 2000 2002 2004 2006 2008 2010 2012 2014$120
$140
$160
$180
$200
$220
$240
$260
Thou
sand
s
Private Corporate All Respondents! & '
Private $140 $139 $180 $190 $200 $215 $210 $210 $225 $250 Corporate $123 $130 $150 $165 $180 $189 $200 $214 $211 $240
All Respondents $125 $130 $160 $175 $187 $200 $200 $205 $210 $237
* Income includes Partner income, cash bonus, share of profits and deferred comp.
TREND OF MEDIAN INCOMES FOR PRIVATE PRACTICE ATTORNEYS:
1996-2014 (P. I-3, Q10)Private Solo Practitioners, Private Partners, and Private Associates
'
'
'
'' ' '
' ' '
&
&
&
&& &
&
&
&
&
!
!
!
!
!!
!
! ! !
1996 1998 2000 2002 2004 2006 2008 2010 2012 2014$50
$150
$250
$350
$450
Thou
s and
s
Solo Partner Associate! & '
Solo $120 $134 $200 $170 $160 $200 $161 $169 $167 $167 Partner $228 $230 $286 $300 $300 $345 $415 $374 $400 $400
Associate $85 $97 $130 $140 $137 $145 $165 $165 $170 $173
AIPLA Report of the Economic Survey 2015
11
GROSS INCOME (2014) BY PRIMARY PRACTICE (P. I-3, Q10)
$96,693
$124,000
$127,607
$139,000
$157,050
$162,000
$162,500
$166,800
$170,000
$173,000
$230,000
$234,500
$275,000
$298,000
$400,000
$0 $100,000 $200,000 $300,000 $400,000 $500,000
Private Partner
Corporate IP, Head
Corporate Legal, Head
Corporate IP, Attorney
Private Of Counsel
Private Associate
Corporate Legal,Attorney
Solo Practitioner
PTOAdmin/Management
Corporate IP, Agent
Government IP, notPTO
Corporate Legal, Agent
Other
Private Agent
PTO Examiner
Median
BILLABLE HOURS (2014) (P. I-6, Q28)By Practice Type
800
1,447 1,500
1,7001,750
0
200
400
600
800
1000
1200
1400
1600
1800
2000
Solo Of Counsel Partner Agent Associate
Median
AIPLA Report of the Economic Survey 2015
12
BILLABLE HOURS FOR ALL FULL-TIME PRIVATE PRACTICE ATTORNEYS (P. I-6, Q28)
By Years of IP Experience
1,58
0
1,65
0 1,83
0
1,87
0
1,75
0 1,90
0
1,74
5
1,80
0
1,54
5 1,64
3
1,50
0 1,59
9
1,50
01,
535
1,50
0
1,49
5
1,29
3 1,39
4 1,49
0
1,40
0
1,20
0
800
0
200
400
600
800
1000
1200
1400
1600
1800
2000
2200
Tota
l All
Few
er th
an 5 5-6
7-9
10-1
4
15-1
9
20-2
4
25-2
9
30-3
4
35-3
9
40 o
r Mor
e
2014 Median 2012 Median
TREND OF MEDIAN BILLABLE HOURS FOR PRIVATE PRACTICE ATTORNEYS:
1996-2014 (P. I-6, Q28)Private Solo Practitioners, Private Partners, and Private Associates
''
' ' ' ' ' ' ' '&
&
& & & & && & &
!
!
! !!
!
!!
!
!
1996 1998 2000 2002 2004 2006 2008 2010 2012 20140
200
400
600
800
1,000
1,200
1,400
1,600
1,800
2,000
2,200
Solo Partner Associate! & '
Solo 1,120 1,260 1,301 1,203 1,000 1,150 1,080 1,000 683 800 Partner 1,750 1,800 1,800 1,800 1,780 1,800 1,702 1,650 1,650 1,500
Associate 1,850 1,883 1,900 1,900 1,850 1,850 1,820 1,800 1,805 1,750
AIPLA Report of the Economic Survey 2015
13
SUMMARY OF SURVEY RESULTS BY PRACTICE TYPE The survey findings reported in aggregate for all respondents are also broken down and summarized for eight major practice types covered—solo practitioner, private firm partner, private firm associate, private firm of counsel, corporate IP department head, corporate IP department attorney, private firm patent agent, and corporate IP department patent agent.
SOLO PRACTITIONER 122 solo practitioners responded to the 2015 survey and reported an average of 21.2 years of IP
attorney experience. Just over half (50.8%) held a bachelor’s as their highest degree (other than their law degree), while 36.9% held a master’s degree.
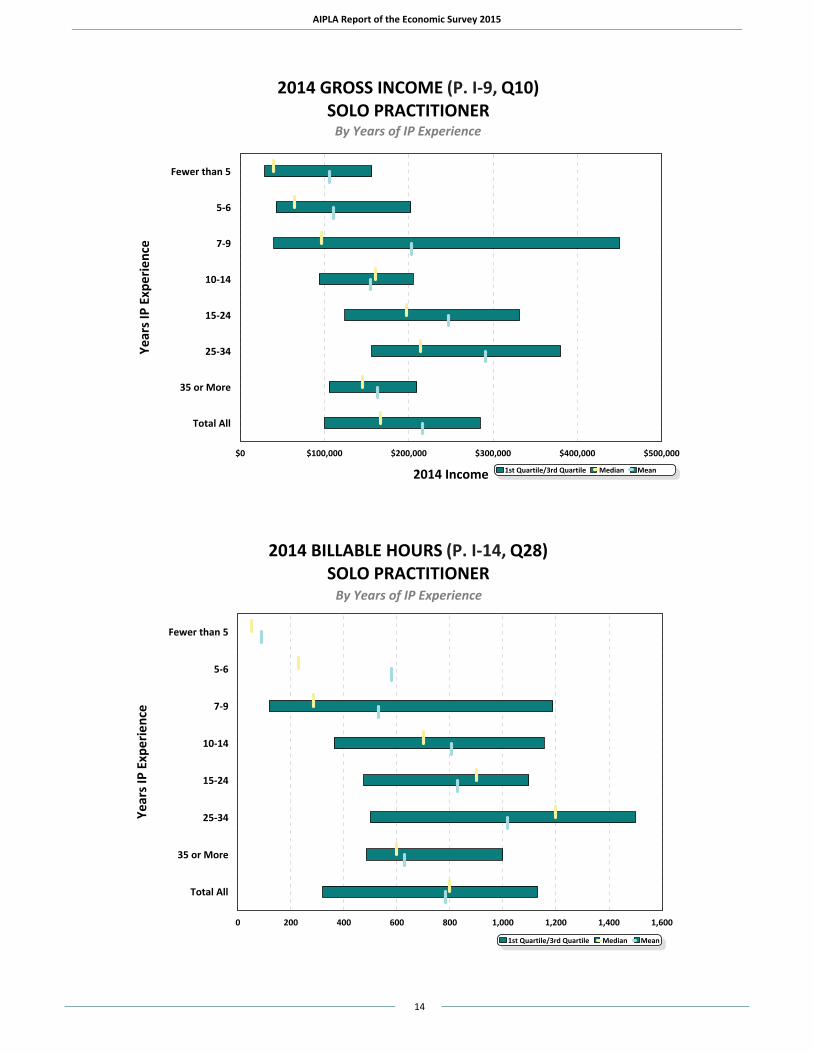
The mean (average) gross income for solo practitioners was $216,692 for 2014, up nine percent from $198,436 in 2012; the median was $166,800 dipping slightly from $167,500 two years ago. The highest median income was reported for the Minnesota-St. Paul PMSA and Other East—$300,000—followed by Los Angeles at $275,000. The lowest median income was reported for Other Southeast—$87,000.
Solo practitioner 401(k)/403(b) employer contributions averaged $24,802 with $25,000 as the median.
Expected median total cash income for 2015 was $150,000, 10.1% below the median actual gross income reported for 2014.
Solo practitioners spent an average of 53.3% of their time engaged directly in IP prosecution work, down somewhat from 56.3% in 2012.
Patent work was the dominant IP area measured in time spent (61.6%), also dropping from 65.0% in 2012.
The average number of new priority US and PCT Patent applications prepared and filed by solo practitioners in 2014 was 19.2, up from 14.3 in 2012. Solo practitioners specializing in computer software reported the highest median number of new US and PCT Patent applications prepared and filed 21.0, up from 15.0, reported two years ago. Medical/Health Care IP specialization was close behind with a median value of 20.0 new priority US and PCT patent applications prepared and filed in 2014.
The median number of billable hours recorded in 2014 by solo practitioners was 800, up from 683 hours in 2012. Billable hours varied by experience, climbing to 1,200 among those with 25-34 years of experience. However, billable hours drop off to 600 hours for those who are likely closer to retirement (those with 35 years or more experience). Billable hours were the highest for those in the Minnesota-St. Paul area at 1,440 (median) hours.
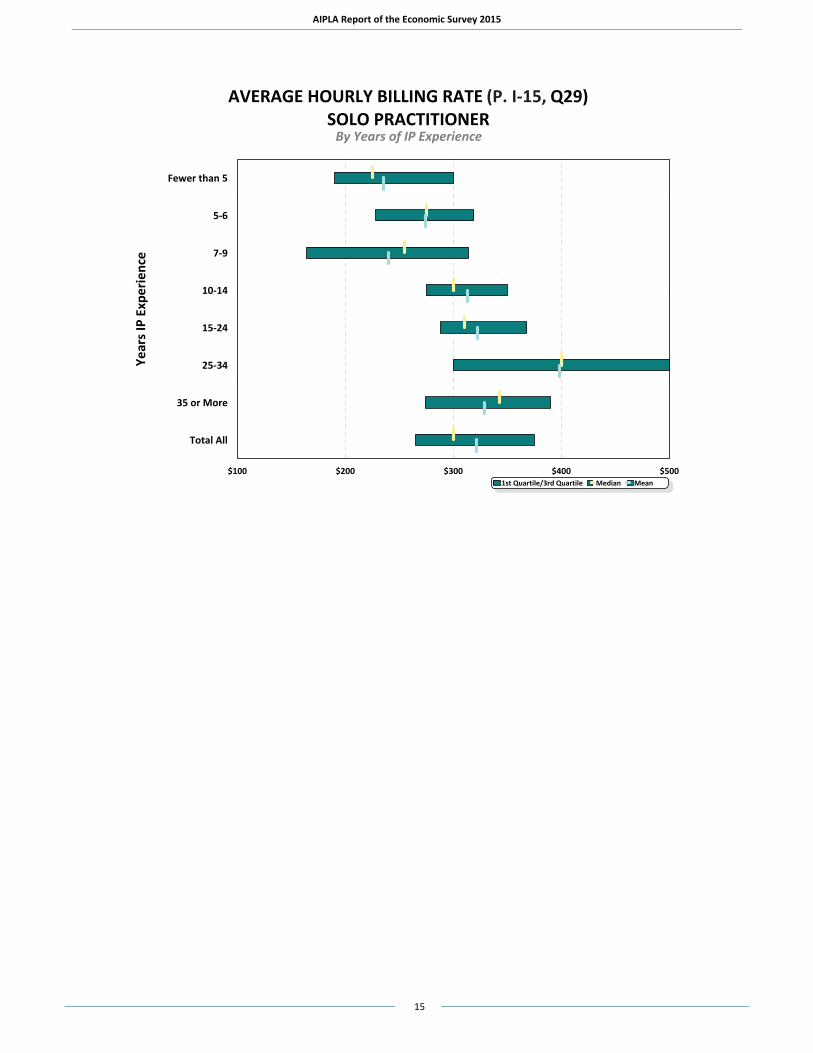
The average hourly billing rate was $321 per hour in 2014, up from $295 in 2012 and 2010.
More than half (59.6%) of services billed were on an hourly basis while 38.4% were based on a predetermined fee, fairly similar to the past two surveys.
The median dollar amount a solo practitioner billed for legal services performed in 2014 was $215,001, up from $180,000 in 2012.
Solo Practitioners indicate that they spent an average of 5.4 hours per week on business development.
AIPLA Report of the Economic Survey 2015
14
2014 GROSS INCOME (P. I-9, Q10)SOLO PRACTITIONER
By Years of IP Experience
Fewer than 5
5-6
7-9
10-14
15-24
25-34
35 or More
Total All
Year
s IP
Expe
r ienc
e
$0 $100,000 $200,000 $300,000 $400,000 $500,000
2014 Income 1st Quartile/3rd Quartile Median Mean
2014 BILLABLE HOURS (P. I-14, Q28)SOLO PRACTITIONER
By Years of IP Experience
Fewer than 5
5-6
7-9
10-14
15-24
25-34
35 or More
Total All
Year
s IP
Expe
ri enc
e
0 200 400 600 800 1,000 1,200 1,400 1,600
1st Quartile/3rd Quartile Median Mean
AIPLA Report of the Economic Survey 2015
15
AVERAGE HOURLY BILLING RATE (P. I-15, Q29)SOLO PRACTITIONER
By Years of IP Experience
Fewer than 5
5-6
7-9
10-14
15-24
25-34
35 or More
Total All
Year
s IP
Expe
rienc
e
$100 $200 $300 $400 $5001st Quartile/3rd Quartile Median Mean
AIPLA Report of the Economic Survey 2015
16
PRIVATE FIRM, PARTNER
On average, the 458 private firm partners had 22.2 years of IP attorney experience, with 66.5% holding a bachelor’s degree as their highest education aside from their law degree.
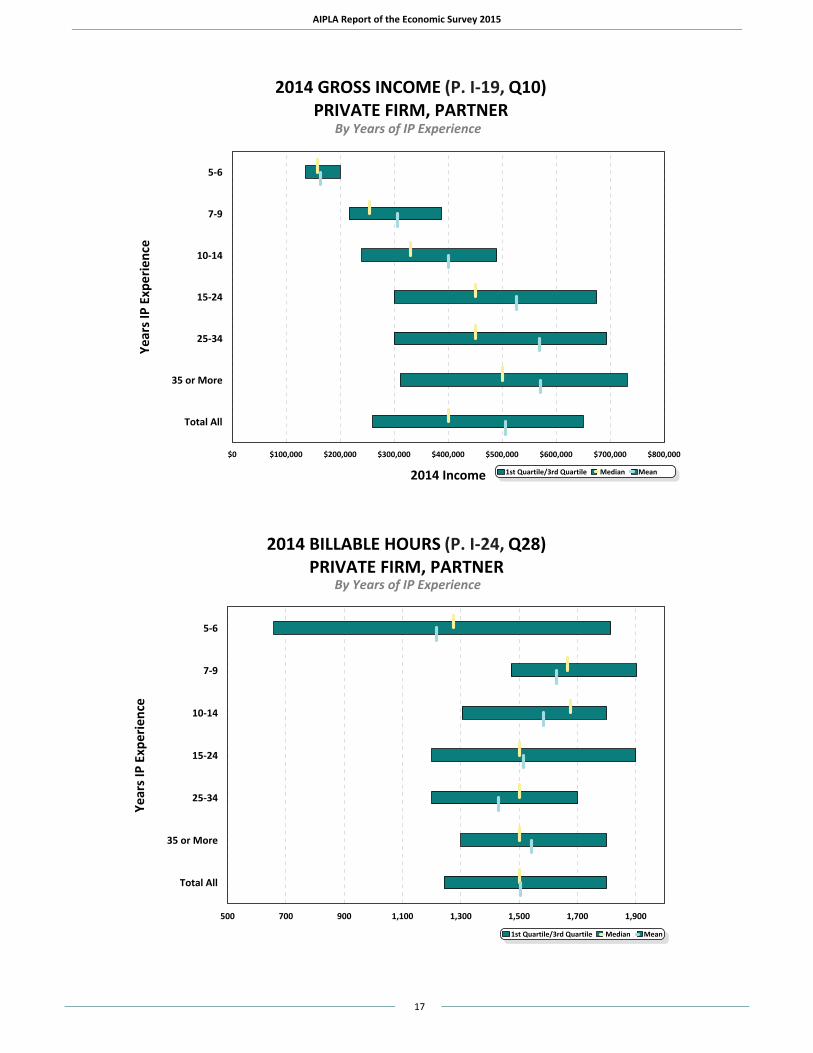
Gross income for private firm partners averaged $505,316 for 2014, down 1.4% from $512,557 reported for 2012. The median for all participants was $400,000; the highest reported location was the San Francisco CMSA, where the median was $661,000, followed by Texas at $510,000.
Employer contributions to 401(k)/403(b) retirement and savings plans averaged $23,112 with $20,000 as the median, rising 23.1% from $16,250 (median) reported in 2012.
Private firm partners expected their total cash income in 2015 to be a median value of $400,000, and an average of $500,925.
Private firm partners on average spent 42.1% of their time engaged in IP prosecution work, up from 34.4% reported for 2012. In contrast, they spent an average of 15.5% of their time on IP litigation, down from 20.6% two years ago.
The predominant IP work area was patent work, accounting for 68.9% of responding partners’ time.
The mean number of IP lawyers and patent agents employed at all locations reported by the private firm partners responding to this survey was 42.5, a drop of 22.9% from 55.1 reported in 2012.
The number of new priority US and PCT Patent applications prepared and filed by private firm partners in 2014 averaged 26.5, rising from 19.4 in 2012. The median was 15.0 for both surveys.
The typical partner billed 1,500 hours (median) in 2014. This number has been on an overall decline for the last few surveys, and is down 9.9% from 1,650 hours in 2012.
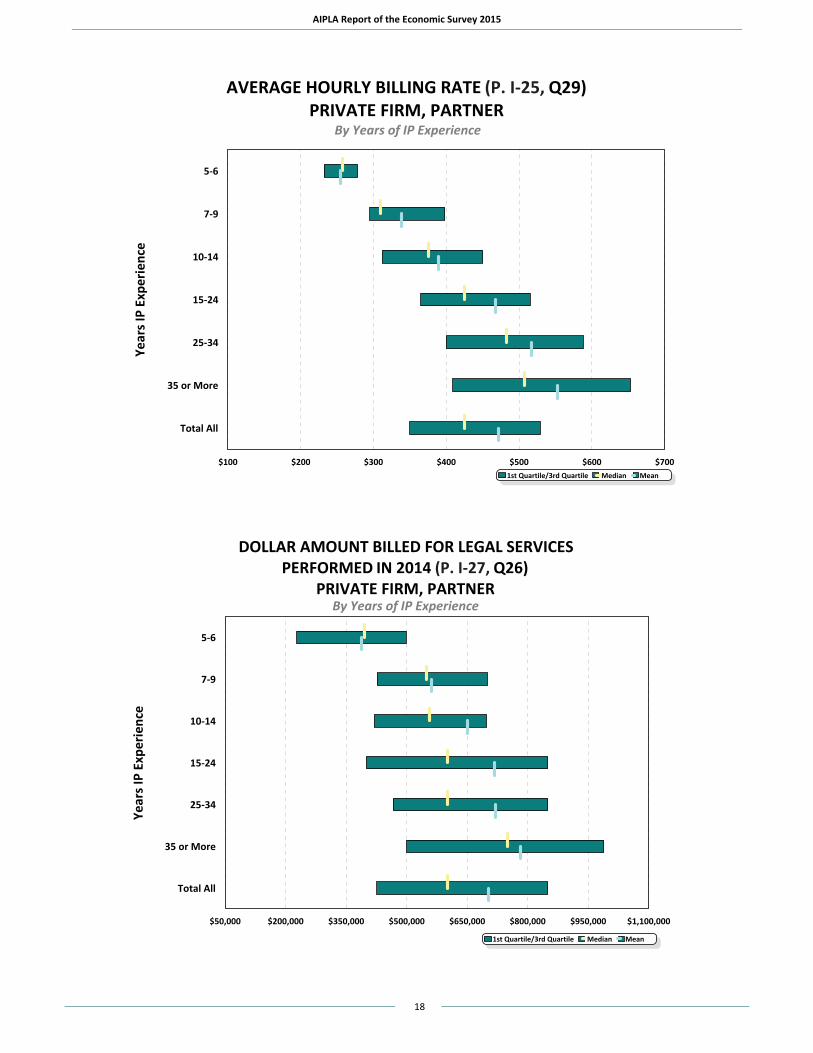
The median average hourly billing rate in 2014 was $425, the same as reported for 2012. The highest rates were in the Los Angeles CMSA and San Francisco CMSA, with medians of $575 and $530 per hour, respectively.
Partner’s billings are done primarily on an hourly basis (70.7%), with 25.8% on a pre-determined fee.
The median dollar amount billed for legal services by private firm partners in 2014 was $600,000, slipping from $610,000 in 2012 (a 1.6% decline).
Private firm partners spent an average of 6.7 hours per week on business development.
AIPLA Report of the Economic Survey 2015
17
2014 GROSS INCOME (P. I-19, Q10)PRIVATE FIRM, PARTNER
By Years of IP Experience
5-6
7-9
10-14
15-24
25-34
35 or More
Total All
Year
s IP
Expe
ri enc
e
$0 $100,000 $200,000 $300,000 $400,000 $500,000 $600,000 $700,000 $800,000
2014 Income 1st Quartile/3rd Quartile Median Mean
2014 BILLABLE HOURS (P. I-24, Q28)PRIVATE FIRM, PARTNER
By Years of IP Experience
5-6
7-9
10-14
15-24
25-34
35 or More
Total All
Year
s IP
Expe
rienc
e
500 700 900 1,100 1,300 1,500 1,700 1,900
1st Quartile/3rd Quartile Median Mean
AIPLA Report of the Economic Survey 2015
18
AVERAGE HOURLY BILLING RATE (P. I-25, Q29)PRIVATE FIRM, PARTNER
By Years of IP Experience
5-6
7-9
10-14
15-24
25-34
35 or More
Total All
Yea r
s IP
Expe
rienc
e
$100 $200 $300 $400 $500 $600 $7001st Quartile/3rd Quartile Median Mean
DOLLAR AMOUNT BILLED FOR LEGAL SERVICES PERFORMED IN 2014 (P. I-27, Q26)
PRIVATE FIRM, PARTNERBy Years of IP Experience
5-6
7-9
10-14
15-24
25-34
35 or More
Total All
Year
s IP
Expe
rienc
e
$50,000 $200,000 $350,000 $500,000 $650,000 $800,000 $950,000 $1,100,000
1st Quartile/3rd Quartile Median Mean
AIPLA Report of the Economic Survey 2015
19
PRIVATE FIRM, ASSOCIATE
There were 288 private firm associates who participated in the 2015 survey, and averaged 7.9 years of IP attorney experience. The highest education degree held (other than a law degree) was a bachelor’s, held by 62.5% of private firm associates.
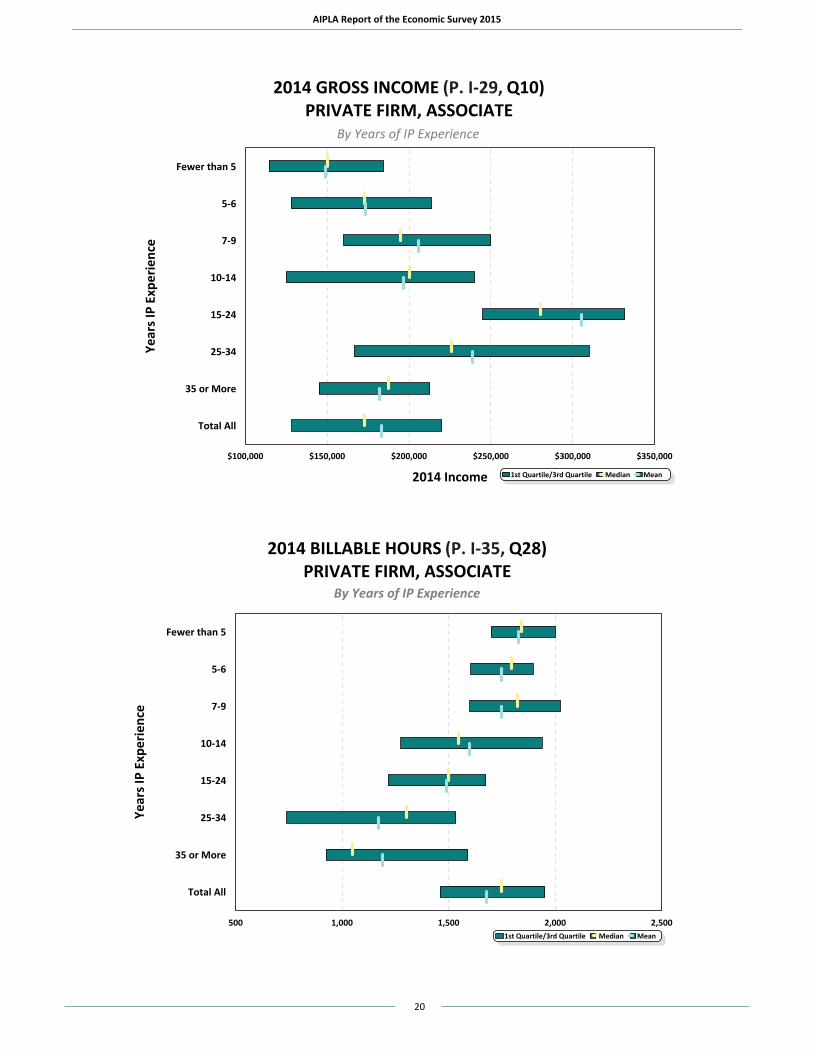
The average total gross income for private firm associates was $183,021, dipping slightly from $188,093 in 2012. The 2014 median is at $173,000, inching up from $170,000 reported in 2012.
Employer contributions to private firm associates’ 401(k)/403(b) retirement and savings plans averaged $7,828 with $6,000 as the median, very similar to what was reported in 2012.
The expected median cash income for associates in 2015 was $175,000. Respondents in NYC CMSA had the highest median expected cash income of $255,000.
Private firm associates spent over half (56.1%) their time directly on IP prosecution work.
Patent work was the predominant IP work area, accounting for an average of 77.0% of associates’ time.
The mean number of full-time IP lawyers and patent agents employed at all private firm locations represented by the associates responding to this year’s survey was down sharply, from 74.3 in 2012 to 59.6 in 2014.
New priority US and PCT patent applications prepared and filed by private firm associates averaged 18.0 in 2014, similar to 17.8 in 2012.
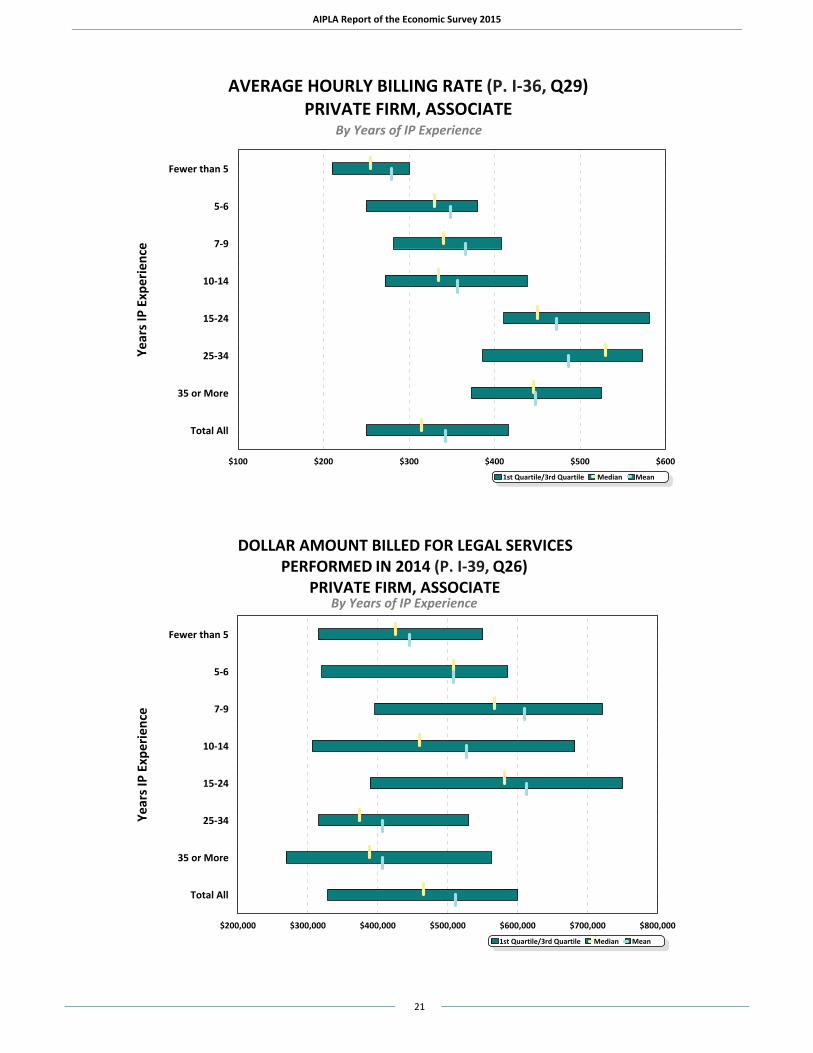
Median billable hours reported for associates for 2014 was 1,750, dropping from 1,805 hours in 2012.
The median average hourly billing rate for private firm associates increased from $305 in 2012 to $315 in 2014. In 2014, the rate ranged from $250 for firms with 3-5 IP attorneys and agents, up to $425 for those with more than 150.
Hourly billing was used most often by private firm associates, averaging 75.6% of all billings. A predetermined fee option was the second most often used, 22.8% of the time.
The median dollar amount billed for legal services by private firm associates in 2014 was $465,000, up from $455,000 in 2012 but short of the $467,335 observed in 2010. The median amount billed for legal services increased with the number of IP attorneys, ranging from $273,400 for 1-2 IP attorneys, up to $715,000 for firms with more than 150 IP lawyers and agents.
Private firm associates spent an average of 4.2 hours per week on business development.
AIPLA Report of the Economic Survey 2015
20
2014 GROSS INCOME (P. I-29, Q10)PRIVATE FIRM, ASSOCIATE
By Years of IP Experience
Fewer than 5
5-6
7-9
10-14
15-24
25-34
35 or More
Total All
Year
s IP
Expe
rienc
e
$100,000 $150,000 $200,000 $250,000 $300,000 $350,000
2014 Income 1st Quartile/3rd Quartile Median Mean
2014 BILLABLE HOURS (P. I-35, Q28)PRIVATE FIRM, ASSOCIATE
By Years of IP Experience
Fewer than 5
5-6
7-9
10-14
15-24
25-34
35 or More
Total All
Year
s IP
Expe
ri enc
e
500 1,000 1,500 2,000 2,5001st Quartile/3rd Quartile Median Mean
AIPLA Report of the Economic Survey 2015
21
AVERAGE HOURLY BILLING RATE (P. I-36, Q29)PRIVATE FIRM, ASSOCIATE
By Years of IP Experience
Fewer than 5
5-6
7-9
10-14
15-24
25-34
35 or More
Total All
Year
s IP
Expe
ri enc
e
$100 $200 $300 $400 $500 $600
1st Quartile/3rd Quartile Median Mean
DOLLAR AMOUNT BILLED FOR LEGAL SERVICES
PERFORMED IN 2014 (P. I-39, Q26)PRIVATE FIRM, ASSOCIATE
By Years of IP Experience
Fewer than 5
5-6
7-9
10-14
15-24
25-34
35 or More
Total All
Yea r
s IP
Expe
rienc
e
$200,000 $300,000 $400,000 $500,000 $600,000 $700,000 $800,000
1st Quartile/3rd Quartile Median Mean
AIPLA Report of the Economic Survey 2015
22
PRIVATE FIRM, OF COUNSEL
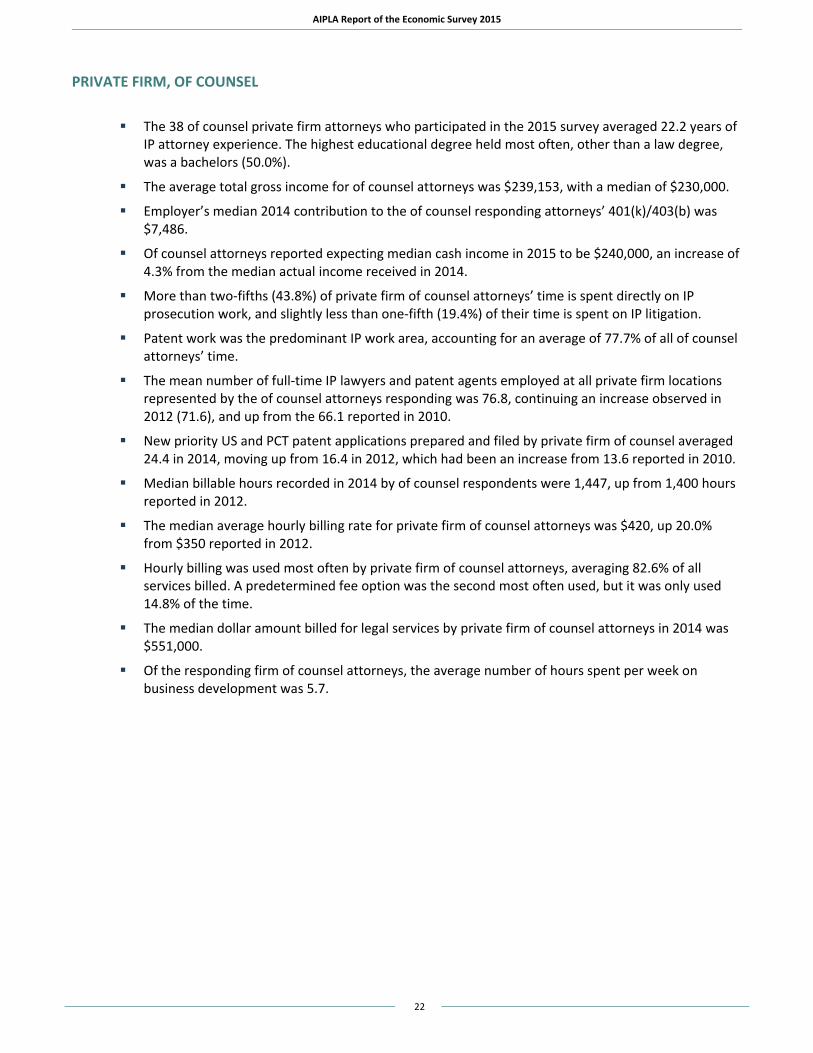
The 38 of counsel private firm attorneys who participated in the 2015 survey averaged 22.2 years of IP attorney experience. The highest educational degree held most often, other than a law degree, was a bachelors (50.0%).
The average total gross income for of counsel attorneys was $239,153, with a median of $230,000.
Employer’s median 2014 contribution to the of counsel responding attorneys’ 401(k)/403(b) was $7,486.
Of counsel attorneys reported expecting median cash income in 2015 to be $240,000, an increase of 4.3% from the median actual income received in 2014.
More than two-fifths (43.8%) of private firm of counsel attorneys’ time is spent directly on IP prosecution work, and slightly less than one-fifth (19.4%) of their time is spent on IP litigation.
Patent work was the predominant IP work area, accounting for an average of 77.7% of all of counsel attorneys’ time.
The mean number of full-time IP lawyers and patent agents employed at all private firm locations represented by the of counsel attorneys responding was 76.8, continuing an increase observed in 2012 (71.6), and up from the 66.1 reported in 2010.
New priority US and PCT patent applications prepared and filed by private firm of counsel averaged 24.4 in 2014, moving up from 16.4 in 2012, which had been an increase from 13.6 reported in 2010.
Median billable hours recorded in 2014 by of counsel respondents were 1,447, up from 1,400 hours reported in 2012.
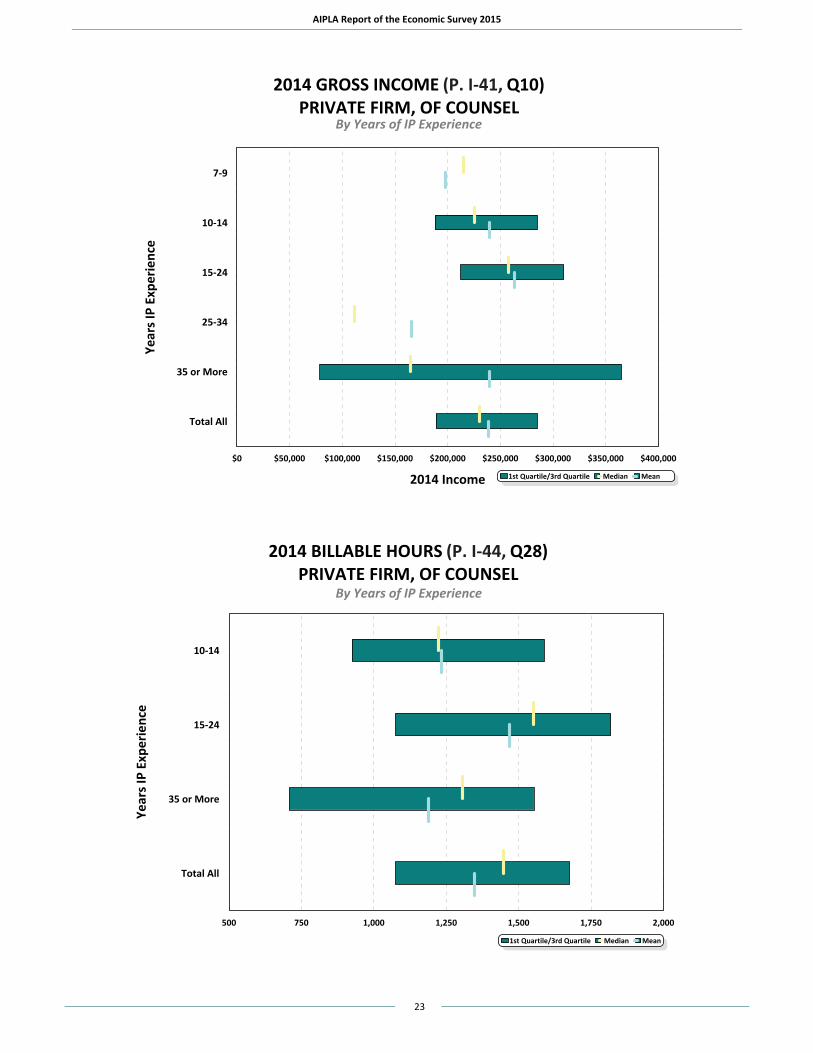
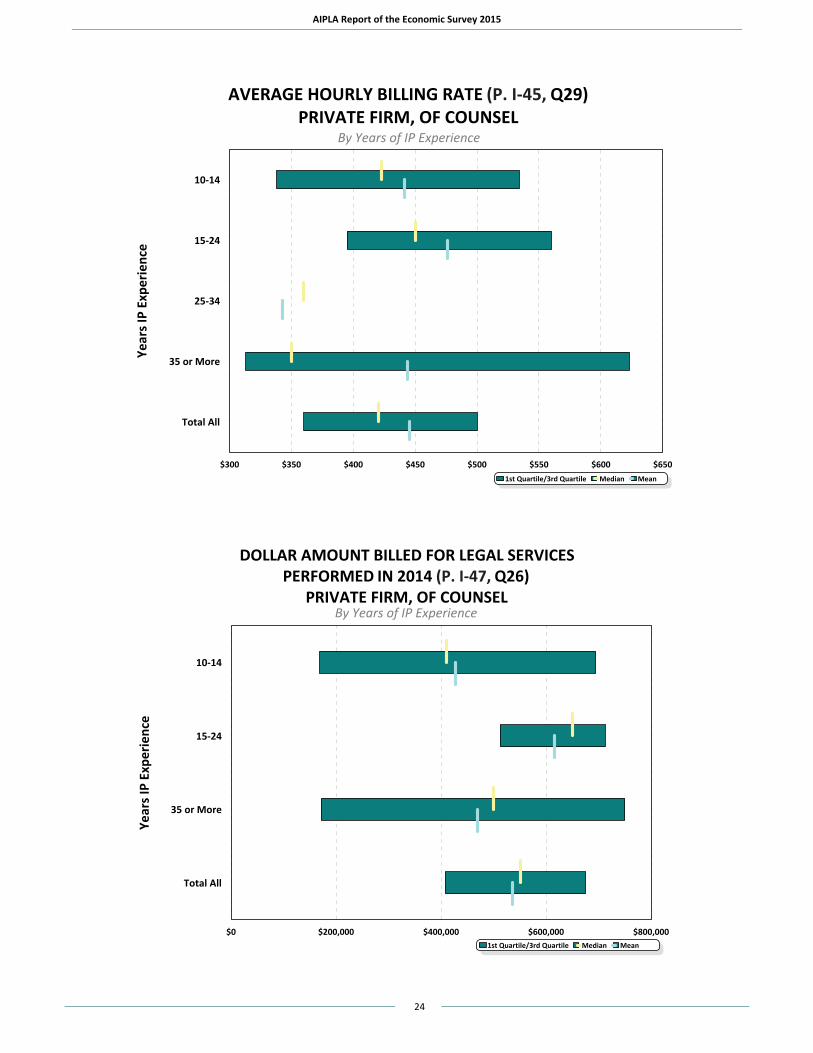
The median average hourly billing rate for private firm of counsel attorneys was $420, up 20.0% from $350 reported in 2012.
Hourly billing was used most often by private firm of counsel attorneys, averaging 82.6% of all services billed. A predetermined fee option was the second most often used, but it was only used 14.8% of the time.
The median dollar amount billed for legal services by private firm of counsel attorneys in 2014 was $551,000.
Of the responding firm of counsel attorneys, the average number of hours spent per week on business development was 5.7.
AIPLA Report of the Economic Survey 2015
23
2014 GROSS INCOME (P. I-41, Q10)PRIVATE FIRM, OF COUNSEL
By Years of IP Experience
7-9
10-14
15-24
25-34
35 or More
Total All
Yea r
s IP
Expe
rienc
e
$0 $50,000 $100,000 $150,000 $200,000 $250,000 $300,000 $350,000 $400,000
2014 Income 1st Quartile/3rd Quartile Median Mean
2014 BILLABLE HOURS (P. I-44, Q28)PRIVATE FIRM, OF COUNSEL
By Years of IP Experience
10-14
15-24
35 or More
Total All
Year
s IP
Expe
rienc
e
500 750 1,000 1,250 1,500 1,750 2,000
1st Quartile/3rd Quartile Median Mean
AIPLA Report of the Economic Survey 2015
24
AVERAGE HOURLY BILLING RATE (P. I-45, Q29)PRIVATE FIRM, OF COUNSEL
By Years of IP Experience
10-14
15-24
25-34
35 or More
Total All
Yea r
s IP
Exp e
rienc
e
$300 $350 $400 $450 $500 $550 $600 $6501st Quartile/3rd Quartile Median Mean
DOLLAR AMOUNT BILLED FOR LEGAL SERVICES PERFORMED IN 2014 (P. I-47, Q26)
PRIVATE FIRM, OF COUNSELBy Years of IP Experience
10-14
15-24
35 or More
Total All
Year
s IP
E xpe
rien c
e
$0 $200,000 $400,000 $600,000 $800,0001st Quartile/3rd Quartile Median Mean
AIPLA Report of the Economic Survey 2015
25
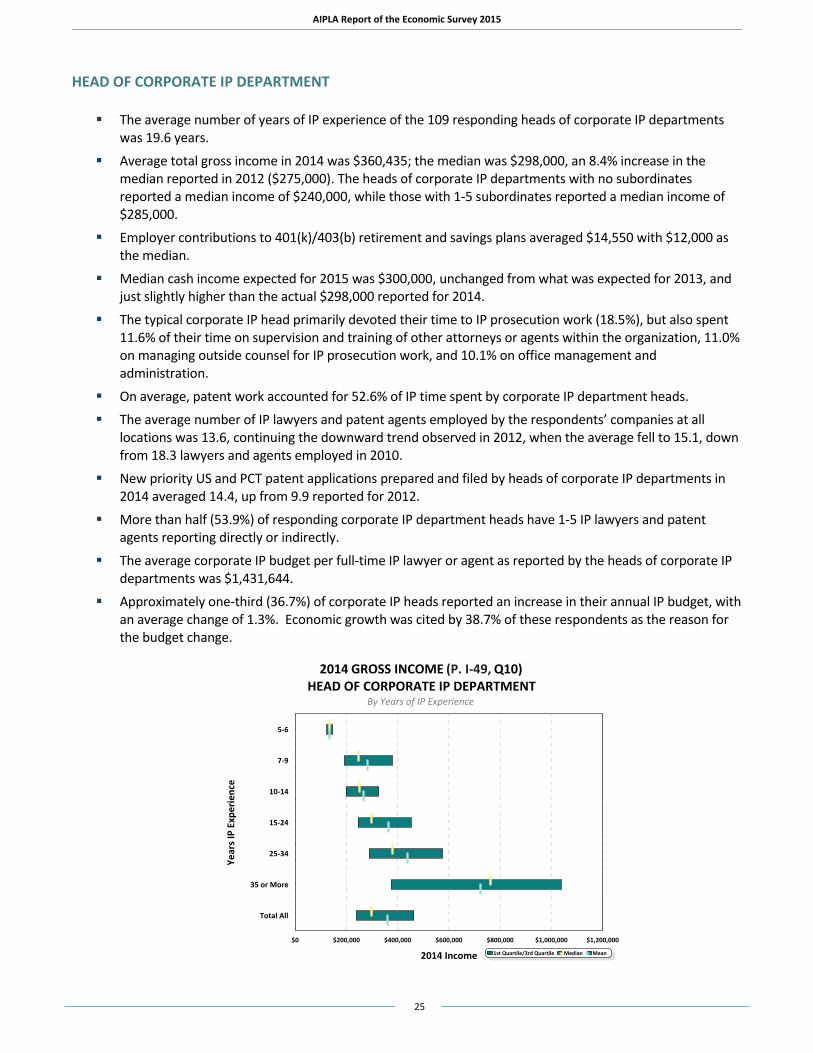
HEAD OF CORPORATE IP DEPARTMENT The average number of years of IP experience of the 109 responding heads of corporate IP departments
was 19.6 years.
Average total gross income in 2014 was $360,435; the median was $298,000, an 8.4% increase in the median reported in 2012 ($275,000). The heads of corporate IP departments with no subordinates reported a median income of $240,000, while those with 1-5 subordinates reported a median income of $285,000.
Employer contributions to 401(k)/403(b) retirement and savings plans averaged $14,550 with $12,000 as the median.
Median cash income expected for 2015 was $300,000, unchanged from what was expected for 2013, and just slightly higher than the actual $298,000 reported for 2014.
The typical corporate IP head primarily devoted their time to IP prosecution work (18.5%), but also spent 11.6% of their time on supervision and training of other attorneys or agents within the organization, 11.0% on managing outside counsel for IP prosecution work, and 10.1% on office management and administration.
On average, patent work accounted for 52.6% of IP time spent by corporate IP department heads. The average number of IP lawyers and patent agents employed by the respondents’ companies at all
locations was 13.6, continuing the downward trend observed in 2012, when the average fell to 15.1, down from 18.3 lawyers and agents employed in 2010.
New priority US and PCT patent applications prepared and filed by heads of corporate IP departments in 2014 averaged 14.4, up from 9.9 reported for 2012.
More than half (53.9%) of responding corporate IP department heads have 1-5 IP lawyers and patent agents reporting directly or indirectly.
The average corporate IP budget per full-time IP lawyer or agent as reported by the heads of corporate IP departments was $1,431,644.
Approximately one-third (36.7%) of corporate IP heads reported an increase in their annual IP budget, with an average change of 1.3%. Economic growth was cited by 38.7% of these respondents as the reason for the budget change.
2014 GROSS INCOME (P. I-49, Q10)HEAD OF CORPORATE IP DEPARTMENT
By Years of IP Experience
5-6
7-9
10-14
15-24
25-34
35 or More
Total All
Year
s IP
Expe
rienc
e
$0 $200,000 $400,000 $600,000 $800,000 $1,000,000 $1,200,000
2014 Income 1st Quartile/3rd Quartile Median Mean
AIPLA Report of the Economic Survey 2015
26
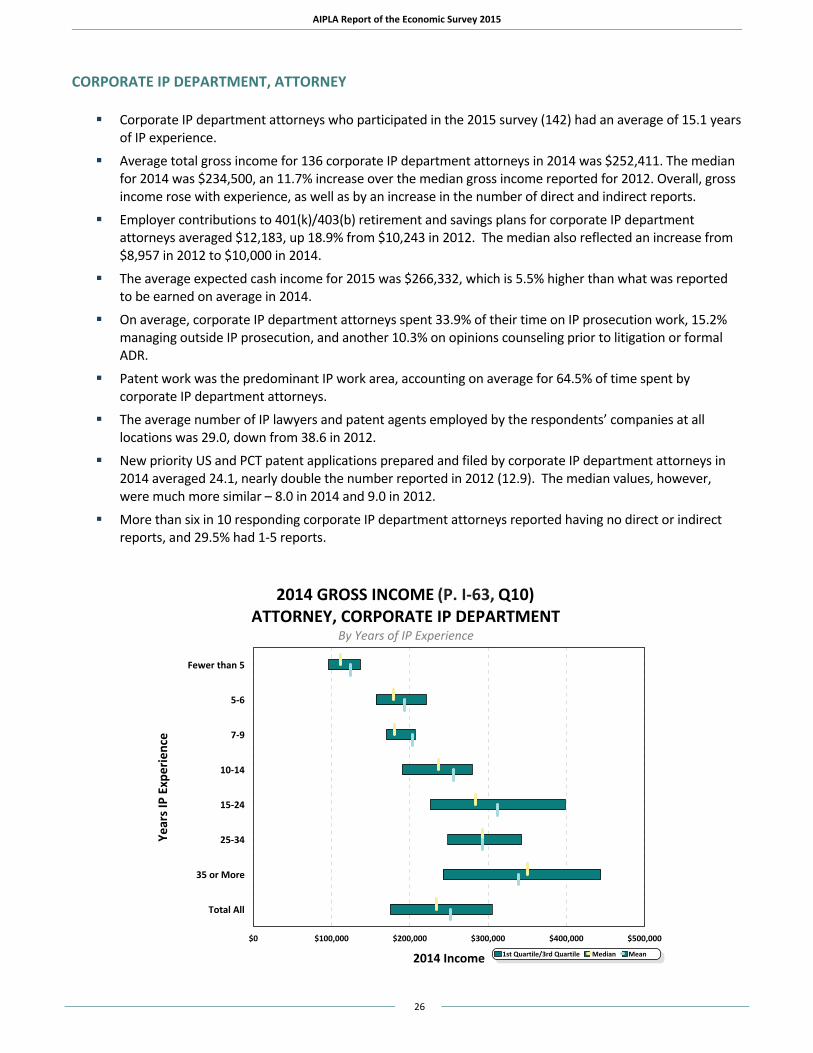
CORPORATE IP DEPARTMENT, ATTORNEY Corporate IP department attorneys who participated in the 2015 survey (142) had an average of 15.1 years
of IP experience.
Average total gross income for 136 corporate IP department attorneys in 2014 was $252,411. The median for 2014 was $234,500, an 11.7% increase over the median gross income reported for 2012. Overall, gross income rose with experience, as well as by an increase in the number of direct and indirect reports.
Employer contributions to 401(k)/403(b) retirement and savings plans for corporate IP department attorneys averaged $12,183, up 18.9% from $10,243 in 2012. The median also reflected an increase from $8,957 in 2012 to $10,000 in 2014.
The average expected cash income for 2015 was $266,332, which is 5.5% higher than what was reported to be earned on average in 2014.
On average, corporate IP department attorneys spent 33.9% of their time on IP prosecution work, 15.2% managing outside IP prosecution, and another 10.3% on opinions counseling prior to litigation or formal ADR.
Patent work was the predominant IP work area, accounting on average for 64.5% of time spent by corporate IP department attorneys.
The average number of IP lawyers and patent agents employed by the respondents’ companies at all locations was 29.0, down from 38.6 in 2012.
New priority US and PCT patent applications prepared and filed by corporate IP department attorneys in 2014 averaged 24.1, nearly double the number reported in 2012 (12.9). The median values, however, were much more similar – 8.0 in 2014 and 9.0 in 2012.
More than six in 10 responding corporate IP department attorneys reported having no direct or indirect reports, and 29.5% had 1-5 reports.
2014 GROSS INCOME (P. I-63, Q10)ATTORNEY, CORPORATE IP DEPARTMENT
By Years of IP Experience
Fewer than 5
5-6
7-9
10-14
15-24
25-34
35 or More
Total All
Year
s IP
E xpe
rien c
e
$0 $100,000 $200,000 $300,000 $400,000 $500,000
2014 Income 1st Quartile/3rd Quartile Median Mean
AIPLA Report of the Economic Survey 2015
27
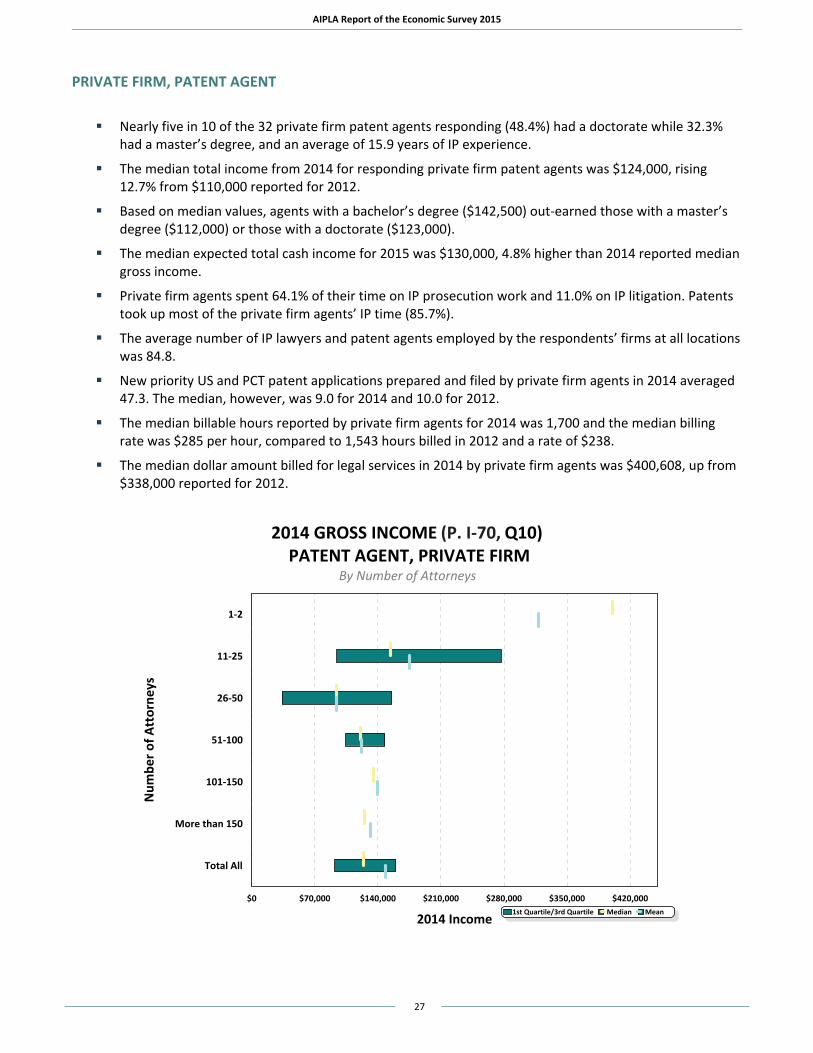
PRIVATE FIRM, PATENT AGENT Nearly five in 10 of the 32 private firm patent agents responding (48.4%) had a doctorate while 32.3%
had a master’s degree, and an average of 15.9 years of IP experience.
The median total income from 2014 for responding private firm patent agents was $124,000, rising 12.7% from $110,000 reported for 2012.
Based on median values, agents with a bachelor’s degree ($142,500) out-earned those with a master’s degree ($112,000) or those with a doctorate ($123,000).
The median expected total cash income for 2015 was $130,000, 4.8% higher than 2014 reported median gross income.
Private firm agents spent 64.1% of their time on IP prosecution work and 11.0% on IP litigation. Patents took up most of the private firm agents’ IP time (85.7%).
The average number of IP lawyers and patent agents employed by the respondents’ firms at all locations was 84.8.
New priority US and PCT patent applications prepared and filed by private firm agents in 2014 averaged 47.3. The median, however, was 9.0 for 2014 and 10.0 for 2012.
The median billable hours reported by private firm agents for 2014 was 1,700 and the median billing rate was $285 per hour, compared to 1,543 hours billed in 2012 and a rate of $238.
The median dollar amount billed for legal services in 2014 by private firm agents was $400,608, up from $338,000 reported for 2012.
2014 GROSS INCOME (P. I-70, Q10) PATENT AGENT, PRIVATE FIRM
By Number of Attorneys
1-2
11-25
26-50
51-100
101-150
More than 150
Total All
Num
ber o
f Att
orn e
ys
$0 $70,000 $140,000 $210,000 $280,000 $350,000 $420,000
2014 Income1st Quartile/3rd Quartile Median Mean
AIPLA Report of the Economic Survey 2015
28
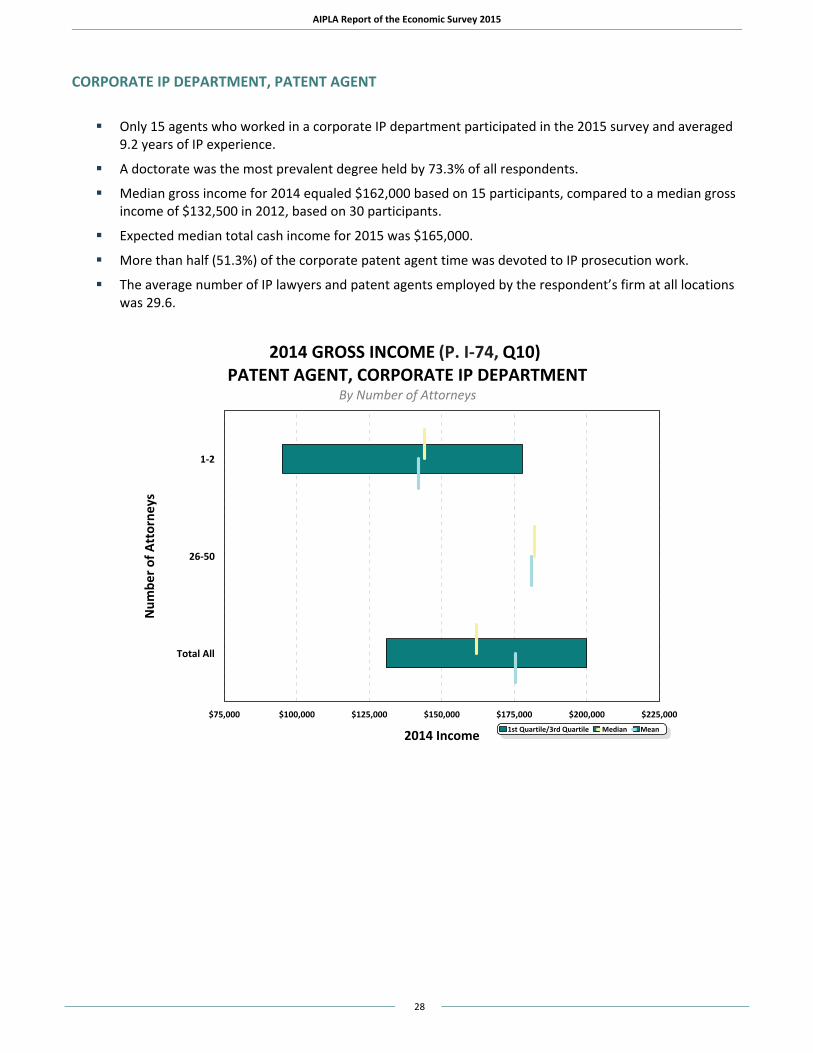
CORPORATE IP DEPARTMENT, PATENT AGENT Only 15 agents who worked in a corporate IP department participated in the 2015 survey and averaged
9.2 years of IP experience.
A doctorate was the most prevalent degree held by 73.3% of all respondents.
Median gross income for 2014 equaled $162,000 based on 15 participants, compared to a median gross income of $132,500 in 2012, based on 30 participants.
Expected median total cash income for 2015 was $165,000.
More than half (51.3%) of the corporate patent agent time was devoted to IP prosecution work.
The average number of IP lawyers and patent agents employed by the respondent’s firm at all locations was 29.6.
2014 GROSS INCOME (P. I-74, Q10) PATENT AGENT, CORPORATE IP DEPARTMENT
By Number of Attorneys
1-2
26-50
Total All
Num
ber o
f Att
o rne
ys
$75,000 $100,000 $125,000 $150,000 $175,000 $200,000 $225,000
2014 Income 1st Quartile/3rd Quartile Median Mean
AIPLA Report of the Economic Survey 2015
29
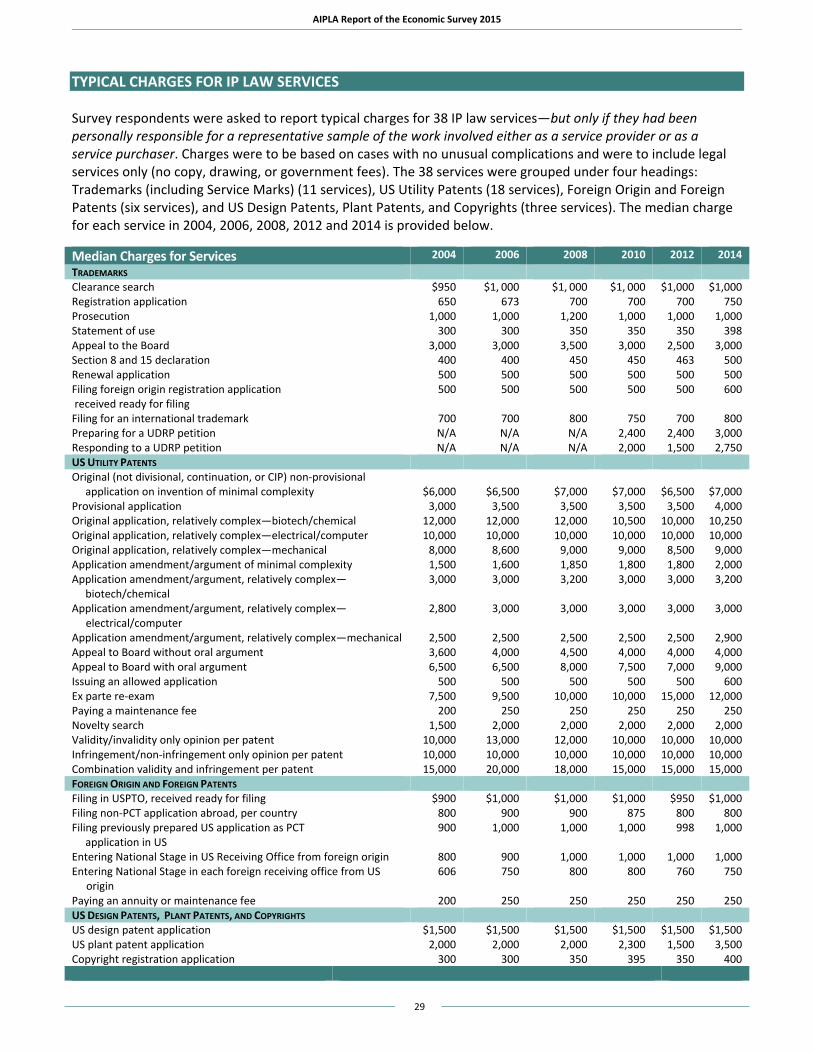
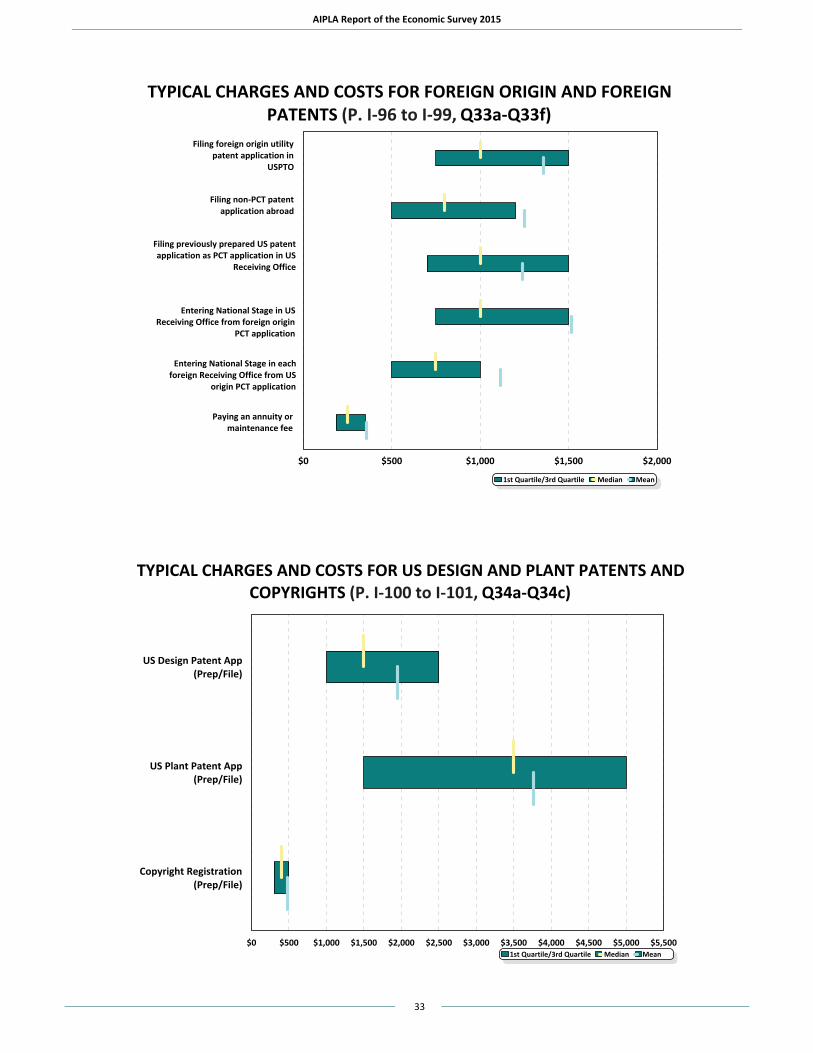
TYPICAL CHARGES FOR IP LAW SERVICES Survey respondents were asked to report typical charges for 38 IP law services—but only if they had been personally responsible for a representative sample of the work involved either as a service provider or as a service purchaser. Charges were to be based on cases with no unusual complications and were to include legal services only (no copy, drawing, or government fees). The 38 services were grouped under four headings: Trademarks (including Service Marks) (11 services), US Utility Patents (18 services), Foreign Origin and Foreign Patents (six services), and US Design Patents, Plant Patents, and Copyrights (three services). The median charge for each service in 2004, 2006, 2008, 2012 and 2014 is provided below. Median Charges for Services 2004 2006 2008 2010 2012 2014 TRADEMARKS Clearance search $950 $1, 000 $1, 000 $1, 000 $1,000 $1,000 Registration application 650 673 700 700 700 750 Prosecution 1,000 1,000 1,200 1,000 1,000 1,000 Statement of use 300 300 350 350 350 398 Appeal to the Board 3,000 3,000 3,500 3,000 2,500 3,000 Section 8 and 15 declaration 400 400 450 450 463 500 Renewal application 500 500 500 500 500 500 Filing foreign origin registration application received ready for filing
500 500 500 500 500 600
Filing for an international trademark 700 700 800 750 700 800 Preparing for a UDRP petition N/A N/A N/A 2,400 2,400 3,000 Responding to a UDRP petition N/A N/A N/A 2,000 1,500 2,750 US UTILITY PATENTS Original (not divisional, continuation, or CIP) non-provisional application on invention of minimal complexity
$6,000
$6,500
$7,000
$7,000
$6,500
$7,000
Provisional application 3,000 3,500 3,500 3,500 3,500 4,000 Original application, relatively complex—biotech/chemical 12,000 12,000 12,000 10,500 10,000 10,250 Original application, relatively complex—electrical/computer 10,000 10,000 10,000 10,000 10,000 10,000 Original application, relatively complex—mechanical 8,000 8,600 9,000 9,000 8,500 9,000 Application amendment/argument of minimal complexity 1,500 1,600 1,850 1,800 1,800 2,000 Application amendment/argument, relatively complex— biotech/chemical
3,000 3,000 3,200 3,000 3,000 3,200
Application amendment/argument, relatively complex—electrical/computer
2,800 3,000 3,000 3,000 3,000 3,000
Application amendment/argument, relatively complex—mechanical 2,500 2,500 2,500 2,500 2,500 2,900 Appeal to Board without oral argument 3,600 4,000 4,500 4,000 4,000 4,000 Appeal to Board with oral argument 6,500 6,500 8,000 7,500 7,000 9,000 Issuing an allowed application 500 500 500 500 500 600 Ex parte re-exam 7,500 9,500 10,000 10,000 15,000 12,000 Paying a maintenance fee 200 250 250 250 250 250 Novelty search 1,500 2,000 2,000 2,000 2,000 2,000 Validity/invalidity only opinion per patent 10,000 13,000 12,000 10,000 10,000 10,000 Infringement/non-infringement only opinion per patent 10,000 10,000 10,000 10,000 10,000 10,000 Combination validity and infringement per patent 15,000 20,000 18,000 15,000 15,000 15,000 FOREIGN ORIGIN AND FOREIGN PATENTS Filing in USPTO, received ready for filing $900 $1,000 $1,000 $1,000 $950 $1,000 Filing non-PCT application abroad, per country 800 900 900 875 800 800 Filing previously prepared US application as PCT application in US
900 1,000 1,000 1,000 998 1,000
Entering National Stage in US Receiving Office from foreign origin 800 900 1,000 1,000 1,000 1,000 Entering National Stage in each foreign receiving office from US
origin 606 750 800 800 760 750
Paying an annuity or maintenance fee 200 250 250 250 250 250 US DESIGN PATENTS, PLANT PATENTS, AND COPYRIGHTS US design patent application $1,500 $1,500 $1,500 $1,500 $1,500 $1,500 US plant patent application 2,000 2,000 2,000 2,300 1,500 3,500 Copyright registration application 300 300 350 395 350 400
AIPLA Report of the Economic Survey 2015
30
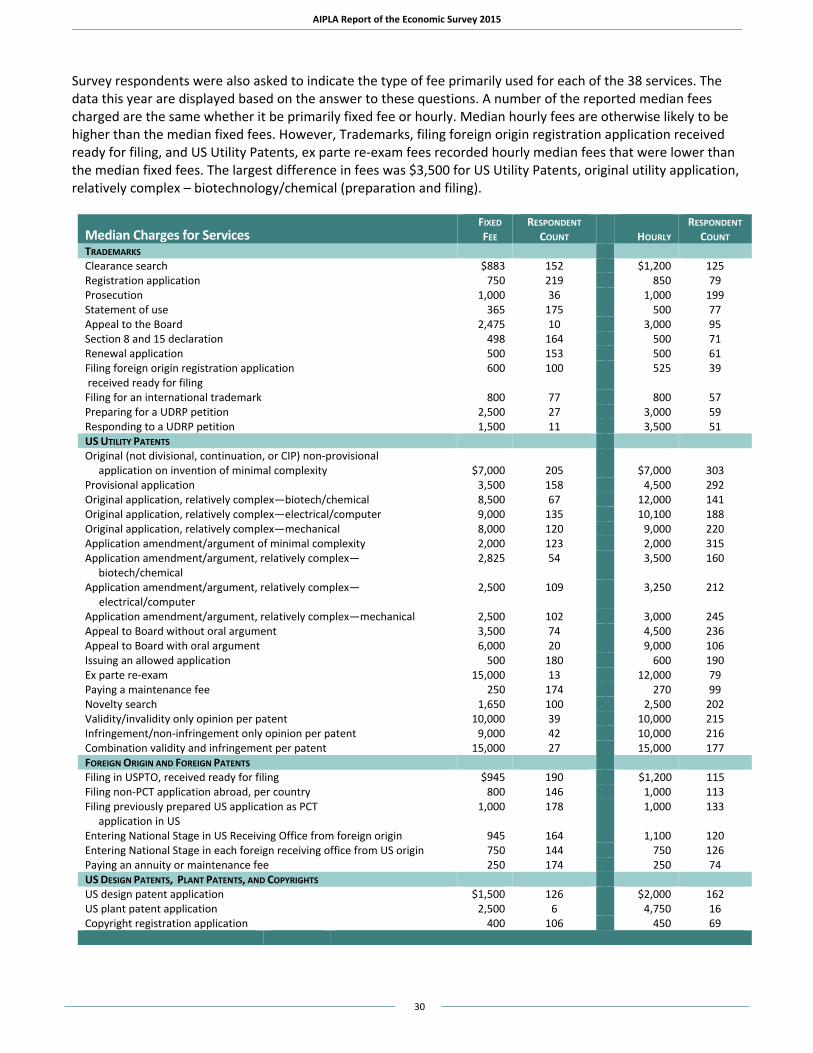
Survey respondents were also asked to indicate the type of fee primarily used for each of the 38 services. The data this year are displayed based on the answer to these questions. A number of the reported median fees charged are the same whether it be primarily fixed fee or hourly. Median hourly fees are otherwise likely to be higher than the median fixed fees. However, Trademarks, filing foreign origin registration application received ready for filing, and US Utility Patents, ex parte re-exam fees recorded hourly median fees that were lower than the median fixed fees. The largest difference in fees was $3,500 for US Utility Patents, original utility application, relatively complex – biotechnology/chemical (preparation and filing).
Median Charges for Services FIXED
FEE RESPONDENT
COUNT
HOURLY RESPONDENT
COUNT TRADEMARKS Clearance search $883 152 $1,200 125 Registration application 750 219 850 79 Prosecution 1,000 36 1,000 199 Statement of use 365 175 500 77 Appeal to the Board 2,475 10 3,000 95 Section 8 and 15 declaration 498 164 500 71 Renewal application 500 153 500 61 Filing foreign origin registration application received ready for filing
600 100 525 39
Filing for an international trademark 800 77 800 57 Preparing for a UDRP petition 2,500 27 3,000 59 Responding to a UDRP petition 1,500 11 3,500 51 US UTILITY PATENTS Original (not divisional, continuation, or CIP) non-provisional application on invention of minimal complexity
$7,000
205
$7,000
303
Provisional application 3,500 158 4,500 292 Original application, relatively complex—biotech/chemical 8,500 67 12,000 141 Original application, relatively complex—electrical/computer 9,000 135 10,100 188 Original application, relatively complex—mechanical 8,000 120 9,000 220 Application amendment/argument of minimal complexity 2,000 123 2,000 315 Application amendment/argument, relatively complex— biotech/chemical
2,825 54 3,500 160
Application amendment/argument, relatively complex—electrical/computer
2,500 109 3,250 212
Application amendment/argument, relatively complex—mechanical 2,500 102 3,000 245 Appeal to Board without oral argument 3,500 74 4,500 236 Appeal to Board with oral argument 6,000 20 9,000 106 Issuing an allowed application 500 180 600 190 Ex parte re-exam 15,000 13 12,000 79 Paying a maintenance fee 250 174 270 99 Novelty search 1,650 100 2,500 202 Validity/invalidity only opinion per patent 10,000 39 10,000 215 Infringement/non-infringement only opinion per patent 9,000 42 10,000 216 Combination validity and infringement per patent 15,000 27 15,000 177 FOREIGN ORIGIN AND FOREIGN PATENTS Filing in USPTO, received ready for filing $945 190 $1,200 115 Filing non-PCT application abroad, per country 800 146 1,000 113 Filing previously prepared US application as PCT application in US
1,000 178 1,000 133
Entering National Stage in US Receiving Office from foreign origin 945 164 1,100 120 Entering National Stage in each foreign receiving office from US origin 750 144 750 126 Paying an annuity or maintenance fee 250 174 250 74 US DESIGN PATENTS, PLANT PATENTS, AND COPYRIGHTS US design patent application $1,500 126 $2,000 162 US plant patent application 2,500 6 4,750 16 Copyright registration application 400 106 450 69
AIPLA Report of the Economic Survey 2015
31
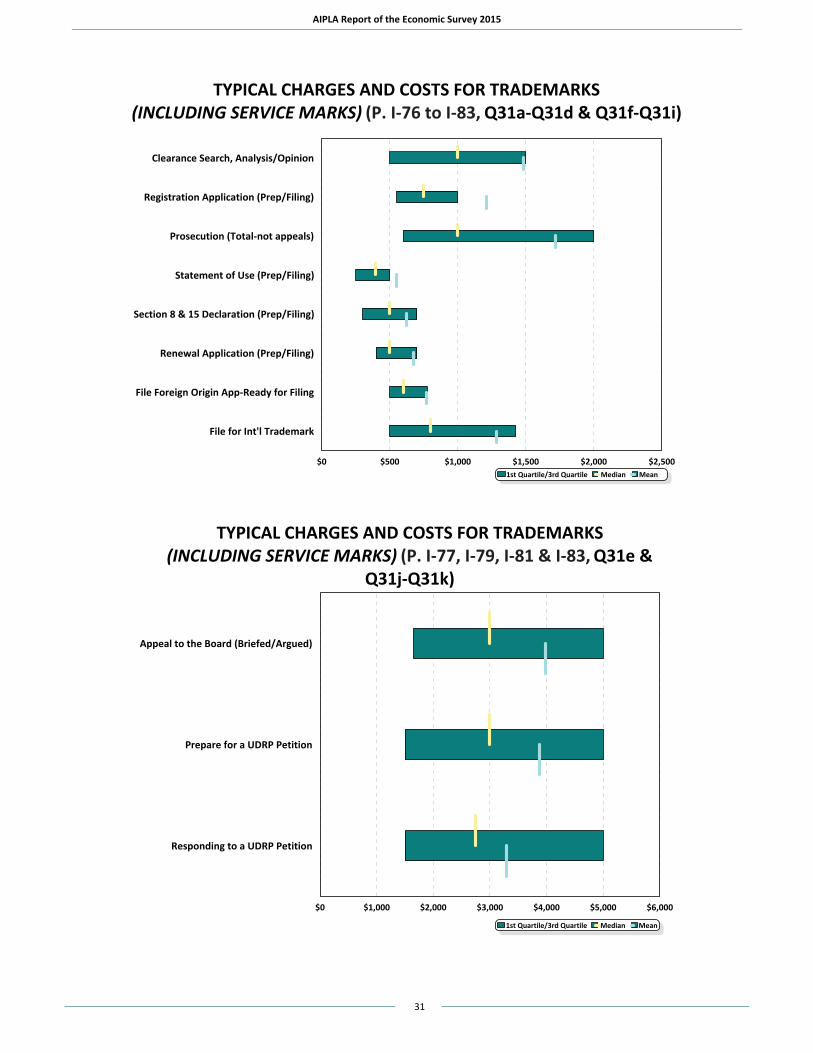
TYPICAL CHARGES AND COSTS FOR TRADEMARKS(INCLUDING SERVICE MARKS) (P. I-76 to I-83, Q31a-Q31d & Q31f-Q31i)
Clearance Search, Analysis/Opinion
Registration Application (Prep/Filing)
Prosecution (Total-not appeals)
Statement of Use (Prep/Filing)
Section 8 & 15 Declaration (Prep/Filing)
Renewal Application (Prep/Filing)
File Foreign Origin App-Ready for Filing
File for Int'l Trademark
$0 $500 $1,000 $1,500 $2,000 $2,5001st Quartile/3rd Quartile Median Mean
TYPICAL CHARGES AND COSTS FOR TRADEMARKS(INCLUDING SERVICE MARKS) (P. I-77, I-79, I-81 & I-83, Q31e &
Q31j-Q31k)
Appeal to the Board (Briefed/Argued)
Prepare for a UDRP Petition
Responding to a UDRP Petition
$0 $1,000 $2,000 $3,000 $4,000 $5,000 $6,000
1st Quartile/3rd Quartile Median Mean
AIPLA Report of the Economic Survey 2015
32
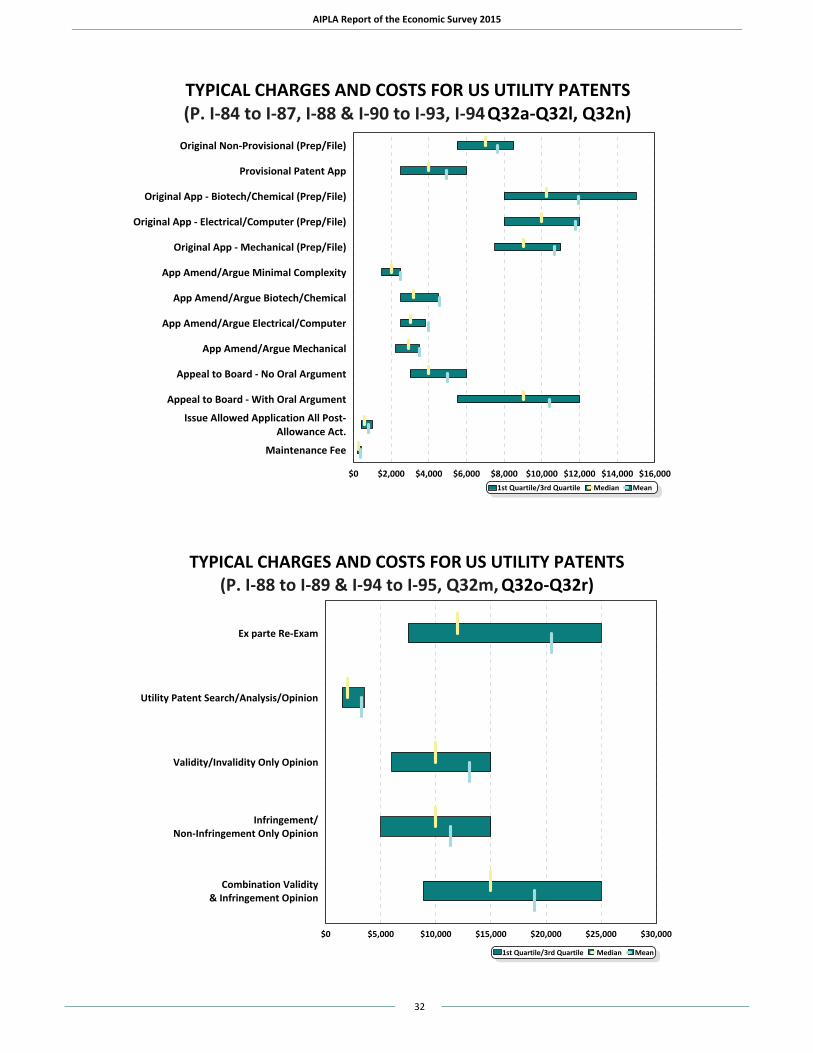
TYPICAL CHARGES AND COSTS FOR US UTILITY PATENTS (P. I-84 to I-87, I-88 & I-90 to I-93, I-94 Q32a-Q32l, Q32n)
Original Non-Provisional (Prep/File)
Provisional Patent App
Original App - Biotech/Chemical (Prep/File)
Original App - Electrical/Computer (Prep/File)
Original App - Mechanical (Prep/File)
App Amend/Argue Minimal Complexity
App Amend/Argue Biotech/Chemical
App Amend/Argue Electrical/Computer
App Amend/Argue Mechanical
Appeal to Board - No Oral Argument
Appeal to Board - With Oral Argument
Issue Allowed Application All Post-Allowance Act.
Maintenance Fee
$0 $2,000 $4,000 $6,000 $8,000 $10,000 $12,000 $14,000 $16,0001st Quartile/3rd Quartile Median Mean
TYPICAL CHARGES AND COSTS FOR US UTILITY PATENTS (P. I-88 to I-89 & I-94 to I-95, Q32m, Q32o-Q32r)
Ex parte Re-Exam
Utility Patent Search/Analysis/Opinion
Validity/Invalidity Only Opinion
Infringement/Non-Infringement Only Opinion
Combination Validity& Infringement Opinion
$0 $5,000 $10,000 $15,000 $20,000 $25,000 $30,000
1st Quartile/3rd Quartile Median Mean
AIPLA Report of the Economic Survey 2015
33
TYPICAL CHARGES AND COSTS FOR FOREIGN ORIGIN AND FOREIGN PATENTS (P. I-96 to I-99, Q33a-Q33f)
$0 $500 $1,000 $1,500 $2,000
1st Quartile/3rd Quartile Median Mean
Filing foreign origin utility patent application in
USPTO
Filing non-PCT patent application abroad
Filing previously prepared US patent application as PCT application in US
Receiving Office
Entering National Stage in US Receiving Office from foreign origin
PCT application
Entering National Stage in each foreign Receiving Office from US
origin PCT application
Paying an annuity or maintenance fee
TYPICAL CHARGES AND COSTS FOR US DESIGN AND PLANT PATENTS AND COPYRIGHTS (P. I-100 to I-101, Q34a-Q34c)
US Design Patent App(Prep/File)
US Plant Patent App(Prep/File)
Copyright Registration(Prep/File)
$0 $500 $1,000 $1,500 $2,000 $2,500 $3,000 $3,500 $4,000 $4,500 $5,000 $5,5001st Quartile/3rd Quartile Median Mean
AIPLA Report of the Economic Survey 2015
34
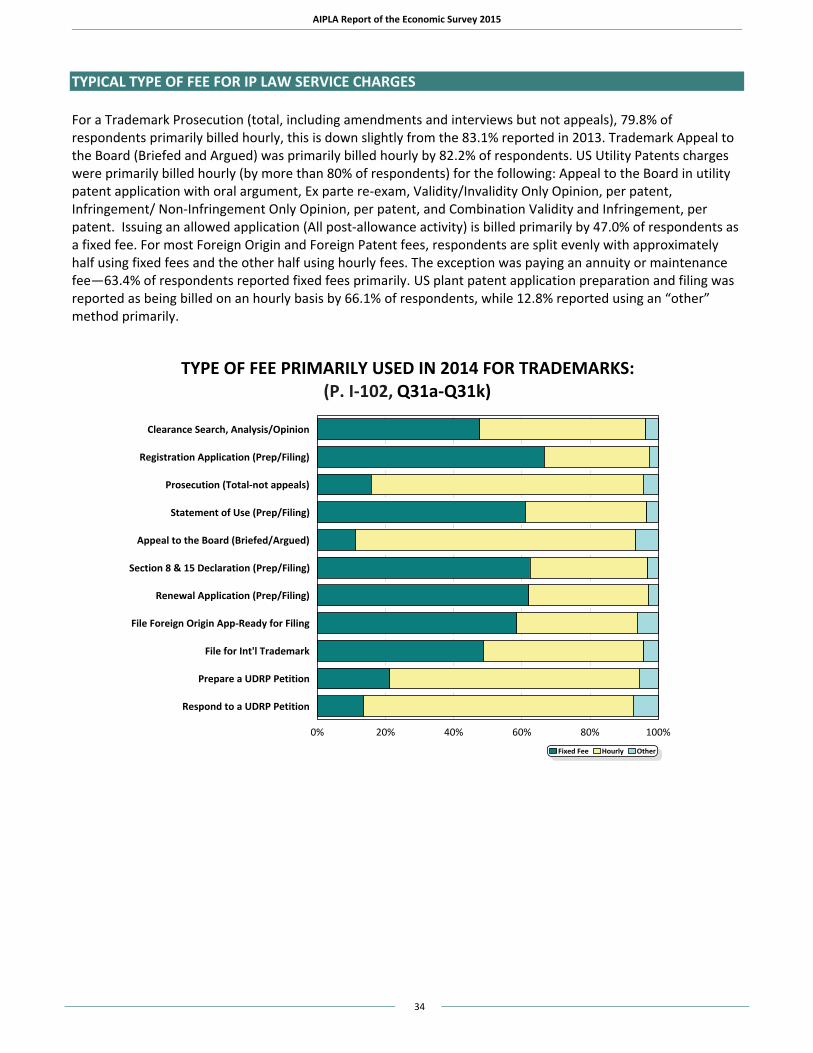
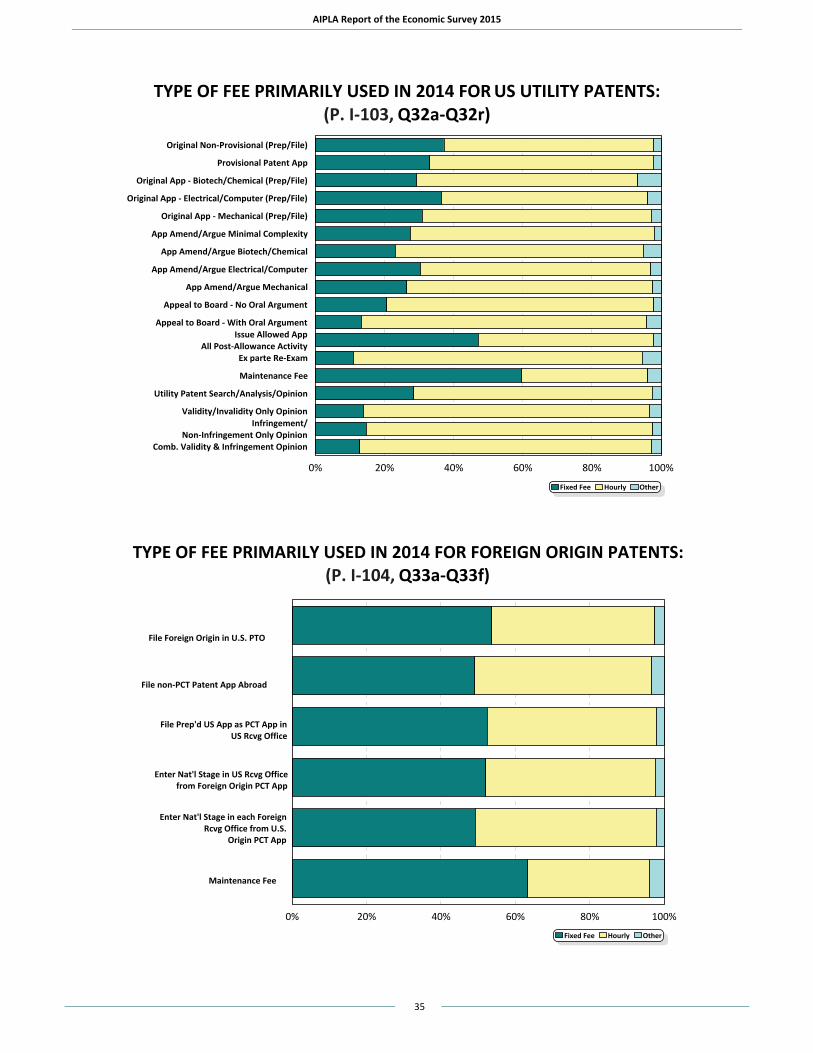
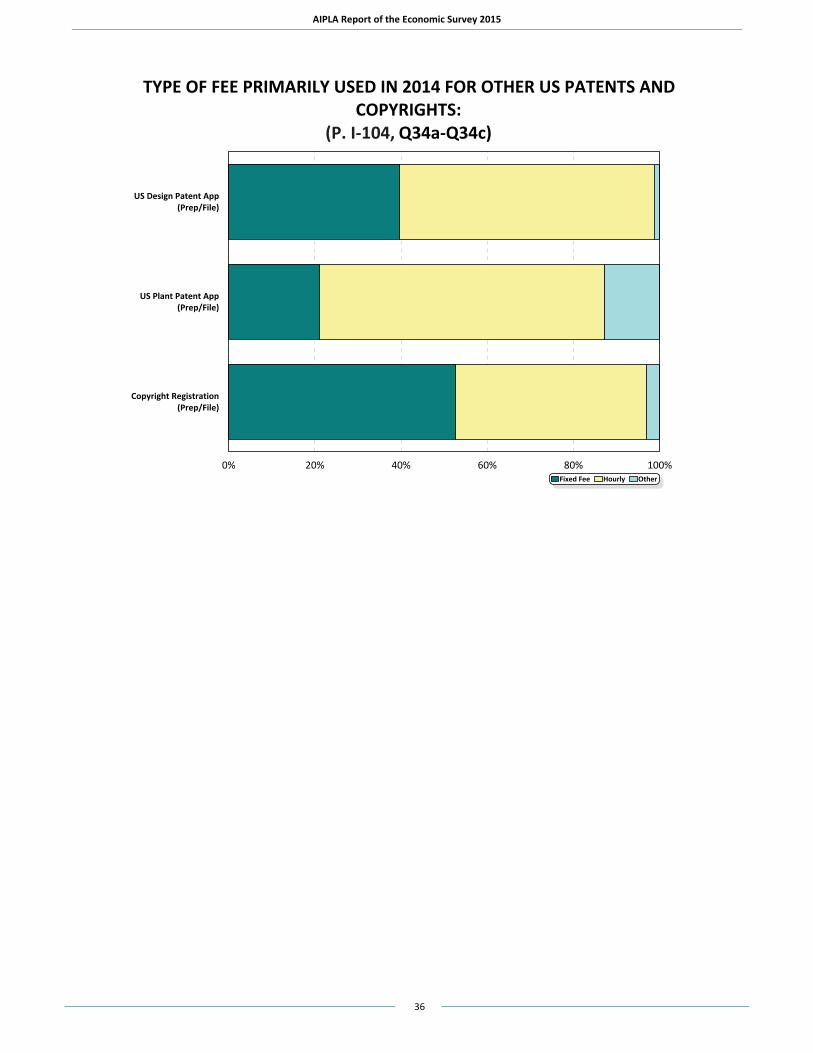
TYPICAL TYPE OF FEE FOR IP LAW SERVICE CHARGES For a Trademark Prosecution (total, including amendments and interviews but not appeals), 79.8% of respondents primarily billed hourly, this is down slightly from the 83.1% reported in 2013. Trademark Appeal to the Board (Briefed and Argued) was primarily billed hourly by 82.2% of respondents. US Utility Patents charges were primarily billed hourly (by more than 80% of respondents) for the following: Appeal to the Board in utility patent application with oral argument, Ex parte re-exam, Validity/Invalidity Only Opinion, per patent, Infringement/ Non-Infringement Only Opinion, per patent, and Combination Validity and Infringement, per patent. Issuing an allowed application (All post-allowance activity) is billed primarily by 47.0% of respondents as a fixed fee. For most Foreign Origin and Foreign Patent fees, respondents are split evenly with approximately half using fixed fees and the other half using hourly fees. The exception was paying an annuity or maintenance fee—63.4% of respondents reported fixed fees primarily. US plant patent application preparation and filing was reported as being billed on an hourly basis by 66.1% of respondents, while 12.8% reported using an “other” method primarily.
TYPE OF FEE PRIMARILY USED IN 2014 FOR TRADEMARKS:(P. I-102, Q31a-Q31k)
Clearance Search, Analysis/Opinion
Registration Application (Prep/Filing)
Prosecution (Total-not appeals)
Statement of Use (Prep/Filing)
Appeal to the Board (Briefed/Argued)
Section 8 & 15 Declaration (Prep/Filing)
Renewal Application (Prep/Filing)
File Foreign Origin App-Ready for Filing
File for Int'l Trademark
Prepare a UDRP Petition
Respond to a UDRP Petition
0% 20% 40% 60% 80% 100%
Fixed Fee Hourly Other
AIPLA Report of the Economic Survey 2015
35
TYPE OF FEE PRIMARILY USED IN 2014 FOR US UTILITY PATENTS:(P. I-103, Q32a-Q32r)
Original Non-Provisional (Prep/File)
Provisional Patent App
Original App - Biotech/Chemical (Prep/File)
Original App - Electrical/Computer (Prep/File)
Original App - Mechanical (Prep/File)
App Amend/Argue Minimal Complexity
App Amend/Argue Biotech/Chemical
App Amend/Argue Electrical/Computer
App Amend/Argue Mechanical
Appeal to Board - No Oral Argument
Appeal to Board - With Oral ArgumentIssue Allowed App
All Post-Allowance ActivityEx parte Re-Exam
Maintenance Fee
Utility Patent Search/Analysis/Opinion
Validity/Invalidity Only OpinionInfringement/
Non-Infringement Only OpinionComb. Validity & Infringement Opinion
0% 20% 40% 60% 80% 100%
Fixed Fee Hourly Other
TYPE OF FEE PRIMARILY USED IN 2014 FOR FOREIGN ORIGIN PATENTS:(P. I-104, Q33a-Q33f)
0% 20% 40% 60% 80% 100%
Fixed Fee Hourly Other
File Foreign Origin in U.S. PTO
File non-PCT Patent App Abroad
Enter Nat'l Stage in US Rcvg Officefrom Foreign Origin PCT App
Enter Nat'l Stage in each Foreign Rcvg Office from U.S.
Origin PCT App
Maintenance Fee
File Prep'd US App as PCT App inUS Rcvg Office
AIPLA Report of the Economic Survey 2015
36
TYPE OF FEE PRIMARILY USED IN 2014 FOR OTHER US PATENTS AND COPYRIGHTS:
(P. I-104, Q34a-Q34c)
US Design Patent App(Prep/File)
US Plant Patent App(Prep/File)
Copyright Registration(Prep/File)
0% 20% 40% 60% 80% 100%Fixed Fee Hourly Other
AIPLA Report of the Economic Survey 2015
37
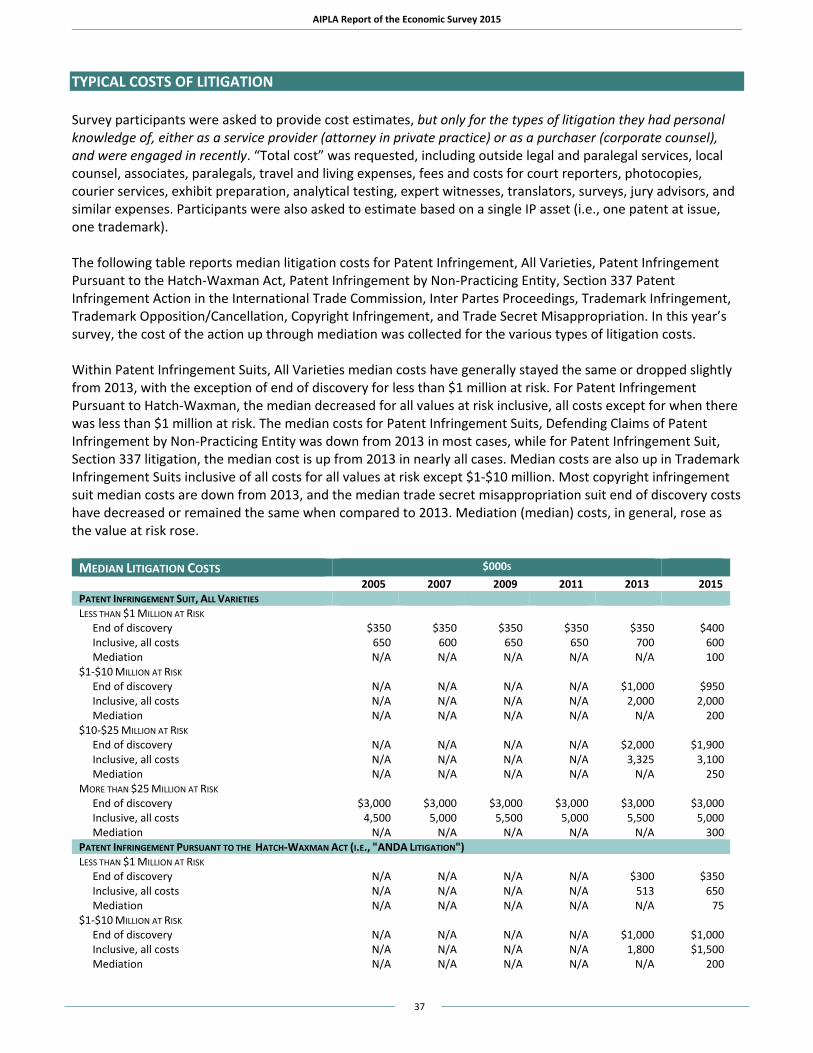
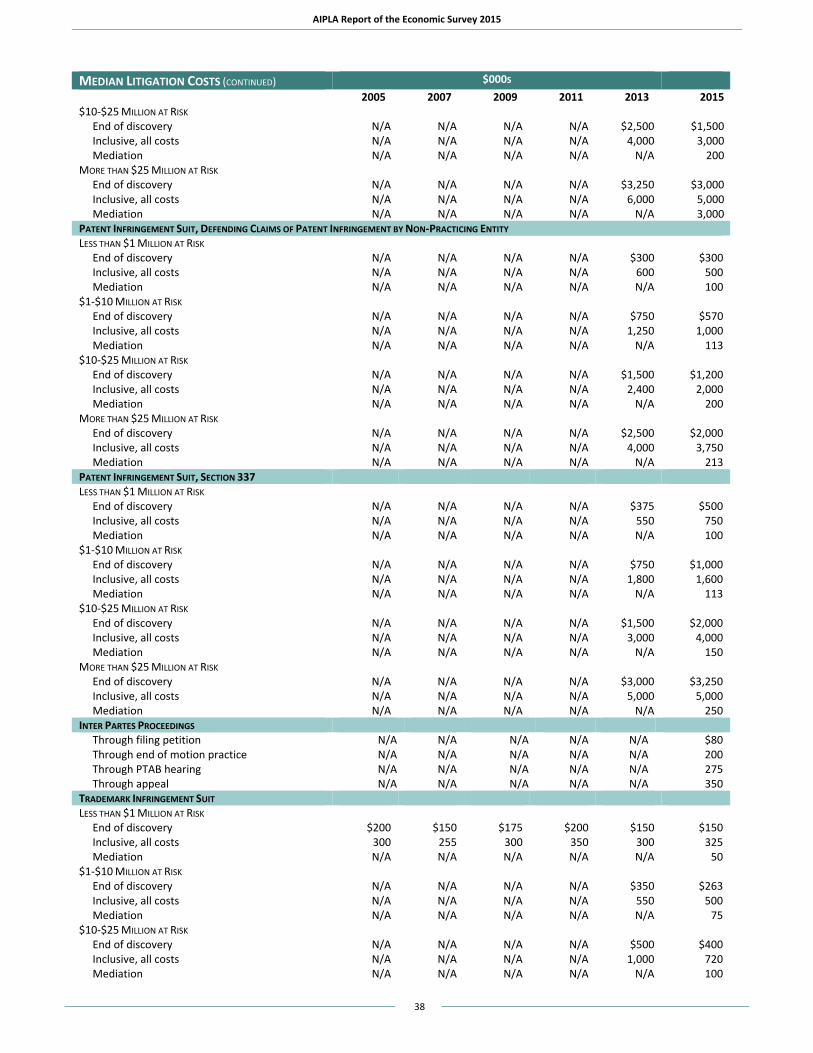
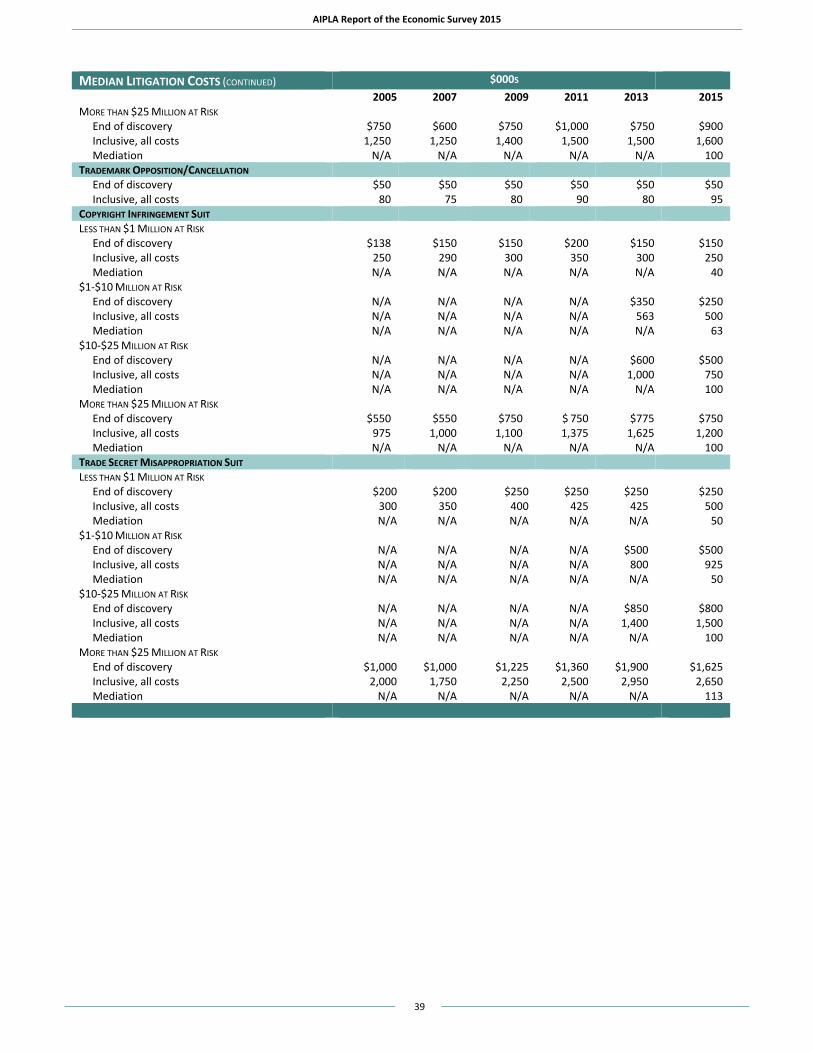
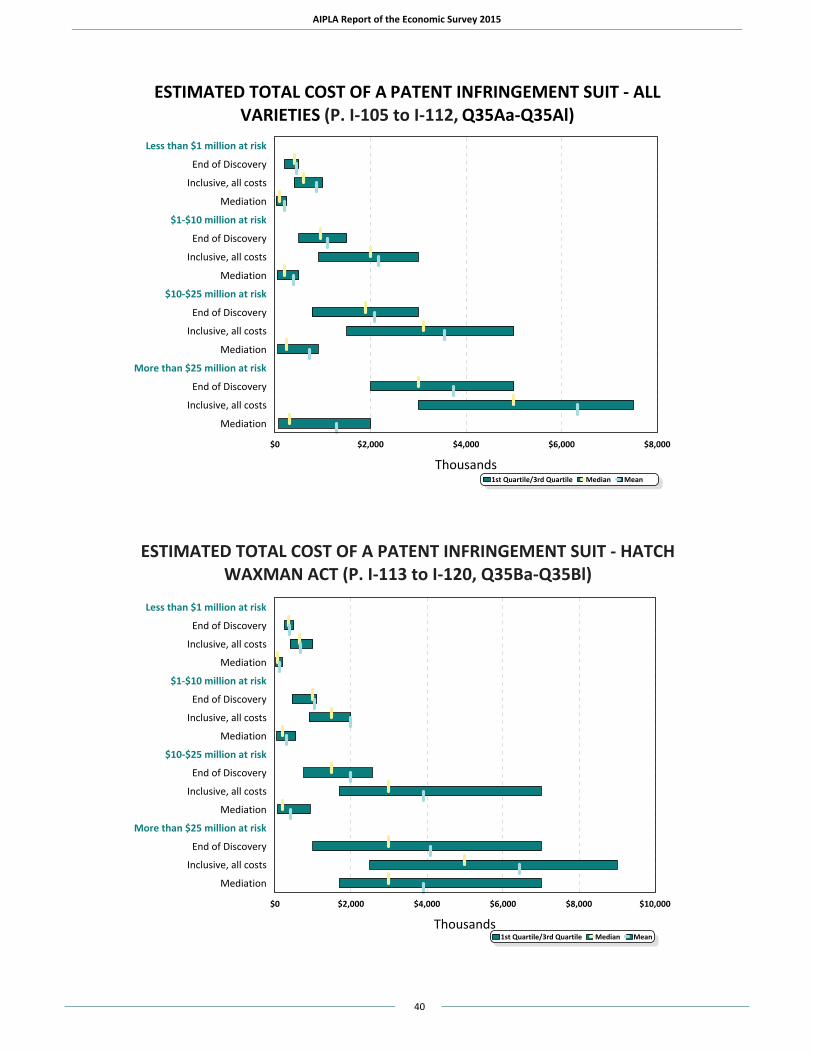
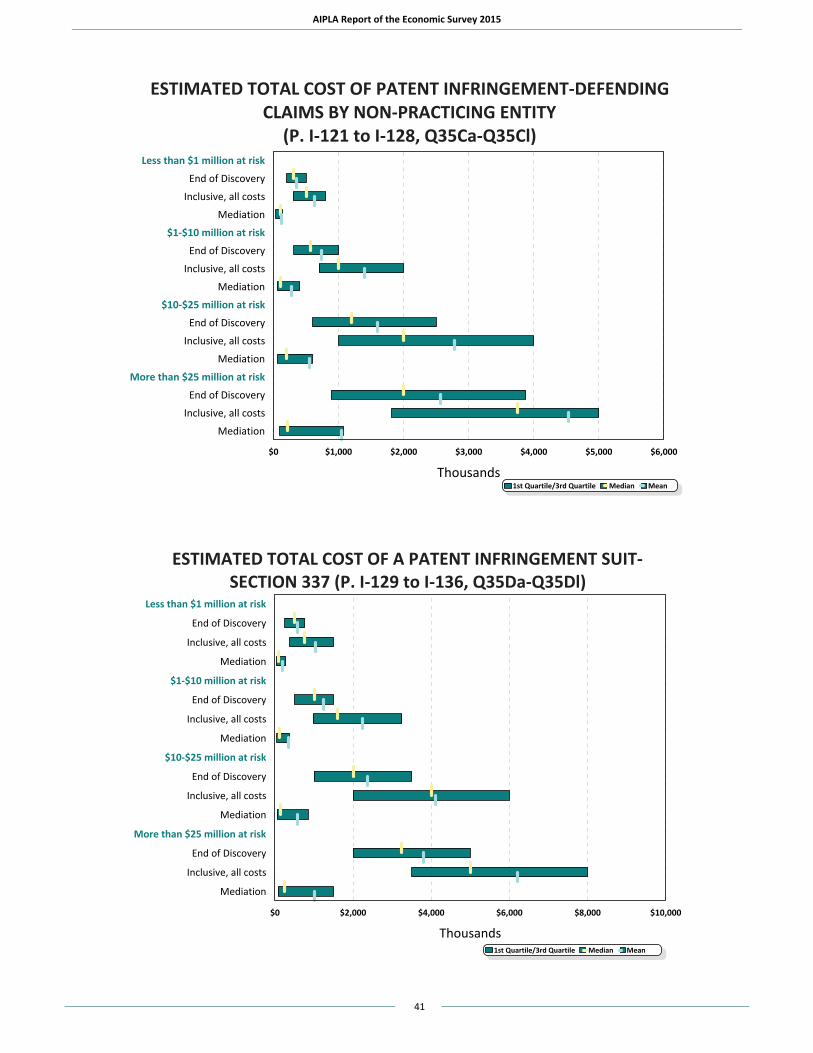
TYPICAL COSTS OF LITIGATION Survey participants were asked to provide cost estimates, but only for the types of litigation they had personal knowledge of, either as a service provider (attorney in private practice) or as a purchaser (corporate counsel), and were engaged in recently. “Total cost” was requested, including outside legal and paralegal services, local counsel, associates, paralegals, travel and living expenses, fees and costs for court reporters, photocopies, courier services, exhibit preparation, analytical testing, expert witnesses, translators, surveys, jury advisors, and similar expenses. Participants were also asked to estimate based on a single IP asset (i.e., one patent at issue, one trademark). The following table reports median litigation costs for Patent Infringement, All Varieties, Patent Infringement Pursuant to the Hatch-Waxman Act, Patent Infringement by Non-Practicing Entity, Section 337 Patent Infringement Action in the International Trade Commission, Inter Partes Proceedings, Trademark Infringement, Trademark Opposition/Cancellation, Copyright Infringement, and Trade Secret Misappropriation. In this year’s survey, the cost of the action up through mediation was collected for the various types of litigation costs. Within Patent Infringement Suits, All Varieties median costs have generally stayed the same or dropped slightly from 2013, with the exception of end of discovery for less than $1 million at risk. For Patent Infringement Pursuant to Hatch-Waxman, the median decreased for all values at risk inclusive, all costs except for when there was less than $1 million at risk. The median costs for Patent Infringement Suits, Defending Claims of Patent Infringement by Non-Practicing Entity was down from 2013 in most cases, while for Patent Infringement Suit, Section 337 litigation, the median cost is up from 2013 in nearly all cases. Median costs are also up in Trademark Infringement Suits inclusive of all costs for all values at risk except $1-$10 million. Most copyright infringement suit median costs are down from 2013, and the median trade secret misappropriation suit end of discovery costs have decreased or remained the same when compared to 2013. Mediation (median) costs, in general, rose as the value at risk rose.
MEDIAN LITIGATION COSTS $000S 2005 2007 2009 2011 2013 2015
PATENT INFRINGEMENT SUIT, ALL VARIETIES LESS THAN $1 MILLION AT RISK End of discovery $350 $350 $350 $350 $350 $400 Inclusive, all costs 650 600 650 650 700 600 Mediation N/A N/A N/A N/A N/A 100 $1-$10 MILLION AT RISK End of discovery N/A N/A N/A N/A $1,000 $950 Inclusive, all costs N/A N/A N/A N/A 2,000 2,000 Mediation N/A N/A N/A N/A N/A 200 $10-$25 MILLION AT RISK End of discovery N/A N/A N/A N/A $2,000 $1,900 Inclusive, all costs N/A N/A N/A N/A 3,325 3,100 Mediation N/A N/A N/A N/A N/A 250 MORE THAN $25 MILLION AT RISK End of discovery $3,000 $3,000 $3,000 $3,000 $3,000 $3,000 Inclusive, all costs 4,500 5,000 5,500 5,000 5,500 5,000 Mediation N/A N/A N/A N/A N/A 300 PATENT INFRINGEMENT PURSUANT TO THE HATCH-WAXMAN ACT (I.E., "ANDA LITIGATION") LESS THAN $1 MILLION AT RISK End of discovery N/A N/A N/A N/A $300 $350 Inclusive, all costs N/A N/A N/A N/A 513 650 Mediation N/A N/A N/A N/A N/A 75 $1-$10 MILLION AT RISK End of discovery N/A N/A N/A N/A $1,000 $1,000 Inclusive, all costs N/A N/A N/A N/A 1,800 $1,500 Mediation N/A N/A N/A N/A N/A 200
AIPLA Report of the Economic Survey 2015
38
MEDIAN LITIGATION COSTS (CONTINUED) $000S 2005 2007 2009 2011 2013 2015
$10-$25 MILLION AT RISK End of discovery N/A N/A N/A N/A $2,500 $1,500 Inclusive, all costs N/A N/A N/A N/A 4,000 3,000 Mediation N/A N/A N/A N/A N/A 200 MORE THAN $25 MILLION AT RISK End of discovery N/A N/A N/A N/A $3,250 $3,000 Inclusive, all costs N/A N/A N/A N/A 6,000 5,000 Mediation N/A N/A N/A N/A N/A 3,000 PATENT INFRINGEMENT SUIT, DEFENDING CLAIMS OF PATENT INFRINGEMENT BY NON-PRACTICING ENTITY LESS THAN $1 MILLION AT RISK End of discovery N/A N/A N/A N/A $300 $300 Inclusive, all costs N/A N/A N/A N/A 600 500 Mediation N/A N/A N/A N/A N/A 100 $1-$10 MILLION AT RISK End of discovery N/A N/A N/A N/A $750 $570 Inclusive, all costs N/A N/A N/A N/A 1,250 1,000 Mediation N/A N/A N/A N/A N/A 113 $10-$25 MILLION AT RISK End of discovery N/A N/A N/A N/A $1,500 $1,200 Inclusive, all costs N/A N/A N/A N/A 2,400 2,000 Mediation N/A N/A N/A N/A N/A 200 MORE THAN $25 MILLION AT RISK End of discovery N/A N/A N/A N/A $2,500 $2,000 Inclusive, all costs N/A N/A N/A N/A 4,000 3,750 Mediation N/A N/A N/A N/A N/A 213 PATENT INFRINGEMENT SUIT, SECTION 337 LESS THAN $1 MILLION AT RISK End of discovery N/A N/A N/A N/A $375 $500 Inclusive, all costs N/A N/A N/A N/A 550 750 Mediation N/A N/A N/A N/A N/A 100 $1-$10 MILLION AT RISK End of discovery N/A N/A N/A N/A $750 $1,000 Inclusive, all costs N/A N/A N/A N/A 1,800 1,600 Mediation N/A N/A N/A N/A N/A 113 $10-$25 MILLION AT RISK End of discovery N/A N/A N/A N/A $1,500 $2,000 Inclusive, all costs N/A N/A N/A N/A 3,000 4,000 Mediation N/A N/A N/A N/A N/A 150 MORE THAN $25 MILLION AT RISK End of discovery N/A N/A N/A N/A $3,000 $3,250 Inclusive, all costs N/A N/A N/A N/A 5,000 5,000 Mediation N/A N/A N/A N/A N/A 250 INTER PARTES PROCEEDINGS Through filing petition N/A N/A N/A N/A N/A $80 Through end of motion practice N/A N/A N/A N/A N/A 200
Through PTAB hearing N/A N/A N/A N/A N/A 275 Through appeal N/A N/A N/A N/A N/A 350 TRADEMARK INFRINGEMENT SUIT LESS THAN $1 MILLION AT RISK End of discovery $200 $150 $175 $200 $150 $150 Inclusive, all costs 300 255 300 350 300 325 Mediation N/A N/A N/A N/A N/A 50 $1-$10 MILLION AT RISK End of discovery N/A N/A N/A N/A $350 $263 Inclusive, all costs N/A N/A N/A N/A 550 500 Mediation N/A N/A N/A N/A N/A 75 $10-$25 MILLION AT RISK End of discovery N/A N/A N/A N/A $500 $400 Inclusive, all costs N/A N/A N/A N/A 1,000 720 Mediation N/A N/A N/A N/A N/A 100
AIPLA Report of the Economic Survey 2015
39
MEDIAN LITIGATION COSTS (CONTINUED) $000S 2005 2007 2009 2011 2013 2015 MORE THAN $25 MILLION AT RISK End of discovery $750 $600 $750 $1,000 $750 $900 Inclusive, all costs 1,250 1,250 1,400 1,500 1,500 1,600 Mediation N/A N/A N/A N/A N/A 100 TRADEMARK OPPOSITION/CANCELLATION End of discovery $50 $50 $50 $50 $50 $50 Inclusive, all costs 80 75 80 90 80 95 COPYRIGHT INFRINGEMENT SUIT LESS THAN $1 MILLION AT RISK End of discovery $138 $150 $150 $200 $150 $150 Inclusive, all costs 250 290 300 350 300 250 Mediation N/A N/A N/A N/A N/A 40 $1-$10 MILLION AT RISK End of discovery N/A N/A N/A N/A $350 $250 Inclusive, all costs N/A N/A N/A N/A 563 500 Mediation N/A N/A N/A N/A N/A 63 $10-$25 MILLION AT RISK End of discovery N/A N/A N/A N/A $600 $500 Inclusive, all costs N/A N/A N/A N/A 1,000 750 Mediation N/A N/A N/A N/A N/A 100 MORE THAN $25 MILLION AT RISK End of discovery $550 $550 $750 $ 750 $775 $750 Inclusive, all costs 975 1,000 1,100 1,375 1,625 1,200 Mediation N/A N/A N/A N/A N/A 100 TRADE SECRET MISAPPROPRIATION SUIT LESS THAN $1 MILLION AT RISK End of discovery $200 $200 $250 $250 $250 $250 Inclusive, all costs 300 350 400 425 425 500 Mediation N/A N/A N/A N/A N/A 50 $1-$10 MILLION AT RISK End of discovery N/A N/A N/A N/A $500 $500 Inclusive, all costs N/A N/A N/A N/A 800 925 Mediation N/A N/A N/A N/A N/A 50 $10-$25 MILLION AT RISK End of discovery N/A N/A N/A N/A $850 $800 Inclusive, all costs N/A N/A N/A N/A 1,400 1,500 Mediation N/A N/A N/A N/A N/A 100 MORE THAN $25 MILLION AT RISK End of discovery $1,000 $1,000 $1,225 $1,360 $1,900 $1,625 Inclusive, all costs 2,000 1,750 2,250 2,500 2,950 2,650 Mediation N/A N/A N/A N/A N/A 113
AIPLA Report of the Economic Survey 2015
40
ESTIMATED TOTAL COST OF A PATENT INFRINGEMENT SUIT - ALL VARIETIES (P. I-105 to I-112, Q35Aa-Q35Al)
Less than $1 million at risk
End of Discovery
Inclusive, all costs
Mediation
$1-$10 million at risk
End of Discovery
Inclusive, all costs
Mediation
$10-$25 million at risk
End of Discovery
Inclusive, all costs
Mediation
More than $25 million at risk
End of Discovery
Inclusive, all costs
Mediation
$0 $2,000 $4,000 $6,000 $8,000
Thousands1st Quartile/3rd Quartile Median Mean
ESTIMATED TOTAL COST OF A PATENT INFRINGEMENT SUIT - HATCH WAXMAN ACT (P. I-113 to I-120, Q35Ba-Q35Bl)
Less than $1 million at risk
End of Discovery
Inclusive, all costs
Mediation
$1-$10 million at risk
End of Discovery
Inclusive, all costs
Mediation
$10-$25 million at risk
End of Discovery
Inclusive, all costs
Mediation
More than $25 million at risk
End of Discovery
Inclusive, all costs
Mediation
$0 $2,000 $4,000 $6,000 $8,000 $10,000
Thousands1st Quartile/3rd Quartile Median Mean
AIPLA Report of the Economic Survey 2015
41
ESTIMATED TOTAL COST OF PATENT INFRINGEMENT-DEFENDING CLAIMS BY NON-PRACTICING ENTITY
(P. I-121 to I-128, Q35Ca-Q35Cl)Less than $1 million at risk
End of Discovery
Inclusive, all costs
Mediation
$1-$10 million at risk
End of Discovery
Inclusive, all costs
Mediation
$10-$25 million at risk
End of Discovery
Inclusive, all costs
Mediation
More than $25 million at risk
End of Discovery
Inclusive, all costs
Mediation
$0 $1,000 $2,000 $3,000 $4,000 $5,000 $6,000
Thousands1st Quartile/3rd Quartile Median Mean
Less than $1 million at risk
End of Discovery
Inclusive, all costs
Mediation
$1-$10 million at risk
End of Discovery
Inclusive, all costs
Mediation
$10-$25 million at risk
End of Discovery
Inclusive, all costs
Mediation
More than $25 million at risk
End of Discovery
Inclusive, all costs
Mediation
$0 $2,000 $4,000 $6,000 $8,000 $10,000
Thousands1st Quartile/3rd Quartile Median Mean
ESTIMATED TOTAL COST OF A PATENT INFRINGEMENT SUIT-SECTION 337 (P. I-129 to I-136, Q35Da-Q35Dl)
AIPLA Report of the Economic Survey 2015
42
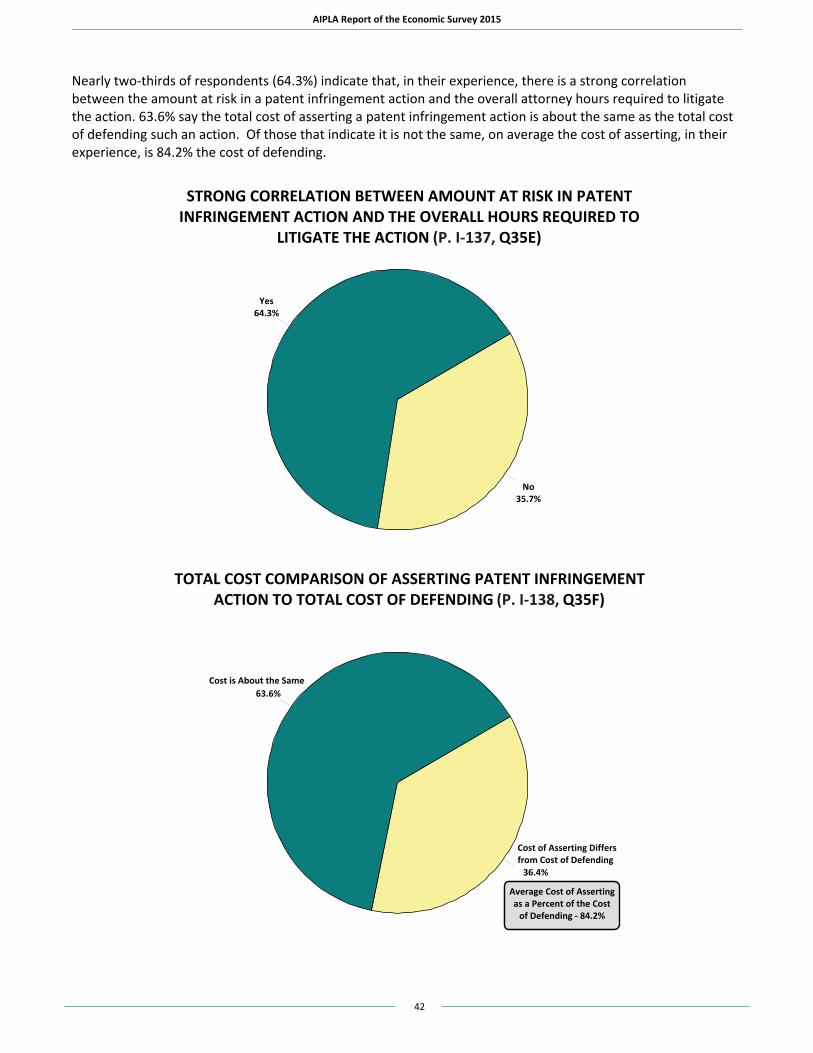
Nearly two-thirds of respondents (64.3%) indicate that, in their experience, there is a strong correlation between the amount at risk in a patent infringement action and the overall attorney hours required to litigate the action. 63.6% say the total cost of asserting a patent infringement action is about the same as the total cost of defending such an action. Of those that indicate it is not the same, on average the cost of asserting, in their experience, is 84.2% the cost of defending.
STRONG CORRELATION BETWEEN AMOUNT AT RISK IN PATENT INFRINGEMENT ACTION AND THE OVERALL HOURS REQUIRED TO
LITIGATE THE ACTION (P. I-137, Q35E)
Yes64.3%
No35.7%
TOTAL COST COMPARISON OF ASSERTING PATENT INFRINGEMENT
ACTION TO TOTAL COST OF DEFENDING (P. I-138, Q35F)
63.6%
36.4%
Average Cost of Asserting as a Percent of the Cost
of Defending - 84.2%
Cost is About the Same
Cost of Asserting Differs from Cost of Defending
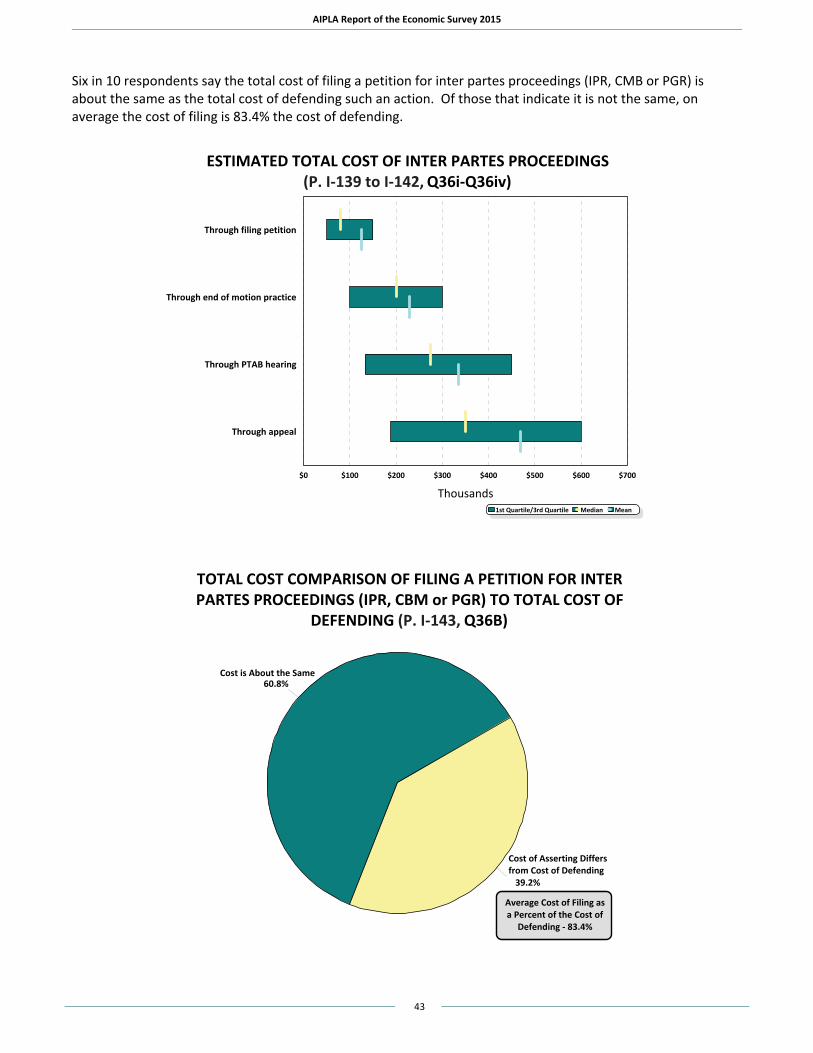
AIPLA Report of the Economic Survey 2015
43
Six in 10 respondents say the total cost of filing a petition for inter partes proceedings (IPR, CMB or PGR) is about the same as the total cost of defending such an action. Of those that indicate it is not the same, on average the cost of filing is 83.4% the cost of defending.
ESTIMATED TOTAL COST OF INTER PARTES PROCEEDINGS (P. I-139 to I-142, Q36i-Q36iv)
Through filing petition
Through end of motion practice
Through PTAB hearing
Through appeal
$0 $100 $200 $300 $400 $500 $600 $700
Thousands1st Quartile/3rd Quartile Median Mean
TOTAL COST COMPARISON OF FILING A PETITION FOR INTER PARTES PROCEEDINGS (IPR, CBM or PGR) TO TOTAL COST OF
DEFENDING (P. I-143, Q36B)
60.8%
39.2%
Average Cost of Filing as a Percent of the Cost of
Defending - 83.4%
Cost is About the Same
Cost of Asserting Differs from Cost of Defending
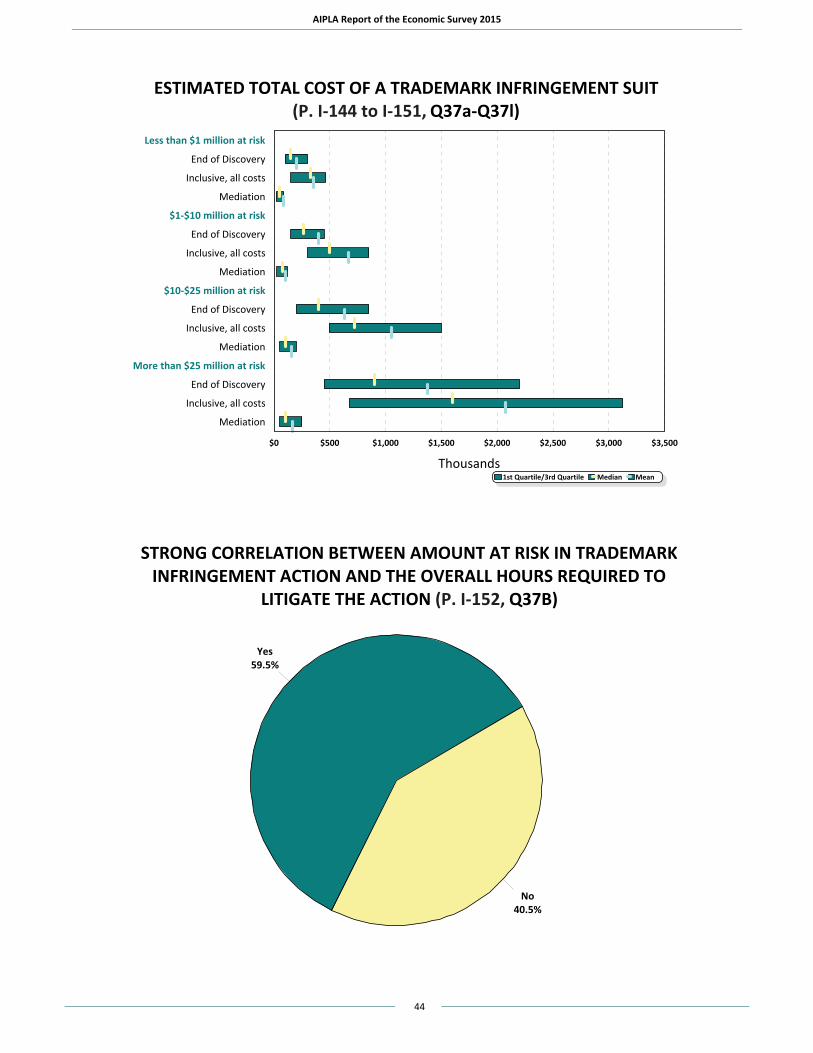
AIPLA Report of the Economic Survey 2015
44
ESTIMATED TOTAL COST OF A TRADEMARK INFRINGEMENT SUIT (P. I-144 to I-151, Q37a-Q37l)
Less than $1 million at risk
End of Discovery
Inclusive, all costs
Mediation
$1-$10 million at risk
End of Discovery
Inclusive, all costs
Mediation
$10-$25 million at risk
End of Discovery
Inclusive, all costs
Mediation
More than $25 million at risk
End of Discovery
Inclusive, all costs
Mediation
$0 $500 $1,000 $1,500 $2,000 $2,500 $3,000 $3,500
Thousands1st Quartile/3rd Quartile Median Mean
STRONG CORRELATION BETWEEN AMOUNT AT RISK IN TRADEMARK INFRINGEMENT ACTION AND THE OVERALL HOURS REQUIRED TO
LITIGATE THE ACTION (P. I-152, Q37B)
Yes59.5%
No40.5%
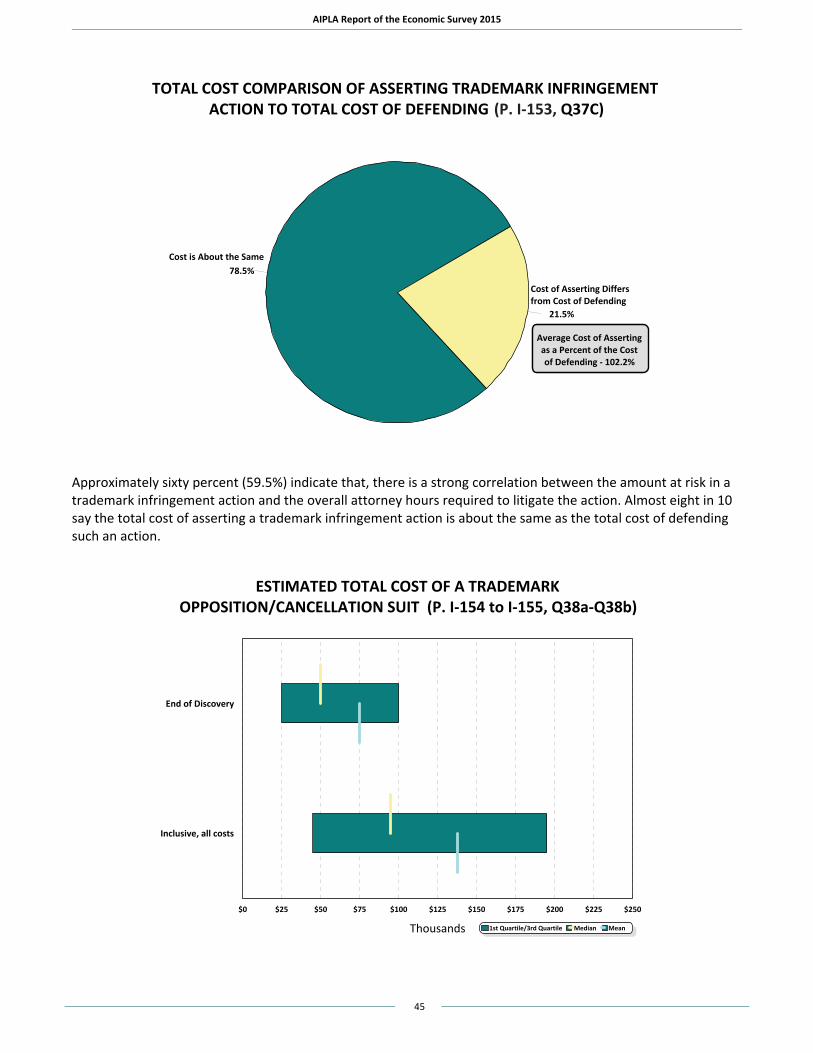
AIPLA Report of the Economic Survey 2015
45
TOTAL COST COMPARISON OF ASSERTING TRADEMARK INFRINGEMENT ACTION TO TOTAL COST OF DEFENDING (P. I-153, Q37C)
78.5%
21.5%
Average Cost of Asserting as a Percent of the Cost of Defending - 102.2%
Cost is About the Same
Cost of Asserting Differs from Cost of Defending
Approximately sixty percent (59.5%) indicate that, there is a strong correlation between the amount at risk in a trademark infringement action and the overall attorney hours required to litigate the action. Almost eight in 10 say the total cost of asserting a trademark infringement action is about the same as the total cost of defending such an action.
ESTIMATED TOTAL COST OF A TRADEMARK OPPOSITION/CANCELLATION SUIT (P. I-154 to I-155, Q38a-Q38b)
End of Discovery
Inclusive, all costs
$0 $25 $50 $75 $100 $125 $150 $175 $200 $225 $250
Thousands 1st Quartile/3rd Quartile Median Mean
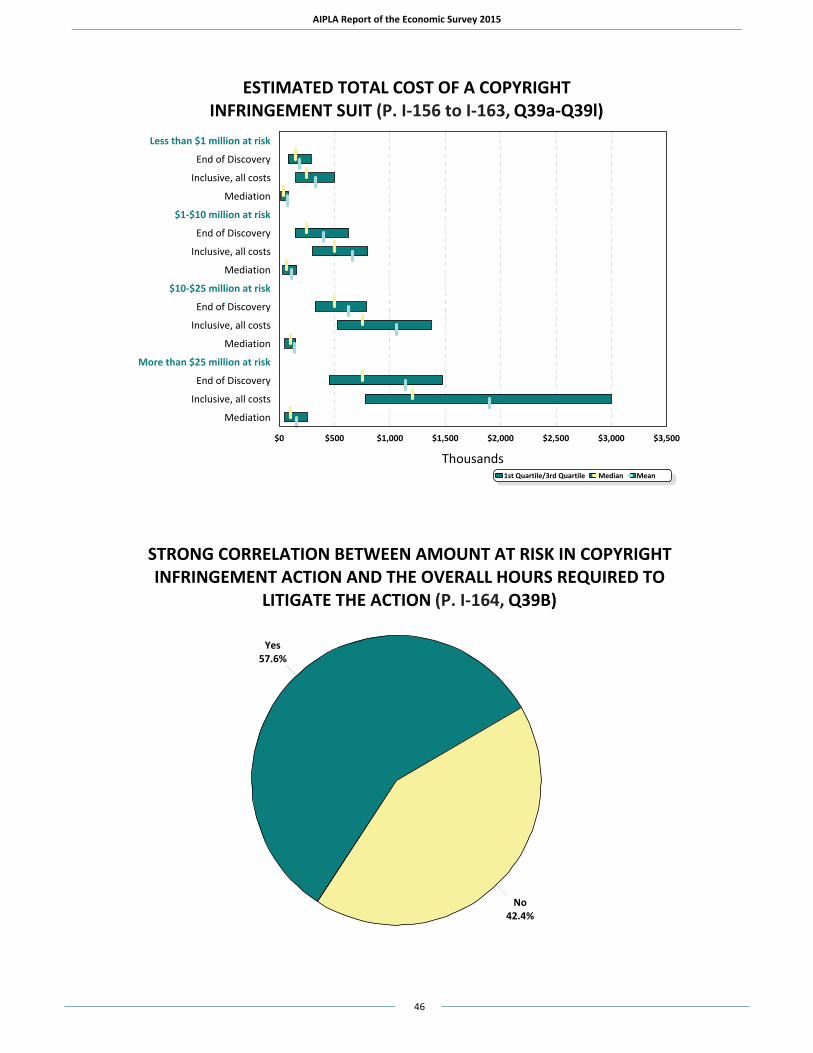
AIPLA Report of the Economic Survey 2015
46
ESTIMATED TOTAL COST OF A COPYRIGHT INFRINGEMENT SUIT (P. I-156 to I-163, Q39a-Q39l)
Less than $1 million at risk
End of Discovery
Inclusive, all costs
Mediation
$1-$10 million at risk
End of Discovery
Inclusive, all costs
Mediation
$10-$25 million at risk
End of Discovery
Inclusive, all costs
Mediation
More than $25 million at risk
End of Discovery
Inclusive, all costs
Mediation
$0 $500 $1,000 $1,500 $2,000 $2,500 $3,000 $3,500
Thousands1st Quartile/3rd Quartile Median Mean
STRONG CORRELATION BETWEEN AMOUNT AT RISK IN COPYRIGHT INFRINGEMENT ACTION AND THE OVERALL HOURS REQUIRED TO
LITIGATE THE ACTION (P. I-164, Q39B)
Yes57.6%
No42.4%
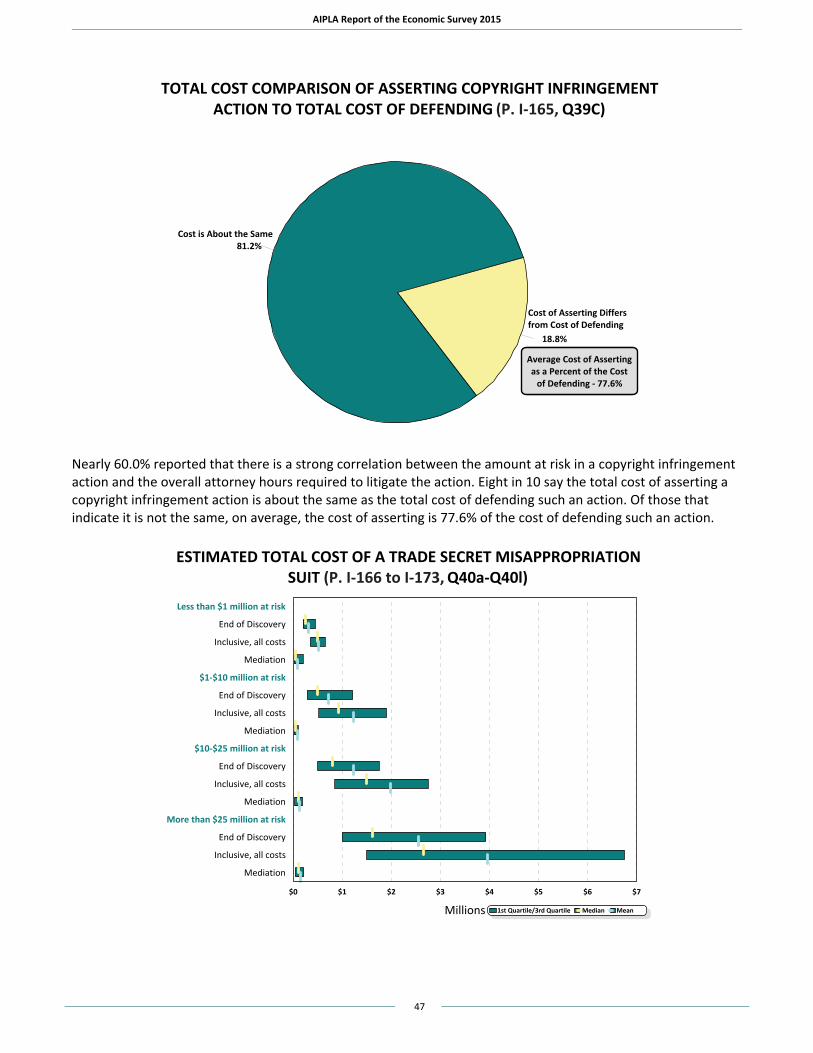
AIPLA Report of the Economic Survey 2015
47
TOTAL COST COMPARISON OF ASSERTING COPYRIGHT INFRINGEMENT ACTION TO TOTAL COST OF DEFENDING (P. I-165, Q39C)
81.2%
18.8%
Average Cost of Asserting as a Percent of the Cost
of Defending - 77.6%
Cost is About the Same
Cost of Asserting Differs from Cost of Defending
Nearly 60.0% reported that there is a strong correlation between the amount at risk in a copyright infringement action and the overall attorney hours required to litigate the action. Eight in 10 say the total cost of asserting a copyright infringement action is about the same as the total cost of defending such an action. Of those that indicate it is not the same, on average, the cost of asserting is 77.6% of the cost of defending such an action.
ESTIMATED TOTAL COST OF A TRADE SECRET MISAPPROPRIATION SUIT (P. I-166 to I-173, Q40a-Q40l)
Less than $1 million at risk
End of Discovery
Inclusive, all costs
Mediation
$1-$10 million at risk
End of Discovery
Inclusive, all costs
Mediation
$10-$25 million at risk
End of Discovery
Inclusive, all costs
Mediation
More than $25 million at risk
End of Discovery
Inclusive, all costs
Mediation
$0 $1 $2 $3 $4 $5 $6 $7
Millions 1st Quartile/3rd Quartile Median Mean
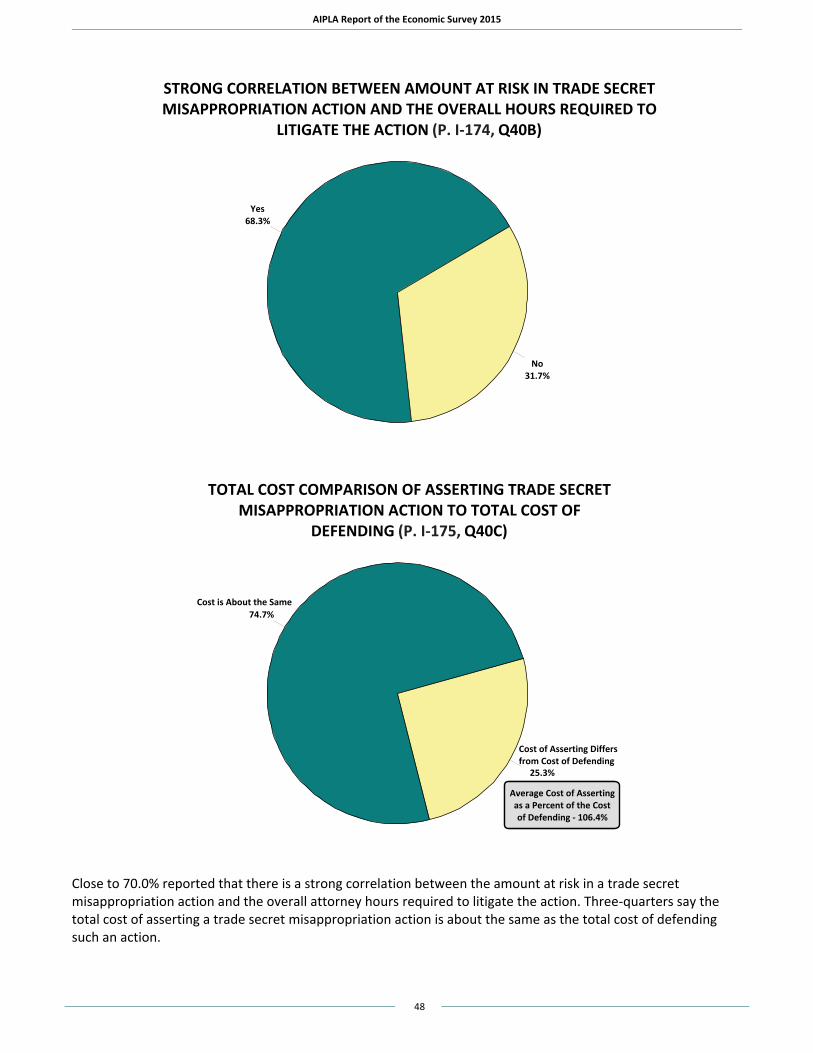
AIPLA Report of the Economic Survey 2015
48
STRONG CORRELATION BETWEEN AMOUNT AT RISK IN TRADE SECRET MISAPPROPRIATION ACTION AND THE OVERALL HOURS REQUIRED TO
LITIGATE THE ACTION (P. I-174, Q40B)
Yes68.3%
No31.7%
TOTAL COST COMPARISON OF ASSERTING TRADE SECRET MISAPPROPRIATION ACTION TO TOTAL COST OF
DEFENDING (P. I-175, Q40C)
74.7%
25.3%
Average Cost of Asserting as a Percent of the Cost of Defending - 106.4%
Cost is About the Same
Cost of Asserting Differs from Cost of Defending
Close to 70.0% reported that there is a strong correlation between the amount at risk in a trade secret misappropriation action and the overall attorney hours required to litigate the action. Three-quarters say the total cost of asserting a trade secret misappropriation action is about the same as the total cost of defending such an action.
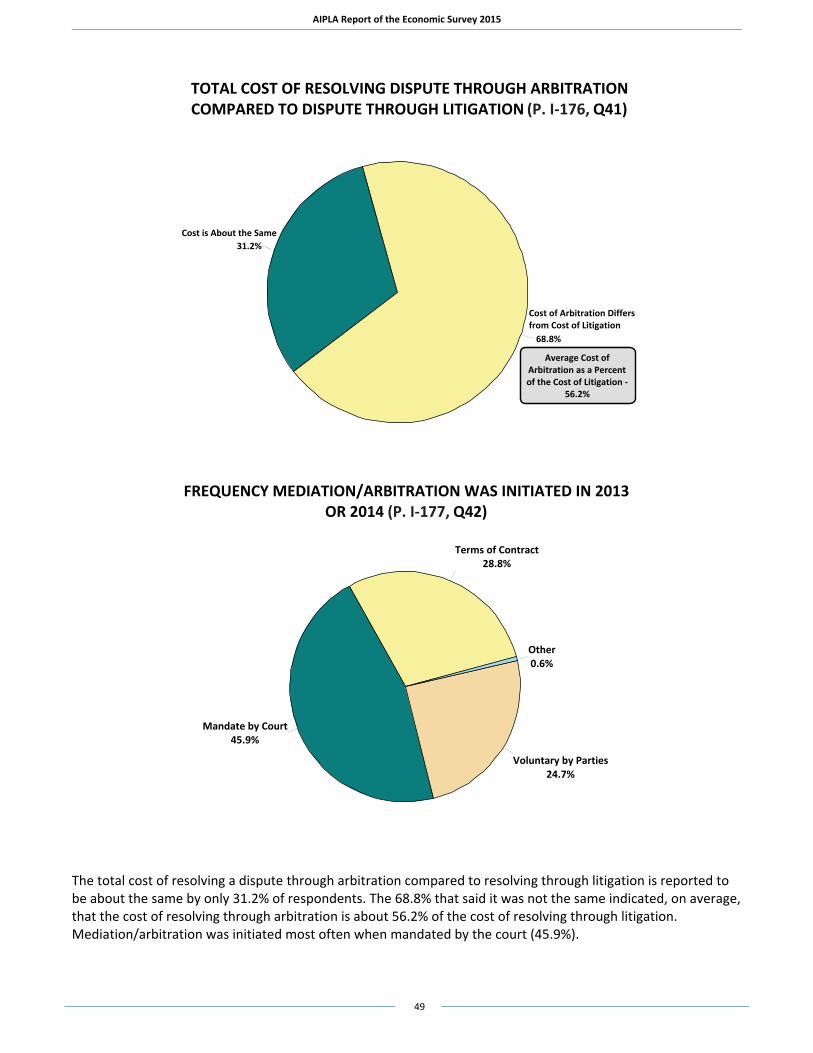
AIPLA Report of the Economic Survey 2015
49
TOTAL COST OF RESOLVING DISPUTE THROUGH ARBITRATION COMPARED TO DISPUTE THROUGH LITIGATION (P. I-176, Q41)
31.2%
68.8%
Average Cost of Arbitration as a Percent of the Cost of Litigation -
56.2%
Cost is About the Same
Cost of Arbitration Differs from Cost of Litigation
FREQUENCY MEDIATION/ARBITRATION WAS INITIATED IN 2013 OR 2014 (P. I-177, Q42)
Terms of Contract28.8%
Mandate by Court45.9%
Voluntary by Parties24.7%
Other0.6%
The total cost of resolving a dispute through arbitration compared to resolving through litigation is reported to be about the same by only 31.2% of respondents. The 68.8% that said it was not the same indicated, on average, that the cost of resolving through arbitration is about 56.2% of the cost of resolving through litigation. Mediation/arbitration was initiated most often when mandated by the court (45.9%).
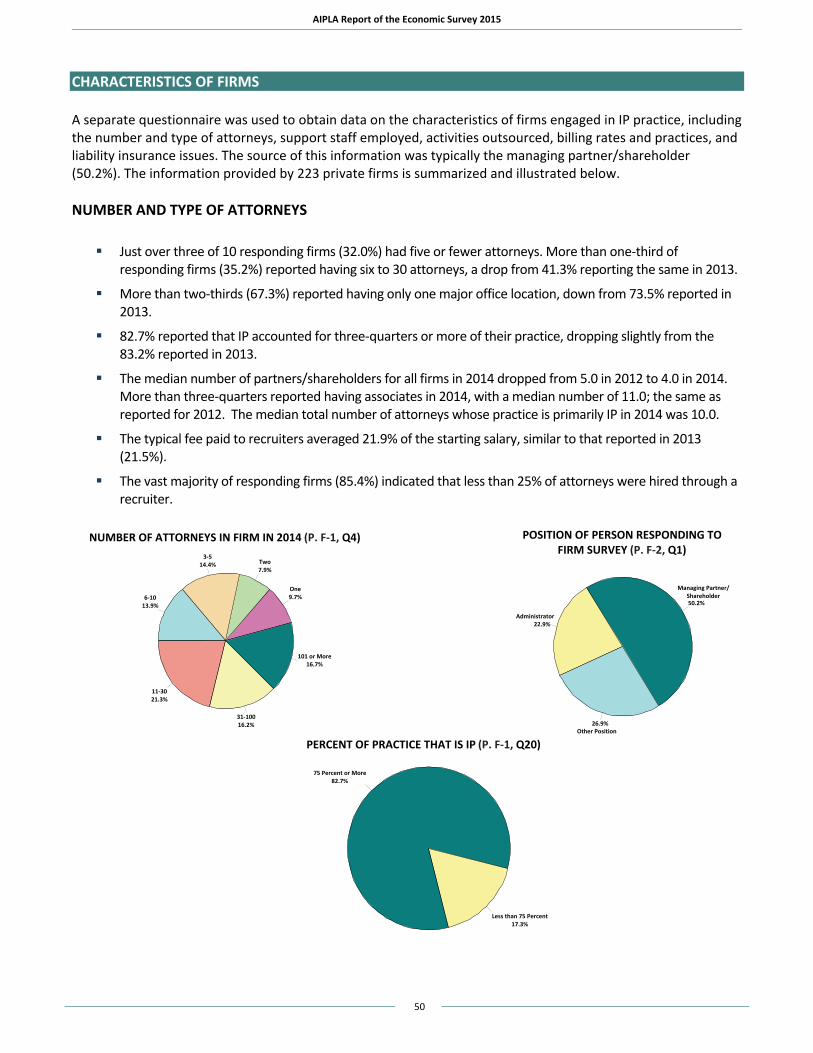
AIPLA Report of the Economic Survey 2015
50
NUMBER OF ATTORNEYS IN FIRM IN 2014 (P. F-1, Q4)
One9.7%
Two7.9%
3-514.4%
6-1013.9%
11-3021.3%
31-10016.2%
101 or More16.7%
POSITION OF PERSON RESPONDING TOFIRM SURVEY (P. F-2, Q1)
50.2%
22.9%
26.9%
Managing Partner/ Shareholder
Administrator
Other Position
PERCENT OF PRACTICE THAT IS IP (P. F-1, Q20)
75 Percent or More82.7%
Less than 75 Percent17.3%
CHARACTERISTICS OF FIRMS A separate questionnaire was used to obtain data on the characteristics of firms engaged in IP practice, including the number and type of attorneys, support staff employed, activities outsourced, billing rates and practices, and liability insurance issues. The source of this information was typically the managing partner/shareholder (50.2%). The information provided by 223 private firms is summarized and illustrated below. NUMBER AND TYPE OF ATTORNEYS
Just over three of 10 responding firms (32.0%) had five or fewer attorneys. More than one-third of responding firms (35.2%) reported having six to 30 attorneys, a drop from 41.3% reporting the same in 2013.
More than two-thirds (67.3%) reported having only one major office location, down from 73.5% reported in 2013.
82.7% reported that IP accounted for three-quarters or more of their practice, dropping slightly from the 83.2% reported in 2013.
The median number of partners/shareholders for all firms in 2014 dropped from 5.0 in 2012 to 4.0 in 2014. More than three-quarters reported having associates in 2014, with a median number of 11.0; the same as reported for 2012. The median total number of attorneys whose practice is primarily IP in 2014 was 10.0.
The typical fee paid to recruiters averaged 21.9% of the starting salary, similar to that reported in 2013 (21.5%).
The vast majority of responding firms (85.4%) indicated that less than 25% of attorneys were hired through a recruiter.
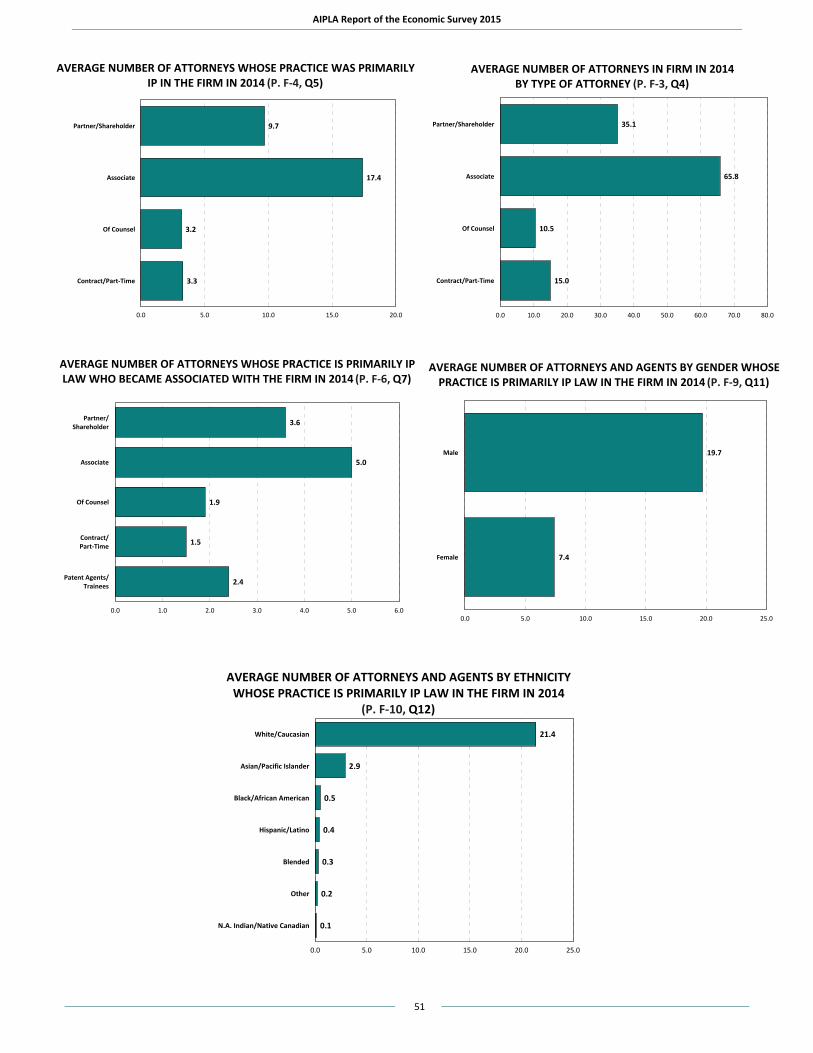
AIPLA Report of the Economic Survey 2015
51
AVERAGE NUMBER OF ATTORNEYS WHOSE PRACTICE WAS PRIMARILY IP IN THE FIRM IN 2014 (P. F-4, Q5)
9.7
17.4
3.2
3.3
Partner/Shareholder
Associate
Of Counsel
Contract/Part-Time
0.0 5.0 10.0 15.0 20.0
AVERAGE NUMBER OF ATTORNEYS IN FIRM IN 2014 BY TYPE OF ATTORNEY (P. F-3, Q4)
35.1
65.8
10.5
15.0
Partner/Shareholder
Associate
Of Counsel
Contract/Part-Time
0.0 10.0 20.0 30.0 40.0 50.0 60.0 70.0 80.0
AVERAGE NUMBER OF ATTORNEYS WHOSE PRACTICE IS PRIMARILY IP LAW WHO BECAME ASSOCIATED WITH THE FIRM IN 2014 (P. F-6, Q7)
3.6
5.0
1.9
1.5
2.4
Partner/Shareholder
Associate
Of Counsel
Contract/Part-Time
Patent Agents/Trainees
0.0 1.0 2.0 3.0 4.0 5.0 6.0
AVERAGE NUMBER OF ATTORNEYS AND AGENTS BY GENDER WHOSE PRACTICE IS PRIMARILY IP LAW IN THE FIRM IN 2014 (P. F-9, Q11)
19.7
7.4
Male
Female
0.0 5.0 10.0 15.0 20.0 25.0
AVERAGE NUMBER OF ATTORNEYS AND AGENTS BY ETHNICITY WHOSE PRACTICE IS PRIMARILY IP LAW IN THE FIRM IN 2014
(P. F-10, Q12)
21.4
2.9
0.5
0.4
0.3
0.2
0.1
White/Caucasian
Asian/Pacific Islander
Black/African American
Hispanic/Latino
Blended
Other
N.A. Indian/Native Canadian
0.0 5.0 10.0 15.0 20.0 25.0
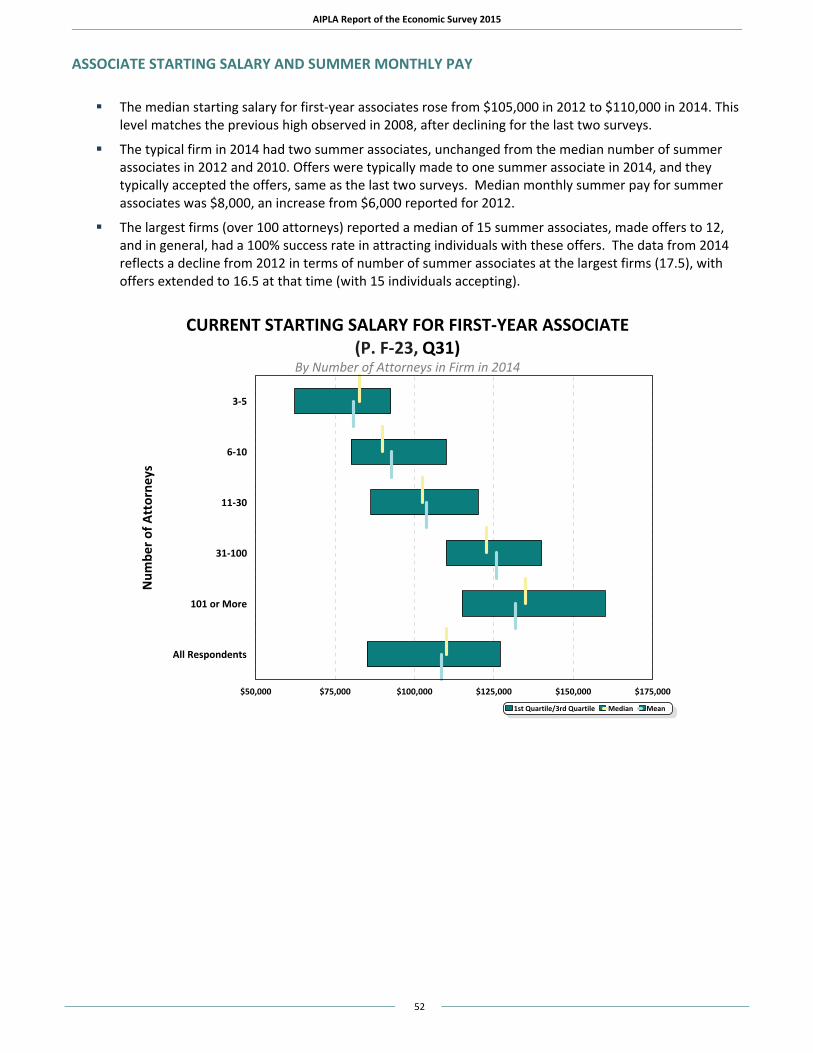
AIPLA Report of the Economic Survey 2015
52
ASSOCIATE STARTING SALARY AND SUMMER MONTHLY PAY
The median starting salary for first-year associates rose from $105,000 in 2012 to $110,000 in 2014. This level matches the previous high observed in 2008, after declining for the last two surveys.
The typical firm in 2014 had two summer associates, unchanged from the median number of summer associates in 2012 and 2010. Offers were typically made to one summer associate in 2014, and they typically accepted the offers, same as the last two surveys. Median monthly summer pay for summer associates was $8,000, an increase from $6,000 reported for 2012.
The largest firms (over 100 attorneys) reported a median of 15 summer associates, made offers to 12, and in general, had a 100% success rate in attracting individuals with these offers. The data from 2014 reflects a decline from 2012 in terms of number of summer associates at the largest firms (17.5), with offers extended to 16.5 at that time (with 15 individuals accepting).
CURRENT STARTING SALARY FOR FIRST-YEAR ASSOCIATE(P. F-23, Q31)
By Number of Attorneys in Firm in 2014
3-5
6-10
11-30
31-100
101 or More
All Respondents
Num
ber o
f Att
orne
ys
$50,000 $75,000 $100,000 $125,000 $150,000 $175,000
1st Quartile/3rd Quartile Median Mean
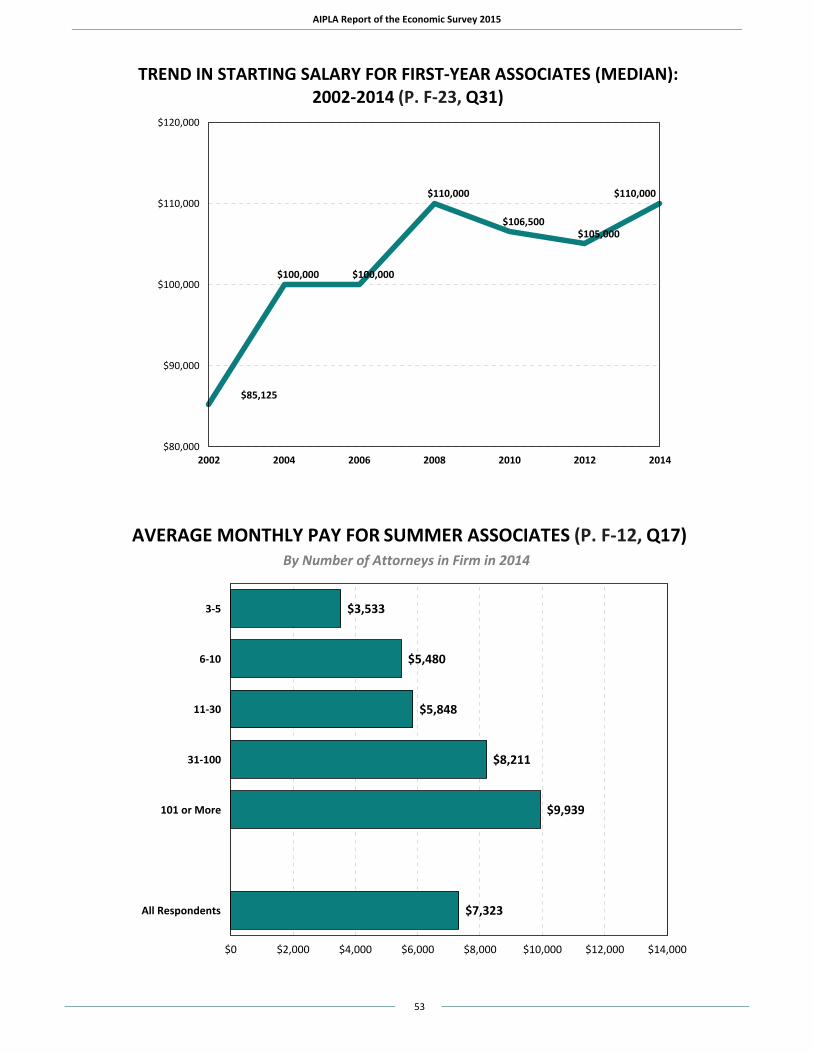
AIPLA Report of the Economic Survey 2015
53
TREND IN STARTING SALARY FOR FIRST-YEAR ASSOCIATES (MEDIAN): 2002-2014 (P. F-23, Q31)
!
!
! !
!
!!
$85,125
$100,000 $100,000
$110,000
$106,500 $105,000
$110,000
2002 2004 2006 2008 2010 2012 2014 $80,000
$90,000
$100,000
$110,000
$120,000
AVERAGE MONTHLY PAY FOR SUMMER ASSOCIATES (P. F-12, Q17)By Number of Attorneys in Firm in 2014
$3,533
$5,480
$5,848
$8,211
$9,939
$7,323
3-5
6-10
11-30
31-100
101 or More
All Respondents
$0 $2,000 $4,000 $6,000 $8,000 $10,000 $12,000 $14,000
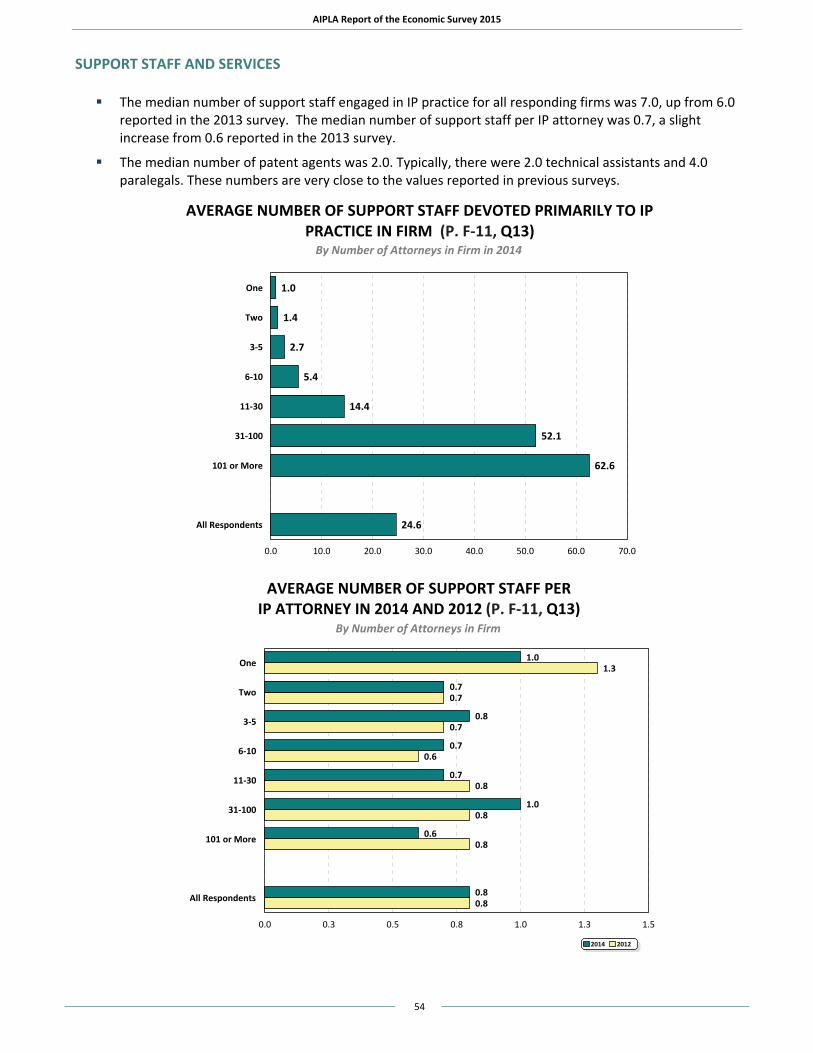
AIPLA Report of the Economic Survey 2015
54
SUPPORT STAFF AND SERVICES
The median number of support staff engaged in IP practice for all responding firms was 7.0, up from 6.0 reported in the 2013 survey. The median number of support staff per IP attorney was 0.7, a slight increase from 0.6 reported in the 2013 survey.
The median number of patent agents was 2.0. Typically, there were 2.0 technical assistants and 4.0 paralegals. These numbers are very close to the values reported in previous surveys.
AVERAGE NUMBER OF SUPPORT STAFF DEVOTED PRIMARILY TO IP PRACTICE IN FIRM (P. F-11, Q13)
By Number of Attorneys in Firm in 2014
1.0
1.4
2.7
5.4
14.4
52.1
62.6
24.6
One
Two
3-5
6-10
11-30
31-100
101 or More
All Respondents
0.0 10.0 20.0 30.0 40.0 50.0 60.0 70.0
AVERAGE NUMBER OF SUPPORT STAFF PER
IP ATTORNEY IN 2014 AND 2012 (P. F-11, Q13)By Number of Attorneys in Firm
1.0
0.7
0.8
0.7
0.7
1.0
0.6
0.8
1.3
0.7
0.7
0.6
0.8
0.8
0.8
0.8
One
Two
3-5
6-10
11-30
31-100
101 or More
All Respondents
0.0 0.3 0.5 0.8 1.0 1.3 1.5
2014 2012

AIPLA Report of the Economic Survey 2015
55
AGENTS AND ASSISTANTS INVOLVED PRIMARILY IN THE IP PRACTICE OF THE FIRM IN 2014 (P. F-5, Q6)
5.5
4.2
8.8
USPTO-registered Patent Agents
Technical Assistants
Paralegal/Assistants
0.0 2.0 4.0 6.0 8.0 10.0
AVERAGE NUMBER OF PARALEGALS/LEGAL ASSISTANTS IN FIRM (P. F-5, Q6)
By Number of Attorneys in Firm in 2014
1.1
1.3
2.4
3.6
7.4
17.1
15.3
8.8
One
Two
3-5
6-10
11-30
31-100
101 or More
All Respondents
0.0 5.0 10.0 15.0 20.0
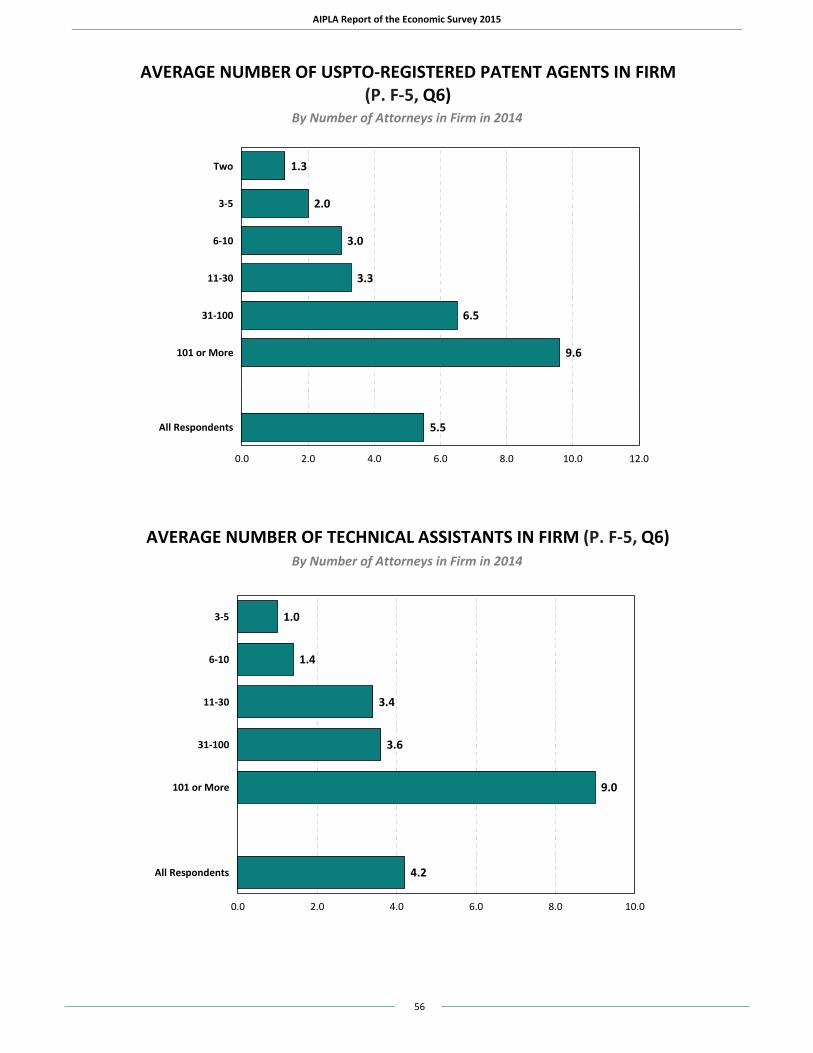
AIPLA Report of the Economic Survey 2015
56
AVERAGE NUMBER OF USPTO-REGISTERED PATENT AGENTS IN FIRM (P. F-5, Q6)
By Number of Attorneys in Firm in 2014
1.3
2.0
3.0
3.3
6.5
9.6
5.5
Two
3-5
6-10
11-30
31-100
101 or More
All Respondents
0.0 2.0 4.0 6.0 8.0 10.0 12.0
AVERAGE NUMBER OF TECHNICAL ASSISTANTS IN FIRM (P. F-5, Q6)By Number of Attorneys in Firm in 2014
1.0
1.4
3.4
3.6
9.0
4.2
3-5
6-10
11-30
31-100
101 or More
All Respondents
0.0 2.0 4.0 6.0 8.0 10.0
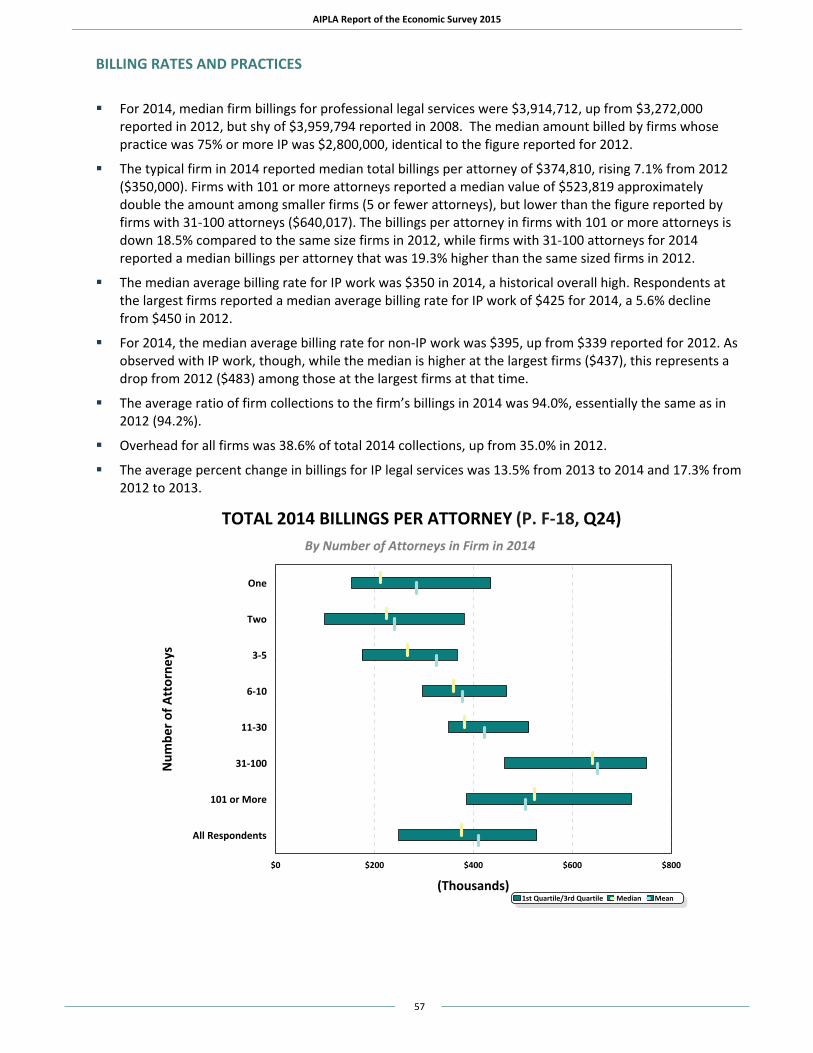
AIPLA Report of the Economic Survey 2015
57
BILLING RATES AND PRACTICES For 2014, median firm billings for professional legal services were $3,914,712, up from $3,272,000
reported in 2012, but shy of $3,959,794 reported in 2008. The median amount billed by firms whose practice was 75% or more IP was $2,800,000, identical to the figure reported for 2012.
The typical firm in 2014 reported median total billings per attorney of $374,810, rising 7.1% from 2012 ($350,000). Firms with 101 or more attorneys reported a median value of $523,819 approximately double the amount among smaller firms (5 or fewer attorneys), but lower than the figure reported by firms with 31-100 attorneys ($640,017). The billings per attorney in firms with 101 or more attorneys is down 18.5% compared to the same size firms in 2012, while firms with 31-100 attorneys for 2014 reported a median billings per attorney that was 19.3% higher than the same sized firms in 2012.
The median average billing rate for IP work was $350 in 2014, a historical overall high. Respondents at the largest firms reported a median average billing rate for IP work of $425 for 2014, a 5.6% decline from $450 in 2012.
For 2014, the median average billing rate for non-IP work was $395, up from $339 reported for 2012. As observed with IP work, though, while the median is higher at the largest firms ($437), this represents a drop from 2012 ($483) among those at the largest firms at that time.
The average ratio of firm collections to the firm’s billings in 2014 was 94.0%, essentially the same as in 2012 (94.2%).
Overhead for all firms was 38.6% of total 2014 collections, up from 35.0% in 2012.
The average percent change in billings for IP legal services was 13.5% from 2013 to 2014 and 17.3% from 2012 to 2013.
TOTAL 2014 BILLINGS PER ATTORNEY (P. F-18, Q24)By Number of Attorneys in Firm in 2014
One
Two
3-5
6-10
11-30
31-100
101 or More
All Respondents
Num
ber o
f Att
orne
ys
$0 $200 $400 $600 $800
(Thousands)1st Quartile/3rd Quartile Median Mean
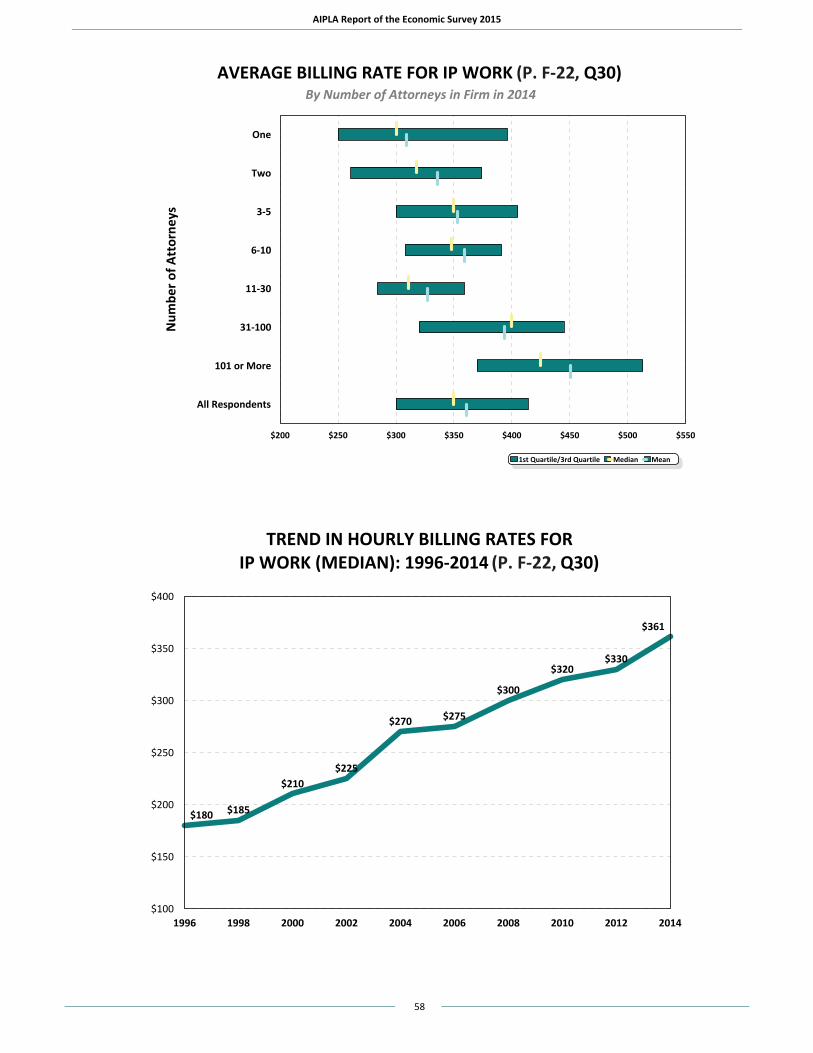
AIPLA Report of the Economic Survey 2015
58
AVERAGE BILLING RATE FOR IP WORK (P. F-22, Q30)By Number of Attorneys in Firm in 2014
One
Two
3-5
6-10
11-30
31-100
101 or More
All Respondents
Num
ber o
f Att
orne
ys
$200 $250 $300 $350 $400 $450 $500 $550
1st Quartile/3rd Quartile Median Mean
TREND IN HOURLY BILLING RATES FOR IP WORK (MEDIAN): 1996-2014 (P. F-22, Q30)
!
!
!
!
!
! !
!
!!
$180 $185
$210$225
$270 $275
$300
$320$330
$361
1996 1998 2000 2002 2004 2006 2008 2010 2012 2014$100
$150
$200
$250
$300
$350
$400
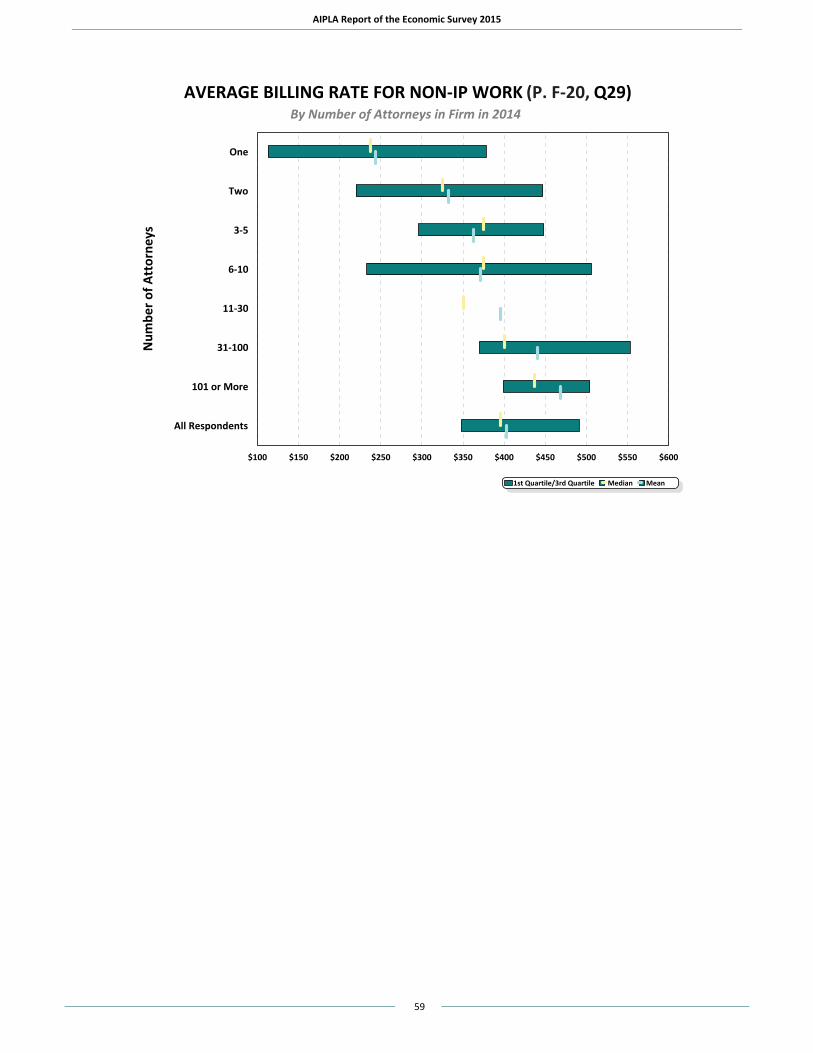
AIPLA Report of the Economic Survey 2015
59
AVERAGE BILLING RATE FOR NON-IP WORK (P. F-20, Q29)By Number of Attorneys in Firm in 2014
One
Two
3-5
6-10
11-30
31-100
101 or More
All Respondents
Num
ber o
f Att
orne
y s
$100 $150 $200 $250 $300 $350 $400 $450 $500 $550 $600
1st Quartile/3rd Quartile Median Mean
AIPLA Report of the Economic Survey 2015
60
LIABILITY INSURANCE In 2014, the typical firm reported maximum total liability coverage of $4,000,000 (median). This is down
from $4,350,000 reported in 2012, and also represents a decline from the five million dollars reported in 2010.
The maximum coverage per claim in 2014 was $3,000,000 (median), unchanged from 2012 but higher than it was in 2010 ($2,750,000). Still this figure is lower than in 2008 when it was $3,500,000.
The median total deductible in 2014 was $25,000, unchanged from the figure reported for 2012.
The median per claim deductible in 2014 was also $25,000, reflecting no change from 2012, 2008 and 2006.
Liability insurance cost per attorney was a median of $4,420 in 2014, a very slight decline from $4,427 in 2012.
The typical firm had a median of one liability claim for IP matters in the past five years and .073 claims for IP matters per IP attorney in the past 5 years, down from .104 in 2012.
TRAINING & MARKETING New questions were added in the 2015 survey regarding training and marketing. On average, firms
spent 1.8% of gross revenue in 2014 on outside providers of attorney training and external training programs.
Most often formal training was provided for practice skills (e.g., claim drafting, case law review, etc.), with 40.4% of firms saying they provided this type of training, followed by business development (30.5%). They are least likely to provide leadership training and team dynamics or team building (15.2%).
Just over one-third of firms say they have dedicated business development personnel (34.9%). All firms with 101 or more attorneys indicate having this type of personnel, with 66.7% of firms with 31-100 attorneys saying the same.
Additionally, as a percentage of gross revenue in 2014, the average spent on a marketing budget was 2.6%. Most often, this budget was allocated to travel (23.2%), followed by advertising (19.6%), event sponsorship (18.1%), and website development (15.9%).
Most firms do not give associates “billable hour” credit toward their billing requirement for time spent marketing and participating in bar associations or other professional organizations (87.3% reported ‘No’).
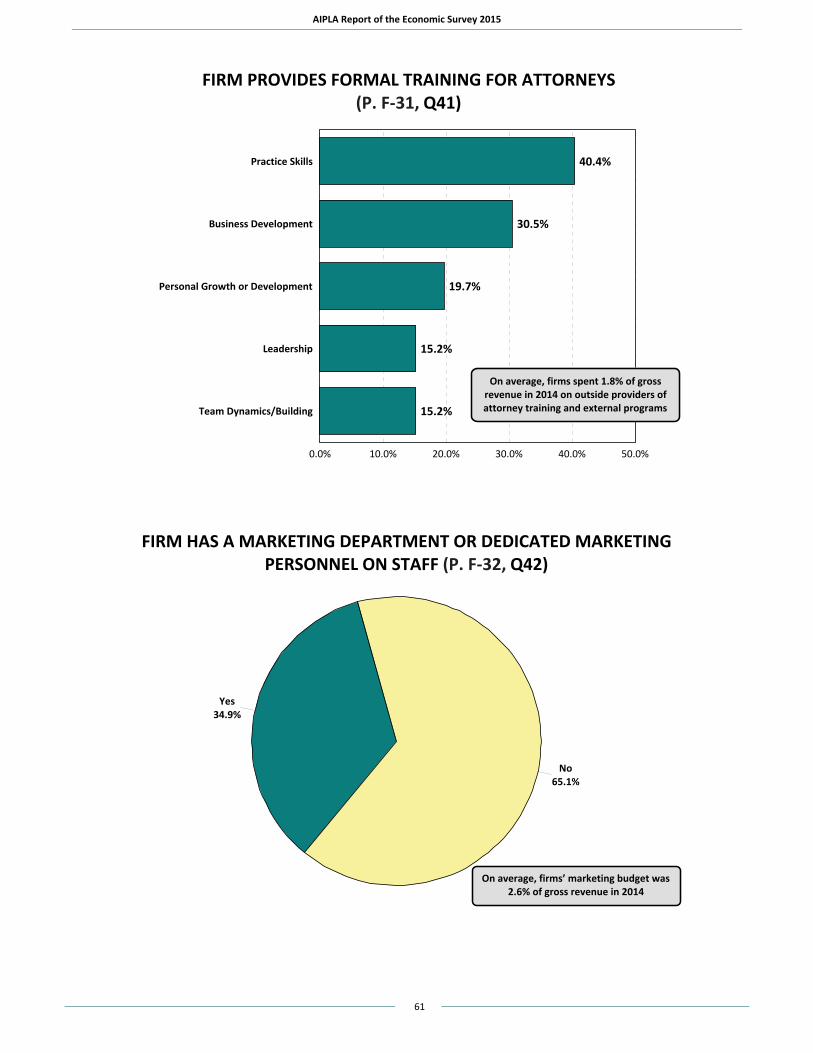
AIPLA Report of the Economic Survey 2015
61
FIRM PROVIDES FORMAL TRAINING FOR ATTORNEYS(P. F-31, Q41)
40.4%
30.5%
19.7%
15.2%
15.2%
Practice Skills
Business Development
Personal Growth or Development
Leadership
Team Dynamics/Building
0.0% 10.0% 20.0% 30.0% 40.0% 50.0%
On average, firms spent 1.8% of gross revenue in 2014 on outside providers of attorney training and external programs
FIRM HAS A MARKETING DEPARTMENT OR DEDICATED MARKETING PERSONNEL ON STAFF (P. F-32, Q42)
Yes34.9%
No65.1%
On average, firms’ marketing budget was 2.6% of gross revenue in 2014
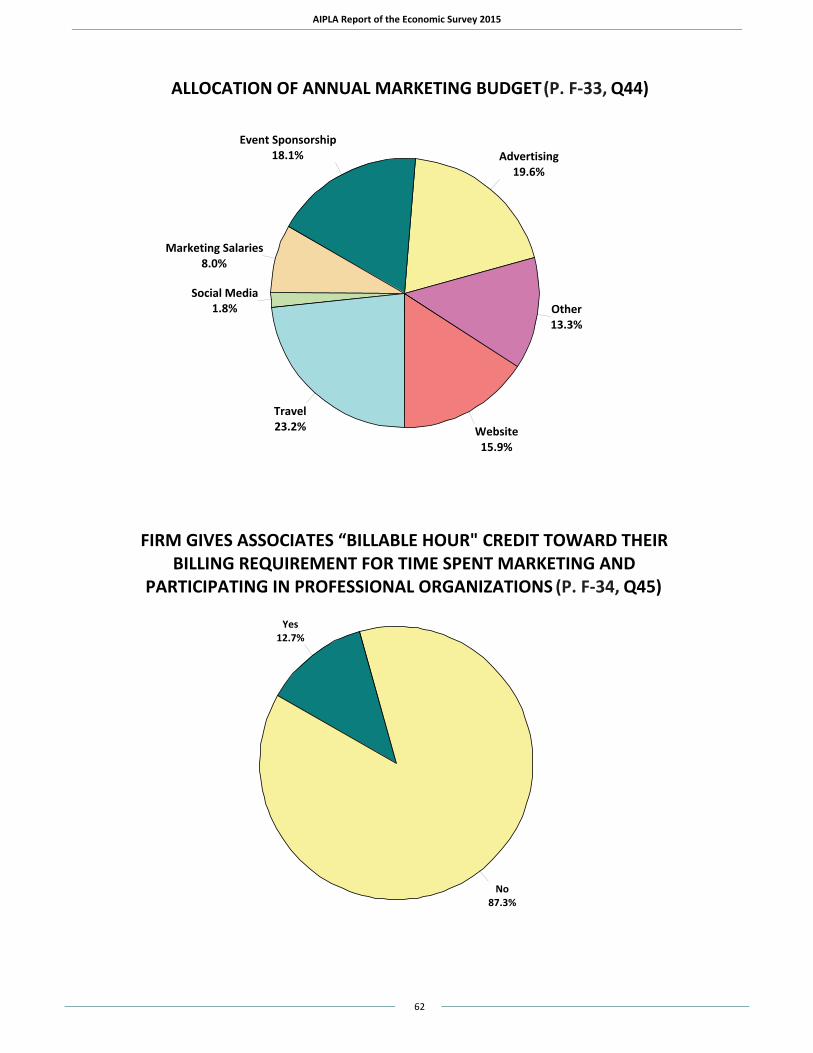
AIPLA Report of the Economic Survey 2015
62
ALLOCATION OF ANNUAL MARKETING BUDGET (P. F-33, Q44)
Advertising19.6%
Event Sponsorship18.1%
Marketing Salaries8.0%
Social Media1.8%
Travel23.2% Website
15.9%
Other13.3%
FIRM GIVES ASSOCIATES “BILLABLE HOUR" CREDIT TOWARD THEIR BILLING REQUIREMENT FOR TIME SPENT MARKETING AND
PARTICIPATING IN PROFESSIONAL ORGANIZATIONS (P. F-34, Q45)
Yes12.7%
No87.3%