Embed Size (px)
Citation preview
2015 TECH
GROWTH EQUITYReview and Outlook
Year of the
UnicornWill 2015 bring the same?
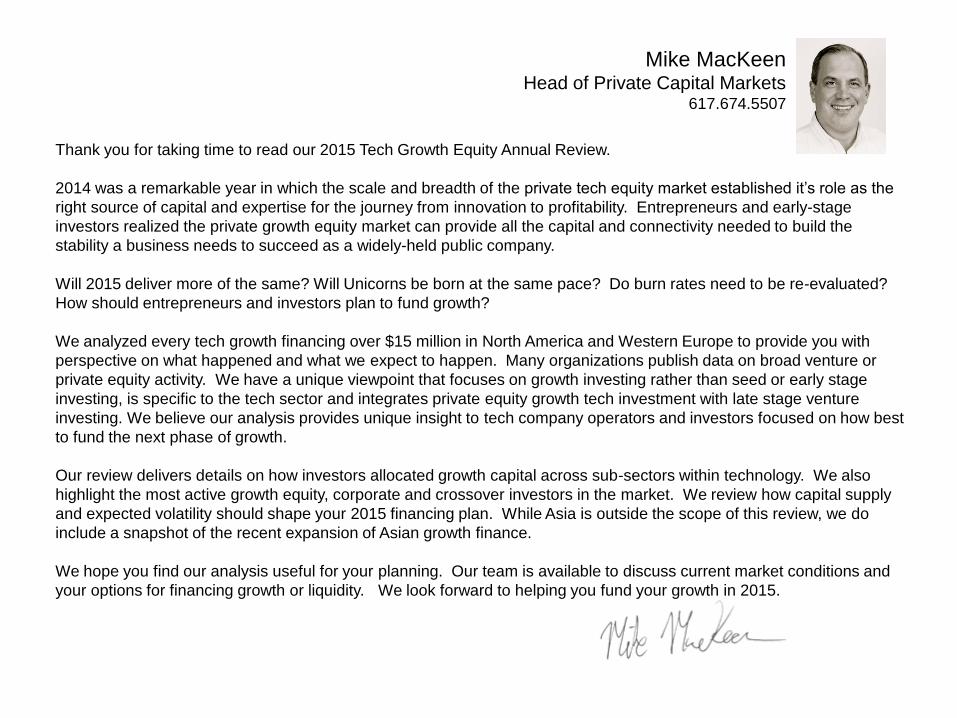
Thank you for taking time to read our 2015 Tech Growth Equity Annual Review.
2014 was a remarkable year in which the scale and breadth of the private tech equity market established it’s role as the
right source of capital and expertise for the journey from innovation to profitability. Entrepreneurs and early-stage
investors realized the private growth equity market can provide all the capital and connectivity needed to build the
stability a business needs to succeed as a widely-held public company.
Will 2015 deliver more of the same? Will Unicorns be born at the same pace? Do burn rates need to be re-evaluated?
How should entrepreneurs and investors plan to fund growth?
We analyzed every tech growth financing over $15 million in North America and Western Europe to provide you with
perspective on what happened and what we expect to happen. Many organizations publish data on broad venture or
private equity activity. We have a unique viewpoint that focuses on growth investing rather than seed or early stage
investing, is specific to the tech sector and integrates private equity growth tech investment with late stage venture
investing. We believe our analysis provides unique insight to tech company operators and investors focused on how best
to fund the next phase of growth.
Our review delivers details on how investors allocated growth capital across sub-sectors within technology. We also
highlight the most active growth equity, corporate and crossover investors in the market. We review how capital supply
and expected volatility should shape your 2015 financing plan. While Asia is outside the scope of this review, we do
include a snapshot of the recent expansion of Asian growth finance.
We hope you find our analysis useful for your planning. Our team is available to discuss current market conditions and
your options for financing growth or liquidity. We look forward to helping you fund your growth in 2015.
Mike MacKeenHead of Private Capital Markets
617.674.5507
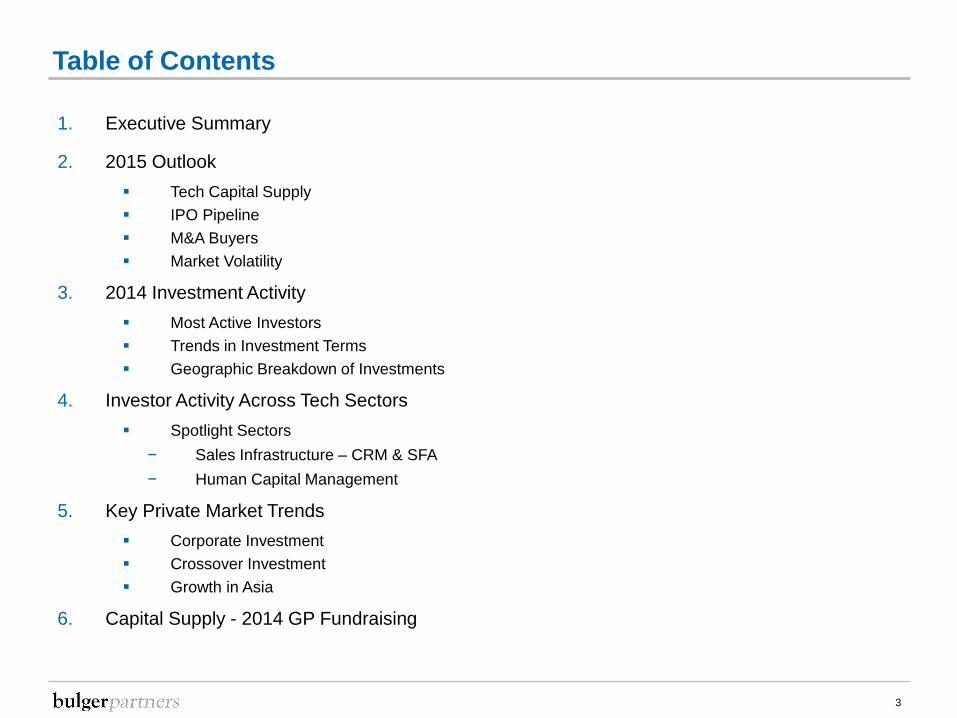
1. Executive Summary
2. 2015 Outlook
Tech Capital Supply
IPO Pipeline
M&A Buyers
Market Volatility
3. 2014 Investment Activity
Most Active Investors
Trends in Investment Terms
Geographic Breakdown of Investments
4. Investor Activity Across Tech Sectors
Spotlight Sectors
− Sales Infrastructure – CRM & SFA
− Human Capital Management
5. Key Private Market Trends
Corporate Investment
Crossover Investment
Growth in Asia
6. Capital Supply - 2014 GP Fundraising
Table of Contents
3
Executive Summary
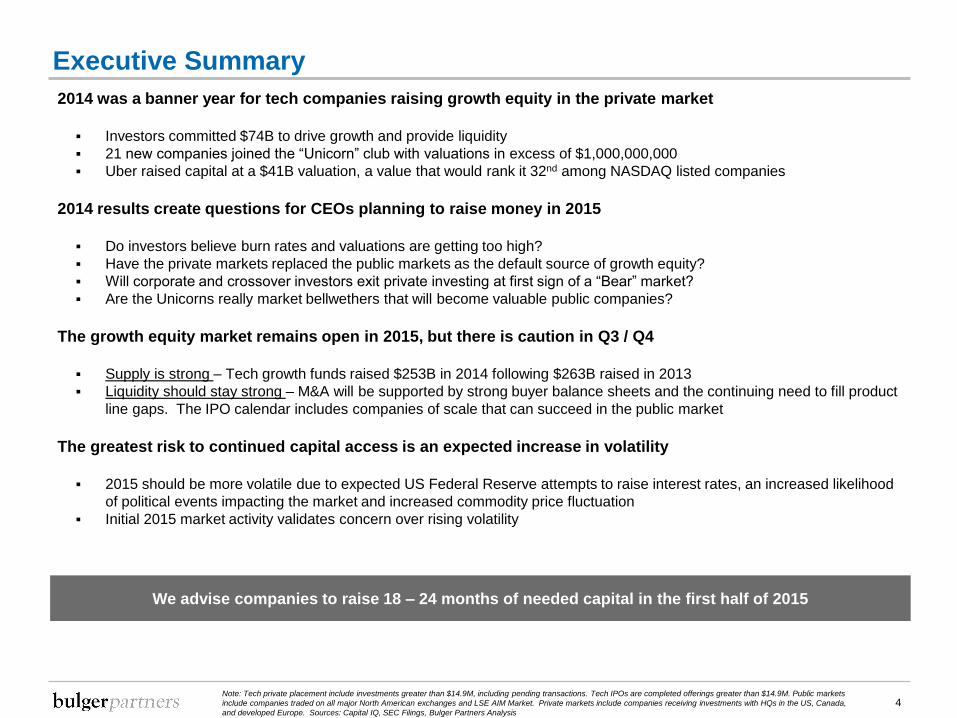
2014 was a banner year for tech companies raising growth equity in the private market
Investors committed $74B to drive growth and provide liquidity
21 new companies joined the “Unicorn” club with valuations in excess of $1,000,000,000
Uber raised capital at a $41B valuation, a value that would rank it 32nd among NASDAQ listed companies
2014 results create questions for CEOs planning to raise money in 2015
Do investors believe burn rates and valuations are getting too high?
Have the private markets replaced the public markets as the default source of growth equity?
Will corporate and crossover investors exit private investing at first sign of a “Bear” market?
Are the Unicorns really market bellwethers that will become valuable public companies?
The growth equity market remains open in 2015, but there is caution in Q3 / Q4
Supply is strong – Tech growth funds raised $253B in 2014 following $263B raised in 2013
Liquidity should stay strong – M&A will be supported by strong buyer balance sheets and the continuing need to fill product
line gaps. The IPO calendar includes companies of scale that can succeed in the public market
The greatest risk to continued capital access is an expected increase in volatility
2015 should be more volatile due to expected US Federal Reserve attempts to raise interest rates, an increased likelihood
of political events impacting the market and increased commodity price fluctuation
Initial 2015 market activity validates concern over rising volatility
We advise companies to raise 18 – 24 months of needed capital in the first half of 2015
4Note: Tech private placement include investments greater than $14.9M, including pending transactions. Tech IPOs are completed offerings greater than $14.9M. Public markets
include companies traded on all major North American exchanges and LSE AIM Market. Private markets include companies receiving investments with HQs in the US, Canada,
and developed Europe. Sources: Capital IQ, SEC Filings, Bulger Partners Analysis

2015 Outlook

Capital Supply is Strong Entering 2015
Tech Investors Need to Deploy $262 Billion
6
$0
$50.0
$100.0
$150.0
$200.0
$250.0
$300.0
$350.0
$400.0
$450.0
2004 2005 2006 2007 2008 2009 2010 2011 2012 2013 2014
$261.8B
We estimate that the tech sector private growth capital “overhang” exceeds $250 Billion entering 2015− Our methodology includes conservative assumptions of likely annual investment capacity
Capital supply is adequate to support take-private transactions of significant scale
Supply will also allow routine private growth financings equal to the size of a typical growth company IPO
Note: Funds include only funds that have historical interest in Media, Internet, Information Technology, Telecommunications, or HCIT. Sources: S&P CapIQ, BP Analysis
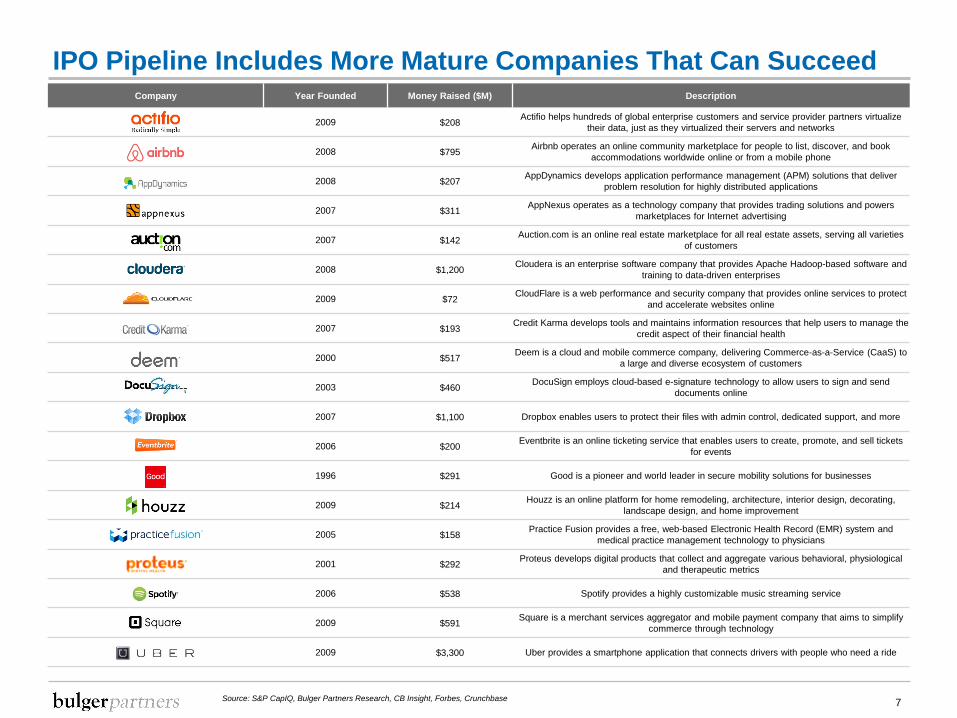
IPO Pipeline Includes More Mature Companies That Can Succeed
7Source: S&P CapIQ, Bulger Partners Research, CB Insight, Forbes, Crunchbase
Company Year Founded Money Raised ($M) Description
2009 $208Actifio helps hundreds of global enterprise customers and service provider partners virtualize
their data, just as they virtualized their servers and networks
2008 $795Airbnb operates an online community marketplace for people to list, discover, and book
accommodations worldwide online or from a mobile phone
2008 $207AppDynamics develops application performance management (APM) solutions that deliver
problem resolution for highly distributed applications
2007 $311AppNexus operates as a technology company that provides trading solutions and powers
marketplaces for Internet advertising
2007 $142Auction.com is an online real estate marketplace for all real estate assets, serving all varieties
of customers
2008 $1,200Cloudera is an enterprise software company that provides Apache Hadoop-based software and
training to data-driven enterprises
2009 $72CloudFlare is a web performance and security company that provides online services to protect
and accelerate websites online
2007 $193Credit Karma develops tools and maintains information resources that help users to manage the
credit aspect of their financial health
2000 $517Deem is a cloud and mobile commerce company, delivering Commerce-as-a-Service (CaaS) to
a large and diverse ecosystem of customers
2003 $460DocuSign employs cloud-based e-signature technology to allow users to sign and send
documents online
2007 $1,100 Dropbox enables users to protect their files with admin control, dedicated support, and more
2006 $200Eventbrite is an online ticketing service that enables users to create, promote, and sell tickets
for events
1996 $291 Good is a pioneer and world leader in secure mobility solutions for businesses
2009 $214Houzz is an online platform for home remodeling, architecture, interior design, decorating,
landscape design, and home improvement
2005 $158Practice Fusion provides a free, web-based Electronic Health Record (EMR) system and
medical practice management technology to physicians
2001 $292Proteus develops digital products that collect and aggregate various behavioral, physiological
and therapeutic metrics
2006 $538 Spotify provides a highly customizable music streaming service
2009 $591Square is a merchant services aggregator and mobile payment company that aims to simplify
commerce through technology
2009 $3,300 Uber provides a smartphone application that connects drivers with people who need a ride
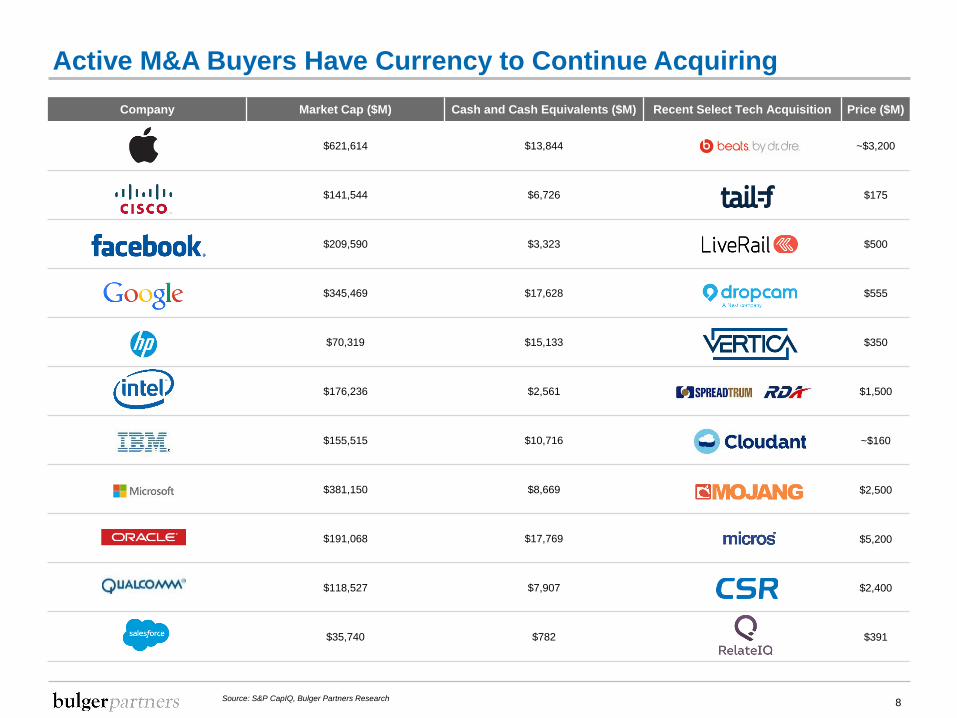
Active M&A Buyers Have Currency to Continue Acquiring
8Source: S&P CapIQ, Bulger Partners Research
Company Market Cap ($M) Cash and Cash Equivalents ($M) Recent Select Tech Acquisition Price ($M)
$621,614 $13,844 ~$3,200
$141,544 $6,726 $175
$209,590 $3,323 $500
$345,469 $17,628 $555
$70,319 $15,133 $350
$176,236 $2,561 $1,500
$155,515 $10,716 ~$160
$381,150 $8,669 $2,500
$191,068 $17,769 $5,200
$118,527 $7,907 $2,400
$35,740 $782 $391
16.4
22.4
10.0
20.0
30.0
40.0
50.0
60.0
70.0
CBOE Volatility S&P 500 Index (^VIX) - Index Value 2008-Present Average
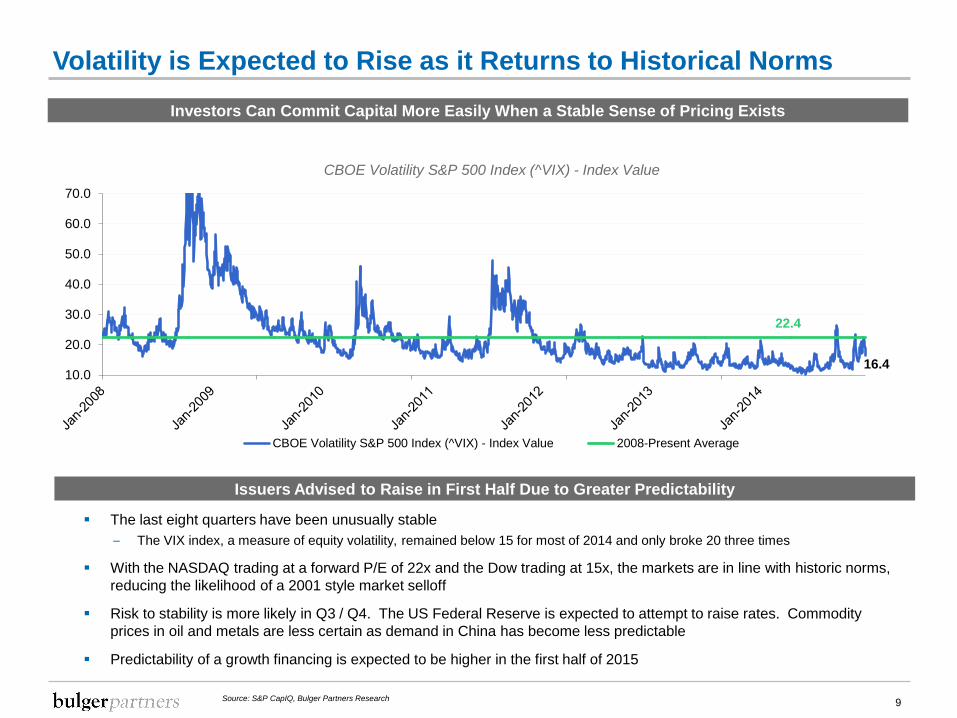
Volatility is Expected to Rise as it Returns to Historical Norms
9
Issuers Advised to Raise in First Half Due to Greater Predictability
Investors Can Commit Capital More Easily When a Stable Sense of Pricing Exists
The last eight quarters have been unusually stable
– The VIX index, a measure of equity volatility, remained below 15 for most of 2014 and only broke 20 three times
With the NASDAQ trading at a forward P/E of 22x and the Dow trading at 15x, the markets are in line with historic norms,
reducing the likelihood of a 2001 style market selloff
Risk to stability is more likely in Q3 / Q4. The US Federal Reserve is expected to attempt to raise rates. Commodity
prices in oil and metals are less certain as demand in China has become less predictable
Predictability of a growth financing is expected to be higher in the first half of 2015
CBOE Volatility S&P 500 Index (^VIX) - Index Value
Source: S&P CapIQ, Bulger Partners Research

2014 Investment Activity
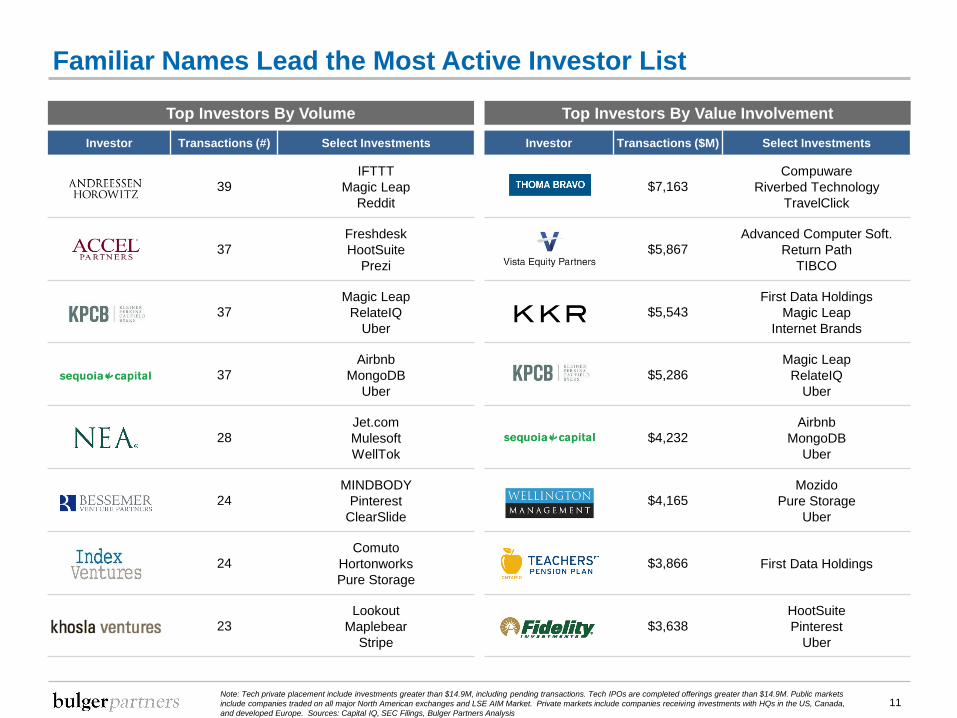
Familiar Names Lead the Most Active Investor List
11Note: Tech private placement include investments greater than $14.9M, including pending transactions. Tech IPOs are completed offerings greater than $14.9M. Public markets
include companies traded on all major North American exchanges and LSE AIM Market. Private markets include companies receiving investments with HQs in the US, Canada,
and developed Europe. Sources: Capital IQ, SEC Filings, Bulger Partners Analysis
Top Investors By Volume Top Investors By Value Involvement
Investor Transactions (#) Select Investments
39IFTTT
Magic Leap
37Freshdesk
HootSuite
Prezi
37Magic Leap
RelateIQ
Uber
37Airbnb
MongoDB
Uber
28Jet.com
Mulesoft
WellTok
24MINDBODY
ClearSlide
24Comuto
Hortonworks
Pure Storage
23Lookout
Maplebear
Stripe
Investor Transactions ($M) Select Investments
$7,163Compuware
Riverbed Technology
TravelClick
$5,867Advanced Computer Soft.
Return Path
TIBCO
$5,543First Data Holdings
Magic Leap
Internet Brands
$5,286Magic Leap
RelateIQ
Uber
$4,232Airbnb
MongoDB
Uber
$4,165Mozido
Pure Storage
Uber
$3,866 First Data Holdings
$3,638HootSuite
Uber

$35.9
$17.1
$61.6
$37.3
$0.0
$10.0
$20.0
$30.0
$40.0
$50.0
$60.0
$70.0
2011 2012 2013 2014
Private Investors Committed $74 Billion to Tech Economy in 2014
$21.0$26.8
$22.2
$36.5
$0.0
$10.0
$20.0
$30.0
$40.0
$50.0
$60.0
$70.0
2011 2012 2013 2014
Minority Investments in the Tech Sector ($B)
Control Investments in Tech Sector ($B)
12
$74B
Capital Increased 64%
Includes Dell
MBO ($27B)
Note: Tech private placement include investments greater than $14.9M, including pending transactions. Tech IPOs are completed offerings greater than $14.9M. Public markets
include companies traded on all major North American exchanges and LSE AIM Market. Private markets include companies receiving investments with HQs in the US, Canada,
and developed Europe. Sources: Capital IQ, SEC Filings, Bulger Partners Analysis
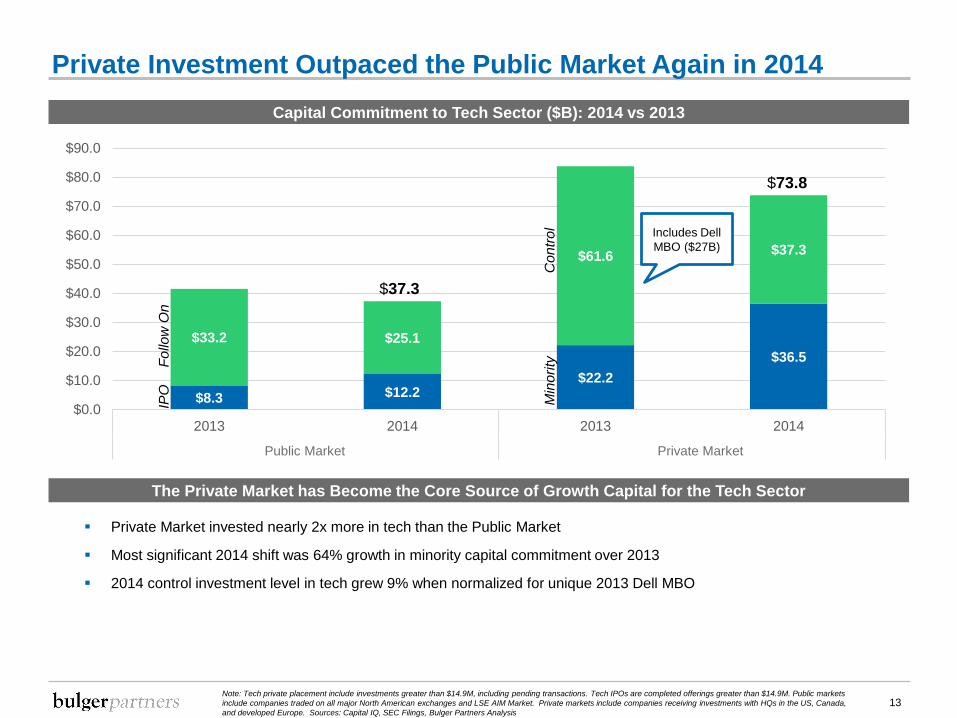
Private Investment Outpaced the Public Market Again in 2014
Note: Tech private placement include investments greater than $14.9M, including pending transactions. Tech IPOs are completed offerings greater than $14.9M. Public markets
include companies traded on all major North American exchanges and LSE AIM Market. Private markets include companies receiving investments with HQs in the US, Canada,
and developed Europe. Sources: Capital IQ, SEC Filings, Bulger Partners Analysis
$8.3 $12.2$22.2
$36.5
$33.2 $25.1
$61.6 $37.3
$0.0
$10.0
$20.0
$30.0
$40.0
$50.0
$60.0
$70.0
$80.0
$90.0
2013 2014 2013 2014
Public PM
Fo
llow
On
Includes Dell
MBO ($27B)
Capital Commitment to Tech Sector ($B): 2014 vs 2013
The Private Market has Become the Core Source of Growth Capital for the Tech Sector
Private Market invested nearly 2x more in tech than the Public Market
Most significant 2014 shift was 64% growth in minority capital commitment over 2013
2014 control investment level in tech grew 9% when normalized for unique 2013 Dell MBO
$37.3
$73.8
13
Private Market
IPO
Co
ntr
ol
Min
ori
ty
Public Market
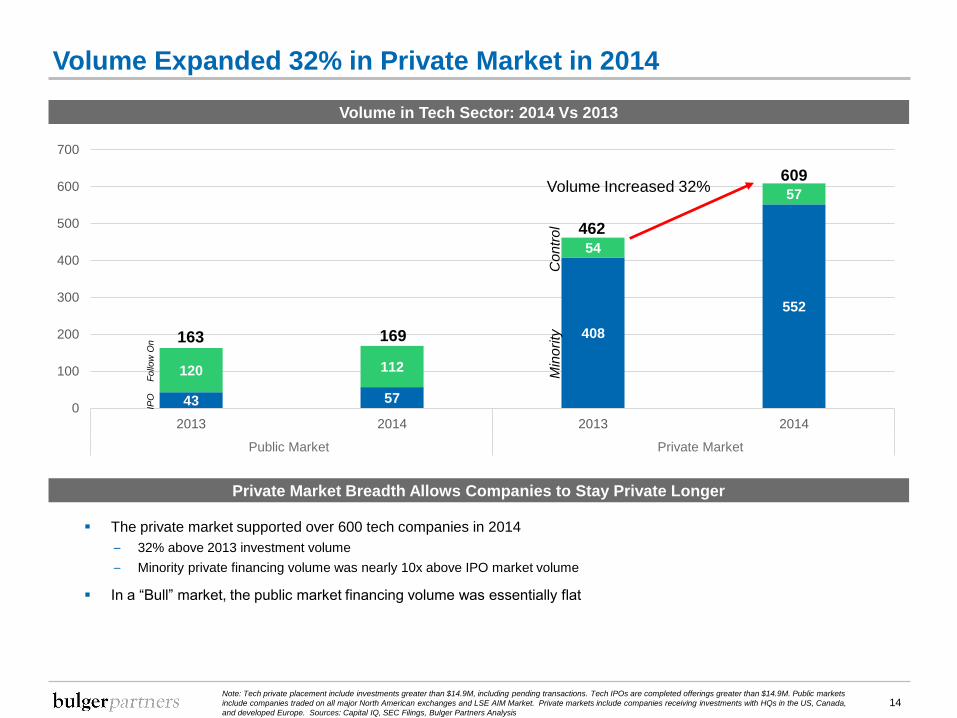
Volume Expanded 32% in Private Market in 2014
43 57
408
552
120 112
54
57
0
100
200
300
400
500
600
700
2013 2014 2013 2014
Public PM
Volume in Tech Sector: 2014 Vs 2013
Private Market Breadth Allows Companies to Stay Private Longer
The private market supported over 600 tech companies in 2014
– 32% above 2013 investment volume
– Minority private financing volume was nearly 10x above IPO market volume
In a “Bull” market, the public market financing volume was essentially flat
14
Private Market
Follo
w O
nIP
O
Co
ntr
ol
Min
ori
ty
609
169
Volume Increased 32%
Note: Tech private placement include investments greater than $14.9M, including pending transactions. Tech IPOs are completed offerings greater than $14.9M. Public markets
include companies traded on all major North American exchanges and LSE AIM Market. Private markets include companies receiving investments with HQs in the US, Canada,
and developed Europe. Sources: Capital IQ, SEC Filings, Bulger Partners Analysis
462
163
Public Market
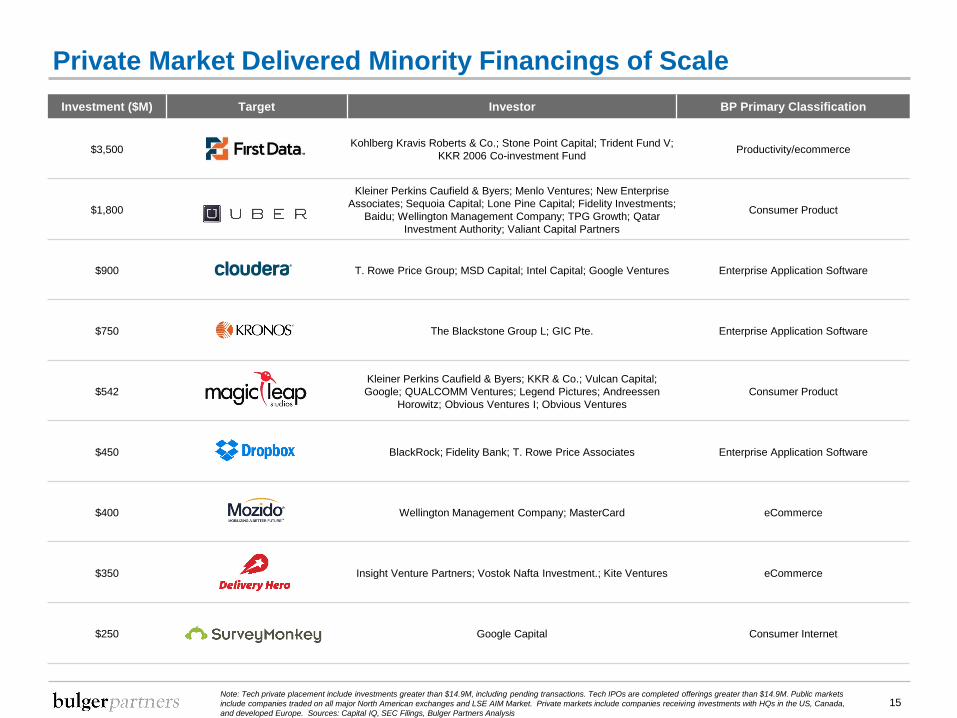
Private Market Delivered Minority Financings of Scale
Investment ($M) Target Investor BP Primary Classification
$3,500Kohlberg Kravis Roberts & Co.; Stone Point Capital; Trident Fund V;
KKR 2006 Co-investment FundProductivity/ecommerce
$1,800
Kleiner Perkins Caufield & Byers; Menlo Ventures; New Enterprise
Associates; Sequoia Capital; Lone Pine Capital; Fidelity Investments;
Baidu; Wellington Management Company; TPG Growth; Qatar
Investment Authority; Valiant Capital Partners
Consumer Product
$900 T. Rowe Price Group; MSD Capital; Intel Capital; Google Ventures Enterprise Application Software
$750 The Blackstone Group L; GIC Pte. Enterprise Application Software
$542
Kleiner Perkins Caufield & Byers; KKR & Co.; Vulcan Capital;
Google; QUALCOMM Ventures; Legend Pictures; Andreessen
Horowitz; Obvious Ventures I; Obvious Ventures
Consumer Product
$450 BlackRock; Fidelity Bank; T. Rowe Price Associates Enterprise Application Software
$400 Wellington Management Company; MasterCard eCommerce
$350 Insight Venture Partners; Vostok Nafta Investment.; Kite Ventures eCommerce
$250 Google Capital Consumer Internet
15Note: Tech private placement include investments greater than $14.9M, including pending transactions. Tech IPOs are completed offerings greater than $14.9M. Public markets
include companies traded on all major North American exchanges and LSE AIM Market. Private markets include companies receiving investments with HQs in the US, Canada,
and developed Europe. Sources: Capital IQ, SEC Filings, Bulger Partners Analysis
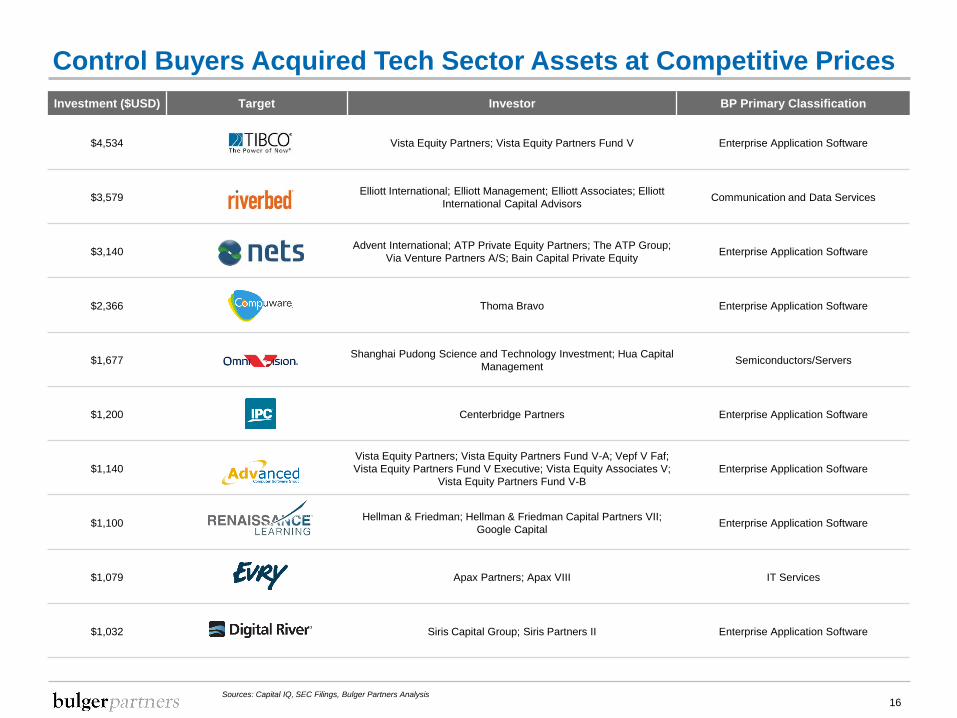
Control Buyers Acquired Tech Sector Assets at Competitive Prices
Investment ($USD) Target Investor BP Primary Classification
$4,534 Vista Equity Partners; Vista Equity Partners Fund V Enterprise Application Software
$3,579Elliott International; Elliott Management; Elliott Associates; Elliott
International Capital AdvisorsCommunication and Data Services
$3,140Advent International; ATP Private Equity Partners; The ATP Group;
Via Venture Partners A/S; Bain Capital Private EquityEnterprise Application Software
$2,366 Thoma Bravo Enterprise Application Software
$1,677Shanghai Pudong Science and Technology Investment; Hua Capital
ManagementSemiconductors/Servers
$1,200 Centerbridge Partners Enterprise Application Software
$1,140
Vista Equity Partners; Vista Equity Partners Fund V-A; Vepf V Faf;
Vista Equity Partners Fund V Executive; Vista Equity Associates V;
Vista Equity Partners Fund V-B
Enterprise Application Software
$1,100Hellman & Friedman; Hellman & Friedman Capital Partners VII;
Google CapitalEnterprise Application Software
$1,079 Apax Partners; Apax VIII IT Services
$1,032 Siris Capital Group; Siris Partners II Enterprise Application Software
16Sources: Capital IQ, SEC Filings, Bulger Partners Analysis

Transaction Terms are Favoring Issuers
Up and Down Rounds by Quarter – Equity Financings
Source: WSGR Entrepreneurs Report
Up Rounds Are Near Historic Highs and Terms Are Favorable
The wealth of up rounds suggests investors are giving companies the benefit of the doubt and placing credence in future
growth plans
– Up rounds in 2014 made up about 80% of the transactions
– Only about 70% of rounds in 2012 and 2013 were up rounds
Terms are moving closer to standardization
– Non-participating preferred structure
– Dividends, but non-cumulative
– No pay to play provisions
17
0
10
20
30
40
50
60
70
80
90
100
Q4 2011 Q1 2012 Q2 2012 Q3 2012 Q4 2012 Q1 2013 Q2 2013 Q3 2013 Q4 2013 Q1 2014 Q2 2014 Q3 2014
Up Down Flat

California Companies Still Overweight in Market
39% of growth capital invested in the
western hemisphere went to California
companies
Uber impacted allocation, but the figure is
still 35% CA normalized for Uber
Investor preference toward California
companies remains an issue for non-
California issuers to overcome
2014 Geographic Allocation of Growth Equity Capital California Bias an Issue
18
California
39%
Georgia
New York
Vaud
Michigan
Berlin
Greater
London
Capital Region
Of Denmark
New
Jersey
Utah
Quebec
Wisconsin
Massachusetts
Arizona
Akershus
Surrey
Utah
Florida
Texas
Stockholm
County
New York & Berlin Gain, Texas is Light
New York is attracting growth capital as
ad tech and social media gain share
Berlin attracted almost as much growth
capital as London
Texas and North Carolina companies
attracted surprisingly little growth capital
given strong start-up communities in
Austin and RTP
Strength in Michigan, Georgia, Wisconsin
and Denmark was driven by large buyout
investments (Compuware, First Data,
Renaissance Learning and Nets
Holdings)
Note: Tech private placement include investments greater than $14.9M, including pending transactions. Tech IPOs are completed offerings greater than $14.9M. Public markets
include companies traded on all major North American exchanges and LSE AIM Market. Private markets include companies receiving investments with HQs in the US, Canada,
and developed Europe. Sources: Capital IQ, SEC Filings, Bulger Partners Analysis
Madrid

Investor Activity Across Tech Sectors
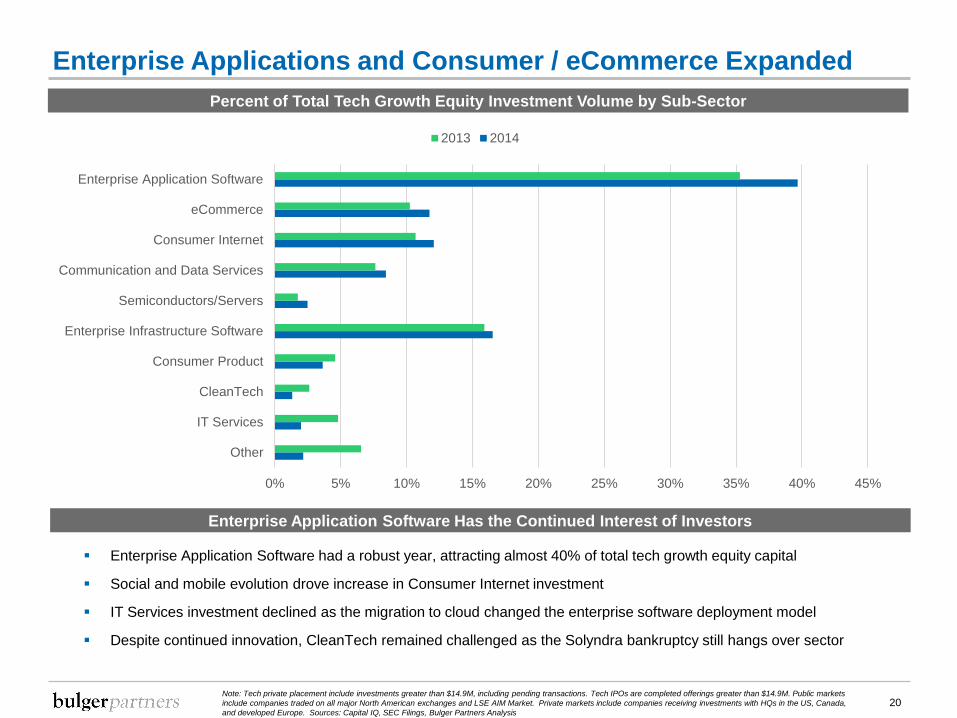
Enterprise Applications and Consumer / eCommerce Expanded
Enterprise Application Software Has the Continued Interest of Investors
20
Enterprise Application Software had a robust year, attracting almost 40% of total tech growth equity capital
Social and mobile evolution drove increase in Consumer Internet investment
IT Services investment declined as the migration to cloud changed the enterprise software deployment model
Despite continued innovation, CleanTech remained challenged as the Solyndra bankruptcy still hangs over sector
Note: Tech private placement include investments greater than $14.9M, including pending transactions. Tech IPOs are completed offerings greater than $14.9M. Public markets
include companies traded on all major North American exchanges and LSE AIM Market. Private markets include companies receiving investments with HQs in the US, Canada,
and developed Europe. Sources: Capital IQ, SEC Filings, Bulger Partners Analysis
0% 5% 10% 15% 20% 25% 30% 35% 40% 45%
Other
IT Services
CleanTech
Consumer Product
Enterprise Infrastructure Software
Semiconductors/Servers
Communication and Data Services
Consumer Internet
eCommerce
Enterprise Application Software
2013 2014
Percent of Total Tech Growth Equity Investment Volume by Sub-Sector

Horizontal Applications Displaced Vertical Applications
Investor Focus on SaaS Business Models Created Bias Toward Horizontal Applications
21
Investment in sales infrastructure shifted from marketing automation to sales execution tools within the CRM / SFA
segment
Human Capital Management gained attention as next generation talent recruiting platforms began to scale and benefits
management continued to move to cloud-centric solutions
Platforms for deploying Hadoop and its derivatives attracted capital within the BI / Analytics segment as the enterprise
begins to convert Big Data from lab projects into production systems
Note: Tech private placement include investments greater than $14.9M, including pending transactions. Tech IPOs are completed offerings greater than $14.9M. Public markets
include companies traded on all major North American exchanges and LSE AIM Market. Private markets include companies receiving investments with HQs in the US, Canada,
and developed Europe. Sources: Capital IQ, SEC Filings, Bulger Partners Analysis
0% 5% 10% 15% 20% 25% 30% 35% 40% 45%
Vertical Other
HCIT
Marketing Automation
Engineering Software
FinTech
Education
HCM
ERP/Supply Chain
CRM/SFA
Productivity/Other
BI/Analytics
2013 2014
Percent of Total Enterprise Application Software Investments by Sub Sector

Sector Spotlight: Sales Infrastructure – CRM & SFA
Percentage Allocation to CRM/SFA Increased In 2014
22
Private Placement
$100M
Top Financial Investors Top Corporate Investors
Interesting 2014 Minority Investments
Private Placement
$50M
Private Placement
$90M
Private Placement
$50M
Private Placement
$100M
Private Placement
$20M
Interesting Companies to Watch in 2015
Last Round: $22M Total
Raised: $33M
Founded: 2007
Last Round: $31M
Total Raised: $44M
Founded: 2010
Last Round: N/M
Total Raised: N/M
Founded: 2011
Last Round: $20M
Total Raised: $34M
Founded: 2010
Note: Tech private placement include investments greater than $14.9M, including pending transactions. Tech IPOs are completed offerings greater than $14.9M. Public markets
include companies traded on all major North American exchanges and LSE AIM Market. Private markets include companies receiving investments with HQs in the US, Canada,
and developed Europe. Sources: Capital IQ, SEC Filings, Bulger Partners Analysis
0% 1% 2% 3% 4% 5% 6% 7% 8% 9% 10%
2014
2013

Sector Spotlight: Human Capital Management
Percentage Allocation to HCM Investments Jumped in 2014
23
Private Placement
$750M
Top Financial Investors Top Corporate Investors
Interesting 2014 Minority Investments
Private Placement
$63M
Private Placement
$67M
Private Placement
$85M
Private Placement
$51M
Private Placement
$20M
Interesting Companies to Watch in 2015
Last Round: $16M
Total Raised: $63M
Founded: 2009
Last Round: $41M
Total Raised: $41M
Founded: 2005
Last Round: $25M
Total Raised: $52M
Founded: 2004
Last Round: $20M
Total Raised: $25M
Founded: 2007
Note: Tech private placement include investments greater than $14.9M, including pending transactions. Tech IPOs are completed offerings greater than $14.9M. Public markets
include companies traded on all major North American exchanges and LSE AIM Market. Private markets include companies receiving investments with HQs in the US, Canada,
and developed Europe. Sources: Capital IQ, SEC Filings, Bulger Partners Analysis
0% 1% 2% 3% 4% 5% 6% 7% 8%
2014
2013

Key Private Market Trends
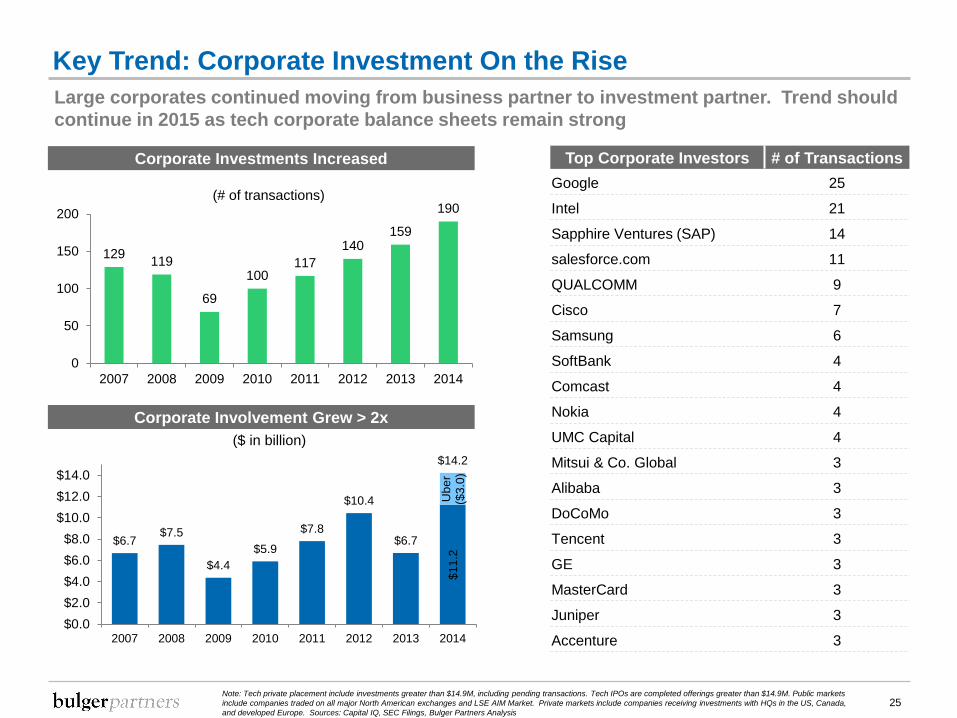
Key Trend: Corporate Investment On the Rise
129119
69
100117
140159
190
0
50
100
150
200
2007 2008 2009 2010 2011 2012 2013 2014
(# of transactions)
$1
1.2
Ube
r($
3.0
)
$6.7$7.5
$4.4
$5.9
$7.8
$10.4
$6.7
$14.2
$0.0
$2.0
$4.0
$6.0
$8.0
$10.0
$12.0
$14.0
2007 2008 2009 2010 2011 2012 2013 2014
($ in billion)
Top Corporate Investors # of Transactions
Google 25
Intel 21
Sapphire Ventures (SAP) 14
salesforce.com 11
QUALCOMM 9
Cisco 7
Samsung 6
SoftBank 4
Comcast 4
Nokia 4
UMC Capital 4
Mitsui & Co. Global 3
Alibaba 3
DoCoMo 3
Tencent 3
GE 3
MasterCard 3
Juniper 3
Accenture 3
Corporate Investments Increased
Corporate Involvement Grew > 2x
25
Large corporates continued moving from business partner to investment partner. Trend should
continue in 2015 as tech corporate balance sheets remain strong
Note: Tech private placement include investments greater than $14.9M, including pending transactions. Tech IPOs are completed offerings greater than $14.9M. Public markets
include companies traded on all major North American exchanges and LSE AIM Market. Private markets include companies receiving investments with HQs in the US, Canada,
and developed Europe. Sources: Capital IQ, SEC Filings, Bulger Partners Analysis

Most Active Corporate Investors By Technology Sub-Sector
Enterprise Application
Intel
salesforce.com
Sapphire Ventures (SAP)
QUALCOMM
Cisco
Horizons Ventures Limited
Adobe
SoftBank
Comcast
Enterprise Infrastructure
Sapphire Ventures (SAP)
Samsung
Cisco
Intel
Telstra
NTT DoCoMo
United Microelectronics
QUALCOMM
salesforce.com
Consumer Internet
Recruit Holdings
MGM Resorts International
Access Industries
Advanced Micro Devices
Amazon.com
Bertelsmann
IAC/InterActiveCorp
eCommerce
Tengelmann
Scripps Networks
Nokia
Bertelsmann
SoftBank
Comcast
MasterCard
Conde Nast
Rocket Internet AG
Difference Capital Financial
CRM/SFA
salesforce.com
News Corporation
TripleFive
Adobe
Cisco
Intel
Samsung
Marketing Automation
SoftBank
WPP Digital
Adobe
Intel
Akamai Technologies
salesforce.com
Comcast
HCIT
QUALCOMM
Wellcome Trust
HCA
salesforce.com
CHV Capital
Foundation Medical Partners
GE Ventures
HCM
Sapphire Ventures (SAP)
Recruit Holdings
26Note: Tech private placement include investments greater than $14.9M, including pending transactions. Tech IPOs are completed offerings greater than $14.9M. Public
markets include companies traded on all major North American exchanges and LSE AIM Market. Private markets include companies receiving investments with HQs in the
US, Canada, and developed Europe. Sources: Capital IQ, SEC Filings, Bulger Partners Analysis
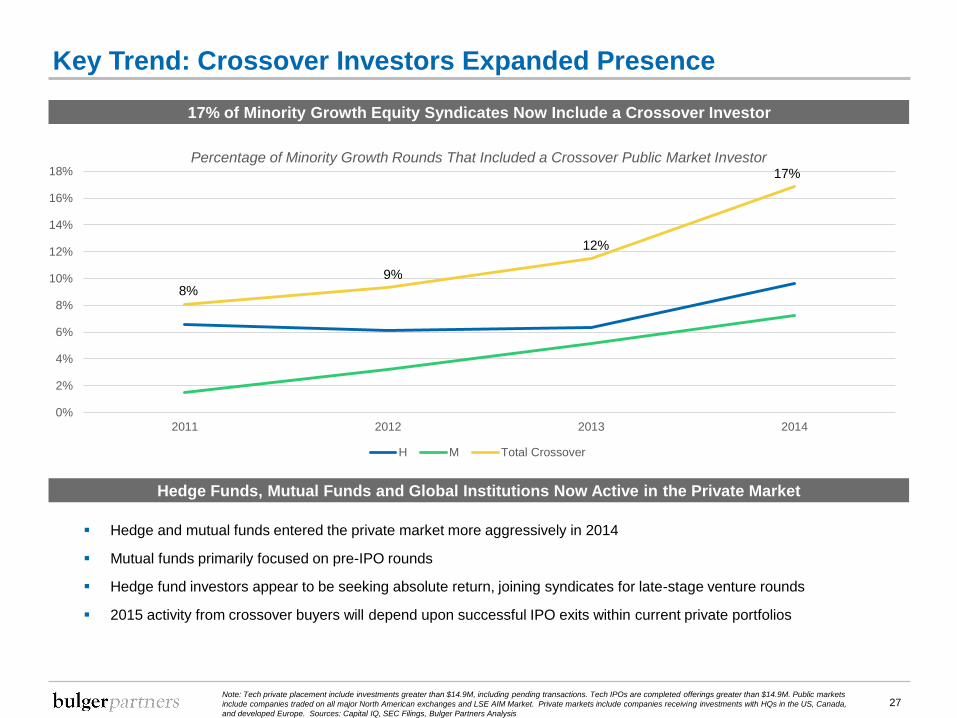
Key Trend: Crossover Investors Expanded Presence
27
8%
9%
12%
17%
0%
2%
4%
6%
8%
10%
12%
14%
16%
18%
2011 2012 2013 2014
H M Total Crossover
17% of Minority Growth Equity Syndicates Now Include a Crossover Investor
Hedge Funds, Mutual Funds and Global Institutions Now Active in the Private Market
Hedge and mutual funds entered the private market more aggressively in 2014
Mutual funds primarily focused on pre-IPO rounds
Hedge fund investors appear to be seeking absolute return, joining syndicates for late-stage venture rounds
2015 activity from crossover buyers will depend upon successful IPO exits within current private portfolios
Percentage of Minority Growth Rounds That Included a Crossover Public Market Investor
Note: Tech private placement include investments greater than $14.9M, including pending transactions. Tech IPOs are completed offerings greater than $14.9M. Public markets
include companies traded on all major North American exchanges and LSE AIM Market. Private markets include companies receiving investments with HQs in the US, Canada,
and developed Europe. Sources: Capital IQ, SEC Filings, Bulger Partners Analysis

The Largest Public Market Investors Have Entered Growth Equity
28
Name Brand Funds Are Investing Most Actives
T. Rowe Price was an early crossover investor
adding names such as Domo, Doximity, Houzz,
Dropbox, Eventbrite and Cloudera
Fidelity was more active in 2014 joining syndicates
for Pinterest, Pure Storage, Domo, Uber and
Hootsuite
Wellington assembled a broad private tech portfolio
including Lookout, New Relic, Apigee, DataLogix,
Veracode and Mozido
Wasatch and Firsthand Capital continued long
patterns of crossover investment in growth tech
Note: Tech private placement include investments greater than $14.9M, including pending transactions. Tech IPOs are completed offerings greater than $14.9M. Public markets
include companies traded on all major North American exchanges and LSE AIM Market. Private markets include companies receiving investments with HQs in the US, Canada,
and developed Europe. Sources: Capital IQ, SEC Filings, Bulger Partners Analysis
Mutual Funds:
Hedge Funds:
A core set of hedge funds are frequent
investors in late-stage venture syndicates:
− Coatue − Passport
− ICONIQ − Dragoneer
− Valiant − Altimeter
Global Investors:
Sovereign funds such as Temasek increased
growth tech investment, as did global institutional
investors like Goldman Sachs
Tiger Global created a platform dedicated to
growth tech equity on a global scale
Key Trend: Increased Growth Investing Across Asia
26
32
23
59
0
10
20
30
40
50
60
70
2011 2012 2013 2014
$1.1
$3.7
$2.8
$5.5
$0.0
$1.0
$2.0
$3.0
$4.0
$5.0
$6.0
2011 2012 2013 2014
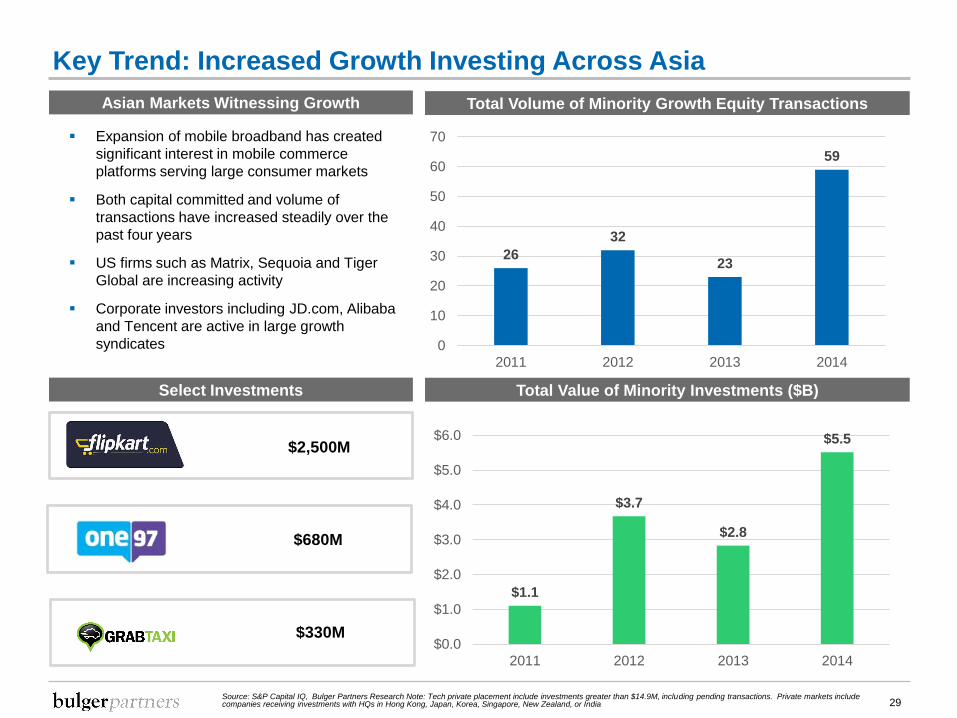
Expansion of mobile broadband has created
significant interest in mobile commerce
platforms serving large consumer markets
Both capital committed and volume of
transactions have increased steadily over the
past four years
US firms such as Matrix, Sequoia and Tiger
Global are increasing activity
Corporate investors including JD.com, Alibaba
and Tencent are active in large growth
syndicates
Total Volume of Minority Growth Equity Transactions
Total Value of Minority Investments ($B)
Source: S&P Capital IQ, Bulger Partners Research Note: Tech private placement include investments greater than $14.9M, including pending transactions. Private markets include companies receiving investments with HQs in Hong Kong, Japan, Korea, Singapore, New Zealand, or India
Select Investments
$2,500M
Asian Markets Witnessing Growth
$680M
$330M
29

Capital Supply - 2014 GP Fundraising
$0
$50.0
$100.0
$150.0
$200.0
$250.0
$300.0
$350.0
$400.0
$450.0
2004 2005 2006 2007 2008 2009 2010 2011 2012 2013 2014
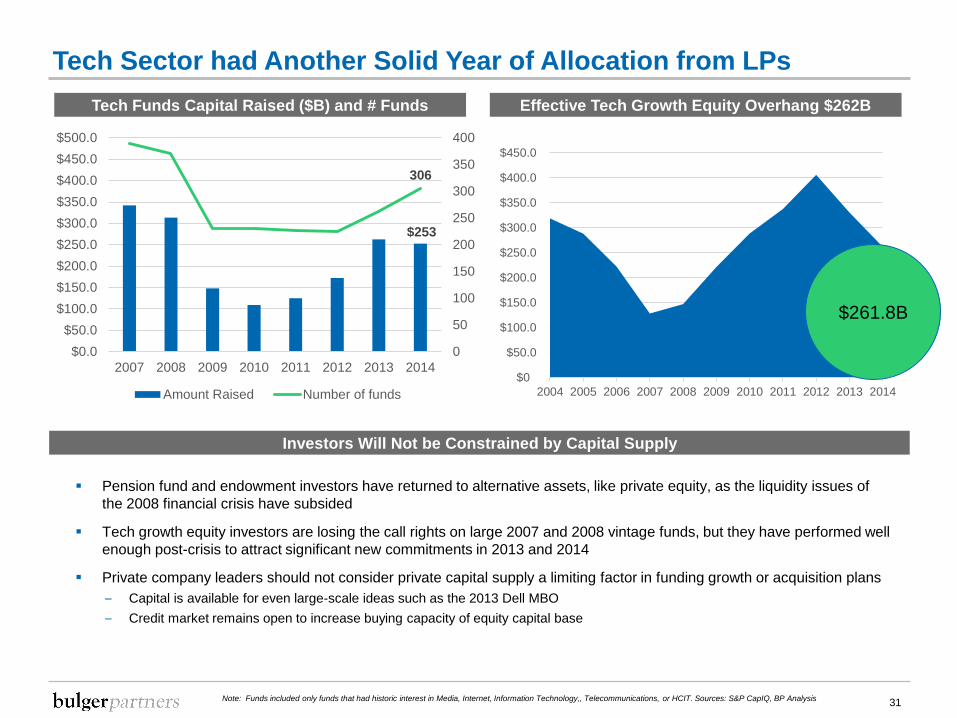
Tech Sector had Another Solid Year of Allocation from LPs
Tech Funds Capital Raised ($B) and # Funds
Investors Will Not be Constrained by Capital Supply
31
Effective Tech Growth Equity Overhang $262B
$261.8B
Pension fund and endowment investors have returned to alternative assets, like private equity, as the liquidity issues of
the 2008 financial crisis have subsided
Tech growth equity investors are losing the call rights on large 2007 and 2008 vintage funds, but they have performed well
enough post-crisis to attract significant new commitments in 2013 and 2014
Private company leaders should not consider private capital supply a limiting factor in funding growth or acquisition plans
– Capital is available for even large-scale ideas such as the 2013 Dell MBO
– Credit market remains open to increase buying capacity of equity capital base
$253
306
0
50
100
150
200
250
300
350
400
$0.0
$50.0
$100.0
$150.0
$200.0
$250.0
$300.0
$350.0
$400.0
$450.0
$500.0
2007 2008 2009 2010 2011 2012 2013 2014
Amount Raised Number of funds
Note: Funds included only funds that had historic interest in Media, Internet, Information Technology,, Telecommunications, or HCIT. Sources: S&P CapIQ, BP Analysis
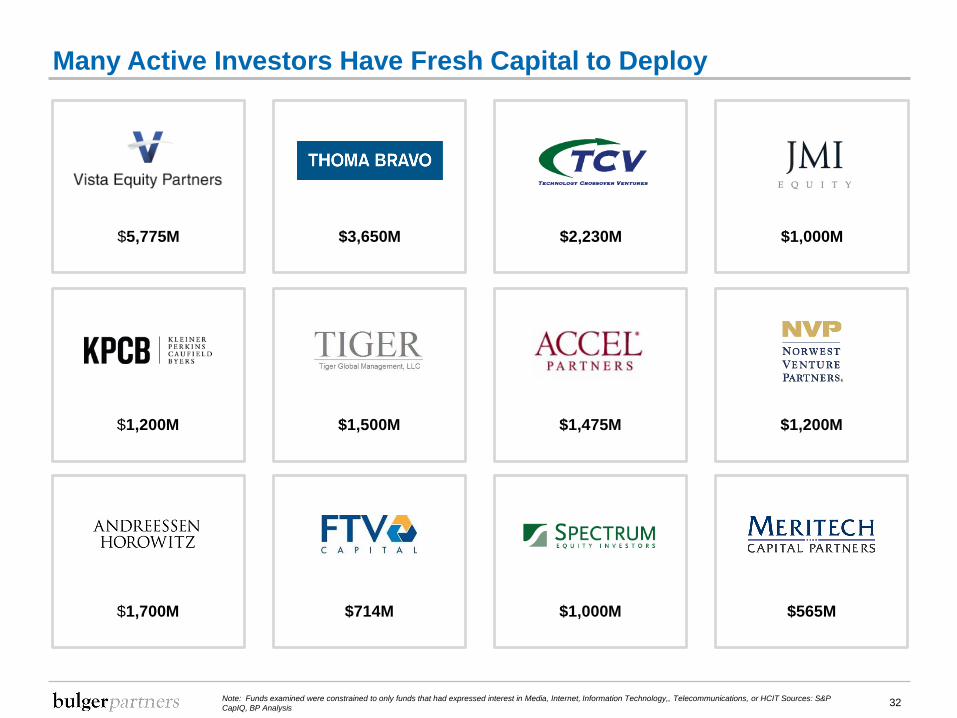
Many Active Investors Have Fresh Capital to Deploy
32
$1,200M $1,500M $1,200M$1,475M
$5,775M $1,000M$2,230M$3,650M
Note: Funds examined were constrained to only funds that had expressed interest in Media, Internet, Information Technology,, Telecommunications, or HCIT Sources: S&P
CapIQ, BP Analysis
$1,700M $714M $565M$1,000M
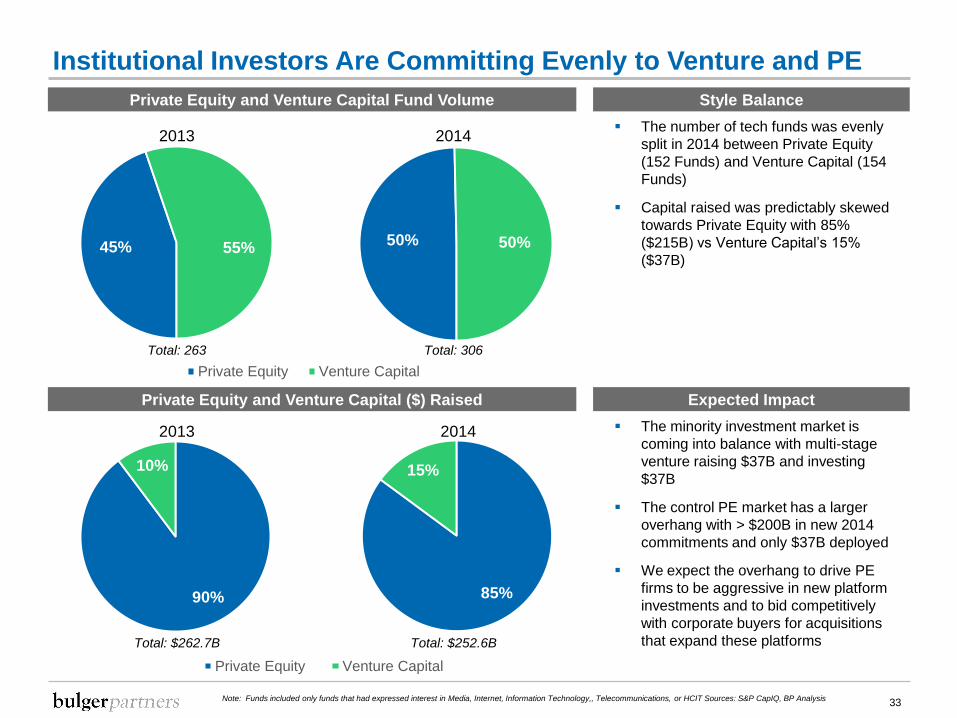
90%
10%
Private Equity Venture Capital
50% 50%
Private Equity Venture Capital
85%
15%
Institutional Investors Are Committing Evenly to Venture and PE
Private Equity and Venture Capital Fund Volume
33
Private Equity and Venture Capital ($) Raised
45% 55%
2013 2014
2013 2014
Style Balance
The number of tech funds was evenly
split in 2014 between Private Equity
(152 Funds) and Venture Capital (154
Funds)
Capital raised was predictably skewed
towards Private Equity with 85%
($215B) vs Venture Capital’s 15%
($37B)
Expected Impact
The minority investment market is
coming into balance with multi-stage
venture raising $37B and investing
$37B
The control PE market has a larger
overhang with > $200B in new 2014
commitments and only $37B deployed
We expect the overhang to drive PE
firms to be aggressive in new platform
investments and to bid competitively
with corporate buyers for acquisitions
that expand these platformsTotal: $252.6BTotal: $262.7B
Total: 306Total: 263
Note: Funds included only funds that had expressed interest in Media, Internet, Information Technology,, Telecommunications, or HCIT Sources: S&P CapIQ, BP Analysis
Mike MacKeenManaging Director
Head of Private Capital Markets Group and Co-Head of
Investment Banking
Expertise
Capital formation for high-growth companies, venture capital and private equity investment, secondary direct
investments, business planning, diligence and strategy and presentation training. Deep experience across
media and technology sectors including consumer and enterprise application software, mobile applications,
network infrastructure, tech-enabled services and financial technology.
About Mike
Mike leads our investment banking activities with global leadership responsibility for Private Capital Markets.
Mike is one of the most active and experienced bankers in direct equity private placements for the technology,
media and telecommunications sectors. He has spent two decades focused exclusively on providing growth
capital for entrepreneurial companies. During this time Mike has provided growth companies with over
$1,000,000,000 in new equity capital. He maintains active relationships with leading growth equity, strategic
and family office investors around the world.
Mike has great enthusiasm for innovation and new products. He has helped entrepreneurs fund innovation at
market disrupting companies such as VistaPrint, Cardlytics, TopCoder, Nexidia and Tongal. Mike began his
career on the team that launched Hyundai Motor Corp in the US market. He is a co-author of a book on New
Product introductions where he wrote about the launch of MTV. Mike serves as a mentor and advisor to young
companies and a judge in business plan competitions.
Prior to joining Bulger Partners, Mike helped launch Revolution Partners which he helped build into a leading
investment bank serving middle market technology companies. Prior to Revolution, Mike was a key member of
the Robertson Stephens Private Capital Markets Group, which became the largest and most active private
placement group in the technology and healthcare industries.
Mike holds degrees from the McDonough School at Georgetown University and the Carroll School at Boston
College. He is also a Chartered Financial Analyst.
Mike MacKeen
CV Summary
Advisory Boards of wymsee, MyNetDiary & Phyre
Executive Committee - Boston College Technology Council
Revolution Partners, Group Head, Management Committee
Robertson Stephens, Private Capital Markets Group
BankBoston Corp, Media and Communications Group
Ford Motor Company, Zone Manager
Hyundai Motor America, District Manager
Chartered Financial Analyst
Georgetown University, McDonough School of Business, MBA
University of Oxford. Brasenose College, Executive Programon Globalization
Boston College, Carroll School of Management, BS
Representative Clients
34