Embed Size (px)
Citation preview
U.S. DEPARTMENT OF EDUCATION
2015–16 National Postsecondary Student Aid Study (NPSAS:16)Student Financial Aid Estimates for 2015–16
First Look
NCES 2018-466
This page intentionally left blank
NCES 2018-466
U.S. DEPARTMENT OF EDUCATION
2015–16 National Postsecondary Student Aid Study (NPSAS:16) Student Financial Aid Estimates for 2015–16
First Look
JANUARY 2018
David Radwin Johnathan G. Conzelmann Annaliza Nunnery T. Austin Lacy Joanna Wu Stephen Lew Jennifer Wine Peter Siegel RTI International
Tracy Hunt-White Project Officer National Center for Education Statistics
U.S. Department of Education Betsy DeVos Secretary
Institute of Education Sciences Thomas W. Brock, Commissioner for Education Research Delegated Duties of the Director
National Center for Education Statistics Peggy G. Carr Acting Commissioner
The National Center for Education Statistics (NCES) is the primary federal entity for collecting, analyzing, and reporting data related to education in the United States and other nations. It fulfills a congressional mandate to collect, collate, analyze, and report full and complete statistics on the condition of education in the United States; conduct and publish reports and specialized analyses of the meaning and significance of such statistics; assist state and local education agencies in improving their statistical systems; and review and report on education activities in foreign countries.
NCES activities are designed to address high-priority education data needs; provide consistent, reliable, complete, and accurate indicators of education status and trends; and report timely, useful, and high-quality data to the U.S. Department of Education, the Congress, the states, other education policymakers, practitioners, data users, and the general public. Unless specifically noted, all information contained herein is in the public domain.
We strive to make our products available in a variety of formats and in language that is appropriate to a variety of audiences. You, as our customer, are the best judge of our success in communicating information effectively. If you have any comments or suggestions about this or any other NCES product or report, we would like to hear from you. Please direct your comments to
NCES, IES, U.S. Department of Education Potomac Center Plaza 550 12th Street SW Washington, DC 20202
January 2018
The NCES Home Page address is http://nces.ed.gov. The NCES Publications and Products address is http://nces.ed.gov/pubsearch.
This publication is only available online. To download, view, and print the report as a PDF file, go to the NCES Publications and Products address shown above.
This report was prepared for the National Center for Education Statistics under Contract No. ED-IES-13-C-0070 with RTI International. Mention of trade names, commercial products, or organizations does not imply endorsement by the U.S. Government.
Suggested Citation Radwin, D., Conzelmann, J.G., Nunnery, A., Lacy, T.A., Wu, J., Lew, S., Wine, J., and Siegel, P. (2018). 2015–16 National Postsecondary Student Aid Study (NPSAS:16): Student Financial Aid Estimates for 2015–16 (NCES 2018-466). U.S. Department of Education. Washington, DC: National Center for Education Statistics. Retrieved [date] from http://nces.ed.gov/pubsearch/pubsinfo.asp?pubid=2018466.
Content Contact National Center for Education Statistics [email protected] (800) 677-6987

iii
Acknowledgments
The authors sincerely thank all the individuals who contributed to the 2015–16 National Postsecondary Student Aid Study (NPSAS:16), particularly the students who participated in the interview and the institutional staff who provided student records. This study could not have been completed without their contributions.

This page intentionally left blank
v
Contents
PAGE
Acknowledgments ................................................................................................................. iii
List of Tables ......................................................................................................................... vi
Introduction ............................................................................................................................ 1
Selected Findings .................................................................................................................... 5
Tables ....................................................................................................................................... 6
References ............................................................................................................................. 21
Appendix A—Glossary ..................................................................................................... A-1
Appendix B—Technical Notes and Methodology ........................................................ B-1
Appendix C—Standard Error Tables ............................................................................ C-1
vi
List of Tables
TABLE PAGE
1. Percentage of undergraduates receiving selected types of financial aid, by control and level of institution, attendance pattern, dependency status, and income level: 2015–16 .......................................................................... 6
2. Average amounts of selected types of financial aid received by undergraduates who received any aid, by control and level of institution, attendance pattern, dependency status, and income level: 2015–16 ...................................................................................................................... 8
3. Percentage of undergraduates receiving selected types of financial aid from federal, state, or institutional sources, by control and level of institution, attendance pattern, dependency status, and income level: 2015–16 ................................................................................................................... 10
4. Average amounts of selected types of financial aid from federal, state, or institutional sources received among undergraduates receiving that type of aid, by control and level of institution, attendance pattern, dependency status, and income level: 2015–16 .................................................. 12
5. Percentage of undergraduates receiving federal Title IV aid from selected programs, by control and level of institution, attendance pattern, dependency status, and income level: 2015–16 ................................... 14
6. Average amounts of federal Title IV aid received by undergraduates from selected programs, by control and level of institution, attendance pattern, dependency status, and income level: 2015–16 ................................... 16
7. Percentage of graduate students receiving selected types of financial aid, by control and level of institution, graduate program, attendance pattern, and income level: 2015–16 ..................................................................... 18
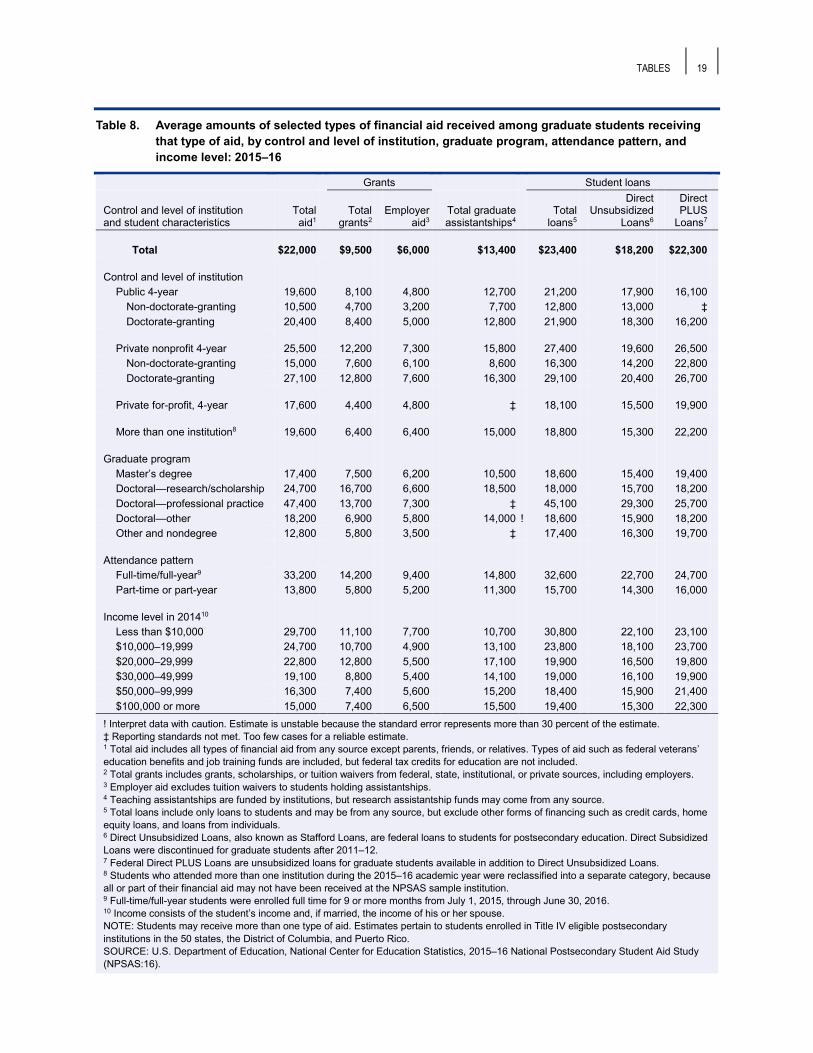
8. Average amounts of selected types of financial aid received among graduate students receiving that type of aid, by control and level of institution, graduate program, attendance pattern, and income level: 2015–16 .................................................................................................................... 19
LIST OF TABLES vii
APPENDIX B TABLE PAGE
B-1. Numbers of sampled, eligible, and participating institutions and participation rates, by control and level of institution: 2015–16 ................... B-7
B-2. Numbers of sampled and eligible students and rates of study membership, by control and level of institution: 2015–16 ............................. B-8
B-3. Summary of components of the student analysis weight: 2015–16 ............ B-11
B-4. Summary of institution-level nonresponse bias analysis, by control and level of institution: 2015–16 .............................................................................. B-15
B-5. Summary of institution-level differences between means, by control and level of institution: 2015–16 ...................................................................... B-16
B-6. Summary of student-level nonresponse bias analysis, by control and level of institution: 2015–16 .............................................................................. B-19
B-7. Summary of student-level differences between means, by control and level of institution: 2015–16 .............................................................................. B-21
B-8. Weighted student-level item response rates, by control and level of institution: 2015–16 ............................................................................................ B-24
B-9. Summary of item nonresponse bias analysis for all students: 2015–16 ...... B-26
APPENDIX C TABLE PAGE
C-1. Standard errors for table 1: Percentage of undergraduates receiving selected types of financial aid, by control and level of institution, attendance pattern, dependency status, and income level: 2015–16 ............. C-2
C-2. Standard errors for table 2: Average amounts of selected types of financial aid received by undergraduates who received any aid, by control and level of institution, attendance pattern, dependency status, and income level: 2015–16 .................................................................................. C-3
viii LIST OF TABLES
TABLE PAGE
C-3. Standard errors for table 3: Percentage of undergraduates receiving selected types of financial aid from federal, state, or institutional sources, by control and level of institution, attendance pattern, dependency status, and income level: 2015–16 ................................................ C-4
C-4. Standard errors for table 4: Average amounts of selected types of financial aid from federal, state, or institutional sources received among undergraduates receiving that type of aid, by control and level of institution, attendance pattern, dependency status, and income level: 2015–16 .................................................................................................................. C-5
C-5. Standard errors for table 5: Percentage of undergraduates receiving federal Title IV aid from selected programs, by control and level of institution, attendance pattern, dependency status, and income level: 2015–16 .................................................................................................................. C-6
C-6. Standard errors for table 6: Average amounts of federal Title IV aid received by undergraduates from selected programs, by control and level of institution, attendance pattern, dependency status, and income level: 2015–16 ........................................................................................................ C-7
C-7. Standard errors for table 7: Percentage of graduate students receiving selected types of financial aid, by control and level of institution, graduate program, attendance pattern, and income level: 2015–16 .............. C-8
C-8. Standard errors for table 8: Average amounts of selected types of financial aid received among graduate students receiving that type of aid, by control and level of institution, graduate program, attendance pattern, and income level: 2015–16 ................................................................... C-9
1
Introduction
This First Look report presents selected findings about student financial aid during the 2015–16 academic year. These findings are based on data from the 2015–16 National Postsecondary Student Aid Study (NPSAS:16), a nationally representative sample survey of undergraduate and graduate students enrolled any time between July 1, 2015, and June 30, 2016, in institutions eligible to participate in federal financial aid programs. The primary purpose of NPSAS:16 is to measure how students and their families pay for postsecondary education at Title IV eligible institutions, with particular emphasis on federal student aid provided through Title IV of the Higher Education Act of 1965, as amended.
The NPSAS:16 sample consists of about 89,000 undergraduate and 24,000 graduate students attending approximately 1,800 Title IV eligible postsecondary institutions in the 50 states, the District of Columbia, and Puerto Rico. The sample represents approximately 20 million undergraduate and 4 million graduate students1 enrolled in postsecondary education at Title IV eligible institutions at any time between July 1, 2015, and June 30, 2016. Further details about the NPSAS:16 sample are provided in appendix B, along with information about key changes to NPSAS cycles over time for readers interested in comparisons over time.
This report classifies financial aid by type (grants, loans, work-study, and other) and source (federal, state, institutional, employer, and other private sources). The three major types of aid for undergraduate students are grants, loans, and work-study. Grants include scholarships, tuition waivers, employer tuition reimbursements, and federal grants such as Pell Grants. Student loans, which must be paid back or forgiven, include federal Direct Subsidized and Unsubsidized Loans (also known as Stafford Loans), federal Perkins Loans, state loans, institutional loans, and private or alternative loans. Direct Subsidized Loans and Perkins Loans are limited to students with demonstrated financial need (need-based aid), while Direct Unsubsidized Loans are available regardless of need. Parents of dependent undergraduates may borrow using Direct PLUS Loans. These loans do not count toward students’ borrowing because their parents are responsible for repayment, but they are considered part of students’ total aid received. Work-study provides part-time employment to students with demonstrated financial need. It is partially underwritten by federal (and, in rare
1 These population enrollment figures are adjusted to account for students who enroll in more than one institution in the same academic year (Wine, Stollberg, and Siegel forthcoming). They may differ from other enrollment statistics that are computed without this adjustment.
2 INTRODUCTION
cases, state or institutional) subsidies. Other aid is composed of federal veterans’ education benefits, military (Department of Defense) aid, and vocational rehabilitation and job training grants. Additional details about types of aid to undergraduates are provided in appendix A.
Graduate students receive grants and fellowships from the federal government; state governments; institutions; and private organizations, including their employers. Graduate students may also take out federal Direct Unsubsidized Loans and federal Direct PLUS Loans.2 In addition, some graduate students may receive assistantships from their institutions or other sources, and some may participate in work-study. Further details about these types of aid to graduate students are provided in appendix A.
One of the main factors associated with the allocation of student financial aid overall is the total price of attendance, which is the sum of tuition and fees, housing, books, and other expenses (Higher Education Opportunity Act of 2008). Because average prices vary substantially by type of institution (Radwin and Wei 2015), student financial aid estimates in this report are presented by institutional control and level.3 Results for undergraduates at public 4-year, non-doctorate-granting institutions are further subdivided by whether the institutions primarily confer subbaccalaureate awards (certificates and associate’s degrees) or bachelor’s degrees.
Enrollment status is a second major factor related to eligibility for student aid from federal and other sources. Students who enroll full time (usually at least 12 credits for undergraduates and 9 credits for graduate students) for the full academic year (9 months or longer) generally have greater expenses and qualify for more aid than their counterparts who enroll part time or for fewer than 9 months. Consequently, this report shows student financial aid estimates for both full-time, full-year students (enrolled full time for 9 or more months) and those who enroll part time or for part of the year.
A third factor associated with aid eligibility is the student’s family income, which is determined by the student’s dependency status. For financial aid purposes, dependent students are undergraduates under 24 years of age who are unmarried, do not have dependents, are not veterans or on active military duty, are not orphans or wards of the court, are not homeless or at risk of homelessness, and have not been deemed independent by a financial aid officer. All other undergraduates and all
2 Direct Subsidized Loans were discontinued for graduate students after the 2011–12 academic year. 3 Control refers to the source of revenue and control of operations (public, private nonprofit, private for-profit), and level refers to the highest degree or award offered by the institution in any program. Additional details are available in appendix A.

INTRODUCTION 3
graduate students are considered independent. For dependent students, family income consists of the parents’ income. For independent students, family income consists of the student’s income and, if married, the income of his or her spouse. Due to these differences in how income is defined, student financial aid estimates by income are reported separately for dependent and independent undergraduates.4
The report is organized to present findings, beginning with selected findings from each table, followed by tables of student financial aid estimates. Following the tables, appendix A provides a glossary listing and describing all of the variables used in this report. Appendix B contains a brief technical section about NPSAS:16 and its methodology. Appendix C contains standard error tables for each of the student financial aid estimates found in the body of the report. For more information about federal student aid programs, visit https://studentaid.gov or see the 2015–2016 Federal Student Aid Handbook (U.S. Department of Education 2015).
Readers are cautioned not to draw causal inferences based on the results presented in this report. Although many of the characteristics examined may be related to one another, the complex interactions and relationships among them were not explored. It should also be noted that the variables examined here are just a few of the several hundred that can be examined in the NPSAS:16 data.
4 The analyses use 2014 income because it was the basis for calculating aid eligibility for the 2015–16 academic year.

This page intentionally left blank
5
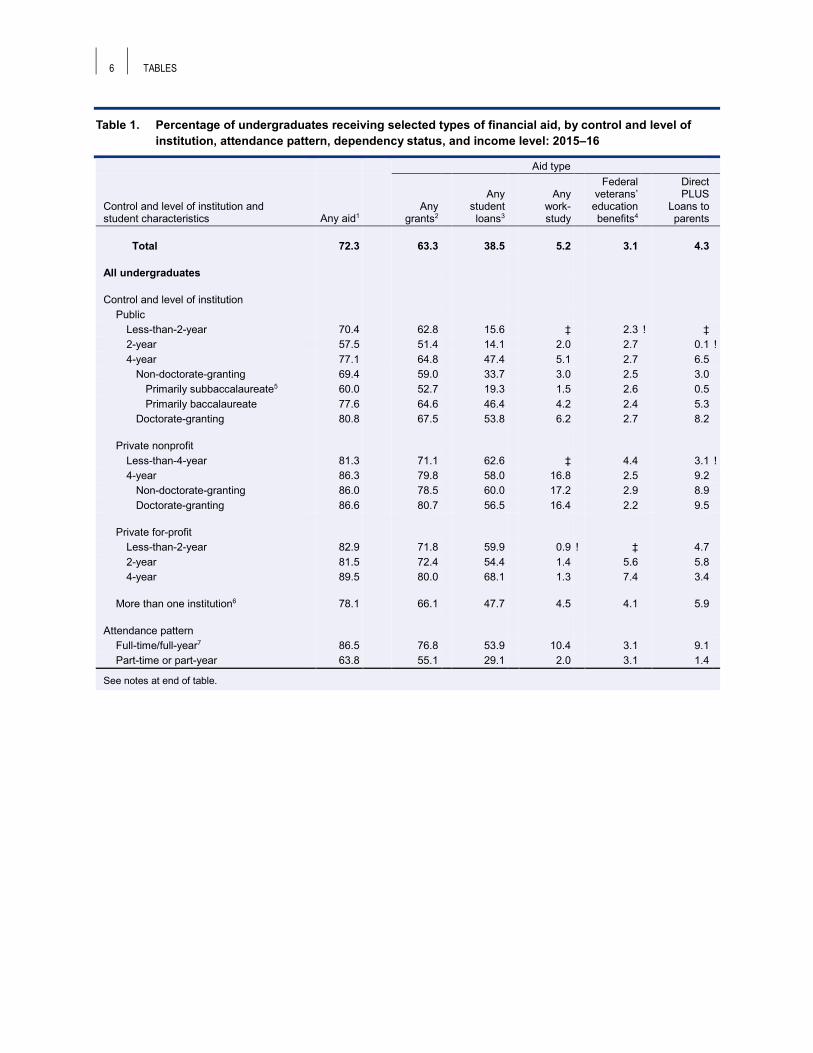
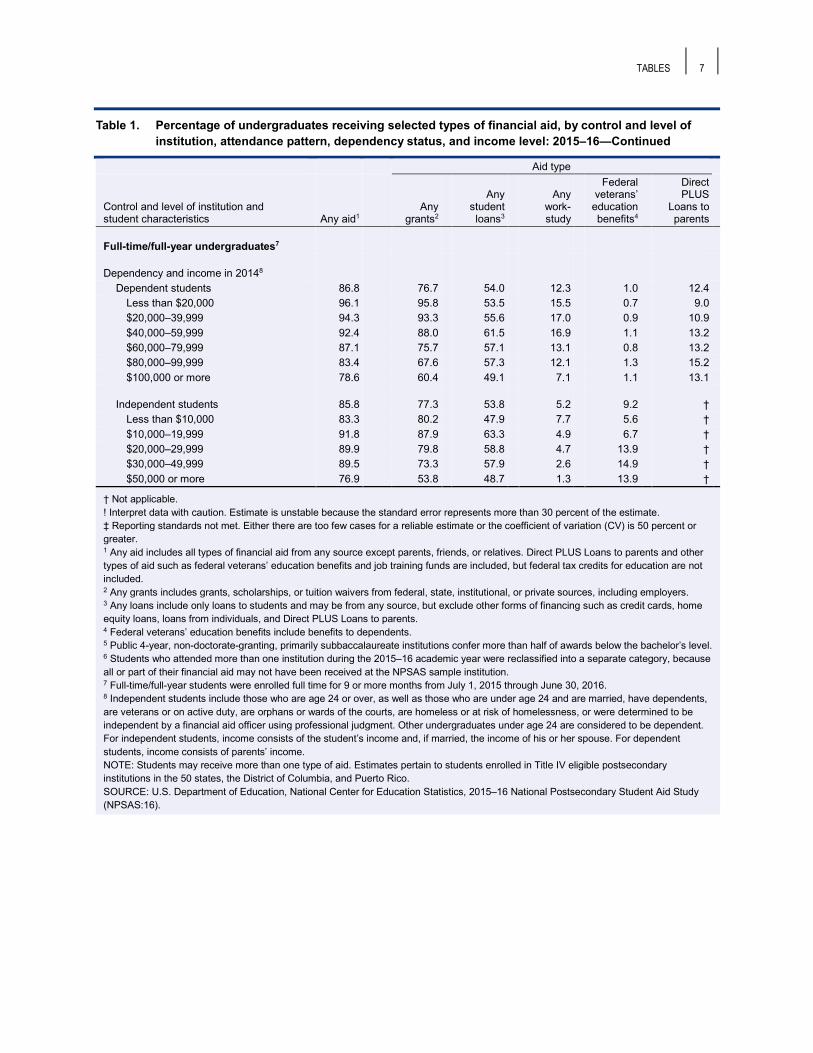
Selected Findings • Seventy-two percent of all undergraduates received some type of financial aid
(table 1). Sixty-three percent received grants, 38 percent took out student loans, 5 percent received aid through work-study programs, 3 percent received federal veterans’ education benefits, and 4 percent had parents who took out federal Direct PLUS Loans.
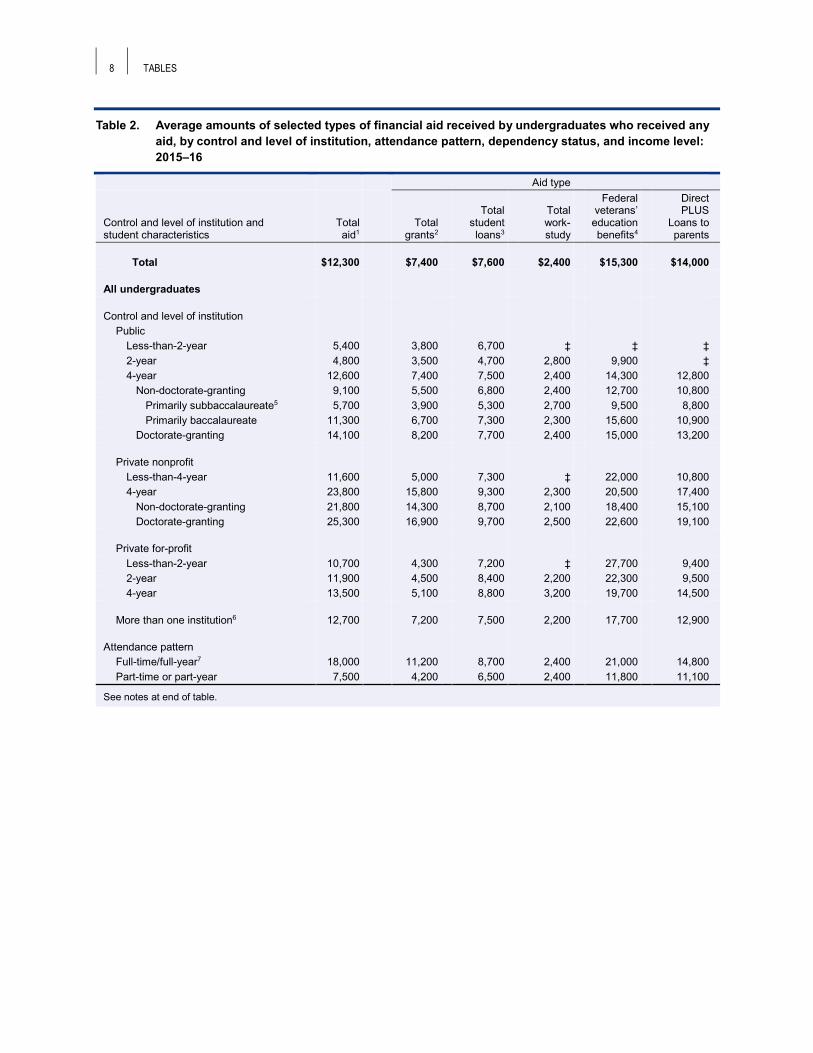
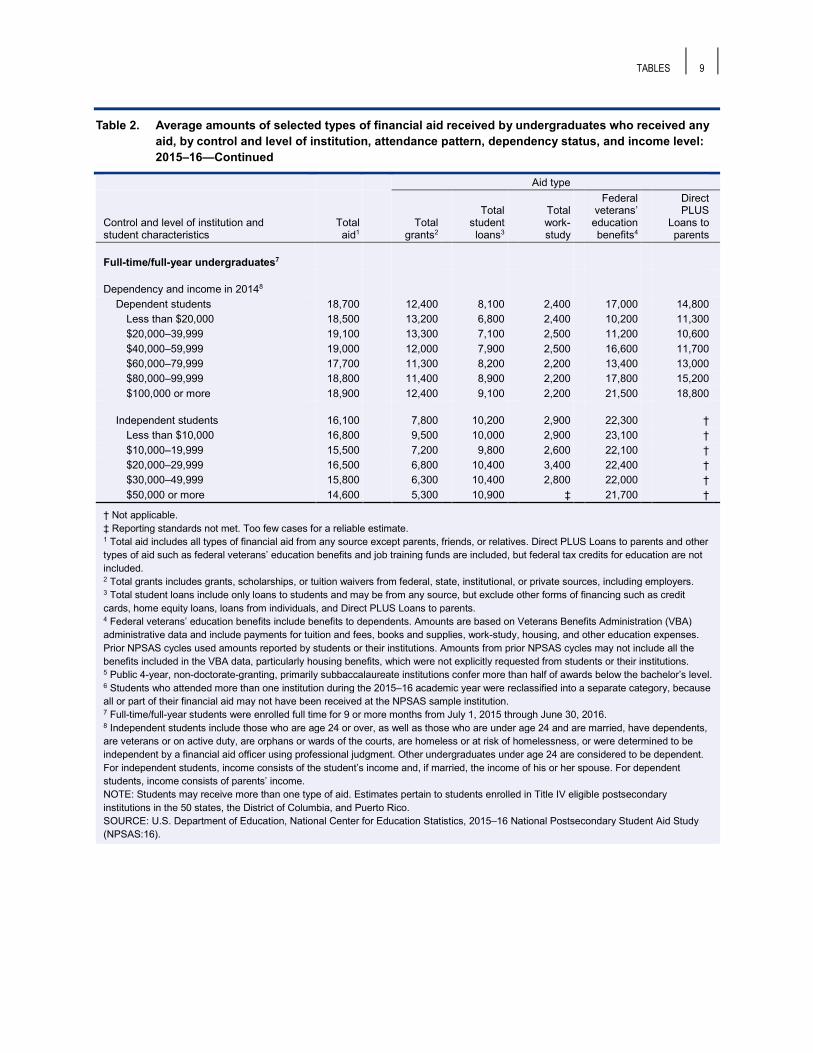
• Among undergraduates who received any aid, the average total amount received was $12,300 (table 2). The average total grant amount was $7,400, and student borrowers took out an average of $7,600 in student loans. Work-study participants earned an average of $2,400. Recipients of federal veterans’ education benefits received an average of $15,300.5 Parents of undergraduates borrowed an average of $14,000 in federal Direct PLUS Loans.
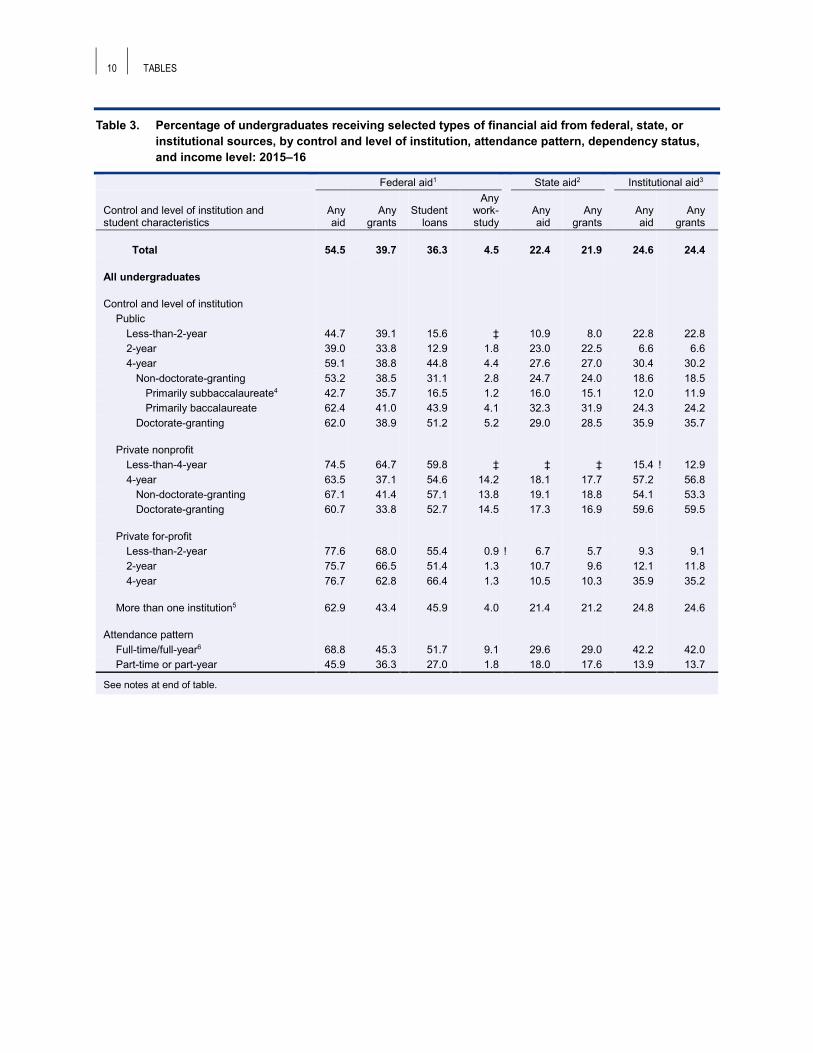
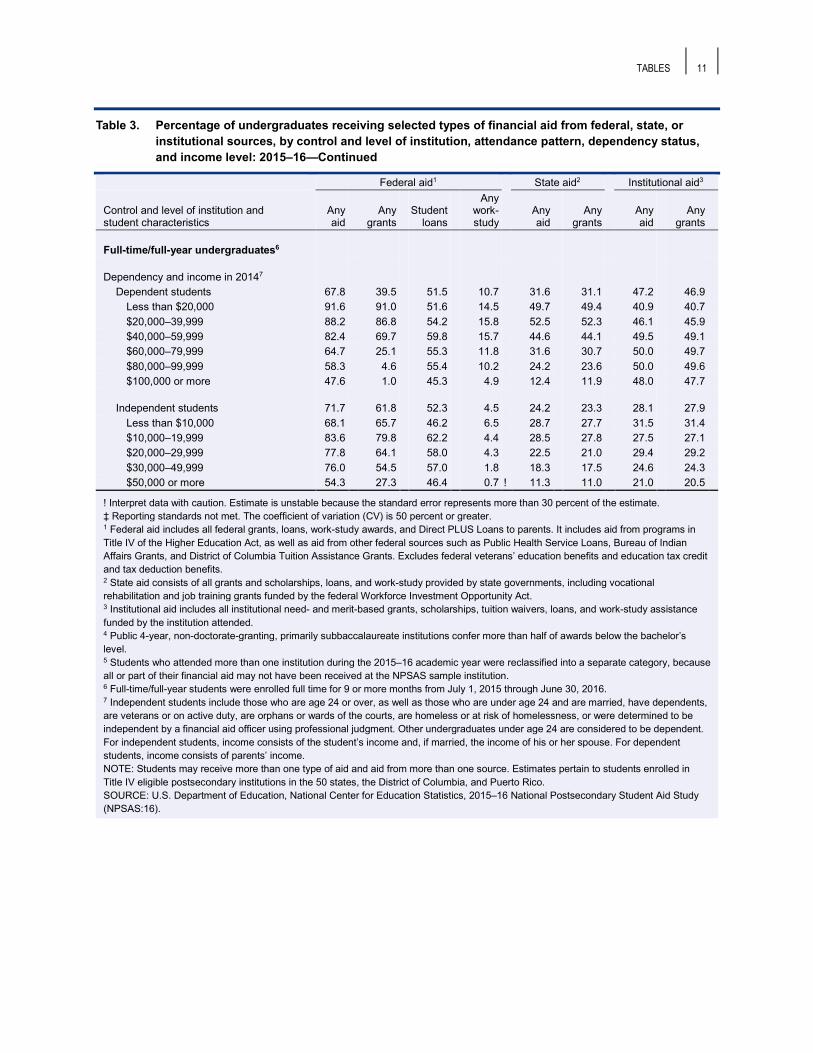
• Fifty-five percent of all undergraduates received federal student aid, 22 percent received state aid, and 25 percent received aid funded by the postsecondary institution they attended (table 3).
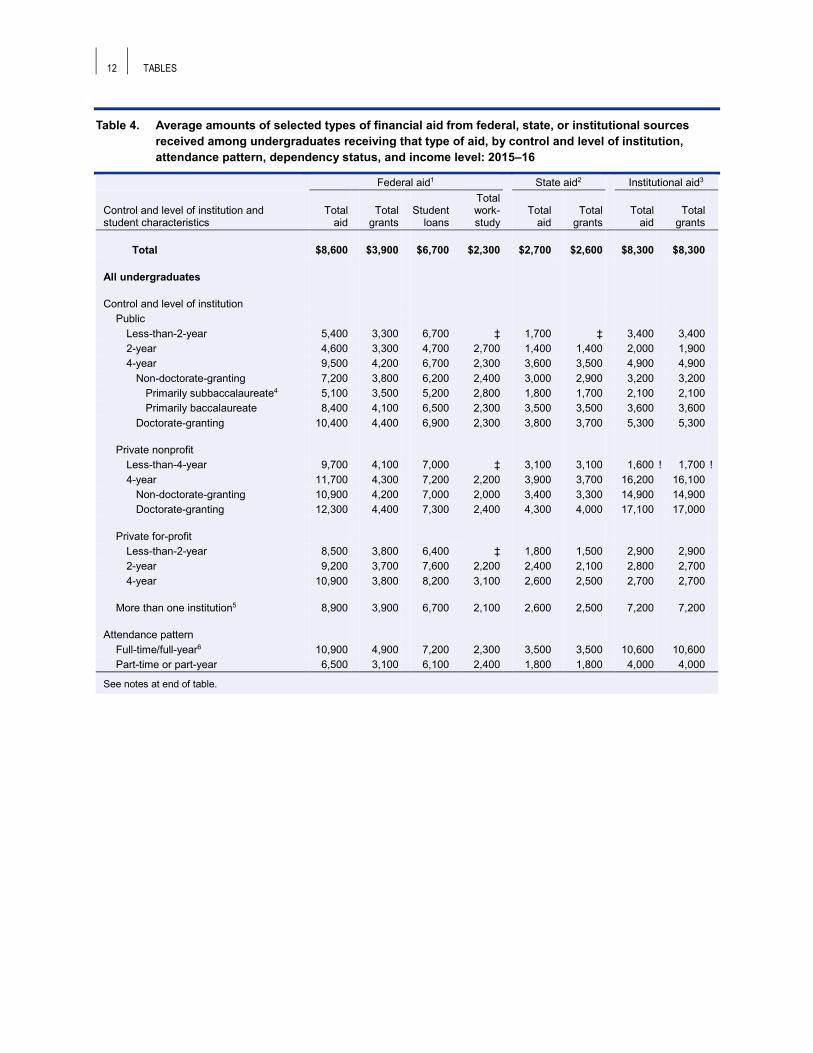
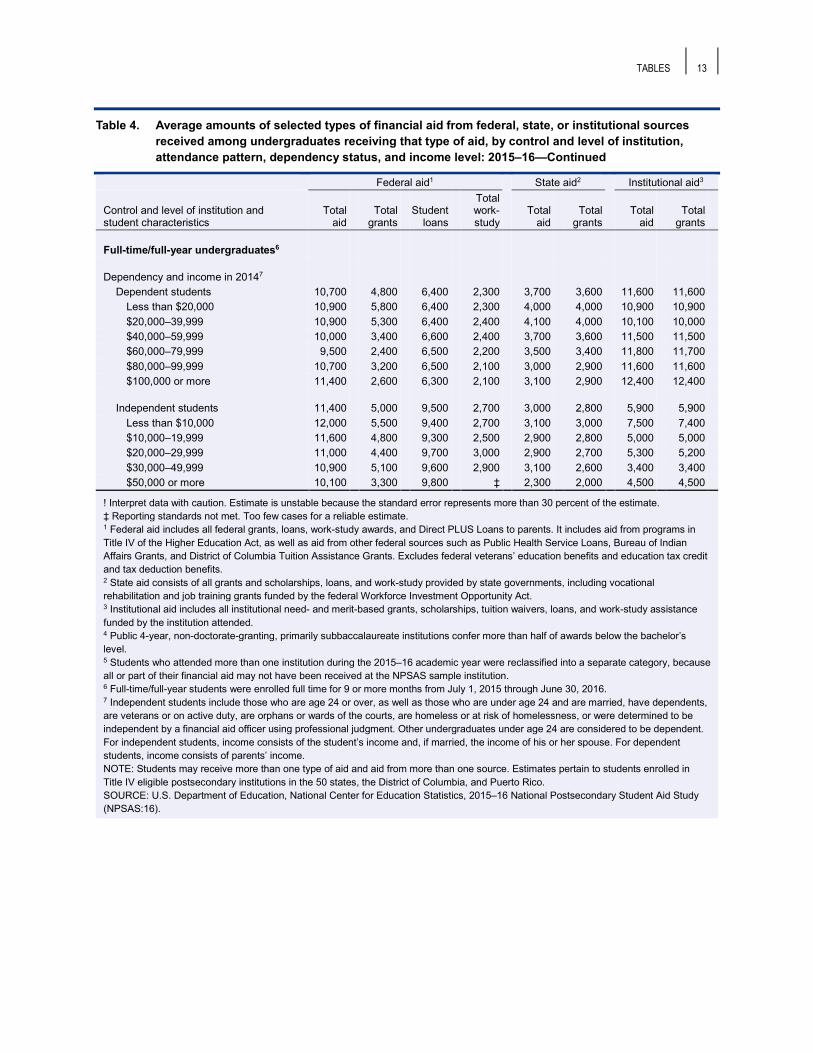
• The average amount of total federal student aid for undergraduates who received such aid was $8,600 (table 4). The average amount of state aid for undergraduates who received it was $2,700, and the average amount of institutional aid for undergraduates who received it was $8,300.
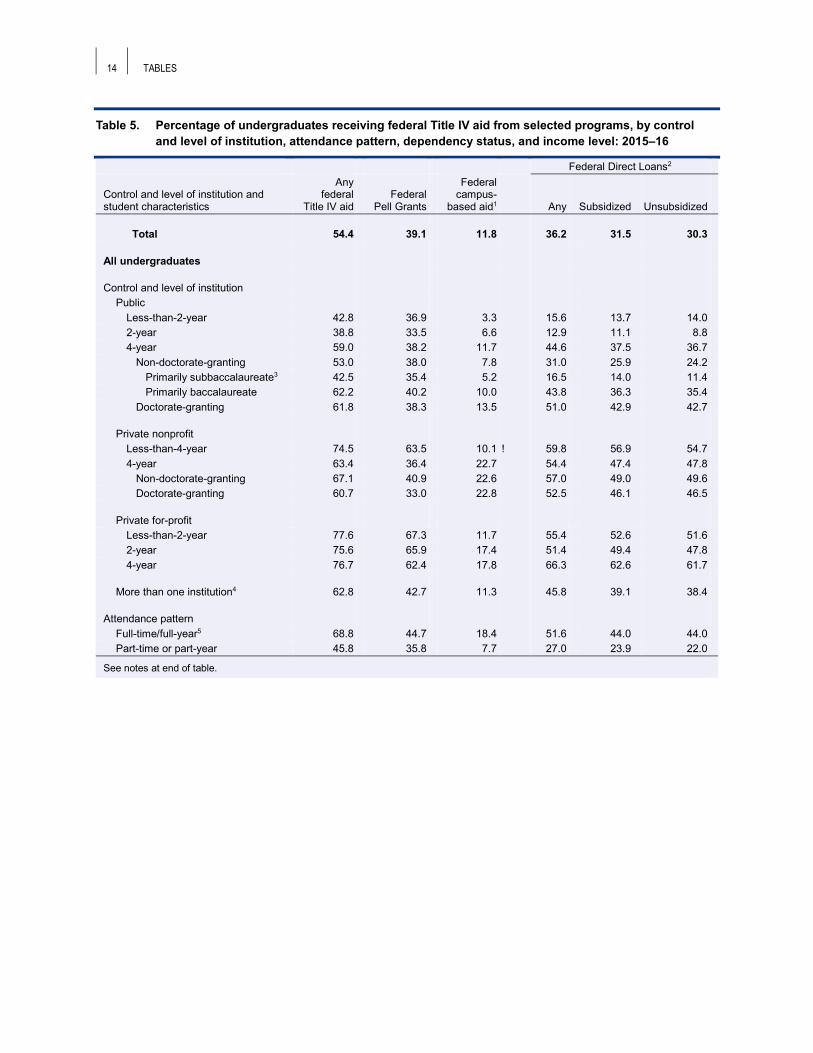
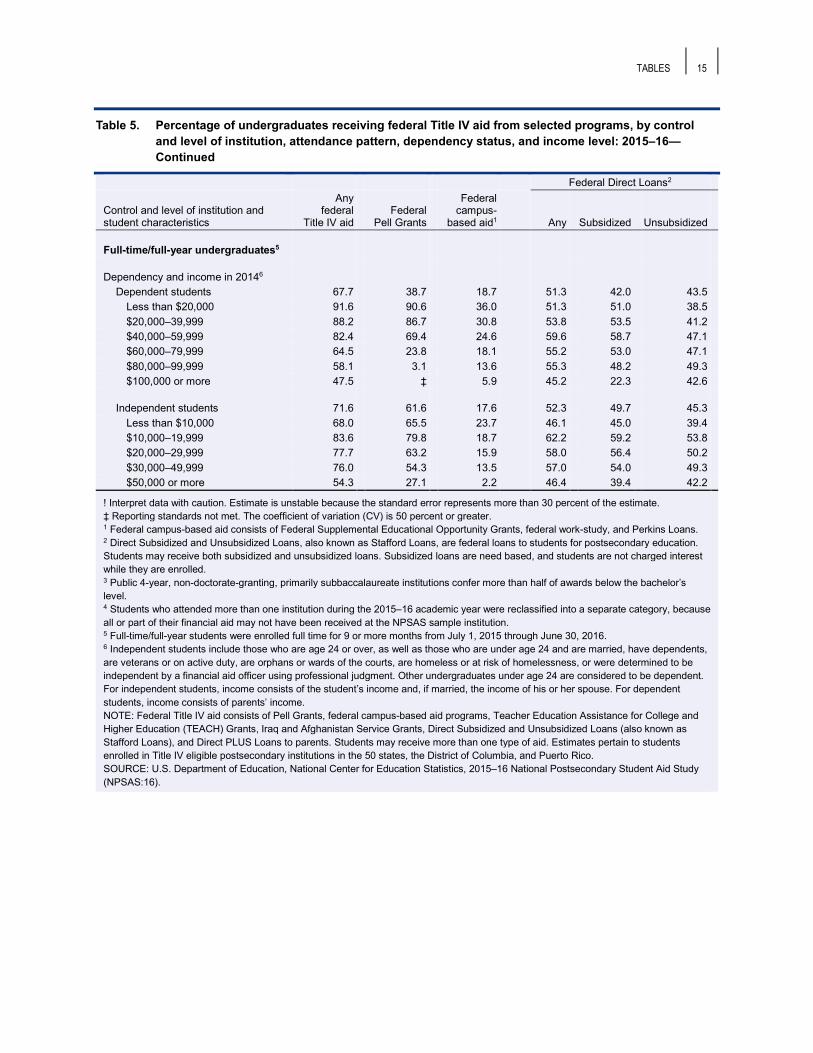
• Thirty-nine percent of all undergraduates received federal Pell Grants, and 36 percent took out federal Direct Loans (table 5). Thirty-one percent of undergraduates took out Direct Subsidized Loans, while 30 percent took out Direct Unsubsidized Loans.
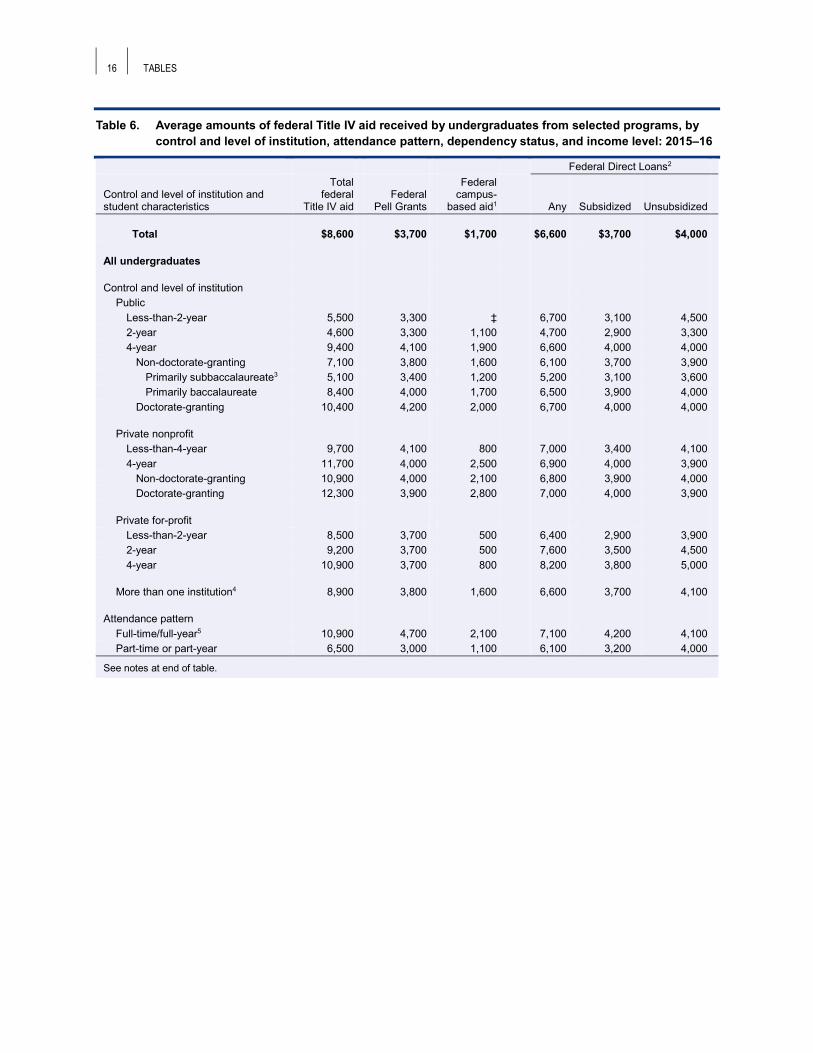
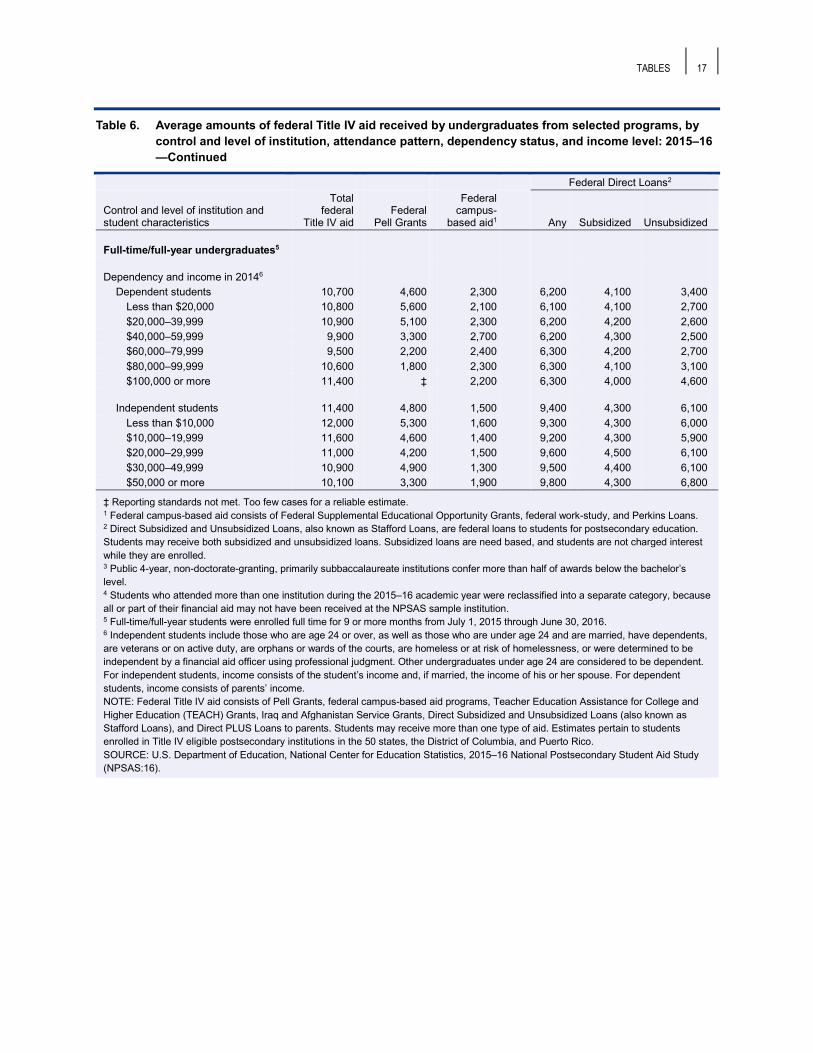
• Undergraduates who received federal Pell Grants received an average amount of $3,700 (table 6). Undergraduate borrowers took out an average of $6,600 in federal Direct Loans overall, $3,700 in Direct Subsidized Loans, and $4,000 in Direct Unsubsidized Loans.
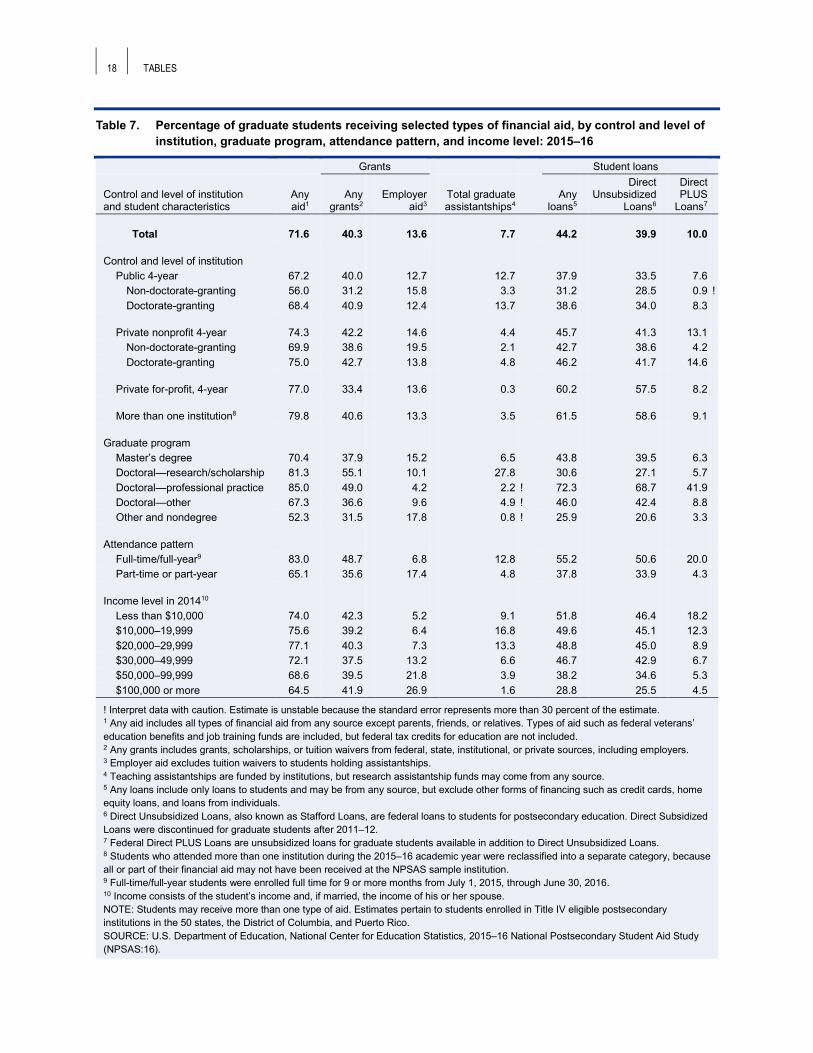
• Seventy-two percent of graduate students received some type of financial aid (table 7). Eight percent received graduate assistantships, 40 percent received grants, and 44 percent took out student loans. Forty percent of graduate students took out federal Direct Unsubsidized Loans, and 10 percent took out federal Direct PLUS Loans to graduate students.
• The average total aid received by graduate students was $22,000 (table 8). The average value of a graduate assistantship was $13,400. Borrowers took out an average of $23,400 in student loans. The average amount borrowed from federal Direct Unsubsidized Loans was $18,200, and the average amount borrowed in federal Direct PLUS Loans to graduate students was $22,300.
5 Amounts are based on Veterans Benefits Administration (VBA) administrative data and include payments for tuition and fees, books and supplies, work-study, housing, and other education expenses. Prior NPSAS cycles used amounts reported by students or their institutions, which may not include all the benefits included in the VBA data, particularly housing benefits, which were not explicitly requested from students or their institutions.
6 TABLES
Tables
Table 1. Percentage of undergraduates receiving selected types of financial aid, by control and level of institution, attendance pattern, dependency status, and income level: 2015–16
Aid type
Control and level of institution and student characteristics Any aid1
Any grants2
Any student loans3
Any work- study
Federal veterans’
education benefits4
Direct PLUS
Loans to parents
Total 72.3 63.3 38.5 5.2 3.1 4.3
All undergraduates
Control and level of institution Public
Less-than-2-year 70.4 62.8 15.6 ‡ 2.3 ! ‡ 2-year 57.5 51.4 14.1 2.0 2.7 0.1 ! 4-year 77.1 64.8 47.4 5.1 2.7 6.5
Non-doctorate-granting 69.4 59.0 33.7 3.0 2.5 3.0 Primarily subbaccalaureate5 60.0 52.7 19.3 1.5 2.6 0.5 Primarily baccalaureate 77.6 64.6 46.4 4.2 2.4 5.3
Doctorate-granting 80.8 67.5 53.8 6.2 2.7 8.2
Private nonprofit Less-than-4-year 81.3 71.1 62.6 ‡ 4.4 3.1 ! 4-year 86.3 79.8 58.0 16.8 2.5 9.2
Non-doctorate-granting 86.0 78.5 60.0 17.2 2.9 8.9 Doctorate-granting 86.6 80.7 56.5 16.4 2.2 9.5
Private for-profit Less-than-2-year 82.9 71.8 59.9 0.9 ! ‡ 4.7 2-year 81.5 72.4 54.4 1.4 5.6 5.8 4-year 89.5 80.0 68.1 1.3 7.4 3.4
More than one institution6 78.1 66.1 47.7 4.5 4.1 5.9
Attendance pattern Full-time/full-year7 86.5 76.8 53.9 10.4 3.1 9.1 Part-time or part-year 63.8 55.1 29.1 2.0 3.1 1.4
See notes at end of table.
TABLES 7
Table 1. Percentage of undergraduates receiving selected types of financial aid, by control and level of institution, attendance pattern, dependency status, and income level: 2015–16—Continued
Aid type
Control and level of institution and student characteristics Any aid1
Any grants2
Any student loans3
Any work- study
Federal veterans’
education benefits4
Direct PLUS
Loans to parents
Full-time/full-year undergraduates7
Dependency and income in 20148 Dependent students 86.8 76.7 54.0 12.3 1.0 12.4
Less than $20,000 96.1 95.8 53.5 15.5 0.7 9.0 $20,000–39,999 94.3 93.3 55.6 17.0 0.9 10.9 $40,000–59,999 92.4 88.0 61.5 16.9 1.1 13.2 $60,000–79,999 87.1 75.7 57.1 13.1 0.8 13.2 $80,000–99,999 83.4 67.6 57.3 12.1 1.3 15.2 $100,000 or more 78.6 60.4 49.1 7.1 1.1 13.1
Independent students 85.8 77.3 53.8 5.2 9.2 † Less than $10,000 83.3 80.2 47.9 7.7 5.6 † $10,000–19,999 91.8 87.9 63.3 4.9 6.7 † $20,000–29,999 89.9 79.8 58.8 4.7 13.9 † $30,000–49,999 89.5 73.3 57.9 2.6 14.9 † $50,000 or more 76.9 53.8 48.7 1.3 13.9 †
† Not applicable. ! Interpret data with caution. Estimate is unstable because the standard error represents more than 30 percent of the estimate. ‡ Reporting standards not met. Either there are too few cases for a reliable estimate or the coefficient of variation (CV) is 50 percent or greater. 1 Any aid includes all types of financial aid from any source except parents, friends, or relatives. Direct PLUS Loans to parents and other types of aid such as federal veterans’ education benefits and job training funds are included, but federal tax credits for education are not included. 2 Any grants includes grants, scholarships, or tuition waivers from federal, state, institutional, or private sources, including employers. 3 Any loans include only loans to students and may be from any source, but exclude other forms of financing such as credit cards, home equity loans, loans from individuals, and Direct PLUS Loans to parents. 4 Federal veterans’ education benefits include benefits to dependents. 5 Public 4-year, non-doctorate-granting, primarily subbaccalaureate institutions confer more than half of awards below the bachelor’s level. 6 Students who attended more than one institution during the 2015–16 academic year were reclassified into a separate category, because all or part of their financial aid may not have been received at the NPSAS sample institution. 7 Full-time/full-year students were enrolled full time for 9 or more months from July 1, 2015 through June 30, 2016. 8 Independent students include those who are age 24 or over, as well as those who are under age 24 and are married, have dependents, are veterans or on active duty, are orphans or wards of the courts, are homeless or at risk of homelessness, or were determined to be independent by a financial aid officer using professional judgment. Other undergraduates under age 24 are considered to be dependent. For independent students, income consists of the student’s income and, if married, the income of his or her spouse. For dependent students, income consists of parents’ income. NOTE: Students may receive more than one type of aid. Estimates pertain to students enrolled in Title IV eligible postsecondary institutions in the 50 states, the District of Columbia, and Puerto Rico. SOURCE: U.S. Department of Education, National Center for Education Statistics, 2015–16 National Postsecondary Student Aid Study (NPSAS:16).
8 TABLES
Table 2. Average amounts of selected types of financial aid received by undergraduates who received any aid, by control and level of institution, attendance pattern, dependency status, and income level: 2015–16
Aid type
Control and level of institution and student characteristics
Total aid1
Total grants2
Total student loans3
Total work- study
Federal veterans’
education benefits4
Direct PLUS
Loans to parents
Total $12,300 $7,400 $7,600 $2,400 $15,300 $14,000
All undergraduates
Control and level of institution Public
Less-than-2-year 5,400 3,800 6,700 ‡ ‡ ‡ 2-year 4,800 3,500 4,700 2,800 9,900 ‡ 4-year 12,600 7,400 7,500 2,400 14,300 12,800
Non-doctorate-granting 9,100 5,500 6,800 2,400 12,700 10,800 Primarily subbaccalaureate5 5,700 3,900 5,300 2,700 9,500 8,800 Primarily baccalaureate 11,300 6,700 7,300 2,300 15,600 10,900
Doctorate-granting 14,100 8,200 7,700 2,400 15,000 13,200
Private nonprofit Less-than-4-year 11,600 5,000 7,300 ‡ 22,000 10,800 4-year 23,800 15,800 9,300 2,300 20,500 17,400
Non-doctorate-granting 21,800 14,300 8,700 2,100 18,400 15,100 Doctorate-granting 25,300 16,900 9,700 2,500 22,600 19,100
Private for-profit Less-than-2-year 10,700 4,300 7,200 ‡ 27,700 9,400 2-year 11,900 4,500 8,400 2,200 22,300 9,500 4-year 13,500 5,100 8,800 3,200 19,700 14,500
More than one institution6 12,700 7,200 7,500 2,200 17,700 12,900
Attendance pattern Full-time/full-year7 18,000 11,200 8,700 2,400 21,000 14,800 Part-time or part-year 7,500 4,200 6,500 2,400 11,800 11,100
See notes at end of table.
TABLES 9
Table 2. Average amounts of selected types of financial aid received by undergraduates who received any aid, by control and level of institution, attendance pattern, dependency status, and income level: 2015–16—Continued
Aid type
Control and level of institution and student characteristics
Total aid1
Total grants2
Total student loans3
Total work- study
Federal veterans’
education benefits4
Direct PLUS
Loans to parents
Full-time/full-year undergraduates7
Dependency and income in 20148
Dependent students 18,700 12,400 8,100 2,400 17,000 14,800 Less than $20,000 18,500 13,200 6,800 2,400 10,200 11,300 $20,000–39,999 19,100 13,300 7,100 2,500 11,200 10,600 $40,000–59,999 19,000 12,000 7,900 2,500 16,600 11,700 $60,000–79,999 17,700 11,300 8,200 2,200 13,400 13,000 $80,000–99,999 18,800 11,400 8,900 2,200 17,800 15,200 $100,000 or more 18,900 12,400 9,100 2,200 21,500 18,800
Independent students 16,100 7,800 10,200 2,900 22,300 †
Less than $10,000 16,800 9,500 10,000 2,900 23,100 † $10,000–19,999 15,500 7,200 9,800 2,600 22,100 † $20,000–29,999 16,500 6,800 10,400 3,400 22,400 † $30,000–49,999 15,800 6,300 10,400 2,800 22,000 † $50,000 or more 14,600 5,300 10,900 ‡ 21,700 †
† Not applicable. ‡ Reporting standards not met. Too few cases for a reliable estimate. 1 Total aid includes all types of financial aid from any source except parents, friends, or relatives. Direct PLUS Loans to parents and other types of aid such as federal veterans’ education benefits and job training funds are included, but federal tax credits for education are not included. 2 Total grants includes grants, scholarships, or tuition waivers from federal, state, institutional, or private sources, including employers. 3 Total student loans include only loans to students and may be from any source, but exclude other forms of financing such as credit cards, home equity loans, loans from individuals, and Direct PLUS Loans to parents. 4 Federal veterans’ education benefits include benefits to dependents. Amounts are based on Veterans Benefits Administration (VBA) administrative data and include payments for tuition and fees, books and supplies, work-study, housing, and other education expenses. Prior NPSAS cycles used amounts reported by students or their institutions. Amounts from prior NPSAS cycles may not include all the benefits included in the VBA data, particularly housing benefits, which were not explicitly requested from students or their institutions. 5 Public 4-year, non-doctorate-granting, primarily subbaccalaureate institutions confer more than half of awards below the bachelor’s level. 6 Students who attended more than one institution during the 2015–16 academic year were reclassified into a separate category, because all or part of their financial aid may not have been received at the NPSAS sample institution. 7 Full-time/full-year students were enrolled full time for 9 or more months from July 1, 2015 through June 30, 2016. 8 Independent students include those who are age 24 or over, as well as those who are under age 24 and are married, have dependents, are veterans or on active duty, are orphans or wards of the courts, are homeless or at risk of homelessness, or were determined to be independent by a financial aid officer using professional judgment. Other undergraduates under age 24 are considered to be dependent. For independent students, income consists of the student’s income and, if married, the income of his or her spouse. For dependent students, income consists of parents’ income. NOTE: Students may receive more than one type of aid. Estimates pertain to students enrolled in Title IV eligible postsecondary institutions in the 50 states, the District of Columbia, and Puerto Rico. SOURCE: U.S. Department of Education, National Center for Education Statistics, 2015–16 National Postsecondary Student Aid Study (NPSAS:16).
10 TABLES
Table 3. Percentage of undergraduates receiving selected types of financial aid from federal, state, or institutional sources, by control and level of institution, attendance pattern, dependency status, and income level: 2015–16
Federal aid1 State aid2 Institutional aid3
Control and level of institution and student characteristics
Any aid
Any grants
Student loans
Any work- study
Any aid
Any grants
Any aid
Any grants
Total 54.5 39.7 36.3 4.5 22.4 21.9 24.6 24.4
All undergraduates
Control and level of institution Public
Less-than-2-year 44.7 39.1 15.6 ‡ 10.9 8.0 22.8 22.8 2-year 39.0 33.8 12.9 1.8 23.0 22.5 6.6 6.6 4-year 59.1 38.8 44.8 4.4 27.6 27.0 30.4 30.2
Non-doctorate-granting 53.2 38.5 31.1 2.8 24.7 24.0 18.6 18.5 Primarily subbaccalaureate4 42.7 35.7 16.5 1.2 16.0 15.1 12.0 11.9 Primarily baccalaureate 62.4 41.0 43.9 4.1 32.3 31.9 24.3 24.2
Doctorate-granting 62.0 38.9 51.2 5.2 29.0 28.5 35.9 35.7
Private nonprofit Less-than-4-year 74.5 64.7 59.8 ‡ ‡ ‡ 15.4 ! 12.9 4-year 63.5 37.1 54.6 14.2 18.1 17.7 57.2 56.8
Non-doctorate-granting 67.1 41.4 57.1 13.8 19.1 18.8 54.1 53.3 Doctorate-granting 60.7 33.8 52.7 14.5 17.3 16.9 59.6 59.5
Private for-profit Less-than-2-year 77.6 68.0 55.4 0.9 ! 6.7 5.7 9.3 9.1 2-year 75.7 66.5 51.4 1.3 10.7 9.6 12.1 11.8 4-year 76.7 62.8 66.4 1.3 10.5 10.3 35.9 35.2
More than one institution5 62.9 43.4 45.9 4.0 21.4 21.2 24.8 24.6
Attendance pattern Full-time/full-year6 68.8 45.3 51.7 9.1 29.6 29.0 42.2 42.0 Part-time or part-year 45.9 36.3 27.0 1.8 18.0 17.6 13.9 13.7
See notes at end of table.
TABLES 11
Table 3. Percentage of undergraduates receiving selected types of financial aid from federal, state, or institutional sources, by control and level of institution, attendance pattern, dependency status, and income level: 2015–16—Continued
Federal aid1 State aid2 Institutional aid3
Control and level of institution and student characteristics
Any aid
Any grants
Student loans
Any work- study
Any aid
Any grants
Any aid
Any grants
Full-time/full-year undergraduates6
Dependency and income in 20147 Dependent students 67.8 39.5 51.5 10.7 31.6 31.1 47.2 46.9
Less than $20,000 91.6 91.0 51.6 14.5 49.7 49.4 40.9 40.7 $20,000–39,999 88.2 86.8 54.2 15.8 52.5 52.3 46.1 45.9 $40,000–59,999 82.4 69.7 59.8 15.7 44.6 44.1 49.5 49.1 $60,000–79,999 64.7 25.1 55.3 11.8 31.6 30.7 50.0 49.7 $80,000–99,999 58.3 4.6 55.4 10.2 24.2 23.6 50.0 49.6 $100,000 or more 47.6 1.0 45.3 4.9 12.4 11.9 48.0 47.7
Independent students 71.7 61.8 52.3 4.5 24.2 23.3 28.1 27.9 Less than $10,000 68.1 65.7 46.2 6.5 28.7 27.7 31.5 31.4 $10,000–19,999 83.6 79.8 62.2 4.4 28.5 27.8 27.5 27.1 $20,000–29,999 77.8 64.1 58.0 4.3 22.5 21.0 29.4 29.2 $30,000–49,999 76.0 54.5 57.0 1.8 18.3 17.5 24.6 24.3 $50,000 or more 54.3 27.3 46.4 0.7 ! 11.3 11.0 21.0 20.5
! Interpret data with caution. Estimate is unstable because the standard error represents more than 30 percent of the estimate.‡ Reporting standards not met. The coefficient of variation (CV) is 50 percent or greater.1 Federal aid includes all federal grants, loans, work-study awards, and Direct PLUS Loans to parents. It includes aid from programs inTitle IV of the Higher Education Act, as well as aid from other federal sources such as Public Health Service Loans, Bureau of IndianAffairs Grants, and District of Columbia Tuition Assistance Grants. Excludes federal veterans’ education benefits and education tax credit and tax deduction benefits.2 State aid consists of all grants and scholarships, loans, and work-study provided by state governments, including vocational rehabilitation and job training grants funded by the federal Workforce Investment Opportunity Act.3 Institutional aid includes all institutional need- and merit-based grants, scholarships, tuition waivers, loans, and work-study assistancefunded by the institution attended.4 Public 4-year, non-doctorate-granting, primarily subbaccalaureate institutions confer more than half of awards below the bachelor’slevel.5 Students who attended more than one institution during the 2015–16 academic year were reclassified into a separate category, becauseall or part of their financial aid may not have been received at the NPSAS sample institution. 6 Full-time/full-year students were enrolled full time for 9 or more months from July 1, 2015 through June 30, 2016.7 Independent students include those who are age 24 or over, as well as those who are under age 24 and are married, have dependents,are veterans or on active duty, are orphans or wards of the courts, are homeless or at risk of homelessness, or were determined to be independent by a financial aid officer using professional judgment. Other undergraduates under age 24 are considered to be dependent.For independent students, income consists of the student’s income and, if married, the income of his or her spouse. For dependentstudents, income consists of parents’ income.NOTE: Students may receive more than one type of aid and aid from more than one source. Estimates pertain to students enrolled inTitle IV eligible postsecondary institutions in the 50 states, the District of Columbia, and Puerto Rico.SOURCE: U.S. Department of Education, National Center for Education Statistics, 2015–16 National Postsecondary Student Aid Study (NPSAS:16).
12 TABLES
Table 4. Average amounts of selected types of financial aid from federal, state, or institutional sources received among undergraduates receiving that type of aid, by control and level of institution, attendance pattern, dependency status, and income level: 2015–16
Federal aid1 State aid2 Institutional aid3
Control and level of institution and student characteristics
Total aid
Total grants
Student loans
Total work- study
Total aid
Total grants
Total aid
Total grants
Total $8,600 $3,900 $6,700 $2,300 $2,700 $2,600 $8,300 $8,300
All undergraduates
Control and level of institution Public
Less-than-2-year 5,400 3,300 6,700 ‡ 1,700 ‡ 3,400 3,400 2-year 4,600 3,300 4,700 2,700 1,400 1,400 2,000 1,900 4-year 9,500 4,200 6,700 2,300 3,600 3,500 4,900 4,900
Non-doctorate-granting 7,200 3,800 6,200 2,400 3,000 2,900 3,200 3,200 Primarily subbaccalaureate4 5,100 3,500 5,200 2,800 1,800 1,700 2,100 2,100 Primarily baccalaureate 8,400 4,100 6,500 2,300 3,500 3,500 3,600 3,600
Doctorate-granting 10,400 4,400 6,900 2,300 3,800 3,700 5,300 5,300
Private nonprofit Less-than-4-year 9,700 4,100 7,000 ‡ 3,100 3,100 1,600 ! 1,700 ! 4-year 11,700 4,300 7,200 2,200 3,900 3,700 16,200 16,100
Non-doctorate-granting 10,900 4,200 7,000 2,000 3,400 3,300 14,900 14,900 Doctorate-granting 12,300 4,400 7,300 2,400 4,300 4,000 17,100 17,000
Private for-profit Less-than-2-year 8,500 3,800 6,400 ‡ 1,800 1,500 2,900 2,900 2-year 9,200 3,700 7,600 2,200 2,400 2,100 2,800 2,700 4-year 10,900 3,800 8,200 3,100 2,600 2,500 2,700 2,700
More than one institution5 8,900 3,900 6,700 2,100 2,600 2,500 7,200 7,200
Attendance pattern Full-time/full-year6 10,900 4,900 7,200 2,300 3,500 3,500 10,600 10,600 Part-time or part-year 6,500 3,100 6,100 2,400 1,800 1,800 4,000 4,000
See notes at end of table.
TABLES 13
Table 4. Average amounts of selected types of financial aid from federal, state, or institutional sources received among undergraduates receiving that type of aid, by control and level of institution, attendance pattern, dependency status, and income level: 2015–16—Continued
Federal aid1 State aid2 Institutional aid3
Control and level of institution and student characteristics
Total aid
Total grants
Student loans
Total work- study
Total aid
Total grants
Total aid
Total grants
Full-time/full-year undergraduates6
Dependency and income in 20147 Dependent students 10,700 4,800 6,400 2,300 3,700 3,600 11,600 11,600
Less than $20,000 10,900 5,800 6,400 2,300 4,000 4,000 10,900 10,900 $20,000–39,999 10,900 5,300 6,400 2,400 4,100 4,000 10,100 10,000 $40,000–59,999 10,000 3,400 6,600 2,400 3,700 3,600 11,500 11,500 $60,000–79,999 9,500 2,400 6,500 2,200 3,500 3,400 11,800 11,700 $80,000–99,999 10,700 3,200 6,500 2,100 3,000 2,900 11,600 11,600 $100,000 or more 11,400 2,600 6,300 2,100 3,100 2,900 12,400 12,400
Independent students 11,400 5,000 9,500 2,700 3,000 2,800 5,900 5,900 Less than $10,000 12,000 5,500 9,400 2,700 3,100 3,000 7,500 7,400 $10,000–19,999 11,600 4,800 9,300 2,500 2,900 2,800 5,000 5,000 $20,000–29,999 11,000 4,400 9,700 3,000 2,900 2,700 5,300 5,200 $30,000–49,999 10,900 5,100 9,600 2,900 3,100 2,600 3,400 3,400 $50,000 or more 10,100 3,300 9,800 ‡ 2,300 2,000 4,500 4,500
! Interpret data with caution. Estimate is unstable because the standard error represents more than 30 percent of the estimate. ‡ Reporting standards not met. Too few cases for a reliable estimate. 1 Federal aid includes all federal grants, loans, work-study awards, and Direct PLUS Loans to parents. It includes aid from programs in Title IV of the Higher Education Act, as well as aid from other federal sources such as Public Health Service Loans, Bureau of Indian Affairs Grants, and District of Columbia Tuition Assistance Grants. Excludes federal veterans’ education benefits and education tax credit and tax deduction benefits. 2 State aid consists of all grants and scholarships, loans, and work-study provided by state governments, including vocational rehabilitation and job training grants funded by the federal Workforce Investment Opportunity Act. 3 Institutional aid includes all institutional need- and merit-based grants, scholarships, tuition waivers, loans, and work-study assistance funded by the institution attended. 4 Public 4-year, non-doctorate-granting, primarily subbaccalaureate institutions confer more than half of awards below the bachelor’s level. 5 Students who attended more than one institution during the 2015–16 academic year were reclassified into a separate category, because all or part of their financial aid may not have been received at the NPSAS sample institution. 6 Full-time/full-year students were enrolled full time for 9 or more months from July 1, 2015 through June 30, 2016. 7 Independent students include those who are age 24 or over, as well as those who are under age 24 and are married, have dependents, are veterans or on active duty, are orphans or wards of the courts, are homeless or at risk of homelessness, or were determined to be independent by a financial aid officer using professional judgment. Other undergraduates under age 24 are considered to be dependent. For independent students, income consists of the student’s income and, if married, the income of his or her spouse. For dependent students, income consists of parents’ income. NOTE: Students may receive more than one type of aid and aid from more than one source. Estimates pertain to students enrolled in Title IV eligible postsecondary institutions in the 50 states, the District of Columbia, and Puerto Rico. SOURCE: U.S. Department of Education, National Center for Education Statistics, 2015–16 National Postsecondary Student Aid Study (NPSAS:16).
14 TABLES
Table 5. Percentage of undergraduates receiving federal Title IV aid from selected programs, by control and level of institution, attendance pattern, dependency status, and income level: 2015–16
Federal Direct Loans2
Control and level of institution and student characteristics
Any federal
Title IV aid Federal
Pell Grants
Federal campus-
based aid1 Any Subsidized Unsubsidized
Total 54.4 39.1 11.8 36.2 31.5 30.3
All undergraduates
Control and level of institution Public
Less-than-2-year 42.8 36.9 3.3 15.6 13.7 14.0 2-year 38.8 33.5 6.6 12.9 11.1 8.8 4-year 59.0 38.2 11.7 44.6 37.5 36.7
Non-doctorate-granting 53.0 38.0 7.8 31.0 25.9 24.2 Primarily subbaccalaureate3 42.5 35.4 5.2 16.5 14.0 11.4 Primarily baccalaureate 62.2 40.2 10.0 43.8 36.3 35.4
Doctorate-granting 61.8 38.3 13.5 51.0 42.9 42.7
Private nonprofit Less-than-4-year 74.5 63.5 10.1 ! 59.8 56.9 54.7 4-year 63.4 36.4 22.7 54.4 47.4 47.8
Non-doctorate-granting 67.1 40.9 22.6 57.0 49.0 49.6 Doctorate-granting 60.7 33.0 22.8 52.5 46.1 46.5
Private for-profit Less-than-2-year 77.6 67.3 11.7 55.4 52.6 51.6 2-year 75.6 65.9 17.4 51.4 49.4 47.8 4-year 76.7 62.4 17.8 66.3 62.6 61.7
More than one institution4 62.8 42.7 11.3 45.8 39.1 38.4
Attendance pattern Full-time/full-year5 68.8 44.7 18.4 51.6 44.0 44.0 Part-time or part-year 45.8 35.8 7.7 27.0 23.9 22.0
See notes at end of table.
TABLES 15
Table 5. Percentage of undergraduates receiving federal Title IV aid from selected programs, by control and level of institution, attendance pattern, dependency status, and income level: 2015–16—Continued
Federal Direct Loans2
Control and level of institution and student characteristics
Any federal
Title IV aid Federal
Pell Grants
Federal campus-
based aid1 Any Subsidized Unsubsidized
Full-time/full-year undergraduates5
Dependency and income in 20146 Dependent students 67.7 38.7 18.7 51.3 42.0 43.5
Less than $20,000 91.6 90.6 36.0 51.3 51.0 38.5 $20,000–39,999 88.2 86.7 30.8 53.8 53.5 41.2 $40,000–59,999 82.4 69.4 24.6 59.6 58.7 47.1 $60,000–79,999 64.5 23.8 18.1 55.2 53.0 47.1 $80,000–99,999 58.1 3.1 13.6 55.3 48.2 49.3 $100,000 or more 47.5 ‡ 5.9 45.2 22.3 42.6
Independent students 71.6 61.6 17.6 52.3 49.7 45.3 Less than $10,000 68.0 65.5 23.7 46.1 45.0 39.4 $10,000–19,999 83.6 79.8 18.7 62.2 59.2 53.8 $20,000–29,999 77.7 63.2 15.9 58.0 56.4 50.2 $30,000–49,999 76.0 54.3 13.5 57.0 54.0 49.3 $50,000 or more 54.3 27.1 2.2 46.4 39.4 42.2
! Interpret data with caution. Estimate is unstable because the standard error represents more than 30 percent of the estimate. ‡ Reporting standards not met. The coefficient of variation (CV) is 50 percent or greater. 1 Federal campus-based aid consists of Federal Supplemental Educational Opportunity Grants, federal work-study, and Perkins Loans. 2 Direct Subsidized and Unsubsidized Loans, also known as Stafford Loans, are federal loans to students for postsecondary education. Students may receive both subsidized and unsubsidized loans. Subsidized loans are need based, and students are not charged interest while they are enrolled. 3 Public 4-year, non-doctorate-granting, primarily subbaccalaureate institutions confer more than half of awards below the bachelor’s level. 4 Students who attended more than one institution during the 2015–16 academic year were reclassified into a separate category, because all or part of their financial aid may not have been received at the NPSAS sample institution. 5 Full-time/full-year students were enrolled full time for 9 or more months from July 1, 2015 through June 30, 2016. 6 Independent students include those who are age 24 or over, as well as those who are under age 24 and are married, have dependents, are veterans or on active duty, are orphans or wards of the courts, are homeless or at risk of homelessness, or were determined to be independent by a financial aid officer using professional judgment. Other undergraduates under age 24 are considered to be dependent. For independent students, income consists of the student’s income and, if married, the income of his or her spouse. For dependent students, income consists of parents’ income. NOTE: Federal Title IV aid consists of Pell Grants, federal campus-based aid programs, Teacher Education Assistance for College and Higher Education (TEACH) Grants, Iraq and Afghanistan Service Grants, Direct Subsidized and Unsubsidized Loans (also known as Stafford Loans), and Direct PLUS Loans to parents. Students may receive more than one type of aid. Estimates pertain to students enrolled in Title IV eligible postsecondary institutions in the 50 states, the District of Columbia, and Puerto Rico. SOURCE: U.S. Department of Education, National Center for Education Statistics, 2015–16 National Postsecondary Student Aid Study (NPSAS:16).
16 TABLES
Table 6. Average amounts of federal Title IV aid received by undergraduates from selected programs, by control and level of institution, attendance pattern, dependency status, and income level: 2015–16
Federal Direct Loans2
Control and level of institution and student characteristics
Total federal
Title IV aid Federal
Pell Grants
Federal campus-
based aid1 Any Subsidized Unsubsidized
Total $8,600 $3,700 $1,700 $6,600 $3,700 $4,000
All undergraduates
Control and level of institution Public
Less-than-2-year 5,500 3,300 ‡ 6,700 3,100 4,500 2-year 4,600 3,300 1,100 4,700 2,900 3,300 4-year 9,400 4,100 1,900 6,600 4,000 4,000
Non-doctorate-granting 7,100 3,800 1,600 6,100 3,700 3,900 Primarily subbaccalaureate3 5,100 3,400 1,200 5,200 3,100 3,600 Primarily baccalaureate 8,400 4,000 1,700 6,500 3,900 4,000
Doctorate-granting 10,400 4,200 2,000 6,700 4,000 4,000
Private nonprofit Less-than-4-year 9,700 4,100 800 7,000 3,400 4,100 4-year 11,700 4,000 2,500 6,900 4,000 3,900
Non-doctorate-granting 10,900 4,000 2,100 6,800 3,900 4,000 Doctorate-granting 12,300 3,900 2,800 7,000 4,000 3,900
Private for-profit Less-than-2-year 8,500 3,700 500 6,400 2,900 3,900 2-year 9,200 3,700 500 7,600 3,500 4,500 4-year 10,900 3,700 800 8,200 3,800 5,000
More than one institution4 8,900 3,800 1,600 6,600 3,700 4,100
Attendance pattern Full-time/full-year5 10,900 4,700 2,100 7,100 4,200 4,100 Part-time or part-year 6,500 3,000 1,100 6,100 3,200 4,000
See notes at end of table.
TABLES 17
Table 6. Average amounts of federal Title IV aid received by undergraduates from selected programs, by control and level of institution, attendance pattern, dependency status, and income level: 2015–16 —Continued
Federal Direct Loans2
Control and level of institution and student characteristics
Total federal
Title IV aid Federal
Pell Grants
Federal campus-
based aid1 Any Subsidized Unsubsidized
Full-time/full-year undergraduates5
Dependency and income in 20146 Dependent students 10,700 4,600 2,300 6,200 4,100 3,400
Less than $20,000 10,800 5,600 2,100 6,100 4,100 2,700 $20,000–39,999 10,900 5,100 2,300 6,200 4,200 2,600 $40,000–59,999 9,900 3,300 2,700 6,200 4,300 2,500 $60,000–79,999 9,500 2,200 2,400 6,300 4,200 2,700 $80,000–99,999 10,600 1,800 2,300 6,300 4,100 3,100 $100,000 or more 11,400 ‡ 2,200 6,300 4,000 4,600
Independent students 11,400 4,800 1,500 9,400 4,300 6,100 Less than $10,000 12,000 5,300 1,600 9,300 4,300 6,000 $10,000–19,999 11,600 4,600 1,400 9,200 4,300 5,900 $20,000–29,999 11,000 4,200 1,500 9,600 4,500 6,100 $30,000–49,999 10,900 4,900 1,300 9,500 4,400 6,100 $50,000 or more 10,100 3,300 1,900 9,800 4,300 6,800
‡ Reporting standards not met. Too few cases for a reliable estimate. 1 Federal campus-based aid consists of Federal Supplemental Educational Opportunity Grants, federal work-study, and Perkins Loans. 2 Direct Subsidized and Unsubsidized Loans, also known as Stafford Loans, are federal loans to students for postsecondary education. Students may receive both subsidized and unsubsidized loans. Subsidized loans are need based, and students are not charged interest while they are enrolled. 3 Public 4-year, non-doctorate-granting, primarily subbaccalaureate institutions confer more than half of awards below the bachelor’s level. 4 Students who attended more than one institution during the 2015–16 academic year were reclassified into a separate category, because all or part of their financial aid may not have been received at the NPSAS sample institution. 5 Full-time/full-year students were enrolled full time for 9 or more months from July 1, 2015 through June 30, 2016. 6 Independent students include those who are age 24 or over, as well as those who are under age 24 and are married, have dependents, are veterans or on active duty, are orphans or wards of the courts, are homeless or at risk of homelessness, or were determined to be independent by a financial aid officer using professional judgment. Other undergraduates under age 24 are considered to be dependent. For independent students, income consists of the student’s income and, if married, the income of his or her spouse. For dependent students, income consists of parents’ income. NOTE: Federal Title IV aid consists of Pell Grants, federal campus-based aid programs, Teacher Education Assistance for College and Higher Education (TEACH) Grants, Iraq and Afghanistan Service Grants, Direct Subsidized and Unsubsidized Loans (also known as Stafford Loans), and Direct PLUS Loans to parents. Students may receive more than one type of aid. Estimates pertain to students enrolled in Title IV eligible postsecondary institutions in the 50 states, the District of Columbia, and Puerto Rico. SOURCE: U.S. Department of Education, National Center for Education Statistics, 2015–16 National Postsecondary Student Aid Study (NPSAS:16).
18 TABLES
Table 7. Percentage of graduate students receiving selected types of financial aid, by control and level of institution, graduate program, attendance pattern, and income level: 2015–16
Grants Student loans
Control and level of institution and student characteristics
Any aid1
Any grants2
Employer aid3
Total graduate assistantships4
Any loans5
Direct Unsubsidized
Loans6
Direct PLUS
Loans7
Total 71.6 40.3 13.6 7.7 44.2 39.9 10.0
Control and level of institution Public 4-year 67.2 40.0 12.7 12.7 37.9 33.5 7.6
Non-doctorate-granting 56.0 31.2 15.8 3.3 31.2 28.5 0.9 ! Doctorate-granting 68.4 40.9 12.4 13.7 38.6 34.0 8.3
Private nonprofit 4-year 74.3 42.2 14.6 4.4 45.7 41.3 13.1 Non-doctorate-granting 69.9 38.6 19.5 2.1 42.7 38.6 4.2 Doctorate-granting 75.0 42.7 13.8 4.8 46.2 41.7 14.6
Private for-profit, 4-year 77.0 33.4 13.6 0.3 60.2 57.5 8.2
More than one institution8 79.8 40.6 13.3 3.5 61.5 58.6 9.1
Graduate program Master’s degree 70.4 37.9 15.2 6.5 43.8 39.5 6.3 Doctoral—research/scholarship 81.3 55.1 10.1 27.8 30.6 27.1 5.7 Doctoral—professional practice 85.0 49.0 4.2 2.2 ! 72.3 68.7 41.9 Doctoral—other 67.3 36.6 9.6 4.9 ! 46.0 42.4 8.8 Other and nondegree 52.3 31.5 17.8 0.8 ! 25.9 20.6 3.3
Attendance pattern Full-time/full-year9 83.0 48.7 6.8 12.8 55.2 50.6 20.0 Part-time or part-year 65.1 35.6 17.4 4.8 37.8 33.9 4.3
Income level in 201410 Less than $10,000 74.0 42.3 5.2 9.1 51.8 46.4 18.2 $10,000–19,999 75.6 39.2 6.4 16.8 49.6 45.1 12.3 $20,000–29,999 77.1 40.3 7.3 13.3 48.8 45.0 8.9 $30,000–49,999 72.1 37.5 13.2 6.6 46.7 42.9 6.7 $50,000–99,999 68.6 39.5 21.8 3.9 38.2 34.6 5.3 $100,000 or more 64.5 41.9 26.9 1.6 28.8 25.5 4.5
! Interpret data with caution. Estimate is unstable because the standard error represents more than 30 percent of the estimate. 1 Any aid includes all types of financial aid from any source except parents, friends, or relatives. Types of aid such as federal veterans’ education benefits and job training funds are included, but federal tax credits for education are not included. 2 Any grants includes grants, scholarships, or tuition waivers from federal, state, institutional, or private sources, including employers. 3 Employer aid excludes tuition waivers to students holding assistantships. 4 Teaching assistantships are funded by institutions, but research assistantship funds may come from any source. 5 Any loans include only loans to students and may be from any source, but exclude other forms of financing such as credit cards, home equity loans, and loans from individuals. 6 Direct Unsubsidized Loans, also known as Stafford Loans, are federal loans to students for postsecondary education. Direct Subsidized Loans were discontinued for graduate students after 2011–12. 7 Federal Direct PLUS Loans are unsubsidized loans for graduate students available in addition to Direct Unsubsidized Loans. 8 Students who attended more than one institution during the 2015–16 academic year were reclassified into a separate category, because all or part of their financial aid may not have been received at the NPSAS sample institution. 9 Full-time/full-year students were enrolled full time for 9 or more months from July 1, 2015, through June 30, 2016. 10 Income consists of the student’s income and, if married, the income of his or her spouse. NOTE: Students may receive more than one type of aid. Estimates pertain to students enrolled in Title IV eligible postsecondary institutions in the 50 states, the District of Columbia, and Puerto Rico. SOURCE: U.S. Department of Education, National Center for Education Statistics, 2015–16 National Postsecondary Student Aid Study (NPSAS:16).
TABLES 19
Table 8. Average amounts of selected types of financial aid received among graduate students receiving that type of aid, by control and level of institution, graduate program, attendance pattern, and income level: 2015–16
Grants Student loans
Control and level of institution and student characteristics
Total aid1
Total grants2
Employer aid3
Total graduate assistantships4
Total loans5
Direct Unsubsidized
Loans6
Direct PLUS
Loans7
Total $22,000 $9,500 $6,000 $13,400 $23,400 $18,200 $22,300
Control and level of institution Public 4-year 19,600 8,100 4,800 12,700 21,200 17,900 16,100
Non-doctorate-granting 10,500 4,700 3,200 7,700 12,800 13,000 ‡ Doctorate-granting 20,400 8,400 5,000 12,800 21,900 18,300 16,200
Private nonprofit 4-year 25,500 12,200 7,300 15,800 27,400 19,600 26,500 Non-doctorate-granting 15,000 7,600 6,100 8,600 16,300 14,200 22,800 Doctorate-granting 27,100 12,800 7,600 16,300 29,100 20,400 26,700
Private for-profit, 4-year 17,600 4,400 4,800 ‡ 18,100 15,500 19,900
More than one institution8 19,600 6,400 6,400 15,000 18,800 15,300 22,200
Graduate program Master’s degree 17,400 7,500 6,200 10,500 18,600 15,400 19,400 Doctoral—research/scholarship 24,700 16,700 6,600 18,500 18,000 15,700 18,200 Doctoral—professional practice 47,400 13,700 7,300 ‡ 45,100 29,300 25,700 Doctoral—other 18,200 6,900 5,800 14,000 ! 18,600 15,900 18,200 Other and nondegree 12,800 5,800 3,500 ‡ 17,400 16,300 19,700
Attendance pattern Full-time/full-year9 33,200 14,200 9,400 14,800 32,600 22,700 24,700 Part-time or part-year 13,800 5,800 5,200 11,300 15,700 14,300 16,000
Income level in 201410 Less than $10,000 29,700 11,100 7,700 10,700 30,800 22,100 23,100 $10,000–19,999 24,700 10,700 4,900 13,100 23,800 18,100 23,700 $20,000–29,999 22,800 12,800 5,500 17,100 19,900 16,500 19,800 $30,000–49,999 19,100 8,800 5,400 14,100 19,000 16,100 19,900 $50,000–99,999 16,300 7,400 5,600 15,200 18,400 15,900 21,400 $100,000 or more 15,000 7,400 6,500 15,500 19,400 15,300 22,300
! Interpret data with caution. Estimate is unstable because the standard error represents more than 30 percent of the estimate. ‡ Reporting standards not met. Too few cases for a reliable estimate. 1 Total aid includes all types of financial aid from any source except parents, friends, or relatives. Types of aid such as federal veterans’ education benefits and job training funds are included, but federal tax credits for education are not included. 2 Total grants includes grants, scholarships, or tuition waivers from federal, state, institutional, or private sources, including employers. 3 Employer aid excludes tuition waivers to students holding assistantships. 4 Teaching assistantships are funded by institutions, but research assistantship funds may come from any source. 5 Total loans include only loans to students and may be from any source, but exclude other forms of financing such as credit cards, home equity loans, and loans from individuals. 6 Direct Unsubsidized Loans, also known as Stafford Loans, are federal loans to students for postsecondary education. Direct Subsidized Loans were discontinued for graduate students after 2011–12. 7 Federal Direct PLUS Loans are unsubsidized loans for graduate students available in addition to Direct Unsubsidized Loans. 8 Students who attended more than one institution during the 2015–16 academic year were reclassified into a separate category, because all or part of their financial aid may not have been received at the NPSAS sample institution. 9 Full-time/full-year students were enrolled full time for 9 or more months from July 1, 2015, through June 30, 2016. 10 Income consists of the student’s income and, if married, the income of his or her spouse. NOTE: Students may receive more than one type of aid. Estimates pertain to students enrolled in Title IV eligible postsecondary institutions in the 50 states, the District of Columbia, and Puerto Rico. SOURCE: U.S. Department of Education, National Center for Education Statistics, 2015–16 National Postsecondary Student Aid Study (NPSAS:16).

This page intentionally left blank
21
References
Chromy, J.R. (1979). Sequential Sample Selection Methods. In Proceedings of the Survey Research Methods Section of the American Statistical Association (pp. 401–406). Alexandria, VA: American Statistical Association.
Cohen, J. (1988). Statistical Power Analysis for the Behavioral Sciences (2nd ed.). Hillsdale, NJ: Lawrence Erlbaum Associates.
Cox, B. (1980). The Weighted Sequential Hot Deck Imputation Procedure. In Proceedings of the Section on Survey Research Methods, American Statistical Association (pp. 721–726). Alexandria, VA: American Statistical Association.
Flyer, P.A. (1987). Finite Population Correction for Replication Estimates of Variance. In Proceedings of the Section on Survey Research Methods, American Statistical Association (pp. 732–736). Alexandria, VA: American Statistical Association.
Folsom, R.E., Potter, F.J., and Williams, S.R. (1987). Notes on a Composite Size Measure for Self-Weighting Samples in Multiple Domains. In Proceedings of the Section on Survey Research Methods, American Statistical Association (pp. 792–796). Alexandria, VA: American Statistical Association.
Higher Education Opportunity Act of 2008, 20 U.S.C. § 1087ll (2008).
Kott, P.S. (1988). Model-Based Finite Population Correction for the Horvitz-Thompson Estimator. Biometrika, 75(4): 797–799.
Marker, D.A., Judkins, D.R., and Winglee, M. (2002). Large-Scale Imputation for Complex Surveys. In R. Groves, D. Dillman, J. Eltinge, and R. Little (Eds.), Survey Nonresponse (pp. 329–341). New York: John Wiley & Sons, Inc.
Radwin, D., and Wei, C.C. (2015). What Is the Price of College? Total, Net, and Out-of-Pocket Prices by Type of Institution in 2011–12 (NCES 2015-165). U.S. Department of Education. Washington, DC: National Center for Education Statistics.
RTI International. (2012). SUDAAN 11 Language Manuals. Research Triangle Park, NC: Author.
22 REFERENCES
Seastrom, M. (2014). NCES Statistical Standards (NCES 2014-097). U.S. Department of Education. Washington, DC: National Center for Education Statistics. Retrieved May 8, 2014, from https://nces.ed.gov/statprog/2012/.
U.S. Department of Education, Office of Federal Student Aid. (2015). 2015–2016 Federal Student Aid Handbook. Washington, DC: Author.
Wine, J., Stollberg, R., and Siegel, P. (forthcoming). 2015–16 National Postsecondary Student Aid Study (NPSAS:16): Data File Documentation. U.S. Department of Education. Washington, DC: National Center for Education Statistics.
A-1
Appendix A—Glossary
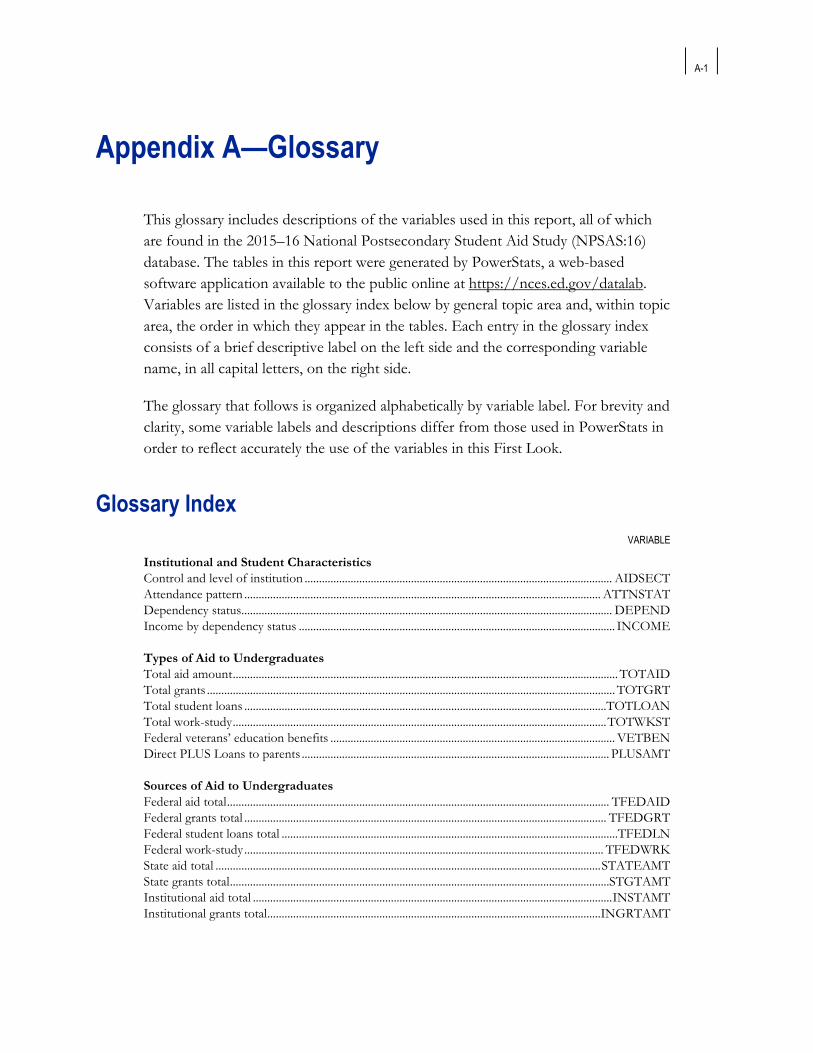
This glossary includes descriptions of the variables used in this report, all of which are found in the 2015–16 National Postsecondary Student Aid Study (NPSAS:16) database. The tables in this report were generated by PowerStats, a web-based software application available to the public online at https://nces.ed.gov/datalab. Variables are listed in the glossary index below by general topic area and, within topic area, the order in which they appear in the tables. Each entry in the glossary index consists of a brief descriptive label on the left side and the corresponding variable name, in all capital letters, on the right side.
The glossary that follows is organized alphabetically by variable label. For brevity and clarity, some variable labels and descriptions differ from those used in PowerStats in order to reflect accurately the use of the variables in this First Look.
Glossary Index VARIABLE
Institutional and Student Characteristics Control and level of institution ........................................................................................................... AIDSECT Attendance pattern ............................................................................................................................ ATTNSTAT Dependency status................................................................................................................................. DEPEND Income by dependency status .............................................................................................................. INCOME
Types of Aid to Undergraduates Total aid amount ...................................................................................................................................... TOTAID Total grants .............................................................................................................................................. TOTGRT Total student loans .............................................................................................................................. TOTLOAN Total work-study .................................................................................................................................. TOTWKST Federal veterans’ education benefits ................................................................................................... VETBEN Direct PLUS Loans to parents ........................................................................................................... PLUSAMT
Sources of Aid to Undergraduates Federal aid total ..................................................................................................................................... TFEDAID Federal grants total .............................................................................................................................. TFEDGRT Federal student loans total ..................................................................................................................... TFEDLN Federal work-study ............................................................................................................................. TFEDWRK State aid total ...................................................................................................................................... STATEAMT State grants total ....................................................................................................................................STGTAMT Institutional aid total ............................................................................................................................. INSTAMT Institutional grants total....................................................................................................................INGRTAMT
A-2 APPENDIX A—GLOSSARY
VARIABLE
Federal Title IV Aid to Undergraduates Total federal Title IV aid .................................................................................................................... TITIVAMT Federal Pell Grants ............................................................................................................................... PELLAMT Federal campus-based aid ................................................................................................................. CAMPAMT Federal Direct Loans .......................................................................................................................... STAFFAMT Federal Direct Subsidized Loans ......................................................................................................... STAFSUB Federal Direct Unsubsidized Loans ................................................................................................ STAFUNSB
Graduate Students Control and level of institution ........................................................................................................ AIDSECTG Graduate degree program .................................................................................................................GRADDEG Attendance pattern ............................................................................................................................ ATTNSTAT Graduate student income level in 2014 ........................................................................................... INCOMEG Total aid amount ...................................................................................................................................... TOTAID Total grants .............................................................................................................................................. TOTGRT Employer aid ..................................................................................................................................... EMPLYAMT Graduate assistantships.................................................................................................................... GRASTAMT Total student loans .............................................................................................................................. TOTLOAN Direct Unsubsidized Loans ............................................................................................................... STAFUNSB Direct PLUS Loans [to graduate students] ................................................................................... GPLUSAMT
APPENDIX A—GLOSSARY A-3
VARIABLE
Attendance pattern ATTNSTAT Students were considered to have attended for a full year if they were enrolled 9 or more months during the 2015–16 academic year. Months did not have to be contiguous nor at the same institution, and students did not have to be enrolled for a full month in order to be considered enrolled for that month. Students who were first enrolled in November 2015 or later but who subsequently enrolled full time are classified as full-time/part-year because they were enrolled full time for less than 9 months during the 12 months of the 2015–16 academic year. However, some of these students may have been enrolled continuously for 9 months or more if the enrollment period after June 2016 were included. The categories were as follows:
Full-time/full-year Enrolled full time for 9 or more months.
Full-time/part-year Enrolled full time, but for less than 9 months.
Part-time/full-year Enrolled for 9 or more months, but less than 9 months were full time.
Part-time or part-year Enrolled for less than 9 months, and these months were not all full time.
Control and level of institution AIDSECT AIDSECTG Control and level of the NPSAS sample institution attended by a student during the 2015–16 academic year, based on the classification in the 2016 Integrated Postsecondary Education Data System (IPEDS) Institutional Characteristics file. Control refers to the source of revenue and control of operations (public, private nonprofit, private for-profit), and level refers to the highest degree or award offered by the institution in any program. Doctorate-granting institutions awarded a doctoral—research/scholarship or doctoral—professional practice degree in one or more programs; non-doctorate-granting 4-year institutions awarded at least a bachelor’s degree; 2-year institutions awarded at least an associate’s degree; and less-than-2-year institutions awarded certificates or other credentials in vocational programs. Public 4-year, non-doctorate-granting institutions were further subdivided by whether the institutions primarily conferred subbaccalaureate awards (certificates and associate’s degrees) or bachelor’s degrees.
The 11 types of institutions consisting of combinations of control and level were used as the sampling strata for the NPSAS sample. Sample members who attended more than one institution during the 2015–16 academic year were reclassified for this report into a separate category, because all or part of their financial aid may not have been received at the NPSAS sample institution.
Dependency status DEPEND Student’s dependency status for federal financial aid purposes during the 2015–16 academic year. Students were considered to be financially independent of their parents for federal financial aid purposes during the 2015–16 academic year if they were age 24 or older on December 31, 2015, or if they were under age 24 and met any of the following criteria: were married; had legal dependents; were veterans of the U.S. armed forces or on active duty; were orphans or wards of the court; were homeless or at risk of becoming homeless; or were enrolled in a graduate degree program (beyond the bachelor’s degree) during the 2015–16 academic year. All other students under 24 were considered to be dependent unless they could document that they were receiving no parental support and were determined to be independent by a financial aid officer using professional judgment.
A-4 APPENDIX A—GLOSSARY VARIABLE
Direct PLUS Loans [to graduate students] GPLUSAMT Total amount of federal Direct PLUS Loans, also known as Graduate PLUS Loans, taken out by a graduate student at all institutions attended during the 2015–16 academic year. Federal Direct PLUS Loans were available to graduate students in addition to any federal Direct Unsubsidized Loans for which students were eligible. Direct PLUS Loans were not based on need. There was no fixed limit to the amount of a PLUS Loan, but the loan could not exceed the total price of attendance minus any other financial aid. Percentage estimates indicate students who received more than $0 in aid.
Direct PLUS Loans to parents PLUSAMT Total amount of federal Direct PLUS Loans, also known as Parent PLUS Loans, taken out by an undergraduate student’s parents at all institutions attended during the 2015–16 academic year. Federal Direct PLUS Loans were available to parents of dependent undergraduates in addition to any federal Direct Subsidized and Unsubsidized Loans for which students were eligible. Direct PLUS Loans were not based on need. There was no fixed limit to the amount of a PLUS Loan, but the loan could not exceed the total price of attendance minus any other financial aid. Percentage estimates indicate students who received more than $0 in aid.
Employer aid EMPLYAMT Total amount of aid received from employers at all institutions attended during the 2015–16 academic year. Employer aid consisted of grants to students from their employers or their parents’ employers, including employer-paid tuition reimbursements. It included tuition waivers from postsecondary institutions for faculty or staff and their dependents, but it did not include tuition waivers for graduate students holding assistantships. Percentage estimates indicate students who received more than $0 in aid.
Federal aid total TFEDAID Total amount of federal financial aid received by a student at all institutions attended during the 2015–16 academic year. This included federal grants, federal student loans, federal work-study, and federal Direct PLUS Loans. It included aid from programs in Title IV of the Higher Education Act, as well as aid from other federal sources such as Public Health Service Loans, Bureau of Indian Affairs Grants, and District of Columbia Tuition Assistance Grants. It did not include federal tax benefits, federal veterans’ education benefits, or Department of Defense programs. Percentage estimates indicate students who received more than $0 in aid.
Federal campus-based aid CAMPAMT Total amount of federal campus-based aid received by a student at all institutions attended during the 2015–16 academic year. The federal campus-based aid programs were the Federal Supplemental Educational Opportunity Grants (FSEOGs), federal work-study, and Perkins Loans. The federal campus-based program funds were allocated to institutions, and the financial aid officers at the institutions determined the allocation of awards to students within federal guidelines. All of the federal campus-based aid was awarded on the basis of need. Federal Pell Grant recipients were given priority for FSEOG awards and Perkins Loans. Percentage estimates indicate students who received more than $0 in aid.
Federal Direct Loans STAFFAMT Total amount of federal Direct Subsidized and Unsubsidized Loans received by a student at all institutions attended during the 2015–16 academic year including loans to attend schools other than the NPSAS sample school. As of July 1, 2012, graduate and professional students were no longer eligible to receive Direct Subsidized Loans. Direct Subsidized and Unsubsidized Loans are also known as Stafford Loans. Percentage estimates indicate students who received more than $0 in aid.
APPENDIX A—GLOSSARY A-5
VARIABLE
Federal Direct Subsidized Loans STAFSUB Total amount of federal Direct Subsidized Loans taken out by a student at all institutions attended during the 2015–16 academic year. Direct Subsidized Loans were awarded on the basis of financial need to students enrolled at least half time (usually taking at least two courses). If a student qualifies for a Direct Subsidized Loan, the federal government pays the interest on the loan until the student begins repayment and during authorized periods of deferment thereafter. Annual loan limits for Direct Subsidized Loans varied by class level (first-year undergraduate, second-year undergraduate, or other undergraduate) and dependency status. As of July 1, 2012, graduate and professional students were no longer eligible to receive Direct Subsidized Loans. Direct Subsidized Loans are also known as Subsidized Stafford Loans. Percentage estimates indicate students who received more than $0 in aid.
Federal Direct Unsubsidized Loans STAFUNSB Total amount of federal Direct Unsubsidized Loans taken out by a student at all institutions attended during the 2015–16 academic year. Direct Unsubsidized Loans were available to students enrolled at least half time (usually taking at least two courses) irrespective of need. Students are charged interest on the loan from the time the loan is disbursed until it is paid in full. Students can choose to pay the interest while they are enrolled or allow it to accumulate. If the student allows the interest to accumulate, then the interest is capitalized (added to the original loan principal). Annual loan limits for Direct Unsubsidized Loans varied by class level (first-year undergraduate, second-year undergraduate, or other undergraduate) and dependency status, with different limits for graduate students. Dependent students could take out additional Direct Unsubsidized Loans at the independent student limit if their parents were not eligible for a Direct PLUS Loan. Direct Unsubsidized Loans are also known as Unsubsidized Stafford Loans. Percentage estimates indicate students who received more than $0 in aid.
Federal grants total TFEDGRT Total amount of federal grants received by a student at all institutions attended during the 2015–16 academic year. These were primarily federal Pell Grants and FSEOGs, but they also included several smaller federal grant programs, as well as any federal graduate fellowships or traineeships received during the 2015–16 academic year. This amount did not include federal tax benefits, federal veterans’ education benefits, or Department of Defense programs. Percentage estimates indicate students who received more than $0 in aid.
Federal Pell Grants PELLAMT Total amount of federal Pell Grants received by a student at all institutions attended during the 2015–16 academic year. Pell Grants were need-based grants awarded to undergraduates who had not yet received a bachelor’s degree and students in teaching certificate programs. They were intended as a financial base to which other financial aid awards could be added. For the 2015–16 academic year, the maximum Pell Grant amount was $5,775 for students who had a federal expected family contribution (EFC) of zero and were enrolled full time for a full academic year. The actual amount of a Pell Grant received by the student depended on the EFC and the actual attendance pattern (full time or part time, full year or part year). Percentage estimates indicate students who received more than $0 in aid.
Federal student loans total TFEDLN Total amount of federal loans a student took out at all institutions attended during the 2015–16 academic year. These included Perkins Loans, Direct Subsidized and Unsubsidized Loans, and federal loans through the Public Health Service. They included Direct PLUS Loans to graduate students but excluded Direct PLUS Loans to parents. Percentage estimates indicate students who received more than $0 in aid.
A-6 APPENDIX A—GLOSSARY VARIABLE
Federal veterans’ education benefits VETBEN Total amount of all federal veterans’ education benefits received by a student at all institutions attended during the 2015–16 academic year. Included benefits to dependents of veterans. Amounts are based on Veterans Benefits Administration (VBA) administrative data and include payments for tuition and fees, books and supplies, work-study, housing, and other education expenses. Prior NPSAS cycles used amounts reported by students or their institutions. Amounts from prior NPSAS cycles may not include all the benefits included in the VBA data, particularly housing benefits, which were not explicitly requested from students or their institutions. Percentage estimates indicate students who received more than $0 in aid.
Federal work-study TFEDWRK Total amount awarded to a student through the federal work-study programs at all institutions attended during the 2015–16 academic year. It included the institutional matching funds as well as federal funds. Federal work-study was one of the three federal Title IV campus-based aid programs and was awarded based on need. Percentage estimates indicate students who received more than $0 in aid.
Graduate assistantships GRASTAMT Total amount of all graduate student assistantships received by a student at all institutions attended during the 2015–16 academic year, including all research assistantships, teaching assistantships, and any other type of graduate assistantships. Assistantships were classified as institutional aid, but they included research assistantships funded from federal or other sources. Percentage estimates indicate students who received more than $0 in aid.
Graduate degree program GRADDEG General type of graduate degree program in which the student was enrolled during the 2015–16 academic year. Specific categories included master’s degree, doctoral—research/scholarship, doctoral—professional practice, and doctoral—other. Master’s degrees usually require the equivalent of one to two full-time academic years of work beyond the bachelor’s degree, but certain types of master’s degrees such as M.Div. and M.H.L./Rav may require more than two full-time equivalent academic years. Doctoral—research/scholarship programs, such as Ph.D., Ed.D., D.M.A., D.B.A., D.Sc., D.A., or D.M, were doctoral degrees beyond the master’s level that require completion of a dissertation based on original research or an original project demonstrating substantial artistic or scholarly achievement. Doctoral—professional practice programs included one of the following: Chiropractic (D.C. or D.C.M.), Pharmacy (Pharm.D.), Dentistry (D.D.S. or D.M.D.), Podiatry (Pod.D. or D.P.), Medicine (M.D.), Veterinary Medicine (D.V.M.), Optometry (O.D.), Law (L.L.B. or J.D.), or Osteopathic Medicine (D.O.). Doctoral—other programs consisted of all other doctoral degree programs not classified as doctoral—research/scholarship or doctoral—professional practice. Students in postbaccalaureate certificate programs and those not enrolled in a formal degree program were included in the category “Other and nondegree” for this report.
Graduate student income level in 2014 INCOMEG For graduate students, this was the total income of the student and, if married, the income of his or her spouse. Prior calendar year income was reported in the financial aid application and used in determining the expected family contribution in need analysis. That is, 2014 income was used to determine financial aid eligibility for the 2015–16 academic year.
APPENDIX A—GLOSSARY A-7
VARIABLE
Income by dependency status INCOME Income category in 2014 by dependency status in the 2015–16 academic year. For dependent undergraduates, this was the total income of the student’s parents. For independent undergraduates, this was the total income of the student and, if married, the income of his or her spouse. Prior calendar year income was reported in the financial aid application and used in determining the expected family contribution in need analysis. That is, 2014 income was used to determine financial aid eligibility for the 2015–16 academic year. Income for those not filing a financial aid application was self-reported in the NPSAS interview.
Institutional aid total INSTAMT Total amount of institutional aid received by a student at all institutions attended during the 2015–16 academic year. This included all types of institutional grants and scholarships from institutional funds, tuition waivers, institutional loans, institutional work-study (outside of the federal work-study program), and graduate student assistantships. Percentage estimates indicate students who received more than $0 in aid.
Institutional grants total INGRTAMT Total amount of grant aid received by a student at all institutions attended during the 2015–16 academic year that was funded by the postsecondary institution attended. This included all grants, scholarships, tuition waivers, and graduate fellowships from institutional funds. It included both need- and merit-based grants. Percentage estimates indicate students who received more than $0 in aid.
State aid total STATEAMT Total amount of state-funded financial aid received by a student at all institutions attended during the 2015–16 academic year. This included state grants, state loans, state-sponsored work-study, and vocational rehabilitation and job training grants, including any federal Workforce Investment Opportunity Act funds. Percentage estimates indicate students who received more than $0 in aid.
State grants total STGTAMT Total amount of state-funded grants, scholarships, and fellowships received by a student at all institutions attended during the 2015–16 academic year. These grants included the federal matching funds to states through the Leveraging Educational Assistance Partnership program and included need- and merit-based grant programs. Percentage estimates indicate students who received more than $0 in aid.
Total aid amount TOTAID Total amount of financial aid received by a student at all institutions attended during the 2015–16 academic year from any source except parents, relatives, or friends. It included any grants, student loans, work-study, Direct PLUS Loans to graduate students and parents of dependent undergraduates, job training funds, federal veterans’ education benefits and Department of Defense programs, and graduate assistantships. It did not include federal or state tax benefits. Percentage estimates indicate students who received more than $0 in aid.
Total federal Title IV aid TITIVAMT Total amount received by a student from federal financial aid programs in Title IV of the Higher Education Act at all institutions attended during the 2015–16 academic year. The Title IV programs included federal Pell Grants, the Teacher Education Assistance for College and Higher Education (TEACH) Grants, the Iraq and Afghanistan Service Grants, Direct Subsidized and Unsubsidized Loans, Direct PLUS Loans to graduate students and parents of dependent undergraduates, and the federal campus-based programs (Perkins Loans, FSEOGs, and federal work-study). Percentage estimates indicate students who received more than $0 in aid.
A-8 APPENDIX A—GLOSSARY VARIABLE
Total grants TOTGRT Total amount of all grants and scholarships received by a student at all institutions attended during the 2015–16 academic year. A grant is a type of student financial aid that does not require repayment or employment. This amount was equal to the sum of all federal grants, state grants, institutional grants, and grants from employers or private sources. All need-based grants, merit scholarships, tuition waivers, and employer tuition reimbursements were included. Percentage estimates indicate students who received more than $0 in aid.
Total student loans TOTLOAN Total amount of all student loans taken out by a student at all institutions attended during the 2015–16 academic year. This amount included all student loans received through federal, state, institutional, or private programs. A student loan was defined as a type of financial aid in which funds were advanced to a student, and the receipt of aid was evidenced by a promissory note requiring the recipient to repay the specified amounts under prescribed conditions. It excluded federal Direct PLUS Loans to parents and any loans from family or friends. Percentage estimates indicate students who received more than $0 in aid.
Total work-study TOTWKST Total amount of work-study aid received by a student at all institutions attended during the 2015–16 academic year. This amount included all federal, state, and institutional work-study aid and included undergraduates who had assistantships, tutoring, dormitory, or advising jobs. Graduate research, teaching, or other assistantships were classified separately. Percentage estimates indicate students who received more than $0 in aid.
APPENDIX B—TECHNICAL NOTES AND METHODOLOGY B-1
Appendix B—Technical Notes and Methodology
Overview Developed by the U.S. Department of Education (ED), National Center for Education Statistics (NCES), the 2015–16 National Postsecondary Student Aid Study (NPSAS:16) includes a cross-sectional, nationally representative sample of undergraduate and graduate students enrolled in postsecondary education in the United States. It covers topics pertaining to student enrollment with a focus on how individuals and families finance postsecondary education. In addition to administering a student survey, NPSAS collects data from the institutions attended by the enrolled students and from other relevant databases, including ED records on student loan and grant programs. The result is a comprehensive dataset of student-level demographic and enrollment data with federal records on various forms of financial aid.
Since the first NPSAS study in 1986–87, NCES has conducted NPSAS every 3 to 4 years, most recently during the 2015–16 academic year. NPSAS traditionally serves as the base-year data collection for two longitudinal studies—the Beginning Postsecondary Students Longitudinal Study (BPS) and the Baccalaureate and Beyond Longitudinal Study (B&B)—in alternating cycles. NPSAS:16 serves as the base year for B&B, which focuses on students who completed the requirements for the bachelor’s degree during the 2015–16 academic year. As part of the longitudinal study, NCES contacted the B&B:16 cohort in 2017 for a follow-up survey and plans to do so again in 2020 and 2026. Consequently, subsets of questions in the NPSAS:16 student interview focused on the experience of baccalaureate recipients, including questions about the last year of their bachelor’s degree program, student debt accrual and repayment status, entry to graduate school, and the transition to employment.
Data Sources Information for NPSAS:16 came from multiple sources.
• Student interview: NPSAS:16 respondents provided information through a self-administered web survey or a computer-assisted telephone interview.
B-2 APPENDIX B—TECHNICAL NOTES AND METHODOLOGY
• Student records: Institutions were asked to provide student information from financial aid records and other institutional sources.
• Central Processing System (CPS): CPS is an ED database that consolidates data from the Free Application for Federal Student Aid (FAFSA) forms submitted by students.
• National Student Loan Data System (NSLDS): NSLDS is an ED database containing student-level data on federal Pell Grants and federal student loans.
• Integrated Postsecondary Education Data System (IPEDS): IPEDS is the NCES database of descriptive information about every postsecondary institution that participates in federal student financial aid programs.
• ACT: These administrative records from ACT, Inc. contain survey data on students’ high school courses and grades and the highest ACT admissions test score of each student between the 2009–10 and 2014–15 academic years.
• SAT/College Board: These administrative records provided by College Board contain survey data on students’ high school courses and grades and the students’ most recent student SAT admissions test scores.
• National Student Clearinghouse (NSC): These administrative records provide enrollment and completion data for institutions that participate in NSC collections.
• Veterans Benefits Administration (VBA): These administrative records identify veterans and other recipients of most categories of federal veterans’ education benefits, amounts of federal veterans’ education benefits, and military service information.
Sample Design NPSAS:16 used a two-stage sampling design. The first stage involved the selection of institutions. In the second stage, students were selected from within sampled institutions.
To be eligible for NPSAS:16, selected institutions had to
• offer an educational program designed for persons who have completed secondary education;
• offer at least one academic, occupational, or vocational program of study lasting at least 3 months or 300 clock hours;
• offer courses that were open to more than the employees or members of the company or group (e.g., union) that administers the institution;
APPENDIX B—TECHNICAL NOTES AND METHODOLOGY B-3
• be located in the 50 states, the District of Columbia, or Puerto Rico;
• not be a U.S. service academy institution; and
• have signed the Title IV participation agreement with the Department of Education.6
Institutions that provided only avocational, recreational, or remedial courses or only in-house courses for their own employees or members were excluded. All U.S. service academies, consisting of the U.S. Air Force Academy, the U.S. Coast Guard Academy, the U.S. Military Academy, the U.S. Merchant Marine Academy, and the U.S. Naval Academy, were excluded from the NPSAS:16 institution sample because of their unique funding and tuition structure.
The above institution eligibility conditions are consistent with all previous NPSAS administrations with three exceptions. First, institutions that were not eligible to distribute Title IV student financial aid were included prior to NPSAS:2000. Second, otherwise-eligible institutions that offered instruction exclusively through correspondence courses were not included prior to NPSAS:04. Third, institutions in Puerto Rico were not included in NPSAS:87 or NPSAS:12. For more information on how to compare estimates across NPSAS cycles, see “Comparison to Prior NPSAS Administrations” below.
The NPSAS:16 target population was all eligible students enrolled at any time between July 1, 2015, and June 30, 2016, in eligible postsecondary institutions in the United States who met three additional conditions. The first condition was that students had to be enrolled in a program or coursework eligible for Title IV aid, which consisted of either (1) an academic program; (2) at least one course for credit that could be applied toward fulfilling the requirements for an academic degree; (3) exclusively noncredit remedial coursework but determined by the institution to be eligible for Title IV aid; or (4) an occupational or vocational program that required at least 3 months or 300 clock hours of instruction to receive a degree, certificate, or other type of formal award. The second condition was that students could not be currently enrolled in high school. The third condition was that students could not be solely enrolled in a high school completion program.
The above student eligibility criteria are consistent with all previous NPSAS administrations except that, prior to 2012, all students enrolled exclusively in noncredit remedial coursework were ineligible to participate in NPSAS.
6 A Title IV eligible institution has a written program participation agreement with the U.S. Secretary of Education that allows the institution to participate in any of the Title IV federal student financial assistance programs other than the State Student Incentive Grant and the National Early Intervention Scholarship and Partnership programs.
B-4 APPENDIX B—TECHNICAL NOTES AND METHODOLOGY
NPSAS statisticians created the NPSAS:16 institution sampling frame in a different manner than had been done for the three previous NPSAS administrations. Earlier administrations created only one sampling frame for both field-test and full-scale data collections. For NPSAS:16, statisticians created separate institution frames for the field-test and full-scale data collections. The field-test institution frame was constructed from the IPEDS 2013–14 Institutional Characteristics Header, 2013–14 Institutional Characteristics, 2012–13 Completions, and 2012–13 12-month Enrollment files. The full-scale institution frame was constructed from the IPEDS 2014–15 Institutional Characteristics Header, 2014–15 Institutional Characteristics, 2013–14 Completions, and 2013–14 12-month Enrollment files. Creating two separate institution frames ensured a more accurate and current full-scale institution sample because each frame was constructed using the most up-to-date files.
Large systems and institutions likely to be selected with certainty (i.e., probability of selection equal to one) in the full-scale frame were removed from the field-test frame to avoid burdening them with both field-test and full-scale data collections. Likewise, field-test sample institutions were removed from the full-scale frame for the purposes of burden reduction.7 Because some eligible institutions were excluded from being sampled, the weights for the full-scale sample institutions were adjusted so that the sum of the weights would represent the full population of eligible institutions.
NPSAS statisticians selected 2,000 institutions using a variation of probability proportional to size (PPS) sampling called sequential probability minimum replacement sampling (Chromy 1979). A composite size measure (Folsom, Potter, and Williams 1987) was created using enrollment data from the most recent IPEDS 12-month and Completions components.
In stage two of the sampling design, each sampled institution verified as NPSAS eligible was asked to provide a list of all students who satisfied all eligibility conditions. The NPSAS:16 student sample of 122,030 included several student subgroups that were intentionally sampled at rates differing from their actual proportion within the population to meet specific analytic objectives (e.g., to facilitate a longitudinal study of 2015–16 baccalaureate recipients, to increase the number of student veterans in the study). The oversampled student groups were
• baccalaureate recipients who were veterans;
7 It was decided for the full-scale data collection to oversample public 4-year, non-doctorate-granting, primarily subbaccalaureate institutions after the field-test results were analyzed. Therefore, 23 of these institutions were in both the field-test and full-scale collections.
APPENDIX B—TECHNICAL NOTES AND METHODOLOGY B-5
• baccalaureate recipients from science, technology, engineering, and mathematics (STEM) programs;
• baccalaureate recipients from teacher education programs;
• other undergraduate students who were veterans;
• graduate students who were veterans;
• first-time graduate students;
• master’s degree students in STEM programs;
• doctoral—research/scholarship and doctoral—other students in STEM programs;8
• students and baccalaureate recipients in public 4-year, non-doctorate-granting, primarily subbaccalaureate institutions;
• undergraduate students at all award levels enrolled in private for-profit institutions; and
• master’s degree students enrolled in private for-profit institutions.
Due to relatively large numbers within the target population, sampling certain student groups at a rate consistent with representation in the population would have made it difficult to draw inferences about the experiences of other bachelor’s degree, master’s degree, and doctoral students.
For this reason, the student groups that were undersampled were
• baccalaureate recipients from business programs;
• master’s degree students in education and business programs; and
• doctoral—research/scholarship and doctoral—other students in education and business programs.
Seventeen student sampling strata were identified for NPSAS:16. Like NPSAS:12, NPSAS:16 included additional stratification at the graduate-student level to improve the quality of estimates for students in STEM programs. The strata were
• baccalaureate recipients who were veterans;
• baccalaureate recipients from STEM programs;
• baccalaureate recipients from teacher education programs;
8 Doctoral—other degrees consist of all doctoral degrees other than doctoral—research/scholarship degrees and doctoral—professional practice degrees. Examples include D.B.A. (Doctor of Business Administration), D.F.A. (Doctor of Fine Arts), and D.P.A. (Doctor of Public Administration).

B-6 APPENDIX B—TECHNICAL NOTES AND METHODOLOGY
• baccalaureate recipients from business programs;
• baccalaureate recipients from other programs;
• undergraduate students not classified as baccalaureate recipients who were veterans;
• other undergraduate students;
• graduate students who were veterans;
• first-time graduate students;
• master’s degree students in STEM programs;
• master’s degree students in education and business programs;
• master’s degree students in other programs;
• doctoral—research/scholarship and doctoral—other students in STEM programs;
• doctoral—research/scholarship and doctoral—other students in education and business programs;
• doctoral—research/scholarship and doctoral—other students in other programs;
• doctoral—professional practice students; and
• graduate students not enrolled in a degree program.
To identify and sample veterans, Social Security numbers (SSNs) from the student enrollment lists were sent to the VBA for matching to the VBA administrative records. Students on the enrollment list who were identified as veterans receiving federal veterans’ education benefits or as veterans not receiving benefits were placed in the appropriate veteran stratum.
Student SSNs from enrollment lists were also matched to NSLDS financial aid data for student implicit stratification.9 Within each student stratum, individuals were sorted by whether they received federal aid and then systematically sampled so that the number of aided and unaided sampled students approximately matched the population proportions of aided and unaided students within the institution and student strata. This implicit stratification was done to help produce more accurate financial aid estimates.
Table B-1 shows the number of institutions that were sampled, the number of eligible institutions, and the number and unweighted and weighted percentages of eligible institutions providing enrollment lists, by institutional characteristics.
9 Implicit stratification creates strata during the sampling process by sorting the data (as opposed to explicit stratification, which creates the strata prior to sampling).
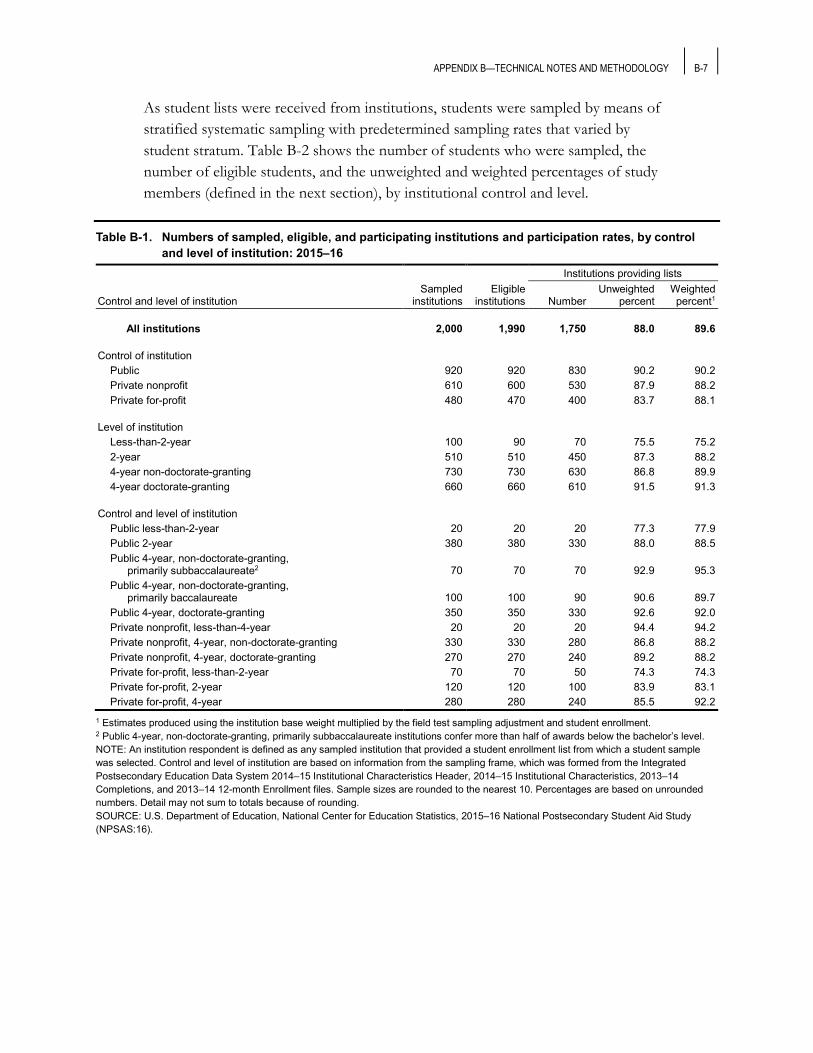
APPENDIX B—TECHNICAL NOTES AND METHODOLOGY B-7
As student lists were received from institutions, students were sampled by means of stratified systematic sampling with predetermined sampling rates that varied by student stratum. Table B-2 shows the number of students who were sampled, the number of eligible students, and the unweighted and weighted percentages of study members (defined in the next section), by institutional control and level.
Table B-1. Numbers of sampled, eligible, and participating institutions and participation rates, by control and level of institution: 2015–16
Institutions providing lists
Control and level of institution Sampled
institutions Eligible
institutions Number Unweighted
percent Weighted percent1
All institutions 2,000 1,990 1,750 88.0 89.6
Control of institution Public 920 920 830 90.2 90.2 Private nonprofit 610 600 530 87.9 88.2 Private for-profit 480 470 400 83.7 88.1
Level of institution Less-than-2-year 100 90 70 75.5 75.2 2-year 510 510 450 87.3 88.2 4-year non-doctorate-granting 730 730 630 86.8 89.9 4-year doctorate-granting 660 660 610 91.5 91.3
Control and level of institution Public less-than-2-year 20 20 20 77.3 77.9 Public 2-year 380 380 330 88.0 88.5 Public 4-year, non-doctorate-granting,
primarily subbaccalaureate2 70 70 70 92.9 95.3 Public 4-year, non-doctorate-granting,
primarily baccalaureate 100 100 90 90.6 89.7 Public 4-year, doctorate-granting 350 350 330 92.6 92.0 Private nonprofit, less-than-4-year 20 20 20 94.4 94.2 Private nonprofit, 4-year, non-doctorate-granting 330 330 280 86.8 88.2 Private nonprofit, 4-year, doctorate-granting 270 270 240 89.2 88.2 Private for-profit, less-than-2-year 70 70 50 74.3 74.3 Private for-profit, 2-year 120 120 100 83.9 83.1 Private for-profit, 4-year 280 280 240 85.5 92.2
1 Estimates produced using the institution base weight multiplied by the field test sampling adjustment and student enrollment. 2 Public 4-year, non-doctorate-granting, primarily subbaccalaureate institutions confer more than half of awards below the bachelor’s level. NOTE: An institution respondent is defined as any sampled institution that provided a student enrollment list from which a student sample was selected. Control and level of institution are based on information from the sampling frame, which was formed from the Integrated Postsecondary Education Data System 2014–15 Institutional Characteristics Header, 2014–15 Institutional Characteristics, 2013–14 Completions, and 2013–14 12-month Enrollment files. Sample sizes are rounded to the nearest 10. Percentages are based on unrounded numbers. Detail may not sum to totals because of rounding. SOURCE: U.S. Department of Education, National Center for Education Statistics, 2015–16 National Postsecondary Student Aid Study (NPSAS:16).
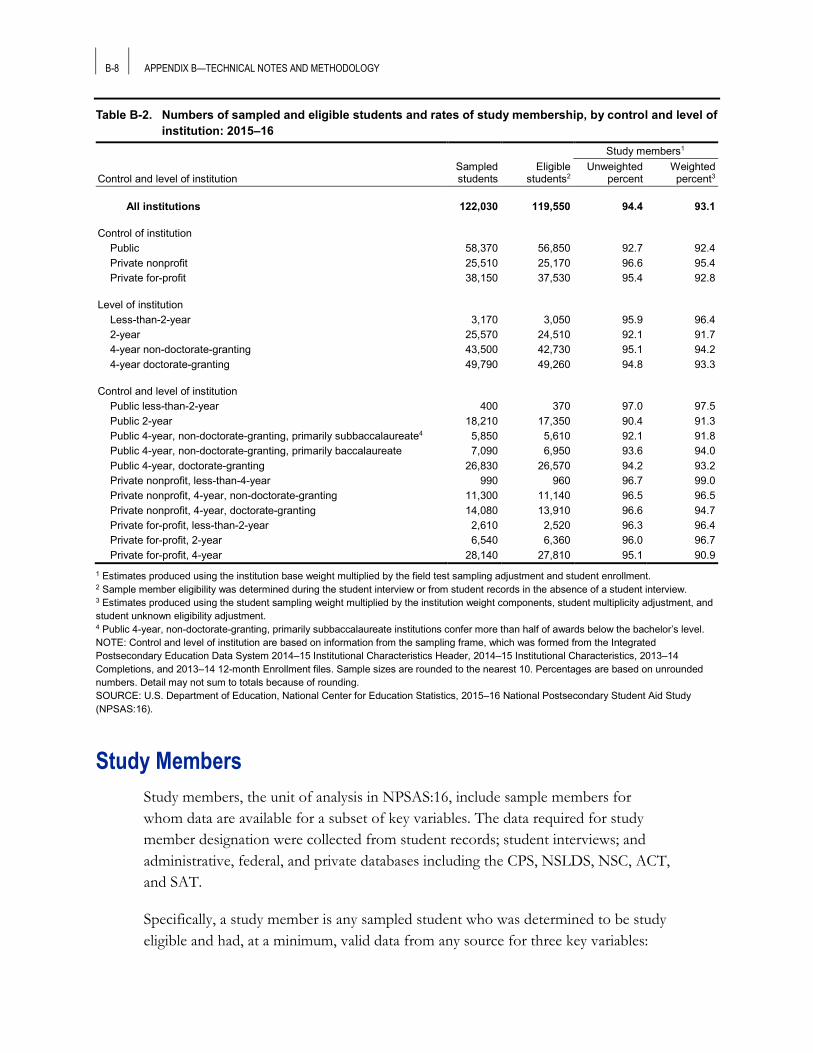
B-8 APPENDIX B—TECHNICAL NOTES AND METHODOLOGY
Table B-2. Numbers of sampled and eligible students and rates of study membership, by control and level of institution: 2015–16
Study members1
Control and level of institution Sampled students
Eligible students2
Unweighted percent
Weighted percent3
All institutions 122,030 119,550 94.4 93.1
Control of institution Public 58,370 56,850 92.7 92.4 Private nonprofit 25,510 25,170 96.6 95.4 Private for-profit 38,150 37,530 95.4 92.8
Level of institution Less-than-2-year 3,170 3,050 95.9 96.4 2-year 25,570 24,510 92.1 91.7 4-year non-doctorate-granting 43,500 42,730 95.1 94.2 4-year doctorate-granting 49,790 49,260 94.8 93.3
Control and level of institution Public less-than-2-year 400 370 97.0 97.5 Public 2-year 18,210 17,350 90.4 91.3 Public 4-year, non-doctorate-granting, primarily subbaccalaureate4 5,850 5,610 92.1 91.8 Public 4-year, non-doctorate-granting, primarily baccalaureate 7,090 6,950 93.6 94.0 Public 4-year, doctorate-granting 26,830 26,570 94.2 93.2 Private nonprofit, less-than-4-year 990 960 96.7 99.0 Private nonprofit, 4-year, non-doctorate-granting 11,300 11,140 96.5 96.5 Private nonprofit, 4-year, doctorate-granting 14,080 13,910 96.6 94.7 Private for-profit, less-than-2-year 2,610 2,520 96.3 96.4 Private for-profit, 2-year 6,540 6,360 96.0 96.7 Private for-profit, 4-year 28,140 27,810 95.1 90.9
1 Estimates produced using the institution base weight multiplied by the field test sampling adjustment and student enrollment. 2 Sample member eligibility was determined during the student interview or from student records in the absence of a student interview. 3 Estimates produced using the student sampling weight multiplied by the institution weight components, student multiplicity adjustment, and student unknown eligibility adjustment. 4 Public 4-year, non-doctorate-granting, primarily subbaccalaureate institutions confer more than half of awards below the bachelor’s level. NOTE: Control and level of institution are based on information from the sampling frame, which was formed from the Integrated Postsecondary Education Data System 2014–15 Institutional Characteristics Header, 2014–15 Institutional Characteristics, 2013–14 Completions, and 2013–14 12-month Enrollment files. Sample sizes are rounded to the nearest 10. Percentages are based on unrounded numbers. Detail may not sum to totals because of rounding. SOURCE: U.S. Department of Education, National Center for Education Statistics, 2015–16 National Postsecondary Student Aid Study (NPSAS:16).
Study Members Study members, the unit of analysis in NPSAS:16, include sample members for whom data are available for a subset of key variables. The data required for study member designation were collected from student records; student interviews; and administrative, federal, and private databases including the CPS, NSLDS, NSC, ACT, and SAT.
Specifically, a study member is any sampled student who was determined to be study eligible and had, at a minimum, valid data from any source for three key variables:
APPENDIX B—TECHNICAL NOTES AND METHODOLOGY B-9
• student type (undergraduate or graduate);
• date of birth or age;
• sex; and
• at least 8 of the following 15 variables:
o dependency status;
o marital status;
o any dependents;
o income;
o expected family contribution;
o degree program;
o class level;
o baccalaureate status;
o months enrolled;
o tuition;
o received federal aid;
o received nonfederal aid;
o student budget;
o race; and
o parent education.
Study members also must have had valid data for at least 1 variable among these 18 key variables that come from the interview or student records.
Perturbation To protect the confidentiality of information about specific individuals, NPSAS:16 data were subject to perturbation procedures to minimize disclosure risk. Perturbation procedures, which have been approved by the NCES Disclosure Review Board, preserve central tendency estimates but may result in slight increases in nonsampling errors.
Imputation For all variables used in this report, missing values have been imputed. The imputation procedures involved a four-step process. In the first step, missing values
B-10 APPENDIX B—TECHNICAL NOTES AND METHODOLOGY
were logically imputed.10 In the second step, variables and groups of variables were prioritized for imputation based upon their level of missing data; those with low levels of missingness were imputed before those with greater levels of missingness. For each variable or group of variables with missing values, NPSAS staff identified imputation classes, or combinations of characteristics with no missing values, from which valid values would be selected. In the third step, an initial weighted sequential hot deck process was implemented (Cox 1980),11 whereby missing data were replaced with valid data from donor records that matched the recipients with respect to the matching criteria. In the fourth step, a cyclic n-partition hot deck process (Marker, Judkins, and Winglee 2002) was implemented to iteratively cycle through n-partition hot decks.
Weighting All estimates in this report were weighted to represent the target population described in the Sample Design section. The institution sampling weight compensates for the unequal probability of selection of institutions in the NPSAS:16 sample. This institution sampling weight is adjusted for field-test sampling, nonresponse, and coverage (poststratification). The institution nonresponse and poststratification adjustments incorporate student enrollment at the institution level because all NPSAS inferences will be at the student level and not at the institution level. Additionally, the institutions were selected with PPS, with the size being counts of students, as described above. This method of sampling does not yield an accurate estimate of institutions.
The student sampling weight compensates for the unequal probability of selection of students in the NPSAS:16 sample. This student sampling weight is adjusted for students attending more than one institution during the 2015–16 academic year (student multiplicity), unknown student eligibility, nonresponse, and poststratification.
10 Logical imputation is possible when a missing value can be imputed given logical or mathematical relationships between other existing variable values. For example, if a student has valid values for the total number of dependents and the number of dependent children but not the number of other dependents, the third value may be calculated as the difference of the first value minus the second value. Likewise, if a student has zero total dependents, it may be logically inferred that the student has zero dependent children. 11 The term hot deck refers to an imputation method in which valid values in the current survey dataset are used to impute missing values. In contrast, cold deck imputation replaces a missing value with a constant value from an external source such as a value from a previous survey. (These terms date back to when a survey dataset was stored on a deck of computer punch cards. Cards from the same dataset were hot or warm to the touch from recent processing, whereas cards from a different dataset were cold.)
APPENDIX B—TECHNICAL NOTES AND METHODOLOGY B-11
A summary of all the weight components is presented in table B-3. The student analysis weight, WTA000, is the product of the weight components in table B-3.
Table B-3. Summary of components of the student analysis weight: 2015–16
Weight component Purpose
Field test sampling adjustment To adjust the weights for institutions that had a probability of being selected in the field test
Institution sampling weight To account for the institution’s probability of selection
Institution nonresponse adjustment To adjust the institution weights to compensate for nonresponding institutions
Institution postratification adjustment To adjust the institution weights to match population enrollment totals to ensure population coverage
Student sampling weight To account for the student’s probability of selection
Student multiplicity adjustment To adjust the weights for students who attended more than one institution
Student unknown eligibility adjustment To adjust the weights for nonresponding students with unknown eligibility
Student nonresponse adjustment To adjust the weights to compensate for nonresponding students
Student poststratification adjustment To adjust the student weights to match known population enrollment and aid totals to ensure population coverage
SOURCE: U.S. Department of Education, National Center for Education Statistics, 2015–16 National Postsecondary Student Aid Study (NPSAS:16).
Quality of Estimates
Bias Analysis: General Description NCES Statistical Standard 4-4-1 states that “Any survey stage of data collection with a unit or item response rate less than 85 percent must be evaluated for the potential magnitude of nonresponse bias before the data or any analysis using the data may be released. Estimates of survey characteristics for nonrespondents and respondents are required to assess the potential nonresponse bias” (Seastrom 2014).
Bias Analysis: Institution Level An institution respondent is defined as any sampled institution that provided a student enrollment list from which a student sample was selected.
As shown in table B-1, about 1,750 of the 1,990 eligible sample institutions were respondents (88 percent unweighted and 90 percent weighted). The weighted response rates, by control and level of institution, range from 74 percent for private for-profit, less-than-2-year institutions to 95 percent for public 4-year, non-doctorate-granting, primarily subbaccalaureate institutions. The institution-weighted response rate is below 85 percent for 3 of the 11 types of institutions: public less-
B-12 APPENDIX B—TECHNICAL NOTES AND METHODOLOGY
than-2-year; private for-profit, less-than-2-year; and private for-profit, 2-year institutions.
A nonresponse bias analysis was conducted overall and for each institutional sector, regardless of response rate. Because all sectors were included in the nonresponse weight adjustments, the bias analysis can evaluate how well the weight adjustments reduce nonresponse bias for sectors both above and below an 85 percent institution response rate. The nonresponse bias was estimated for characteristics known for most respondents and nonrespondents. There are extensive data available from IPEDS for all institutions for the 2014–15 and 2015–16 academic years. The variables used for the nonresponse bias analysis were
• control and level of institution;
• 2015 Carnegie Basic classification;
• degree of urbanization;12
• institution region;
• Historically Black College or University status;
• Hispanic-Serving Institution (HSI) status;13
• percentage of full-time, first-time degree/certificate-seeking students receiving federal grant aid;
• percentage of full-time, first-time degree/certificate-seeking students receiving state or local grant aid;
• percentage of full-time, first-time degree/certificate-seeking students receiving institutional grant aid;
• percentage of full-time, first-time degree/certificate-seeking students receiving student loan aid;
• average net price among full-time, first-time degree/certificate-seeking students receiving grant or scholarship aid;
• percentage of students enrolled who were Hispanic;
• percentage of students enrolled who were Asian or Pacific Islander, non-Hispanic;14
• percentage of students enrolled who were Black, non-Hispanic;
12 Degree of urbanization is an IPEDS variable representing the urbanicity (city/suburb/rural) by population size of the institution’s location. 13 Of the listed variables, only the HSI indicator no longer exists in IPEDS. An HSI proxy was created using IPEDS Hispanic enrollment data. 14 Asian or Pacific Islander, non-Hispanic includes Native Hawaiian.
APPENDIX B—TECHNICAL NOTES AND METHODOLOGY B-13
• total undergraduate enrollment;
• male undergraduate enrollment;
• female undergraduate enrollment;
• total graduate enrollment;
• male graduate enrollment;
• female graduate enrollment;
• number of bachelor’s degrees awarded;
• percentage of full-time, first-time degree/certificate-seeking undergraduate students who received any grant aid;
• number of full-time, first-time undergraduate students living on campus;
• average amount of grant and scholarship aid received; and
• number of full-time, first-time undergraduate students with incomes up to $30,000 who were receiving Title IV aid.15
First, for the institution-level variables listed above, the nonresponse bias was estimated for each category as the weighted difference between the means (proportions) of the respondents and of the full sample, and this estimated nonresponse bias was tested using a t-test to determine if it differed significantly from zero at the 5-percent level. Relative bias was computed as the ratio of the estimated bias to the weighted full-sample mean. Second, nonresponse adjustments were computed to reduce or eliminate nonresponse bias for key variables. Third, using the weights adjusted for nonresponse, the re-estimated nonresponse bias was tested for significance. These tests were complemented by effect size calculations.16 Finally, to better understand the effect of poststratification on efforts to reduce nonresponse bias, two additional sets of estimates were created. The first set of estimates equals the differences in respondent means before and after poststratification, which corresponds to the effect of poststratification on nonresponse adjustments. The second set of estimates, equal to the difference between base-weighted full-sample means and the poststratified respondent means, corresponds to the cumulative effects of all weighting and adjustment steps.
As shown in table B-4, the institution nonresponse weighting adjustment eliminated some, but not all, significant bias on the observable characteristics for sectors that met reporting requirements (excluding characteristics for sectors with fewer than five nonresponding institutions). Before weighting, the median effect size for all
15 For the continuous variables, categories were formed based on quartiles. 16 Effect size was calculated as the square root of the sum over categories of the squared bias estimates divided by full-sample means (Cohen 1988).

B-14 APPENDIX B—TECHNICAL NOTES AND METHODOLOGY
institutions was 0.08, ranging from 0.02 for public 4-year doctorate-granting institutions to 0.27 for public 4-year, non-doctorate-granting, primarily baccalaureate institutions. The percentage of variable categories that were significantly biased was 35 percent overall, ranging from zero percent for four institutional sectors to 10 percent for private for-profit, 4-year institutions. After the nonresponse weight adjustment, the median effect size for all institutions was 0.05, ranging from 0.05 for public 4-year doctorate-granting institutions to 0.27 for public 4-year, non-doctorate-granting, primarily baccalaureate institutions. The percentage of variable categories that remained significantly biased was 4 percent overall and ranged from zero percent for three institution sectors to 8 percent for private nonprofit, 4-year, doctorate-granting institutions.
As shown in table B-5, the mean absolute difference between means for respondents before and after poststratification adjustment ranged from zero for public 2-year institutions to 2.6 for private for-profit, less-than-2-year institutions. Similarly, the median absolute difference between means for respondents before and after poststratification adjustment ranged from zero for public 2-year institutions to 2.2 for private for-profit, less-than-2-year institutions. (Estimates for sectors with fewer than five nonresponding institutions were excluded.) The absolute difference between means for the full sample and respondents after poststratification adjustment ranged from 0.6 for public 4-year, doctorate-granting institutions to 6.6 for public 4-year, non-doctorate-granting, primarily baccalaureate institutions; and the median absolute difference ranged from 0.5 for public 4-year, doctorate-granting institutions to 3.8 for private for-profit, 2-year institutions.
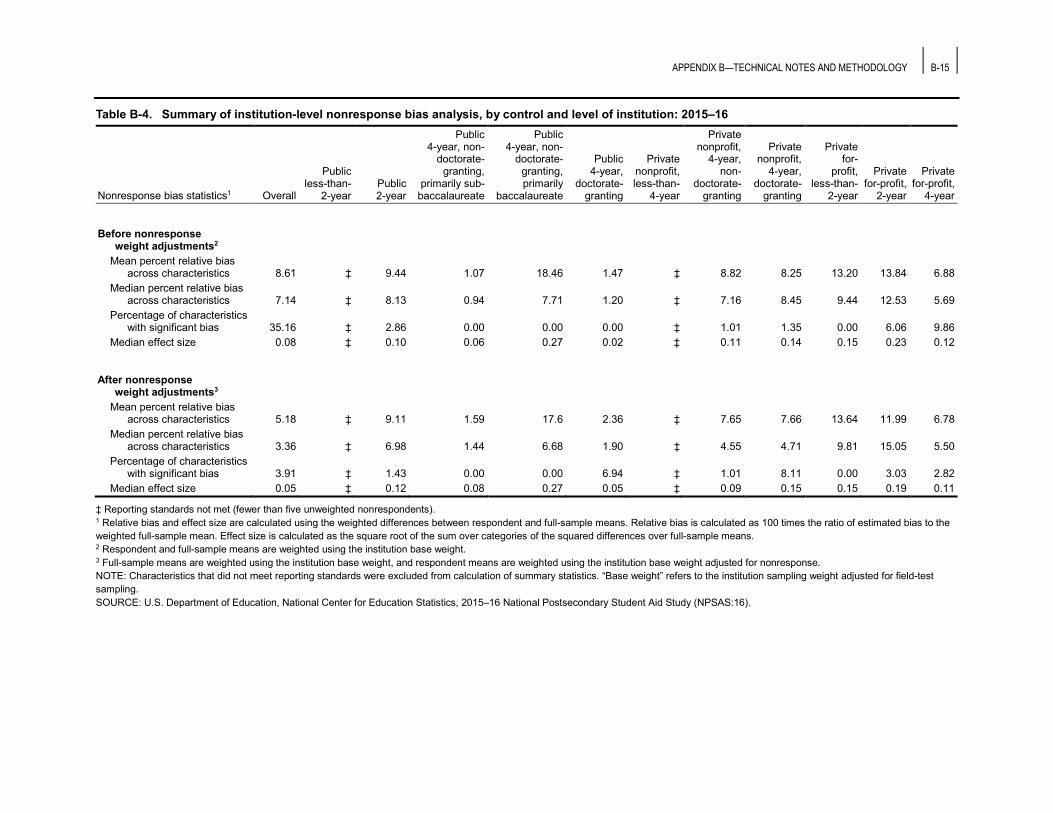
APPENDIX B—TECHNICAL NOTES AND METHODOLOGY B-15
Table B-4. Summary of institution-level nonresponse bias analysis, by control and level of institution: 2015–16
Nonresponse bias statistics1 Overall
Public less-than-
2-year Public 2-year
Public 4-year, non-
doctorate-granting,
primarily sub-baccalaureate
Public 4-year, non-
doctorate-granting, primarily
baccalaureate
Public 4-year,
doctorate-granting
Private nonprofit, less-than-
4-year
Private nonprofit,
4-year, non-
doctorate-granting
Private nonprofit,
4-year, doctorate-
granting
Private for-
profit, less-than-
2-year
Private for-profit,
2-year
Private for-profit,
4-year
Before nonresponse weight adjustments2
Mean percent relative bias across characteristics 8.61 ‡ 9.44 1.07 18.46 1.47 ‡ 8.82 8.25 13.20 13.84 6.88
Median percent relative bias across characteristics 7.14 ‡ 8.13 0.94 7.71 1.20 ‡ 7.16 8.45 9.44 12.53 5.69
Percentage of characteristics with significant bias 35.16 ‡ 2.86 0.00 0.00 0.00 ‡ 1.01 1.35 0.00 6.06 9.86
Median effect size 0.08 ‡ 0.10 0.06 0.27 0.02 ‡ 0.11 0.14 0.15 0.23 0.12
After nonresponse weight adjustments3
Mean percent relative bias across characteristics 5.18 ‡ 9.11 1.59 17.6 2.36 ‡ 7.65 7.66 13.64 11.99 6.78
Median percent relative bias across characteristics 3.36 ‡ 6.98 1.44 6.68 1.90 ‡ 4.55 4.71 9.81 15.05 5.50
Percentage of characteristics with significant bias 3.91 ‡ 1.43 0.00 0.00 6.94 ‡ 1.01 8.11 0.00 3.03 2.82
Median effect size 0.05 ‡ 0.12 0.08 0.27 0.05 ‡ 0.09 0.15 0.15 0.19 0.11
‡ Reporting standards not met (fewer than five unweighted nonrespondents). 1 Relative bias and effect size are calculated using the weighted differences between respondent and full-sample means. Relative bias is calculated as 100 times the ratio of estimated bias to the weighted full-sample mean. Effect size is calculated as the square root of the sum over categories of the squared differences over full-sample means. 2 Respondent and full-sample means are weighted using the institution base weight. 3 Full-sample means are weighted using the institution base weight, and respondent means are weighted using the institution base weight adjusted for nonresponse. NOTE: Characteristics that did not meet reporting standards were excluded from calculation of summary statistics. “Base weight” refers to the institution sampling weight adjusted for field-test sampling. SOURCE: U.S. Department of Education, National Center for Education Statistics, 2015–16 National Postsecondary Student Aid Study (NPSAS:16).
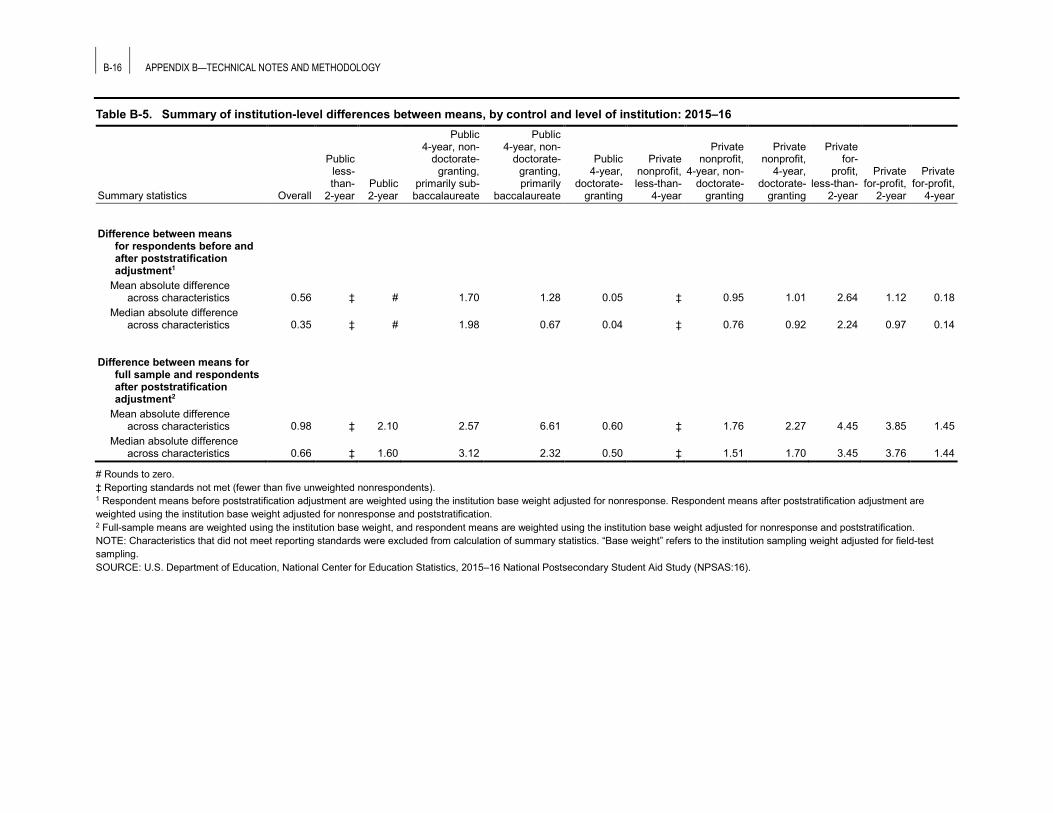
B-16 APPENDIX B—TECHNICAL NOTES AND METHODOLOGY
Table B-5. Summary of institution-level differences between means, by control and level of institution: 2015–16
Summary statistics Overall
Public less-than-
2-year Public 2-year
Public 4-year, non-
doctorate-granting,
primarily sub-baccalaureate
Public 4-year, non-
doctorate-granting, primarily
baccalaureate
Public 4-year,
doctorate-granting
Private nonprofit, less-than-
4-year
Private nonprofit,
4-year, non-doctorate-
granting
Private nonprofit,
4-year, doctorate-
granting
Private for-
profit, less-than-
2-year
Private for-profit,
2-year
Private for-profit,
4-year
Difference between means for respondents before and after poststratification adjustment1
Mean absolute difference across characteristics 0.56 ‡ # 1.70 1.28 0.05 ‡ 0.95 1.01 2.64 1.12 0.18
Median absolute difference across characteristics 0.35 ‡ # 1.98 0.67 0.04 ‡ 0.76 0.92 2.24 0.97 0.14
Difference between means for full sample and respondents after poststratification adjustment2
Mean absolute difference across characteristics 0.98 ‡ 2.10 2.57 6.61 0.60 ‡ 1.76 2.27 4.45 3.85 1.45
Median absolute difference across characteristics 0.66 ‡ 1.60 3.12 2.32 0.50 ‡ 1.51 1.70 3.45 3.76 1.44
# Rounds to zero. ‡ Reporting standards not met (fewer than five unweighted nonrespondents). 1 Respondent means before poststratification adjustment are weighted using the institution base weight adjusted for nonresponse. Respondent means after poststratification adjustment are weighted using the institution base weight adjusted for nonresponse and poststratification. 2 Full-sample means are weighted using the institution base weight, and respondent means are weighted using the institution base weight adjusted for nonresponse and poststratification. NOTE: Characteristics that did not meet reporting standards were excluded from calculation of summary statistics. “Base weight” refers to the institution sampling weight adjusted for field-test sampling. SOURCE: U.S. Department of Education, National Center for Education Statistics, 2015–16 National Postsecondary Student Aid Study (NPSAS:16).
APPENDIX B—TECHNICAL NOTES AND METHODOLOGY B-17
Bias Analyses: Study Member Level and Student Interview Level As shown in table B-2, of the approximately 119,550 eligible students, the unweighted and weighted rates of study membership were 94 and 93 percent, respectively. The weighted study membership rates, by control and level of institution, ranged from 91 to 99 percent.
A study member-level nonresponse bias analysis is not required per the NCES Statistical Standards, given the rates of study membership; however, a nonresponse bias analysis was conducted to provide context alongside the institution, student interview, and item-level nonresponse bias analyses. Using the procedure described above, these analyses were conducted overall and within each institutional sector. The nonresponse bias was estimated for characteristics known for most respondents and nonrespondents. Bias estimates for characteristic categories that do not meet reporting requirements because they have fewer than 30 student nonrespondents were excluded from calculations of summary statistics. The following characteristics were used for the nonresponse bias analysis:17
• institutional control and level;
• institutional region;
• student type (undergraduate or graduate);
• sampled baccalaureate recipient status (baccalaureate/not baccalaureate);
• student age as of December 31, 2015;
• major (2-digit Classification of Instructional Programs code);
• degree program (undergraduates only);
• parent’s education (from CPS for aid applicants);
• marital status (from CPS for aid applicants);
• support children (from CPS for aid applicants);
• income (from CPS for aid applicants);
• federal aid receipt status (yes/no/don’t know);18
• federal Pell Grant recipient (yes/no/don’t know);18
• Direct Loan recipient (yes/no/don’t know);18
17 For continuous variables, categories were formed based on quartiles. Institution-level variables come from 2014–15 and 2015–16 IPEDS and student-level variables from NPSAS:16 institution enrollment lists and CPS for aid applicants. 18 The “don’t know” category for federal aid captures sample members for whom an SSN was not available.
B-18 APPENDIX B—TECHNICAL NOTES AND METHODOLOGY
• institutional aid recipient (yes/no);
• state aid recipient (yes/no);
• federal Pell Grant amount;
• Direct Loan amount;
• institution enrollment;
• institution percentage of undergraduates who received any grant aid;
• veteran status;
• race;
• ethnicity;
• sex;
• percentage of first-time, full-time degree/certificate-seeking undergraduate students who received any grant aid;
• number of first-time, full-time undergraduate students living on campus;
• average amount of grant and scholarship aid received; and
• number of full-time, first-time undergraduate students with incomes up to $30,000 who were receiving Title IV aid.
As shown in table B-6, the student nonresponse weighting adjustment eliminated some, but not all, significant bias on the observable characteristics for sectors that met reporting requirements (have at least 30 non-study members). Before weighting, the median effect size for all institutions was 0.02, ranging from 0.01 for students in private nonprofit, less-than-4-year institutions to 0.06 for students in private for-profit, 4-year institutions. The percentage of characteristics that were significantly biased for study members was 58 percent overall, ranging from zero percent for students in private nonprofit, less-than-4-year institutions to 52 percent for students in public 2-year institutions. After the nonresponse weight adjustment, the median effect size for all study members was zero, ranging from zero for students in private nonprofit, less-than-4-year institutions to 0.04 for students in private for-profit, 4-year institutions. The percentage of characteristics that remained significantly biased was 19 percent overall and ranged from 1 percent for students in private for-profit, 4-year institutions to 21 percent for students in public 2-year institutions.
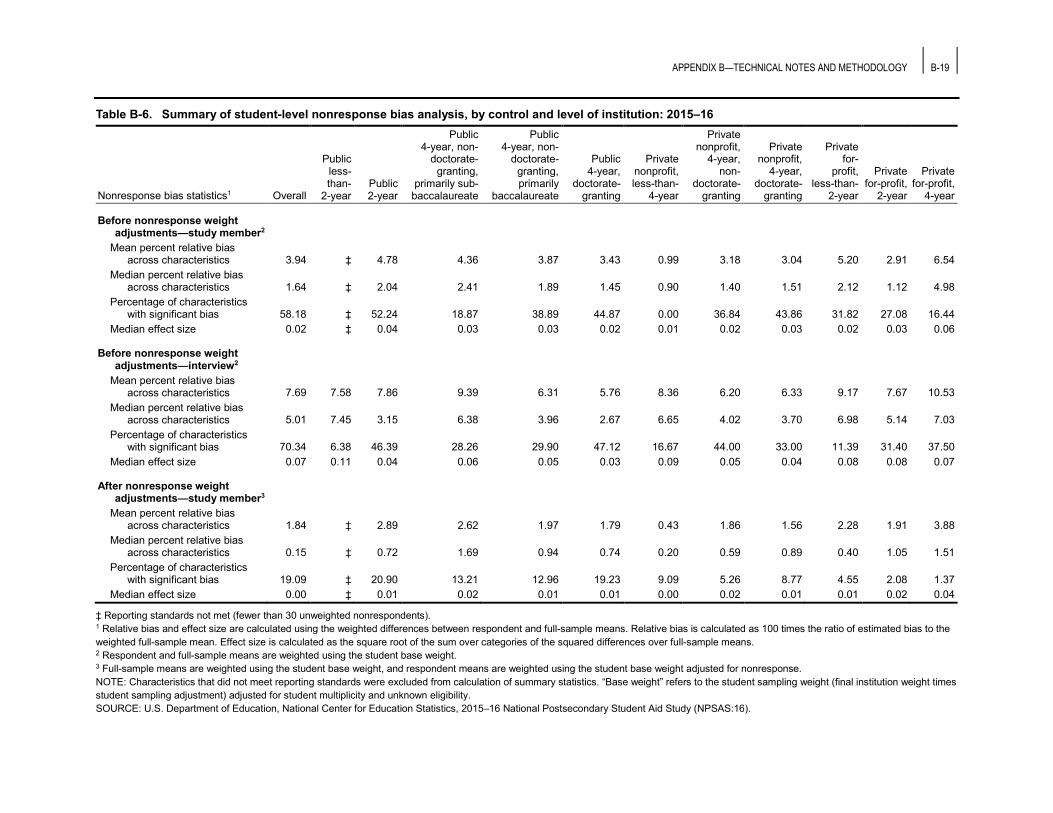
APPENDIX B—TECHNICAL NOTES AND METHODOLOGY B-19
Table B-6. Summary of student-level nonresponse bias analysis, by control and level of institution: 2015–16
Nonresponse bias statistics1 Overall
Public less-than-
2-year Public 2-year
Public 4-year, non-
doctorate-granting,
primarily sub-baccalaureate
Public 4-year, non-
doctorate-granting, primarily
baccalaureate
Public 4-year,
doctorate-granting
Private nonprofit, less-than-
4-year
Private nonprofit,
4-year, non-
doctorate-granting
Private nonprofit,
4-year, doctorate-
granting
Private for-
profit, less-than-
2-year
Private for-profit,
2-year
Private for-profit,
4-year
Before nonresponse weight adjustments—study member2
Mean percent relative bias across characteristics 3.94 ‡ 4.78 4.36 3.87 3.43 0.99 3.18 3.04 5.20 2.91 6.54
Median percent relative bias across characteristics 1.64 ‡ 2.04 2.41 1.89 1.45 0.90 1.40 1.51 2.12 1.12 4.98
Percentage of characteristics with significant bias 58.18 ‡ 52.24 18.87 38.89 44.87 0.00 36.84 43.86 31.82 27.08 16.44
Median effect size 0.02 ‡ 0.04 0.03 0.03 0.02 0.01 0.02 0.03 0.02 0.03 0.06
Before nonresponse weight adjustments—interview2
Mean percent relative bias across characteristics 7.69 7.58 7.86 9.39 6.31 5.76 8.36 6.20 6.33 9.17 7.67 10.53
Median percent relative bias across characteristics 5.01 7.45 3.15 6.38 3.96 2.67 6.65 4.02 3.70 6.98 5.14 7.03
Percentage of characteristics with significant bias 70.34 6.38 46.39 28.26 29.90 47.12 16.67 44.00 33.00 11.39 31.40 37.50
Median effect size 0.07 0.11 0.04 0.06 0.05 0.03 0.09 0.05 0.04 0.08 0.08 0.07
After nonresponse weight adjustments—study member3
Mean percent relative bias across characteristics 1.84 ‡ 2.89 2.62 1.97 1.79 0.43 1.86 1.56 2.28 1.91 3.88
Median percent relative bias across characteristics 0.15 ‡ 0.72 1.69 0.94 0.74 0.20 0.59 0.89 0.40 1.05 1.51
Percentage of characteristics with significant bias 19.09 ‡ 20.90 13.21 12.96 19.23 9.09 5.26 8.77 4.55 2.08 1.37
Median effect size 0.00 ‡ 0.01 0.02 0.01 0.01 0.00 0.02 0.01 0.01 0.02 0.04
‡ Reporting standards not met (fewer than 30 unweighted nonrespondents). 1 Relative bias and effect size are calculated using the weighted differences between respondent and full-sample means. Relative bias is calculated as 100 times the ratio of estimated bias to the weighted full-sample mean. Effect size is calculated as the square root of the sum over categories of the squared differences over full-sample means. 2 Respondent and full-sample means are weighted using the student base weight. 3 Full-sample means are weighted using the student base weight, and respondent means are weighted using the student base weight adjusted for nonresponse. NOTE: Characteristics that did not meet reporting standards were excluded from calculation of summary statistics. “Base weight” refers to the student sampling weight (final institution weight times student sampling adjustment) adjusted for student multiplicity and unknown eligibility. SOURCE: U.S. Department of Education, National Center for Education Statistics, 2015–16 National Postsecondary Student Aid Study (NPSAS:16).
B-20 APPENDIX B—TECHNICAL NOTES AND METHODOLOGY
As shown in table B-7, the absolute differences between means for respondents before and after poststratification adjustment ranged from 0.7 for students in public 2-year institutions and private nonprofit, 4-year, non-doctorate-granting institutions to 3.9 for students in private for-profit, 4-year institutions, while the median difference ranged from 0.2 for students in public 2-year institutions to 3.1 for students in private nonprofit, less-than-4-year institutions. For the absolute differences between means for the full sample and respondents after poststratification adjustment, the mean ranged from 0.7 for students in private nonprofit, 4-year, non-doctorate-granting institutions to 4.0 for students in private for-profit, 4-year institutions, while the median ranged from 0.3 for students in public 2-year institutions to 3.1 for students in private nonprofit, less-than-4-year institutions.
Finally, an additional nonresponse bias analysis was conducted in which interview respondents and interview nonrespondents were compared, following the same procedures outlined above. As shown in table B-6, before weighting, the percentage of characteristics for which bias was statistically significant was 70 percent for students overall and ranged from 6 percent for students in public less-than-2-year institutions to 48 percent for students in public 4-year, doctorate-granting institutions. The median effect size for all interview respondents was 0.07 and ranged from 0.03 for students in public 4-year, doctorate-granting institutions to 0.11 for students in public less-than-2-year institutions. Because study members, not interview respondents, are the unit of analysis in NPSAS:16, only a study member weight was created. Thus, nonresponse bias analyses after weight adjustments could not be computed, and it is unknown whether bias was reduced after adjusting the weights.
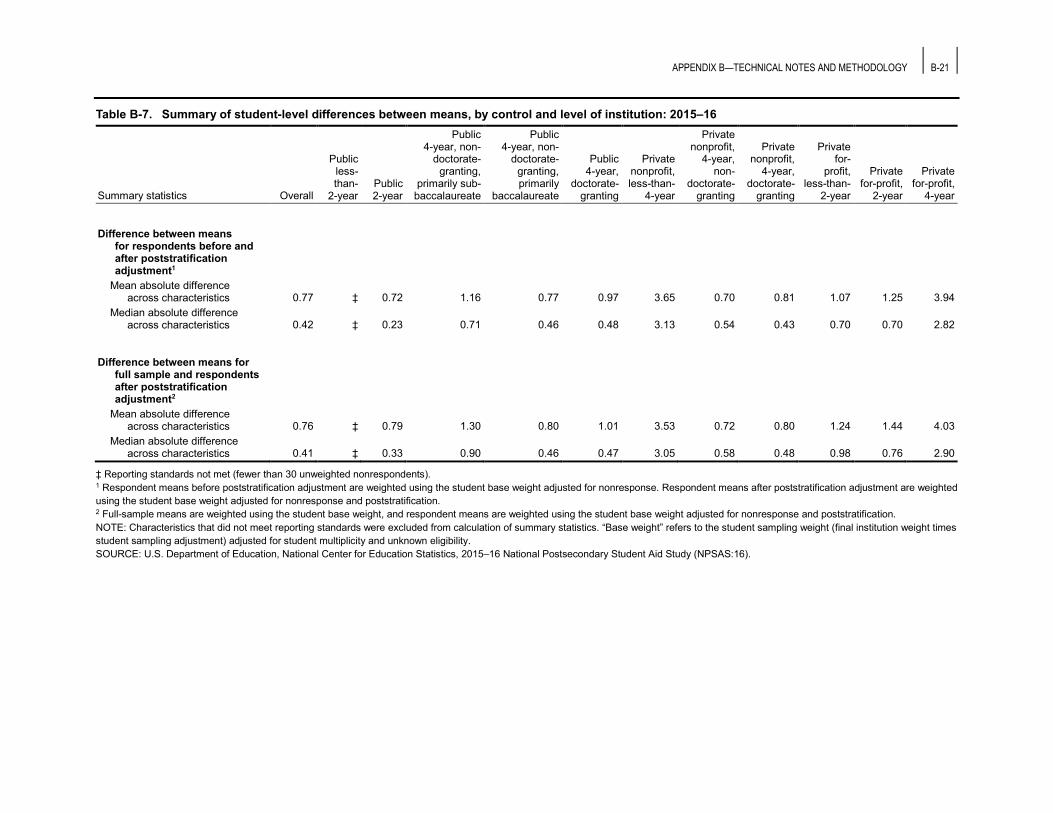
APPENDIX B—TECHNICAL NOTES AND METHODOLOGY B-21
Table B-7. Summary of student-level differences between means, by control and level of institution: 2015–16
Summary statistics Overall
Public less-than-
2-year Public 2-year
Public 4-year, non-
doctorate-granting,
primarily sub-baccalaureate
Public 4-year, non-
doctorate-granting, primarily
baccalaureate
Public 4-year,
doctorate-granting
Private nonprofit, less-than-
4-year
Private nonprofit,
4-year, non-
doctorate-granting
Private nonprofit,
4-year, doctorate-
granting
Private for-
profit, less-than-
2-year
Private for-profit,
2-year
Private for-profit,
4-year
Difference between means for respondents before and after poststratification adjustment1
Mean absolute difference across characteristics 0.77 ‡ 0.72 1.16 0.77 0.97 3.65 0.70 0.81 1.07 1.25 3.94
Median absolute difference across characteristics 0.42 ‡ 0.23 0.71 0.46 0.48 3.13 0.54 0.43 0.70 0.70 2.82
Difference between means for full sample and respondents after poststratification adjustment2
Mean absolute difference across characteristics 0.76 ‡ 0.79 1.30 0.80 1.01 3.53 0.72 0.80 1.24 1.44 4.03
Median absolute difference across characteristics 0.41 ‡ 0.33 0.90 0.46 0.47 3.05 0.58 0.48 0.98 0.76 2.90
‡ Reporting standards not met (fewer than 30 unweighted nonrespondents). 1 Respondent means before poststratification adjustment are weighted using the student base weight adjusted for nonresponse. Respondent means after poststratification adjustment are weighted using the student base weight adjusted for nonresponse and poststratification. 2 Full-sample means are weighted using the student base weight, and respondent means are weighted using the student base weight adjusted for nonresponse and poststratification. NOTE: Characteristics that did not meet reporting standards were excluded from calculation of summary statistics. “Base weight” refers to the student sampling weight (final institution weight times student sampling adjustment) adjusted for student multiplicity and unknown eligibility. SOURCE: U.S. Department of Education, National Center for Education Statistics, 2015–16 National Postsecondary Student Aid Study (NPSAS:16).
B-22 APPENDIX B—TECHNICAL NOTES AND METHODOLOGY
Bias Analysis: Item Level NCES Statistical Standard 4-4-3A states, “For an item with a low total response rate, respondents and nonrespondents can be compared on sampling frame and/or questionnaire variables for which data on respondents and nonrespondents are available. Base weights must be used in such analysis. Comparison items should have very high response rates. A full range of available items should be used for these comparisons. This approach may be limited to the extent that items available for respondents and nonrespondents may not be related to the low response rate item being analyzed” (Seastrom 2014).
Moreover, NCES Statistical Standard 1-3-5 states, “Item response rates (RRI) are calculated as the ratio of the number of respondents for whom an in-scope response was obtained (Ix for item x) to the number of respondents who are asked to answer that item. The number asked to answer an item is the number of unit-level respondents (I) minus the number of respondents with a valid skip for item x (Vx). When an abbreviated questionnaire is used to convert refusals, the eliminated questions are treated as item nonresponse. In the case of constructed variables, the numerator includes cases that have available data for the full set of items required to construct the variable, and the denominator includes all respondents eligible to respond to all items in the constructed variable” (Seastrom 2014). The item response rate is calculated as
RRIx = Ix / (I – Vx)
A student was defined to be an item respondent for an analytic variable if that student had data for that variable from any source, including logical imputation. An item nonrespondent for analytic variables was a student who did not have data for that variable from any source. As shown in table B-8, the weighted item response rates for items used in this First Look report for all students ranged from 46 percent for Total aid amount (TOTAID) and Total grants (TOTGRT) to 100 percent for variables derived from IPEDS and administrative records. The weighted item response rates by control and level of institution ranged from 27 percent, for TOTAID for students in private for-profit, 2-year institutions, to 100 percent for items based on IPEDS and administrative records.
Per NCES Standard 1-3-5, response rates for composite variables must account for missing inputs prior to imputation. Therefore, while many of the components of key constructed variables had response rates greater than 95 percent, some composite variables had low response rates due to components with low response rates. For example, the primary sources for the components of the composite variables for TOTGRT and Total student loans (TOTLOAN), which are the major components of
APPENDIX B—TECHNICAL NOTES AND METHODOLOGY B-23
TOTAID, were federal databases and data obtained from institutional student records. The federal databases have complete information of federal aid; however, information on other aid that is disbursed directly to students and not through institutional financial offices is not always available. Information on Employer aid (EMPLYAMT) and Private (alternative) loans (PRIVLOAN) is sometimes obtained from student records but is generally obtained from student interview responses because institutions are not always aware of students’ receipt of these aid types. If the student did not complete an interview and the institutional records for that student did not contain any employer aid or private loans for the student, these two variables were set to missing and statistically or logically imputed. The high rate of imputation for these two variables accounted for the low response rates for aggregate aid variables.
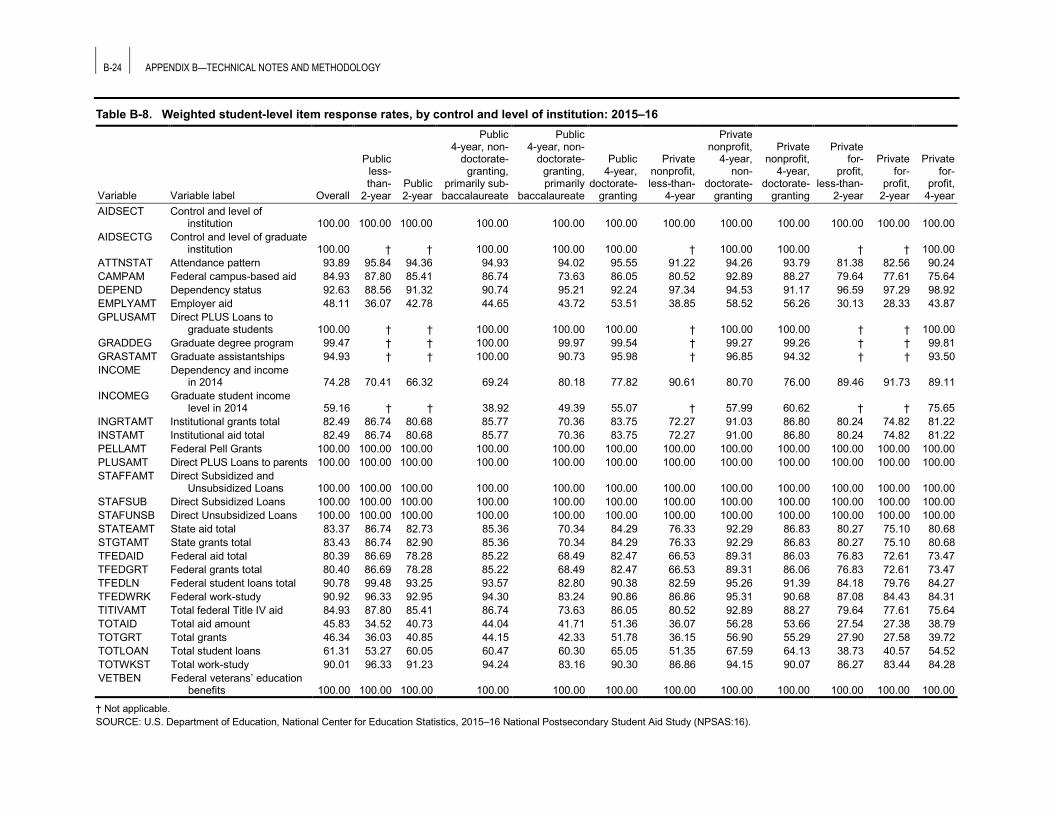
B-24 APPENDIX B—TECHNICAL NOTES AND METHODOLOGY
Table B-8. Weighted student-level item response rates, by control and level of institution: 2015–16
Variable Variable label Overall
Public less-than-
2-year Public 2-year
Public 4-year, non-
doctorate-granting,
primarily sub-baccalaureate
Public 4-year, non-
doctorate-granting, primarily
baccalaureate
Public 4-year,
doctorate-granting
Private nonprofit, less-than-
4-year
Private nonprofit,
4-year, non-
doctorate-granting
Private nonprofit,
4-year, doctorate-
granting
Private for-
profit, less-than-
2-year
Private for-
profit, 2-year
Private for-
profit, 4-year
AIDSECT Control and level of institution 100.00 100.00 100.00 100.00 100.00 100.00 100.00 100.00 100.00 100.00 100.00 100.00
AIDSECTG Control and level of graduate institution 100.00 † † 100.00 100.00 100.00 † 100.00 100.00 † † 100.00
ATTNSTAT Attendance pattern 93.89 95.84 94.36 94.93 94.02 95.55 91.22 94.26 93.79 81.38 82.56 90.24 CAMPAM Federal campus-based aid 84.93 87.80 85.41 86.74 73.63 86.05 80.52 92.89 88.27 79.64 77.61 75.64 DEPEND Dependency status 92.63 88.56 91.32 90.74 95.21 92.24 97.34 94.53 91.17 96.59 97.29 98.92 EMPLYAMT Employer aid 48.11 36.07 42.78 44.65 43.72 53.51 38.85 58.52 56.26 30.13 28.33 43.87 GPLUSAMT Direct PLUS Loans to
graduate students 100.00 † † 100.00 100.00 100.00 † 100.00 100.00 † † 100.00 GRADDEG Graduate degree program 99.47 † † 100.00 99.97 99.54 † 99.27 99.26 † † 99.81 GRASTAMT Graduate assistantships 94.93 † † 100.00 90.73 95.98 † 96.85 94.32 † † 93.50 INCOME Dependency and income
in 2014 74.28 70.41 66.32 69.24 80.18 77.82 90.61 80.70 76.00 89.46 91.73 89.11 INCOMEG Graduate student income
level in 2014 59.16 † † 38.92 49.39 55.07 † 57.99 60.62 † † 75.65 INGRTAMT Institutional grants total 82.49 86.74 80.68 85.77 70.36 83.75 72.27 91.03 86.80 80.24 74.82 81.22 INSTAMT Institutional aid total 82.49 86.74 80.68 85.77 70.36 83.75 72.27 91.00 86.80 80.24 74.82 81.22 PELLAMT Federal Pell Grants 100.00 100.00 100.00 100.00 100.00 100.00 100.00 100.00 100.00 100.00 100.00 100.00 PLUSAMT Direct PLUS Loans to parents 100.00 100.00 100.00 100.00 100.00 100.00 100.00 100.00 100.00 100.00 100.00 100.00 STAFFAMT Direct Subsidized and
Unsubsidized Loans 100.00 100.00 100.00 100.00 100.00 100.00 100.00 100.00 100.00 100.00 100.00 100.00 STAFSUB Direct Subsidized Loans 100.00 100.00 100.00 100.00 100.00 100.00 100.00 100.00 100.00 100.00 100.00 100.00 STAFUNSB Direct Unsubsidized Loans 100.00 100.00 100.00 100.00 100.00 100.00 100.00 100.00 100.00 100.00 100.00 100.00 STATEAMT State aid total 83.37 86.74 82.73 85.36 70.34 84.29 76.33 92.29 86.83 80.27 75.10 80.68 STGTAMT State grants total 83.43 86.74 82.90 85.36 70.34 84.29 76.33 92.29 86.83 80.27 75.10 80.68 TFEDAID Federal aid total 80.39 86.69 78.28 85.22 68.49 82.47 66.53 89.31 86.03 76.83 72.61 73.47 TFEDGRT Federal grants total 80.40 86.69 78.28 85.22 68.49 82.47 66.53 89.31 86.06 76.83 72.61 73.47 TFEDLN Federal student loans total 90.78 99.48 93.25 93.57 82.80 90.38 82.59 95.26 91.39 84.18 79.76 84.27 TFEDWRK Federal work-study 90.92 96.33 92.95 94.30 83.24 90.86 86.86 95.31 90.68 87.08 84.43 84.31 TITIVAMT Total federal Title IV aid 84.93 87.80 85.41 86.74 73.63 86.05 80.52 92.89 88.27 79.64 77.61 75.64 TOTAID Total aid amount 45.83 34.52 40.73 44.04 41.71 51.36 36.07 56.28 53.66 27.54 27.38 38.79 TOTGRT Total grants 46.34 36.03 40.85 44.15 42.33 51.78 36.15 56.90 55.29 27.90 27.58 39.72 TOTLOAN Total student loans 61.31 53.27 60.05 60.47 60.30 65.05 51.35 67.59 64.13 38.73 40.57 54.52 TOTWKST Total work-study 90.01 96.33 91.23 94.24 83.16 90.30 86.86 94.15 90.07 86.27 83.44 84.28 VETBEN Federal veterans’ education
benefits 100.00 100.00 100.00 100.00 100.00 100.00 100.00 100.00 100.00 100.00 100.00 100.00
† Not applicable. SOURCE: U.S. Department of Education, National Center for Education Statistics, 2015–16 National Postsecondary Student Aid Study (NPSAS:16).
APPENDIX B—TECHNICAL NOTES AND METHODOLOGY B-25
As shown in table B-8, 14 of the items had a weighted response rate below 85 percent, and 18 of the items had a weighted response rate below 85 percent for at least one institution type. The response rates for five items (TOTAID, TOTGRT, TOTLOAN, EMPLYAMT, and INCOMEG) were below 85 percent for all students and for all applicable institution types. (See appendix A for descriptions of these items.) A nonresponse bias analysis was conducted for the 18 items with response rates below 85 percent, summarized in table B-9 for students overall. The procedures used for the preimputation item-level nonresponse bias analysis were the same as those used for the unit-level nonresponse bias analysis presented above. Before imputation, the mean and median percent relative bias across characteristics ranged from 4.4 and 2.3, respectively, for Attendance Pattern (ATTNSTAT) to 17.6 (INCOMEG) and 8.9 (INCOMEG and TOTGRT), respectively. Median effect sizes were small, ranging from 0.03 for ATTNSTAT to 0.11 for INCOMEG. A goal of imputation (described above) is the reduction or elimination of nonresponse bias. While bias after imputation is not directly measurable, it is possible to compare estimates before and after imputation to determine whether the imputation changed the estimates. Changes generally indicate a reduction in bias, whereas no change suggests that bias was not reduced or was not present. For the preimputation versus postimputation comparisons, 12 variables showed a statistically significant difference or at least a one category-level significant difference, although most changes were small. The variables with the largest corresponding effect size and potentially the largest reduction in bias were INCOME (0.16) and INCOMEG (0.22).

B-26 APPENDIX B—TECHNICAL NOTES AND METHODOLOGY
Table B-9. Summary of item nonresponse bias analysis for all students: 2015–16
Before Imputation After Imputation
Variable
Mean percent relative bias across
characteristics
Median percent relative bias across
characteristics
Percentage of characteristics with
significant bias Median
effect size
Difference between pre- and post-
imputation means1 Effect size
for difference
ATTNSTAT (Attendance pattern) 4.43 2.28 61.86 0.03 0.98 * 0.01
CAMPAMT (Federal campus-based aid) 7.53 3.25 42.50 0.04 8.27 * 0.02
EMPLYAMT (Employer aid) 14.10 8.29 60.50 0.09 11.45 * 0.02
INCOME (Income and dependency in 2014) 17.54 6.66 71.43 0.08 12.10 * 0.16
INCOMEG (Graduate student income level in 2014) 17.56 8.94 55.71 0.11 16.98 * 0.22
INGRTAMT (Institutional grants total) 8.04 4.35 47.06 0.05 1.71 0.01
INSTAMT (Institutional aid total) 8.04 4.35 47.06 0.05 1.80 0.01
STATEAMT (State aid total) 7.59 3.41 45.38 0.05 7.71 * 0.03
STGTAMT (State grants total) 7.57 3.45 45.38 0.05 8.33 * 0.03
TFEDAID (Federal aid total) 8.48 4.46 43.70 0.05 1.74 0.01
TFEDGRT (Federal grants total) 8.48 4.46 43.70 0.05 1.93 * 0.01
TFEDLN (Federal student loans total) 6.02 2.59 44.92 0.03 4.87 * 0.02
TFEDWRK (Federal work-study) 6.41 2.59 45.76 0.04 3.51 * 0.01
TITIVAMT (Total federal Title IV aid) 7.53 3.25 42.50 0.04 0.27 #
TOTAID (Total aid amount) 12.76 8.59 60.68 0.08 16.19 * 0.12
TOTGRT (Total grants) 12.85 8.94 60.68 0.08 18.06 * 0.10
TOTLOAN (Total student loans) 10.31 5.02 66.67 0.05 2.78 0.01
TOTWKST (Total work-study) 6.58 2.93 47.46 0.04 0.20 #
# Rounds to zero. * The difference between the pre-and postimputation means is significant at the .05 level. For categorical variables, at least one category difference is significant. 1 For categorical variables, this is the size-weighted average percentage difference across categories pre- and postimputation. NOTE: Relative bias and effect size are calculated using the weighted differences between respondent and full-sample means. Relative bias is calculated as 100 times the ratio of estimated bias to the weighted full-sample mean. Effect size for categorical variables is calculated as the square root of the sum over categories of the squared differences over full-sample means. Characteristics that did not meet reporting standards were excluded from calculation of summary statistics. SOURCE: U.S. Department of Education, National Center for Education Statistics, 2015–16 National Postsecondary Student Aid Study (NPSAS:16).
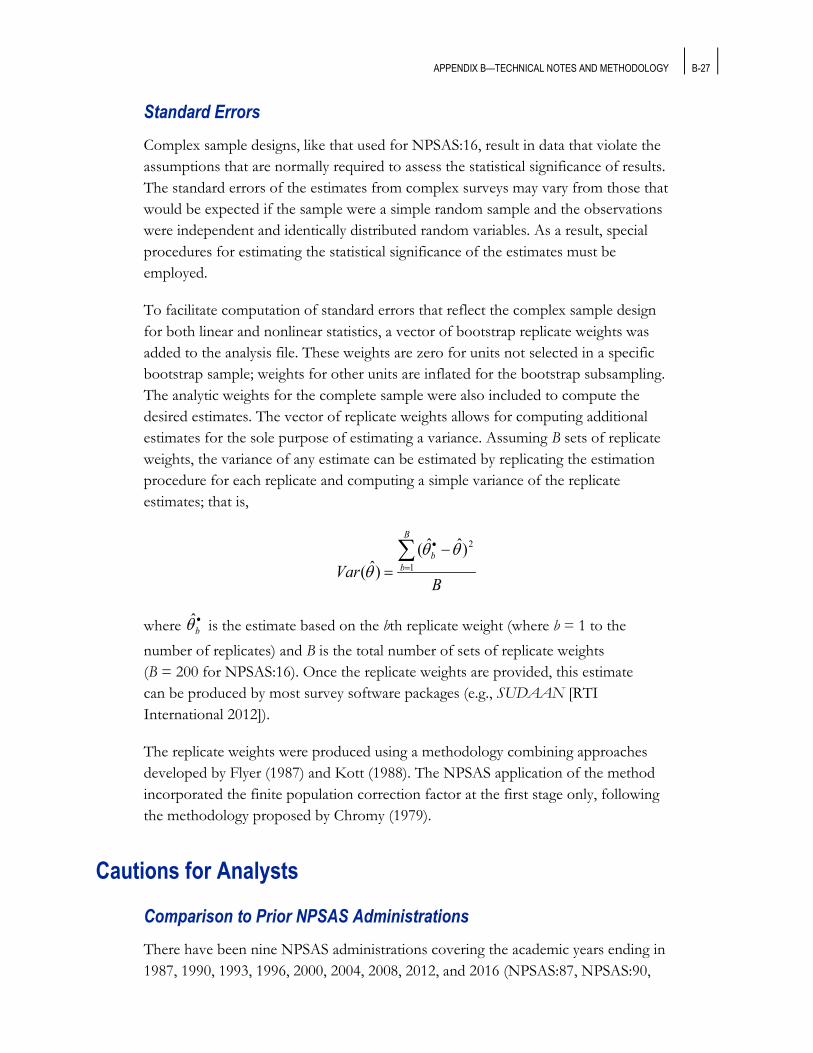
APPENDIX B—TECHNICAL NOTES AND METHODOLOGY B-27
Standard Errors Complex sample designs, like that used for NPSAS:16, result in data that violate the assumptions that are normally required to assess the statistical significance of results. The standard errors of the estimates from complex surveys may vary from those that would be expected if the sample were a simple random sample and the observations were independent and identically distributed random variables. As a result, special procedures for estimating the statistical significance of the estimates must be employed.
To facilitate computation of standard errors that reflect the complex sample design for both linear and nonlinear statistics, a vector of bootstrap replicate weights was added to the analysis file. These weights are zero for units not selected in a specific bootstrap sample; weights for other units are inflated for the bootstrap subsampling. The analytic weights for the complete sample were also included to compute the desired estimates. The vector of replicate weights allows for computing additional estimates for the sole purpose of estimating a variance. Assuming B sets of replicate weights, the variance of any estimate can be estimated by replicating the estimation procedure for each replicate and computing a simple variance of the replicate estimates; that is,
BVar
B
bb
2
1)ˆˆ(
)ˆ(θθ
θ−
=∑=
•
where •bθ̂ is the estimate based on the bth replicate weight (where b = 1 to the
number of replicates) and B is the total number of sets of replicate weights (B = 200 for NPSAS:16). Once the replicate weights are provided, this estimate can be produced by most survey software packages (e.g., SUDAAN [RTI International 2012]).
The replicate weights were produced using a methodology combining approaches developed by Flyer (1987) and Kott (1988). The NPSAS application of the method incorporated the finite population correction factor at the first stage only, following the methodology proposed by Chromy (1979).
Cautions for Analysts
Comparison to Prior NPSAS Administrations There have been nine NPSAS administrations covering the academic years ending in 1987, 1990, 1993, 1996, 2000, 2004, 2008, 2012, and 2016 (NPSAS:87, NPSAS:90,
B-28 APPENDIX B—TECHNICAL NOTES AND METHODOLOGY
NPSAS:93, NPSAS:96, NPSAS:2000, NPSAS:04, NPSAS:08, NPSAS:12, and NPSAS:16, respectively). The estimates from each study can be compared to the others, but several important differences across studies limit these comparisons over time.
Puerto Rico. All administrations except NPSAS:87 and NPSAS:12 sampled institutions in Puerto Rico. There are approximately 90 institutions in Puerto Rico enrolling about 1 percent each of undergraduate and graduate students nationally. In NPSAS:08, students attending institutions in Puerto Rico made up about 10 percent of Hispanic students nationally, compared with NPSAS:16, in which students attending institutions in Puerto Rico made up about 6 percent of Hispanic students nationally. Analysts who wish to compare other NPSAS administrations to NPSAS:87 or NPSAS:12 or who are interested in national estimates for Hispanic students may filter on COMPTO87 to exclude Puerto Rico.
Title IV eligibility. Starting with NPSAS:2000, samples were limited to institutions participating in federal Title IV student aid programs. In the earlier surveys (NPSAS:87, NPSAS:90, NPSAS:93, and NPSAS:96), about 1 percent of undergraduate students, mainly concentrated in private for-profit, less-than-2-year institutions, attended institutions that were not eligible for Title IV aid. Analysts wishing to exclude students from institutions that were not eligible for Title IV aid may filter on T4ELIG in these earlier administrations.
Community colleges. Over the past two decades, community colleges in many states began conferring bachelor’s degrees in selected fields. In the IPEDS data used to determine control and level of institution in NPSAS, these institutions are categorized as public 4-year, non-doctorate-granting institutions. For NPSAS:16, this group of institutions was subdivided into two categories: (1) those that conferred mainly subbaccalaureate awards (certificates and associate’s degrees) and (2) those that conferred mainly bachelor’s degrees. This differs from past NPSAS administrations in which these institutions were classified together to reflect the highest level of award offered.
Estimates from imputed versus unimputed data. Starting with NPSAS:04, missing values were imputed for almost all, rather than a selected subset, of variables. Analysts should use caution when comparing estimates based on imputed data with estimates based on unimputed data. Distributions of imputed and unimputed variables are not directly comparable because imputed variables have no missing values, and imputation may appreciably change the distribution of valid values for variables with a substantial proportion of missing data.
APPENDIX B—TECHNICAL NOTES AND METHODOLOGY B-29
Fall enrollment. Starting with NPSAS:90, all NPSAS samples have been based on 12-month enrollment, which is higher than fall enrollment commonly reported by IPEDS because those who enroll only in spring, summer, or winter terms are included in the 12-month total. This is particularly true at private for-profit, less-than-4-year institutions, where a substantial proportion of students may enroll throughout the year and not necessarily during the fall. The NPSAS:87 sample was based on fall 1986 enrollment. Analysts wishing to compare NPSAS:87 results with those from subsequent administrations can filter on COMPTO87 in the later NPSAS administrations.
Federal loans older than 10 years. In prior NPSAS administrations, federal student loans older than 10 years as of the beginning of the study were excluded from cumulative borrowing and outstanding loan amount variables. In NPSAS:16, this was changed so that loans older than 10 years were included in these variables (e.g., FEDCUM1, BORAMT1). As a result, cumulative borrowing estimates in NPSAS:16, especially for older student subpopulations, may differ from estimates for prior NPSAS administrations, with prior studies underestimating these amounts.
Federal veterans’ education benefits (VETBEN). In NPSAS:16, an administrative data match to VBA databases was conducted to obtain information on sampled students’ receipt of federal veterans’ education benefits and their military service. The VBA data was the sole source for federal veterans’ education benefits amounts, and they include payments for tuition and fees, books and supplies, work-study, housing, and other education expenses. Estimates of federal veterans’ education benefits in prior NPSAS cycles were derived from self-reported amounts, amounts reported by the recipient’s NPSAS institution, and stochastic imputation and were significantly lower on average than amounts in NPSAS:16. These earlier values may not include all the benefits included in the VBA data, particularly housing benefits, which were not explicitly requested from students or their institutions.
Students Attending Multiple Institutions About 10 percent of undergraduate students and 5 percent of graduate students attended more than one institution during the 2015–16 academic year, concurrently or sequentially. These students may have attended institutions of differing types (private nonprofit, 4-year, non-doctorate-granting; private nonprofit, 4-year, doctorate-granting; and so forth) and may have had varying attendance patterns (full-time/full-year or other) at different institutions. They are included in the calculation of total values in this report, but they are presented separately in results disaggregated by control and level of institution and excluded from results disaggregated by attendance pattern.
B-30 APPENDIX B—TECHNICAL NOTES AND METHODOLOGY
Sampling Error Because NPSAS:16 consists of a representative sample of postsecondary students rather than the entire population, the estimates in this report are subject to sampling error. A different sample of the same population, even one using identical methods, could yield different results. Similarly, estimates of aid will vary from population values reported by agency offices.
The sampling error of an estimate is measured by its standard error. The standard errors for the estimates in this report were calculated with bootstrap replication procedures using PowerStats software and are available at http://nces.ed.gov/pubsearch/pubsinfo.asp?pubid=2018466. Standard errors are presented in tables C-1 through C-8.
Nonsampling Error The estimates presented in this report are also subject to various types of nonsampling error, which are variations in the estimates that may be caused by population coverage limitations as well as data collection, processing, and reporting procedures. Potential sources of nonsampling error include misreporting by survey respondents, incomplete administrative records, coding and data entry errors, misspecification of derived variables, and nonresponse. Data swapping and other forms of perturbation used to limit disclosure of information about individual study members may also lead to nonsampling error.
In general, it is difficult to identify and estimate either the amount of nonsampling error or the bias caused by this error. For NPSAS:16, efforts were made to prevent such errors from occurring and to compensate for them where possible (e.g., field testing data collection instruments, using survey questions that had been tested and used in previous surveys, training interviewers, and monitoring interviewer performance and field data quality throughout the collection period).
PowerStats The estimates in this report were produced using PowerStats, a web-based software application that enables users to generate tables with data for most of the postsecondary surveys conducted by NCES. PowerStats produces the design-adjusted standard errors necessary for testing the statistical significance of differences in the estimates. PowerStats also describes how each variable was created and includes question wording for items directly from an interview. With PowerStats, users can replicate or expand upon the tables presented in this report.
APPENDIX B—TECHNICAL NOTES AND METHODOLOGY B-31
The output from PowerStats includes the table estimates (e.g., percentages or means), design-adjusted standard errors,19 and weighted sample sizes for the estimates. If the number of valid cases is too small to produce a reliable estimate (fewer than 30 cases), PowerStats prints the double dagger symbol (‡) instead of the estimate.
In addition to producing tables, PowerStats users may conduct linear or logistic regressions. Many options are available for output with the regression results. For a description of all the options available, users should access the PowerStats website at http://nces.ed.gov/datalab. For more information, contact [email protected].
19 The NPSAS:16 sample is not a simple random sample; therefore, simple random sample techniques for estimating sampling error cannot be applied to these data. PowerStats takes into account the complexity of the sampling procedures and calculates standard errors appropriate for such samples. The method for computing sampling errors used by PowerStats involves approximating the estimator by replication of the sampled population. The procedure used is a bootstrap technique.

This page intentionally left blank
C-1
Appendix C—Standard Error Tables
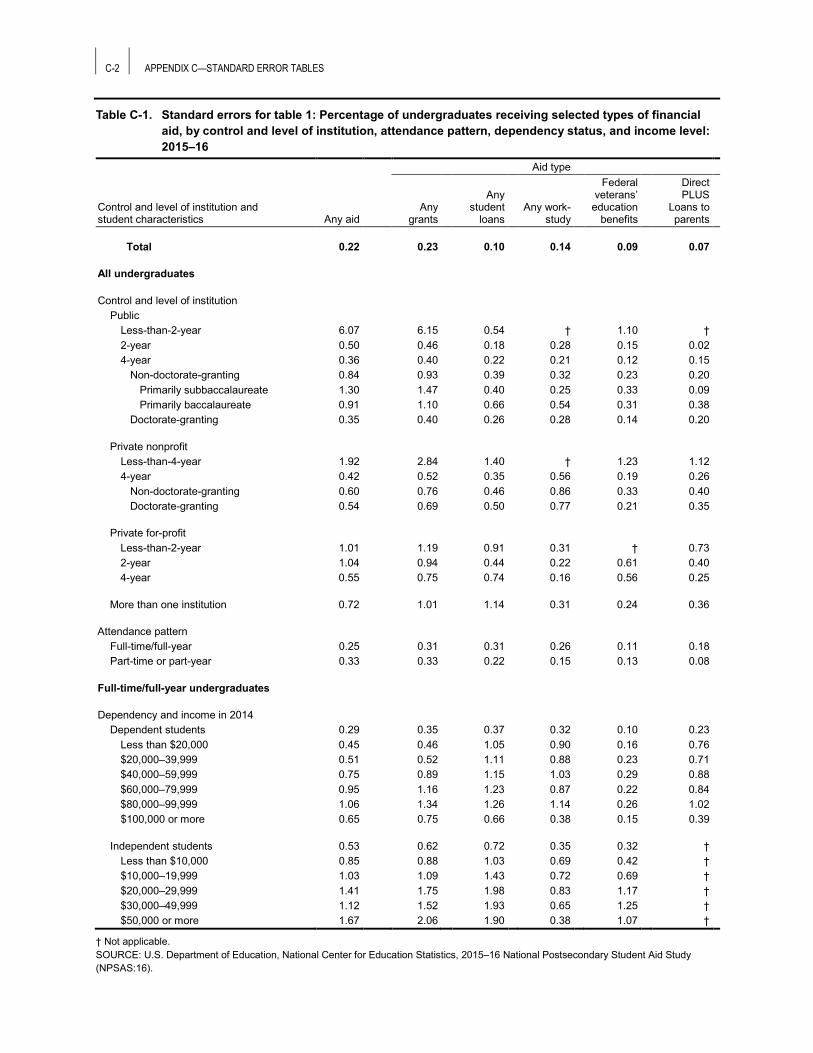
C-2 APPENDIX C—STANDARD ERROR TABLES
Table C-1. Standard errors for table 1: Percentage of undergraduates receiving selected types of financial aid, by control and level of institution, attendance pattern, dependency status, and income level: 2015–16
Aid type
Control and level of institution and student characteristics Any aid
Any grants
Any student
loans Any work-
study
Federal veterans’
education benefits
Direct PLUS
Loans to parents
Total 0.22 0.23 0.10 0.14 0.09 0.07
All undergraduates
Control and level of institution Public
Less-than-2-year 6.07 6.15 0.54 † 1.10 † 2-year 0.50 0.46 0.18 0.28 0.15 0.02 4-year 0.36 0.40 0.22 0.21 0.12 0.15
Non-doctorate-granting 0.84 0.93 0.39 0.32 0.23 0.20 Primarily subbaccalaureate 1.30 1.47 0.40 0.25 0.33 0.09 Primarily baccalaureate 0.91 1.10 0.66 0.54 0.31 0.38
Doctorate-granting 0.35 0.40 0.26 0.28 0.14 0.20
Private nonprofit Less-than-4-year 1.92 2.84 1.40 † 1.23 1.12 4-year 0.42 0.52 0.35 0.56 0.19 0.26
Non-doctorate-granting 0.60 0.76 0.46 0.86 0.33 0.40 Doctorate-granting 0.54 0.69 0.50 0.77 0.21 0.35
Private for-profit Less-than-2-year 1.01 1.19 0.91 0.31 † 0.73 2-year 1.04 0.94 0.44 0.22 0.61 0.40 4-year 0.55 0.75 0.74 0.16 0.56 0.25
More than one institution 0.72 1.01 1.14 0.31 0.24 0.36
Attendance pattern Full-time/full-year 0.25 0.31 0.31 0.26 0.11 0.18 Part-time or part-year 0.33 0.33 0.22 0.15 0.13 0.08
Full-time/full-year undergraduates
Dependency and income in 2014 Dependent students 0.29 0.35 0.37 0.32 0.10 0.23
Less than $20,000 0.45 0.46 1.05 0.90 0.16 0.76 $20,000–39,999 0.51 0.52 1.11 0.88 0.23 0.71 $40,000–59,999 0.75 0.89 1.15 1.03 0.29 0.88 $60,000–79,999 0.95 1.16 1.23 0.87 0.22 0.84 $80,000–99,999 1.06 1.34 1.26 1.14 0.26 1.02 $100,000 or more 0.65 0.75 0.66 0.38 0.15 0.39
Independent students 0.53 0.62 0.72 0.35 0.32 † Less than $10,000 0.85 0.88 1.03 0.69 0.42 † $10,000–19,999 1.03 1.09 1.43 0.72 0.69 † $20,000–29,999 1.41 1.75 1.98 0.83 1.17 † $30,000–49,999 1.12 1.52 1.93 0.65 1.25 † $50,000 or more 1.67 2.06 1.90 0.38 1.07 †
† Not applicable. SOURCE: U.S. Department of Education, National Center for Education Statistics, 2015–16 National Postsecondary Student Aid Study (NPSAS:16).
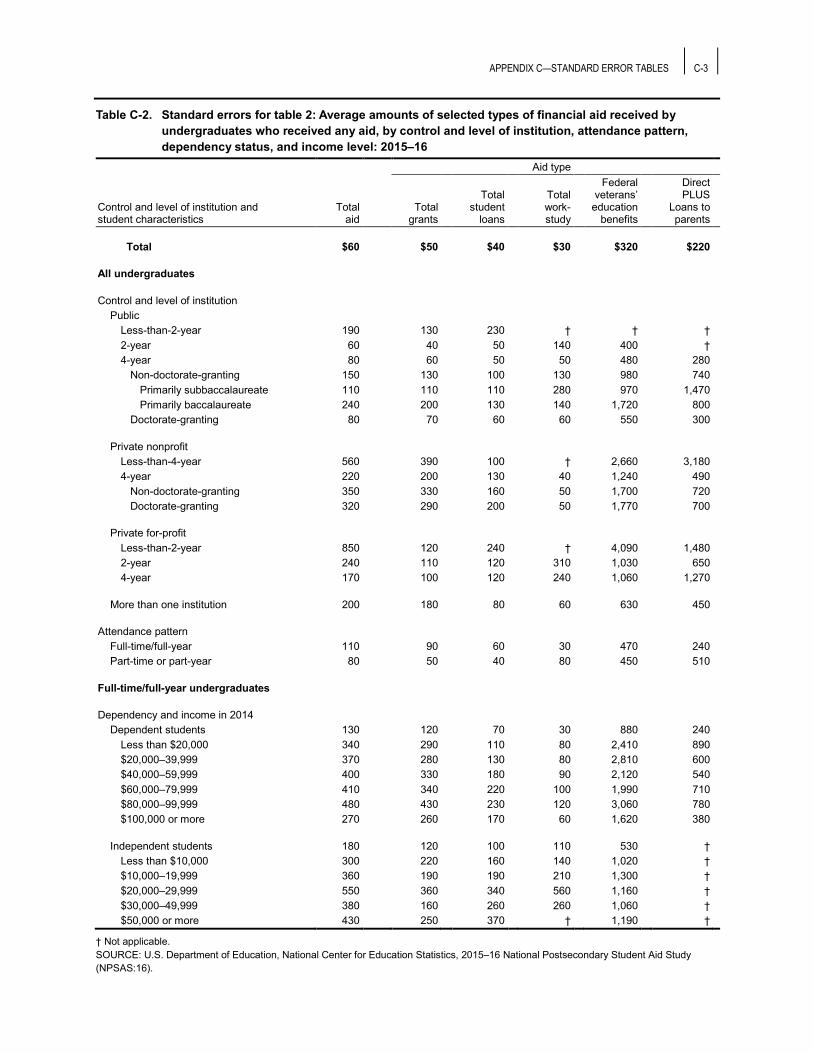
APPENDIX C—STANDARD ERROR TABLES C-3
Table C-2. Standard errors for table 2: Average amounts of selected types of financial aid received by undergraduates who received any aid, by control and level of institution, attendance pattern, dependency status, and income level: 2015–16
Aid type
Control and level of institution and student characteristics
Total aid
Total grants
Total student
loans
Total work- study
Federal veterans’
education benefits
Direct PLUS
Loans to parents
Total $60 $50 $40 $30 $320 $220
All undergraduates
Control and level of institution Public
Less-than-2-year 190 130 230 † † † 2-year 60 40 50 140 400 † 4-year 80 60 50 50 480 280
Non-doctorate-granting 150 130 100 130 980 740 Primarily subbaccalaureate 110 110 110 280 970 1,470 Primarily baccalaureate 240 200 130 140 1,720 800
Doctorate-granting 80 70 60 60 550 300
Private nonprofit Less-than-4-year 560 390 100 † 2,660 3,180 4-year 220 200 130 40 1,240 490
Non-doctorate-granting 350 330 160 50 1,700 720 Doctorate-granting 320 290 200 50 1,770 700
Private for-profit Less-than-2-year 850 120 240 † 4,090 1,480 2-year 240 110 120 310 1,030 650 4-year 170 100 120 240 1,060 1,270
More than one institution 200 180 80 60 630 450
Attendance pattern Full-time/full-year 110 90 60 30 470 240 Part-time or part-year 80 50 40 80 450 510
Full-time/full-year undergraduates
Dependency and income in 2014 Dependent students 130 120 70 30 880 240
Less than $20,000 340 290 110 80 2,410 890 $20,000–39,999 370 280 130 80 2,810 600 $40,000–59,999 400 330 180 90 2,120 540 $60,000–79,999 410 340 220 100 1,990 710 $80,000–99,999 480 430 230 120 3,060 780 $100,000 or more 270 260 170 60 1,620 380
Independent students 180 120 100 110 530 † Less than $10,000 300 220 160 140 1,020 † $10,000–19,999 360 190 190 210 1,300 † $20,000–29,999 550 360 340 560 1,160 † $30,000–49,999 380 160 260 260 1,060 † $50,000 or more 430 250 370 † 1,190 †
† Not applicable. SOURCE: U.S. Department of Education, National Center for Education Statistics, 2015–16 National Postsecondary Student Aid Study (NPSAS:16).
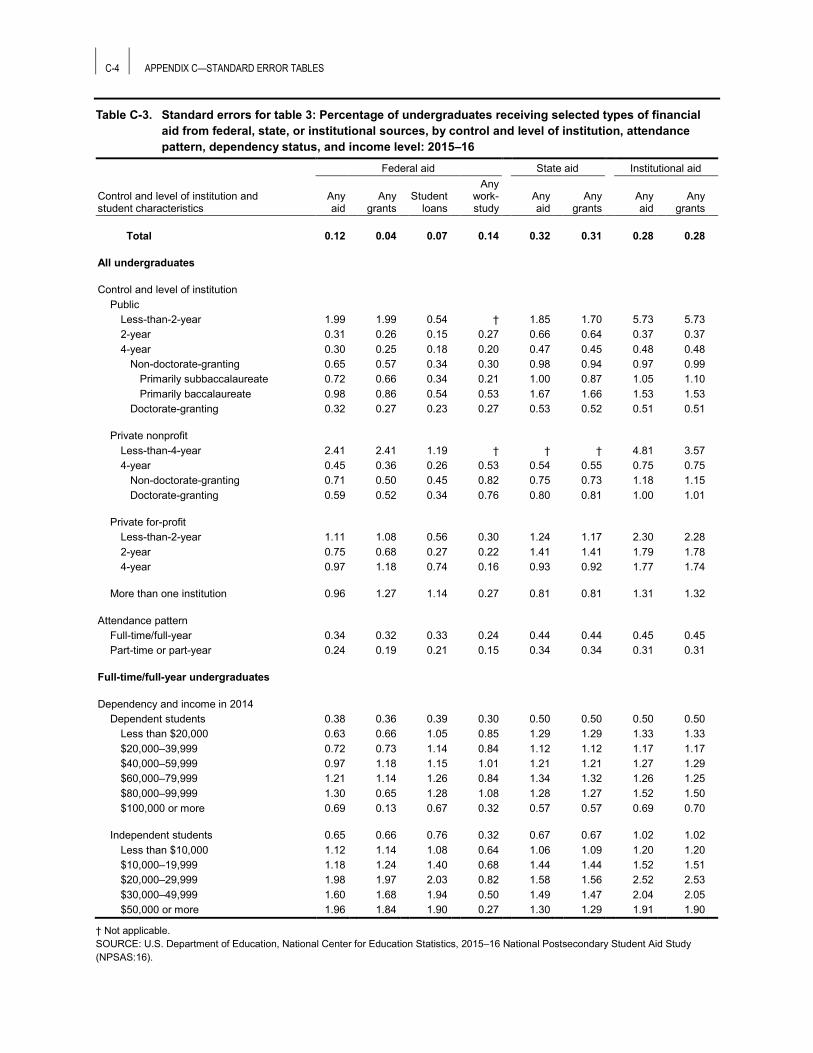
C-4 APPENDIX C—STANDARD ERROR TABLES
Table C-3. Standard errors for table 3: Percentage of undergraduates receiving selected types of financial aid from federal, state, or institutional sources, by control and level of institution, attendance pattern, dependency status, and income level: 2015–16
Federal aid State aid Institutional aid
Control and level of institution and student characteristics
Any aid
Any grants
Student loans
Any work- study
Any aid
Any grants
Any aid
Any grants
Total 0.12 0.04 0.07 0.14 0.32 0.31 0.28 0.28
All undergraduates
Control and level of institution Public
Less-than-2-year 1.99 1.99 0.54 † 1.85 1.70 5.73 5.73 2-year 0.31 0.26 0.15 0.27 0.66 0.64 0.37 0.37 4-year 0.30 0.25 0.18 0.20 0.47 0.45 0.48 0.48
Non-doctorate-granting 0.65 0.57 0.34 0.30 0.98 0.94 0.97 0.99 Primarily subbaccalaureate 0.72 0.66 0.34 0.21 1.00 0.87 1.05 1.10 Primarily baccalaureate 0.98 0.86 0.54 0.53 1.67 1.66 1.53 1.53
Doctorate-granting 0.32 0.27 0.23 0.27 0.53 0.52 0.51 0.51
Private nonprofit Less-than-4-year 2.41 2.41 1.19 † † † 4.81 3.57 4-year 0.45 0.36 0.26 0.53 0.54 0.55 0.75 0.75
Non-doctorate-granting 0.71 0.50 0.45 0.82 0.75 0.73 1.18 1.15 Doctorate-granting 0.59 0.52 0.34 0.76 0.80 0.81 1.00 1.01
Private for-profit Less-than-2-year 1.11 1.08 0.56 0.30 1.24 1.17 2.30 2.28 2-year 0.75 0.68 0.27 0.22 1.41 1.41 1.79 1.78 4-year 0.97 1.18 0.74 0.16 0.93 0.92 1.77 1.74
More than one institution 0.96 1.27 1.14 0.27 0.81 0.81 1.31 1.32
Attendance pattern Full-time/full-year 0.34 0.32 0.33 0.24 0.44 0.44 0.45 0.45 Part-time or part-year 0.24 0.19 0.21 0.15 0.34 0.34 0.31 0.31
Full-time/full-year undergraduates
Dependency and income in 2014 Dependent students 0.38 0.36 0.39 0.30 0.50 0.50 0.50 0.50
Less than $20,000 0.63 0.66 1.05 0.85 1.29 1.29 1.33 1.33 $20,000–39,999 0.72 0.73 1.14 0.84 1.12 1.12 1.17 1.17 $40,000–59,999 0.97 1.18 1.15 1.01 1.21 1.21 1.27 1.29 $60,000–79,999 1.21 1.14 1.26 0.84 1.34 1.32 1.26 1.25 $80,000–99,999 1.30 0.65 1.28 1.08 1.28 1.27 1.52 1.50 $100,000 or more 0.69 0.13 0.67 0.32 0.57 0.57 0.69 0.70
Independent students 0.65 0.66 0.76 0.32 0.67 0.67 1.02 1.02 Less than $10,000 1.12 1.14 1.08 0.64 1.06 1.09 1.20 1.20 $10,000–19,999 1.18 1.24 1.40 0.68 1.44 1.44 1.52 1.51 $20,000–29,999 1.98 1.97 2.03 0.82 1.58 1.56 2.52 2.53 $30,000–49,999 1.60 1.68 1.94 0.50 1.49 1.47 2.04 2.05 $50,000 or more 1.96 1.84 1.90 0.27 1.30 1.29 1.91 1.90
† Not applicable. SOURCE: U.S. Department of Education, National Center for Education Statistics, 2015–16 National Postsecondary Student Aid Study (NPSAS:16).

APPENDIX C—STANDARD ERROR TABLES C-5
Table C-4. Standard errors for table 4: Average amounts of selected types of financial aid from federal, state, or institutional sources received among undergraduates receiving that type of aid, by control and level of institution, attendance pattern, dependency status, and income level: 2015–16
Federal aid State aid Institutional aid
Control and level of institution and student characteristics
Total aid
Total grants
Student loans
Total work- study
Total aid
Total grants
Total aid
Total grants
Total $20 $10 $10 $30 $40 $40 $120 $120
All undergraduates
Control and level of institution Public
Less-than-2-year 170 150 230 † 300 † 270 270 2-year 30 20 40 130 30 20 170 170 4-year 50 30 30 50 60 60 80 80
Non-doctorate-granting 90 50 70 130 160 150 180 180 Primarily subbaccalaureate 100 70 90 320 110 120 280 280 Primarily baccalaureate 140 70 80 140 220 210 230 230
Doctorate-granting 60 30 30 60 60 60 90 90
Private nonprofit Less-than-4-year 420 160 110 † 430 770 510 530 4-year 100 50 40 40 130 130 240 240
Non-doctorate-granting 130 40 50 60 100 90 410 390 Doctorate-granting 130 90 60 60 240 230 320 330
Private for-profit Less-than-2-year 120 60 60 † 380 360 570 590 2-year 100 40 40 310 190 180 480 490 4-year 130 40 90 250 200 210 100 100
More than one institution 100 40 60 60 70 70 550 550
Attendance pattern Full-time/full-year 50 20 30 30 60 50 160 160 Part-time or part-year 50 10 30 90 30 30 150 150
Full-time/full-year undergraduates
Dependency and income in 2014 Dependent students 60 30 30 30 60 60 170 170
Less than $20,000 170 20 80 80 120 120 520 520 $20,000–39,999 180 40 80 80 120 110 400 400 $40,000–59,999 190 50 80 90 100 100 490 490 $60,000–79,999 260 70 80 80 150 140 450 450 $80,000–99,999 340 650 90 100 150 140 480 480 $100,000 or more 170 460 40 60 130 100 270 270
Independent students 90 30 70 120 90 80 300 300 Less than $10,000 170 40 130 140 140 140 430 430 $10,000–19,999 190 50 160 180 140 140 410 400 $20,000–29,999 270 100 220 620 160 160 820 830 $30,000–49,999 230 80 200 270 280 230 300 300 $50,000 or more 250 120 220 † 240 170 480 490
† Not applicable. SOURCE: U.S. Department of Education, National Center for Education Statistics, 2015–16 National Postsecondary Student Aid Study (NPSAS:16).
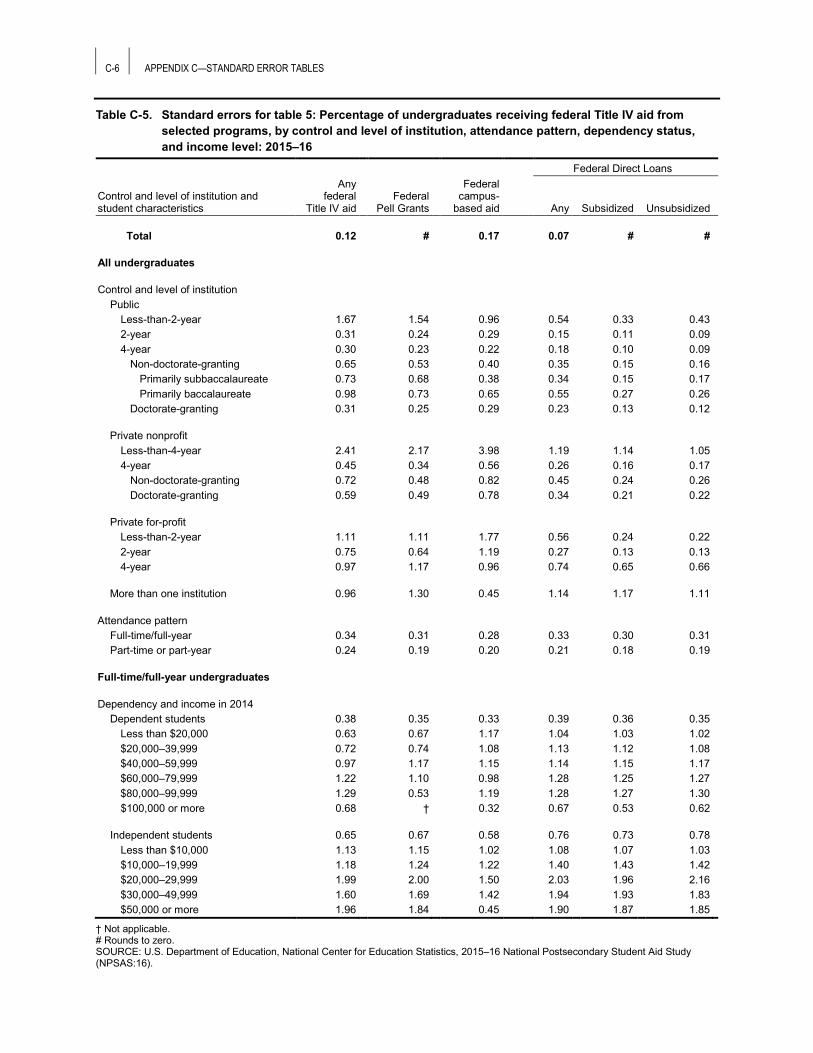
C-6 APPENDIX C—STANDARD ERROR TABLES
Table C-5. Standard errors for table 5: Percentage of undergraduates receiving federal Title IV aid from selected programs, by control and level of institution, attendance pattern, dependency status, and income level: 2015–16
Federal Direct Loans
Control and level of institution and student characteristics
Any federal
Title IV aid Federal
Pell Grants
Federal campus-
based aid Any Subsidized Unsubsidized
Total 0.12 # 0.17 0.07 # #
All undergraduates
Control and level of institution Public
Less-than-2-year 1.67 1.54 0.96 0.54 0.33 0.43 2-year 0.31 0.24 0.29 0.15 0.11 0.09 4-year 0.30 0.23 0.22 0.18 0.10 0.09
Non-doctorate-granting 0.65 0.53 0.40 0.35 0.15 0.16 Primarily subbaccalaureate 0.73 0.68 0.38 0.34 0.15 0.17 Primarily baccalaureate 0.98 0.73 0.65 0.55 0.27 0.26
Doctorate-granting 0.31 0.25 0.29 0.23 0.13 0.12
Private nonprofit Less-than-4-year 2.41 2.17 3.98 1.19 1.14 1.05 4-year 0.45 0.34 0.56 0.26 0.16 0.17
Non-doctorate-granting 0.72 0.48 0.82 0.45 0.24 0.26 Doctorate-granting 0.59 0.49 0.78 0.34 0.21 0.22
Private for-profit Less-than-2-year 1.11 1.11 1.77 0.56 0.24 0.22 2-year 0.75 0.64 1.19 0.27 0.13 0.13 4-year 0.97 1.17 0.96 0.74 0.65 0.66
More than one institution 0.96 1.30 0.45 1.14 1.17 1.11
Attendance pattern Full-time/full-year 0.34 0.31 0.28 0.33 0.30 0.31 Part-time or part-year 0.24 0.19 0.20 0.21 0.18 0.19
Full-time/full-year undergraduates
Dependency and income in 2014 Dependent students 0.38 0.35 0.33 0.39 0.36 0.35
Less than $20,000 0.63 0.67 1.17 1.04 1.03 1.02 $20,000–39,999 0.72 0.74 1.08 1.13 1.12 1.08 $40,000–59,999 0.97 1.17 1.15 1.14 1.15 1.17 $60,000–79,999 1.22 1.10 0.98 1.28 1.25 1.27 $80,000–99,999 1.29 0.53 1.19 1.28 1.27 1.30 $100,000 or more 0.68 † 0.32 0.67 0.53 0.62
Independent students 0.65 0.67 0.58 0.76 0.73 0.78 Less than $10,000 1.13 1.15 1.02 1.08 1.07 1.03 $10,000–19,999 1.18 1.24 1.22 1.40 1.43 1.42 $20,000–29,999 1.99 2.00 1.50 2.03 1.96 2.16 $30,000–49,999 1.60 1.69 1.42 1.94 1.93 1.83 $50,000 or more 1.96 1.84 0.45 1.90 1.87 1.85
† Not applicable. # Rounds to zero. SOURCE: U.S. Department of Education, National Center for Education Statistics, 2015–16 National Postsecondary Student Aid Study (NPSAS:16).
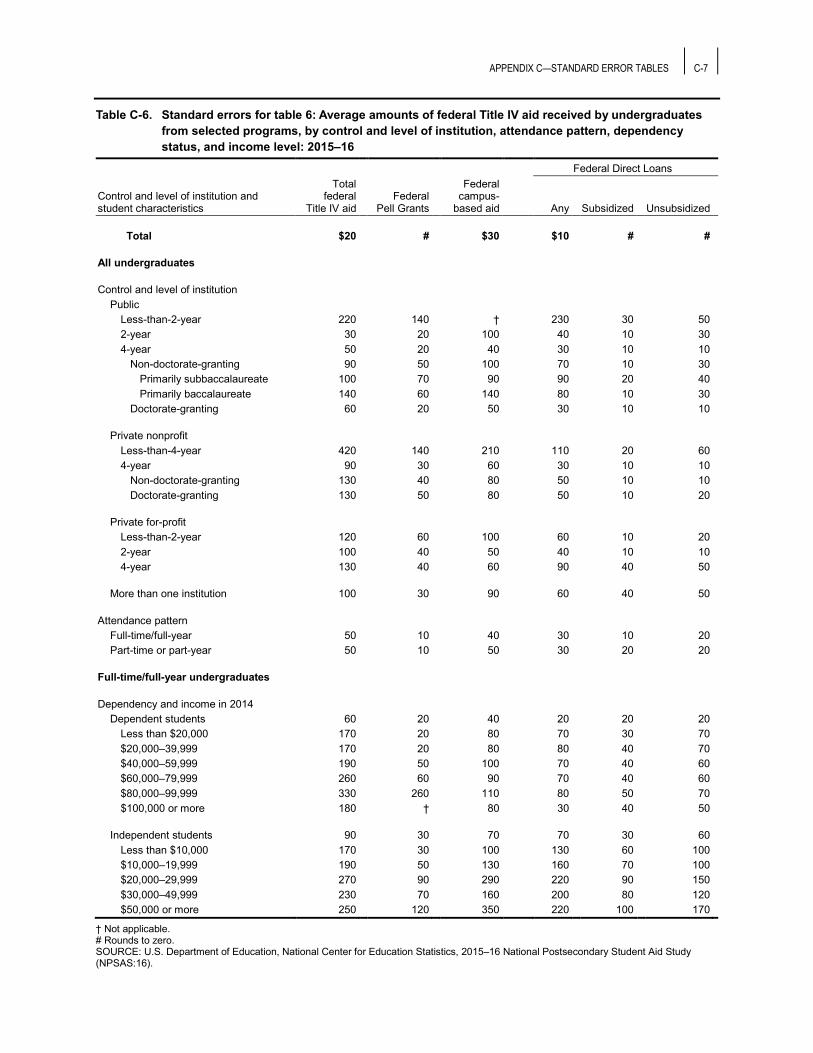
APPENDIX C—STANDARD ERROR TABLES C-7
Table C-6. Standard errors for table 6: Average amounts of federal Title IV aid received by undergraduates from selected programs, by control and level of institution, attendance pattern, dependency status, and income level: 2015–16
Federal Direct Loans
Control and level of institution and student characteristics
Total federal
Title IV aid Federal
Pell Grants
Federal campus-
based aid Any Subsidized Unsubsidized
Total $20 # $30 $10 # #
All undergraduates
Control and level of institution Public
Less-than-2-year 220 140 † 230 30 50 2-year 30 20 100 40 10 30 4-year 50 20 40 30 10 10
Non-doctorate-granting 90 50 100 70 10 30 Primarily subbaccalaureate 100 70 90 90 20 40 Primarily baccalaureate 140 60 140 80 10 30
Doctorate-granting 60 20 50 30 10 10
Private nonprofit Less-than-4-year 420 140 210 110 20 60 4-year 90 30 60 30 10 10
Non-doctorate-granting 130 40 80 50 10 10 Doctorate-granting 130 50 80 50 10 20
Private for-profit Less-than-2-year 120 60 100 60 10 20 2-year 100 40 50 40 10 10 4-year 130 40 60 90 40 50
More than one institution 100 30 90 60 40 50
Attendance pattern Full-time/full-year 50 10 40 30 10 20 Part-time or part-year 50 10 50 30 20 20
Full-time/full-year undergraduates
Dependency and income in 2014 Dependent students 60 20 40 20 20 20
Less than $20,000 170 20 80 70 30 70 $20,000–39,999 170 20 80 80 40 70 $40,000–59,999 190 50 100 70 40 60 $60,000–79,999 260 60 90 70 40 60 $80,000–99,999 330 260 110 80 50 70 $100,000 or more 180 † 80 30 40 50
Independent students 90 30 70 70 30 60 Less than $10,000 170 30 100 130 60 100 $10,000–19,999 190 50 130 160 70 100 $20,000–29,999 270 90 290 220 90 150 $30,000–49,999 230 70 160 200 80 120 $50,000 or more 250 120 350 220 100 170
† Not applicable. # Rounds to zero. SOURCE: U.S. Department of Education, National Center for Education Statistics, 2015–16 National Postsecondary Student Aid Study (NPSAS:16).
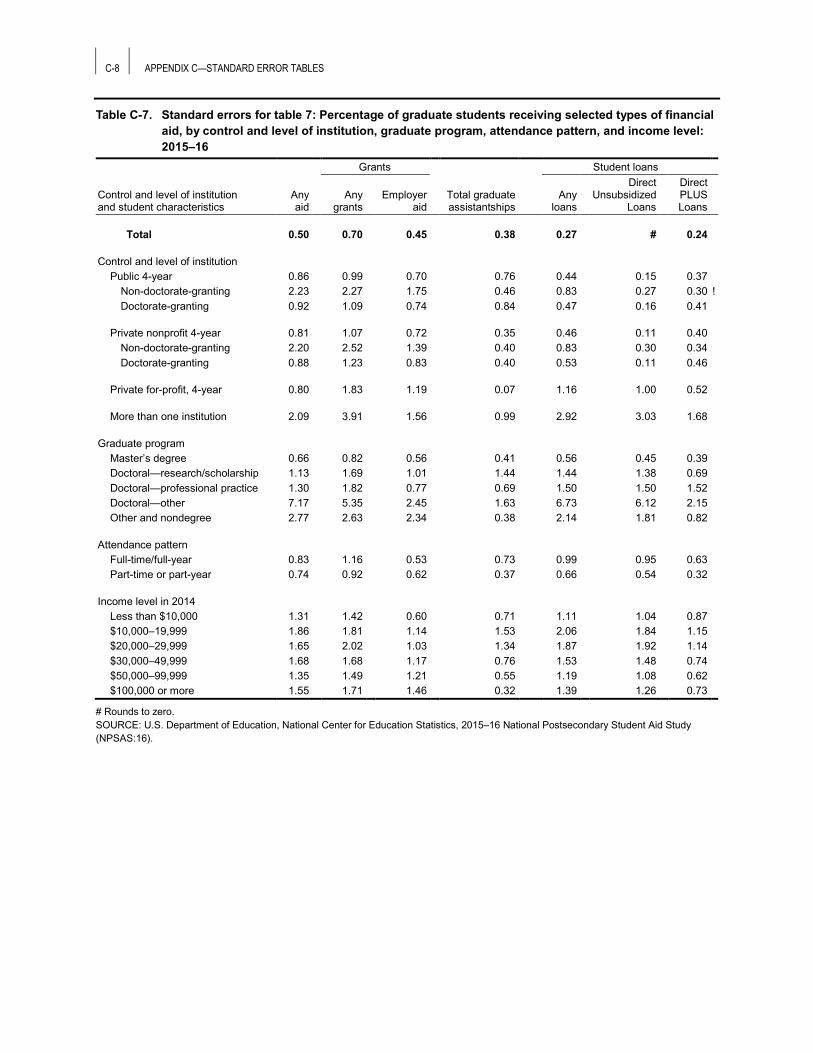
C-8 APPENDIX C—STANDARD ERROR TABLES
Table C-7. Standard errors for table 7: Percentage of graduate students receiving selected types of financial aid, by control and level of institution, graduate program, attendance pattern, and income level: 2015–16
Grants Student loans
Control and level of institution and student characteristics
Any aid
Any grants
Employer aid
Total graduate assistantships
Any loans
Direct Unsubsidized
Loans
Direct PLUS Loans
Total 0.50 0.70 0.45 0.38 0.27 # 0.24
Control and level of institution Public 4-year 0.86 0.99 0.70 0.76 0.44 0.15 0.37
Non-doctorate-granting 2.23 2.27 1.75 0.46 0.83 0.27 0.30 ! Doctorate-granting 0.92 1.09 0.74 0.84 0.47 0.16 0.41
Private nonprofit 4-year 0.81 1.07 0.72 0.35 0.46 0.11 0.40 Non-doctorate-granting 2.20 2.52 1.39 0.40 0.83 0.30 0.34 Doctorate-granting 0.88 1.23 0.83 0.40 0.53 0.11 0.46
Private for-profit, 4-year 0.80 1.83 1.19 0.07 1.16 1.00 0.52
More than one institution 2.09 3.91 1.56 0.99 2.92 3.03 1.68
Graduate program Master’s degree 0.66 0.82 0.56 0.41 0.56 0.45 0.39 Doctoral—research/scholarship 1.13 1.69 1.01 1.44 1.44 1.38 0.69 Doctoral—professional practice 1.30 1.82 0.77 0.69 1.50 1.50 1.52 Doctoral—other 7.17 5.35 2.45 1.63 6.73 6.12 2.15 Other and nondegree 2.77 2.63 2.34 0.38 2.14 1.81 0.82
Attendance pattern Full-time/full-year 0.83 1.16 0.53 0.73 0.99 0.95 0.63 Part-time or part-year 0.74 0.92 0.62 0.37 0.66 0.54 0.32
Income level in 2014 Less than $10,000 1.31 1.42 0.60 0.71 1.11 1.04 0.87 $10,000–19,999 1.86 1.81 1.14 1.53 2.06 1.84 1.15 $20,000–29,999 1.65 2.02 1.03 1.34 1.87 1.92 1.14 $30,000–49,999 1.68 1.68 1.17 0.76 1.53 1.48 0.74 $50,000–99,999 1.35 1.49 1.21 0.55 1.19 1.08 0.62 $100,000 or more 1.55 1.71 1.46 0.32 1.39 1.26 0.73
# Rounds to zero. SOURCE: U.S. Department of Education, National Center for Education Statistics, 2015–16 National Postsecondary Student Aid Study (NPSAS:16).

APPENDIX C—STANDARD ERROR TABLES C-9
Table C-8. Standard errors for table 8: Average amounts of selected types of financial aid received among graduate students receiving that type of aid, by control and level of institution, graduate program, attendance pattern, and income level: 2015–16
Grants Student loans
Control and level of institution and student characteristics
Total aid
Total grants
Employer aid
Total graduate assistantships
Total loans
Direct Unsubsidized
Loans
Direct PLUS Loans
Total $240 $280 $270 $480 $130 # $540
Control and level of institution Public 4-year 280 260 240 530 220 30 750
Non-doctorate-granting 360 480 280 810 250 90 † Doctorate-granting 310 280 270 550 240 40 760
Private nonprofit 4-year 470 580 560 1,250 260 50 800 Non-doctorate-granting 540 790 400 1,100 390 70 1,980 Doctorate-granting 530 650 700 1,340 310 60 850
Private for-profit, 4-year 260 200 240 † 320 170 1,270
More than one institution 940 1,240 1,060 2,050 1,030 550 2,730
Graduate program Master’s degree 350 270 330 570 340 170 1,100 Doctoral—research/scholarship 790 970 470 700 590 420 1,950 Doctoral—professional practice 1,290 830 1,520 † 1,070 470 920 Doctoral—other 1,690 1,060 1,120 4,530 1,920 1,390 2,200 Other and nondegree 1,020 630 660 † 1,510 1,100 4,490
Attendance pattern Full-time/full-year 530 530 1,170 710 470 230 620 Part-time or part-year 240 170 210 540 270 170 1,030
Income level in 2014 Less than $10,000 660 530 1,520 740 620 340 1,030 $10,000–19,999 940 820 870 1,000 990 510 1,980 $20,000–29,999 910 1,150 1,030 1,130 880 470 2,170 $30,000–49,999 630 510 490 1,440 660 410 1,730 $50,000–99,999 450 350 360 1,930 660 360 2,250 $100,000 or more 870 500 600 2,060 1,240 440 3,850
† Not applicable. # Rounds to zero. SOURCE: U.S. Department of Education, National Center for Education Statistics, 2015–16 National Postsecondary Student Aid Study (NPSAS:16).