Embed Size (px)
Citation preview

Working Together to Manage Our Shared WatersAlberta-Northwest Territories Bilateral Management Committee Annual Report to Ministers2016-17


TABLE OF CONTENTSMessage from the BMC ................................................................................................................................ 2
Executive Summary ........................................................................................................................................ 4
Introduction ...................................................................................................................................................... 6The Master Agreement ............................................................................................................................... 7Bilateral Water Management Agreements ......................................................................................... 8The Alberta-NWT Bilateral Water Management Agreement .................................................... 9
Working Together ........................................................................................................................................... 10The Bilateral Management Committee ................................................................................................ 10BMC members ................................................................................................................................................. 11Technical team members ........................................................................................................................... 11Information sharing, notification and consultation ...................................................................... 12Emergency response .................................................................................................................................... 12
Risk Informed Management ....................................................................................................................... 13Classification system ................................................................................................................................... 14Learning plans ................................................................................................................................................ 16
Traditional and Local Knowledge .............................................................................................................. 17
Public Engagement ......................................................................................................................................... 19
Aquatic Ecosystem.......................................................................................................................................... 20Surface water quantity ............................................................................................................................... 20Surface water quality .................................................................................................................................. 28Groundwater ................................................................................................................................................... 34Biological component .................................................................................................................................. 36
Monitoring ......................................................................................................................................................... 40Water quantity monitoring ....................................................................................................................... 40Water quality monitoring .......................................................................................................................... 42
Climate Change ................................................................................................................................................ 43
Conclusion ......................................................................................................................................................... 45
Appendix ...............................................................................................................................................................................47

2 Alberta-Northwest Territories Bilateral Management Committee Annual Report to Ministers 2016-17
MESSAGE FROM THE BMC

WORKING TOGETHER TO MANAGE OUR SHARED WATERS 3
One of the most comprehensive of its kind, the Alberta-Northwest Territories (NWT) Bilateral Water Management Agreement lays the foundation for long-term cooperative management of the water shared between Alberta and the NWT.
The Agreement establishes decision making mechanisms between the jurisdictions and facilitates a strong working relationship.
The inaugural (2015-16) Alberta-NWT Annual Report to Ministers was released in November 2017. Having concluded our second year of implementation, the Bilateral Management Committee (BMC) is reporting on the progress in 2016-17.
Building on the successes of year one, highlights from 2016-17 include:• Work towards refining biological indicators. • Continued surface water quality and quantity monitoring and progress on related
reporting.• Advancement towards creation of a traditional knowledge working group.• Establishment of a joint implementation fund.
Our jurisdictions have made significant progress related to the various components of the Agreement. In the spirit of collaboration and considerable knowledge exchange, we look forward to the continued implementation of this important, proactive Agreement.

The second year of implementing the Bilateral Water Management Agreement between the governments of Alberta and the Northwest Territories has involved significant learning and focus on reporting as well as confirmation of decision making mechanisms.
EXECUTIVE SUMMARY
In support of implementation commitments, the BMC established a joint implementation fund, with financial commitments from each jurisdiction over the next three to five years.
Classification of shared water bodies has not changed. Elements of learning plans for the Slave and Hay rivers are well underway. Understanding and monitoring of the biological component (e.g. fish, aquatic mammals and benthic invertebrates) have been identified as a key gap. There has been considerable work on selecting biological indicators and developing a benthic macroinvertebrate (e.g. immature stages of dragonflies, mayflies, aquatic worms) monitoring plan for the Hay and Slave rivers.
The Mackenzie River Basin Hydraulic Model was updated with water quantity data up to December 2015 and an update report was prepared with recommendations to enhance model performance. This model will help to understand and differentiate between downstream water quantity impacts caused by upstream water use and impacts attributable to climate variability. Learning plans for the Hay and Slave rivers will continue to be developed and updated, and learning areas prioritized.
There were no concerns in the 2016 water quantity assessment of the Slave and Hay rivers. Slave River allocation data showed consumptive use was well below the annual consumptive use threshold of 2 billion cubic metres (m3), the point at which the Parties will review and agree on next steps.

WORKING TOGETHER TO MANAGE OUR SHARED WATERS 5
Hay River data were assessed at a monthly time step, which is a refinement from the annual time step used in the 2015-16 report. Trigger 1, which includes the total allocation of groundwater and surface water in the Hay River basin, was exceeded in January, February and March. Trigger 2, which includes surface water and groundwater consumption, was not exceeded in any month.
There were no new minimum flows for the Slave River; however, new maximum flows were reached on days in December. No new minimum or maximum flows were reached for the Hay River; however, high flows approached historic maximums in late June.
Overall, there were no concerns in the 2016 water quality assessment of the Slave and Hay rivers. Hay River water quality results indicated five of 41 parameters (5 of 164 results) had values above Trigger 2, none of which were above their respective historical seasonal maximum values.
Slave River water quality results revealed 46 of 66 parameters (67 of 538 results) had values above Trigger 2, seven of which were above their respective historical maximum values. The majority of values above Trigger 2 occurred in June following the peak of the spring freshet and in September following a large rain event. The elevated water quality results are likely attributable to these two flow events because high flows tend to carry more particulate matter to which many metals and other substances are attached. The massive wild fire that occurred from May to July in the Fort McMurray area might have also contributed to the elevated water quality results. Water quality sampled in the later months was within the historical seasonal ranges for all parameters.
This annual report outlines initiatives planned for subsequent years to meet the commitments of the Alberta-NWT Agreement and manage the shared waters in a way that protects the ecological integrity of the aquatic ecosystem.
Two reports on groundwater were completed in 2016: Preliminary State of Groundwater Knowledge in the Transboundary Region of the Mackenzie River Basin and State of Aquatic Knowledge for the Hay River Basin. The reports conclude there is limited knowledge on groundwater. A comparison was completed to the groundwater learning plan table of contents in the agreement and priorities for implementing groundwater commitments were identified.
Work is proceeding to evaluate and develop final biological indicators to implement the Agreement, including developing an annotated bibliography of relevant biological monitoring on the Slave and Hay rivers, creating a summary of previous biological indicator work undertaken in the Mackenzie River Basin, delivering a workshop to better understand biological indicator-related activities in Alberta’s lower Athabasca region and how they may relate to the Agreement, and preparing and planning for a field program to test different methods of sampling benthic macroinvertebrates on large rivers.
This annual report, for the fiscal year 2016-17, details activities undertaken from April 2016 to March 2017 and includes results of analysis of 2016 water quality and quantity monitoring data from the Slave and Hay rivers. The report also outlines initiatives planned for subsequent years to meet the commitments of the Alberta-NWT Agreement and manage the shared waters in a way that protects the ecological integrity of the aquatic ecosystem.
While this report contains complex technical information and concepts, efforts have been made to use plain language where possible. As a result, some terms include definitions and explanations.

INTRODUCTIONThe Mackenzie River Basin is the largest drainage basin in Canada and is among the most intact large-scale ecosystems in North America. It is ecologically, culturally and economically significant for users throughout the entire basin, including as an important transportation corridor, as a source of food and as an essential drinking water source for communities.
The basin’s waters are important for traditional uses as well as industrial, municipal and agricultural uses ranging from oil and gas extraction and hydroelectric development to farming and forestry.
As a basin that spans five provinces and territories, traditional areas for many Indigenous peoples and many ecological zones, monitoring and protecting this immense and varied basin requires cooperation and collaboration.

WORKING TOGETHER TO MANAGE OUR SHARED WATERS 7
The Master AgreementIn 1997 the governments of Alberta, Saskatchewan, British Columbia, Yukon, NWT and Canada signed the Mackenzie River Basin Transboundary Waters Master Agreement (the Master Agreement). The Master Agreement commits all six governments to work towards cooperatively managing the water and aquatic ecosystems of the entire Mackenzie River Basin and makes provisions for the Parties to develop bilateral water management agreements.
The Master Agreement commits the governments to:
• Manage the resources in a way that preserves the ecological integrity of the aquatic ecosystem.
• Manage the use of the water resources in a sustainable manner for present and future generations.
• Allow each Party to the Agreement to use or manage the use of water resources within its jurisdiction, as long as it does not unreasonably harm the ecological integrity in any other jurisdiction.
• Provide for early and effective consultation, notification and sharing of information on developments and activities that might affect the ecological integrity of the aquatic ecosystem in another jurisdiction.
• Resolve issues cooperatively.
Figure 1. Map of the Mackenzie River Basin Transboundary Sub-basins

8 Alberta-Northwest Territories Bilateral Management Committee Annual Report to Ministers 2016-17
Bilateral Water Management Agreements Bilateral water management agreements between neighbouring jurisdictions help ensure water and aquatic ecosystems within the Mackenzie River Basin are managed cooperatively, in a way that maintains healthy and diverse ecosystems.
Bilateral agreements are important to both upstream and downstream jurisdictions because they provide a long-term framework to manage shared water resources in the Mackenzie River Basin in a sustainable manner for current and future generations.
Bilateral agreements help to ensure that upstream jurisdictions do not unreasonably harm the aquatic ecosystem of downstream jurisdictions. They also commit the jurisdictions to consult, notify and share information on developments and activities that might affect the aquatic ecosystem in other jurisdictions as well as to learn and take action should the level of risk to shared water bodies increase. The bilateral agreements apply to all water resources, including rivers, deltas, lakes, wetlands and groundwater shared by the Parties to the specific bilateral agreement and within the Mackenzie River Basin.
The bilateral agreements do not address the effects of past actions, but these effects could be addressed by other means, if governments choose to do so.
While each Party to a bilateral agreement continues to make its own decisions about water and land use within its jurisdiction, the Parties agree to cooperate in good faith and take all reasonable actions to achieve the principles of the Master Agreement and the commitments in their bilateral agreements.
Further in line with the Master Agreement, clause 15.5 of the Bilateral Water Management Agreement between the Governments of Alberta and NWT states: Nothing in this Agreement shall be interpreted in a manner inconsistent with the exercise of any existing Aboriginal and treaty rights as recognized and affirmed in Section 35 of the Constitution Act, 1982, which include rights now existing by way of land claims agreements or which may be acquired either under land claims agreements or otherwise.

WORKING TOGETHER TO MANAGE OUR SHARED WATERS 9
The Alberta-NWT Bilateral Water Management Agreement
Figure 2. Map of the Alberta-NWT Transboundary Area
On March 18, 2015, the Government of Alberta and the Government of the Northwest Territories signed a bilateral water management agreement.
This Agreement applies to all transboundary waters shared between Alberta and the NWT in the Mackenzie River Basin. These waters include the Slave, Hay, Buffalo, Little Buffalo, Whitesand, Yates, Kakisa, Petitot, Salt and Tethul rivers, and their tributaries.
This Agreement, one of the most comprehensive of its kind, facilitates joint learning to inform bilateral water management actions on transboundary waters and provides for improved monitoring and reporting of effects from upstream development. It also includes provisions to develop transboundary objectives.
10 Alberta-Northwest Territories Bilateral Management Committee Annual Report to Ministers 2016-17
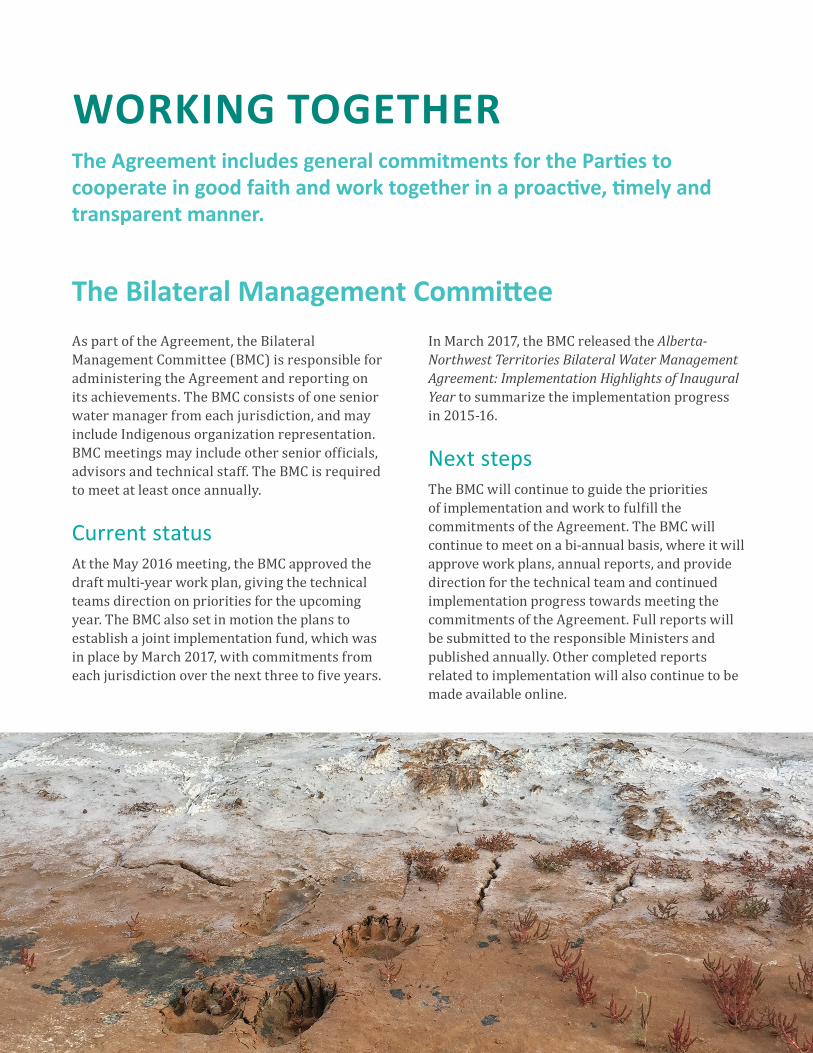
WORKING TOGETHERThe Agreement includes general commitments for the Parties to cooperate in good faith and work together in a proactive, timely and transparent manner.
The Bilateral Management CommitteeAs part of the Agreement, the Bilateral Management Committee (BMC) is responsible for administering the Agreement and reporting on its achievements. The BMC consists of one senior water manager from each jurisdiction, and may include Indigenous organization representation. BMC meetings may include other senior officials, advisors and technical staff. The BMC is required to meet at least once annually.
Current statusAt the May 2016 meeting, the BMC approved the draft multi-year work plan, giving the technical teams direction on priorities for the upcoming year. The BMC also set in motion the plans to establish a joint implementation fund, which was in place by March 2017, with commitments from each jurisdiction over the next three to five years.
In March 2017, the BMC released the Alberta-Northwest Territories Bilateral Water Management Agreement: Implementation Highlights of Inaugural Year to summarize the implementation progress in 2015-16.
Next stepsThe BMC will continue to guide the priorities of implementation and work to fulfill the commitments of the Agreement. The BMC will continue to meet on a bi-annual basis, where it will approve work plans, annual reports, and provide direction for the technical team and continued implementation progress towards meeting the commitments of the Agreement. Full reports will be submitted to the responsible Ministers and published annually. Other completed reports related to implementation will also continue to be made available online.
WORKING TOGETHER TO MANAGE OUR SHARED WATERS 11
BMC membersNorthwest TerritoriesDr. Erin KellyAssistant Deputy Minister, Environment and Natural Resources, Government of the Northwest Territories
Tim HeronLands and Resources Manager,Lands and Resources,Northwest Territory Métis NationRepresenting the NWT Water Strategy Aboriginal Steering Committee
Robert Jenkins B.Sc., M.A.Sc.
Director, Water Resources,Environment and Natural Resources,Government of the Northwest Territories
AlbertaRick BlackwoodAssistant Deputy Minister, Strategy, Alberta Environment and Parks,Government of Alberta
Brian Yee P. Eng.
Director, Transboundary Waters Secretariat,Alberta Environment and Parks, Government of Alberta
Technical team membersNorthwest TerritoriesMeghan Beveridge, Manager, Transboundary Waters
Andrea Czarnecki, Aquatic Quality Scientist
Derek Faria, Hydrologist
Isabelle de Grandpré, Hydrogeologist
Annie Levasseur, Water Stewardship Advisor
AlbertaCaroline Bampfylde, Ecosystem and Risk Assessment Modeller
Guy Bayegnak, Senior Hydrologist, Groundwater Policy Specialist
Jacquie Browne, Transboundary Water Advisor
Carmen de la Chevrotière, Transboundary Water Quantity Specialist
Tracey Howlett, Knowledge Translation Lead, Indigenous Services
Gongchen Li, Transboundary Water Quality Specialist
Tim Toth, Senior Transboundary Water Advisor
12 Alberta-Northwest Territories Bilateral Management Committee Annual Report to Ministers 2016-17
Information sharing, notification and consultation The Alberta-NWT Bilateral Water Management Agreement establishes clear information sharing, prior notification and consultation mechanisms that commit the jurisdictions to consult, notify and share information on developments that might affect the aquatic ecosystem in the other jurisdiction.
Current statusProcedures to efficiently share information about the aquatic ecosystem are being developed. The BMC will make decisions on what and how to share information. The BMC is developing and implementing agreed upon processes for notification and consultation.
Next stepsThe BMC will continue to seek opportunities to improve and refine mechanisms to share information, notify the downstream Party about projected and proposed development, and consult on developments and activities.
Emergency response The Agreement commits the Parties to have emergency response protocols in place to identify, mitigate and, where possible, prevent adverse effects to the aquatic ecosystem in the event of a water-related emergency (e.g. a spill). In the event of an emergency, the Parties must maintain clear communication and notify the other jurisdiction without delay.
Current statusThere are two spill response systems in Alberta: the Alberta Environment Support and Emergency Response Team (ASERT) and the Alberta Energy Regulator Field Incident Response Support Team (AER FIRST) for oil and gas related spills. In Alberta, the release of substances that could harm the environment must be reported.
In accordance with the Alberta emergency response protocol, ASERT or AER FIRST staff call the NWT Spill Response Line if they detect a spill or water-related emergency that could cross the border between Alberta and the NWT.
Similarly, in the NWT, the Department of Environment and Natural Resources (ENR) operates the 24-hour NWT Spill Response Line for reports of spills such as diesel, gasoline and used oil. ENR also maintains a database of spills reported.
Alberta authorities will be alerted if a water-related incident or emergency occurs in the NWT that might have transboundary effects.
A system to track water-related emergencies that could cause transboundary effects is being explored. ENR is updating its emergency response protocols to ensure consistent notification to Alberta authorities should a spill occur in shared waters.
Next stepsAEP’s Transboundary Waters Secretariat is working with Alberta Energy Regulator to ensure adequate communication is in place to report water-related emergencies that could cause transboundary effects for NWT. Processes will be updated as needed.

WORKING TOGETHER TO MANAGE OUR SHARED WATERS 13
RISK INFORMED MANAGEMENT The AB-NWT Agreement is based on a Risk Informed Management (RIM) approach. This approach helps the BMC identify and carry out actions to protect the ecological integrity of the aquatic ecosystem.
Figure 3: The Risk Informed Management Approach
The nature and intensity of Bilateral Management and Jurisdictional Water Management increase from class 1 to class 3 (varying levels of learning, setting transboundary objectives, monitoring, etc.).
Class 4Transboundary Objectives Not Met
Class 3Transboundary Objective Setting
Class 2Learning
Class 1ReportingIN
TEN
SITY
OF
MA
NA
GEM
ENT
Using the RIM approach means understanding the risks associated with the use of, or impacts to, a water body and the sensitivity of the aquatic ecosystem, classifying a water body based on those risks, and taking management actions necessary for that classification of the water body. The higher the risk, the higher the classification, and the more intensive the management actions.
Under the RIM approach, each transboundary water body is assigned one of four classes depending on the likelihood of risk from development, the extent of traditional use and the sensitivity of its ecosystem, among other factors. Specific management actions are required in each class.
The goals of the RIM approach are set out in Appendix A of the Agreement. This approach is a key part of the oversight provided by the BMC as well as each Party’s jurisdictional water management practices.

Classification systemThe RIM approach uses a classification system based on risks for each water body crossing the border. Along with the extent of traditional use, the sensitivity of its ecosystem and other factors, the classifications consider both existing and projected development, based on a detailed five-year development forecast as well as a longer-term (ten-year) outlook. The Parties jointly decide which class to assign to a transboundary water body.
If a water body is assigned as class 1, water management practices (e.g. existing monitoring) already in use by each jurisdiction will be sufficient to meet transboundary commitments. In general, water bodies with little or no development or use are designated as class 1. However, if increased development, use or other factors occur, the water body will be moved to a higher class and management actions will be identified to address the increased risk.
Water bodies with moderate level of existing or projected development or use are assigned as class 2. Learning plans are required to be developed for water bodies at class 2 or higher to explore relevant water quality, water quantity, groundwater and biological considerations, to gather baseline data, and to prepare for setting transboundary objectives. (See the "Learning plans" section for more information.)
Water bodies with either high levels of development or a combination of moderate development with natural vulnerabilities, sensitive uses, use conflicts or controversy and/or negative conditions or trends are assigned as class 3. Management actions for a water body at class 3 will require site-specific transboundary objectives and implementation of joint and/or jurisdictional monitoring programs. If the BMC determines that transboundary objectives are not met for a class 3 water body, the water body will be designated as class 4 and actions will be implemented with the goal of returning the water body to class 3.

WORKING TOGETHER TO MANAGE OUR SHARED WATERS 15
Current statusUpon review of available information, the BMC determined there is no need to change classification of transboundary water bodies in 2016-17. The Hay River and Slave River, two water bodies that cross the Alberta-NWT border, remain designated as class 3 – the basis for this classification is outlined in the table below. All other transboundary water bodies remain assigned as class 1.
Groundwater has been assigned as class 1, but can be moved to a higher class if the BMC determines a need. Factors to be considered in the classification of transboundary groundwater
include groundwater quality and quantity, domestic well density, presence of community wells, irrigation and other large production wells, water source wells, surficial geology, hydrogeology and subsurface geology data, along with land use. Upon review of available information, the BMC determined there is no change in classification of transboundary groundwater in 2016-17.
Discussions among Mackenzie River Basin jurisdictions will contribute to development of a consistent approach for classifying transboundary surface and groundwater in all Agreements under the Mackenzie River Basin Transboundary Waters Master Agreement.
Water Body RIM Class Rationale/Comments
Hay River 3 Development is present, high traditional use, existing trend of increasing winter flows, existing annual trends in water quality, community drinking water supply.
Slave River 3 Development is present, high traditional use, existing trend of decreasing annual flows, existing trends in water quality, community drinking water supply.
Table 1. Classification of the Hay and Slave rivers

16 Alberta-Northwest Territories Bilateral Management Committee Annual Report to Ministers 2016-17
Learning plans A learning plan is used to help improve understanding of the ecological integrity of the aquatic ecosystem, inform any adjustments to water body classifications and gather information to inform objective setting. Developing learning plans includes reviewing available relevant watershed information, assessing information gaps and developing plans to fill those gaps. Learning plans can include existing data and information and, if necessary, collecting additional baseline data, including water quality, water quantity and biological data. As part of the learning plan for class 2 and 3 transboundary waters, the Parties will assess the monitoring needs and priorities as well as appropriate locations for monitoring those waters. This monitoring could include surface water quantity and quality, groundwater quantity and quality, and biology. The Parties may consider monitoring social attributes and/or air quality in the future.
Because the Slave and Hay rivers are assigned class 3, learning plans are being developed for these rivers.
Current statusFor both the Hay and Slave rivers, understanding and monitoring of the biological component (e.g. fish, aquatic mammals and benthic invertebrates) has been identified as a key gap. Therefore, considerable work is being undertaken to select biological indicators and develop a benthic macroinvertebrate monitoring plan in the Hay and Slave rivers. See the Biology section of this report for more information.
Hay River The BMC has reviewed knowledge gaps identified in the Hay River Basin State of the Aquatic Knowledge, which helps advance the Hay River Basin learning plan.
Slave River Work to develop a learning plan for the Slave River Basin continues, including reviewing information in existing reports and identifying gaps. The Mackenzie River Basin Hydraulic Model was updated with water quantity data up to December 2015 and an update report was prepared with recommendations to enhance model performance. This model will help all Parties understand and differentiate between downstream water quantity impacts caused by upstream water use and impacts attributed to climate variability.
Next stepsLearning plans for the Hay and Slave rivers will continue to be developed and updated, and learning areas prioritized. A reproducible approach to classifying surface water and groundwater will be discussed by the technical committee.
WORKING TOGETHER TO MANAGE OUR SHARED WATERS 17
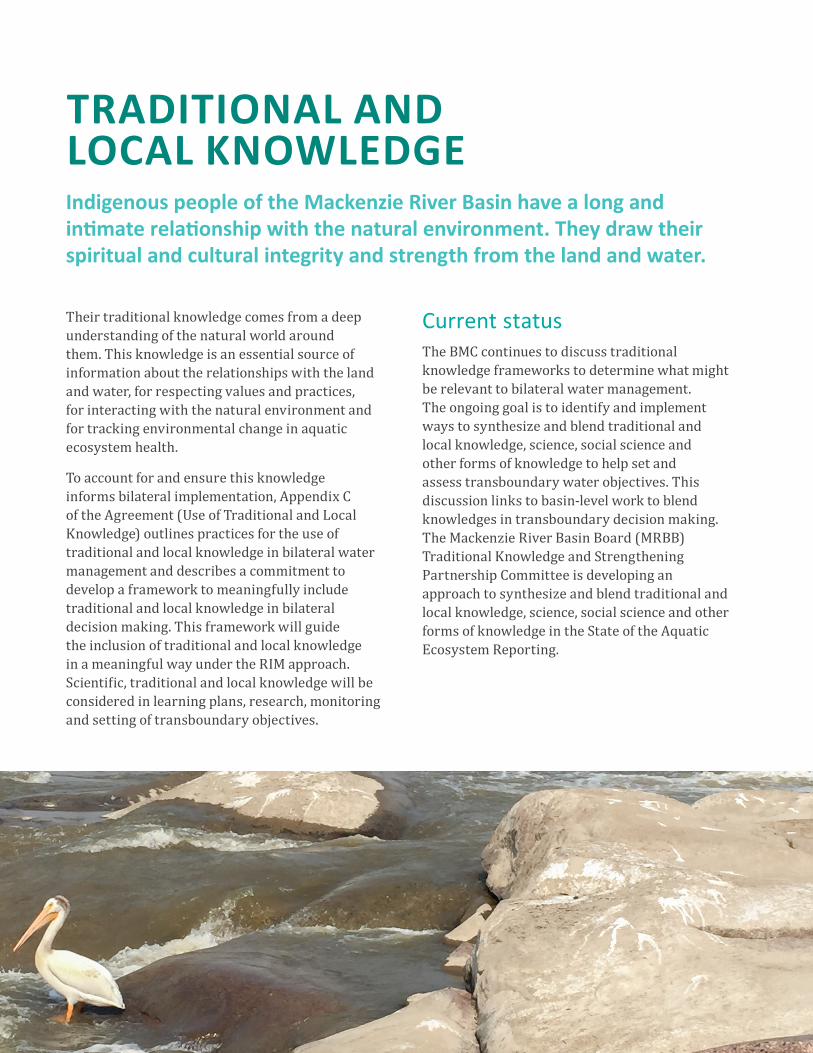
TRADITIONAL AND LOCAL KNOWLEDGE Indigenous people of the Mackenzie River Basin have a long and intimate relationship with the natural environment. They draw their spiritual and cultural integrity and strength from the land and water.
Their traditional knowledge comes from a deep understanding of the natural world around them. This knowledge is an essential source of information about the relationships with the land and water, for respecting values and practices, for interacting with the natural environment and for tracking environmental change in aquatic ecosystem health.
To account for and ensure this knowledge informs bilateral implementation, Appendix C of the Agreement (Use of Traditional and Local Knowledge) outlines practices for the use of traditional and local knowledge in bilateral water management and describes a commitment to develop a framework to meaningfully include traditional and local knowledge in bilateral decision making. This framework will guide the inclusion of traditional and local knowledge in a meaningful way under the RIM approach. Scientific, traditional and local knowledge will be considered in learning plans, research, monitoring and setting of transboundary objectives.
Current statusThe BMC continues to discuss traditional knowledge frameworks to determine what might be relevant to bilateral water management. The ongoing goal is to identify and implement ways to synthesize and blend traditional and local knowledge, science, social science and other forms of knowledge to help set and assess transboundary water objectives. This discussion links to basin-level work to blend knowledges in transboundary decision making. The Mackenzie River Basin Board (MRBB) Traditional Knowledge and Strengthening Partnership Committee is developing an approach to synthesize and blend traditional and local knowledge, science, social science and other forms of knowledge in the State of the Aquatic Ecosystem Reporting.

18 Alberta-Northwest Territories Bilateral Management Committee Annual Report to Ministers 2016-17
Also at the basin-level and in partnership with the MRBB, the Tracking Change research project1 is funding local and traditional knowledge research activities in the Mackenzie River Basin, as well as in the Lower Amazon and Lower Mekong River Basins, with “the long-term goal of strengthening the voices of subsistence fishers and Indigenous communities in the governance of major fresh water ecosystems”.
Implementation of the Alberta-NWT Agreement can build on the efforts of the MRBB, the Tracking Change project and other initiatives.
1 Tracking Change is a research project led by University of Alberta in partnership with the GNWT and the Mackenzie River Basin Board, along with many Indigenous governments and organizations throughout the Mackenzie River Basin as well as academic partners from across Canada. The project also has international community and academic partners. See www.trackingchange.ca for more information.
Next stepsThe BMC will continue to review traditional knowledge sources and approaches, including the GNWT Traditional Knowledge framework, the work of the Environmental Monitoring and Science Division of AEP, and the work of the MRBB Traditional Knowledge and Strengthening Partnership Committee. The BMC will establish a Traditional Knowledge Working Group and begin to develop an approach for traditional and local knowledge to be considered in learning plans, selection of biological indicators, research, monitoring, and setting and assessment of transboundary objectives. This group will be instrumental in working to blend and synthesize traditional knowledge with western science and to develop more robust results and reporting.

WORKING TOGETHER TO MANAGE OUR SHARED WATERS 19
PUBLIC ENGAGEMENTThe Agreement sets out responsibilities for each Party to engage and consult with their public – including Indigenous peoples – about matters of the Agreement so that public input can be considered in bilateral water management.
2 The 2016 NWT Water Stewardship Strategy Implementation Workshop report is available here: www.enr.gov.nt.ca/sites/enr/files/resources/nwt_water_stewardship_strategy_implementation_workshop_summary_report_november_2016.pdf
3 ecologynorth.ca/event/past-present-future-mackenzie-river
Current statusTo ensure the public has the information it needs to understand the transboundary waters shared by Alberta and NWT, reports completed as part of implementation are published online as they become available.
NWT transboundary staff participated in public events to share updates about implementation of the Agreement. They participated in the NWT Water Stewardship Strategy Implementation Workshop2 in November 2016. Staff also participated in a Canada Water Week speakers’ panel about the Past, Present and Future of the Mackenzie River Basin3 in March 2017.
GNWT staff regularly meet with the NWT Water Strategy Aboriginal Steering Committee to gather input and understand interests of NWT’s Indigenous governments.
In May 2016, Alberta presented the status of the first year of implementation of the Agreement at the annual general meeting of the Mighty
Peace Watershed Alliance, a regional planning and advisory body that advises the Government of Alberta on environmental issues in the Peace River watershed.
More generally, under Alberta’s Land-use Framework, Alberta collaborates with government partners and Indigenous communities during its land use planning process. Through Indigenous working groups, First Nation and Métis are consulted and engaged throughout the development, implementation, ongoing review and potential amendments of regional plans.
Next stepsThe BMC will continue to share online reports completed as part of implementing the Agreement. The BMC will continue to take advantage of opportunities to share updates and seek public input on implementation of the Agreement. A web application for public input will be explored, building on or modelling existing applications, if possible.

20 Alberta-Northwest Territories Bilateral Management Committee Annual Report to Ministers 2016-17
AQUATIC ECOSYSTEM Surface water quantity Bilateral agreements describe how water is managed and shared. As per the RIM approach, the Parties classify the water body and then, depending on the class of the water body, monitor it, create a learning plan and develop transboundary water quantity objectives. These transboundary objectives are designed to ensure that the aquatic ecosystem continues to receive the water it needs to remain healthy. Any water that is available after the needs of the ecosystem have been met (i.e. available water) is shared equitably between the jurisdictions. The BMC establishes triggers to ensure appropriate action is taken to meet transboundary objectives.
The Alberta-NWT Bilateral Water Management Agreement specifies that a licence to transfer water into or out of the Mackenzie River Basin (i.e. interbasin transfer) will not be issued in Alberta, unless the licence is specifically authorized by a special act of the legislature. Even then, flow requirements at the Alberta-NWT border and the information, notification and consultation requirements still must be met.
Transboundary water quantity objectivesThe Agreement commits Alberta and the NWT to establish and implement transboundary water quantity objectives and monitoring according to the RIM approach.
A transboundary water quantity objective is the minimum amount of water calculated at the border that the upstream Party must pass to the downstream Party. This minimum amount of water must first meet the needs for the ecological integrity of the aquatic ecosystem, after which at least 50% of the remaining water must pass to the downstream Party.
Transboundary water quantity objectives are site-specific water quantity conditions that the Party or Parties will meet in accordance with the RIM approach.
Available water is the amount of water available for human use after the needs for ecological integrity of the aquatic ecosystem are considered.
Interbasin transfer, for this Agreement, is a transfer of water into or out of the Mackenzie River Basin.
Consumptive use is that portion of water withdrawn from the Mackenzie River Basin that is lost or otherwise not returned to the basin, excluding any volume of water stored in hydroelectric projects.
Allocation is the maximum net amount of surface water or groundwater that a licensee can take from a water body within a defined time period (e.g. annually).

WORKING TOGETHER TO MANAGE OUR SHARED WATERS 21
Current statusSlave River At the time the Agreement was signed, site-specific water quantity objectives for the Slave River had not been determined. The Slave River is designated class 3. The learning plan is being developed and the water quantity portions will focus on gathering currently available historical water quantity data. Because consumptive use (e.g. municipal, industrial) in the Slave River Basin is very low, the Parties agreed to defer objective setting and to establish a consumptive use threshold based on the best available sources of information. Further discussion on establishing water quantity objectives for the Slave River would be triggered once annual consumptive use in Alberta reaches the threshold defined in the Agreement – 2 billion m3 – or sooner if other triggering conditions occur. The allocation of both surface water and groundwater is currently used by the Parties as an estimate of the consumptive use.
Hay River The Hay River is designated class 3 and the learning plan is currently being developed. In the interim, the Parties agreed to be guided by a modified desktop approach, which uses the
4 Framework for Assessing the Ecological Flow Requirements to Support Fisheries in Canada. DFO Can. Sci. Advis. Sec. Sci. Advis. Rep. 2013/017: www.dfo-mpo.gc.ca/csas-sccs/Publications/SAR-AS/2013/2013_017-eng.html
available historical flow monitoring data to determine the amount of water needed for the ecosystem. Fisheries and Oceans Canada produced a science advisory report in 20134 stating there is low probability of detecting negative impacts to aquatic ecosystems with 10% human use of the instantaneous natural flow (flow before human diversions). The Parties used this approach to define an interim objective and will refine the approach or pursue detailed field studies once triggers are reached.
The inaugural report presented the interim objective and triggers at an annual time-step. During the second year of implementation, the Parties discussed, and agreed to, calculation methodologies and a refined monthly time-step for the interim objective and triggers.
Next stepsThe Parties will continue to track and report on the consumptive use threshold (annual consumptive use and recorded flow) for the Slave River. For the Hay River, the Parties will continue to track and report on the interim objective and triggers at a monthly time-step.

22 Alberta-Northwest Territories Bilateral Management Committee Annual Report to Ministers 2016-17
Daily flow conditionsFlow is monitored by the Water Survey of Canada (WSC), a section of Environment and Climate Change Canada (ECCC). Water levels are measured by a continuous recording device, translated into provisional flows and provided online, usually within minutes of recording. In-field flow measurements are taken periodically throughout the year to confirm the water level-flow relationship. WSC compiles, checks and publishes daily average flows in the year following the measurements. At the time of preparing this report, 2016 flow data were still provisional and had not been fully checked and published by WSC.
The information about daily flows is aggregated for the monthly and annual reporting for the Hay and Slave rivers. It is also used to report on the interim triggers for water quality.
Current statusFigures 4 and 5 show daily flows for 2016 compared to selected percentiles for each day of the year. Each day of the year is compared to the historical record prior to 2016 by ranking historical flows on that day by their percentile values. The median, or the 50th percentile, is the flow value exactly in the middle of the range. The 25th percentile is at the lower end, with only 25% of the years in the historical record having lower flow on that day.
Slave River As illustrated in Figure 4, 2016 daily flows in the Slave River reached the 75th percentile or higher in late June, in September, and in November and December. New maximums were also reached for days in late December. No new minimums were reached for days in 2016.
Hay RiverAs shown in Figure 5, the 2016 daily flows reached the 75th percentile or higher in June and were near the maximum in late June or early July. Throughout 2016 daily flows remained above the 25th percentile. No new minimum flows were reached for days in 2016.
What is a percentile?
A percentile is a value below which a certain proportion of observations fall. For example, if the 25th percentile flow is 2000 cubic metres per second (m3/s) on January 1, then 25% of the historical observations on January 1 have a flow of 2000 m3/s or less. It also means that 75% of the observations on January 1 have a flow of 2000 m3/s or greater, or that 2000 m3/s is exceeded in 75% of those observations.
Next stepsDaily flow conditions will continue to be tracked and reported on for both the Slave and Hay rivers, and aggregated for reporting on interim water quantity objectives and triggers as well as interim water quality triggers. The Parties will investigate the circumstances related to the new maximum flows measured in the Slave River.

WORKING TOGETHER TO MANAGE OUR SHARED WATERS 23
5 Water Survey of Canada’s “provisional” data may be subject to change for Quality-Assurance/Quality-Control.
SLAVE RIVER AT FITZGERALD 2016 DAILY FLOWS & 1972-2015 STATISTICS
Flow
s (m
3 /s)
Figure 4. Slave River at Fitzgerald daily flows, 2016 daily provisional5 flow data and 1972-2015 statistics
Wat
er le
vel (
mas
l)
HAY RIVER AT THE AB-NWT BORDER 2016 DAILY LEVELS & 1986-2015 STATISTICS
Figure 5. Hay River at the AB-NWT border 2016 daily provisional water level data and 1986-2015 statistics

24 Alberta-Northwest Territories Bilateral Management Committee Annual Report to Ministers 2016-17
Transboundary water quantity triggersSlave River The BMC will initiate further discussion about the Slave River if:
1. Alberta’s annual consumptive use reaches the 2 billion m3 threshold;
2. 2 billion m3 becomes significantly different from 1.9% of the long-term average (1972-present) annual flow; or
3. 50% of the consumptive use in Alberta is in the form of interbasin transfers.
Should any of these conditions be reached, the Parties will review and agree on next steps, which may include either agreeing to a further deferral or determining the needs for the ecological integrity of the aquatic ecosystem of the Slave River and each Party’s share of the available water (i.e. the transboundary water quantity objective).
Current statusThe Parties agreed to use Alberta’s current annual allocation (surface and ground water) as an estimate for annual consumptive use. This is a conservative approach because the allocation is the maximum annual consumptive use allowed. Often, the actual use of water in a given year is 50% of the allocation, or less. The volume of an annual allocation includes consideration of emergency water demands in addition to typical operations throughout the year. This approach also does not include any diversion restrictions in the licence or diversion restrictions due to other policies, such as the “Surface Water Quantity Management Framework for the Lower Athabasca
River”. For more details on a licensee’s conditions for water use, licence documents can be accessed online, through the Alberta Environment and Parks “Authorization Viewer”.
Figure 6 below represents the long-term annual Slave River flow. In Figure 6, Alberta’s consumptive use threshold of 2 billion m3 is the sum of Alberta’s surface water allocations (blue), groundwater allocations (red) and the remainder of the threshold not used (pale green).
Figure 6. Alberta 2016 allocation as percentage of Slave River average flow
ALBERTA 2016 ALLOCATION AS % OF SLAVE RIVER AVERAGE FLOW

WORKING TOGETHER TO MANAGE OUR SHARED WATERS 25
Water Body 2016 Allocations and Flows (m3/year) 2015 Allocations and Flows (m3/year)
Surface Water 912,544,077 903,538,399
Groundwater 170,839,356 178,146,719
Total Allocation 1,083,383,433 1,081,685,118
Consumptive Use Threshold 2,000,000,000 2,000,000,000
1972-present Mean Annual Flow 105,300,000,000 105,400,000,000
Table 2. Comparison of 2015 and 2016 Slave River allocations and mean annual flows from 1972
Table 2 shows Slave River surface water and groundwater allocations and flows for 2016 and 2015. The total allocation was slightly more in 2016, with increases in surface water allocations and decreases in groundwater allocations. The mean annual flow from 1972 to present has decreased slightly; however, the 2 billion m³ threshold remains at 1.9% of the long-term annual flow of the Slave River.
The Parties agreed to track interbasin transfers into or out of the Mackenzie River Basin, as discussions will be triggered if 50% of Alberta’s consumptive use is in the form of interbasin transfers. No new special acts were passed in Alberta during 2016 to allow for transfer of water out of the Mackenzie River Basin. Such allowances under pre-existing special acts6 are included in the surface water allocation given in Figure 6 and Table 2.
Next stepsThe Parties will continue to track and report on consumptive use, annual flow and interbasin transfers as well as refine the methods for calculating annual consumptive use and mean annual flow when needed.
Hay River There are two interim water quantity triggers for the Hay River. Trigger 1 is reached when allocations reach 50% of a Party’s share of available water (2.5% of the natural flow). Trigger 2 is reached when water consumption reaches 80% of a Party’s share of available water (4% of the natural flow). The Parties agreed to seek confirmation of actual withdrawals and estimated return flows if Trigger 1 is reached.
6 The total volume of allocation under special acts is 0.02 % of the total allocation (of surface water and groundwater).

26 Alberta-Northwest Territories Bilateral Management Committee Annual Report to Ministers 2016-17
Current statusThe triggers for the Hay River were assessed at a monthly time-step, a refinement from the annual time-step in the 2015-16 annual report. The triggers are percentages of the natural flow and, therefore, require natural flow to be calculated monthly as well.7
HAY RIVER 2016 ALLOCATIONS (% NATURAL BORDER FLOW)
Figure 7. 2016 allocations as percentage of Hay River estimated monthly natural border flow 8
7 The natural flow calculation requires estimating the flow reduction at the border in each month due to water use throughout the basin. The natural flow calculation should consider the timing of the flow from sub-basin to sub-basin, where the water uses occur and the type of water diversion (e.g. on-stream weir, canal, pumping or combination) in order to calculate the month that the flow will be reduced at the border. However, there is not enough information on sub-basin flow in the Hay River Basin at this time to calculate detailed natural flow. For each of the triggers, it is conservatively assumed that the water used throughout the basin is taken directly at the border and natural flow is estimated according to that assumption (see Table 4 of Monitoring section).
8 Monthly natural border flow is calculated by dividing the total annual allocation of surface water and groundwater (7,507,411 m³) evenly throughout the year and adding it to 94% of the measured monthly flow near the town of Hay River. This assumes the full allocation volume is taken directly at the border.
For Trigger 1, the annual allocation (surface water and groundwater) was divided equally among the months of the year, and assumed to be the amount of flow reduction at the border. Figure 7 shows the allocation as a percentage of the natural border flow, in relation to Trigger 1. The allocations are well below Trigger 1 in most months, but exceeded Trigger 1 in January, February and March (Figure 7), prompting a review of consumption data.

WORKING TOGETHER TO MANAGE OUR SHARED WATERS 27
HAY RIVER 2016 CONSUMPTION ESTIMATE (% NATURAL BORDER FLOW)
Figure 8. 2016 consumption estimate as percentage of Hay River estimated monthly natural border flow10
9 For those licensees who did report use in 2016, the reported surface water consumption was shown to be 31% of the allocation. The assumed consumption rate of 62% (double 31%) for licensees who did not report use acknowledges that they may have used a higher percentage than those who did report use. The numbers and types of licensees (municipal, commercial, industrial) were similar in both the group of licensees who reported their use and the group who did not. Size of allocations in both groups was also similar.
10 For Trigger 2, monthly natural border flow is calculated by adding the total monthly estimated consumption (metered value + non-metered estimate) to 94% of the measured monthly flow near the town of Hay River. This assumes that the consumption occurs directly at the border.
Since Trigger 1 was exceeded in some months, consumption data were reviewed to determine if Trigger 2 was exceeded. This required an estimation of the overall consumption. Not all licensees are required to report their consumption, but when monthly consumption was reported, the data were included in the estimation. When data were not available, a conservative estimate of the consumption is assumed to be 62% of the allocation9. Figure 8 shows the monthly consumption estimate as a percentage of the natural flow, in relation to Trigger 2. Trigger 2 was not exceeded in any month (Figure 8).
Next stepsThe Parties will continue to discuss and refine methodologies to better understand consumption throughout the Hay River Basin and natural flows of the Hay River, with efforts to improve reporting.

28 Alberta-Northwest Territories Bilateral Management Committee Annual Report to Ministers 2016-17
Surface water qualityThe Agreement describes how water quality in the transboundary reaches is monitored, assessed and managed. The Slave and Hay rivers are class 3 rivers for which learning plans will be developed and transboundary water quality triggers and objectives will be set. Water quality triggers and objectives are intended to help protect surface water quality, proactively address any emerging water quality concerns and support pollution prevention.
Transboundary water quality objectivesA transboundary water quality objective is defined as the site-specific water quality conditions that the responsible Party or Parties will meet in accordance with the RIM approach.
Current statusTo promote consistency among the jurisdictions within the Mackenzie River Basin, methods and processes to develop water quality objectives continue to be discussed.
What is site-specific water quality?
Water quality naturally varies from place to place, with the seasons, climate, and the types of soils and rocks through which water moves. Sometimes, when generic guidelines are used to assess water quality, the guidelines can be exceeded due to natural factors, such as high sediment loads. In other cases, the generic guidelines for some parameters may be considerably higher than the natural levels.
Water quality triggers in the Agreement were derived from Hay and Slave rivers long-term monitoring data and are known as site-specific water quality triggers. Triggers provide a relevant set of benchmarks against which future data can be compared. Also, where generic guidelines do not currently exist for certain parameters (e.g. phosphorus), site-specific water quality triggers are useful.

WORKING TOGETHER TO MANAGE OUR SHARED WATERS 29
Transboundary water quality triggersA transboundary water quality trigger is a pre-defined early warning of potential changes in typical and/or extreme water quality conditions, which results in jurisdictional and/or bilateral water management to confirm that change.
Current statusInterim site-specific water quality triggers are being used to assess the surface water quality of the Slave and Hay rivers, and to track water quality variability within the year and over time. The interim triggers, calculated using historical water quality data at the 50th (typical; Trigger 1) and 90th (extreme; Trigger 2) percentiles, were updated for the 2016 assessment to include the remaining 2014 (Hay River) and 2012-2014 (Slave River) water quality data that were unavailable at the time the Agreement was signed in 2015.
Slave and Hay river water quality monitoring programs
Transboundary water quality is monitored in the Slave River at Fitzgerald, Slave River at Fort Smith and Hay River near the Alberta/NWT border. Water samples are analyzed for conventional parameters, including physical variables (e.g. pH, total suspended solids), major ions (e.g. calcium, magnesium, sulphate), nutrients (e.g. nitrogen, phosphorus) and metals (e.g. arsenic, copper, lead and mercury). Water samples are also analyzed for organic substances, including pesticides and hydrocarbons.
Environment and Climate Change Canada has monitored surface water quality of the Slave and Hay rivers since 1960 and 1988, respectively. These long-term datasets are important to determine the historical flow conditions and water quality concentrations of various parameters in water and to set Triggers 1 and 2.

30 Alberta-Northwest Territories Bilateral Management Committee Annual Report to Ministers 2016-17
Trigger 1: 50th percentileThe annual 50th percentile was designated as Interim Trigger 1 for both the 2015 and 2016 assessments. As a first step, a parameter was flagged if more than half of its values were above Trigger 1. Trend results were reviewed for all Trigger 1 flagged parameters to determine if levels are changing over time. For the Slave River, flagged parameters that revealed an increasing trend and/or parameters that were flagged in both 2015 and 2016 were evaluated further by combining the 2015 and 2016 water quality data and statistically comparing the combined data to the historical data using the Wilcoxon-Mann-Whitney test. This test identifies any statistically significant differences between two time periods and can highlight parameters that may warrant additional attention. The Wilcoxon-Mann-Whitney test was not applied to the Hay River because the combined two-year sample size was too small (n=7).
Trigger 2: 90th percentile The seasonal 90th percentile was designated as Interim Trigger 2 for both the 2015 and 2016 assessments. A parameter was flagged if its value was greater than Trigger 2 and then it was compared to its respective historical open-water or ice-covered maximum value. Any parameter above its respective seasonal maximum value was evaluated further by examining flow conditions at the time of sample collection, reviewing trend results and comparing values to existing water quality guidelines for the protection of aquatic life.
What is a percentile?
A percentile is a value below which a certain proportion of data fall. For example, if the 50th percentile for dissolved sodium is 12.5 milligram per litre (mg/L) (Hay River, open-water season), then 50% of the historical data have a sodium concentration of 12.5 mg/L or less.
Since percentiles are based on values that have been observed in the past, not all values above a percentile signal a concern. Percentiles are useful to highlight those parameters that should be examined further to determine whether or not change is occurring.
11 Two bottles from the July sampling event were lost in transit from the field to the laboratory. This resulted in 538 water quality results available for assessment.
2016 water quality assessment resultsSlave RiverIn this assessment, 53811 individual conventional water quality results were assessed against Trigger 1 and Trigger 2. These results were generated from water samples collected in 2016 by Environment and Climate Change Canada (ECCC) from the Slave River at Fitzgerald site on nine occasions. Sixty-six parameters from each sample were reviewed as part of this assessment.

WORKING TOGETHER TO MANAGE OUR SHARED WATERS 31
2016 water quality technical report
The 2016 water quality results included here were summarized from the technical companion report: 2016 Water Quality Report for the Slave and Hay Transboundary Rivers, which is available online at www.aep.alberta.ca and www.enr.gov.nt.ca.
The technical report: 1. Describes the transboundary water
quality monitoring programs used for the assessment;
2. Describes the approach to the 2016 water quality assessment;
3. Presents and discusses the results of the water quality assessment; and
4. Provides recommendations for future bilateral water quality-related tasks.
Twenty-seven of the 66 parameters were flagged during the 2016 Trigger 1 assessment. Of the 27 parameters, seven were also flagged during the 2015 assessment. These seven are alkalinity, specific conductance, dissolved calcium, dissolved magnesium, dissolved sulphate, nitrate/nitrite and dissolved strontium. These seven parameters plus dissolved organic carbon, which revealed an increasing trend in 2015, were assessed with the Wilcoxon-Mann-Whitney test. The test revealed a statistically significant difference for dissolved magnesium and nitrate/nitrite, suggesting that concentrations for these two parameters are higher in the last two years than in the past. For the other six parameters (i.e. alkalinity, specific conductance, dissolved calcium, dissolved sulphate, dissolved strontium and dissolved organic carbon), no significant differences were revealed.
The BMC will review and confirm whether the levels of dissolved magnesium and nitrate/nitrite are changing and will report on the results in subsequent annual reports. Potential next steps may include conducting a more thorough statistical trend assessment and assessment of the impacts of flow, missing data and changing laboratory methodologies on water quality data as well as reviewing trend reports to learn if similar trends are emerging upstream.
The Trigger 2 assessment revealed considerably more values above Trigger 2 in 2016 (67 of 538 results) than in 2015 (9 of 590 results). The majority of values above Trigger 2 occurred in June following the peak of the spring freshet and in September following a large rain event (see Figure 4 – quantity section). The elevated water quality values for several parameters and the new maximum values for total
bismuth, total cobalt, total nickel, total selenium, total thallium, total uranium and nitrate/nitrite are likely attributable to the two high flow events because high flows tend to carry more particulate matter to which many metals and other substances are attached. High concentrations of total suspended solids were also observed at the same time as the high flow events. The massive wild fire that occurred from May to July in the Fort McMurray area might have also contributed to the elevated water quality values.
32 Alberta-Northwest Territories Bilateral Management Committee Annual Report to Ministers 2016-17
Hay RiverFor the Hay River assessment, 164 individual conventional water quality results were compared to Trigger 1 and Trigger 2. These results were generated from water samples collected in 2016 by ECCC from the Hay River near the Alberta/NWT boundary on four occasions. Forty-one parameters from each sample were reviewed as part of this assessment.
Eleven of the 41 parameters were flagged during the 2016 Trigger 1 assessment. Of these, the historical dataset for total vanadium was reviewed because a pre-existing statistically significant increasing annual trend was revealed. It was found that recent data are very similar to historical levels and total vanadium is not a concern at this time. The Trigger 2 assessment showed that five of 41 parameters (5 of 164 results) had values above Trigger 2, but none were above their respective historical seasonal maximum values.
Toxic, bioaccumulative and persistent substancesThe Parties are committed to pollution prevention and sustainable development to meet the objective of virtual elimination (VE) for substances that are human-made, toxic, bioaccumulative and persistent. The BMC reports on the detection of any substance subject to VE that is detected in the Slave and Hay rivers.
During the summer of 2016, Environment and Natural Resources (GNWT) collected three water samples from each river. These samples were analyzed for 14 substances subject to VE.12 Some of these substances were detected on each sampling occasion in each river, but at very low concentrations. Comparisons with the available corresponding United States Environmental Protection Agency (USEPA) Chronic Aquatic Life Criteria show that the levels detected pose no risk to aquatic life. Laboratory contamination or historical residues are potential causes for the detection of these substances.
ConclusionThere were no concerns with water quality in either the Slave or Hay rivers in 2016. With regard to Trigger 1, the BMC will follow-up to confirm whether the levels of dissolved magnesium and nitrate/nitrite in the Slave River are changing over time. With regard to Trigger 2, the new maximum values for several parameters in the Slave River were likely attributable to water sampling during peak flows in June or September and the possible influence of the Fort McMurray wild fire. In the later months, Slave River water quality was within the historical seasonal ranges for all parameters. Monitoring and assessment will continue in both rivers.
12 Aldrin, chlordane, dieldrin, endosulfan, endrin, heptachlor, hexachlorobenzene, hexachlorobutadiene, hexachlorcyclohexane (HCH; alpha, beta, gamma), mirex, dichlorodiphenyltrichloroethane (DDT), toxaphene, polychlorinated biphenyls (PCBs), and pentachlorobenzene (see Table 10, Appendix E6 of the Agreement).

WORKING TOGETHER TO MANAGE OUR SHARED WATERS 33
Completed/ongoing tasks Over the 2016-17 fiscal year, the following tasks were completed:
1. Jointly reviewed and assessed the 2016 Slave and Hay river surface water quality data.
2. Updated the 2015 interim site-specific water quality triggers. The triggers were updated to reflect data that were unavailable at the time the Agreement was signed in 2015. All triggers (original and updated) are included in Appendix 1 and 2 of the 2016 technical water quality report.
3. Continued to collect Slave and Hay river water samples for the analysis of mercury so that interim site-specific water quality triggers for mercury can be developed. All mercury data, for this purpose, can be found in the 2016 technical water quality report.
Next stepsWhen the Agreement was signed in March 2015, the Parties acknowledged that work was required in several areas to fully implement the Agreement. The Parties agreed that they would learn together through implementation. Tasks for the 2017-18 fiscal year and beyond include:
1. Jointly review and assess the 2017 Slave and Hay river water quality data.
2. Review the water quality monitoring data generated by ECCC and the GNWT on the Hay River to examine the feasibility of merging datasets to increase the annual sample size.
3. Continue the mercury water quality sampling program in the Slave and Hay rivers.
4. Continue to explore approaches for assessing trends in water quality to inform the annual water quality assessment. Seek participation from other Mackenzie River Basin jurisdictional staff.
5. Continue to discuss approaches to develop triggers and objectives that identify changes in water quality. Seek participation from other Mackenzie River Basin jurisdictional staff.
Each year, Hay and Slave rivers surface water samples are collected by ECCC and the GNWT. Data from these sampling programs are used to assess the water quality of the Slave and Hay rivers as part of the BWMA annual reporting commitment.

34 Alberta-Northwest Territories Bilateral Management Committee Annual Report to Ministers 2016-17
GroundwaterThe Agreement describes how groundwater will be shared reasonably and equitably. However, there is limited knowledge about the quality, quantity and location of groundwater shared between Alberta and the NWT.
Current statusTwo reports were completed in 2016 to increase our knowledge on the state of groundwater: the Preliminary State of Groundwater Knowledge in the Transboundary Region of the Mackenzie River Basin13 and the State of Aquatic Knowledge for the Hay River Basin14. Both reports highlighted the lack of information on groundwater in the Alberta-NWT transboundary area, especially on the NWT side. A very limited number of aquifers were identified in the transboundary regions of the Mackenzie River Basin and, in most jurisdictions, the delineation of transboundary groundwater areas has not been completed yet. Groundwater monitoring data, when existent, are difficult to access. There is no central registry for well data in the NWT (Alberta has a water well information database: groundwater.alberta.ca/WaterWells/d/) and limited consistent or continuous monitoring of transboundary groundwater conditions in the different basins of the transboundary area. Additionally, the reports identify that information on water licences, particularly for hydraulically fractured wells, is not readily accessible.
These reports made a series of recommendations, including the following:
• Undertake further analysis of local community information and traditional knowledge.
• Further delineate aquifers using the abundant oil and gas well logs and surficial and bedrock geology maps available through the federal, provincial and territorial geological surveys; these sources might identify groundwater resources in the region.
• Inventory and review available groundwater quality data and develop baselines for transboundary groundwater.
• Improve the availability and reporting of data from industry for operating activities with the potential to impact groundwater (especially natural gas extraction).
• Monitor groundwater (level and quality) and make it publicly available among jurisdictions.
• Continue and expand monitoring to acquire further data to assess against baseline and identify potential temporal trends.
• Develop a central (and spatial) database and reporting system for the NWT.
• Undertake further analysis on groundwater-surface water interaction to inform the surface water learning plans.
13 The Preliminary State of Groundwater Knowledge in the Transboundary Region of the Mackenzie River Basin (2016) presented an overview of the physical characteristics of the Mackenzie Basin (geology, surficial deposits, vegetation, etc.) at a regional scale, and compiled known groundwater use and potential impacts to groundwater for the transboundary areas that the NWT shares with Alberta, British Columbia, Nunavut, Saskatchewan and Yukon.
14 The State of Aquatic Knowledge for the Hay River Basin report (2016) included regional-level information about surface water, groundwater and biology for the Hay River Basin. The report gathered basin-specific information on existing water wells in Alberta and British Columbia, groundwater licence allocations in Alberta, British Columbia and the NWT, and existing and potential activities and pressures. However, data were not always easily accessible, especially for oil and gas activities (conventional and unconventional), and there were some data gaps in the records.
Transboundary groundwater refers to all water resources that collect, flow or freeze beneath the Earth’s surface and are shared by the Parties to this Agreement and within the Mackenzie River Basin.

WORKING TOGETHER TO MANAGE OUR SHARED WATERS 35
The gaps and recommendations from the two reports were compared to the groundwater learning plan table of contents (Appendix H2) for the Agreement. The following priorities were identified for implementation of the Agreement:
1. Delineate Alberta-NWT shared groundwater areas;
2. Complete a comprehensive search for information on immediate and proposed developments, activities and human pressures for the groundwater areas (especially information that was not possible to access for the two state of knowledge reports);
3. Identify monitoring priorities; 4. Develop a groundwater monitoring and
aquifer characterization plan for the areas of interest; and
5. Establish a scientifically based approach to identify areas of impaired groundwater quality. This approach may include, but is not limited to:a. Temporal trend assessmentb. Spatial trend assessmentc. Control charting d. Trigger/thresholds
Best practices reportIn order to develop a groundwater monitoring and aquifer characterization plan, the University of Montreal and McGill University is drafting a report on best practices in groundwater monitoring for northern Canada. They are collecting information on how aquifers are commonly identified, how
groundwater flow is determined and what are best practices for groundwater monitoring. The study is exploring the various methods that can be used, including information needed to design a suitable monitoring program. The final report of this multi-year project will be delivered in fall 2017.
Next stepsA comprehensive inventory of available information on water wells, monitoring data and future development will be conducted to fill the information gaps remaining from the two state of knowledge reports. The existing data will be analyzed to detect any trends, and the monitoring gaps and priorities will be identified.
Hydrogeological information to delineate transboundary groundwater in the AB-NWT border region is scarce and most of the aquifers in this area are not defined and mapped. Alberta and NWT groundwater staff will define shared groundwater areas as an interim approach until aquifers are mapped.
Options for mapping aquifers and monitoring groundwater will be explored for the priorities identified. The best practices in groundwater monitoring for northern Canada report will be completed and reviewed, and the conclusions will be taken into account for future groundwater monitoring and aquifer determination. Finally, a partnership with academics will be explored to improve understanding of permafrost dynamics and characterization of the Slave and Hay river basins.
36 Alberta-Northwest Territories Bilateral Management Committee Annual Report to Ministers 2016-17
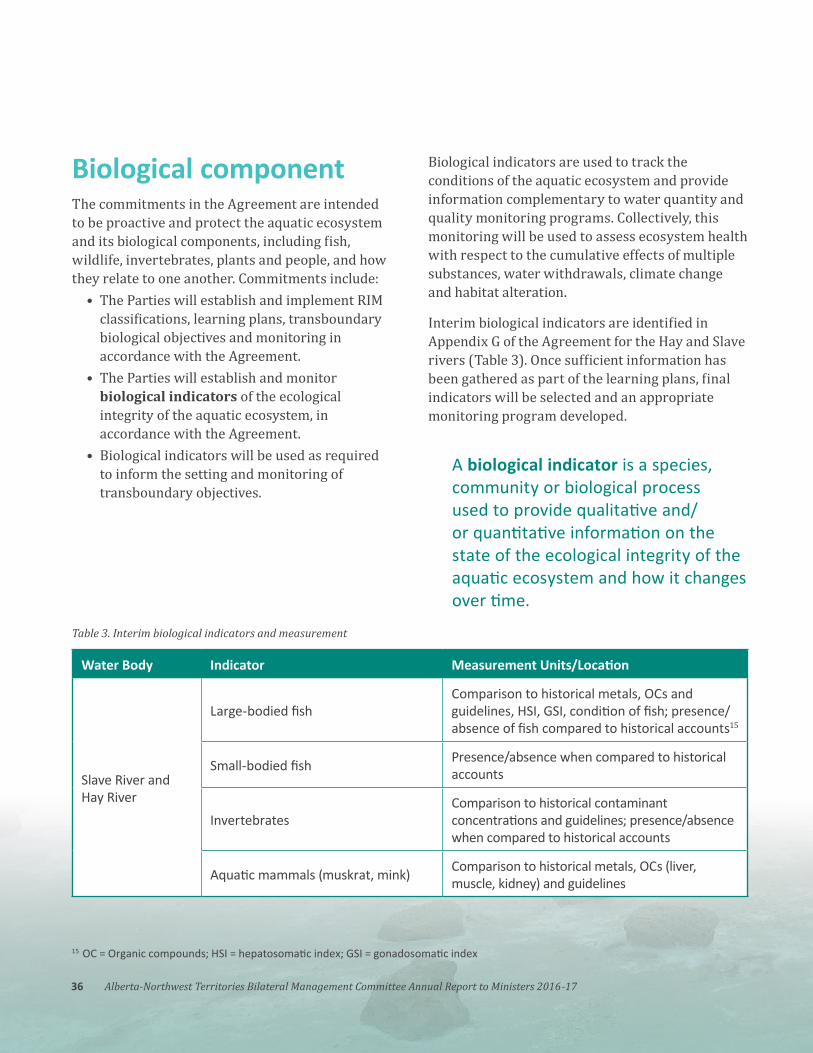
Biological componentThe commitments in the Agreement are intended to be proactive and protect the aquatic ecosystem and its biological components, including fish, wildlife, invertebrates, plants and people, and how they relate to one another. Commitments include:
• The Parties will establish and implement RIM classifications, learning plans, transboundary biological objectives and monitoring in accordance with the Agreement.
• The Parties will establish and monitor biological indicators of the ecological integrity of the aquatic ecosystem, in accordance with the Agreement.
• Biological indicators will be used as required to inform the setting and monitoring of transboundary objectives.
Biological indicators are used to track the conditions of the aquatic ecosystem and provide information complementary to water quantity and quality monitoring programs. Collectively, this monitoring will be used to assess ecosystem health with respect to the cumulative effects of multiple substances, water withdrawals, climate change and habitat alteration.
Interim biological indicators are identified in Appendix G of the Agreement for the Hay and Slave rivers (Table 3). Once sufficient information has been gathered as part of the learning plans, final indicators will be selected and an appropriate monitoring program developed.
Water Body Indicator Measurement Units/Location
Slave River and Hay River
Large-bodied fishComparison to historical metals, OCs and guidelines, HSI, GSI, condition of fish; presence/absence of fish compared to historical accounts15
Small-bodied fish Presence/absence when compared to historical accounts
InvertebratesComparison to historical contaminant concentrations and guidelines; presence/absence when compared to historical accounts
Aquatic mammals (muskrat, mink) Comparison to historical metals, OCs (liver, muscle, kidney) and guidelines
Table 3. Interim biological indicators and measurement
15 OC = Organic compounds; HSI = hepatosomatic index; GSI = gonadosomatic index
A biological indicator is a species, community or biological process used to provide qualitative and/or quantitative information on the state of the ecological integrity of the aquatic ecosystem and how it changes over time.

WORKING TOGETHER TO MANAGE OUR SHARED WATERS 37
Current statusThe jurisdictions are working to evaluate and develop final biological indicators. Activities undertaken in 2016-17 to help develop final biological indicators included creating an annotated bibliography of relevant biological monitoring on the Slave and Hay rivers, producing a summary of previous biological indicator work undertaken in the Mackenzie River Basin, delivering a workshop to better understand biological indicator-related activities in Alberta’s lower Athabasca region and how they may relate to the Agreement, and preparation and planning for a field program to test different methods of sampling benthic macroinvertebrates on large rivers.
Annotated Bibliography: literature review on biological monitoring and biological indicators in the Hay and Slave rivers for the Alberta-NWT Bilateral Water Management AgreementA large number of documents, research articles and databases were reviewed for their relevancy to biological monitoring, or the development of biological indicators in the Slave and Hay river basins. The literature review focused on the interim biological indicators listed in the Agreement (i.e. fish, aquatic mammals, invertebrates) and also included other indicators, such as amphibians, ecosystem, algae, vegetation and birds. The Annotated Bibliography can be made available upon request.
Recommendations report on monitoring and assessment protocols for benthic macroinvertebrate communities and benthic macroinvertebrates monitoring plan for NWT transboundary riversProgress was made to initiate a monitoring program for benthic macroinvertebrates in large transboundary rivers through collaboration with the Canadian Rivers Institute. Potential monitoring
methods and associated protocols were reviewed and assessed to develop a foundation for a monitoring program. A monitoring plan specific to the needs of the Agreement was developed to characterize the community structure of benthic macroinvertebrates in large transboundary rivers. This program will help determine current condition and provide baseline information that can be used for continued assessment and determining trends.
Workshop on biological indicators In March 2017, Alberta hosted a joint meeting with the NWT to learn about the development and use of biological indicators in existing management frameworks in Alberta. Participants discussed the interim biological indicators in the Agreement and how existing management frameworks might inform development of final biological indicators of aquatic ecosystem health for the Slave and Hay rivers.
Next stepsBased on the information gathered in the annotated bibliography, a report will be produced to synthesize past and current biological monitoring in the Slave and Hay rivers, and to recommend final biological indicators for the Agreement. A pilot benthic macroinvertebrates sampling program in the Slave and Hay rivers is scheduled for fall 2017. The intent is to trial methods that could be used in a long-term program.
A second workshop intended to identify the most suitable biological indicators for implementation of the Agreement is being planned for January 2018. The workshop will include experts from provincial, territorial and federal governments, academia and Indigenous representatives.
38 Alberta-Northwest Territories Bilateral Management Committee Annual Report to Ministers 2016-17
Status of interim biological indicatorsHistorical information collected near the Alberta-NWT border for each interim biological indicator is summarized below.
Large-bodied fishCondition factor and anomaliesLarge-bodied fish were sampled in the Slave River near Fort Smith during a 2011-2015 study led by the University of Saskatchewan16 (U of S). The study showed that the condition factor17 of fish was significantly lower in 2011 and 2012 than in 2014 and 2015. A similar trend was observed during the study for the number of anomalies18, where there were a higher number of anomalies observed in 2011-12, as compared to fish caught in 2014-15.
No studies or information was found on the condition of large-bodied fish for the Hay River.
PAHs (polycyclic aromatic hydrocarbons) in fish bile and fish muscleResults from the U of S study found that PAH concentrations in muscle of fish in the Slave River are low and similar to results from the Slave River Environmental Quality Monitoring Program19 conducted in the 1990s. Due to different analytical methodology from the two studies, results for PAHs in fish bile were not comparable between the two datasets. Seasonality was observed to be an important factor, where PAHs in bile were generally higher in the summer than in the spring and winter.
Baseline information on PAH concentrations in bile and muscles of walleye and northern pike was collected on the Hay River near the border in 1994 (Bujold, 1995). Currently, the only PAH with a Canadian guideline is benzo(a)pyrene. Benzo(a)pyrene was not detected in fish during the 1994 study.
Mercury concentration in fish muscleAll fish sampled for mercury in the Slave River during the U of S study had levels below the general Health Canada guideline for mercury, with the exception of one burbot. These 2011-2015 mercury concentration results are similar to previous studies conducted in the 1980s and 1990s.
For the Hay River, a study of mercury in fish in 1988-1990 found that mercury concentrations were below the Health Canada commercial advisory level (Grey et al., 1995). Concentrations of total mercury in fish collected from the Hay River and other water bodies in Alberta in 2009-2013 were within the ranges reported in the literature for the same fish species from other rivers and lakes elsewhere in Canada and the United States (Alberta Government, 2016).
Fish communityTwenty-three species of fish have been identified in the Slave River. No perceptible change in the number of species has been identified in available studies (Dagg, 2016).
For the Hay River, within the NWT, the last known studies conducted on fish stocks occurred between 1972 and 1986 (Stantec Consulting Ltd., 2016). The survey indicated that there was no concern about
16 Report currently being finalized by Ehimai Ohiozebau, Tim Jardine, Brett Tendler and Paul Jones from University of Saskatchewan.17 The condition factor is a function of fish morphology (round/rotund versus skinny/narrow), which provides a general indicator of fish
health. In general, fish that are heavier for a standard weight (i.e. expected weight for a given length) have more accumulated energy reserve for growth and reproduction.
18 Anomalies include unusual external features of a fish, such as lesions.19 Sanderson, J., Lafontaine, C., and Robertson, K. 1997. Slave River environmental quality monitoring program. Final five year study report.
Water Resources Division, Department of Indian Affairs and Northern Development, Yellowknife, TN-O. www.aadnc-aandc.gc.ca/eng/1368201898882/1368201976775
WORKING TOGETHER TO MANAGE OUR SHARED WATERS 39
20 Finescale dace (Phoxinus neogaeus), lake chub (Couesius plumbeus), white sucker (Catostomus commersoni) and longnose sucker (Catostomus catostomus).
21 Information on the Slave Watershed Environmental Effects Program can be found online at www.cwn-rce.ca/project-library/project/sweep-the-slave-watershed-environmental-effects-program-paul-jones
stock replacement at that time (Stewart and Low, 2000). Alberta undertook limited work on fish distribution in the Chinchaga River in 1992 and inventoried arctic grayling within the Hay, Yates and Whitesand river basins in Alberta in 2010 and 2012. The latter survey (Lyttle and Wilcox 2012) concluded that arctic grayling are present in numerous rivers within the Hay and Whitesand river watersheds.
Small-bodied fishSmall-bodied fish (spottail shiner and emerald shiner) were studied in 2014 on the Slave River near Fort Smith to address concerns from residents about the ecological integrity of the Slave River near the municipal wastewater discharge site. Small-bodied fish were collected near, upstream and downstream of the point of discharge. Some differences were found between the sites for emerald shiner. The author recommended conducting additional monitoring to determine the potential cause of these differences (Pomeroy et al., 2015).
In 2012, four non-sportfish species20 were inventoried from two tributaries to the Hay River (Steenbergen, Lyttle and Wilcox 2013). The presence of arctic grayling and other fish species indicates there is important fisheries habitat in the Alberta portion of the Hay River Basin.
InvertebratesTwo extensive studies to characterize benthic macroinvertebrates communities in the Slave River were undertaken in the 1970s and 1990s. Numerous sampling methods were tested to obtain information on the community structure
and composition. The vast majority of the invertebrates collected from those studies were chironomids. More recently, the Slave Watershed Environmental Effects Program collected benthic invertebrate samples in 2013-1421. Samples were found to contain a diverse assemblage of benthic macroinvertebrates.
On the Hay River, benthic invertebrates were sampled by ECCC near the town of Hay River in 2015, but results have not yet been published.
Aquatic mammals (muskrat, mink)Contaminant concentrations in mink on the Slave River near Fort Smith were studied in the 1990s. Concentrations of metals and organochlorines were low compared to other locations in the NWT, with the exception of mercury, which was slightly higher. The study suggests that higher mercury concentrations in mink may be due to natural occurrence in the environment or anthropogenic sources. Overall, the concentrations of heavy metals, including mercury, were found to be below what would impair aquatic mammal reproduction (Poole et al, 1998).
Most recently, the concentration of heavy metals in muskrats and minks was investigated by the Slave River and Delta Partnership in 2013. Mercury, cadmium, arsenic, lead and chromium in the muscles of those furbearers were found to be very low. Mercury concentrations in the liver of mink were lower than in the samples collected in the 1990s (Cott et al, 2016).
No studies on aquatic mammals on the Hay River were found.

40 Alberta-Northwest Territories Bilateral Management Committee Annual Report to Ministers 2016-17
MONITORINGLong-term monitoring is critical to understanding whether significant changes are taking place in the natural environment. Data collected about surface water quantity and quality, groundwater and biology over the long term can reveal important patterns.
These patterns allow trends, cycles and rare events to be identified. Long-term data are particularly important for complex, large systems where environmental signals may be subtle and slow to emerge. Interpreting monitoring results tells us whether the Agreement commitments are being met.
Water quantity monitoring Setting transboundary water quantity objectives requires site-specific knowledge of stream flow and current diversions for human use. The primary goals of water quantity monitoring of transboundary waters are to track changes in water quantity over time, determine anthropogenic and natural drivers for changes in water quantity, and ensure that sufficient water is available for downstream uses (for the ecosystem and humans). Long-term continuous monitoring of stream flow is important to understand the hydrology of a water body and to estimate available water.
Current statusFor the Hay River, Table 4 shows the monitoring or assessment sites that provide information to assess and refine transboundary water quantity interim triggers and objectives. As mentioned previously, Water Survey of Canada undertakes the hydrometric monitoring. The costs of the monitoring are shared with the provincial/territorial jurisdictions.
A list of hydrometric stations in the Slave and Hay river basins is included in Appendix I of the Agreement. The list identifies several monitoring sites that provide data to help understand regional climate conditions and influence on water quantity.
The Hay River station near the Alberta-NWT border has been converted from a seasonal water-level station to a year-round flow monitoring station as recommended in the Agreement. A few years of data collection are required to establish the water level-to-flow relationship prior to being able to use the flow data for interim objective analysis.
Next stepsThe Parties will continue to notify and provide information to each other about hydrometric monitoring occurring in their respective jurisdictions that is relevant to the Agreement.
Two stations that currently are monitored by Water Survey of Canada will be added to the list in Appendix I (Table I3): one lake-level station that monitors water level fluctuations on Great Slave Lake and one flow station below the outflow of Great Slave Lake on the Mackenzie River.
In partnership with other jurisdictions, the Parties will work to better understand under ice flows and associated monitoring methods.
The Parties will explore possible processes to implement further monitoring in the Hay River Basin that was recommended in the Agreement.

WORKING TOGETHER TO MANAGE OUR SHARED WATERS 41
Monitoring Station/ Assessment Point Site Status
Hay River near town of Hay River (flow monitoring, 1963-present ; level monitoring, 2002-present)
Continuous monitoring since July 1963; one incomplete month (July 2010).Drainage Area: 51,700 km²; geo-coordinates 60.743 N, 115.8596 W
Hay River near Alberta-NWT border (level monitoring, 1986-present)
Intermittent monitoring began in 1986, stopped in 1998 and restarted in 2004.Drainage area: 48,800 km²; geo-coordinates 60.0039 N, 116.9721 W
Hay River at the Alberta-NWT border (calculated flow estimate)
Used to assess the triggers for the Hay River Basin. This is done by reducing the flow to the smaller drainage area at the border. The flow at the border is estimated as 94% of the flow near the town of Hay River.
Hay River at the Alberta-NWT border (calculated natural flow estimate)
To assess triggers for the Hay River Basin, estimated natural border flow is calculated by adding the upstream monthly surface water and groundwater allocation or estimated consumption to the ‘Hay River at the Alberta-NWT border (calculated flow estimate)’ above.
Slave River at Fitzgerald (flow monitoring, 1960-present)
Intermittent monitoring 1921-1922, 1930-1931 and 1953-1958.Continuous daily monitoring since May 1959; nine incomplete months (2011-2014).This location is used to assess whether the 2 billion m3 consumptive use threshold becomes significantly different from 1.9% of the long-term average annual flow.
Table 4. Hay and Slave river water quantity monitoring sites for assessment of interim triggers and objectives

42 Alberta-Northwest Territories Bilateral Management Committee Annual Report to Ministers 2016-17
Water quality monitoringThe primary goals of monitoring transboundary surface water quality are to track changes in water quality over time, determine anthropogenic and natural drivers for changes in water quality, and help to ensure that water quality is protected for all uses.
The Agreement commits the Parties to support long-term monitoring of surface water quality. Although Alberta and the NWT are each responsible for managing their own risks to water quality, cooperative long-term monitoring and assessment will allow each jurisdiction to identify risks or trends, better enabling jurisdictions to address cumulative effects on aquatic ecosystems.
Current statusTo fulfill the monitoring requirements of the Agreement, ECCC and the GNWT collect surface water quality samples from the Slave and Hay rivers. Monitoring includes the collection of water quality samples for the analysis of physical parameters, nutrients, major ions, metals and organic compounds, including pesticides, polychlorinated biphenyls (PCBs) and hydrocarbons.
As a requirement of the Agreement, the BMC annually reviews the surface water quality results from the following monitoring sites:
• Slave River at Fitzgerald,• Slave River at Fort Smith, and• Hay River at the Alberta-NWT border.
Slave River monitoring programIn 2016, ECCC collected nine surface water quality samples from the Slave River at Fitzgerald. Samples were collected in January, February, March, May, June, July, August, September and October. Also, in 2016, the GNWT collected three water quality samples from the Slave River at Fort Smith in June, July and September.
Hay River monitoring programIn 2016, ECCC collected four water samples from the Hay River near the Alberta-NWT border. Samples were collected in April, May, July and August. Also, in 2016, the GNWT collected three water samples from this monitoring site in June, July and September.
Next stepsThe Parties agreed that there will be no changes to identified monitoring programs or sites for the Hay and Slave rivers at this time.
WORKING TOGETHER TO MANAGE OUR SHARED WATERS 43
CLIMATE CHANGEClimate change can cause challenges for the management of transboundary waters. Changes in the amount of precipitation directly affect the level of the rivers and the level of the water table in aquifers.
Changes in timing of precipitation (rain and snow) affect seasonal stream flow, while changes in intensity and amount of precipitation have an effect on erosion rates and water quality (e.g. lack of water quantity can cause increasing concentrations of various water quality parameters). Climate change can also affect ice formation and break up as well as water temperature.
The effects of climate change are more drastic in permafrost regions where the thawing of permafrost can lead to the drainage of lakes, emergence of thermokarsts and new stream flow patterns as well as changes to water quality.
Climate change also can affect forest fire frequency, vegetation, wildlife distribution and weather events.
The Agreement does not have one specific section that addresses the effects of climate change; the entire Agreement is intended to be responsive to a changing climate. Its commitments are designed to be adaptive and responsive to new information and changing conditions, including information related to climate change. The commitments that address climate change impacts are:
• Water quantity interim triggers and objectives are a percentage of flow, accounting for whether flow increases or decreases.
• Protective and precautionary water quantity and quality objectives have been set, or will be set when needed, to maintain aquatic ecosystem health and to allow the Parties the flexibility to adapt to climate change impacts as they occur.
• Bilateral management under the RIM approach is based on the most up-to-date knowledge, including information about climate impacts.
• Classification of water bodies accounts for the risk from climate change.
• Continual monitoring at the borders and other priority locations in the Mackenzie River Basin helps to assess the impacts of climate change on the health of the basin.
• Proactive identification of research needs will continue in support of bilateral management, including research on climate change.
Current statusOngoing monitoring of water quality, quantity and snow contributes to the ability to assess impacts of climate change. The GNWT expanded its hydrometric network by two stations (Rat River near Fort McPherson and Johnny Hoe River above Lac Ste. Therese); this and further expansion will contribute to better understanding of climate changes in the NWT portion of the Mackenzie River Basin.
The Mackenzie River Basin Hydraulic Model updates increase basin-wide understanding of climate influences on flows and water levels versus water use impacts. However, further updates to the model are required to enhance its performance at simulating complexities in flows through the Peace-Athabasca Delta and Great Slave Lake to further increase our understanding of cumulative effects.

44 Alberta-Northwest Territories Bilateral Management Committee Annual Report to Ministers 2016-17
The GNWT is developing an NWT Climate Change Strategic Framework to guide the GNWT’s approach to climate change. To gather input towards the development of the NWT Climate Change Strategic Framework, six regional engagement workshops took place between November 2016 and March 2017. The workshops were held jointly by ENR and the Department of Infrastructure, who was seeking input on the NWT Energy Strategy. A public survey, comprised of climate change and energy-related questions, was also available for completion until January 2017.
The Government of Alberta has implemented The Climate Leadership Plan (CLP) – a made-in-Alberta strategy that brings together government, business, industry and the public to diversify the economy, create jobs and reduce greenhouse gas emissions (GHG) that cause climate change. The Climate Change Leadership Plan Progress Report can be found at www.alberta.ca/climate-leadership-plan.aspx. This Progress Report includes:
• A description of what Alberta is working to achieve – CLP outcomes in the short, medium and long term.
• An update on what Alberta is achieving in its one- to five-year action areas.
• An update on the programs and initiatives designed to move towards achieving the CLP outcomes.
Next stepsThe Parties will continue to consider climate change in their monitoring programs under each joint hydrometric agreement with the Government of Canada. The GNWT will continue to expand its hydrometric network to further contribute to better knowledge and understanding of climate changes in the NWT portion of the Mackenzie River Basin.
The Parties will continue discussions to develop a scoping study to examine the potential methods, feasibility and benefits of a broader study to inform the BMC about how to account for the effects of climate change in the setting and monitoring of transboundary objectives. Collaborative research and studies will be discussed at the Mackenzie River Basin Board level.

WORKING TOGETHER TO MANAGE OUR SHARED WATERS 45
CONCLUSIONConsiderable collaboration took place between the governments of Alberta and the NWT in 2016-17 to implement the Agreement.
This collaborative work led to significant learning and accomplishments, with focus on reporting as well as confirmation of decision making mechanisms. Classification of shared water bodies has not changed. Elements of learning plans for the Slave and Hay rivers are well underway. Key accomplishments included:
• In support of implementation commitments, the BMC established a joint implementation fund, with financial commitments from each jurisdiction over the next three to five years.
• Assessment of the 2016 water quantity data for the Hay and Slave rivers identified no concerns. 2016 allocation data for the Slave River showed consumptive use was well below the annual consumptive use threshold of 2 billion cubic metres. For the Hay River, Trigger 1 was exceeded in January, February and March. Trigger 2 was not exceeded in any month. There were no new minimum flows for the Slave River; however, new maximum flows were reached on days in December. No new minimum or maximum flows were reached for the Hay River; however, high flows approached historic maximums in late June.
• Assessment of the 2016 water quality data for the Hay and Slave rivers identified no concerns. Hay River water quality results show five of 41 parameters (5 of 164 results) had values above Trigger 2; none of these parameters were above their respective historical seasonal maximum values. Slave
River water quality results for 2016 revealed new overall maximum values for seven parameters. The new maximum values occurred in June following the spring freshet. Water quality sampled in the later months was within the historical seasonal ranges for all parameters.
• The Mackenzie River Basin Hydraulic Model was updated with data up to December 2015 and an update report was prepared with recommendations to enhance model performance.
• Priorities for implementation of groundwater commitments were identified, including delineation of shared groundwater areas, improved information on immediate and proposed developments in groundwater areas, and identification of monitoring priorities.
• An annotated bibliography of relevant biological monitoring on the Slave and Hay rivers was completed, along with a summary of previous biological indicators work undertaken in the Mackenzie River Basin.
• A workshop took place to better understand biological indicator-related activities in Alberta’s lower Athabasca region and how they may relate to the Agreement.
• Preparation and planning for a field program took place to test different methods of sampling benthic macroinvertebrates on large rivers.

46 Alberta-Northwest Territories Bilateral Management Committee Annual Report to Ministers 2016-17
To further pursue commitments in the Agreement, the BMC is following a multi-year work plan. Work planned for the next few years include:
• Discuss and refine methodologies to better understand consumption throughout the Hay River Basin and to refine natural flows of the Hay River.
• Continue tracking and reporting on flow conditions for both the Slave and Hay rivers for reporting.
• Monitor and report on surface water quality by jointly reviewing and assessing the Slave and Hay rivers water quality data. Address methodological questions about interim water quality triggers. Continue to collect mercury samples from the Slave and Hay rivers to establish interim water quality triggers for mercury.
• Confirm whether the levels of dissolved magnesium and nitrate/nitrite in the Slave River are changing.
• Work towards consistent methods to derive water quality triggers and objectives.
• Continue efforts to refine biological indicators and develop a biological monitoring plan for the Hay and Slave rivers.
• Test methods to sample benthic macroinvertebrates in the Slave and Hay rivers.
• Discuss the development of a scoping study to consider the effects of climate change in setting and monitoring transboundary objectives.
• Define shared groundwater areas and develop best practices to determine groundwater flow and groundwater monitoring.
• Identify and implement ways to synthesize and blend traditional and local knowledge, western science and social science, and other forms of knowledge relevant to setting and assessing transboundary water objectives.
The BMC looks forward to continued cooperation and collaboration, and continues to take all reasonable actions to meet the commitments of the Agreement and sustain the spirit under which it was signed.

WORKING TOGETHER TO MANAGE OUR SHARED WATERS 47
Links to source materialsAlberta-NWT Bilateral Water Management Agreement: http://www.enr.gov.nt.ca/sites/enr/files/ab-nwt_water_management_agreement_final_signed_2.pdf
Appendices to the Alberta-NWT Mackenzie River Bilateral Water Management Agreement: http://www.enr.gov.nt.ca/sites/enr/files/bwma_ab-nt_appendices_24_february_2015.pdf
2016 Water Quality Report for the Slave and Hay Transboundary Rivers: Online at www.aep.alberta.ca and www.enr.gov.nt.ca
ReferencesAlberta Government. 2016. Mercury in Fish in Alberta Water Bodies 2009-2013. Alberta Health, 2016. Retrieved at: https://open.alberta.ca/dataset/d48f8329-da01-4612-879b-877662f8b8d8/resource/45d32958-9c84-4303-8d9b-7be42f3527c2/download/2016-Mercury-Fish-Alberta-2009-13.pdf.
Bujold, R. 1995. Fish tissue quality report 1994/1995 Hay River Northwest Territories. Prepared for Environment Canada and Alberta – NWT Transboundary Rivers Aquatic Quality Program.
Cott, P., S. Goodman, and R. Gregory. 2016. Concentrations of mercury and other heavy metals in furbearers from the Slave River. NWT Environmental Research Bulletin (NERB) 1(3):2.
Dagg, J. 2016. State of Knowledge of the Slave River and Slave River Delta. A component of the vulnerability assessment of the Slave River and Delta. Final report April 2016. The Pembina Institute.
APPENDIX

48 Alberta-Northwest Territories Bilateral Management Committee Annual Report to Ministers 2016-17
Grey, B.J., S.M. Harbicht, and G.R. Stephens. 1995. Mercury in fish from rivers and lakes in the southwestern Northwest Territories. Department of Indian and Northern Affairs and Department of Fisheries and Oceans. Catalogue No. R71-48/4-1995E.
Lyttle, C, K. Wilcox. 2012. Hay-Whites and Watersheds Fish Sustainability Index: Artic Grayling Assessment. 2010 Progress Report. Alberta Sustainable Resource Development, June 2012.
Pomeroy B., et al. 2015. Notropis hudonius (Spottail Shiner) and Notropis atherinoides (Emerald Shiner) as Small-bodied Fish Biomonitoring Species in Northern Canadian Waters. Wilfrid Laurier University. Not published.
Poole, K.G., B.T. Elkin, and R.W. Bethke. 1998. Organochlorine and heavy metal contaminants in wild mink in western Northwest Territories, Canada. Archives of Environmental Contamination and Toxicology 34(4):406-13. DOI: 10.1007/s..2449900337.
Sanderson, J. (Pebble), C. Lafontaine, and K. Robertson. 1997. Slave River Environmental Quality Monitoring Program: Final five-year study report, 1990-1995. Yellowknife, NWT: Indian and Northern Affairs Canada, Water Resources Division, and Government of the Northwest Territories, Department of Resources, Wildlife and Economic Development.
Stantec Consulting Ltd. 2016. State of Aquatic Knowledge for the Hay River Basin. Government of the Northwest Territories, Department of Environment andNatural Resources.
Steenbergen, C., C. Lyttle, and K. Wilcox. 2012. Melvin River Watershed and Slavey Creek Watershed Stream Inventory, Fall, 2012. Alberta Environment and Sustainable Resource Development. November 2012.
Stewart, D.B. and G. Low. 2000. A Review of Information on Fish Stocks and Harvests in the Dehcho Area, Northwest Territories. Canadian Manuscript Report of Fisheries and Aquatic Sciences 2549.
AcknowledgementsA special thank you to Environment and Climate Change Canada for their continued, long-term operation of the important water quality and hydrometric sites on the Slave and Hay rivers, and throughout the Mackenzie River Basin.


![Accountable Government: A Guide for Ministers and Ministers ......2011/05/27 · Accountable government: a guide for ministers and ministers of state Annual (irregular) [2003]- Text](https://img.pdfslide.net/doc/110x75/60dbf72e48bc3559e537dc8c/accountable-government-a-guide-for-ministers-and-ministers-20110527-.jpg)