Embed Size (px)
Citation preview

2016-17 Operating and Capital Budgets
March 21, 2016
Annex 1


Page 1
Western University
2016-17 Budget Highlights A. Introduction Western’s 2016-17 Operating and Capital Budgets lead us to the second year of the 4-year budget plan spanning the period 2015-16 to 2018-19. This budget builds on the multi-year plan developed last year in the context of our Strategic Plan – Achieving Excellence on the World Stage – and with reference to the priorities outlined in the Faculty Academic Plans and the Support Unit Operational Plans. The budgetary context is one of continued uncertainty and a period of constrained growth in revenues. The future of our two major sources of revenue – government grants and tuition fees – are under review/consideration by the Province. B. The 2016-17 Operating Budget Revenues The 2016-17 Operating Budget projects total revenue of $728.5 million – which is based on stable government grants, the current tuition framework which allows for an overall increase of 3% for domestic students, and stable undergraduate enrolment and modest growth in graduate enrolments.
Projected 2016-17 Operating Revenues(Total = $728.5M)
38.8%
48.8%
12.4%
Government Grants Tuition All Other

Western University: Highlights of the 2016-17 Operating and Capital Budgets March 21, 2016
Page 2 of 4
Expenditures Total expenditures for 2016-17 are projected to be $732.4, and include the following investments in new initiatives and priorities: Support for our Long-Range Space Plan – specifically to create additional student-centered
teaching, learning, and innovation spaces through the construction of the Integrated Learning and Innovation Centre – through an investment of $15 million one-time.
The self-funding multi-year Engineering Expansion Plan that will result in expansion of enrolments and faculty/staff complements, and the construction of a new building. In 2016-17, a sum of $800,000 in base funding and $5.5 million in one-time funding (to support the building project) are recommended.
Support for Scholarship/Research Initiatives in the SSHRC Disciplines has been identified as a high priority. In 2016-17, a total $5.2 million in one-time funding is being recommended – which is comprised of $5 million to create an endowment (which will yield an annual amount of $200,000 starting in 2017-18) and $200,000 for spending in 2016-17.
As signaled in our Campus Master Plan (approved in June 2015), we are in the early stages of a multi-year plan to transform our campus into a pedestrian-friendly and safe campus. In support of this, a sum of $2 million in one-time funding is being recommended.
In order to help contain utilities costs into the future, a sum of $1.5 million in one-time funding is being invested in campus-wide Energy Conservation Initiatives.
In order to strengthen our Library Acquisitions Budget – which has been significantly impacted by the weakening of the Canadian Dollar – the budget invests $500,000 in base funding and $1.1 million in one-time funding.
In order to better coordinate and expand the University’s Student Entrepreneurship Ecosystem, a sum of $1 million one-time is being recommended.
Growing our endowments is a University priority – and, in support of this, a special provision is being made in this budget. A sum of $500,000 one-time is being recommended to complete the Alice Munro Chair in Creativity in the Faculty of Arts & Humanities.
A sum of $500,000 is being recommended to continue a number of advertising initiatives to support our fundraising campaign and recruitment of students, faculty, and staff.
A number of facilities enhancements and equipment/infrastructure renewals in the Faculties are being supported through the investment of $6.6 million in one-time funding.

Western University: Highlights of the 2016-17 Operating and Capital Budgets March 21, 2016
Page 3 of 4
The Provost’s Taskforce on University Budget Models (January 25, 2016) concluded that strong support remains for Western’s current hybrid budget model – and its ability to evolve over time and to adopt various components found in Incremental, RCM, and Performance-based models. The recommendations in this budget continue with the underlying principles that drive our current model: maintain high student and educational quality in the context of a research-intensive university. A high-level breakdown of the expenditure recommendations is as follows:
2016-17 Operating Expenditures(Total = $732.4M)
65.9%
4.4%
13.2%
10.0%
6.5%
Faculties Base + One-Time Centrally-Funded Student Aid
Support Units Base + One-Time University-Wide Expenditures
All Other
C. The 2016-17 Capital Budget The Capital Budget supports our Long-Range Space Plan which involves a number of high priority projects. Funding for the Capital Budget in 2016-17 is derived from the following sources: Government Grants ($11.2 million), transfers from the Operating Budget – including unit budgets ($55.6 million), fundraising ($2.6 million), borrowing ($21.9 million), and self-funded or ancillary operations ($19.9 million). Capital Expenditures are projected to be $134.4 million in 2016-17, with a breakdown as follows: $55.7 million in support of new construction, which includes the new academic building to
house the Faculty of Information and Media Studies and Nursing, completion of the Music Building Project, the Western Interdisciplinary Research Building, and the New Engineering Building.

Western University: Highlights of the 2016-17 Operating and Capital Budgets March 21, 2016
Page 4 of 4
$25.9 million in support of major renovation projects, which includes modernization of University College, re-alignment of medical school research facilities, and renewal of instructional facilities in the Faculty of Education.
$8.5 million for utilities and infrastructure projects.
$9.8 million associated with the modernization/adaptation of instructional and research facilities across campus.
$10.7 million for general campus maintenance projects.
$13.6 million in support of renewal in our residences.
$10.2 million for all other capital expenditures – which includes carrying costs and debt repayment.

Western University: 2016-17 Operating and Capital Budgets March 21, 2016
Table of Contents
2016-17 Operating Budget ................................................................................. Pages 1 to 38
A. Planning and Budgetary Context ........................................................................................1
B. Updates on Priorities and Initiatives from Last Year’s Budget .....................................4
C. Priorities for the 2016-17 Budget and New Initiatives ......................................................7
D. Four-Year Operating Budget Forecast ...........................................................................12
E. Summary of the 2016-17 Operating Budget.....................................................................13
Table 1: Four-Year Operating Budget Outlook ..........................................................14
Table 2: Summary of the 2016-17 Operating Budget.................................................15
F. Details of the 2016-17 Operating Revenue Forecasts ....................................................16
Government Grants .....................................................................................................16
Tuition Fees .................................................................................................................16
All Other Revenues .....................................................................................................16
G. Details of the 2016-17 Expenditure Recommendations...................................................18
1. Faculty Budget Recommendations ........................................................................18
2. Scholarships and Bursaries......................................................................................21
3. Support Unit Budget Recommendations.................................................................21
4. University-wide Expenditures.................................................................................22
5. One-Time Recommendations..................................................................................23
Table 3: Operating Revenues ......................................................................................24
Table 4: Base Budgets for Faculties ...........................................................................25
Table 4a: Revenue Sharing Allocations for the Faculties.............................................26
Table 4b: 2015-16 Faculties’ Budgets Presented Last Year
Compared to Actual Final Budget ................................................................27
Table 5: Scholarships and Bursaries ...........................................................................28
Table 6: Base Budgets for Support Areas ...................................................................29
Table 7: University-wide Expenditures ......................................................................30
Table 8: One-Time Allocations...................................................................................31
Table 9: Canada Research Chairs ...............................................................................32
Table 10: Research Infrastructure Support Fund ..........................................................33
Table 11: Undergraduate Tuition Fees..........................................................................34
Table 12: Graduate Tuition Fees...................................................................................35
Table 13: Summary of Enrolment Forecast ..................................................................36
Table 14: Update to Western’s Long-Range Space Plan..............................................38

Western University: 2016-17 Operating and Capital Budgets March 21, 2016
Table of Contents (cont’d)
2016-17 Capital Budget ..................................................................................... Pages 39 to 49
A. The Evolution of Capital Expenditures ............................................................................39
1. New Construction....................................................................................................40
2. Major Building Renovations ...................................................................................40
3. Utilities and Infrastructure Projects.........................................................................40
4. Modernization of Instructional and Research Facilities..........................................40
5. General Maintenance and Modernization Projects .................................................40
6. Housing Renovations ..............................................................................................40
7. Ancillary Projects ........……………………………………………………………41
8. Carrying Costs and Debt Repayments.……………………………………………41
9. Other Capital Expenditures .................……………………………………………41
B. Sources of Funding and Capital Expenditures in 2016-17..............................................42
Capital Budget Tables …….………………………………………………………..……...44 to 49
Table 15: Capital Budget Summary, 2012-13 to 2016-17 …………………………….......44
Table 16: Major Capital Projects ……….. ..…………… ………………………………...45
Table 17: Capital Budget Sources of Funding …………..………………………………...46
Table 18: Capital Expenditures for New Construction and Major Building
Renovations: 2015-16 and 2016-17……..…….……………………………..….48
Table 19: Capital Reserves and Debt at Fiscal Year-End ..……….……………………….49
Long-Term Financial Trends .............................................................................. Pages 50 to 55
A. Capital Reserves and Debt .. ..............................................................................................50
B. Employee Future Benefits ..................................................................................................53
C. Deferred Maintenance ........................................................................................................54
Western University: 2016-17 Operating and Capital Budgets March 21, 2016
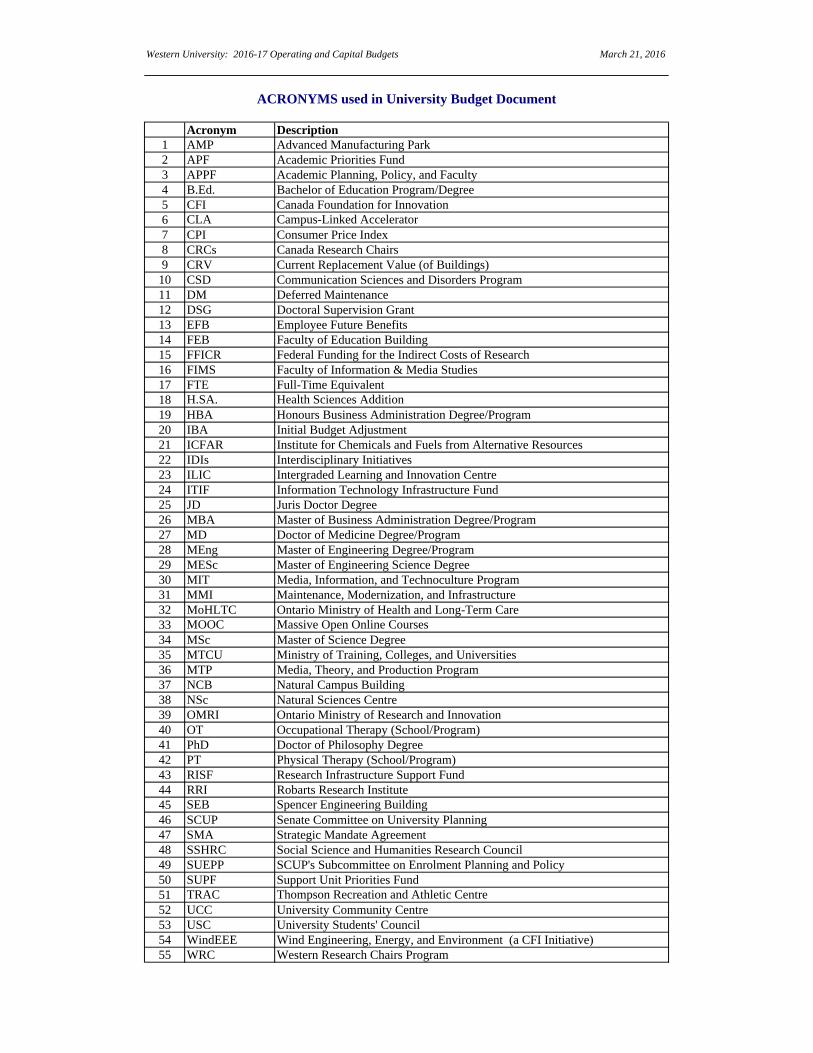
Acronym Description1 AMP Advanced Manufacturing Park2 APF Academic Priorities Fund3 APPF Academic Planning, Policy, and Faculty4 B.Ed. Bachelor of Education Program/Degree5 CFI Canada Foundation for Innovation6 CLA Campus-Linked Accelerator7 CPI Consumer Price Index8 CRCs Canada Research Chairs9 CRV Current Replacement Value (of Buildings)
10 CSD Communication Sciences and Disorders Program11 DM Deferred Maintenance12 DSG Doctoral Supervision Grant13 EFB Employee Future Benefits14 FEB Faculty of Education Building15 FFICR Federal Funding for the Indirect Costs of Research16 FIMS Faculty of Information & Media Studies17 FTE Full-Time Equivalent18 H.SA. Health Sciences Addition19 HBA Honours Business Administration Degree/Program20 IBA Initial Budget Adjustment21 ICFAR Institute for Chemicals and Fuels from Alternative Resources22 IDIs Interdisciplinary Initiatives23 ILIC Intergraded Learning and Innovation Centre 24 ITIF Information Technology Infrastructure Fund25 JD Juris Doctor Degree26 MBA Master of Business Administration Degree/Program27 MD Doctor of Medicine Degree/Program28 MEng Master of Engineering Degree/Program29 MESc Master of Engineering Science Degree30 MIT Media, Information, and Technoculture Program31 MMI Maintenance, Modernization, and Infrastructure32 MoHLTC Ontario Ministry of Health and Long-Term Care33 MOOC Massive Open Online Courses34 MSc Master of Science Degree35 MTCU Ministry of Training, Colleges, and Universities36 MTP Media, Theory, and Production Program37 NCB Natural Campus Building38 NSc Natural Sciences Centre39 OMRI Ontario Ministry of Research and Innovation40 OT Occupational Therapy (School/Program)41 PhD Doctor of Philosophy Degree42 PT Physical Therapy (School/Program)43 RISF Research Infrastructure Support Fund44 RRI Robarts Research Institute45 SEB Spencer Engineering Building46 SCUP Senate Committee on University Planning47 SMA Strategic Mandate Agreement48 SSHRC Social Science and Humanities Research Council49 SUEPP SCUP's Subcommittee on Enrolment Planning and Policy50 SUPF Support Unit Priorities Fund51 TRAC Thompson Recreation and Athletic Centre52 UCC University Community Centre53 USC University Students' Council54 WindEEE Wind Engineering, Energy, and Environment (a CFI Initiative)55 WRC Western Research Chairs Program
ACRONYMS used in University Budget Document


Western University: 2016-17 Operating and Capital Budgets March 21, 2016
Page 1 of 55
2016-17 Operating Budget
A. Planning and Budgetary Context The current planning cycle moves us forward to the second year of the 4-year budget plan spanning the period 2015-16 to 2018-19. This budget builds on the multi-year plan developed last year in the context of our Strategic Plan – Achieving Excellence on the World Stage – and with reference to the priorities outlined in the Faculty Academic Plans and the Support Unit Operational Plans. The recommendations in this budget document support the following high-priority areas: Research Excellence and Enhancing our Research Profile – including interdisciplinarity and
Endowed Chairs. Enhancing the Student Experience – including innovations in pedagogy and increased
experiential learning opportunities. Internationalization – including continued expansion of our undergraduate international
enrolments and student mobility. Continuing with Graduate Expansion – with the recruitment of highly-qualified students in areas
of demand and capacity. The budgetary context is one of continued uncertainty and a period of constrained growth in revenues. The Province is in the middle of a review of the University Funding Formula – and there is a
strong possibility that enrolment growth funding may come to an end. The tuition framework beyond 2016-17 has not yet been announced and significant changes have
been announced (in the 2016 Provincial Budget) to the tuition collection/payment mechanisms for Ontario universities.
Undergraduate enrolments at Western are reaching steady-state. Given this uncertain and constrained revenue context, the incremental resources available to us will be much more modest in the coming years than in the last three 4-year cycles. At Western, our multi-year approach to planning serves us well – and we continue to focus our budget planning on our strategic priorities. Our enrolment planning follows the objectives set out in our Strategic Plan: Attract the brightest students as demonstrated through the highest entering grade average. Our
first-year class is expected to be about 5,100 for the remaining three years of the 4-year planning period.
Over time, increase the number of undergraduate international students to 15% of the undergraduate student body. Our plan is to recruit 600 first-year international students.
Increase the number of out-of-province students to at least 10% of the undergraduate student body. Our plan is to recruit 500 first-year out-of-province students.
Increase graduate student enrolment to at least 20% of the total student body. The graduate enrolment plans from the Faculties are projected to take us beyond this threshold by the end of the 4-year planning period.

Western University: 2016-17 Operating and Capital Budgets March 21, 2016
Page 2 of 55
Our approach to enrolment planning allows us to make significant enhancements to the quality of education and the educational experience we offer our students: Recruitment of outstanding undergraduate students is a high priority. The average entering grade
of our incoming class in the fall of 2014 was 89.3% – highest in the province, and well above the Ontario average.
Nearly 93% of our first-year students continue into their second year. Our retention rates are amongst the highest in Canada and much higher than at our peer institutions in the United States.
Graduation rates of our undergraduate students have been steadily increasing – and they are currently much higher than the rates at our peer universities in Canada and the United States. Over 82% of Western’s 2008-09 entering cohort graduated within 6 years.
Our efforts in undergraduate international enrolment expansion resulted in nearly 10% of our fall 2015 first-year class coming from other countries.
Expansion of graduate enrolments (in areas of demand and capacity) continues to be a strategic priority at Western. The current plans from the Faculties show significant growth aspirations. In the current year, full-time graduate students comprise 18.6% of total full-time enrolment.
Results of exit surveys and course/instructor evaluations at Western indicate that our students rate their courses, instructors, and the quality of their education very high.
We remain committed to building on the substantive gains we have made in the areas of student quality, educational quality, and the students’ educational experience. Going forward, we will continue to manage our resources and target them towards our highest priority – Achieving Excellence on the World Stage.
Figure AAverage Entering Grades of New Full-Time 1st Year Students
75%
78%
81%
84%
87%
90%
85-8
6
86-8
7
87-8
8
88-8
9
89-9
0
90-9
1
91-9
2
92-9
3
93-9
4
94-9
5
95-9
6
96-9
7
97-9
8
98-9
9
99-0
0
00-0
1
01-0
2
02-0
3
03-0
4
04-0
5
05-0
6
06-0
7
07-0
8
08-0
9
09-1
0
10-1
1
11-1
2
12-1
3
13-1
4
14-1
5
Western
Ontario

Western University: 2016-17 Operating and Capital Budgets March 21, 2016
Page 3 of 55
Figure BTotal FTE Enrolment at Western
20,000
22,500
25,000
27,500
30,000
32,500
35,000
90-9
1
91-9
2
92-9
3
93-9
4
94-9
5
95-9
6
96-9
7
97-9
8
98-9
9
99-0
0
00-0
1
01-0
2
02-0
3
03-0
4
04-0
5
05-0
6
06-0
7
07-0
8
08-0
9
09-1
0
10-1
1
11-1
2
12-1
3
13-1
4
14-1
5
15-1
6
16-1
7
17-1
8
18-1
9
19-2
0
20-2
1
Projection
Figure CFull-Time Year 1 Undergraduate International Enrolment at Western
141
212
146
113101
122 120146
347
476
532 527508
550
0
50
100
150
200
250
300
350
400
450
500
550
600
650
03-04 04-05 05-06 06-07 07-08 08-09 09-10 10-11 11-12 12-13 13-14 14-15 15-16 16-17p

Western University: 2016-17 Operating and Capital Budgets March 21, 2016
Page 4 of 55
B. Updates on Priorities and Initiatives from Last Year’s Budget The following initiatives were included in the 2015-16 Budget, and involved substantial investments. 1. Long-Range Space Plan
Our long-range approach to space/facilities/capital planning identified a number of high priority projects which are central to our educational priorities. Due to limitations in targeted capital funding from external sources (such as government or fundraising), we look to borrowing (while adhering to the Board of Governors’ debt policy) and support from the Operating Budget to allow us to move forward with priority projects. In recognition of this, a sum of $10 million in one-time funding was allocated in last year’s budget in support of our Long-Range Space Plan. The funding has allowed us to move forward with the University College Renovations Project, which is currently in the design stage. 2. Support for our Fundraising Campaign – the Endowed Chairs Matching Program Our Strategic Plan – Achieving Excellence on the World Stage – sets out a target of adding 100 research chairs, including 50 endowed chairs, in areas of strength. In support of this priority, last year’s budget set aside a sum of $7.5 million in one-time funding to allow us to pursue private donations aimed at creating new endowed chairs which support our Faculties’ academic priorities. This allocation supplemented previous similar allocations, bringing the total over the last six years to $43.5 million – for the University matching component of our endowed chairs matching program. To-date, 16 chairs have been confirmed through the matching program – with the support of $25 million from the $43.5 million fund. The Vice-President External is currently in discussions with prospective donors regarding a number of other endowed chair opportunities. 3. Interdisciplinary Initiatives (IDI)
Support for and promotion of Interdisciplinary Initiatives – by fostering activities that transcend academic disciplines and create new areas of scholarship – continues to be of high priority at Western. Since 2007-08, a total of over $5 million has been allocated in support of outstanding interdisciplinary proposals from across the campus. Last year’s budget announced the continuation of the IDI Program – with the allocation of $4 million in one-time funding which was partitioned from the $30 million committed in the 2012-13 University Budget in support of our research priorities. A call for proposals was issued in the spring of 2015 with a commitment to spend up to $1 million (of the total $4 million) in 2016-17. Eighteen proposals were received seeking a total of $6.5 million in support – and the selection committee has recommended the following four projects for partial funding:
$350,000 over three years for “Applied Indigenous Scholarship” – led by Professor Chantelle Richmond, Faculty of Social Science
$200,000 over three years for “Global Mental Health Incubator for Disruptive Solutions” – led by Professor Arlene MacDougal, Schulich School of Medicine & Dentistry
$200,000 for “Mary J. Wright Centre for Research and Education at Merrymount” – led by Professor Vicki Schwean, Faculty of Education
$200,000 for “Smart Healthy Campus” – led by Professor Kevin Shoemaker, Faculty of Health Sciences

Western University: 2016-17 Operating and Capital Budgets March 21, 2016
Page 5 of 55
4. Expansion of the Teaching Fellows Program The 2013-14 University budget initiated the Teaching Fellows Program by allocating $250,000 in base funding, with the ultimate goal of appointing one teaching fellow per Faculty. The Teaching Fellows are appointed from within our faculty colleagues who have outstanding credentials in teaching. They initiate and coordinate Faculty-specific programming to respond to the teaching and learning needs of individual instructors, departments, schools, and disciplines on innovation in curriculum development, technology-assisted learning, and on-line course/program delivery. Last year’s budget supplemented the funding for the program with an additional $250,000 base allocation – bringing the total to $500,000. At this point in time, eight Faculty-specific Teaching Fellows and three University-wide Teaching Fellows have been appointed. The Teaching Fellows undertake research on teaching and share the outcomes widely, contributing to teaching innovation across Western. 5. Support for our Fundraising Campaign – Advertising Initiatives Last year’s budget committed $500,000 in one-time funding in support of our fundraising campaign. The funds were used to support the Be Extraordinary Campaign that featured more than thirty outstanding alumni to promote Western’s development of leaders – through advertisements in print and on-line versions of national newspapers and the installation of banners across campus. These initiatives also assist us with student, faculty, and staff recruitment. 6. Energy Conservation Initiatives The University’s utilities costs – after recoveries from ancillary operations – currently exceed $23 million. Our projections are that costs will continue to increase in the future at rates above CPI. In order to help contain utilities costs in the future, last year’s budget allocated $1.5 million in one-time funding in support of University-wide Energy Conservation Initiatives. These funds have been invested in campus-wide infrastructure projects such as insulation improvements, fume hood infrastructure enhancements, and upgrades to chilled water distribution systems. These projects will reduce electricity, water, and natural gas consumption – and the projected “payback” period for the $1.5 million investment is less than four years. 7. Strategic Expansion of High-Demand Undergraduate Programs: Engineering Our Strategic Plan sets out the objective of attracting the brightest students as demonstrated through the highest entering grade average. Western’s approach to direct-entry undergraduate program admissions has placed high priority on maintaining and increasing entrance standards. In recent years, the minimum entrance requirements for high-demand limited-enrolment programs have continued to increase. One such program is Engineering – where demand for entry from very high quality applicants continues to increase. As an outcome of last year’s planning process, the Provost and the Dean of Engineering discussed the concept of a long-range self-funding enrolment, budget, complement, and space/facilities expansion plan. Last year’s budget signaled this initiative. Over the past year, the Provost and the Dean of Engineering have worked through and reached agreement on a multi-year fully self-funding plan with the following elements:

Western University: 2016-17 Operating and Capital Budgets March 21, 2016
Page 6 of 55
First-year intake into Engineering will be set at 580 students – an increase of 150 relative to the 2013-14 level of 430
All the revenues resulting from this increase and the associated flow through will be invested as follows:
o Base allocations to Engineering to support expansion of faculty and staff complements and associated non-salary costs
o Funding to support the construction of a new building and all associated operating costs o Revenue sharing allocations to other Faculties to support the teaching of the incremental
Engineering students o All other central costs – including student aid, student services, and IT infrastructure
It should be noted that this initiative results in expansion of our overall first-year class to 5,110 students (see line 79 of Table 13). The Engineering expansion does not impact the collective level of intake into all other Faculties.

Western University: 2016-17 Operating and Capital Budgets March 21, 2016
Page 7 of 55
C. Priorities for the 2016-17 Budget and New Initiatives 1. Long-Range Space Plan The University’s space/facilities requirements to support our academic priorities are reviewed as part of our integrated approach to planning. The updated Long-Range Space Plan is summarized in Table 14. The need for additional student-centered teaching, learning, and innovation spaces was identified as a priority in our space plan in last year’s budget. The need was reaffirmed as “high priority” in the most recent planning cycle, and therefore it is recommended that we begin planning for the construction of a new facility – the Integrated Learning and Innovation Centre (ILIC). The facility will house a wide array of student-centered spaces – including smart classrooms, student collaborative and study spaces, and student service operations. In order to start this project, it is recommended that a sum of $15 million in one-time funding be allocated in 2016-17. This funding will allow us to begin the initial planning for spaces in the facility – and will also help us leverage other funding sources such as private donations, governments, and student fees. It should also be noted that, depending on the overall budgetary situation, further allocations from the operating budget may be recommended in future years. Category 1 of Table 14 lists the projects that are currently under way or are being recommended to move forward as part of this budget. Category 2 lists projects that are in various planning stages – and includes a new item, the construction of Multi-Level Parking Structures which was signaled in our Campus Master Plan. Due to constraints in the amount of buildable land on our campus, our new buildings are being constructed on parking lots – thus increasing the pressure on available parking. In addition, campus expansion (buildings and people) has led to increased vehicular traffic on our campus – which in turn is raising concerns about pedestrian safety. In order to respond to parking needs and to reduce traffic through/on campus (which will help us move towards a pedestrian-friendly and safer campus), we are exploring options for the construction of parking garages in the periphery of campus – including location, funding plan, and the required parking fee rates to finance the structures. Our initial assessment indicates that, in the near future, we will need to re-align our parking lot categories and fee rates – including a multi-year plan to increase parking fee rates. 2. Strategic Expansion of Engineering As noted above (in section B.7), the Provost and the Dean of Engineering have developed a self-funding multi-year plan that will result in expansion of enrolments, faculty/staff complements, and the construction of a new building. In 2016-17, the direct allocations associated with this strategic initiative are: $2,999,357 in base funding to the Engineering budget (Table 4, line 4, column e). This includes
the transfer of $2.2 million in undergraduate revenue sharing to base budget. Going forward, Engineering will not receive undergraduate revenue sharing allocations – but will receive annual base allocations through this multi-year expansion plan.
$5,543,126 in one-time funding to the Capital Budget (Table 8, line 2) as part of the multi-year transfer to finance the new building.

Western University: 2016-17 Operating and Capital Budgets March 21, 2016
Page 8 of 55
3. Support for Scholarship/Research Initiatives in the SSHRC Disciplines Discussions during the recently-completed planning process identified the need to provide additional targeted internal resources to support scholarship and research initiatives in the SSHRC disciplines. In order to support this priority, it is recommended that $5 million in one-time funding be allocated to create an endowment that will yield an annual amount of $200,000 (i.e. the equivalent of base funding). The first $200,000 from this endowment will not be available until 2017-18. Therefore, in order to have the resources available in 2016-17, it is recommended that an additional $200,000 one-time be allocated to spend in the upcoming year – bringing the total one-time allocation to $5.2 million. The Vice-President (Research) will work through the University Research Board and consult with stakeholders to develop terms of reference for this fund, and to implement the specific programs. 4. Pedestrian-Friendly and Campus Safety Initiatives As noted earlier (in section C.1.), campus expansion (buildings and people) has resulted in increased vehicular traffic on campus – which in turn has raised concerns about pedestrian safety within our campus. As signaled in our Campus Master Plan, we are in the early stages of a multi-year plan to transform our campus into a pedestrian-friendly and safe campus – including reducing/eliminating vehicular traffic, improved pedestrian and bicycle access, and moving parking to the periphery of campus. As part of the initial steps in the transformation of our campus, we are looking at new/improved safety-related signage and traffic calming and vehicle speed reduction initiatives. In support of these initiatives, it is recommended that a sum of $2 million in one-time funding be allocated in 2016-17. As we move forward in future years, towards the ultimate goal of a Pedestrian-friendly and Safe Campus, we will require further budgetary investments. 5. Energy Conservation Initiatives As noted earlier (in section B.6.), energy conservation is a priority for the University. In order to help contain utilities costs into the future, last year’s budget allocated $1.5 million in one-time funding in support of University-wide Energy Conservation Initiatives. It is recommended that a similar amount (another $1.5 million one-time) be allocated in the 2016-17 Budget. These funds will be invested in campus-wide infrastructure projects that will result in reduced energy and water consumption. 6. Strengthening our Library Acquisitions Budget The weak Canadian Dollar has had a significant impact on the purchasing power of the Library Acquisitions Budget – since nearly 80% of our acquisitions are in U.S. dollars. The estimated impact is equivalent to a reduction of $3 million. The Library Acquisitions Budget is a University priority – and therefore, it is recommended that the Library Acquisitions Base Budget be increased by $500,000 in each of the next three years (as opposed to the previously planned increase of $250,000 per year). In addition, it is recommended that $1.1 million in one-time funding be provided in 2016-17.
Western University: 2016-17 Operating and Capital Budgets March 21, 2016
Page 9 of 55
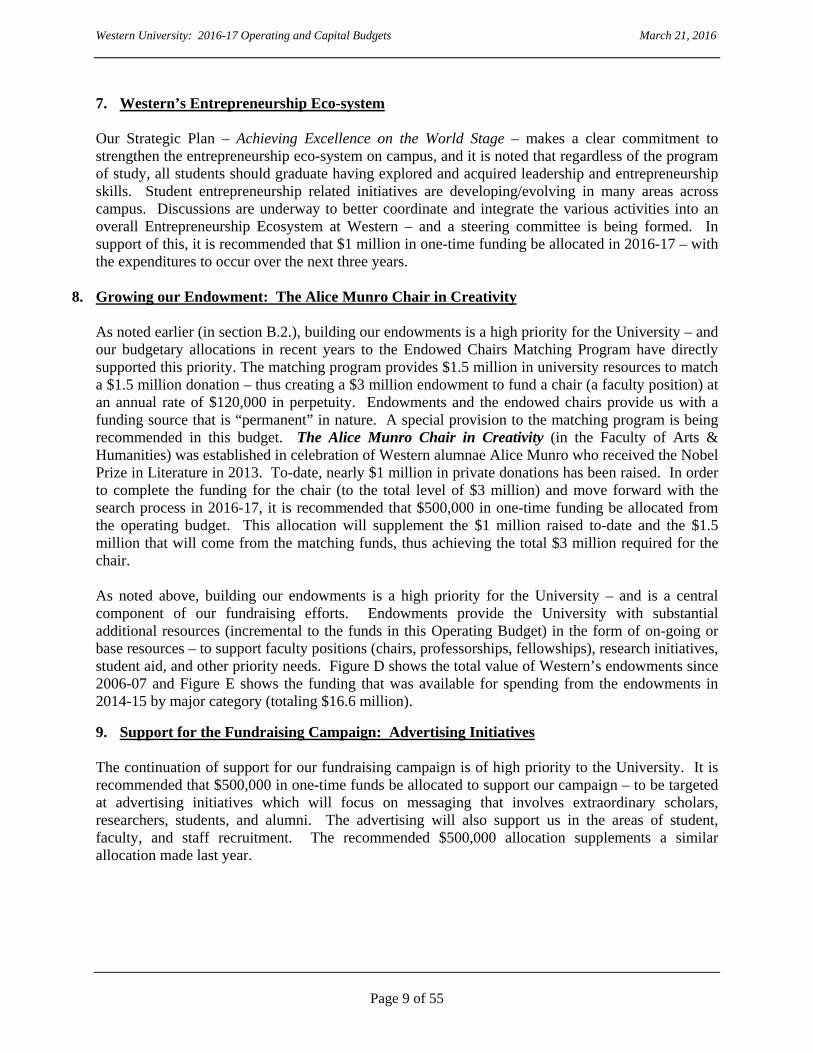
7. Western’s Entrepreneurship Eco-system Our Strategic Plan – Achieving Excellence on the World Stage – makes a clear commitment to strengthen the entrepreneurship eco-system on campus, and it is noted that regardless of the program of study, all students should graduate having explored and acquired leadership and entrepreneurship skills. Student entrepreneurship related initiatives are developing/evolving in many areas across campus. Discussions are underway to better coordinate and integrate the various activities into an overall Entrepreneurship Ecosystem at Western – and a steering committee is being formed. In support of this, it is recommended that $1 million in one-time funding be allocated in 2016-17 – with the expenditures to occur over the next three years.
8. Growing our Endowment: The Alice Munro Chair in Creativity As noted earlier (in section B.2.), building our endowments is a high priority for the University – and our budgetary allocations in recent years to the Endowed Chairs Matching Program have directly supported this priority. The matching program provides $1.5 million in university resources to match a $1.5 million donation – thus creating a $3 million endowment to fund a chair (a faculty position) at an annual rate of $120,000 in perpetuity. Endowments and the endowed chairs provide us with a funding source that is “permanent” in nature. A special provision to the matching program is being recommended in this budget. The Alice Munro Chair in Creativity (in the Faculty of Arts & Humanities) was established in celebration of Western alumnae Alice Munro who received the Nobel Prize in Literature in 2013. To-date, nearly $1 million in private donations has been raised. In order to complete the funding for the chair (to the total level of $3 million) and move forward with the search process in 2016-17, it is recommended that $500,000 in one-time funding be allocated from the operating budget. This allocation will supplement the $1 million raised to-date and the $1.5 million that will come from the matching funds, thus achieving the total $3 million required for the chair. As noted above, building our endowments is a high priority for the University – and is a central component of our fundraising efforts. Endowments provide the University with substantial additional resources (incremental to the funds in this Operating Budget) in the form of on-going or base resources – to support faculty positions (chairs, professorships, fellowships), research initiatives, student aid, and other priority needs. Figure D shows the total value of Western’s endowments since 2006-07 and Figure E shows the funding that was available for spending from the endowments in 2014-15 by major category (totaling $16.6 million).
9. Support for the Fundraising Campaign: Advertising Initiatives The continuation of support for our fundraising campaign is of high priority to the University. It is recommended that $500,000 in one-time funds be allocated to support our campaign – to be targeted at advertising initiatives which will focus on messaging that involves extraordinary scholars, researchers, students, and alumni. The advertising will also support us in the areas of student, faculty, and staff recruitment. The recommended $500,000 allocation supplements a similar allocation made last year.

Western University: 2016-17 Operating and Capital Budgets March 21, 2016
Page 10 of 55
Figure D
Western’s Total Endowment Value -- $M
309 325266
319362 372
432
510
586
0
100
200
300
400
500
600
700
2006-07 2007-08 2008-09 2009-10 2010-11 2011-12 2012-13 2013-14 2014-15
Figure EEndowment Income Available for Spending in 2014-15
(Total = $16.6M)
$5.1M31.0%
$0.7M 4.4%
$8.3M 50.2%
$2.4M14.4%
Chairs/Professorships/Fellowships Research Initiatives Student Aid Other

Western University: 2016-17 Operating and Capital Budgets March 21, 2016
Page 11 of 55
10. Facilities and Equipment Infrastructure Needs in the Faculties
As an outcome of the current planning process, the Faculties brought forward a number of priority needs in the areas of modernization of space/facilities and equipment renewal. In direct response to these needs, a total of $6.6 million in one-time funding is being recommended for the following priorities: Social Science: creation of student space and interdisciplinary research/scholarship space
($1,497,750) Science: modernization of Chemistry Laboratory and creation of space for the Western
Integrated Science Program ($1,924,100) Music: incremental allocation to complete the Music Building Project ($2,000,000) Law: improvements to building systems ($375,000) FIMS: studio instructional equipment renewal and incremental furniture ($440,000) Health Sciences: Nursing simulation equipment renewal and incremental furniture ($375,000)

Western University: 2016-17 Operating and Capital Budgets March 21, 2016
Page 12 of 55
D. Four-Year Operating Budget Forecast We seek approval of the 2016-17 Budget as outlined in this document. The recommendations in this document have been guided by projections of operating revenues and expenditures for the remaining three years of this 4-year planning period. These projections respect the requirement of an operating reserve at the Board-mandated minimum level of $7.5 million at the end of the 4-year cycle. Table 1 summarizes our current forecast for the remaining three years – and the major underlying assumptions are as follows: Revenues Government grant funding commitments for enrolment growth continue in 2016-17. However,
with the funding formula review currently underway, the future of enrolment growth funding may be at risk.
The $750 international student recovery by the Province (which is applied as a base grant reduction) continues in this 4-year planning period.
All other government grant programs continue under the current arrangements.
Enrolment projections and plans (shown in Table 13) underlying the tuition revenue projections
will be achieved.
Expenditures Enrolment-related revenue sharing allocations to the Faculties will continue during this 4-year
planning period, and the projections are shown in Table 4a.
Increases in non-salary costs for major University-wide budget items (e.g. utilities, insurance, IT infrastructure) will be consistent with recent trends and/or known cost escalations.
We need to set aside the necessary funds to cover the operating costs of incremental space in our
new facilities. It should be noted that the Faculties are responsible for covering 50% of the operating costs of incremental space.
Net Position and the Operating Reserve As can be seen in line 34 of Table 1, the Operating Reserve is projected to be at $48.0 million at
the end of the current year (i.e. 2015-16). The reserve is projected to be $9.5 million at the end of the current 4-year planning period (i.e. 2018-19) – above the Board-mandated minimum level of $7.5 million.

Western University: 2016-17 Operating and Capital Budgets March 21, 2016
Page 13 of 55
E. Summary of the 2016-17 Operating Budget Table 2 summarizes the 2016-17 Operating Budget – including total revenues, expenditures by area, net position for the year, and the projected operating reserve. Line 5: Total operating revenues are projected to be $728.5 million in 2016-17 – an increase
of 3.4% over 2015-16. Details of the operating revenues are shown in Table 3. Line 13: Total expenditures are projected to be $732.4 million in 2016-17 – an increase of
5.3% over 2015-16. Details of the expenditures (by area) are shown in Tables 4 through 8.
Line 14: The in-year net position is projected to be a surplus of $8.5 million in 2015-16 and a
deficit of $3.9 million in 2016-17. Line 17: The Operating Reserve is forecast to be $48.0 million at the end of 2015-16 and
$44.1 million at the end of 2016-17.

Western University: 2016-17 Operating and Capital Budgets March 21, 2016
Page 14 of 55
Table 1FOUR-YEAR OPERATING BUDGET OUTLOOK ($M)
2014-15 2015-16 2016-17 2017-18 2018-19
1 REVENUES
2 Government Grants
3 Base Grants 207.3 204.4 204.6 204.5 204.5
4 Undergraduate Accessibility Grant 5.5 6.9 5.0 3.9 1.8
5 Graduate Expansion Fund 11.2 12.9 16.0 17.3 17.3
6 Quality Improvement Fund 10.0 9.9 9.9 9.8 9.8
7 Research-related Grants 11.6 11.6 11.6 11.6 11.6
8 All Other 36.0 35.4 35.4 35.4 35.3
9 Total 281.6 281.1 282.5 282.5 280.3
10 Tuition Revenue 312.3 334.3 355.5 370.4 383.3
11 All Other Revenues
12 Canada Research Chairs (CRCs) 8.0 7.7 7.2 7.2 7.2
13 Recoverable Salaries 27.9 28.3 28.3 28.3 28.3
14 All Other 54.1 52.9 55.0 56.6 58.2
15 Total 90.0 88.9 90.5 92.1 93.7
16 Total Revenues 683.9 704.3 728.5 745.0 757.3
17 EXPENDITURES
18 Faculties
19 Base Budgets 361.4 370.7 370.5 365.7 360.6
20 Revenue Sharing Allocations 17.2 25.3 31.1 40.1 46.0
21 Canada Research Chairs (CRCs) 6.9 6.7 6.3 6.3 6.3
22 All Other 64.4 61.8 61.6 62.5 62.8
23 Total 449.9 464.5 469.5 474.6 475.7
24 Scholarships and Bursaries 29.9 30.8 32.0 34.3 35.9
25 Support Areas 90.7 93.3 93.0 94.5 94.5
26 University-wide Expenditures 66.8 70.8 73.3 76.8 80.6
27 Provision for Cost Fluctuations 0.0 0.0 15.1 29.4 46.1
28 One-Time Allocations 48.5 36.4 49.5 47.0 47.5
29 Total Expenditures 685.8 695.8 732.4 756.6 780.3
30 REVENUES minus EXPENDITURES -1.9 8.5 -3.9 -11.6 -23.0
31 OPERATING RESERVE
32 Beginning Operating Reserve 41.4 39.5 48.0 44.1 32.5
33 Surplus / (Deficit) -- from Line 30 above -1.9 8.5 -3.9 -11.6 -23.0
34 Ending Operating Reserve 39.5 48.0 44.1 32.5 9.5

Western University: 2016-17 Operating and Capital Budgets March 21, 2016
Page 15 of 55
Table 2
SUMMARY OF OPERATING BUDGET: 2016-17
<a> <b> <c>
2015-16 2016-17 $ ChangeBudget Budget from
(@Feb 29, 2016) 2015-16
1 Operating Revenues (Table 3)
2 Government Grants 281,137,698 282,465,925 1,328,227
3 Tuition Revenue 334,337,802 355,517,452 21,179,650
4 All Other 88,805,150 90,523,288 1,718,138
5 Total Revenues 704,280,650 728,506,665 24,226,015
6 Expenditure Budgets
7 Faculties (Table 4) 464,427,019 469,514,651 5,087,632
8 Scholarships and Bursaries (Table 5) 30,826,936 31,963,428 1,136,492
9 Support Areas (Table 6) 93,277,681 93,029,611 -248,070
10 University-wide Expenditures (Table 7) 70,845,177 73,285,794 2,440,617
11 Provision for Cost Fluctuations 0 15,114,302 15,114,302
12 One-Time Allocations 36,438,530 49,507,321 13,068,791
13 Total Expenditures 695,815,343 732,415,107 36,599,764
14 Surplus / (Deficit) - Line 5 minus Line 13 8,465,307 -3,908,442
15 Beginning Operating Reserve Balance 39,533,943 47,999,250
16 Surplus / (Deficit) -- Line 14 above 8,465,307 -3,908,442
17 Closing Operating Reserve Balance 47,999,250 44,090,808
18 Board-mandated Minimum Level Reserve Target 7,500,000 7,500,000

Western University: 2016-17 Operating and Capital Budgets March 21, 2016
Page 16 of 55
F. Details of the 2016-17 Operating Revenue Forecasts (Table 3) Government Grants The major changes in government grants include (a) undergraduate accessibility (i.e. growth) funding decline due to the projected reduction in domestic enrolments and (b) the continuation of graduate expansion funding. Tuition Fees The recommended tuition fee rates for 2016-17 are based on the current Ontario universities tuition framework – and are shown in Tables 11 and 12. Tuition revenue projections are a function of tuition rates and the enrolment forecasts shown in Table 13. As noted earlier, 2016-17 is the final year of the current tuition framework – and our Ministry is currently having preliminary internal discussions regarding the structure of the future framework. Domestic Students Our recommendations for domestic student tuition fees for 2016-17 follow the current framework – which allows for an overall annual increase of 3%. International Students The last six University budgets highlighted the fact that Western’s international student tuition rates were below the average of our peer research-intensive institutions in Ontario – and it was noted that, looking forward, our recommendations for international student tuition will seek to move Western’s tuition rates to the level of our peers. The recommendations for international student tuition fees for 2016-17 continue on the path to narrowing the gap with our peer institutions. All Other Revenues A number of other sources contribute to the University’s Operating Budget. Major items to note are the Canada Research Chairs (CRCs), Transfer from the Affiliated University Colleges, Fundraising associated with Student Financial Aid, Royalties and Licences, and Contributions from Ancillaries and Other Self-funded Operations. Table 9 summarizes the CRC distribution at Western. Our current total allocation is 65 CRCs –
of which, 11 are currently unfilled with searches underway, and 5 are unfilled with nominations for incumbents under review by the CRC program. In addition, some Chairs will shortly become open and searches/nominations are in progress for these. The net effect of this transition is that, in 2016-17, Western will receive $7.2 million in funding support for the 49 CRCs with confirmed incumbents.
The Transfer from the Affiliated University Colleges represents payments for services and teaching provided to their students. The transfer rate for 2016-17 is at the steady-state level of 12% of the Colleges’ grant and tuition revenue.

Western University: 2016-17 Operating and Capital Budgets March 21, 2016
Page 17 of 55
Fundraising for needs-based Student Awards continues to be of high priority to the University. In 2016-17, we project a sum of $6.5 million from this source.
The revenue from Royalties and Licences includes patents/licences associated with the Robarts
Research Institute.
Western’s self-funded operations and ancillary units generate substantial revenue for the University Operating Budget by way of recoveries associated with facilities costs and services provided by the University. The category also includes the payment from the Ivey Business School to the University for services provided by the University to Ivey – a component within the funding model for the Ivey School that was introduced in 2004-05.

Western University: 2016-17 Operating and Capital Budgets March 21, 2016
Page 18 of 55
G. Details of the 2016-17 Expenditure Recommendations 1. Faculty Budget Recommendations Table 4 shows the 2016-17 base budget recommendations for Western’s Faculties. Final 2016-17 base budgets are the net result of the following:
Starting base budgets; The Initial Budget Adjustments (IBA) established as part of the multi-year budget plan; Faculty Turnover Recovery, which returns the greater of $86,000 or 60% of the retiring or
departing member’s salary to the Faculty budget; Academic Priorities Fund (APF) allocations; Targeted government program expansion funding; and Funds associated with CRC positions (detailed in Table 9).
The Initial Budget Adjustment (IBA) – which reduces the base budget by 3% – is applied annually. This adjustment is required to help fund inflationary costs, which are primarily the annual employee salary increases as negotiated through collective bargaining agreements. It is also intended to provide central funding to support institutional priorities. However, in recent years, the IBA has not covered the full cost of annual salary increases. Table 4b illustrates this for the Faculties in the current year (i.e. 2015-16) – where the IBA totals $8.9 million and the annual salary increase allocation totals $13.1 million. The Report of the Provost’s Task Force on University Budget Models (January 25, 2016) suggested that the IBA terminology be changed – and we will review this in the coming year. As an outcome of this planning cycle, in order to provide Faculties with resources to support faculty renewal, the Faculty Turnover Recovery Program is being temporarily suspended. Turnover recovery will be waived for all new tenured/probationary faculty retirements (or exits of faculty members at age 55 or higher) signed between February 1, 2016 and June 30, 2019 – where the faculty member leaves the University by July 1, 2019. Turnover recovery associated with all previous exits – which are currently built into the Faculties’ budget plans – will be applied as planned. The Academic Priorities Fund (APF) shown in line 18 of Table 4 was established in 2011-12. A portion of the APF is being allocated as an outcome of this planning cycle. Recommendations for additional allocations in support of University priorities will be brought forward in future years. The Provost’s APF recommendations are in direct response to requests from the Faculties – and are informed by advice from the Vice-Provosts, in the context of the following considerations:
The Faculty’s overall resource situation relative to enrolments/teaching Plans for program expansion and/or development of new graduate and undergraduate
programs Projected revenue sharing allocations Resources relative to similar programs/Faculties Cost structure variations among disciplines/Faculties Relationship between resources, enrolments, and faculty/staff complements Scholarship/research activities and new initiatives, including interdisciplinary or cross-
Faculty initiatives Previous investments made in the 4-year planning cycle

Western University: 2016-17 Operating and Capital Budgets March 21, 2016
Page 19 of 55
The Faculty-specific APF base recommendations for 2016-17 (shown in column <d> of Table 4) are:
$430,000 to the Faculty of Health Sciences for a tenure-track appointment in Global Health, incremental technical staffing, and to Faculty-wide educational initiatives;
$947,000 to the Faculty of Science for a faculty appointment in Mining, incremental technical staffing in Biology, and support for teaching expansion and research opportunities; and
$1,000,000 to the Faculty of Social Science for two faculty appointments in Sociology, a Faculty-wide Strategic Research Fund, and resources to accommodate enrolment pressures.
As noted earlier (in section C.2.), the multi-year strategic expansion of Engineering will flow a sum of $3 million in base funding to the Engineering budget (Table 4, line 4, column e). This includes the conversion to base funding of $2.2 million in existing undergraduate revenue sharing and a true incremental allocation of about $800,000 associated with the multi-year expansion plan. Going forward, Engineering will not receive undergraduate revenue sharing allocations – but will receive annual base allocations through this multi-year expansion plan. The funding model for the Ivey Business School – introduced in 2004-05 – flows all tuition fees and government grants deriving from the School’s enrolments directly to Ivey. Under this funding model, the Ivey School does not participate in the University’s other funding programs such as the APF or the Research Infrastructure Support Fund (RISF), and the School is responsible for all cost increases – including annual employee salary increases. The School also makes an annual payment to the central budget reflecting the cost of the services provided to the School by the University. Over and above the base budget allocations, the Faculties receive substantial additional on-going funds through the enrolment-related revenue sharing mechanism that was implemented in 2011-12. The proportion of incremental revenues flowing to the Faculties is as follows:
25% on direct-entry undergraduate enrolments/teaching 50% on second-entry (or professional) undergraduate enrolments 50% on professional masters enrolments 85% on research masters and doctoral enrolments – with the remaining 15% set aside to fund
the Doctoral Excellence Research Awards Program, which is aimed at recruiting doctoral students holding external awards,
Line 15 in Table 4 shows the projected $31.1 million that will be available to the Faculties in 2016-17. The Faculty-specific breakdown of this $31.1 million is shown in Table 4a. This amount is on top of a total of $19 million that was rolled into Faculty base budgets in 2014-15. The Faculties also receive additional budgetary support through:
Funding for targeted student financial awards in support of special recruitment efforts – which are included in Table 5;
One-time operating budget allocations – which are detailed in Table 8 (lines 11 to 23); The Research Infrastructure Support Fund (RISF) allocations shown in Table 10; and Support for Faculty-specific capital projects through the University’s Capital Budget.

Western University: 2016-17 Operating and Capital Budgets March 21, 2016
Page 20 of 55
Figure F Revenue Sharing Allocations -- $M
17.2
25.330.5
37.742.3
0.6
2.4
3.7
0
5
10
15
20
25
30
35
40
45
50
2014-15a 2015-16a 2016-17e 2017-18p 2018-19p
Revenue Sharing Contingency Hold-back
For information, a consolidated summary of the Provost’s allocation recommendations for the Faculties (from the various sources described above) is presented in Figure G. These recommendations are for the 2016-17 budget – and, given our multi-year planning approach, should be considered in the context of resource allocations made in previous years.
Figure GSUMMARY OF 2016-17 ALLOCATION RECOMMENDATIONS FOR THE FACULTIES
Base One-Time Targetted CapitalAllocations Allocations Student Awards Allocations
(Subset of Table 4, (Subset of Table 8, (Subset of Table 5, (Included in Table 15,
Columns d and e) Rows 8 to 20) Row 1) Category 4)
1 Arts & Humanities 550,000 200,000 96,000
2 Education 500,000
3 Engineering 797,771 34,992 294,516
4 Health Sciences 430,000 490,000 150,000
5 Information & Media Studies 503,000
6 Law 475,000
7 Medicine & Dentistry
8 Music 2,433,000 100,000
9 Science 947,000 2,524,100
10 Social Science 1,000,000 1,547,750
11 Total 3,174,771 8,557,842 300,000 1,040,516
Note: These recommendations are for the 2016-17 budget -- and, given our multi-year planning approach,should be considered in the context of resource allocations made in previous years.

Western University: 2016-17 Operating and Capital Budgets March 21, 2016
Page 21 of 55
2. Scholarships and Bursaries
Base budget allocations for centrally-funded student support are shown in Table 5. Overall student support funding is projected to be nearly $32 million in 2016-17. The Provincial Government’s Aiming for the Top Program comes to an end in 2016-17, as
reflected in line 5 of Table 5. The gradual phasing-out of the program started four years ago. Fundraising for undergraduate and graduate student needs-based awards continues to be of high
priority to the University. In 2016-17, we project a sum of $6.5 million from this source. As the footnote in Table 5 indicates, graduate student funding is now addressed through the
Faculty budgets – and the Faculty Plans estimate a total of $54 million in 2016-17 for this high priority item.
3. Support Unit Budget Recommendations
Table 6 shows the 2016-17 base budget recommendations for Support Units. Final 2016-17 base budgets are the net result of the following:
Starting base budgets; The initial budget adjustments (IBA) established as part of the multi-year budget plan; Support Units Priorities Fund (SUPF) allocations; and Other strategic base allocations in support of: maintaining core services and the operating
costs of new facilities. The Support Unit Priorities Fund (SUPF) was established in 2011-12, and the unit-specific allocations for 2016-17 (shown in column <c> of Table 6) are:
$90,000 to Information Technology Services in support of additional staffing; $35,000 to the Registrar’s Office for increased recruitment-related costs; $53,000 to the Vice-Provost (Academic Policy, Planning, & Faculty) Portfolio to maintain
staffing levels. $13,100 to the Office of Institutional Planning & Budgeting to maintain staffing levels; $310,000 to Western International in support of initiatives aimed at achieving our
international goals, international student safety-abroad initiatives, and funding to support a Scholars at Risk (SAR) Program;
$6,500 to the McIntosh Gallery to maintain staffing levels; $50,000 to Financial Services for an eLearning Specialist staff position (joint with Human
Resources); $50,000 to Human Resources for the eLearning Specialist staff position (join with Financial
Services); $65,000 to the Campus Community Police Service to maintain security service levels; $100,000 to the Vice-President (Research) Portfolio in support of service enhancement; and $115,000 to the Vice-President (External) Portfolio in support of our fundraising campaign.
The Provost and the Vice-President (Resources & Operations) are also carrying forward a portion of the SUPF resources associated with their units for allocation in the future. These are shown in lines 14 and 23 of Table 6.

Western University: 2016-17 Operating and Capital Budgets March 21, 2016
Page 22 of 55
The Support Units receive nearly $1.1 million additional base allocations (column d, Table 6) to maintain core services and to cover the incremental operating costs associated with new facilities. Similar to the Faculties, the Support Units also receive additional budgetary support through:
One-time operating budget allocations – which are detailed in Table 8 (lines 24 through 40); and
Support for Unit-specific capital projects through the University’s Capital Budget. 4. University-wide Expenditures
Table 7 summarizes University-wide Expenditures – expenses that extend across all areas of the University. The increase in the University’s physical plant Utilities is the net result of projected rate
increases, utilization patterns, and anticipated savings resulting from the implementation of energy efficiency initiatives.
The Library Acquisitions Budget is being increased by $500,000 to a level of $14.6 million.
As described earlier (in section C.6.), as a result of the weak Canadian dollar’s purchasing power, we are investing additional resources to this high priority budget line. The $500,000 base allocation is being supplemented by a one-time allocation of $1.1 million (Table 8, line 6).
The Maintenance, Modernization, and Infrastructure (MMI) transfer to the Capital Budget is being increased by $750,000 – based on the Board of Governors’ recommendation that this rate of annual increase continue until the transfer reaches $15.5 million.
The FFICR Transfer to Capital continues at the $3 million level – and these funds are used to
support major projects in our Long-range Space Plan that involve research facilities.
The Information Technology Infrastructure Fund (ITIF) supports rapidly-expanding University-wide central IT infrastructure – including our networks, wireless technologies, internet bandwidth, IT security infrastructure, general university computer labs, instructional support and eLearning software applications, central university databases, the hardware necessary to run the applications and databases, and maintenance costs associated with all the hardware and software.
Contingency is being set at $1.8 million – 0.25% of Operating Revenues, as in previous years.
Western attracts outstanding students. Their recruitment, within an increasingly competitive
environment, continues to be of high priority to the University – and the Student Recruitment base budget supports a wide array of recruitment activities, including out-of-province student recruitment initiatives.

Western University: 2016-17 Operating and Capital Budgets March 21, 2016
Page 23 of 55
5. One-Time Recommendations
The Faculties and Support Units will receive substantial one-time funding in 2016-17. The specific one-time recommendations are summarized in Table 8 – and include unit-specific items as well as allocations for University-wide initiatives. As described earlier in Section C of this document, the following high priority areas are
recommended for support in the 2016-17 budget – with one-time allocations: o Long-Range Space Plan – $15 million – to be directed at the proposed new Integrated
Learning and Innovation Centre. o $5.5 million to finance the new Engineering Building as part of the multi-year strategic
Engineering expansion plan. o Support for Scholarship/Research Initiatives in the SSHRC Disciplines – $5 million
to create an endowment and $200,000 to spend in 2016-17, for a total of $5.2 million. o Pedestrian-Friendly and Campus Safety Initiatives – $2 million. o Energy Conservation Initiatives – $1.5 million. o Support for the Library Acquisitions Budget – $1.1 million. o Entrepreneurship Ecosystem – $1 million. o Completion of funding for the Alice Munro Chair in Creativity – $500,000. o Support for our Fundraising Campaign (University Advertising Initiatives) – $500,000. o Modernization of Instructional Facilities – $500,000.
As a result of a funding partnership arrangement between the University Students’ Council, the
Society of Graduate Students, and the University, we created two artificial turf playing fields in 2013-14. The 24-year arrangement involves revenues from a targeted student fee and annual contributions from the University. In 2016-17, the University’s contribution amounts to $297,400.
A sum of $1.1 million is being allocated to the Vice-President (Research) to support a number of
research-related initiatives, including research promotion and commercialization of intellectual property.

Western University: 2016-17 Operating and Capital Budgets March 21, 2016
Page 24 of 55
Table 3
2016-17 OPERATING REVENUES
2015-16 Budget Increase /Forecast 2016-17 (Decrease)
(@Feb 29, 2016) Budget Amount % Change(1) (2) (3) (2) to (1)
1 Government Grants
2 Base Grants 204,435,373 204,569,553 134,180 0.1%
3 Undergraduate Accessibility Fund 6,907,658 5,009,312 -1,898,346 -27.5%
4 Sub-Total Base Grants & Accessibility Fund 211,343,031 209,578,865 -1,764,166 -0.8%
5 Graduate Expansion Fund 12,835,292 16,018,037 3,182,745 24.8%
6 Quality Improvement Fund 9,931,270 9,873,193 -58,077 -0.6%
7 Performance Fund 2,263,147 2,263,147 0 0.0%
8 Program Expansion Grants 23,884,324 23,944,304 59,980 0.3%
9 Provincial Research Infrastructure Grant 2,632,735 2,632,735 0 0.0%
10 Federal Funding for Indirect Costs of Research 8,976,988 8,936,834 -40,154 -0.4%
11 Provincial Government Student Support Grants 1,218,054 1,201,955 -16,099 -1.3%
12 Other Targetted Government Grants 8,052,857 8,016,855 -36,002 -0.4%
13 Sub-Total Government Grants 281,137,698 282,465,925 1,328,227 0.5%
14 Tuition Revenue
15 Undergraduate 213,958,669 226,123,117 12,164,448 5.7%
16 Graduate 51,527,871 56,764,297 5,236,426 10.2%
17 Sub-Total General Programs 265,486,540 282,887,414 17,400,874 6.6%
18 Ivey Programs (HBA, MBAs, MSc, PhD) 56,888,913 60,283,262 3,394,349 6.0%
19 International Medical and Dental Students 11,211,635 11,605,776 394,141 3.5%
20 Sub-Total Other Programs 68,100,548 71,889,038 3,788,490 5.6%
21 Miscellaneous Fees 750,714 741,000 -9,714 -1.3%
22 Sub-Total Tuition Revenue 334,337,802 355,517,452 21,179,650 6.3%
23 Other Revenues
24 Canada Research Chairs (CRCs) 7,700,000 7,200,000 -500,000 -6.5%
25 Transfer from Affiliated University Colleges 8,878,705 8,956,557 77,852 0.9%
26 Recoverable Salaries 28,250,147 28,250,147 0 0.0%
27 Investment Income (Robarts) 445,679 452,299 6,620 1.5%
28 Fundraising -- Need-based Student Awards and Bursaries 6,425,000 6,525,000 100,000 1.6%
29 Application Fees 1,780,258 1,780,258 0 0.0%
30 Research Overheads 2,025,000 2,250,000 225,000 11.1%
31 Royalties and Licences 3,984,461 3,456,027 -528,434 -13.3%
32 Contributions from Self-Funded & Ancillary Operations 28,591,900 30,929,000 2,337,100 8.2%
33 Miscellaneous Revenues 724,000 724,000 0 0.0%
34 Sub-Total Other Revenues 88,805,150 90,523,288 1,718,138 1.9%
35 Total Revenues 704,280,650 728,506,665 24,226,015 3.4%

Western University: 2016-17 Operating and Capital Budgets March 21, 2016
Page 25 of 55
<a>
<b>
<c>
<d>
<e>
<f>
<g>
2015
-16
Fac
ulty
Oth
erC
anad
aR
esul
ting
Bas
e B
udge
tIB
AT
urno
ver
AP
FB
ase
Res
earc
h20
16-1
7(@
Feb
29,
201
6)R
ecov
ery
Cha
nges
Cha
irs
Bas
e B
udge
t1
Fac
ult
ies
2A
rts
& H
uman
itie
s32
,188
,643
-894
,378
31,2
94,2
65
3E
duca
tion
8,03
6,14
6-2
74,9
25-1
67,2
757,
593,
946
4E
ngin
eeri
ng26
,925
,017
-749
,288
2,99
9,35
729
,175
,086
5H
ealt
h S
cien
ces
29,9
71,8
69-8
39,8
2543
0,00
0-8
3829
,561
,206
6In
form
atio
n &
Med
ia S
tudi
es10
,404
,079
-296
,349
-83,
622
10,0
24,1
08
7L
aw7,
962,
414
-231
,444
7,73
0,97
0
8M
edic
ine
& D
enti
stry
64,2
14,6
60-1
,829
,643
-189
,998
-25,
013
-90,
000
62,0
80,0
06
9M
usic
10,4
57,2
84-2
97,6
00-9
4,68
810
,064
,996
10S
cien
ce58
,318
,104
-1,5
84,7
32-7
0,50
694
7,00
0-1
70,0
0057
,439
,866
11S
ocia
l Sci
ence
58,0
61,7
71-1
,625
,609
-445
,387
1,00
0,00
0-1
,371
-90,
000
56,8
99,4
04
12S
ub-
Tot
al F
acu
ltie
s (e
xclu
din
g B
usi
nes
s)30
6,53
9,98
7-8
,623
,793
-1,0
51,4
762,
377,
000
2,97
2,13
5-3
50,0
0030
1,86
3,85
3
13B
usin
ess
69,0
99,9
204,
117,
918
-90,
000
73,1
27,8
38
14S
ub-
Tot
al F
acu
ltie
s37
5,63
9,90
7-8
,623
,793
-1,0
51,4
762,
377,
000
7,09
0,05
3-4
40,0
0037
4,99
1,69
1
15R
even
ue S
hari
ng A
lloc
atio
n25
,250
,572
5,86
4,68
331
,115
,255
16R
esea
rch
Infr
astr
uctu
re S
uppo
rt F
und
(RIS
F)
750,
000
750,
000
17F
acul
ty R
ecru
itm
ent I
niti
ativ
es1,
016,
702
1,01
6,70
2
18A
cade
mic
Pri
orit
ies
Fun
d (A
PF
)11
,241
,062
23,0
0011
,264
,062
19T
otal
--
wit
h R
even
ue
Sh
arin
g A
lloc
atio
n41
3,89
8,24
3-8
,623
,793
-1,0
51,4
762,
400,
000
12,9
54,7
36-4
40,0
0041
9,13
7,71
0
20A
ll O
ther
21W
este
rn S
trat
egic
Suc
cess
Pro
gram
s (f
orm
erly
AD
F)
1,50
0,00
01,
500,
000
22C
onti
nuin
g S
tudi
es:
Tro
is-P
isto
les
1,01
9,07
819
,179
1,03
8,25
7
23E
duca
tion
: Con
tinu
ing
Edu
cati
on f
or T
each
ers
1,73
0,99
5-3
46,1
991,
384,
796
24M
edic
ine
& D
enti
stry
: In
tern
atio
nal S
tude
nts
and
Pri
mar
y C
are
11,5
61,4
4039
4,14
111
,955
,581
25M
edic
ine
& D
enti
stry
: R
obar
ts5,
218,
116
-372
,956
4,84
5,16
0
26F
acul
ty S
hare
of
Res
earc
h O
verh
eads
870,
000
154,
000
1,02
4,00
0
27F
acul
ty S
chol
ars
& D
isti
ngui
shed
Uni
vers
ity
Pro
fess
ors
239,
000
239,
000
28G
radu
ate
and
Und
ergr
adua
te P
rogr
am R
evie
ws
140,
000
140,
000
29R
ecov
erab
le S
alar
ies
28,2
50,1
470
28,2
50,1
47
30S
ub-
Tot
al50
,528
,776
00
0-1
51,8
350
50,3
76,9
41
31T
otal
Aca
dem
ic U
nit
s46
4,42
7,01
9-8
,623
,793
-1,0
51,4
762,
400,
000
12,8
02,9
01-4
40,0
0046
9,51
4,65
1
Not
e: F
undi
ng to
cov
er th
e co
sts
of n
egot
iate
d em
ploy
ee s
alar
y an
d be
nefi
ts in
crea
ses
wil
l be
incr
emen
tall
y ad
ded
to F
acul
ty b
ase
budg
ets
(in
year
, to
colu
mn
g), a
s th
e in
form
atio
n is
ava
ilab
le.
FA
CU
LT
IES
Tab
le 4
2016
-17
BA
SE
BU
DG
ET
S

Western University: 2016-17 Operating and Capital Budgets March 21, 2016
Page 26 of 55
Table 4aFACULTIES: REVENUE SHARING ALLOCATIONS
2014-15a 2015-16a 2016-17e 2017-18p 2018-19p
1 Arts & Humanities -74,390 -64,190 -255,705 383,190 704,838
2 Education 2,951,298 5,531,940 7,565,029 7,924,974 8,401,376
3 Engineering 2,178,257 3,803,227 2,228,171 2,972,039 3,273,494
4 Health Sciences 1,543,158 2,196,864 2,599,722 3,301,362 3,810,276
5 Information & Media Studies 397,427 149,498 458,335 1,025,039 1,391,486
6 Law 641,164 895,587 1,294,600 1,444,439 1,432,662
7 Medicine & Dentistry 3,809,577 4,170,113 5,298,785 6,311,962 6,779,621
8 Music 205,051 83,852 205,038 457,777 501,120
9 Science 2,785,763 4,063,965 5,242,198 6,763,847 7,587,395
10 Social Science 2,217,097 3,891,051 5,035,187 5,993,678 7,199,195
11 Inter-Disciplinary Programs 535,849 528,665 821,592 1,111,701 1,281,593
12 Sub-Total 17,190,251 25,250,572 30,492,952 37,690,008 42,363,056
13 Contingency Hold-back 622,303 2,405,746 3,683,742
14 Sub-Total 17,190,251 25,250,572 31,115,255 40,095,754 46,046,798

Western University: 2016-17 Operating and Capital Budgets March 21, 2016
Page 27 of 55
Table 4b
2015-16 FACULTIES' BUDGETS
BUDGET PRESENTED LAST YEAR COMPARED TO ACTUAL FINAL BUDGET
(for information only)
<a> <b> <c> <d> <e> <f> <g> <h>
As in 2015-16 Budget Document
2014-15 Faculty Other Canada ResultingBase Budget IBA Turnover APF Base Research 2015-16
(@Feb 28, 2015) Recovery Changes Chairs Base Budget
1 Faculties
2 Arts & Humanities 31,334,655 -922,040 -157,583 200,000 30,455,032
3 Education 10,055,137 -283,428 -141,567 9,630,142
4 Engineering 26,528,740 -772,462 -77,543 -401 90,000 25,768,334
5 Health Sciences 29,119,956 -865,799 -346,447 200,000 -808 28,106,902
6 Information & Media Studies 10,183,806 -305,514 -71,640 100,000 9,906,652
7 Law 7,953,386 -238,602 57,375 7,772,159
8 Medicine & Dentistry 65,411,263 -1,886,229 -734,205 -24,090 -80,000 62,686,739
9 Music 10,226,793 -306,804 100,000 10,019,989
10 Science 56,298,151 -1,633,745 -289,989 800,000 180,000 55,354,417
11 Social Science 56,732,846 -1,675,885 -623,989 800,000 -37,224 90,000 55,285,748
12 Sub-Total 303,844,733 -8,890,508 -2,442,963 2,257,375 -62,523 280,000 294,986,114
13 Business 62,621,292 2,465,870 -90,000 64,997,162
14 Total 366,466,025 -8,890,508 -2,442,963 2,257,375 2,403,347 190,000 359,983,276
<a> <b> <c> <d> <e> <f> <g> <h>
Actual Final -- as of February 29, 2016
2014-15 Faculty Other Canada ResultingBase Budget IBA Turnover APF Base Research Salary 2015-16
(@Feb 28, 2015) Recovery Changes Chairs Increases Base Budget
1 Faculties
2 Arts & Humanities 31,334,655 -922,040 -157,583 200,000 29,873 -170,000 1,873,738 32,188,643
3 Education 10,055,137 -283,428 -141,567 -1,872,660 278,664 8,036,146
4 Engineering 26,528,740 -772,462 -77,543 -401 0 1,246,683 26,925,017
5 Health Sciences 29,119,956 -865,799 -346,447 450,000 355,201 170,000 1,088,958 29,971,869
6 Information & Media Studies 10,183,806 -305,514 -71,640 100,000 497,427 10,404,079
7 Law 7,953,386 -238,602 57,375 -18,708 208,963 7,962,414
8 Medicine & Dentistry 65,411,263 -1,886,229 -734,205 71,369 -340,000 1,692,462 64,214,660
9 Music 10,226,793 -306,804 100,000 437,295 10,457,284
10 Science 56,298,151 -1,633,745 -289,989 800,000 3,143,687 58,318,104
11 Social Science 56,732,846 -1,675,885 -623,989 800,000 124,276 90,000 2,614,523 58,061,771
12 Sub-Total 303,844,733 -8,890,508 -2,442,963 2,507,375 -1,311,050 -250,000 13,082,400 306,539,987
13 Business 62,621,292 6,478,628 69,099,920
14 Total 366,466,025 -8,890,508 -2,442,963 2,507,375 5,167,578 -250,000 13,082,400 375,639,907

Western University: 2016-17 Operating and Capital Budgets March 21, 2016
Page 28 of 55
Table 5
SCHOLARSHIPS and BURSARIES
2016-17 BASE BUDGETS
<a> <b> <c>
2015-16 ResultingBase Budget Changes 2016-17(@Feb 29, 2016) Base Budget
1 Undergraduate Scholarships 7,300,000 7,300,000
2 Tuition Re-Investment 14,507,337 572,591 15,079,928
3 Western Bursaries 776,545 776,545
4 Privately-Funded Need-based Awards & Bursaries 6,425,000 100,000 6,525,000
5 Government "Aiming for the Top" Program 18,500 -18,500 0
6 MTCU Bursaries 587,955 587,955
7 Global Opportunities Awards 200,000 200,000
8 Graduate Bursaries and Fellowships 1,011,599 2,401 1,014,000
9 Doctoral Excellence Research Awards 480,000 480,000
10 Total Scholarships and Bursaries 30,826,936 1,136,492 31,963,428
Graduate student funding is now addressed through the Faculty budgets. In 2015-16, this funding is estimatedto be $51.2 million and the plan for 2016-17 is $54.4 million.

Western University: 2016-17 Operating and Capital Budgets March 21, 2016
Page 29 of 55
Table 6
SUPPORT AREAS
2016-17 BASE BUDGETS
<a> <b> <c> <d> <e>
2015-16 Other ResultingBase Budget IBA SUPF Base 2016-17(@Feb 29, 2016) Changes Base Budget
1 Reporting to the Provost
2 Teaching Support Centre 703,617 -20,105 8,042 691,554
3 Writing Support Centre 336,086 336,086
4 Information Technology Services 7,265,219 -195,775 90,000 97,888 7,257,332
5 Libraries 13,002,288 -372,737 149,095 12,778,646
6 Registrar's Office 5,898,121 -170,789 35,000 85,395 5,847,727
7 Student Experience Portfolio 906,545 -16,936 6,774 896,383
8 Office of Vice-Provost (APPF) 1,279,361 -28,691 53,000 11,476 1,315,146
9 Graduate & Postdoctoral Studies 1,824,686 -52,870 21,148 1,792,964
10 Institutional Planning and Budgeting 4,622,495 -141,899 13,100 56,760 4,550,456
11 Western International 2,100,441 -55,300 310,000 22,120 2,377,261
12 McIntosh Gallery - Subsidy 267,794 6,500 274,294
13 Teaching Fellows Program 500,000 500,000
14 Support Unit Priorities Fund (SUPF) 205,235 -82,600 122,635
15 Sub-Total 38,911,888 -1,055,102 425,000 458,698 38,740,484
16 Reporting to the Vice-President Resources & Operations
17 Financial Services 4,731,798 -137,316 50,000 54,926 4,699,408
18 Human Resources 6,686,379 -194,496 50,000 77,798 6,619,681
19 Workplace Health Services 170,813 170,813
20 Facilities Management 17,353,603 -420,320 287,574 17,220,857
21 Police 2,816,688 -82,293 65,000 34,421 2,833,816
22 Internal Audit 431,254 -12,427 6,214 425,041
23 Support Unit Priorities Fund (SUPF) 349,000 195,000 544,000
24 Sub-Total 32,539,535 -846,852 360,000 460,933 32,513,616
25 Reporting to the Vice-President Research
26 Animal Care/Veterinary Services - Subsidy 800,000 800,000
27 Research Western 4,116,907 -108,900 100,000 43,560 4,151,567
28 Research Promotion Fund 250,000 250,000
29 Small Grants Support for Arts/Humanities/Social Sciences 250,000 250,000
30 Western Innovation Fund 400,000 400,000
31 Sub-Total 5,816,907 -108,900 100,000 43,560 5,851,567
32 Vice-President External Portfolio 11,639,673 -334,010 115,000 133,603 11,554,266
33 General Administration
34 Offices of the President/Vice-Presidents 3,262,292 3,262,292
35 University Secretariat 1,107,386 1,107,386
36 Sub-Total 4,369,678 0 0 0 4,369,678
37 Total Support Areas 93,277,681 -2,344,864 1,000,000 1,096,794 93,029,611
Note: Funding to cover the costs of negotiated employee salary and benefits increases will be incrementally added to Unit base budgets
(in year, to column e), as the information is available.

Western University: 2016-17 Operating and Capital Budgets March 21, 2016
Page 30 of 55
Table 7
UNIVERSITY-WIDE EXPENDITURES and EMPLOYEE BENEFIT COSTS
2016-17 BASE BUDGETS
<a> <b> <c> <d>
2015-16 ResultingBase Budget New Other 2016-17(@Feb 29, 2016) Investment Changes Base Budget
1 Utilities 23,138,932 989,337 24,128,269
2 Library Acquisitions 14,115,896 500,000 14,615,896
3 Transfer to MMI: Operating 14,000,000 750,000 14,750,000
4 Transfer to MMI: Ancillaries 600,000 600,000
5 FFICR Transfer to Capital 3,000,000 3,000,000
6 CRC Transfer to Capital 808,000 -48,000 760,000
7 Information Technology Infrastructure Fund (ITIF) 8,764,701 438,235 9,202,936
8 Property Taxes 2,168,025 -5,025 2,163,000
9 Insurance 1,803,220 99,280 1,902,500
10 Contingency 1,732,914 88,353 1,821,267
11 Services for Students with Disabilities 1,225,396 -16,697 1,208,699
12 Professional Fees 1,282,500 1,282,500
13 Institutional Memberships 1,020,000 1,020,000
14 Student Recruitment 850,000 850,000
15 Sports and Recreation Services - Subsidy 906,827 8,546 915,373
16 Convocation and Diplomas 340,000 340,000
17 Costs Associated with Employee Contracts 589,000 589,000
18 Ombudsperson 103,354 103,354
19 University Surveys and Teaching Evaluations 75,000 75,000
20 Centre for Research on Violence Against Women and Children - Subsidy 55,000 55,000
21 Museum of Ontario Archaeology - Subsidy 50,000 50,000
22 Total University-wide Expenditures 76,628,765 1,250,000 1,554,029 79,432,794
23 Employee Benefit Plan Costs 106,868,412 2,794,588 109,663,000
24 Employee Benefit Recoveries -112,652,000 -3,158,000 -115,810,000
25 Net Employee Benefits -5,783,588 -363,412 -6,147,000
26 Net University-wide Expenditures 70,845,177 1,250,000 1,190,617 73,285,794

Western University: 2016-17 Operating and Capital Budgets March 21, 2016
Page 31 of 55
Table 82016-17 ONE-TIME ALLOCATIONS
1 Long-Range Space Plan: Support for the Integrated Learning and Innovation Centre 15,000,000
2 New Engineering Building: Multi-year Financing Plan 5,543,126
3 Scholarship/Research Initiatives in the SSHRC Disciplines: Create Endowment ($5M), 2016-17 Spending ($200K) 5,200,000
4 Pedestrian-Friendly and Campus Safety Initiatives 2,000,000
5 Energy Conservation Initiatives 1,500,000
6 Strengthening our Library Acquisitions Budget 1,100,000
7 Western's Entrepreneurship Ecosystem 1,000,000
8 Support for Fundraising Campaign: Advertising Initiatives 500,000
9 Classroom Modernization Initiatives 500,000
10 University Contribution for Artificial Turf Playing Fields 297,400
11 Faculties
12 Alice Munro Chair in Creativity (Arts & Humanities): Additional Allocation to Complete the Endowment 500,000
13 Arts & Humanities: Undergraduate Recruitment Initiatives 50,000
14 Engineering: Upgrades to Undergraduate Lab ($34.9K) 34,992
15Health Sciences: Targetted Government Funding for Clinical Education ($842K) and Nurse Practitioner Program ($580K), Roth Chair Bridge Funding ($65K), Nursing Simulation Suite Equipment ($300K), Incremental Furniture for Nursing ($75K)
1,862,412
16Info & Media Studies: HD Equipment for Instructional Facilities ($280K), Incremental Furniture ($160K), Grants Facilitator Position ($43K), and Recruitment, Promotion and Experiental Learning Initiatives ($20K)
503,000
17Law: Building Systems Improvements ($375K), Capstone Courses ($40K), Blended Learning & eLearning Initiatives ($40K), and International and Pre-Eminent Visiting Scholars Program ($20K)
475,000
18 Medicine & Dentistry: Targetted Government Funding for Dental Clinical Education ($1.2M) and MD Expansion ($2.4M) 3,538,879
19Music: New Building Phase 2 ($2M), Bridge Funding for Faculty Appt ($40K), Music Education Initiatives ($19.5K), Support for AEDO ($50K), Incremental Furniture ($75K), Equipment for CEARP Lab ($38.5K), Piano Purchase ($150K), Recruitment & Community Awareness Initiatives ($45K), and Percussion Equipment Acquisition ($15K)
2,433,000
20 Science: Chemistry Lab Renovations & Creation of space for WISc Program ($1.9M) and Research Start-up Funding ($600K) 2,524,100
21 Social Science: Support for Academic Capital Needs ($1.5M) and Research Matching & Support Fund ($50K) 1,547,750
22 Provost: Use of Base APF for One-time Purposes -45,992
23 Sub-Total Faculties 13,423,141
24 Support Units
25Registrar's Office: First Generation Initiatives ($282K), Additional Special Projects Staffing ($35K), and Liaison Staffing - Joint with Western International ($33K)
350,480
26 Western International: Liaison Staffing ($33K) - Joint with Registrar's Office 33,000
27Student Experience: Experiential Learning Initiatives ($70K), Career Services and First Nations Initiatives ($180K), Targetted Government Funding for Sexual Violence Public Education ($130K), and SRS - Women's Athletic Awards ($50K)
430,000
28Teaching Support Centre: 360 Degree Initiative for Graduate Students ($300K), Faculty Mentor Program ($40K), and Turn-it-in Software License Costs ($63K)
403,000
29 Vice-Provost (APPF): Training and Development Initiatives and Faculty Recruitment/Retention Initiatives 70,000
30SGPS: Maintain Service and Staffing Levels ($175K), Recruitment and Retention Initiatives ($110), Exchange Program Travel Costs ($15K), Aboriginal Graduate Education Initiatives ($36K), Thesis Writing Boot Camp ($19K), International Recruitment Initiatives ($50K), and International Recruitment Coordinator Position ($90K)
495,000
31 McIntosh Gallery: Exhibition and Publication of Contemporary Indigenous Art 30,000
32 Provost: Unallocated Support Unit Priorities Fund (SUPF) 14,000
33 Financial Services: Best Value Business Model Initiative ($135K) and SciQuest Systems Support ($5K) 139,968
34Human Resources: Employee Relations Staffing ($142K), Job Evaluation Initiatives ($40K), Sexual Violence Policy/Bill 132 Education Initiatives ($20K), Space Re-Alignment ($10K), and Fall 2016 Leadership Symposium ($30K)
241,802
35 Facilites Management: Land Development Initiatives ($150K) and Construction Procurement Services ($255K) 405,000
36 Police: Fire Safety Inspections ($40K) and Communications Centre Upgrade ($62K) 102,000
37 Vice-President (Resources & Operations): Use of Base SUPF for One-Time Purposes -528,770
38 Vice-President (Research): Support for Research/Scholarship Initiatives 1,100,000
39 Vice-President (External): Support for Fundraising Campaign 158,174
40 Sub-Total Support Units 3,443,654
41 Total One-Time Allocations 49,507,321

Western University: 2016-17 Operating and Capital Budgets March 21, 2016
Page 32 of 55
2015-16 Final 2016-17 Preliminary
Tier 1 Tier 2 Total Tier 1 Tier 2 Total
N $ N $ N $ N $ N $ N $
1 Arts & Humanities 2 340,000 1 90,000 3 430,000 2 340,000 1 90,000 3 430,000
2 Business 2 340,000 1 90,000 3 430,000 2 340,000 0 0 2 340,000
3 Education
4 Engineering 3 510,000 3 270,000 6 780,000 3 510,000 3 270,000 6 780,000
5 Health Sciences 2 340,000 1 90,000 3 430,000 2 340,000 1 90,000 3 430,000
6 Info & Media Studies
7 Law
8 Medicine & Dentistry 7 1,190,000 7 630,000 14 1,820,000 7 1,190,000 6 540,000 13 1,730,000
9 Music
10 Science 5 850,000 11 990,000 16 1,840,000 4 680,000 11 990,000 15 1,670,000
11 Social Science 3 510,000 5 450,000 8 960,000 3 510,000 4 360,000 7 870,000
12 Total to Faculties 24 4,080,000 29 2,610,000 53 6,690,000 23 3,910,000 26 2,340,000 49 6,250,000
13 Total CRC Funding 4,800,000 2,900,000 7,700,000 4,600,000 2,600,000 7,200,000
Table 9
CRC Allocations -- by Faculty (Cumulative)

Western University: 2016-17 Operating and Capital Budgets March 21, 2016
Page 33 of 55
Table 10
RESEARCH INFRASTRUCTURE SUPPORT FUND (RISF)
2016-17 Allocations
1 Arts & Humanities 10,300
2 Education 7,600
3 Engineering 120,900
4 Health Sciences 41,400
5 Information & Media Studies 5,000
6 Law 5,000
7 Medicine & Dentistry 297,100
8 Music 5,000
9 Science 166,100
10 Social Science 91,600
11 Total 750,000

Western University: 2016-17 Operating and Capital Budgets March 21, 2016
Page 34 of 55
Table 112016-17 TUITION FEE PROPOSALS FOR UNDERGRADUATE PROGRAMS
Canadian Students International StudentsActual 2016-17 Actual 2016-17
2015-16 Proposed <a> 2015-16 Proposed <a>
Tuition Tuition % Increase Tuition Tuition % Increase
1 First-Entry Programs <b>
2 Year 1 6,154 6,338 3.0% 22,817 24,643 8.0%
3 Year 2 6,154 6,338 3.0% 21,972 23,730 4.0%
4 Year 3 6,154 6,338 3.0% 21,158 22,851 4.0%
5 Year 4 6,154 6,338 3.0% 20,376 22,004 4.0%
6 Engineering
7 Year 1 11,802 12,392 5.0% 29,281 31,623 8.0%
8 Year 2 11,802 12,392 5.0% 28,196 30,452 4.0%
9 Year 3 11,802 12,392 5.0% 27,152 29,324 4.0%
10 Year 4 11,468 12,392 5.0% 26,146 28,238 4.0%
11 M.T.P.
12 Year 2 6,438 6,631 3.0% 23,660 25,553 8.0%
13 Year 3 6,438 6,631 3.0% 22,776 24,606 4.0%
14 Year 4 6,438 6,631 3.0% 22,776 23,687 4.0%
15 M.O.S.
16 Year 1 6,154 6,338 3.0% 24,538 27,483 12.0%
17 Year 2 6,154 6,338 3.0% 22,785 25,520 4.0%
18 Year 3 6,154 6,338 3.0% 21,158 23,697 4.0%
19 Year 4 6,154 6,338 3.0% 20,376 22,004 4.0%
20 Nursing
21 Year 1 6,154 6,338 3.0% 29,281 31,623 8.0%
22 Year 2 6,154 6,338 3.0% 28,196 30,452 4.0%
23 Year 3 6,154 6,338 3.0% 27,152 29,324 4.0%
24 Year 4 6,154 6,338 3.0% 26,146 28,238 4.0%
25 Second-Entry Programs
26 Business (HBA)
27 Year 1 24,905 25,652 3.0% 35,906 36,653 2.1%
28 Year 2 24,905 25,652 3.0% 35,906 36,653 2.1%
29 Dentistry
30 Year 1 33,923 35,619 5.0% 65,164 70,377 8.0%
31 Year 2 33,923 35,619 5.0% 62,750 67,771 4.0%
32 Year 3 33,923 35,619 5.0% 60,427 65,260 4.0%
33 Year 4 32,963 35,619 5.0% 58,189 62,844 4.0%
34 Education (B.Ed.) 7,395 7,616 3.0% 24,246 25,215 4.0%
35 Law
36 Year 1 19,342 20,309 5.0% 29,281 31,623 8.0%
37 Year 2 19,342 20,309 5.0% 28,196 30,452 4.0%
38 Year 3 19,342 20,309 5.0% 27,152 29,324 4.0%
39 Medicine (M.D.)
40 Year 1 23,927 25,123 5.0% n.a. n.a. n.a.
41 Year 2 23,927 25,123 5.0% n.a. n.a. n.a.
42 Year 3 23,927 25,123 5.0% n.a. n.a. n.a.
43 Year 4 23,249 25,123 5.0% n.a. n.a. n.a.
<a> The proposed 2016-17 rates are effective May 1, 2016.The % increase figures are calculated on the previous year of study in the previous academic year; for example, the % increase for year 2 is the increase over the year 1 tuition in the previous academic year.
<b> Includes Arts & Humanities, BMedSc program, Health Sciences , Kinesiology, MIT program, MTP year 1, Music, Science,Social Science (excl. M.O.S.).

Western University: 2016-17 Operating and Capital Budgets March 21, 2016
Page 35 of 55
Table 122016-17 TUITION FEE PROPOSALS FOR GRADUATE PROGRAMS
Canadian Students International StudentsActual 2016-17 Actual 2016-17
2015-16 Proposed <a> 2015-16 Proposed <a>
Tuition Tuition % Increase Tuition Tuition % Increase
1 Masters Category 1
2 Arts & Humanities 6,827 6,915 1.3% 17,276 17,501 1.3%
3 Engineering (M.E.Sc.) 6,827 6,915 1.3% 17,276 17,501 1.3%
4 Health & Rehabilitation Sciences 6,827 6,915 1.3% 17,276 17,501 1.3%
5 Health Information Sciences 9,300 9,420 1.3% 24,381 24,698 1.3%
6 Interdisciplinary Programs <b> 6,827 6,915 1.3% 17,276 17,501 1.3%
7 Kinesiology 6,827 6,915 1.3% 17,276 17,501 1.3%
8 Law/Studies in Law 11,521 11,521 0.0% 26,749 26,749 0.0%
9 Media Studies 6,827 6,915 1.3% 17,276 17,501 1.3%
10 Medicine (Basic Health Sciences) 6,827 6,915 1.3% 17,276 17,501 1.3%
11 Music 6,827 6,915 1.3% 17,276 17,501 1.3%
12 Nursing (M.Sc.) 8,199 8,305 1.3% 24,381 24,698 1.3%
13 Science 6,827 6,915 1.3% 17,276 17,501 1.3%
14 Social Science 6,827 6,915 1.3% 17,276 17,501 1.3%
15 Masters Category 2
16 C.S.D./O.T./P.T. (MPT) <c> 10,841 11,383 5.0% 25,813 27,362 6.0%
17 Dentistry (Orthodontics) <c> 26,275 27,588 5.0% 60,422 64,047 6.0%
18 Education (M.Ed) <c> 10,441 10,963 5.0% 25,813 27,362 6.0%
19 Education (MPE, GDPE) 10,441 10,963 5.0% 25,813 27,362 6.0%
20 Engineering (M.Eng.) <c> 10,441 10,963 5.0% 25,813 27,362 6.0%
21 Environment & Sustainability 11,692 12,276 5.0% 25,813 27,362 6.0%
22 M.M. in Journalism & Communication 13,000 13,650 5.0% 25,813 27,362 6.0%
23 Library & Information Science <c> 10,441 10,963 5.0% 25,813 27,362 6.0%
24 Medicine (Family Medicine) <c> 13,749 14,436 5.0% 25,813 27,362 6.0%
25 Medicine (Pathology Assistant) <c> --- 11,385 ---- --- 27,362 ---
26 Medicine (Public Health) 29,767 31,255 5.0% 47,191 50,022 6.0%
27 Physical Therapy (M.Cl.Sc.) <c> 10,441 10,963 5.0% 25,813 27,362 6.0%
28 Doctoral
29 Doctor of Musical Arts 6,827 6,915 1.3% 17,276 17,501 1.3%
30 Ph.D/MSc Clinical Med. Biophysics 13,772 14,208 3.2% 26,804 27,601 3.0%
31 Doctor of Education (EdD) 9,693 10,177 5.0% 25,813 27,362 6.0%
32 PhD Programs 6,827 6,915 1.3% 17,276 17,501 1.3%
<a> The proposed 2016-17 rates are effective September 1, 2016.
<b> Includes Biomedical Engineering, Neuroscience, Theory & Criticism, and Popular Music & Culture
<c> The proposed 2016-17 rates apply to domestic students, who entered in 2013-14 or later;
for students who entered prior to 2013-14, rates increases by 4%.

Western University: 2016-17 Operating and Capital Budgets March 21, 2016
Page 36 of 55
Table 13SUMMARY OF ENROLMENT FORECAST
<adjusted for new Full-Time definition beginning in 2016-17>
Actual Forecast2011-12 2012-13 2013-14 2014-15 2015-16 2016-17 2017-18 2018-19 2019-20 2020-21
1 Constituent University2 Full-Time Undergraduates
3 Arts & Humanities 1,232 1,180 1,147 1,121 1,027 938 931 921 922 922
4 Business (HBA) 979 1,065 1,116 1,100 1,093 1,130 1,130 1,130 1,130 1,130
5 Dentistry 260 266 264 262 265 265 264 264 264 264
6 Education 700 677 597 657 286 668 668 668 668 668
7 Engineering 1,262 1,335 1,449 1,546 1,761 1,871 1,949 1,963 1,942 1,939
8 Health Sciences
9 BHSc Program 1,185 1,160 1,170 1,163 1,179 1,166 1,163 1,138 1,130 1,129
10 Kinesiology 1,246 1,203 1,169 1,240 1,204 1,179 1,190 1,167 1,168 1,169
11 Nursing 808 820 825 835 868 909 939 961 959 959
13 Sub-Total 3,239 3,183 3,164 3,238 3,251 3,254 3,292 3,266 3,257 3,257
14 Law 465 476 480 486 474 468 468 468 468 468
15 Media, Information, & Tech 963 919 930 924 983 967 960 955 949 949
16 Medicine
17 MD Program 646 667 680 683 684 684 684 684 684 684
18 BMedSci Program 688 778 862 892 881 892 892 892 892 892
19 Music 527 542 512 457 432 404 392 390 393 394
20 Science 4,222 4,334 4,482 4,606 4,679 4,605 4,599 4,516 4,443 4,434
21 Social Science 6,618 6,648 6,674 6,601 6,482 6,222 6,215 6,199 6,221 6,226
22 Total Full-Time Undergraduates 21,801 22,070 22,357 22,573 22,298 22,368 22,444 22,316 22,233 22,227
23 Concurrent Programs 144 155 173 201 255 255 255 255 255 255
24 Medical Residents 810 829 853 913 947 943 940 940 940 940
25 Full-Time Graduates
26 Masters 2,823 2,756 2,977 3,146 3,276 3,608 3,839 3,917 3,960 4,000
27 Ph.D. 1,947 2,021 2,026 2,075 2,088 2,196 2,274 2,345 2,370 2,400
28 Total Full-Time Graduates 4,770 4,777 5,003 5,221 5,364 5,804 6,113 6,262 6,330 6,400
29 Total Full-Time Enrolment 27,525 27,831 28,386 28,908 28,864 29,370 29,752 29,773 29,758 29,822
30 Part-Time FTEs
31 Undergraduate 2,243 2,317 2,251 2,123 2,226 2,445 2,445 2,445 2,445 2,445
32 Education (AQs) 745 673 635 607 595 465 525 525 525 525
33 Masters 140 175 149 99 79 80 80 80 80 80
34 Ph.D. 26 22 27 29 32 30 30 30 30 30
35 Total Part-Time FTEs 3,154 3,187 3,062 2,858 2,932 3,020 3,080 3,080 3,080 3,080
36 Total Constituent FTEs 30,679 31,018 31,448 31,766 31,796 32,390 32,832 32,853 32,838 32,902
37 Affiliated University Colleges38 Full-Time Undergraduates
39 Brescia 1,067 1,121 1,150 1,269 1,327 1,389 1,410 1,477 1,520 1,570
40 Huron 1,272 1,230 1,250 1,144 1,062 1,065 1,025 1,050 1,120 1,200
41 King's 3,286 3,244 3,169 3,063 3,004 2,892 2,940 3,007 3,106 3,216
42 Total Full-Time Undergraduates 5,625 5,595 5,569 5,476 5,393 5,346 5,375 5,534 5,746 5,986
43 Part-Time Undergraduate FTEs
44 Brescia 94 94 83 86 80 105 105 105 105 105
45 Huron 70 63 65 65 58 50 50 50 50 50
46 King's 252 239 252 277 260 340 340 340 340 340
47 Total Part-Time FTEs 416 396 400 428 398 495 495 495 495 495
48 Graduate FTEs
49 Brescia 29 32 32 28 33 38 38 38 38 38
50 Huron 14 10 8 11 9 11 13 15 17 18
51 King's 31 33 31 33 29 45 45 45 45 45
52 Total Graduate FTEs 74 75 71 72 71 94 96 98 100 101
53 Total Affiliate FTEs 6,115 6,066 6,040 5,976 5,862 5,935 5,966 6,127 6,341 6,582
54 Total UWO FTEs 36,794 37,084 37,488 37,742 37,658 38,325 38,798 38,980 39,179 39,484

Western University: 2016-17 Operating and Capital Budgets March 21, 2016
Page 37 of 55
Table 13SUMMARY OF ENROLMENT FORECAST
<adjusted for new Full-Time definition beginning in 2016-17>
Actual Forecast2011-12 2012-13 2013-14 2014-15 2015-16 2016-17 2017-18 2018-19 2019-20 2020-21
Rows 55 to 86 Included above
55 International Students56 Constituent Full-Time
57 Undergraduates 923 1,257 1,611 1,895 1,990 2,160 2,215 2,330 2,350 2,350
58 Medical Residents 127 108 112 134 136 135 135 135 135 135
59 Masters (excluding Ivey) 452 463 439 495 576 618 657 671 680 690
60 MBA (Regular), Ivey MSc 30 22 43 39 56 79 96 97 98 100
61 Executive MBA 44 22 40 35 24 0 0 0 0 0
62 Ph.D. 510 499 516 547 562 570 558 556 560 565
63 Affiliates
64 Undergraduates 497 476 497 577 661 669 698 724 747 773
65 Masters 2 4 3 0 0 3 3 3 3 3
66 Year 1 Only67 Constituent
68 Arts & Humanities 272 236 213 267 217 230 230 230 230 230
69 Engineering 416 412 430 511 637 580 580 580 580 580
70 Health Sciences
71 BHSc Program 314 292 338 347 336 325 325 325 325 325
72 Kinesiology 366 331 315 386 335 335 335 335 335 335
73 Nursing 128 128 132 131 143 140 140 140 140 140
74 Media, Information, & Tech 334 314 332 336 350 335 335 335 335 335
75 MOS Program 846 816 741 857 794 800 800 800 800 800
76 Music 142 144 121 99 100 105 105 105 105 105
77 Science 1,388 1,313 1,347 1,474 1,445 1,450 1,450 1,450 1,450 1,450
78 Social Science 850 837 878 803 796 810 810 810 810 810
79 Total Year 1 - Constituent 5,056 4,823 4,847 5,211 5,153 5,110 5,110 5,110 5,110 5,110
80 Affiliated University Colleges
81 Brescia 292 284 309 315 350 356 365 377 389 403
82 Huron 381 367 388 274 290 310 320 330 340 355
83 King's 878 821 848 740 774 795 805 815 825 835
84 Total Year 1 - Affiliates 1,551 1,472 1,545 1,329 1,414 1,461 1,490 1,522 1,554 1,593
85 Total UWO Year 1 6,607 6,295 6,392 6,540 6,567 6,571 6,600 6,632 6,664 6,703
86 Masters 87 All Programs (excluding MBAs) 2,380 2,420 2,583 2,781 2,877 3,129 3,328 3,391 3,434 3,474
88 Ivey (excl EMBA) 183 144 181 161 208 314 346 361 361 361
89 Executive MBA 260 192 213 204 191 165 165 165 165 165
For Information
90 Year 1 Constituent International Students 347 476 532 527 508 550 600 600 600 600

Western University: 2016-17 Operating and Capital Budgets March 21, 2016
Page 38 of 55
Project Type
CATEGORY 1 -- Underway or Soon-to-Start
1 New Music Building -- and removal of Old Music Building New Construction / Demolition
2 New Academic Building (To House FIMS and Nursing) New Construction
3 Medical Research Facilities (Microbiology & Immunology) New Construction / Modernization
4 Modernization of University College Modernization
5 Western Interdisciplinary Research Building -- Phase 1 New Construction
6 New Engineering Building New Construction
7 Follow-on Renovation Projects -- HSA, NCB Modernization / Adaptation
8 Integrated Learning and Innovation Centre New Construction
9 University-wide Infrastructure Projects (multiple stages) New Construction / Modernization
10 Parking-related Projects Infrastructure
11 Campus Sustainability Initiatives (multiple stages) Modernization / Infrastructure
CATEGORY 2 -- Projects in Various Planning Stages
12 Modernization of Thames Hall Modernization
13 Follow-on Renovation Projects -- NSc Modernization / Adaptation
14 New Research Initiatives/Partnerships at the Research Parks New Construction
15 Renewal/Replacement/Expansion of Medical/Dental School Facilities Modernization / New Construction
16 Multi-Level Parking Structures New Construction
17 Renewal of Engineering Facilities -- SEB Modernization
CATEGORY 3 -- For Future Consideration -- if Funding Identified
18 Renewal and/or Realignment of Library Facilities Modernization
19 Renewal of Talbot College, Elborn College, Chemistry Addition Modernization or Replacement
20 Residence Projects New Construction / Modernization
21 Athletic Facilities -- Indoor and Outdoor New Construction
22 Asset Acquisitions Acquisition
Table 14
WESTERN'S LONG-RANGE SPACE PLAN
Note: within each category, the projects are not prioritized

Western University: 2016-17 Operating and Capital Budgets March 21, 2016
Page 39 of 55
2016-17 Capital Budget
A. The Evolution of Capital Expenditures The Capital Budget for 2016-17 should be seen in the context of both recent trends in capital spending and the University’s proposed Long-Range Space Plan as outlined in Table 14 of the Operating Budget portion of this document. Table 15 sets out expenditures in the Capital Budget since 2012-13 in nine categories. Category 1 shows all new construction, while categories 2 to 7 show renovations to existing space. Category 1 expenditures are usually funded from general University funds, the major exceptions being projects funded all or in part from external research grants, private funds, government, student contributions, and Housing construction – the latter being funded from the Housing budget. Categories 2 to 5 are funded primarily from general University funds and government, while category 6 is funded from Housing operations, and category 7 is funded by the particular Ancillary undertaking the work. Categories 8 and 9 involve carrying costs and loan repayments, and other expenditures such as purchases of land and buildings and transfers from the capital budget for other purposes. Planned capital expenditures for 2016-17 total $134.4 million. Categories 2 to 5 involve Maintenance, Modernization, and Infrastructure (MMI) and are eligible to receive funds from the annual MMI transfer from the operating budget to the capital budget, which is budgeted to increase to $14.75 million in 2016-17 ($14.0 M in 2015-16). These are expenditures directed at modification of existing space and renewal and expansion of the utilities and infrastructure of the University. In planning future expenditures on Maintenance, Modernization, and Infrastructure, it is useful to review the value of our current fixed assets on campus. At February 29, 2016, our buildings and infrastructure have a current replacement value (CRV) of approximately $2,363 million, as follows:
Square Major
CRV $M Metres Buildings
Major Non-Residential Buildings 1,652 529,319 69
Utilities and Infrastructure 200
Subtotal, Eligible for MMI 1,852 529,319 69
Housing 411 257,546 15
Other Ancillary Buildings 100 49,300 8
Total 2,363 836,165 92
At February 29, 2016, the University had 529,000 gross square metres in 69 major non-residential buildings, ranging in size from the Cronyn Observatory (338 square metres) to the Social Science

Western University: 2016-17 Operating and Capital Budgets March 21, 2016
Page 40 of 55
Centre (33,757 square metres). Those buildings, and $200 million in utilities and infrastructure, are the physical assets generally eligible for MMI expenditures. On that same date, the University had 258,000 square metres of Housing space in eleven major undergraduate residences, four major apartment buildings, and numerous smaller buildings for graduate students in Platt’s Lane Estates. Other than Housing, there are many buildings which are operated largely or entirely as ancillaries: Western Student Recreation Centre, Thompson Recreation and Athletic Centre, TD Stadium, Boundary Layer Wind Tunnel, Child Care Centre, the Ivey Spencer Leadership Centre, and facilities at the Research Parks. With this background in mind, we briefly set out the nine categories of capital expenditures. 1. New Construction. This category includes projects which create new buildings, including
housing, additions to existing buildings, and other new facilities such as parking lots and athletic fields. It does not include projects which improve the space within existing buildings or projects which upgrade other existing facilities.
2. Major Building Renovations. This category involves major maintenance and renovation
expenditures on non-residential building projects – and the projects generally span more than one year. Of the 529,000 square metres in major buildings, over 57% was built before 1980, so renovations to major buildings will be a continuing part of University capital planning.
3. Utilities and Infrastructure Projects. This category involves projects with values greater than
$10,000 directed at the upgrading and new installation of utilities and other infrastructure, including boilers and chillers, as well as electrical, water, and sewer distribution systems. Given that most of our Utilities and Infrastructure plant and equipment is over thirty years old, these projects will continue to be a critical part of our capital budget. It is noted that proposed projects in this category include many that are devoted to the renewal of portions of our steam, water and chilled water systems. Major projects in future years will include continued work on electrical distribution systems and utility conservation.
4. Modernization of Instructional and Research Facilities. This category includes the renewal
and modernization of classrooms, laboratories, libraries, and other space used for instruction and research, as well as upgrades to information technology. These expenditures are critical to maintaining Western’s reputation as a leader in the quality of teaching and research. These projects are sometimes funded by the units themselves with operating or research funds.
5. General Maintenance and Modernization Projects. This category consists of a wide variety
of maintenance and modernization projects which are not included in categories 2 to 4. Most of the projects are under $100,000, involving such work as roof replacement, interior and exterior painting, road, bridge, and sidewalk repair, and general maintenance of structures and systems. A small provision for unforeseen projects forms part of the allotment in this category.
6. Housing Renovations. This category includes all maintenance and modernization expenditures
on University residences and apartment buildings. Construction of a new residence or apartment building would be included in category 1. Maintenance and modernization expenditures, projected to be $13.6 million in 2016-17, are funded from Housing revenues. Housing has always set aside adequate maintenance funds and does not have the significant deferred maintenance on its buildings which may be observed in many other University buildings.

Western University: 2016-17 Operating and Capital Budgets March 21, 2016
Page 41 of 55
7. Ancillary Projects. This category includes capital expenditures on Ancillaries other than
Housing, including Hospitality Services, the Book Store, Parking Services, student fee-funded units, self-funded support units, and self-funded research units. These units pay a charge to the University for the space they occupy.
8. Carrying Costs and Debt Repayments. This category consists of principal repayments and
interest on debt for capital projects. 9. Other Capital Expenditures. This category includes asset acquisitions and other miscellaneous
expenditures. It has been an established principle in Western’s Campus Master Plan that the University pursue, as appropriate, the purchase of lands contiguous to University property as lands become available. Western will continue to seek to protect the Regional Facilities zoning around the main campus and to buy land near our campus when it comes up for sale. The University will also look to acquire strategic physical assets.
The last twelve lines of Table 15 are labeled A to M. Line A shows total sources of funding for the capital budget, including debt; B, sources of funds less expenditures; C, the capital reserve at year-end (which changes each year by the amount in line B); and D, capital debt outstanding at year-end. Details on these items are shown in Tables 17 and 19. Annual changes in the Capital Reserve (line C) are driven by the differences between funding and expenditure (line B). Thus for 2014-15, line B shows a surplus of $11,868, the difference between funding of $88,934 (all figures in $000) and expenditures of $77,066. The capital reserve in line C increases by this same amount of $11,868, reflecting an increase in the capital reserve. Line E shows the replacement value of non-residential buildings and utilities and infrastructure – the assets eligible for MMI spending -- while line F shows the ratio of the annual MMI expenditure to the replacement value. For example, in 2014-15, MMI expenditures were $26.0 million, while the estimated replacement value of non-residential buildings, utilities, and infrastructure was $1.78 billion. The ratio of the two is 1.5%, as shown in line F. Line G of Table 15 shows the annual transfer from the operating budget to the capital budget for Maintenance, Modernization, and Infrastructure (the MMI transfer). As part of the 1995 Strategic Plan, the Board of Governors approved an incremental annual base transfer of $750,000 from operating to capital in support of maintenance spending for ten years, from 1996-97 to 2005-06. Since there was an existing transfer of $500,000 in 1995-96, the annual transfer was $8.0 million in 2005-06. In 2004, Western’s Board of Governors approved the recommendation that the base transfer of $750,000 be continued for another ten years after 2005-06 until 2015-16, when the annual transfer will be $15.5 million. This commitment established Western as a leader among Canadian universities in maintaining its facilities and dealing with deferred maintenance. For 2009-10 and 2010-11, given the financial constraints faced by the University at that time, the Board approved the annual transfer be held at $10.25 million. Since that time the base transfer has resumed. In 2016-17, the base transfer will be increased by $750,000 to $14.75 million (2015-16, $14.0 million) and will reach the intended maximum annual transfer of $15.5 million in 2017-18. Line H of Table 15 shows the ratio of the annual MMI transfer to total MMI expenditures; for example, in 2014-15, the transfer was $13.25 million and MMI expenditures were $26.0 million, so the ratio in line H is 50.9%. Other sources of funding for MMI expenditures include the annual

Western University: 2016-17 Operating and Capital Budgets March 21, 2016
Page 42 of 55
capital facilities renewal grant from the Province (projected for 2015-16 and 2016-17 at $2.4 million), special Provincial grants; additional one-time allocations from the University’s operating budget; additional one-time allocations from the Province; fundraising; and borrowing. Line J contains an estimate of maintenance spending, defined narrowly as spending required to bring aging facilities up to their condition when originally built. In fact, whenever Western undertakes a major maintenance project, there is also modernization of the facility, and whenever we carry out a major modernization project, there is generally some maintenance expenditure; it is thus difficult to separate the two. Line J is calculated on the assumption that 2/3 of the expenditures in categories 2, 3, and 5 involve maintenance (the remaining 1/3 involve modernization), while 1/3 of the expenditures in category 4 is for maintenance (the remaining 2/3 involves modernization). While these ratios would vary by project and by year, Facilities Management considers them a reasonable average for the four categories over a number of years. The value of line J in 2014-15 is $15.2 million, or (in line K) 0.9% of the replacement value in that year. A standard target in industry for this ratio is 2.0%: if large buildings last an average of 50 years, then on average maintenance spending should be 2.0% of replacement value. When the actual ratio is consistently lower than 2.0%, as has been the case at Western and most Canadian universities over the last three decades, the level of deferred maintenance will grow. Table 16 reviews major capital projects – and the projects are assigned to one of the nine categories. For most of the projects, the year and month of the start and end of the project are shown. The projects listed in Table 16 are the result of an update to the Long-Range Space Plan outlined in Table 14 of the Operating Budget portion of this document. These projects include new construction that will create the additional space necessary to accommodate undergraduate and graduate enrolment expansion and the associated additional faculty and staff, and major building renovations and utilities and infrastructure projects – reflecting the need to maintain and modernize Western’s aging physical plant. With new building construction on campus continuing, Western is utilizing scarce developable land in the core campus. The Campus Master Plan, approved in June 2015, highlights the constraints in the amount of buildable land on our campus, and the fact that new buildings are being constructed on parking lots – thus increasing the pressure on available parking. We are exploring options for the construction of parking garages in the periphery of campus – including siting, funding plan, and the required parking fee rates to finance the structures. University-wide Infrastructure Projects are also included on Table 16. These projects cover upgrades to Western’s central power plant, chiller facilities and major electrical upgrades – and are typically comprised of multiple projects completed over a number of years. B. Sources of Funding and Capital Expenditures in 2016-17 Table 17 displays sources of funding for budgeted capital expenditures with estimates of comparative data for 2015-16, divided into six major categories: federal, provincial and municipal government grants; funds transferred from Western’s operating budget; interest earned; general fundraising; borrowing; and other sources, including internal recoveries. As compared to a decade ago, the University’s capital budget is more dependent on transfers from the operating budget and debt.

Western University: 2016-17 Operating and Capital Budgets March 21, 2016
Page 43 of 55
Table 18 shows expenditures in Categories 1 and 2, for 2015-16 (estimates as of January 31, 2016) and 2016-17 (current proposals).

Western University: 2016-17 Operating and Capital Budgets March 21, 2016
Page 44 of 55
($000)
Actual Actual Actual Projected BudgetCategory Purpose 2012-13 2013-14 2014-15 2015-16 2016-17
New Construction
1 New Construction (Table 18, line 7) 108,508 55,619 23,523 27,557 55,747
Maintenance, Modernization, and Infrastructure (MMI)
2 Major Building Renovations (Table 18, line 13) 5,565 3,506 4,215 5,401 25,877
3 Utilities and Infrastructure Projects 4,760 3,737 9,790 8,279 8,518
4 Modernization of Instructional and Research Facilities 5,805 5,266 6,480 6,753 9,813
5 General Maintenance and Modernization Projects 4,826 4,819 5,523 6,218 10,670
Sub-Total MMI 20,956 17,328 26,008 26,651 54,878
Other
6 Housing Renovations 5,860 7,073 20,012 9,680 13,587
7 Ancillary Projects 1,099 1,503 1,187 2,317 880
8 Carrying Costs and Debt Repayments 3,541 5,077 5,843 6,613 6,354
9 Other Capital Expenditures 48 18 493 1,555 2,986
Sub-Total Other 10,548 13,671 27,535 20,165 23,807
10 Total Expenditures 140,012 86,618 77,066 74,373 134,432
Actual Actual Actual Projected BudgetLine 2012-13 2013-14 2014-15 2015-16 2016-17
Sources of Funding, Reserves, and Debt
A Total Sources of Funding, Including Debt (Table 17) 146,646 83,780 88,934 78,168 111,206
B Sources of Funding less Expenditures 6,634 -2,838 11,868 3,795 -23,226
C Capital Reserve, Year End (Table 19) 30,891 28,053 39,921 43,716 20,490
D Capital Debt Outstanding, Year End (Table 19) 314,148 306,703 299,065 291,565 283,784
EReplacement Value of Nonresidential Buildings, Utilities & Infrastructure, $M
1,608 1,750 1,783 1,852 1,883
F MMI Expenditures/Replacement Value 1.3% 1.0% 1.5% 1.4% 2.9%
G Annual MMI transfer from Operating to Capital Budget 11,750 12,500 13,250 14,000 14,750
H MMI transfer/MMI Expenditures 56.1% 72.1% 50.9% 52.5% 26.9%
J Estimate of Maintenance Expenditure 12,036 9,797 15,179 15,516 33,314
K Maintenance Expenditure/Replacement Value 0.7% 0.6% 0.9% 0.8% 1.8%
L Number of Major Buildings 86 91 91 92 93
M Total Gross Square Meters (000's) 784 829 829 836 848
Category 8 does not include carrying costs and loan repayments for Residences and Apartments, Research Park,
and the Richard Ivey School of Business Foundation.
Line B is equal to Line A Total Sources of Funding less Total Expenses.
The change in line C from one year to the next is equal to Line B.
Line J consists of 2/3 of Category 2, 3 and 5 and 1/3 of Category 4.
CAPITAL BUDGET SUMMARY, 2012-13 TO 2016-17Table 15

Western University: 2016-17 Operating and Capital Budgets March 21, 2016
Page 45 of 55
Category Start End
1 Projects Underway or Soon-to-Start
2 New Music Building - and removal of Old Music Building 1&9 Mar 12 Apr 17
3 New Academic Building (To House FIMS and Nursing) 1 Jan 14 Dec 16
4 Medical Research Facilities (Microbiology & Immunology & RRI) 2 Dec 14 Dec 16
5 Modernization of University College 2 Jan 15 Sep 18
6 Western Interdisciplinary Research Building - Phase 1 1 Nov 15 Jan 18
7 New Engineering Building 1 Jan 16 Sep 18
8 Follow-on Renovation Projects - HSA, NCB 2 Jan 17 Aug 18
9 Integrated Learning and Innovation Centre 1 Sep 16 tbd
10 University-wide Infrastructure Projects (multiple stages) 1&3 May 16 Apr 17
11 Parking-related Projects 1&3 May 14 tbd
12 Campus Sustainability Initiatives (multiple stages) 3&5 Ongoing
13 Projects Under Consideration
14 Modernization of Thames Hall 2 tbd tbd
15 Follow-on Renovation Projects - NSc 5 tbd tbd
16 New Research Initiatives/Partnerships at the Research Parks 1 tbd tbd
17 Renewal/Replacement/Expansion of Medical/Dental School Facilities 1&2 tbd tbd
18 Multi-Level Parking Structures 1 tbd tbd
19 Renewal of Engineering Facilities - SEB 4 tbd tbd
20 Projects for Future Consideration
21 Renewal and/or Realignment of Library Facilities 2 tbd tbd
22 Renewal of Talbot College, Elborn College, Chemistry Addition 2 tbd tbd
23 Residence Projects 1&7 tbd tbd
24 Athletic Facilities - Indoor and Outdoor 1 tbd tbd
25 Asset Acquisitions 9 tbd tbd
MAJOR CAPITAL PROJECTSTable 16

Western University: 2016-17 Operating and Capital Budgets March 21, 2016
Page 46 of 55
Table 17CAPITAL BUDGET: SOURCES OF FUNDING
($000)
Projected Budget2015-16 2016-17
1 Government Grants
2 MTCU Targeted Capital Grant - New Academic Building (to house FIMS and Nursing) 14,000 5,000
3 MTCU Graduate Expansion Capital Grant 3,846 3,808
4 MTCU Annual Capital Grant (Facilities Renewal Program) 2,424 2,424
5 Sub-Total 20,270 11,232
6 Operating Budget
7 Operating Budget MMI Transfer - Base 14,000 14,750
8 Operating Budget MMI Transfer - Base (Ancillaries) 600 600
9 Operating Budget - Integrated Learning and Innovation Centre 0 15,000
10 Operating Budget - FFICR 3,000 3,000
11 Operating Budget - Energy Efficiency and Classroom Upgrades 1,908 2,000
12 Operating Budget - Pedestrian Friendly and Campus Safety Initiatives 0 2,000
13 Operating Budget - CRC Transfer 808 760
14 Engineering Operating Budget - New Engineering Building 4,476 5,543
15 Medicine Operating Budget - Medical Research Facilities (Microbiology & Immunology & RRI) 806 3,950
16 Music Operating Budget - New Music Building - and removal of Old Music Building 250 2,000
17 Science Operating Budget - Chemistry and WISc Integrated Laboratories 1,750 1,924
18 Education Operating Budget - Modernization of Instructional Facilities in FEB 0 1,600
19 Social Science Operating Budget - Academic Facility Renewal Projects 0 1,498
20 Dentistry Operating Budget - Modernization of Dentistry Teaching Laboratories 1,452 648
21 Miscellaneous Faculty/Department Budgets 871 307
22 Sub-Total 29,921 55,580
23 Interest Earned 52 0
24 Fundraising
25 Ivey Building 2,400 1,921
26 Western Fund 350 350
27 The Claudette MacKay-Lassonde Pavilion (Green Building) 290 290
28 All Other 76 0
29 Sub-Total 3,116 2,561
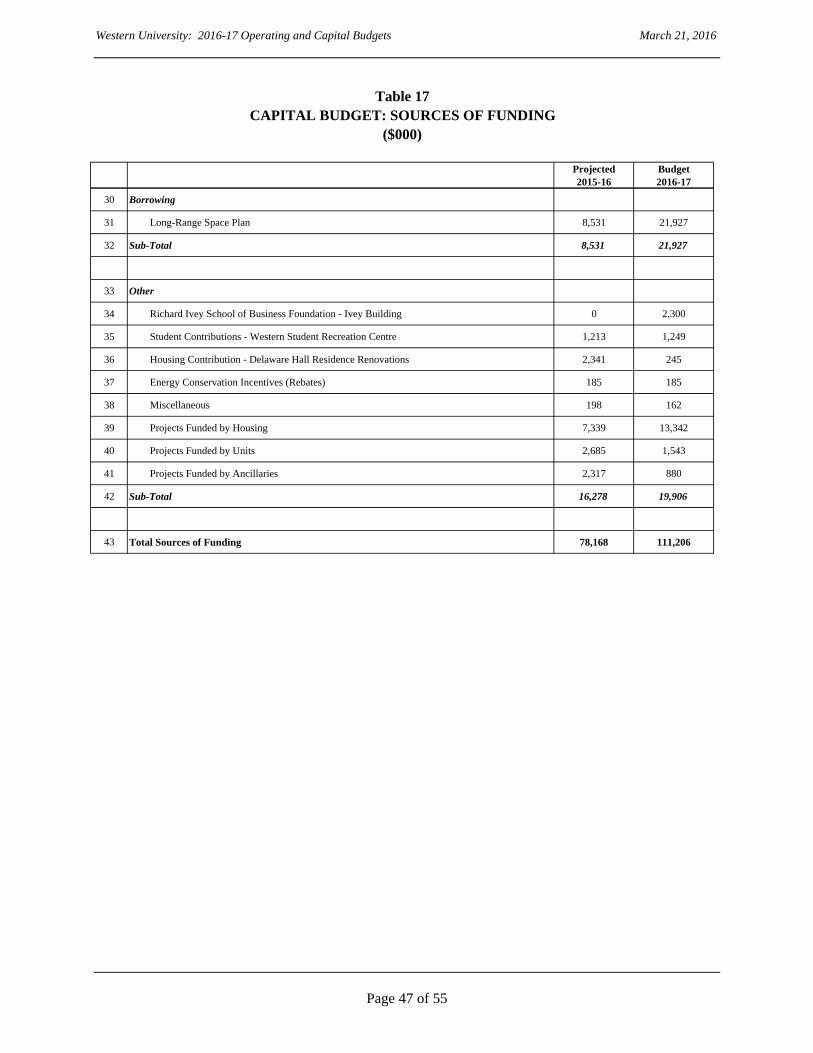
Western University: 2016-17 Operating and Capital Budgets March 21, 2016
Page 47 of 55
Table 17CAPITAL BUDGET: SOURCES OF FUNDING
($000)
Projected Budget2015-16 2016-17
30 Borrowing
31 Long-Range Space Plan 8,531 21,927
32 Sub-Total 8,531 21,927
33 Other
34 Richard Ivey School of Business Foundation - Ivey Building 0 2,300
35 Student Contributions - Western Student Recreation Centre 1,213 1,249
36 Housing Contribution - Delaware Hall Residence Renovations 2,341 245
37 Energy Conservation Incentives (Rebates) 185 185
38 Miscellaneous 198 162
39 Projects Funded by Housing 7,339 13,342
40 Projects Funded by Units 2,685 1,543
41 Projects Funded by Ancillaries 2,317 880
42 Sub-Total 16,278 19,906
43 Total Sources of Funding 78,168 111,206

Western University: 2016-17 Operating and Capital Budgets March 21, 2016
Page 48 of 55
Projected Budget2015-16 2016-17
1 Category 1: New Construction
2 Western Interdisciplinary Research Building - Phase 1 2,255 25,000
3 New Academic Building (To House FIMS and Nursing) 20,340 15,605
4 New Engineering Building 180 11,000
5 New Music Building - and removal of Old Music Building 2,431 4,000
6 Secondary IT Data Centre at the AMP 2,351 142
7 Total, Category 1 27,557 55,747
8 Category 2: Major Building Renovations
9 Modernization of University College 2,362 12,875
10 Medical Research Facilities (Microbiology & Immunology & RRI) 1,587 10,254
11 Modernization of Instructional Facilities in the Althouse Faculty of Education Building 0 2,100
12 Modernization of Dentistry Teaching Laboratories 1,452 648
13 Total, Category 2 5,401 25,877
CAPITAL EXPENDITURES FOR NEW CONSTRUCTION AND MAJOR BUILDING RENOVATIONS
Table 18
($000)
2015-16 and 2016-17

Western University: 2016-17 Operating and Capital Budgets March 21, 2016
Page 49 of 55
($000)
Actual Actual Actual Projected Budget
2012-13 2013-14 2014-15 2015-16 2016-17
1 A. Capital Reserves
2 General Capital Fund 13,359 17,118 13,802 16,922 10,238
3 Designated Capital Fund 15,898 9,293 24,469 25,142 8,600
4 Gibbons Property 1,634 1,642 1,650 1,652 1,652
5 Total Capital Reserves 30,891 28,053 39,921 43,716 20,490
Actual Actual Actual Projected Budget
2012-13 2013-14 2014-15 2015-16 2016-17
6 B. Capital Debt
7 New Construction, Major Renovations & Other 126,377 123,519 100,290 100,628 129,548
8 Housing 139,671 152,066 144,575 132,437 120,136
9 Research Park 31,100 30,318 29,500 28,800 27,900
10 Richard Ivey School of Business Foundation 1,300 800 300 0 0
11 Unused and Invested Debenture Proceeds 15,700 0 24,400 29,700 6,200
12 Total Capital Debt 314,148 306,703 299,065 291,565 283,784
Line 2 includes the required $6 million general capital reserve fund.
Line 3 includes fund balances for large capital projects
CAPITAL RESERVES AND DEBT AT FISCAL YEAR ENDTable 19

Western University: 2016-17 Operating and Capital Budgets March 21, 2016
Page 50 of 55
Long-Term Financial Trends
The Operating and Capital Budgets set out in this document describe, in Tables 2 and 15, proposed spending of some $867 million for the single year of 2016-17. That spending will take place, however, in a longer term context which must be understood in evaluating the Operating and Capital Budgets. The Administration and Board have identified three elements of that longer term context which should be reviewed in the annual Budget of the University: capital reserves and debt, employee future benefits, and deferred maintenance. These three items are described below. The long term context for Western changed in May 2007, when the University issued its first debenture, for $190 million. As part of this process, the University received a credit rating of AA from Standard & Poor’s. This credit rating was reaffirmed in February of 2016. Part of the credit rating evaluation focused on a number of long-term obligations that the University manages on an ongoing basis, including the three which we review below. A. Capital Reserves and Debt Table 19 displays Capital Reserves and Debt for April 30 fiscal year-ends. Capital Reserves are divided into three categories:
The General Capital Fund, not yet designated for specific purposes and funds designated for future infrastructure projects
Designated Capital Fund, which has been assigned to specific capital projects Gibbons Property, the remaining funds from the sale of that property
The University’s intention is that when the Gibbons funds are spent, there will be naming opportunities to honor the Gibbons name. Capital Debt is divided into the following categories:
New Construction, Major Renovations, Infrastructure, and Other – represents debt on projects that are largely new construction, additions to existing buildings, other new facilities, non-residential projects that involve major maintenance and renovations to existing space. It also includes debt on purchases of property and parking related projects.
Housing – debt required for new construction, maintenance, and modernization projects for
University residences and apartment buildings.
Research Park – debt incurred by the Research Park.
Richard Ivey School of Business Foundation – debt held by Richard Ivey School of Business Foundation.

Western University: 2016-17 Operating and Capital Budgets March 21, 2016
Page 51 of 55
Unused and Invested Debenture Proceeds – unused proceeds from Western’s first debenture issue that have been committed, and invested until the specific capital project requires the funding.
In 2002-03, the Board of Governors approved a Capital Debt Policy, which included a limit of $7,500 in debt per student full-time equivalent (FTE). In 2005-06, the Board policy was modified to increase the $7,500 each year by the change in the CPI, beginning in 2002. The table below shows the allowed debt per FTE (shown with indexation beginning in 2003-04) and actual debt per FTE; the figures are for years ending on April 30th. Debt was increased significantly in 2008 due to the issuance of the $190 million debenture, and again in 2013 when the University entered into a $100 million long-term facility to finance the new 1,000 bed residence and other capital projects.
Actual Forecast
2014 2015 2016 2017
Total Debt (in millions) $307 $299 $292 $284
FTE Enrolment 31,448 31,766 31,765 32,390
Allowable debt per FTE $9,393 $9,581 $9,772 $9,968
Actual debt per FTE $9,753 $9,412 $9,175 $8,762
Debt room per FTE ($360) $169 $597 $1,206
In 2016, the maximum allowed debt per FTE under Western’s Capital Debt Policy is $9,772 and the forecast is $9,175. Figure E shows total debt as well as three measures of debt per FTE since 2013: the maximum allowable debt, indexed to the CPI; the actual and projected debt; and the difference between the two, which we call debt room. The projected debt is based on Board-approved projects with allowance for other projects which may be presented to the Board during the period under consideration. Figure E shows that projected debt grew beyond the maximum allowable debt from 2013 to 2014 to support the funding of the new student residence, as approved by the Board. In 2015, total debt once again reduced to within Board Policy.

Western University: 2016-17 Operating and Capital Budgets March 21, 2016
Page 52 of 55
Figure HProjected Debt
(for Approved and Anticipated Projects -- at April 30th)
-100
-50
0
50
100
150
200
250
300
350
400
450
2011
2012
2013
2014
2015
2016
2017
2018
2019
2020
2021
2022
2023
2024
2025
2026
2027
Projected
Max Allowable
Debt Room (Allowable – Projected)
$ M
illi
ons
Combined FTE Revenue Debt /
Debt ($M)
Revenue ($M)
Enrolment per FTE Revenue
(%)
2012 215.4 1,017.4 30,679 $33,163 21.2%
2013 314.1 1,081.3 31,018 $34,860 29.0%
2014 306.7 1,159.3 31,448 $36,864 26.5%
2015 299.0 1,160.4 31,766 $36,530 25.8%
2016 p 291.5 1,101.8 31,765 $34,686 26.5%

Western University: 2016-17 Operating and Capital Budgets March 21, 2016
Page 53 of 55
B. Employee Future Benefits Subject to eligibility rules set within various collective agreements, the University provides medical, dental and life insurance benefits to eligible employees after their employment with Western has ended. These employee future benefits are determined using actuarial valuations every three years. In the years between valuations, an extrapolation of the actuarial valuation is used to determine the projected benefit obligations. At April 30, 2015, the University's accrued benefit liability relating to the employee future benefit plans was $482 million (2014 - $402 million). Cost containment of active and post-retirement benefits has been a focus in recent negotiations. For staff, Western introduced a measure that limits cost increases for active and retiree benefits to no greater than CPI (3% maximum) in each year, reduced the age limit for dependent coverage and increased service requirements to qualify for post-retirement benefits to 10 years. For faculty, the threshold for eligibility has been increased from 5 to 10 years for all new employees and cost containment changes were introduced to the plan. Included in the University’s 2015 Audited Combined Statement of Operations is an annual expense in the amount $22.5 million (2014 - $23.2 million) for non-pension employee future benefits. A recent review of major research universities identified only five institutions with significant post-employment benefit obligations greater than $200 million, ranging from $227 million to $581 million and an unweighted average of $371 million. Western ranked 2nd in total liability for Employee Future Benefits. The ratio of obligations to total revenues ranged from 20.5% to 41.6% with an unweighted average of 30.4%.
Employee Future Benefits (EFB) Obligation and Expense as a % of Total Expenditures: 2011 to 2015
Total EFB EFB
University Obligation Expense
Obligation Expense Expenses as % of as % of
($M) ($M) ($M) Total Total
2011 $287.4 $23.3 $952 30.1% 2.4%
2012 $339.9 $19.6 $975 34.9% 2.0%
2013 $362.6 $22.6 $1,009 35.9% 2.2%
2014 $401.7 $23.2 $1,067 37.6% 2.2%
2015 $482.3 $22.5 $1,084 44.4% 2.1%

Western University: 2016-17 Operating and Capital Budgets March 21, 2016
Page 54 of 55
C. Deferred Maintenance Deferred Maintenance is defined as work on the maintenance of physical facilities that has been deferred on a planned or unplanned basis to a future budget cycle or postponed until funds become available. To avoid increasing the size of the deferred maintenance backlog, it is necessary to carry out replacement of facility components on an annual basis. The estimates of deferred maintenance are different than estimates of debt or employee future benefits in the previous sections. There are actual contracts in place for the first two that allow us to make reasonable estimates. For deferred maintenance, that is not the case; therefore, we have to find other ways to quantify this liability. In 2001, a common capital-asset management system was purchased by the Ontario University system to assess, track, and report on the condition of facilities. The system requires that each major component of a building – roof sections, classrooms, heating, ventilation, air-conditioning systems and so on – be inspected, either entirely or on a sample basis. Data on the findings of these inspections are entered into a central database. The system uses industry-standard cost and lifecycle data to forecast the timing and costs of capital renewal projects. The Facilities Management Division estimates that (as of February 29, 2016) deferred maintenance at Western is $210 million for non-residential buildings and $35 million for residences. Slightly more than 50% of the deferred maintenance for non-residential buildings relates to mechanical, electrical, and infrastructure requirements. Other major components include maintenance driven by code requirements and maintenance for roofs and windows. A common measure for determining the overall condition of facilities is the ratio of deferred maintenance over replacement value of the facilities. The calculation for February 29, 2016 is as follows:
Non-Residential Combined
Buildings Residences
Current Replacement Value (CRV) $1,852 million $ 411 million
Deferred Maintenance (DM) $210 million $35 million
DM/CRV 11.3% 8.5%
The average age of buildings for universities in the Province of Ontario was 42.9 years as of June 2015. Western’s average age is 39.5 years. Over 57% of our buildings were built before 1980. Western’s residences are funded through rents which cover maintenance; the University has never had a problem with deferred maintenance on residences. A ratio of 11.3% (Deferred Maintenance/Current Replacement Value) for non-residential buildings indicates a significant need for maintenance funding. If the average component of a large building lasts 50 years, then on average, maintenance spending should be 2.0% of replacement value. This level of spending is a standard target in the industry. When the actual ratio is consistently less than 2.0%, as has been the case at most Canadian universities, the volume of deferred maintenance will grow. Failure to adequately address deferred maintenance results in substandard facilities and could result in the failure of critical systems. Based

Western University: 2016-17 Operating and Capital Budgets March 21, 2016
Page 55 of 55
on the current replacement value of our facilities at $1.85 billion, spending on major maintenance for campus buildings at 2% should be in the range of $37 million annually. As part of the 1995 Strategic Plan, the Board of Governors approved an incremental annual base transfer of $750,000 from operating capital in support of maintenance spending for ten years, from 1996-97 to 2005-06. In 2004, Western’s Board of Governors approved the recommendation that the base transfer of $750,000 be continued for another ten years after 2005-06, until 2015-16, when the annual transfer will be $15.5 million. However, for 2009-10 and 2010-11, the annual transfer was maintained at $10.25 million. For 2016-17, the base transfer will be increased by $750,000 to $14.75 million (2015-16, $14.0 million) and will reach the intended maximum annual transfer of $15.5 million in 2017-18. As explained at the start of the Capital Budget, the maintenance transfer is used for Maintenance, Modernization, and Infrastructure (MMI). The administration is sometimes asked by faculty and staff if the MMI transfer is too large. As lines G and E in Table 15 show, the ratio of the MMI transfer to the current replacement value (CRV) of our nonresidential buildings, utilities, and infrastructure has been below 1% in recent years.
Actual Actual Actual Projected Budget 2012-13 2013-14 2014-15 2015-16 2016-17
MMI ($M) $ 11.75 $ 12.50 $ 13.25 $ 14.0 $ 14.75
CRV ($M) $ 1,608 $ 1,750 $ 1,783 $ 1,852 $ 1,883
Ratio 0.73% 0.71% 0.74% 0.77% 0.78%
Thus the MMI transfer from the operating to the capital budget is less than half the 2% required to keep deferred maintenance from growing. Continuation of this MMI transfer is essential to maintaining a safe and reliable campus infrastructure, which supports modern research and teaching, and sustains faculty, staff, and student morale. Line J of Table 15 presents an estimate of maintenance spending from all sources, with maintenance defined as spending required to bring aging facilities up to their condition when originally built. During the five years, 2006-07 through 2010-11, the ratio was about 2%, so that the level of deferred maintenance was stabilized. The University reached the 2% ratio with one-time funds from the provincial and federal governments, and by borrowing. The actual ratio in 2014-15, and the estimated ratios through 2016-17 have fallen short of the 2% target. In 2015-16, the Province increased its annual facilities renewal grant to the prior level of $40 million (for Ontario’s universities and colleges). Western’s share of this $40 million is $2.4 million in 2016-17. The Ontario government has committed to a gradual increase in this total level of funding to $100 million by 2019-20, and the universities’ share is normally about two-thirds of this total. While this increased support is welcome, the most recent assessment within the sector indicates the need for much larger investments (on an entirely different scale) to begin to restore to the condition of university facilities.