Embed Size (px)
Citation preview
2016 Annual Mining and Reclamation Report Humboldt Mill Mine Permit MP 01 2010 March 15, 2017
Contents
1. Document Preparers and Qualifications .................................................................................................. 1
2. Introduction ............................................................................................................................................ 2
3. Site Modifications and Amendments ....................................................................................................... 2
4. Processing Activities and Data Report ..................................................................................................... 2
4.1. Processing Report ...................................................................................................................................... 2 4.1.1. Tailings ......................................................................................................................................... 4
5. Site Water Usage, Treatment and Discharge ........................................................................................... 5
5.1. Supply Water Sources and Use ................................................................................................................. 5
5.2. Storm Water Control ................................................................................................................................. 6
5.3. Water Treatment Plant Operations and Discharge .................................................................................. 6
5.4. Water Balance ........................................................................................................................................... 7
6. Materials Handling .................................................................................................................................. 8
6.1. Fuel Handling ............................................................................................................................................. 8
6.2. Bulk Chemical Handling and Storage ........................................................................................................ 9
7. Monitoring Activities ............................................................................................................................... 9
7.1. Water Quality Monitoring ......................................................................................................................... 9 7.1.1. Quarterly Groundwater Quality Monitoring ............................................................................... 9 7.1.2. Quarterly Surface Water Quality Monitoring ........................................................................... 13
7.2. Sediment Sampling .................................................................................................................................. 15
7.3. Regional Hydrologic Monitoring.............................................................................................................. 15 7.3.1. Continuous Groundwater Elevations ........................................................................................ 15 7.3.2. Continuous Surface Water Monitoring ..................................................................................... 16
7.4. Cut-Off Wall Water Quality Review ......................................................................................................... 17
7.5. Biological Monitoring............................................................................................................................... 18 7.5.1. Flora and Fauna Report ............................................................................................................. 18 7.5.2. Threatened and Endangered Species ....................................................................................... 19 7.5.3. Fisheries and Macro Invertebrate Report ................................................................................. 20 7.5.4. Fish Tissue Survey ...................................................................................................................... 22
7.6. Miscellaneous Monitoring ....................................................................................................................... 23 7.6.1. Soil Erosion Control Measures .................................................................................................. 23 7.6.2. Impermeable Surface Inspections ............................................................................................. 23 7.6.3. Tailings Line Inspection .............................................................................................................. 23 7.6.4. Geochemistry Program .............................................................................................................. 24
8. Reclamation Activities ........................................................................................................................... 24
9. Contingency Plan Update ...................................................................................................................... 24
10. Financial Assurance Update ................................................................................................................... 25
11. Organizational Information ................................................................................................................... 25
Appendices Appendix A Humboldt Mill Site Map
Appendix B Bathymetry Surveys
Appendix C Storm Water Drainage Map
Appendix D Water Balance Diagrams
Appendix E Groundwater Monitoring Well Location Map
Appendix F Groundwater Monitoring Well Results and Benchmark Summary Table
Appendix G Groundwater Trend Analysis Summary
Appendix H Surface Water Monitoring Location Map
Appendix I Surface Water Results and Benchmark Summary Table
Appendix J Surface Water Trend Analysis Summary
Appendix K Sediment Results
Appendix L Groundwater Hydrographs
Appendix M Flora and Fauna Survey Location Maps
Appendix N Aquatic Survey Location Maps
Appendix O Contingency Plan Update
Appendix P Organizational Information
Acronyms and Abbreviations AEM Advanced Ecological Management
BMPs best management practices CN Canadian National DO dissolved oxygen Eagle Eagle Mine LLC. EMT Emergency Medical Technician
gpm gallons per minute HDPE high-density polyethylene HTDF Humboldt Tailings Disposal Facility KME King and MacGregor Environmental
MER Middle Branch Escanaba River MDEQ Michigan Department of Environmental Quality MDNR Michigan Department of Natural Resources MG million gallons
MRR Mining and Reclamation Report µg/L micrograms per liter mg/L milligrams per liter MNFI Michigan Natural Features Inventory MSL mean sea level
NPDES National Pollution Discharge Elimination System NREPA Natural Resources & Environmental Protection Act NTU Nephelometric Turbidity Units ORP Oxidation Reduction Potential
PEC Probable Effects Concentration Q1 Quarter 1 QAL quaternary unconsolidated formation SESC Soil Erosion and Sedimentation Control
SU standard units SWPPP Storm water Pollution Prevention Plan t metric ton (tonne) TDS total dissolved solids TEC Threshold Effects Concentration
UFB upper fractured bedrock WBR Black River WTP Water Treatment Plant
1
1. Document Preparers and Qualifications
This Mining and Reclamation Report (MRR) was prepared by the Eagle Mine-Humboldt Mill Environmental Department and incorporates information prepared by other qualified professionals. Table 1 provides a listing of the individuals and organizations who were responsible for the preparation of this MRR as well as those who contributed information for inclusion in the report.
Table 1. Document Preparation – List of Contributors Organization Name Title Individuals responsible for the preparation of the report Eagle Mine LLC David Tornberg Environmental Field Technician Eagle Mine LLC Kristen Mariuzza HSE & Permitting Manager Eagle Mine LLC Amanda Zeidler HSE Superintendent Report contributors Advanced Ecological Management, LLC. Doug Workman Aquatic Scientist Eagle Mine LLC Jason Evans Land & Information Management Specialist Eagle Mine LLC Travis Hansen Senior Metallurgist Eagle Mine LLC Mark Ketchem Operations Supervisor Eagle Mine LLC Jennifer Nutini Environmental Engineer Eagle Mine LLC Roger Olson Water Systems Superintendent Eagle Mine LLC Bill Scarffe Mill Superintendent Eagle Mine LLC Darby Stacey Mill Manager Eagle Mine LLC Hugo Stanton Chief Metallurgist Golder Associates Gary Daniels Senior Engineer King & MacGregor Environmental, Inc. Matt MacGregor Wetland Scientist/Biologist
2
2. Introduction
Eagle Mine officially began the remediation and reconstruction of the Humboldt Mill located in Humboldt Township in October 2008. Processing of ore from the Eagle Mine commenced in September 2014. Due to the commencement of milling operations, Eagle Mine is required per Part 632 to submit an annual Mining and Reclamation Report as detailed in R 425.501.
The MRR is required to provide a description of mining and reclamation activities, updated contingency plan, monitoring results, tonnage of material processed, and a list of incident reports that created, or may create a threat to the environment, natural resources, or public health and safety at the Eagle Mine Site. In addition, this MRR will also memorialize the decisions and/or modifications that have been approved throughout the process.
3. Site Modifications and Amendments
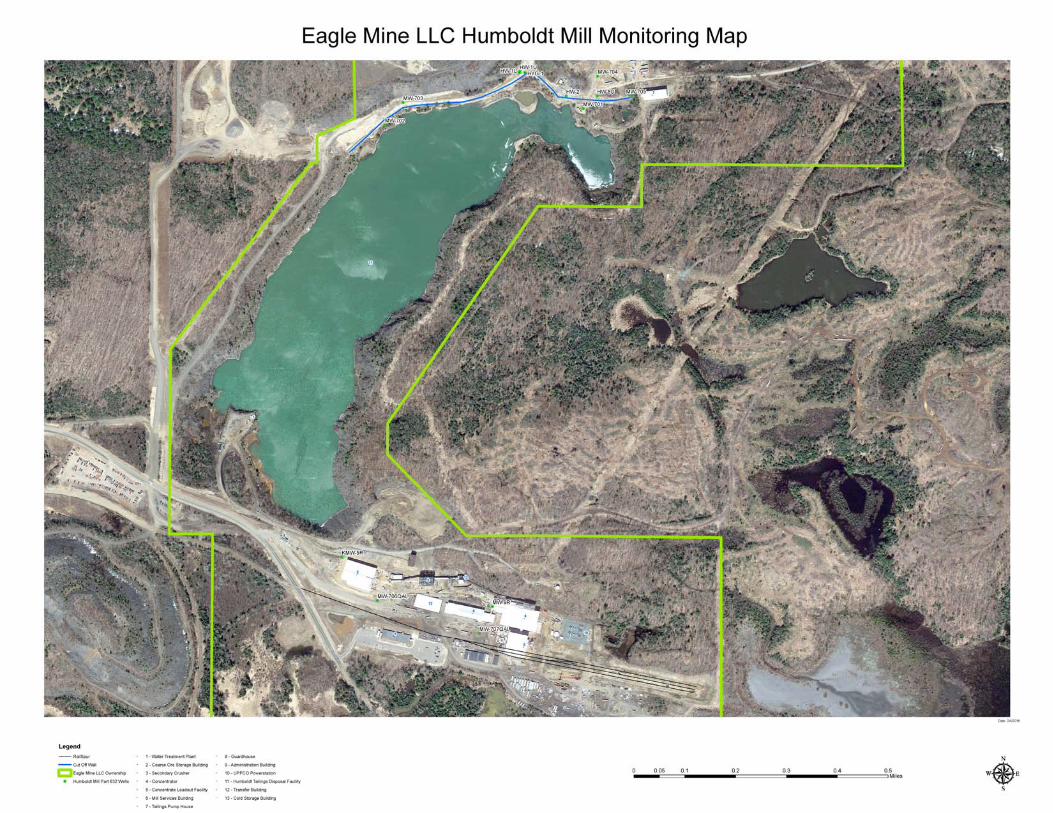
No permit modifications or amendments were submitted to the Department in 2016. Table 4a. below summarizes the submittals that were provided to the Department in 2016 as required under the Part 632 Mining Permit. A copy of the current site map is provided in Appendix A.
Table 3. Submittals Required Under Part 632 Date Description Approval 3/14/16 Submitted 2015 Annual Mining and Reclamation Report N/A 4/6/16 Submitted Q1 groundwater and surface water monitoring data N/A 4/28/16 Submitted response to request for additional information – Annual Mining
and Reclamation Report N/A 5/4/16 Submitted Pollution Incident Prevention Plan (PIPP) notification N/A 7/15/16 Submitted Q2 groundwater and surface water monitoring data N/A 10/23/16 Submitted Q3 groundwater and surface water monitoring data N/A 1/26/17 Submitted Q4 groundwater and surface water monitoring data N/A
4. Processing Activities and Data Report
As of September 23, 2014, the mill was officially operating and producing concentrate. The commencement of milling activities initiated all monitoring programs per the Part 632 Mining Permit. A description of the monitoring activities can be found in Section 7 of this report.
4.1. Processing Report
In 2016, 746,698 dry metric tonnes (t) of ore was transported from the Eagle Mine to the Humboldt Mill by over the road haul trucks. Table 4.1 below summarizes the dry tonnes of ore crushed and milled and the total volume of nickel and copper concentrate produced in 2016.
3
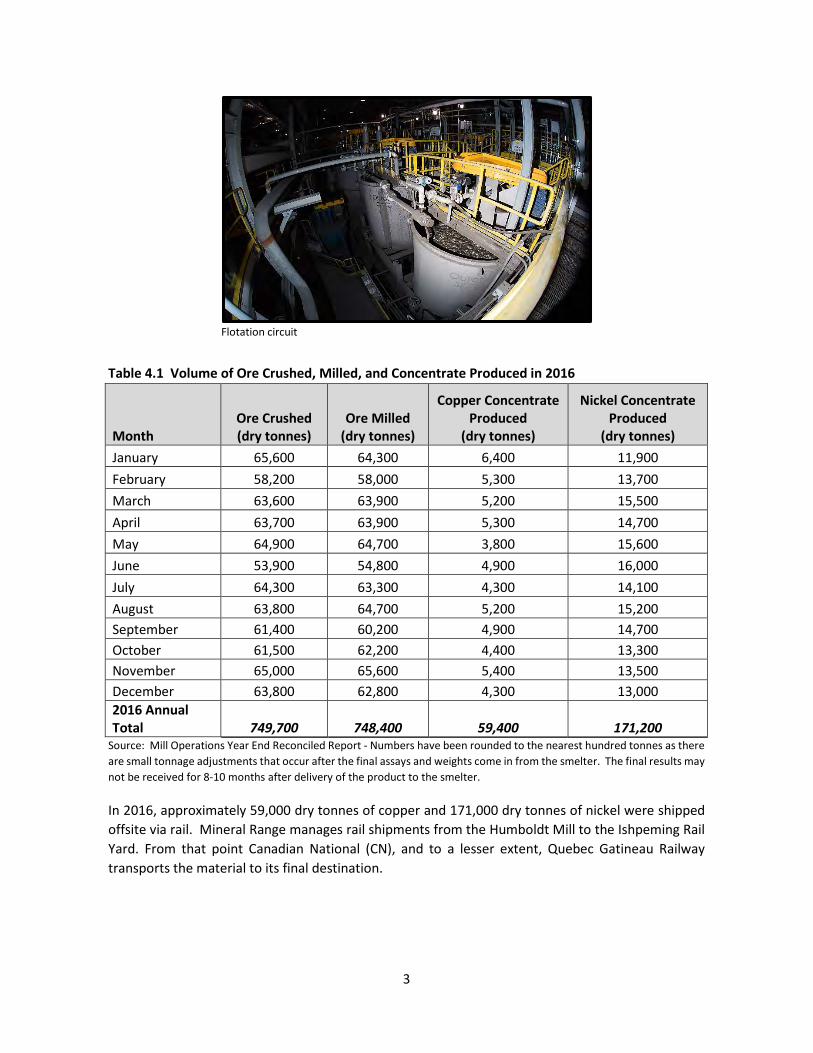
Flotation circuit
Table 4.1 Volume of Ore Crushed, Milled, and Concentrate Produced in 2016
Month Ore Crushed (dry tonnes)
Ore Milled (dry tonnes)
Copper Concentrate Produced
(dry tonnes)
Nickel Concentrate Produced
(dry tonnes) January 65,600 64,300 6,400 11,900 February 58,200 58,000 5,300 13,700 March 63,600 63,900 5,200 15,500 April 63,700 63,900 5,300 14,700 May 64,900 64,700 3,800 15,600 June 53,900 54,800 4,900 16,000 July 64,300 63,300 4,300 14,100 August 63,800 64,700 5,200 15,200 September 61,400 60,200 4,900 14,700 October 61,500 62,200 4,400 13,300 November 65,000 65,600 5,400 13,500 December 63,800 62,800 4,300 13,000 2016 Annual Total 749,700 748,400 59,400 171,200
Source: Mill Operations Year End Reconciled Report - Numbers have been rounded to the nearest hundred tonnes as there are small tonnage adjustments that occur after the final assays and weights come in from the smelter. The final results may not be received for 8-10 months after delivery of the product to the smelter.
In 2016, approximately 59,000 dry tonnes of copper and 171,000 dry tonnes of nickel were shipped offsite via rail. Mineral Range manages rail shipments from the Humboldt Mill to the Ishpeming Rail Yard. From that point Canadian National (CN), and to a lesser extent, Quebec Gatineau Railway transports the material to its final destination.
4
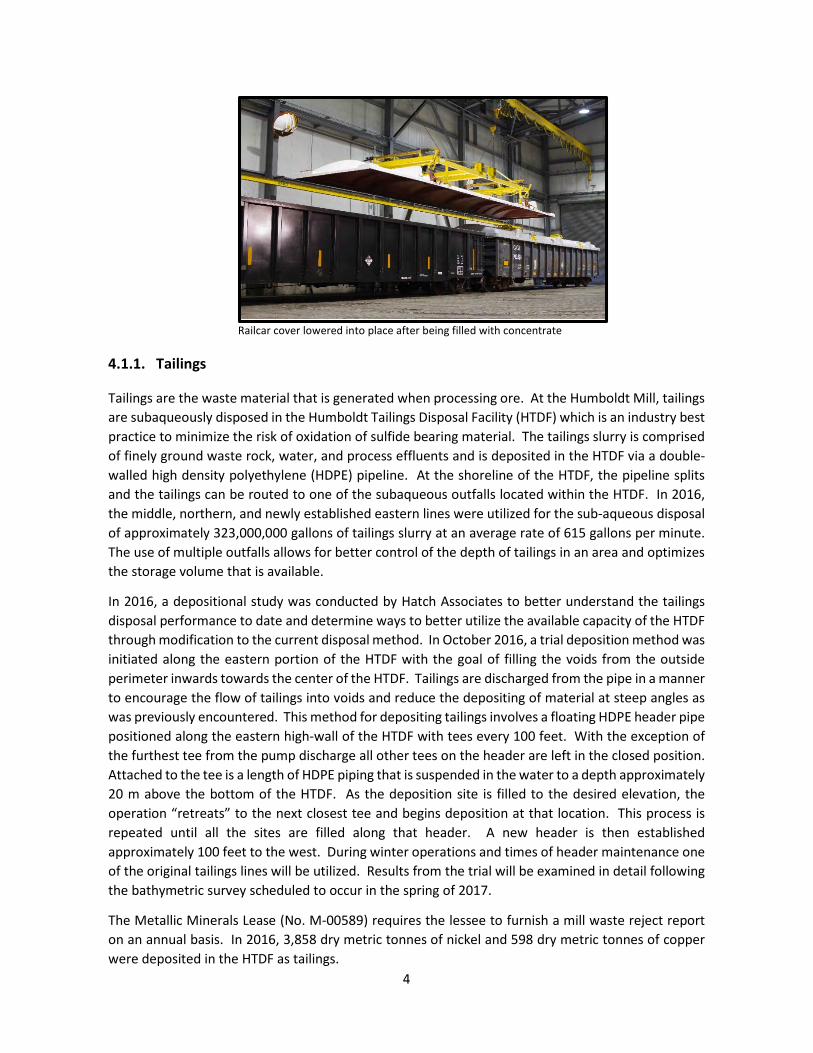
Railcar cover lowered into place after being filled with concentrate
4.1.1. Tailings
Tailings are the waste material that is generated when processing ore. At the Humboldt Mill, tailings are subaqueously disposed in the Humboldt Tailings Disposal Facility (HTDF) which is an industry best practice to minimize the risk of oxidation of sulfide bearing material. The tailings slurry is comprised of finely ground waste rock, water, and process effluents and is deposited in the HTDF via a double-walled high density polyethylene (HDPE) pipeline. At the shoreline of the HTDF, the pipeline splits and the tailings can be routed to one of the subaqueous outfalls located within the HTDF. In 2016, the middle, northern, and newly established eastern lines were utilized for the sub-aqueous disposal of approximately 323,000,000 gallons of tailings slurry at an average rate of 615 gallons per minute. The use of multiple outfalls allows for better control of the depth of tailings in an area and optimizes the storage volume that is available.
In 2016, a depositional study was conducted by Hatch Associates to better understand the tailings disposal performance to date and determine ways to better utilize the available capacity of the HTDF through modification to the current disposal method. In October 2016, a trial deposition method was initiated along the eastern portion of the HTDF with the goal of filling the voids from the outside perimeter inwards towards the center of the HTDF. Tailings are discharged from the pipe in a manner to encourage the flow of tailings into voids and reduce the depositing of material at steep angles as was previously encountered. This method for depositing tailings involves a floating HDPE header pipe positioned along the eastern high-wall of the HTDF with tees every 100 feet. With the exception of the furthest tee from the pump discharge all other tees on the header are left in the closed position. Attached to the tee is a length of HDPE piping that is suspended in the water to a depth approximately 20 m above the bottom of the HTDF. As the deposition site is filled to the desired elevation, the operation “retreats” to the next closest tee and begins deposition at that location. This process is repeated until all the sites are filled along that header. A new header is then established approximately 100 feet to the west. During winter operations and times of header maintenance one of the original tailings lines will be utilized. Results from the trial will be examined in detail following the bathymetric survey scheduled to occur in the spring of 2017.
The Metallic Minerals Lease (No. M-00589) requires the lessee to furnish a mill waste reject report on an annual basis. In 2016, 3,858 dry metric tonnes of nickel and 598 dry metric tonnes of copper were deposited in the HTDF as tailings.
5
In accordance with permit condition, F-7, an annual bathymetry survey is required to be conducted in order to accurately monitor tailings placement and calculate changes in HTDF water storage. However, in order to better understand how the tailings are settling out, three surveys were completed in 2016. The surveys were conducted in April, July, and November and focused on the entire HTDF as tailings were dispersed to multiple areas in 2016. Copies of the bathymetry surveys are available in Appendix B.
5. Site Water Usage, Treatment and Discharge
Three separate water sources supply the facility with either potable or process water which is necessary for operational activities to occur. The site water balance is comprised of process water, precipitation, groundwater infiltration, and storm water runoff all of which is captured in the HTDF and treated by the water treatment plant (WTP) before discharging to a nearby wetland.
5.1. Supply Water Sources and Use
Three separate sources supply water to the mill site to support various operational activities. These sources include the potable well, industrial well, and reclaim water from the HTDF. Utilizing the detailed water use logs maintained on site, the following summary of average water use from each source has been compiled.
The potable well is mainly used to supply potable water to the facility, but may also be utilized to replenish the fire water tank and supplement process water requirements if necessary. In 2016, approximately 0.84 million gallons (MG) of water was drawn from the potable water well which is a decrease from 2015 when over 1.1 million gallons of water was withdrawn.
The industrial well is primarily used to replenish the fire water tank and to supplement process water requirements. In 2016, approximately 7.3 million gallons of water was utilized from the industrial well. This is an improvement in terms of water use because it was a decrease from the 7.6 million gallons that was withdrawn in 2015. Although the total volume of water withdrawn from the industrial well in 2016 is only slightly lower than previous years, it is important to note that the majority of that water was withdrawn in the second half of the year after modifications were made to centrifugal pumps on site. The modifications were made as part of a safety improvement project; however, the changes resulted in the utilization of much more well water because the water reclaimed from the HTDF was unable to consistently meet water demands. During the first half of the year, approximately 3.3 GPM of industrial well water was used in the milling process compared to 24.6 GPM used during the second half of the year. Further updates are planned in early 2017 to again reduce the water demand and need to utilize the industrial well.
The third source of water at the mill site is the reclaim water which is pumped from the HTDF. This water is used throughout the process with the volume that is not consumed being recycled back to the HTDF via tailings. Reclaim water is used whenever possible in the process as it encourages recycling, reduces reliance on well water, and minimizes the volume of new water entering the HTDF which helps maintain the site water balance. In 2016, approximately 272 million gallons of reclaim water was pumped from the HTDF for use in processing ore. With the exception of approximately 6.2 million gallons of water that was contained in the concentrate and shipped offsite, the remainder of the water was recycled back to the HTDF for eventual reuse or treatment by the WTP.
6
5.2. Storm Water Control
A site grading plan was developed with the purpose of keeping all storm water onsite and directing run-off to one of two locations; the HTDF or storm water retention basin. The majority of site grading, paving, and curbing was previously completed to direct water to the series of catch basins that were installed along the length of the main facility from the rail spur to the security building. These catch basins direct storm water from the main mill facility to the HTDF. In November of 2016, additional site paving was completed to ensure that any storm water containing process related materials is captured and discharged in the HTDF. Water which falls south of the main site access road, is directed to the storm water retention pond via a drainage ditch or series of catch basins in the administrative building parking lot. A copy of the Humboldt Mill Storm Water Drainage map is included in Appendix C.
Storm water control at the Humboldt Mill is managed under a National Pollutant Discharge Elimination System (NPDES) permit (MI00058649) and in accordance with Part I.B of the permit a storm water pollution prevention plan (SWPPP) has been developed. The SWPPP describes the Humboldt Mill site and its operations, identifies potential sources of storm water pollution at the facility, recommends appropriate best management practices (BMPs) or pollution control measures to reduce the discharge of pollutants in storm water runoff, and provides for periodic inspections of pollution control measures. The plan must be reviewed, and updated if necessary, on an annual basis and a written report of the review must be maintained and submitted to the Michigan Department of Environmental Quality (MDEQ) on or before January 10th of each year. The 2016 SWPPP annual review was completed and submitted to the Department on January 6th, 2017. A copy of the plan is available upon request.
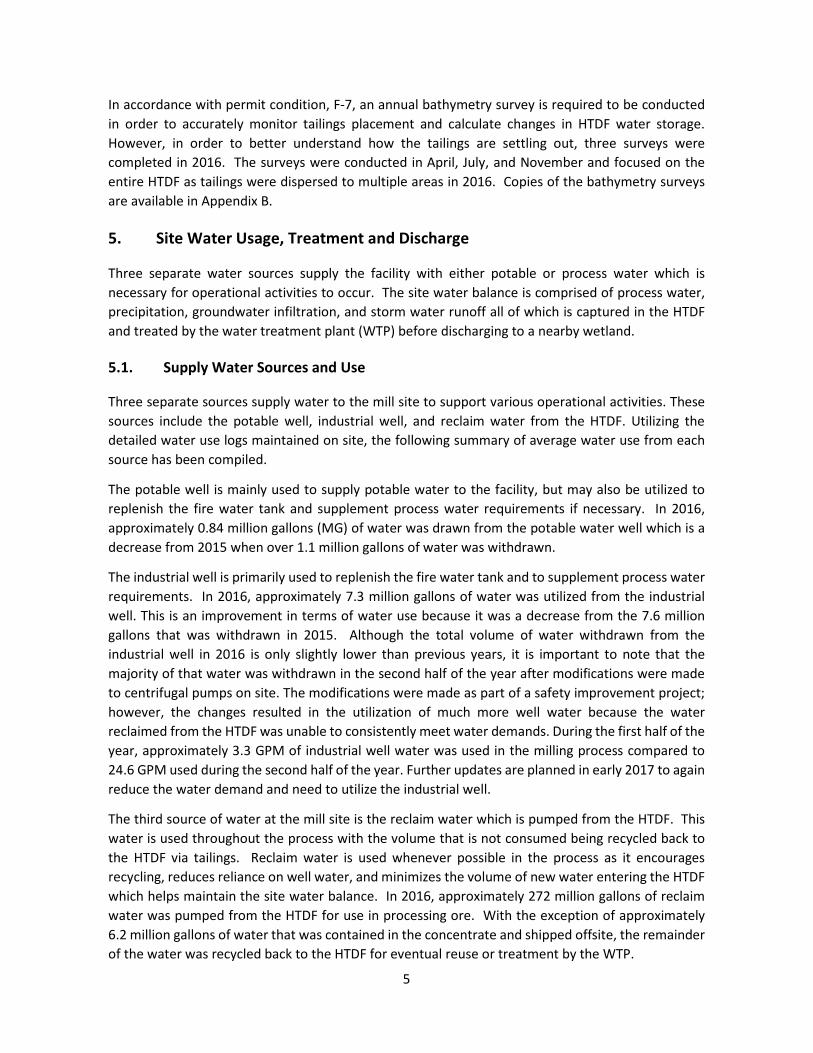
5.3. Water Treatment Plant Operations and Discharge
Effluent discharges to the wetland are regulated under the NPDES permit MI0058649 with analytical results and discharge volume reported to the MDEQ on a monthly basis through the MiWaters electronic reporting system.
In 2016, approximately 312 million gallons of water was treated and discharged from the water treatment plant to the adjacent wetland. Table 6.3 below summarizes the monthly flow rate from each WTP outfall to the wetland in 2016.
7
Table 5.3 Volume of Water Discharged from the WTP in 2016 Month Outfall 001
Volume of Water Discharged (MG)
Outfall 002 Volume of Water Discharged (MG)
Outfall 003 Volume of Water Discharged (MG)
January 0 13.6 13.5 February 0 12.2 12.0 March 0 13.7 13.7 April 2.3 10.8 15.5 May 12.6 2.3 14.9 June 6.0 0.015 17.2 July 0 0.015 19.8 August 0 0.016 21.4 September 0 5.4 21.8 October 0.06 28.5 5.3 November 0.1 25.1 0 December 0.23 23.9 0 Total 21.29 135.5 155.1
Source = WTP Operators log
The water treatment process generates one waste stream which derives from the filter press. The filter press waste stream is dewatered solids from the clarifier and is primarily comprised of aluminum, iron, and calcium. Waste characterization samples are required by the landfill prior to acceptance of the material. Samples from the filter press waste stream were sent to ALS Laboratory for analysis and results indicate the waste stream is non-hazardous. In 2016, approximately 81.2 tonnes of filter press waste was disposed at the Marquette County Landfill.
Aerial view of water treatment plant
5.4. Water Balance
The main components of the water balance are process water, well water, precipitation, groundwater infiltration, and storm water runoff all of which is captured in the HTDF and treated by the WTP before discharging to a nearby wetland. Permit condition F-2 requires that the site water balance is updated
8
on a quarterly basis to ensure the water level of the HTDF is managed in a manner that minimizes risk to the environment. The target operating water elevation of the HTDF is between 1529.5 and 1530.5 MSL which is significantly lower than originally planned during the permitting process. The lower operating level mitigates risks associated with overflow situations and provides excess capacity to manage various operational situations.
As stated in Section 6.1 above, additional use of the industrial well was required during the second half of the year in order to meet the demand for process water after making changes to the configuration of the centrifugal pumps. Although the water balance was able to be maintained without issue, additional efforts to reduce the use of well water within the process will be completed in 2017. The water balance is tracked through a series of flow meters that report results to a database. The database is queried on a routine basis and results transferred to a spreadsheet that calculates quarterly inputs and outputs of the HTDF. The balance includes dry tailings volume and therefore the calculations are more representative of the HTDF volume balance rather than a pure water balance. This information is used to track HTDF water elevations, predict seasonal fluctuations and to help determine if operational adjustments are necessary. Copies of the 2016 quarterly water balance diagrams and HTDF water elevation data are included in Appendix D.
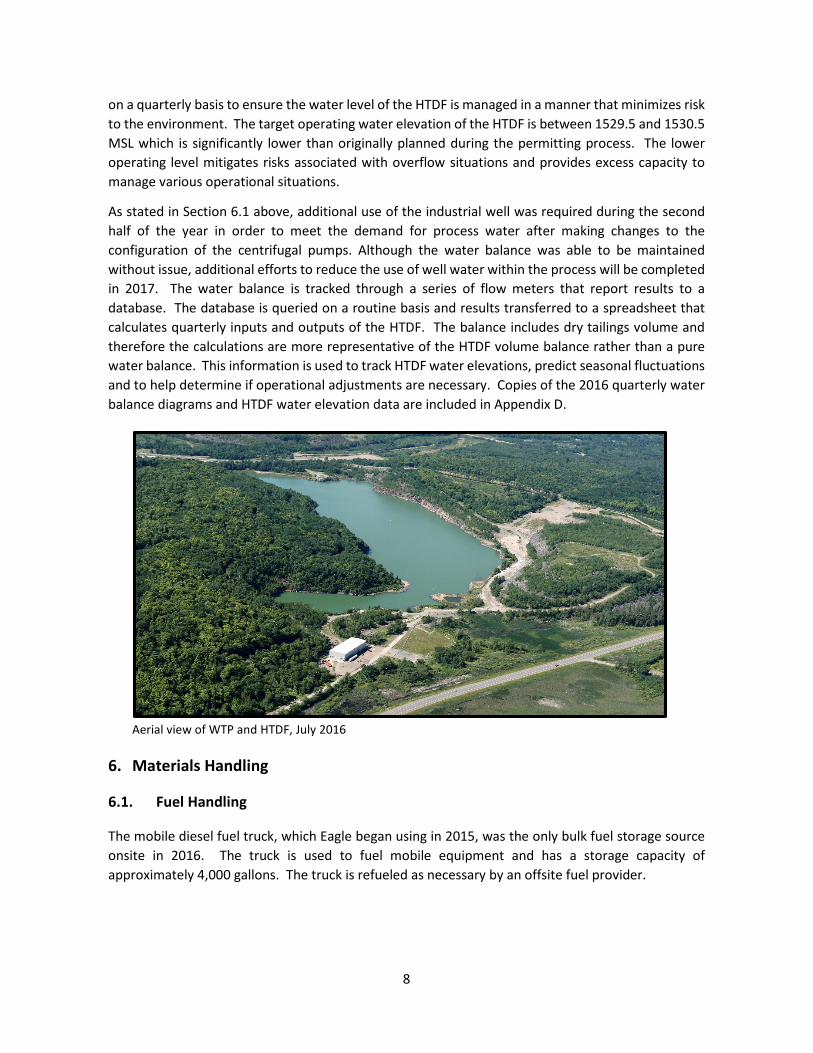
Aerial view of WTP and HTDF, July 2016
6. Materials Handling
6.1. Fuel Handling
The mobile diesel fuel truck, which Eagle began using in 2015, was the only bulk fuel storage source onsite in 2016. The truck is used to fuel mobile equipment and has a storage capacity of approximately 4,000 gallons. The truck is refueled as necessary by an offsite fuel provider.
9
6.2. Bulk Chemical Handling and Storage
It is the goal of Eagle Mine to create a culture of environmental awareness throughout the workforce. Therefore, all employees and subcontractors are trained to immediately respond and report any spills that occur. In 2016, the Humboldt Mill had zero reportable spills under the Part 5 Rules of Part 31, Water Resources Protection of NREPA, 1994 PA 451 as amended (Spillage of Oil and Polluting Materials).
The Michigan SARA Title III Program requires reporting of onsite chemicals being stored above certain threshold quantities. Due to the volume of chemicals stored/used at the site for processing and water treatment, a Tier II Report was submitted in February 2017 via the online Tier II Reporting System to the State Emergency Response Commission (SERC). Copies of the report were also mailed to the Marquette County Local Emergency Planning Committee (LEPC) and Humboldt Township Fire Department.
7. Monitoring Activities
7.1. Water Quality Monitoring
A significant amount of surface water and groundwater quality monitoring is required both on and surrounding the mill site. Following is a summary of the water quality monitoring activities.
7.1.1. Quarterly Groundwater Quality Monitoring
Groundwater quality is monitored through a network of monitoring wells located inside the perimeter fence line of the mill site. The monitoring wells are classified as either compliance, leachate, facility or monitoring. Compliance wells are located on the north-side of the cut-off wall, outside of the influence of the HTDF; leachate wells are located on south-side of the cut-off wall and generally represent HTDF water quality; facility monitoring wells are located downgradient of each operating facility; the remaining monitoring wells are located north of the cut-off wall, but are not used to confirm effectiveness of the cut-off wall as the compliance and leachate wells are. A map of the well locations can be found in Appendix E. Four rounds of quarterly sampling were completed in February, May, August, and November 2016. The Eagle Mine Permit prescribes both a long parameter list for annual monitoring events (conducted in Q3 2016) and a short list to be used quarterly (Q1, Q2, Q4 2016). Samples were collected in accordance with the Eagle Project Quality Assurance Project Plan and Standard Operating Procedures (North Jackson, 2004a and 2004b) and the results are summarized and compared to benchmarks in the tables found in Appendix F.
Two sets of benchmarks were calculated for all mine permit groundwater monitoring locations based on the guidance provided by the Mine Permit and Part 632. It should be noted that due to the required statistical nature of these benchmark values, the accuracy will improve over time as the quantity of data that becomes available increases.
Monitoring Results
Twenty-four monitoring well samples were collected by Golder Associates during each of the four quarterly sampling events. Samples were collected using low-flow sampling techniques, and field parameters (dissolved oxygen (DO), oxidation-reduction potential (ORP), pH, specific conductivity,
10
temperature, turbidity) are collected and analyzed using a flow-through cell and YSI probe. All samples are shipped overnight to Pace Analytical Services (formerly TriMatrix Laboratories) in Grand Rapids, Michigan, for analysis.
The following is a summary of field observations that occurred in 2016:
• Due to turbidity levels that exceeded 3 NTU, seventeen of the twenty four monitoring locations required field filtering for at least one quarter in 2016 and therefore the values are reported as dissolved concentrations. The remaining locations/quarters reported turbidity below 3 NTU and are reported as total concentrations. The sample summary denotes whether the sample values are total or dissolved.
• Four of the monitoring locations (i.e. MW-702 UFB, MW-703 UFB, HW-1L, and HW-1U LLA) are very slow to recharge and are pumped down in advance of sampling in order to ensure that the samples collected are representative of the groundwater at the monitoring location. Locations MW-702, MW-703, and HW-1L take approximately one month to recover while HW-1U takes approximately four months to fully recover due to the tight formation in which it is located. Samples from these locations are taken immediately and do not follow low-flow sampling procedures due to the limited volume of water available and slow re-charge rates.
The majority of the metals and anion parameters analyzed reported values below the analytical reporting limit and calculated benchmark, and are listed as non-detect. The cation parameters analyzed were detected at all locations with the majority of the detections below the calculated benchmarks. A summary of wells that have had one or more parameters exceed a benchmark value can be found in Appendix F.
In accordance with Part 632, R426.406 (6) when a result is greater than a benchmark for two consecutive sampling events, at a compliance monitoring location, the permittee is required to notify the MDEQ and determine the potential source or cause resulting in the deviation from the benchmark. Following is a summary of the 2016 events that occurred:
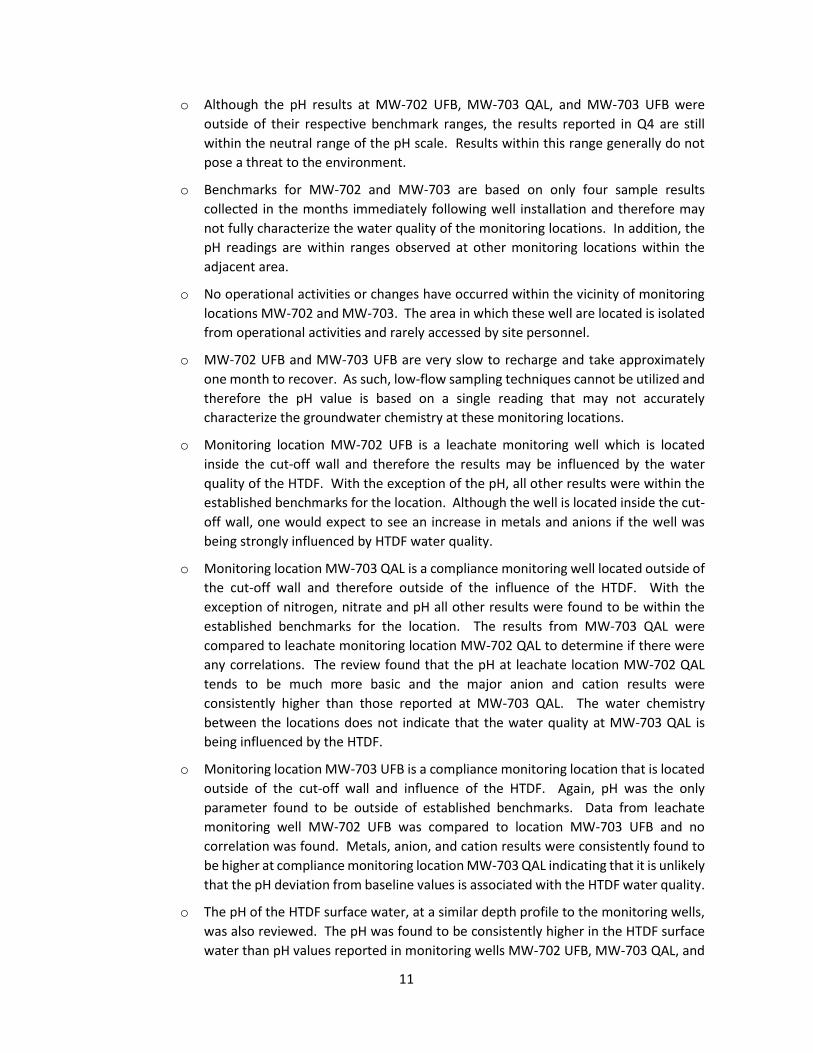
• Per the Part 632 Regulation (Rule 7(b)), an action level was reached for pH at locations MW-702 UFB, MW-703 QAL, and MW-703 UFB as the pH was lower than the average long-term average by 0.5 units for at least two consecutive sampling events. Table 7.1.1 below lists the benchmarks and 2016 results for locations in which the action level was met. As required, a source investigation was completed to determine the potential source of the deviations. Results of the investigation are summarized below.
Table 7.1.1 Result Summary of Locations Meeting the pH Action Level
Location
pH Benchmark Range
(SU)
2016 pH Results (SU)
Q1 Q2 Q3 Q4
MW-702 UFB 8.5-9.5 5.9 7.9 4.0 6.8
MW-703 QAL 7.2-8.2 6.4 6.6 6.2 5.9
MW-703 UFB 8.3-9.3 5.3 8.0 6.3 7.4
11
o Although the pH results at MW-702 UFB, MW-703 QAL, and MW-703 UFB were outside of their respective benchmark ranges, the results reported in Q4 are still within the neutral range of the pH scale. Results within this range generally do not pose a threat to the environment.
o Benchmarks for MW-702 and MW-703 are based on only four sample results collected in the months immediately following well installation and therefore may not fully characterize the water quality of the monitoring locations. In addition, the pH readings are within ranges observed at other monitoring locations within the adjacent area.
o No operational activities or changes have occurred within the vicinity of monitoring locations MW-702 and MW-703. The area in which these well are located is isolated from operational activities and rarely accessed by site personnel.
o MW-702 UFB and MW-703 UFB are very slow to recharge and take approximately one month to recover. As such, low-flow sampling techniques cannot be utilized and therefore the pH value is based on a single reading that may not accurately characterize the groundwater chemistry at these monitoring locations.
o Monitoring location MW-702 UFB is a leachate monitoring well which is located inside the cut-off wall and therefore the results may be influenced by the water quality of the HTDF. With the exception of the pH, all other results were within the established benchmarks for the location. Although the well is located inside the cut-off wall, one would expect to see an increase in metals and anions if the well was being strongly influenced by HTDF water quality.
o Monitoring location MW-703 QAL is a compliance monitoring well located outside of the cut-off wall and therefore outside of the influence of the HTDF. With the exception of nitrogen, nitrate and pH all other results were found to be within the established benchmarks for the location. The results from MW-703 QAL were compared to leachate monitoring location MW-702 QAL to determine if there were any correlations. The review found that the pH at leachate location MW-702 QAL tends to be much more basic and the major anion and cation results were consistently higher than those reported at MW-703 QAL. The water chemistry between the locations does not indicate that the water quality at MW-703 QAL is being influenced by the HTDF.
o Monitoring location MW-703 UFB is a compliance monitoring location that is located outside of the cut-off wall and influence of the HTDF. Again, pH was the only parameter found to be outside of established benchmarks. Data from leachate monitoring well MW-702 UFB was compared to location MW-703 UFB and no correlation was found. Metals, anion, and cation results were consistently found to be higher at compliance monitoring location MW-703 QAL indicating that it is unlikely that the pH deviation from baseline values is associated with the HTDF water quality.
o The pH of the HTDF surface water, at a similar depth profile to the monitoring wells, was also reviewed. The pH was found to be consistently higher in the HTDF surface water than pH values reported in monitoring wells MW-702 UFB, MW-703 QAL, and
12
MW-703 UFB indicating that the monitoring well pH results are not being influenced by the HTDF water quality.
Results from the investigation do not clearly indicate a source of the pH deviations at locations MW-702 UFB, MW-703 QAL, and MW-703 UFB. As stated above, although the pH results were outside of their respective benchmark ranges, the results reported in Q4 are still within the neutral range of the pH scale and do not pose a threat to the environment. The locations will continue to be closely monitored during quarterly sampling events and results reviewed to determine if a source can be determined.
• HYG-1, located on the north side of the cut-off wall, reported several parameters above calculated benchmarks (i.e. manganese, mercury, alkalinity bicarbonate, chloride, potassium, and sodium), however to date no parameters have exceeded an action level. HYG-1 is a very shallow well with a total depth of 25 feet and depth to water of approximately 12-14 feet depending on the season. A comparison of monitoring results from leachate wells, MW-701 QAL and MW-702 QAL, to HYG-1 does not indicate a correlation as all results detected at HYG-1 were greater than results detected at the leachate monitoring wells. This indicates that HYG-1 is not being influenced by the HTDF and since no other mining or milling activities are occurring within a close proximity of HYG-1 the elevated results are most likely related to the well being compromised in some way due its age. Results at HYG-1 for all of the parameters listed decreased in Q4 from levels previously reported in 2016. The location will continue to be closely monitored in 2017.
• Sodium was found to be increasing in concentration at locations HW-1U LLA and HW-2 and sulfate at locations HW-2, HW-8U, and MW-704 QAL. In each case, all other parameters were either consistent with baseline values or just outside of calculated benchmarks. In addition, the magnitude of the results varied and did not show any correlation between locations.
• Iron and lead were outside of benchmarks in each of the four sampling quarters in 2016 at location MW-704 UFB as was calcium, magnesium, and hardness. Results from this compliance monitoring location were compared to the leachate monitoring location MW-701 UFB and a distinct difference was found between the monitoring locations indicating that the location is not being influenced by the HTDF.
• The majority of the rest of the monitoring locations reported results that were just outside of the calculated benchmark values. The benchmarks are based on a small sample set of three to five results, most of which were collected in 2014 during monthly sampling events that occurred after well construction was completed. As such, the majority of the benchmarks do not currently take into account seasonal variation or natural variability that may occur after well installation. In many cases, the benchmark is set at the default of four times the reporting limit due to all non-detect results. All locations will continue to be closely monitored and benchmarks updated as more data becomes available.
A Mann-Kendall trend analysis was conducted on a quarterly basis for all groundwater locations. A parameter was considered to be trending if analysis determined a minimum confidence of 95%. Possible trends, either positive or negative, were identified for one or more parameters at fifteen compliance locations, three leachate monitoring wells and four background monitoring locations using data collected from baseline sampling events (i.e. 2014) through December 2016. Sulfate,
13
hardness, and sodium were the most frequently noted as possibly trending. It should be noted that due to the small sample size, the current trending results should all be considered preliminary.
A trend analysis will continue to be conducted after each quarterly monitoring event in 2017 and results reviewed to determine if the trends are attributable to milling operations. A table summarizing the potential groundwater trends can be found in Appendix G. For compliance, facility, and monitoring locations in which results were outside of established benchmarks for at least two consecutive quarters and a potential trend was identified, the trend charts are also provided in Appendix G.
7.1.2. Quarterly Surface Water Quality Monitoring
Surface water sampling was conducted on a quarterly basis in 2016 at eight surface water locations by Golder Associates. Four locations are associated with surface water resources in the subwatershed containing the HTDF and four are associated with the subwatershed of the milling facility. The samples collected represent winter base flow, spring snowmelt/runoff, summer base flow, and the fall rain season. Samples were collected in February, May, August, and November in 2016. A map of the surface water sampling locations is found in Appendix H. Samples are collected in accordance with the Eagle Project Quality Assurance Project Plan and Standard Operating Procedures (North Jackson, 2004a and 2004b) and the results are summarized and compared to benchmarks (i.e. upper prediction limit) and are located in the tables found in Appendix I.
Similar to the groundwater benchmarks discussed in section 9.1.1, two sets of benchmarks were calculated for all mine permit surface water monitoring locations based on the guidance provided by the Mine Permit and Part 632. MP 01 2010 L2 also requires that seasonal variation be accounted for when calculating surface water benchmarks. To date, a large enough sample set has not been collected during each of the four seasons and therefore are not incorporated into the current benchmarks. As additional samples are collected, the benchmarks will be recalculated to account for seasonal variation as required by MP 01 2010 L2. Until that time, benchmarks are based on baseline data collected in February, May, July, and October 2008 and May, July, and September 2014.
Monitoring Results
Grab samples were collected from each location during the quarterly sampling events completed in February, May, August, and November in 2016. Samples were unable to be collected from monitoring location HMP-009 in Q1 and Q4 and HMWQ-004 in Q1, Q2, Q3 and Q4 as water was not present.
• HMP-009 is located within the wetland that is strongly influenced by WTP discharge. In Q1 and Q4, WTP discharge was routed to an outfall that does not provide water to monitoring location HMP-009. Therefore no water was present in the area and sampling was unable to be completed.
• HMWQ-004 is located in an area in which the only contributions are related to precipitation and storm water run-off from the adjacent roadway, therefore sampling from this location is dependent upon precipitation.
The Humboldt Mill Surface Water and Sediment Monitoring Plan prescribes a long parameter list that is collected annually (conducted in Q3 2016) and a short list to be used quarterly (Q1, Q2, and Q4
14
2016). In addition to the grab samples, field measurements (DO, pH, specific conductivity, temperature) were collected and determined through the use of an YSI probe. Flow measurements were obtained, where conditions allowed, using a wading rod and current meter. Flow rates for location MER-002 were recorded from the USGS website for the station located adjacent to the monitoring location (i.e. 04057800 Middle Brach Escanaba River Humboldt Mill location). All water quality samples were shipped overnight to Pace Analytical Services in Grand Rapids, Michigan, for analysis.
Following is a summary of the 2016 events that occurred.
• Chloride, sulfate, sodium and total dissolved solids (TDS) were found to be greater than calculated benchmarks at location HMP-009. As stated above, this location is strongly influenced by WTP discharge when Outfall 003 is in use.. A review of the sampling data from the WTP discharge on August 24, 2016 and data collected from HMP-009 on August 23, 2016 found a correlation between many of the parameters which did not exist prior to use of Outfall 003. Most notably, the TDS and sulfate results were found to be only slightly below the WTP discharge values. TDS continues to trend slightly upward which is consistent with the WTP discharge data.
• Monitoring location WBR-002 reported results for copper, lead and nickel that were greater than established benchmarks. All three parameters were equal to, or just slightly above the established benchmarks. Each of the results trended down from Q3 to Q4.
• pH was reported to be below calculated benchmarks at MER-003, WBR-002, and WBR-003 for at least two consecutive sampling quarters in 2016. Both the Escanaba River (MER-001) and Black River (WBR-001) reference locations also experienced lower pH levels during at least one sampling quarter indicating that there is a possible trend that is being observed throughout the river system.
It is very likely that a number of the benchmark deviations that were reported in 2016 are not actually deviations from natural conditions. As reported above, the benchmarks were calculated using all baseline data available and do not take into account seasonal variation at this time. A large enough sample set was not available to complete the statistical analysis for each of the four seasons. As additional samples are collected, the benchmarks will be recalculated to account for seasonal variation as required by MP 01 2010 L2. Until that time, benchmarks are based on all baseline data available for the monitoring location and therefore should be considered estimated values.
See Appendix I for a complete summary of surface water results and applicable benchmarks.
A Mann-Kendall trend analysis was also conducted for the surface water monitoring locations on a quarterly basis. The trend analysis does not currently take into account seasonal variations, but will be modified once sufficient data has been collected to complete the analysis. Possible trends, positive or negative, were identified for one or more parameters at two of the eight monitoring locations using data collected from baseline sampling events (May 2014) through December 2016 and are summarized in Appendix J. A parameter was considered to be trending if analysis determined a minimum confidence of 95%. Based on this premise, chloride and fluoride were identified as trending at HMP-009 and copper and lead were identified at WBR-002. The positive trend for chloride and fluoride at HMP-009 is likely attributable to the WTP discharge that strongly influences the monitoring
15
location. The trends identified at location WBR-002 for copper and lead are less apparent as results have stabilized over the last two sampling quarters.
A trend analysis will continue to be conducted after each quarterly monitoring event in 2017 and results reviewed to determine if the trends are attributable to milling operations. For compliance monitoring locations in which results were outside of established benchmarks for at least two consecutive quarters and a potential trend was identified, the 2016 trend charts are also provided in Appendix J.
7.2. Sediment Sampling
Sediment sampling is required on a biennial basis and was conducted on August 23, 2016 during the Q3 surface water sampling event. Sediment monitoring stations are co-located with surface water monitoring stations and consist of reference stations MER-001 and WBR-001, HTDF sub-watershed monitoring stations MER-002, MER-003, and HMP-009 and Mill sub-watershed monitoring stations HMWQ-004, WBR-002, and WBR-003. As required by the Part 632 Mining Permit, the sediment sample results were compared to the Consensus-Based Probable Effect Concentrations found in MacDonald et al., 2000. This included comparison to the threshold effects concentration (TEC) and probable effects concentration (PEC). A result below the TEC indicates that it is unlikely that harmful effects would be observed in sediment-dwelling organisms. In contrast, a result above the PEC indicates that harmful effects would likely be observed in sediment-dwelling organisms. With the exception of arsenic at monitoring location WBR-003 all results were below the established TECs. The arsenic result at location WBR-003 was found to be between the TEC and PEC indicating an uncertainty as to whether effects would actually be observed in sediment-dwelling organisms. Review of results from the baseline sampling event conducted in May 2014, prior to the start of operations, found that the arsenic concentration at WBR-003 also fell within the TEC and PEC indicating that the elevated arsenic result is not associated with Eagle operations. A summary of the sediment results is provided in Appendix K.
7.3. Regional Hydrologic Monitoring
7.3.1. Continuous Groundwater Elevations
Monitoring wells MW-701, MW-702, MW-703, MW-704, MW-705, HYG-1, HW-2, HW-1U, HW-1L, HW-8U are instrumented with continuous water level meters and downloaded quarterly by Golder Associates field technicians. Permit condition F-9 requires that water levels are continuously monitored in Wetland EE and the HTDF. HTDF water level readings were recorded using a stilling well containing a pressure transducer which was installed in the HTDF to collect continuous water level measurements. To ensure accurate readings in the winter, an “ice eater” was installed to prevent the water surrounding the stilling well from freezing. A map of monitoring locations can be found in Appendix E.
Special Condition F-9a requires continuous monitoring of water levels on each side of the cutoff wall and a comparison of the gradient changes actually measured versus earlier predictions. As previously reported, the operating level of the HTDF was lowered from what was originally planned resulting in the HTDF water elevation being lower than the wetland elevation located outside of the cut-off wall. Therefore, the predicted gradient measurements originally calculated with a high HTDF elevation can
16
no longer be used as measurement of effectiveness of the cutoff wall. In addition, the water elevation cannot be compared in the reverse direction due to outside influences on the water levels in the wetland. If at any time during operations the water level rises to levels above the elevation of the downstream wetland, gradient changes will again be measured and discussed.
Continuous groundwater elevation results are reported by water year (October 1 – September 30). Water year is the preferred approach for reporting water levels, because the hydrographs demonstrate the effect of late fall and winter precipitation, which melts and drains in spring, in one 12-month hydrologic cycle. Copies of groundwater hydrographs are located in Appendix L. A review of the hydrographs found the following:
• The hydrographs clearly illustrate when the wells are pumped down in advance of, or during, sampling and the rate in which they recharge.
• Due to an equipment malfunction in which water entered the units causing damage to the circuitry, continuous water level readings were not collected from late May to late October 2016 at locations HW-1U LLA, HW-2, MW-701 UFB, and MW-704 LLA while the units were being evaluated and eventually replaced by the manufacturer. The meters were re-installed in late October and data was collected the final two months of 2016.
• Continuous water level readings were collected beginning in February 2016 at monitoring location MW-702 UFB due to an equipment malfunction which occurred in late 2015. The meter was repaired and data was collected for the remainder of the year.
• HW-1L, HW-1U LLA, MW-702 UFB, and MW-703 UFB are located in a tight formation and are very slow to recharge. HW-1L, MW-702 UFB, and MW-703 UFB took approximately one month to recharge and HW-1U LLA took almost four months to fully recharge. The slow recharge rates are an indication that the integrity of the cut-off wall is intact. If the cut-off wall was compromised one would expect to see the wells recharge more quickly.
• As expected, HTDF surface water elevations were consistently lower than water elevations for monitoring wells located on the opposite side of the cut-off wall. The exceptions are HW-1L and HW-1U LLA that are located in a tight formation and are very slow to recharge.
• Some of the shallower, quaternary aquifer wells displayed signs of seasonal influence as groundwater elevations decreased as frozen conditions set-in and increased again in April with the onset of spring melt.
7.3.2. Continuous Surface Water Monitoring
In accordance with permit condition F-9, Wetland EE is required to be instrumented with a meter to continuously monitor water levels. However, due to the construction of the cut-off wall, recharge is now primarily based on WTP discharge and precipitation (i.e. rain and snow melt). With the onset of WTP discharge into Wetland EE in the fall of 2015, the water levels in Wetland EE are a function of operational decisions and only minimally impacted by natural conditions (i.e. precipitation). The purpose of the continuous water level measurements is to monitor the effectiveness of the cut-off wall and record seasonal variations. Due to the operational influence of the WTP discharge, the monitoring objective can no longer be met and therefore continuous readings are not being collected.
17
However, surface water grab samples and field parameters will be collected quarterly when possible although results will be strongly influenced by effluent discharge water quality.
7.4. Cut-Off Wall Water Quality Review
In accordance with permit condition F-9, Eagle is required to monitor the effectiveness of the cut-off wall in terms of hydraulic containment. This is best accomplished by review of water levels and chemical signatures between the leachate (i.e. MW-701 and MW-702) and compliance monitoring wells (MW-703, MW-704). Focus of the review is on water levels in the quaternary unconsolidated formation (QAL) and chemical signature in the upper fractured bedrock zone (UFB).
Leachate wells are located on the south side of the containment wall (HTDF side) and should show similar water levels and chemical signatures of the HTDF. The compliance wells are downgradient of the leachate wells and are located on the north side of the containment wall and should be outside the influence of the HTDF. Results from leachate monitoring location MW-701 are compared to compliance location MW-704 and results from leachate monitoring location MW-702 are compared to compliance location MW-703.
Chemical Signature Review
• The majority of the metals and anion parameters were consistently non-detect at both the compliance and leachate monitoring locations, therefore, chemical signature comparisons were focused on iron, manganese, chloride, sulfate, and cation parameters as these were the most frequently detected.
• In the quaternary unconsolidated formation, the iron, manganese, chloride, and sulfate results were all significantly higher at compliance location MW-704 than were reported at leachate well MW-701. Iron was also higher in MW-704 in the upper fracture bedrock zone, while manganese was more than two times greater in MW-701 than MW-704. Sulfate and chloride were also found to be higher in MW-704 than leachate well MW-701. These results indicate there is a distinct difference between the leachate and compliance locations. If the containment wall was compromised, the results at the MW-701 and MW-704 would be similar.
• At leachate location MW-702 QAL pH, manganese, alkalinity bicarbonate, calcium, sodium, chloride, sulfate, and hardness were greater than results reported at compliance location MW-703 QAL. These results indicate that the containment wall is functioning as expected as the results would otherwise be closer in comparison.
• Iron, manganese, and sulfate were greater at compliance location MW-703 UFB than compared to leachate monitoring location MW-702 UFB. Again, the differences between the leachate and compliance wells show that the containment wall has not been compromised as results would be similar if it was not functioning properly.
Water Level Review
• There is a distinct difference in groundwater elevations between MW-702 QAL and MW-703 QAL. As expected due to the operating level of the HTDF, compliance monitoring location MW-703 QAL, has a groundwater elevation that is approximately five feet greater than
18
leachate well MW-702 QAL. The groundwater elevation at MW-702 QAL closely mimics the groundwater elevation of the HTDF.
• As predicted due to the operating level of the HTDF, compliance monitoring location MW-703 UFB has a groundwater elevation that is slightly greater than leachate well MW-702 UFB. Groundwater elevations at MW-702 UFB trend closely with HTDF water levels.
• The groundwater elevations at compliance monitoring locations MW 704 QAL and UFB are approximately three feet higher than those reported at leachate monitoring locations MW-701 QAL and UFB. As expected, the water elevations recorded at MW-701 are closer to elevations reported in the HTDF. The distinct separation between the leachate and compliance monitoring wells show that the containment wall has not been compromised as groundwater elevations would be similar if it was not functioning properly.
Based on the review of the chemical signature and groundwater elevations of the leachate and compliance monitoring wells there is sufficient evidence to show that the cut-off wall is functioning as expected. The variability in the detected parameters, difference in reported results, and groundwater elevations all demonstrate that the effectiveness and integrity of the containment wall are intact.
7.5. Biological Monitoring
Biological monitoring events conducted in 2016 included surveys of birds, large and small mammals, frogs, toads, fish and macro invertebrates. Results from each survey have been compiled into annual reports which are available upon request. A brief summary of each survey is provided below.
7.5.1. Flora and Fauna Report
The 2016 flora, fauna, and wetland vegetation surveys were conducted by King & MacGregor Environmental, Inc. (KME). Table 8.5.1 below outlines the type and duration of the surveys that were conducted in 2016. A map of the survey locations can be found in Appendix M.
Table 7.5.1 Type and Duration of 2015 Ecological Investigation Survey Type Survey Date Birds June 14-15, September 26, 27 and 30 Small Mammals September 27-29 Large Mammals May - September Toads/Frogs May 3-4, June 1 & July 6 Threatened and Endangered Species May - September
The wildlife and plant species identified during the 2016 surveys within the Study Area are similar to those identified during previous KME surveys. Following is a summary of the survey results:
• A combined total of 478 birds representing 45 species were observed during the 2016 (June and September) surveys. In June, the white-throated sparrow, red-winged blackbird, and red-eyed vireo were the most abundant birds observed, while the Canada goose, dark-eyed junco, and American crow was the most abundant species observed during the September
19
2016 survey. There was approximately four times as many Canada geese observed in 2016 than the previous year, however there was an overall reduction in count by over 70 individuals from September 2015 to those from September 2016. This is due to the reduced numbers of blue jay, rock pigeon, and American crows observed during the September 2016 survey. Overall between the June and September surveys there were fifty-three fewer birds observed in 2016 compared to 2015. The number of birds observed can be influenced by weather conditions including temperature, wind speed, etc., and therefore variations are expected to occur between survey events. Although fewer birds were observed, the bird species identified during the 2016 bird surveys are similar to those bird species identified in previous surveys conducted within the Study Area and are consistent with the bird species expected to be found in the habitats present.
• Thirty-two small mammals representing eight species were collected during the September survey period. The total number of individuals captured in 2016 were nearly double the number captured in 2015 with the most common small mammal identified during the survey being the deer mouse. No threatened, endangered, or special concern small mammals were observed during any of the surveys. The small mammals encountered within the Study Areas during the 2016 surveys are typical of those expected in the habitats present and are consistent with previous survey results.
• Whitetail deer tracks were observed throughout the study area and the scat of coyote, American black bear, and grey wolf was also observed in September 2016. The large mammal species detected during the 2016 surveys are regionally common large mammal species and are expected to utilize the habitats present.
• Five frog species were observed during the survey; none of which are threatened or endangered. Breeding frog calls were observed at all five sampling points with the most frequently heard being the northern spring peeper. Although, elevated noise levels related to operations were noted at survey points 2 and 3, potentially diminishing the observer’s ability to hear and distinguish calls, the results from the 2016 survey are similar to those of previous years. All of the frog species identified are typical of those expected in the habitats present in the Study Area.
7.5.2. Threatened and Endangered Species
The Michigan Natural Features Inventory (MNFI) maintains a database of rare plants and animals in Michigan. KME requested a Rare Species Review to determine if any protected species had been found within 1.5 miles of the Study Area. Table 8.5.2 lists the species identified during the MNFI review process.
Table 7.5.2 MNFI Review Results of Study Area Species Classification Canada rice grass State threatened species American bittern State special concern species Bald eagle State special concern species osprey State special concern species Great blue heron rookery Rare natural feature
20
In accordance with Michigan Department of Natural Resources (MDNR) guidelines (MDNR 2001), KME surveyed for any MNFI listed species and their habitats during the appropriate season. Following are the results of the threatened and endangered species survey:
• Canada grass was not observed in 2016 and is not expected to occur in the study area due to the lack of suitable habitat.
• Although American bittern observations have been routinely made at Survey Point 5 in the past, none were made in 2016.In May and June 2016, the bald eagle nest on the north shore of Lake Lory was occupied by two adults and two juveniles.
• Although suitable habitat for osprey is present in the study area, no birds were directly observed in 2014, 2015, or 2016.
• In May and June 2016, 16 of 17 nests were identified as active in the heron rookery. The great blue heron rookery appears to be robust and unaffected by the presence of the mill.
A copy of the 2016 Humboldt Mill flora and fauna report is available upon request.
7.5.3. Fisheries and Macro Invertebrate Report
The 2016 Fisheries and Macro-Invertebrate annual surveys were conducted by Advanced Ecological Management (AEM). A total of six stations were surveyed in June 2016, including two stations on the Middle Branch of the Escanaba River (MBER), one station on a tributary of the Middle Branch of the Escanaba, one station on an unnamed tributary of the Black River (WBR), one station in Wetland Complex EE located northeast of the HTDF, and Lake Lory. A map of the survey locations can be found in Appendix N.
Stream Stations
A total of 53 fish representing 11 species were collected in 2016 from all stream stations, up from 44 fish in 2015. Station 1 and MBER 1 are located upstream of the mill and outside of potential impact from operations and Station 5 and MBER 2 are located downstream of milling operations. The most notable change observed in 2016 was that thirteen slimy sculpin (Cottus cognatus) were captured whereas zero were observed in 2015. The Central mudminnow was the most frequently collected
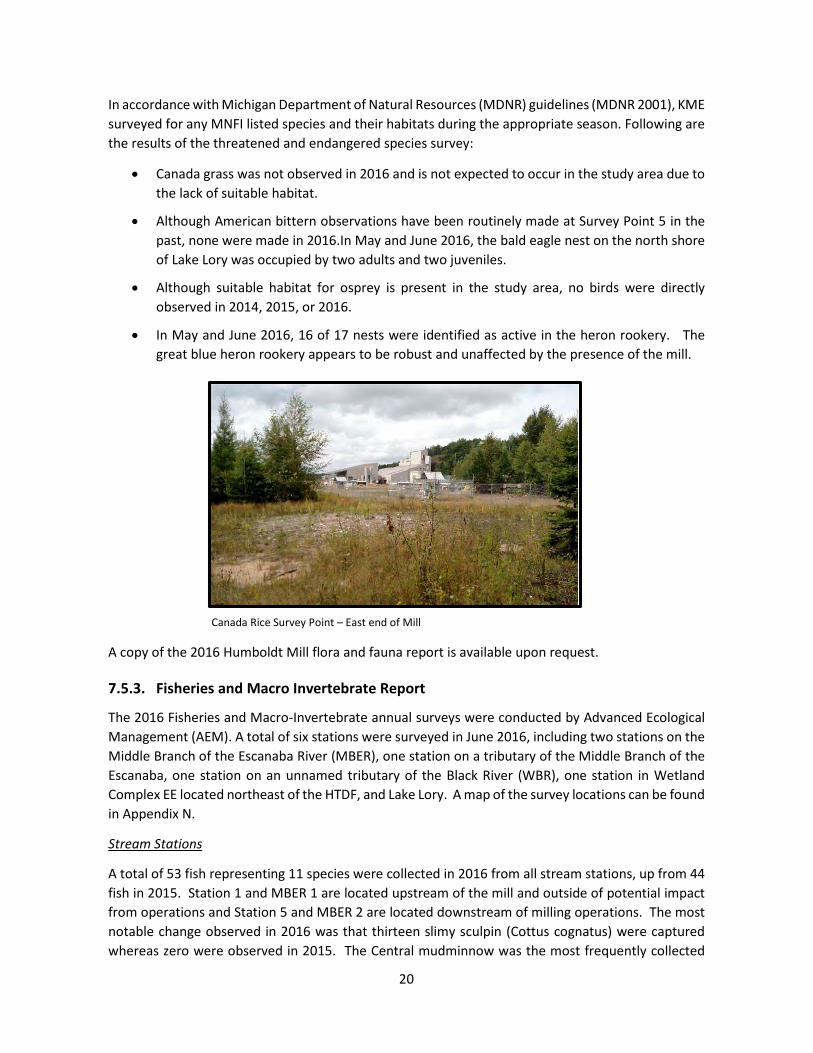
Canada Rice Survey Point – East end of Mill
21
species followed by the slimy sculpin. No threatened, endangered, or special concern fish species were observed at any of the stream stations in 2016. The following is a summary of the findings:
• The community composition of fish species was generally consistent over the past three years.
• A beaver dam located near Station 1 that has been observed since 2014, continues to influence the hydrology and potentially the number of fish collected during the surveys at that location.
• Historically, very few fish are observed at station 5, however, eight fish were collected in 2016 (i.e. Central mudminnow and slimy sculpin). Only one fish (i.e. Central mudminnow) was collected in 2015
• Twenty-six fish were collected between MBER1 & 2. Fish totals between these locations are typically 20 fish or less with the exception of 2007 when 50 fish were collected. Northern pike was the most frequently observed species at MBER1 while the Slimy sculpin was the most noted at MBER2. The surveys conducted to date have determined that the segments of stream associated with these locations are not productive fisheries.
Using the P-51 protocol, a total of 711 macro-invertebrates, representing 37 taxa, were collected from all four stream stations investigated in 2016. The total number of macro-invertebrates collected in 2016 was down by 90 specimens compared to the total number collected in 2015. The largest deviation was at Station 1 where 87 fewer specimens were collected in 2016 compared to 2015. This location is known to exhibit annual variation among the years surveyed by AEM. For example, only 76 macroinvertebrates were collected in 2014 compared to 218 in 2015, and 87 in 2016. Although fewer macroinvertebrates were collected from the stream stations in 2016, the community composition has remained generally consistent between years. No threatened, endangered, or special concern macroinvertebrate species were observed at any of the stream stations in 2016.
A summary of the fish, macroinvertebrate, and habitat ratings for the four stream stations are displayed in Table 7.5.3 below. Ratings were similar to previous baseline studies with all four stations being reported as “poor” fish communities and “acceptable” macroinvertebrate communities. Stream habitat was considered “excellent” in stations MBER1 and MBER2 and “good” at station 1 and 5.
Table 7.5.3 2016 Habitat Ratings Station 1 Station 5 Station MBER1 Station MBER2 Fish Community Poor Poor Poor Poor Macroinvertebrate Community Acceptable Acceptable Acceptable Acceptable
Stream Habitat Good Good Excellent Excellent
Lake Lory
A total of 169 fish representing nine taxa were collected from Lake Lory in 2016 which is greater than the 155 fish that were captured in 2015. The community composition was generally consistent between 2015 and 2016 with yellow perch (Perca flavescens) and bluegills (Lepomis macrochirus)
22
representing the most frequently observed species, followed by largemouth bass (Micropterus salmoides). Many of the fish observed in Lake Lory appear to be in good condition, however black spot which is caused by a natural parasite (larval trematode) that burrows into the skin of the fish was observed in several species. Review of the Michigan Department of Natural Resources website found that black spot is a common disease in earthen bottom ponds and lakes.
A total of 212 macroinvertebrates were collected from Lake Lory which is six more specimens than collected in 2015. Snails, true flies, and dragonflies were the most abundant species identified during the 2016 surveys. No threatened, endangered, or special concern macroinvertebrate species were observed at Lake Lory in 2016.
Wetland EE
One juvenile brook stickleback (Culaea inconstans) was collected from Wetland EE in 2016 and no fish were collected during the 2015 aquatic survey.
A total of thirty-eight macroinvertebrates were collected in 2016 compared to only four specimens collected in 2015. Diving beetles (Dytiscidae), Chironomids (Diptera), and true bugs were the most common species observed during the 2016 aquatic survey. No threatened, endangered, or special concern macroinvertebrate species were observed in Wetland EE in 2016.
In 2016, aquatic vegetation returned to previously observed conditions as the Wetland EE complex was predominately vegetated with cattails. This was in contrast to drier conditions observed during the 2015 survey where little to no vegetation was present. This was related to WTP discharge outfall locations and utilization. The third outfall from the Water Treatment Plant (Outfall 003) was utilized from January through mid-November in 2016 which supplied adequate water to the wetland complex. A copy of the 2016 Humboldt Mill Aquatic Survey Report is available upon request.
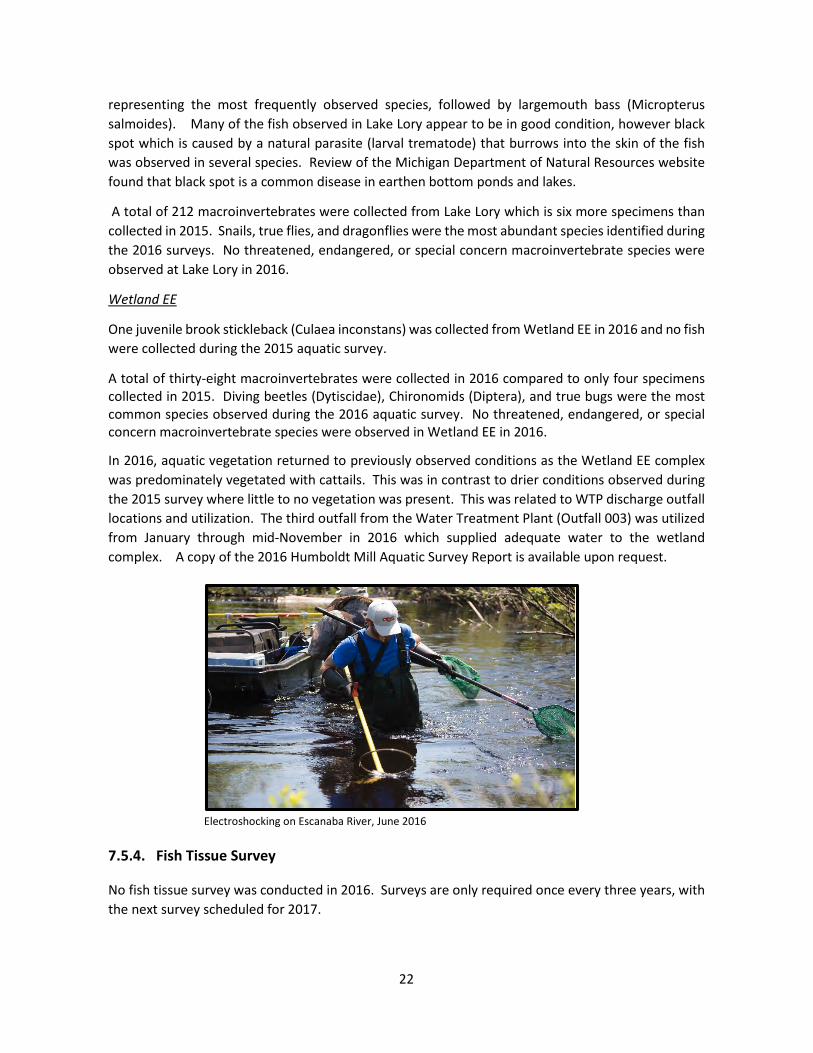
Electroshocking on Escanaba River, June 2016
7.5.4. Fish Tissue Survey
No fish tissue survey was conducted in 2016. Surveys are only required once every three years, with the next survey scheduled for 2017.
23
7.6. Miscellaneous Monitoring
7.6.1. Soil Erosion Control Measures
Soil erosion and sedimentation control (SESC) measures related to the construction of mining facilities now falls under the purview of Part 632. No new SESC measures were required to be implemented in 2016, however although no work is currently being conducted, silt fence remains along the HTDF where additional work on the cut-off wall is scheduled to occur in the future. The Department will be notified in the event that any construction activities occur in which soil erosion measures are necessary and all inspections will be completed as required.
7.6.2. Impermeable Surface Inspections
The Impermeable Surface Inspection and Surface Repair Plan outlines the requirements of integrity monitoring of surfaces exposed to site storm water and areas of ore, concentrate and chemical handling/storage. Areas inspected in 2016 included sumps and floors of the coarse ore storage area, concentrator building, concentrate load out facility, and WTP. Monitoring was conducted on a monthly basis as required by the plan.
Floors are inspected for cracks and overall general condition and the sumps are evaluated for any areas of cracking, pitting, or other surface deficiencies, and accumulation of material. All inspection results are recorded on the impermeable surface inspection form by Environmental Department staff and stored in the compliance binder at the Humboldt Mill administrative office. Any issues identified during the inspections are immediately reported and fixed by onsite staff. Follow-up inspections are completed to ensure the repairs were made. The following issues were identified in 2016:
• Minor, superficial cracks (level 1 or less) were noted on the floor of the Concentrator Building. These will continue be closely monitored.
7.6.3. Tailings Line Inspection
In accordance with Mining Permit Condition E-12, the double-walled HDPE pipeline is monitored by mill operators and Environmental Department staff. Any concerns identified during the inspections would be immediately reported to the Mill operations and maintenance departments who would complete any necessary repairs. The following items were identified in 2016:
• Weekly inspections of the tailings lines found that in April, June, October and December, minor amounts of tailings were introduced into the sump located in the shore vault building. This resulted from routine maintenance activities on the valves inside the building and not the result of a leak in the tailings lines. Operations personnel were notified and the material was cleaned up using a vacuum truck. The material was reintroduced into the system so that it can be disposed of subaqueously in the HTDF via the tailings disposal system.
24
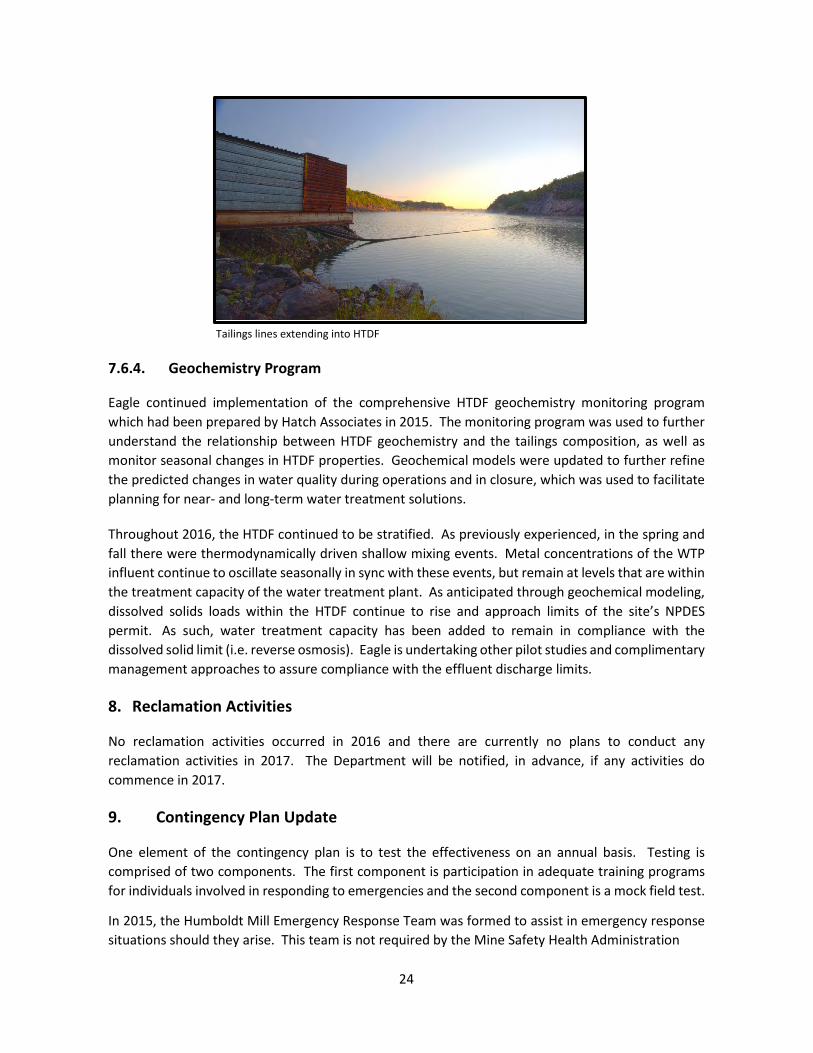
Tailings lines extending into HTDF
7.6.4. Geochemistry Program
Eagle continued implementation of the comprehensive HTDF geochemistry monitoring program which had been prepared by Hatch Associates in 2015. The monitoring program was used to further understand the relationship between HTDF geochemistry and the tailings composition, as well as monitor seasonal changes in HTDF properties. Geochemical models were updated to further refine the predicted changes in water quality during operations and in closure, which was used to facilitate planning for near- and long-term water treatment solutions.
Throughout 2016, the HTDF continued to be stratified. As previously experienced, in the spring and fall there were thermodynamically driven shallow mixing events. Metal concentrations of the WTP influent continue to oscillate seasonally in sync with these events, but remain at levels that are within the treatment capacity of the water treatment plant. As anticipated through geochemical modeling, dissolved solids loads within the HTDF continue to rise and approach limits of the site’s NPDES permit. As such, water treatment capacity has been added to remain in compliance with the dissolved solid limit (i.e. reverse osmosis). Eagle is undertaking other pilot studies and complimentary management approaches to assure compliance with the effluent discharge limits.
8. Reclamation Activities
No reclamation activities occurred in 2016 and there are currently no plans to conduct any reclamation activities in 2017. The Department will be notified, in advance, if any activities do commence in 2017.
9. Contingency Plan Update
One element of the contingency plan is to test the effectiveness on an annual basis. Testing is comprised of two components. The first component is participation in adequate training programs for individuals involved in responding to emergencies and the second component is a mock field test.
In 2015, the Humboldt Mill Emergency Response Team was formed to assist in emergency response situations should they arise. This team is not required by the Mine Safety Health Administration
25
(MSHA) but was established to help ensure the safety of employees while at work. The team is comprised of 22 individuals that are divided into four teams each of which includes at least one licensed emergency medical technician (EMT) and one National Fire Protection Association (NFPA) certified firefighter. Training occurs on a monthly basis and in 2016 included first aid, rapid trauma assessments, assisting with fire drills, extrication from various facilities and equipment, triaging multiple patients and completion of a 40 hour high angle rescue and confined space rescue technician training. The Humboldt Mill Emergency Response Team now has one of the largest professionally trained high angle rescue teams in the Midwest.
In addition to the Emergency Response Team, security personnel are EMTs and paramedics who are trained in accordance with state and federal regulations. This allows for immediate response to medical emergency situations.
A mock field test was conducted in October 2016 and was a desktop exercise which tested the emergency response measures of the contingency plan and crisis management plan in place at Eagle Mine. With the assistance of Eagle Mine employees, a third-party consultant developed an emergency scenario. The scenario generally involves a situation in which both safety and environmental risks are considered and in 2016 the emergency was related to a propane tank fire and train derailment that resulted in the loss of copper concentrate into the Escanaba River both of which occurred simultaneously during a severe weather event. The crisis management team was aware that a test would occur, but were unaware of the nature of the emergency. Two rooms were utilized during the exercise, the first contained the crisis management team and the second contained the “actors” playing roles of employees, regulators, local politicians, media outlets, and concerned citizens and family members. The actors had a loose script developed by the consultant which ensured that certain elements were included and that the scenario progressed at a pre-determined pace. During the crisis management exercise, the third party consultant observed the activity to identify strengths, weaknesses and opportunities for improvement. Once the exercise is complete, the consultant and crisis management team held a debrief session to capture feedback from each participant. Following this session, the consultant captured the overall feedback and prepared a report with actions for improvement. Throughout the following 12-month period, the crisis management team meets on a quarterly basis to review and update the status on those actions in preparation for the annual exercise.
An updated contingency plan can be found in Appendix O. This plan will also be submitted to the Local Emergency Management Coordinator.
10. Financial Assurance Update
Updated reclamation costs were submitted in the 2014 Annual Report and approved by the Department in July 2015. The updated bond was submitted to the MDEQ in April 2016. In accordance with Part 632, the financial assurance will be reviewed every three years with the next review required in 2018.
11. Organizational Information
An updated organization report can be found in Appendix P.
Appendix A
Humboldt Mill
Site Map
Appendix B
Humboldt Mill
Bathymetry Maps
1350
1
3
5
0
1350
1375
1375
1400
1400
1425
1425
1450
1
4
7
5
1
5
0
0
1
3
5
0
1375
1
3
7
5
1
3
7
5
1400
1
4
0
0
1
4
0
0
1
4
2
5
1425
10
10
1
0
1
5
1
5
15
2
0
2
0
2
0
2
5
2
5
2
5
3
0
3
0
3
0
3
5
3
5
35
4
0
4
0
4
0
4
5
5
0
5
5
6
0
5
1
0
1
5
2
0
2
5
3
0
3
5
4
0
45
50
5
5
10
15
SHEET TITLE:
DESIGNED:
DRAWN:
CHECKED:
APPROVED:
DA
TE
DE
SC
RIP
TIO
NIS
SU
ED
JOB NUMBER:
SHEET NUMBER:
TRIMEDIA
Cham
pion, M
I
Eagle M
ine - H
um
boldt M
ill
April 29, 2016 B
athym
etric S
urvey
GWM
PGC
JWM
2014-100
1.0
G:\P
rojects\2014\2014-100 E
agle M
ine - B
athym
etric S
urveying\D
raw
ings\2016 A
pril M
ill B
athy\2014-100 H
um
boldt T
ailings B
asin C
utF
ill 04292016 W
ith G
ridlines_C
urrent.dw
g
NO
RT
H
N
O
R
T
H
Tailings Basin
Product Fill Map
Current Fill Volume
(Observed April 29, 2016)
± 599,200 Cubic Yards
Countour Labels Indicate Fill (5' Intervals)
Above Original Bathymetric Survey
Intermediate Contour = 5'
Index Contour = 25'
Fill Contour = 5'
N: 22,000
N: 22,500
N: 23,000
N: 23,500
N: 24,000
N: 24,500
N: 25,000
E: 21,000E: 20,500E: 20,000E: 19,500E: 19,000E: 18,500
E
:
2
0
,
0
0
0
E
:
1
9
,
5
0
0
E
:
1
9
,
0
0
0
N
:
2
4
,
0
0
0
N
:
2
3
,
5
0
0
N
:
2
4
,
0
0
0
1350
1
3
5
0
1350
1375
1375
1400
1400
1425
1425
1450
1
4
7
5
1
5
0
0
1
3
5
0
1375
1
3
7
5
1
3
7
5
1400
1
4
0
0
1
4
0
0
1
4
2
5
1425
2
5
5
1
0
1
5
1
5
1
5
2
0
3
0
3
5
4
0
4
5
2
5
2
5
5
0
1
5
1
5
20
2
0
30
3
0
35
3
5
40
4
0
4
5
5
5
6
0
6
5
2
5
5
0
5
1
0
1
5
2
0
3
0
3
5
4
0
45
5
5
6
0
SHEET TITLE:
DESIGNED:
DRAWN:
CHECKED:
APPROVED:
DA
TE
DE
SC
RIP
TIO
NIS
SU
ED
JOB NUMBER:
SHEET NUMBER:
TRIMEDIA
Cham
pion, M
I
Eagle M
ine - H
um
boldt M
ill
July 28, 2016 B
athym
etric S
urvey
GWM
PGC
JWM
2014-100
1.0
G:\P
rojects\2014\2014-100 E
agle M
ine - B
athym
etric S
urveying\D
raw
ings\2014-100 B
athy 072816\2014-100 H
um
boldt T
ailings B
asin C
utF
ill 07282016 W
ith G
ridlines_C
urrent.dw
g
NO
RT
H
N
O
R
T
H
Tailings Basin
Product Fill Map
Current Fill Volume
(Observed July 28, 2016)
± 685,300 Cubic Yards
Countour Labels Indicate Fill (5' Intervals)
Above Original Bathymetric Survey
Intermediate Contour = 5'
Index Contour = 25'
Fill Contour = 5'
N: 22,000
N: 22,500
N: 23,000
N: 23,500
N: 24,000
N: 24,500
N: 25,000
E: 21,000E: 20,500E: 20,000E: 19,500E: 19,000E: 18,500
E
:
2
0
,
0
0
0
E
:
1
9
,
5
0
0
E
:
1
9
,
0
0
0
N
:
2
3
,
5
0
0
N
:
2
4
,
0
0
0
N
:
2
4
,
5
0
0
A
A'
B'
C'
B
C
1
3
5
0
1375
1
3
7
5
1
3
7
5
1400
1
4
0
0
1
4
0
0
1
4
2
5
1425
1375
1400
1425
1
4
5
0
1
4
7
5
1
4
7
5
1
3
5
0
1
3
5
0
1
3
5
0
1
4
7
5
1
4
5
0
1
4
0
0
1
3
5
0
1
3
7
5
3
5
3
0
25
20
1
5
1
5
1
5
20
15
3
0
2
5
20
2
0
2
5
3
0
3
5
4
0
4
5
5
0
5
5
6
0
6
5
6
0
5
5
5
0
4
5
4
0
3
5
3
0
2
5
2
0
1
5
5
0
2
0
1
0
4
0
3
0
35
2
5
1
5
3
0
2
0
1
0
2
0
2
0
2
5
2
0
1
5
1
5
2
5
3
5
1
5
2
0
2
5
2
5
20
2
0
1
5
1
0
1
5
3
0
25
2
0
3
5
3
0
35
1
5
1
5
10
2
0
5
0
50
4
0
2
5
3
0
1
5
1
5
15
3
0
4
0
3
5
3
0
2
5
2
0
4
5
4
0
1
5
SHEET TITLE:
DESIGNED:
DRAWN:
CHECKED:
APPROVED:
DA
TE
DE
SC
RIP
TIO
NIS
SU
ED
JOB NUMBER:
SHEET NUMBER:
TRIMEDIA
Cham
pion, M
I
Eagle M
ine - H
um
boldt M
ill
Novem
ber 7, 2016 B
athym
etric S
urvey
11
/1
6/2
01
6
GWM
EJR
MLM
2014-100
1.0
G:\P
rojects\2014\2014-100 E
agle M
ine - B
athym
etric S
urveying\D
raw
ings\2016 N
ovem
ber B
athy\2014-100 H
um
boldt T
ailings B
asin C
utF
ill 110722016 W
ith G
ridlines_C
urrent.dw
g
NO
RT
H
N
O
R
T
H
Tailings Basin
November 2016
Product Fill Map
Current Fill Volume
(Observed November 7, 2016)
± 805,997 Cubic Yards
Countour Labels Indicate Fill (5' Intervals)
Above Original Bathymetric Survey
Intermediate Contour = 5'
Index Contour = 25'
Fill Contour = 5'
N: 22,000
N: 22,500
N: 23,000
N: 23,500
N: 24,000
N: 24,500
N: 25,000
E: 21,000E: 20,500E: 20,000E: 19,500E: 19,000E: 18,500
E
:
2
0
,
0
0
0
E
:
1
9
,
5
0
0
E
:
1
9
,
0
0
0
N
:
2
3
,
5
0
0
N
:
2
4
,
0
0
0
N
:
2
4
,
5
0
0
A
A'
B'
C'
B
C
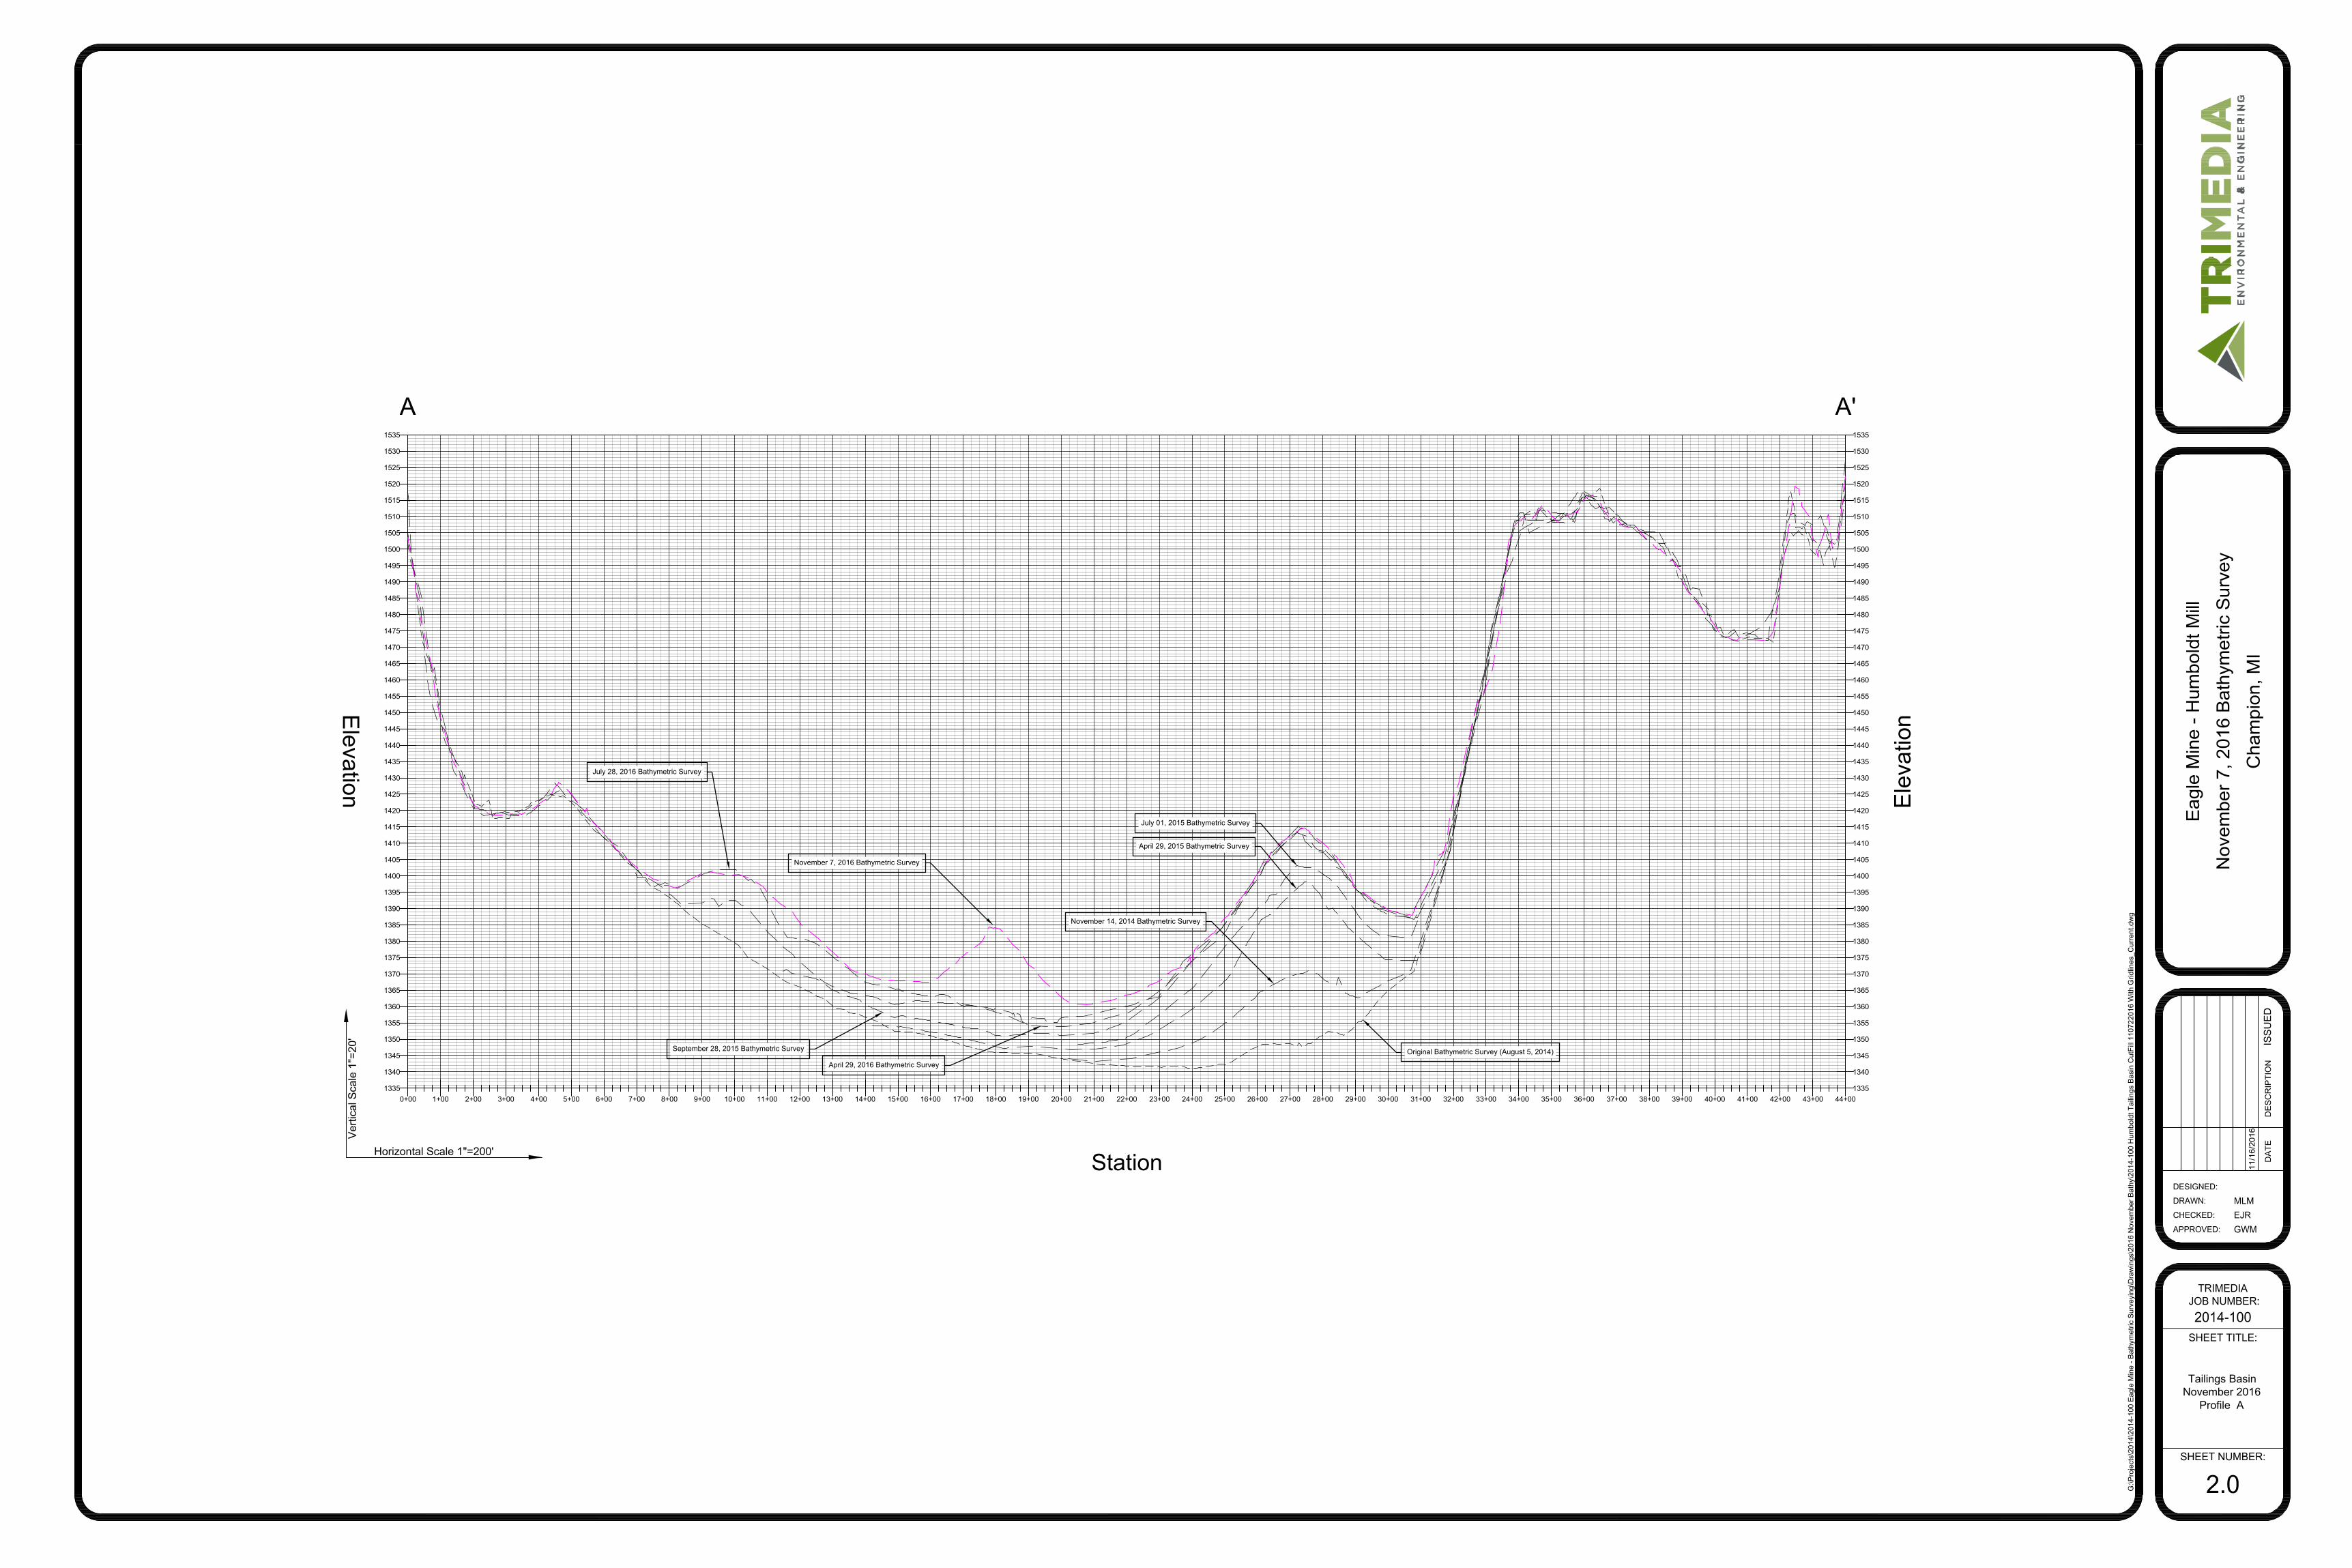
Elevation
Elevation
Station
1335
1340
1345
1350
1355
1360
1365
1370
1375
1380
1385
1390
1395
1400
1405
1410
1415
1420
1425
1430
1435
1440
1445
1450
1455
1460
1465
1470
1475
1480
1485
1490
1495
1500
1505
1510
1515
1520
1525
1530
1535
1335
1340
1345
1350
1355
1360
1365
1370
1375
1380
1385
1390
1395
1400
1405
1410
1415
1420
1425
1430
1435
1440
1445
1450
1455
1460
1465
1470
1475
1480
1485
1490
1495
1500
1505
1510
1515
1520
1525
1530
1535
0+00 1+00 2+00 3+00 4+00 5+00 6+00 7+00 8+00 9+00 10+00 11+00 12+00 13+00 14+00 15+00 16+00 17+00 18+00 19+00 20+00 21+00 22+00 23+00 24+00 25+00 26+00 27+00 28+00 29+00 30+00 31+00 32+00 33+00 34+00 35+00 36+00 37+00 38+00 39+00 40+00 41+00 42+00 43+00 44+00
SHEET TITLE:
DESIGNED:
DRAWN:
CHECKED:
APPROVED:
DA
TE
DE
SC
RIP
TIO
NIS
SU
ED
JOB NUMBER:
SHEET NUMBER:
TRIMEDIA
Ch
am
pio
n, M
I
Ea
gle
M
in
e - H
um
bo
ld
t M
ill
No
ve
mb
er 7
, 2
01
6 B
ath
ym
etric S
urve
y
11
/16/2016
GWM
EJR
MLM
2014-100
2.0
G:\P
rojects\2014\2014-100 E
agle M
ine - B
athym
etric S
urveying\D
raw
ings\2016 N
ovem
ber B
athy\2014-100 H
um
boldt T
ailings B
asin C
utF
ill 110722016 W
ith G
ridlines_C
urrent.dw
g
Horizontal Scale 1"=200'
Vertical S
cale 1"=
20'
Original Bathymetric Survey (August 5, 2014)
November 14, 2014 Bathymetric Survey
April 29, 2015 Bathymetric Survey
July 01, 2015 Bathymetric Survey
September 28, 2015 Bathymetric Survey
April 29, 2016 Bathymetric Survey
A A'
Tailings Basin
November 2016
Profile A
July 28, 2016 Bathymetric Survey
November 7, 2016 Bathymetric Survey
Appendix C
Humboldt Mill
Storm Water Drainage Map
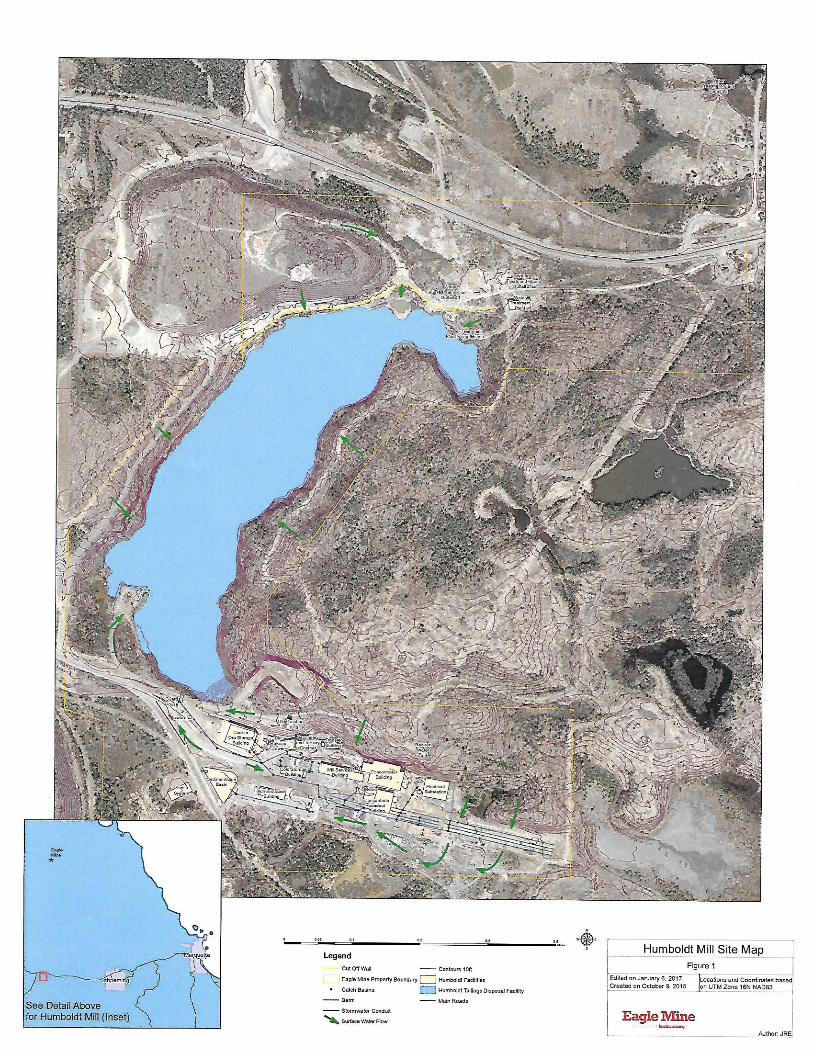
Appendix E
Humboldt Mill
Groundwater Monitoring Well Location Map
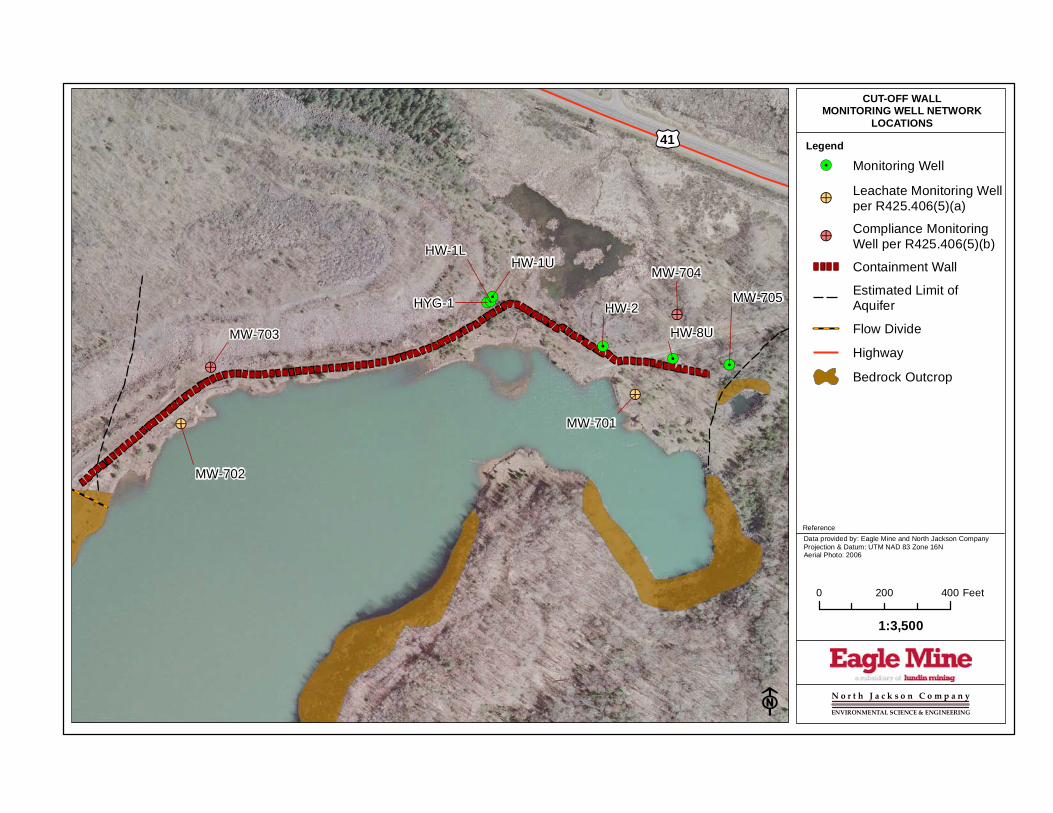
!. !.
!.
!>
!>
!>
!>
!.!.
!.
HW-2
HW-1UHW-1L
HYG-1
HW-8U
MW-701
MW-704
MW-703
MW-702
MW-705
F
CUT-OFF WALLMONITORING WELL NETWORK
LOCATIONSLegend
ReferenceData provided by: Eagle Mine and North Jackson CompanyProjection & Datum: UTM NAD 83 Zone 16NAerial Photo: 2006
N o r t h J a c k s o n C o m p a n yENVIRONMENTAL SCIENCE & ENGINEERING
0 400200 Feet
1:3,500
£¤41!. Monitoring Well
Containment Wall
Estimated Limit ofAquifer
Flow Divide
Highway
Bedrock Outcrop
Compliance MonitoringWell per R425.406(5)(b)!>
Leachate Monitoring Wellper R425.406(5)(a)!>
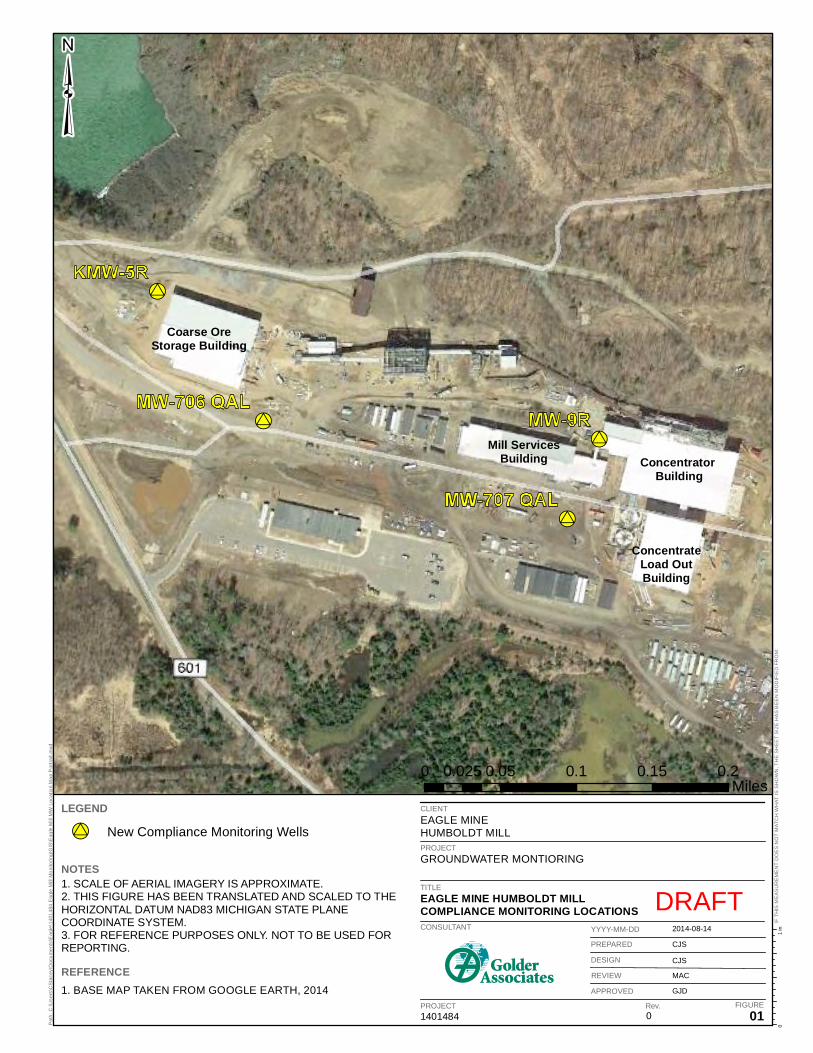
!U
!U
!U
!U
CLIENTEAGLE MINEHUMBOLDT MILL
LEGEND
!U New Compliance Monitoring WellsPROJECTGROUNDWATER MONTIORING
TITLEEAGLE MINE HUMBOLDT MILLCOMPLIANCE MONITORING LOCATIONS
1401484 0 01
2014-08-14
CJS
CJS
MAC
GJD
1 in
0Pat
h: C
:\Use
rs\C
Sta
cey\
Doc
umen
ts\E
agle
\140
1484
Eag
le M
ill M
onito
ring\
GIS
\Eag
le M
ill M
W L
ocat
ion
Map
Por
trait.
mxd
IF T
HIS
ME
AS
UR
EM
EN
T D
OE
S N
OT
MAT
CH
WH
AT IS
SH
OW
N, T
HE
SH
EE
T S
IZE
HA
S B
EE
N M
OD
IFIE
D F
RO
M:
CONSULTANT
PROJECT Rev. FIGURE
YYYY-MM-DD
PREPARED
DESIGN
REVIEW
APPROVED
NOTES
REFERENCE
1. SCALE OF AERIAL IMAGERY IS APPROXIMATE.2. THIS FIGURE HAS BEEN TRANSLATED AND SCALED TO THEHORIZONTAL DATUM NAD83 MICHIGAN STATE PLANECOORDINATE SYSTEM.3. FOR REFERENCE PURPOSES ONLY. NOT TO BE USED FORREPORTING.
1. BASE MAP TAKEN FROM GOOGLE EARTH, 2014
³
Coarse Ore Storage Building
Mill Services Building Concentrator
Building
Concentrate Load Out Building
0 0.05 0.1 0.15 0.20.025Miles
DRAFT
Appendix F
Humboldt Mill
Groundwater Monitoring Well Results
&
Benchmark Summary Table
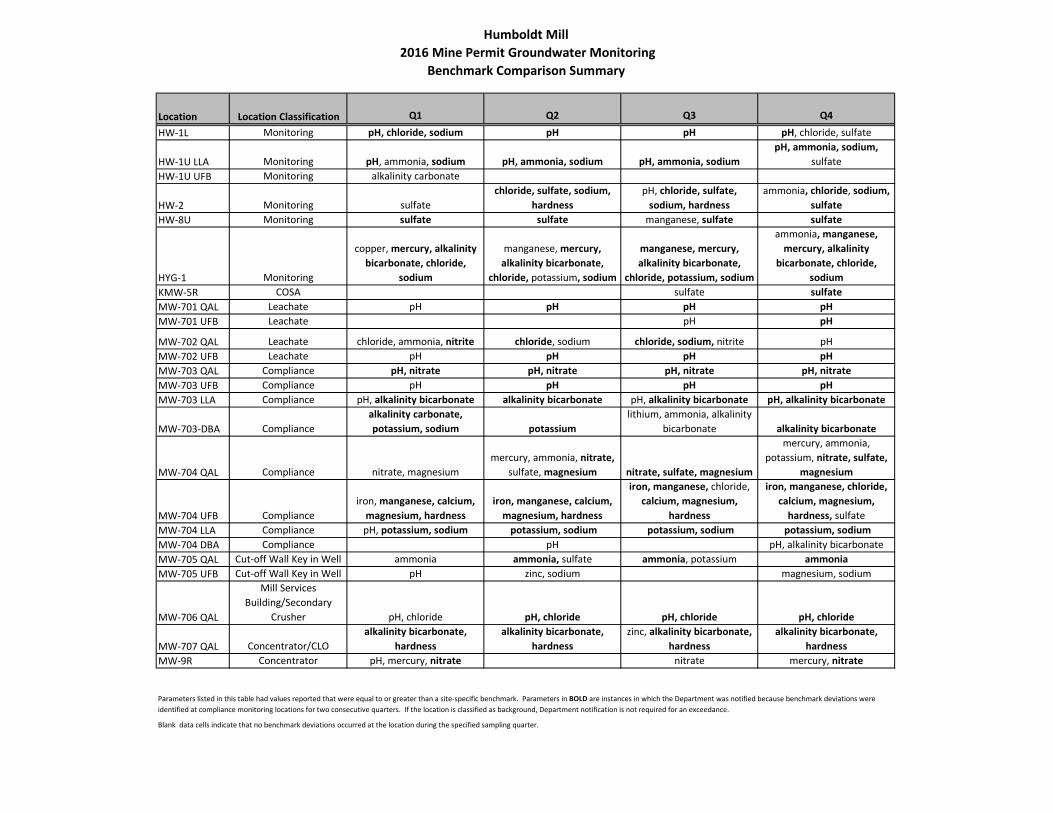
Humboldt Mill 2016 Mine Permit Groundwater Monitoring
Benchmark Comparison Summary
Location Location Classification Q1 Q2 Q3 Q4
HW-1L Monitoring pH, chloride, sodium pH pH pH, chloride, sulfate
HW-1U LLA Monitoring pH, ammonia, sodium pH, ammonia, sodium pH, ammonia, sodiumpH, ammonia, sodium,
sulfateHW-1U UFB Monitoring alkalinity carbonate
HW-2 Monitoring sulfatechloride, sulfate, sodium,
hardnesspH, chloride, sulfate,
sodium, hardnessammonia, chloride, sodium,
sulfateHW-8U Monitoring sulfate sulfate manganese, sulfate sulfate
HYG-1 Monitoring
copper, mercury, alkalinity bicarbonate, chloride,
sodium
manganese, mercury, alkalinity bicarbonate,
chloride, potassium, sodium
manganese, mercury, alkalinity bicarbonate,
chloride, potassium, sodium
ammonia, manganese, mercury, alkalinity
bicarbonate, chloride, sodium
KMW-5R COSA sulfate sulfateMW-701 QAL Leachate pH pH pH pHMW-701 UFB Leachate pH pH
MW-702 QAL Leachate chloride, ammonia, nitrite chloride, sodium chloride, sodium, nitrite pHMW-702 UFB Leachate pH pH pH pHMW-703 QAL Compliance pH, nitrate pH, nitrate pH, nitrate pH, nitrateMW-703 UFB Compliance pH pH pH pHMW-703 LLA Compliance pH, alkalinity bicarbonate alkalinity bicarbonate pH, alkalinity bicarbonate pH, alkalinity bicarbonate
MW-703-DBA Compliancealkalinity carbonate, potassium, sodium potassium
lithium, ammonia, alkalinity bicarbonate alkalinity bicarbonate
MW-704 QAL Compliance nitrate, magnesiummercury, ammonia, nitrate,
sulfate, magnesium nitrate, sulfate, magnesium
mercury, ammonia, potassium, nitrate, sulfate,
magnesium
MW-704 UFB Complianceiron, manganese, calcium,
magnesium, hardnessiron, manganese, calcium,
magnesium, hardness
iron, manganese, chloride, calcium, magnesium,
hardness
iron, manganese, chloride, calcium, magnesium,
hardness, sulfateMW-704 LLA Compliance pH, potassium, sodium potassium, sodium potassium, sodium potassium, sodiumMW-704 DBA Compliance pH pH, alkalinity bicarbonateMW-705 QAL Cut-off Wall Key in Well ammonia ammonia, sulfate ammonia, potassium ammoniaMW-705 UFB Cut-off Wall Key in Well pH zinc, sodium magnesium, sodium
MW-706 QAL
Mill Services Building/Secondary
Crusher pH, chloride pH, chloride pH, chloride pH, chloride
MW-707 QAL Concentrator/CLOalkalinity bicarbonate,
hardnessalkalinity bicarbonate,
hardnesszinc, alkalinity bicarbonate,
hardnessalkalinity bicarbonate,
hardnessMW-9R Concentrator pH, mercury, nitrate nitrate mercury, nitrate
Blank data cells indicate that no benchmark deviations occurred at the location during the specified sampling quarter.
Parameters listed in this table had values reported that were equal to or greater than a site-specific benchmark. Parameters in BOLD are instances in which the Department was notified because benchmark deviations were identified at compliance monitoring locations for two consecutive quarters. If the location is classified as background, Department notification is not required for an exceedance.

2016Mine Permit Groundwater Quality Monitoring Data
HW-1L (Monitoring)Humboldt Mill
Explanations of abbreviations are included on the final page of this table. HW-1L (Monitoring)
Parameter Unit
Recom- mended
Benchmark 2014
D.O.1 ppm -- 0.14 0.24 1.1 0.45ORP mV -- -251 -250 -84 -57pH SU 9.0-10.0 8.5 8.4 8.7 8.4Specific Conductance µS/cm -- 372 365 272 240Temperature °C -- 6.5 9.0 12 8.2Turbidity NTU -- 64 25 55 6.5Water Elevation ft MSL -- 1451.87 1478.81 1472.12 1461.31
Aluminum ug/L 200 (p) -- -- < 50 --Antimony ug/L 8.0 (p) -- -- < 2.0 --Arsenic ug/L 20 (p) < 5.0 < 5.0 < 5.0 < 5.0Barium ug/L 400 (p) -- -- < 100 --Beryllium ug/L 4.0 (p) -- -- < 1.0 --Boron ug/L 1200 (p) -- -- 640 --Cadmium ug/L 4.0 (p) -- -- < 1.0 --Chromium ug/L 40 (p) -- -- < 10 --Cobalt ug/L 80 (p) -- -- < 20 --Copper ug/L 16 (p) < 4.0 < 4.0 < 4.0 < 4.0Iron ug/L 1134 1100 1000 540 700Lead ug/L 12 (p) < 3.0 < 3.0 < 3.0 < 3.0Lithium ug/L 40 (p) -- -- 22 --Manganese ug/L 23 < 50 < 50 < 50 < 50Mercury ng/L 4.0 (p) < 1.0 < 1.0 < 1.0 < 1.0Molybdenum ug/L 200 (p) -- -- < 50 --Nickel ug/L 80 (p) < 20 < 20 < 20 < 20Selenium ug/L 20 (p) -- -- < 5.0 --Silver ug/L 0.8 (p) -- -- < 0.20 --Thallium ug/L 8.0 (p) -- -- < 2.0 --Vanadium ug/L 16 (p) -- -- < 4.0 --Zinc ug/L 11 < 10 < 10 < 10 < 10
Alkalinity, Bicarbonate mg/L 117 79 80 80 82Alkalinity, Carbonate mg/L 14 < 2.0 < 2.0 < 2.0 < 2.0Chloride mg/L 52 53 53 51 53Fluoride mg/L 4.0 (p) < 1.0 < 1.0 < 1.0 < 1.0Nitrogen, Ammonia mg/L 0.04 < 0.03 < 0.03 < 0.03 < 0.03Nitrogen, Nitrate mg/L 0.40 (p) < 0.1 < 0.1 < 0.1 < 0.1Nitrogen, Nitrite mg/L 0.40 (p) < 0.1 < 0.1 < 0.1 < 0.1Sulfate mg/L 24 22 22 22 24Sulfide mg/L 0.80 (p) < 0.20 < 0.20 < 0.20 < 0.20
Calcium mg/L 35 26 27 23 25Magnesium mg/L 17 11 11 10 11Potassium mg/L 11 1.9 1.8 1.6 1.8Sodium mg/L 27 27 27 24 25
Hardness mg/L 157 108 122 112 110
Major Cations
General
Q4 2016 11/22/16D
Q3 2016 8/24/16D
Q2 2016 5/17/16D
Q1 2016 2/24/16D
Field
Metals
Major Anions
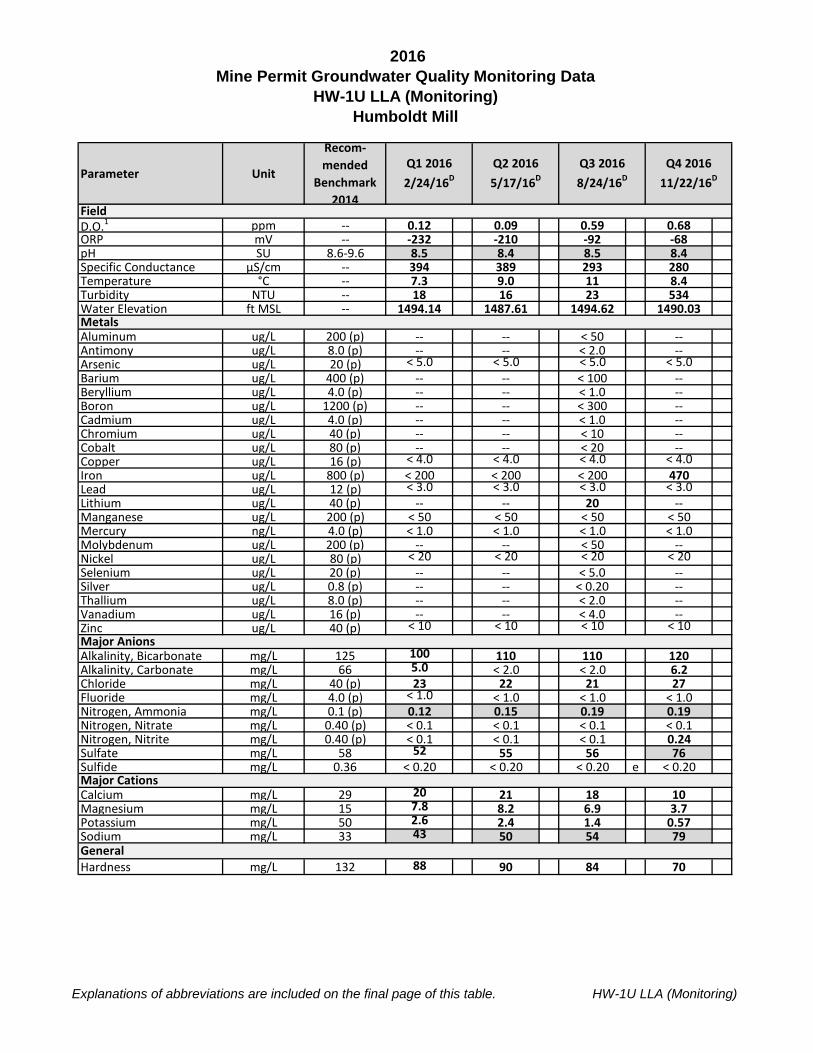
2016Mine Permit Groundwater Quality Monitoring Data
HW-1U LLA (Monitoring)Humboldt Mill
Explanations of abbreviations are included on the final page of this table. HW-1U LLA (Monitoring)
Parameter Unit
Recom- mended
Benchmark 2014
D.O.1 ppm -- 0.12 0.09 0.59 0.68ORP mV -- -232 -210 -92 -68pH SU 8.6-9.6 8.5 8.4 8.5 8.4Specific Conductance µS/cm -- 394 389 293 280Temperature °C -- 7.3 9.0 11 8.4Turbidity NTU -- 18 16 23 534Water Elevation ft MSL -- 1494.14 1487.61 1494.62 1490.03
Aluminum ug/L 200 (p) -- -- < 50 --Antimony ug/L 8.0 (p) -- -- < 2.0 --Arsenic ug/L 20 (p) < 5.0 < 5.0 < 5.0 < 5.0Barium ug/L 400 (p) -- -- < 100 --Beryllium ug/L 4.0 (p) -- -- < 1.0 --Boron ug/L 1200 (p) -- -- < 300 --Cadmium ug/L 4.0 (p) -- -- < 1.0 --Chromium ug/L 40 (p) -- -- < 10 --Cobalt ug/L 80 (p) -- -- < 20 --Copper ug/L 16 (p) < 4.0 < 4.0 < 4.0 < 4.0Iron ug/L 800 (p) < 200 < 200 < 200 470Lead ug/L 12 (p) < 3.0 < 3.0 < 3.0 < 3.0Lithium ug/L 40 (p) -- -- 20 --Manganese ug/L 200 (p) < 50 < 50 < 50 < 50Mercury ng/L 4.0 (p) < 1.0 < 1.0 < 1.0 < 1.0Molybdenum ug/L 200 (p) -- -- < 50 --Nickel ug/L 80 (p) < 20 < 20 < 20 < 20Selenium ug/L 20 (p) -- -- < 5.0 --Silver ug/L 0.8 (p) -- -- < 0.20 --Thallium ug/L 8.0 (p) -- -- < 2.0 --Vanadium ug/L 16 (p) -- -- < 4.0 --Zinc ug/L 40 (p) < 10 < 10 < 10 < 10
Alkalinity, Bicarbonate mg/L 125 100 110 110 120Alkalinity, Carbonate mg/L 66 5.0 < 2.0 < 2.0 6.2Chloride mg/L 40 (p) 23 22 21 27Fluoride mg/L 4.0 (p) < 1.0 < 1.0 < 1.0 < 1.0Nitrogen, Ammonia mg/L 0.1 (p) 0.12 0.15 0.19 0.19Nitrogen, Nitrate mg/L 0.40 (p) < 0.1 < 0.1 < 0.1 < 0.1Nitrogen, Nitrite mg/L 0.40 (p) < 0.1 < 0.1 < 0.1 0.24Sulfate mg/L 58 52 55 56 76Sulfide mg/L 0.36 < 0.20 < 0.20 < 0.20 e < 0.20
Calcium mg/L 29 20 21 18 10Magnesium mg/L 15 7.8 8.2 6.9 3.7Potassium mg/L 50 2.6 2.4 1.4 0.57Sodium mg/L 33 43 50 54 79
Hardness mg/L 132 88 90 84 70
Major Cations
General
Q4 2016 11/22/16D
Q2 2016 5/17/16D
Q1 2016 2/24/16D
Q3 2016 8/24/16D
Field
Metals
Major Anions
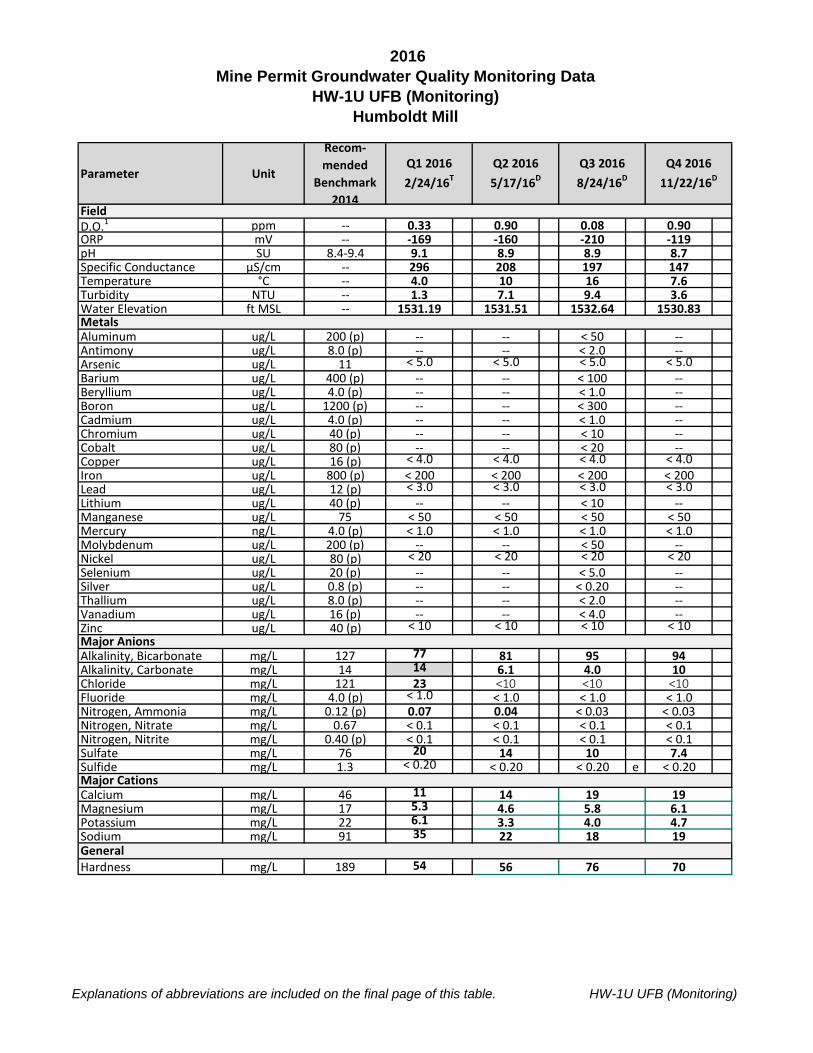
2016Mine Permit Groundwater Quality Monitoring Data
HW-1U UFB (Monitoring)Humboldt Mill
Explanations of abbreviations are included on the final page of this table. HW-1U UFB (Monitoring)
Parameter Unit
Recom- mended
Benchmark 2014
D.O.1 ppm -- 0.33 0.90 0.08 0.90ORP mV -- -169 -160 -210 -119pH SU 8.4-9.4 9.1 8.9 8.9 8.7Specific Conductance µS/cm -- 296 208 197 147Temperature °C -- 4.0 10 16 7.6Turbidity NTU -- 1.3 7.1 9.4 3.6Water Elevation ft MSL -- 1531.19 1531.51 1532.64 1530.83
Aluminum ug/L 200 (p) -- -- < 50 --Antimony ug/L 8.0 (p) -- -- < 2.0 --Arsenic ug/L 11 < 5.0 < 5.0 < 5.0 < 5.0Barium ug/L 400 (p) -- -- < 100 --Beryllium ug/L 4.0 (p) -- -- < 1.0 --Boron ug/L 1200 (p) -- -- < 300 --Cadmium ug/L 4.0 (p) -- -- < 1.0 --Chromium ug/L 40 (p) -- -- < 10 --Cobalt ug/L 80 (p) -- -- < 20 --Copper ug/L 16 (p) < 4.0 < 4.0 < 4.0 < 4.0Iron ug/L 800 (p) < 200 < 200 < 200 < 200Lead ug/L 12 (p) < 3.0 < 3.0 < 3.0 < 3.0Lithium ug/L 40 (p) -- -- < 10 --Manganese ug/L 75 < 50 < 50 < 50 < 50Mercury ng/L 4.0 (p) < 1.0 < 1.0 < 1.0 < 1.0Molybdenum ug/L 200 (p) -- -- < 50 --Nickel ug/L 80 (p) < 20 < 20 < 20 < 20Selenium ug/L 20 (p) -- -- < 5.0 --Silver ug/L 0.8 (p) -- -- < 0.20 --Thallium ug/L 8.0 (p) -- -- < 2.0 --Vanadium ug/L 16 (p) -- -- < 4.0 --Zinc ug/L 40 (p) < 10 < 10 < 10 < 10
Alkalinity, Bicarbonate mg/L 127 77 81 95 94Alkalinity, Carbonate mg/L 14 14 6.1 4.0 10Chloride mg/L 121 23 <10 <10 <10Fluoride mg/L 4.0 (p) < 1.0 < 1.0 < 1.0 < 1.0Nitrogen, Ammonia mg/L 0.12 (p) 0.07 0.04 < 0.03 < 0.03Nitrogen, Nitrate mg/L 0.67 < 0.1 < 0.1 < 0.1 < 0.1Nitrogen, Nitrite mg/L 0.40 (p) < 0.1 < 0.1 < 0.1 < 0.1Sulfate mg/L 76 20 14 10 7.4Sulfide mg/L 1.3 < 0.20 < 0.20 < 0.20 e < 0.20
Calcium mg/L 46 11 14 19 19Magnesium mg/L 17 5.3 4.6 5.8 6.1Potassium mg/L 22 6.1 3.3 4.0 4.7Sodium mg/L 91 35 22 18 19
Hardness mg/L 189 54 56 76 70
Major Cations
General
Q4 2016 11/22/16D
Q2 2016 5/17/16D
Q1 2016 2/24/16T
Q3 2016 8/24/16D
Field
Metals
Major Anions
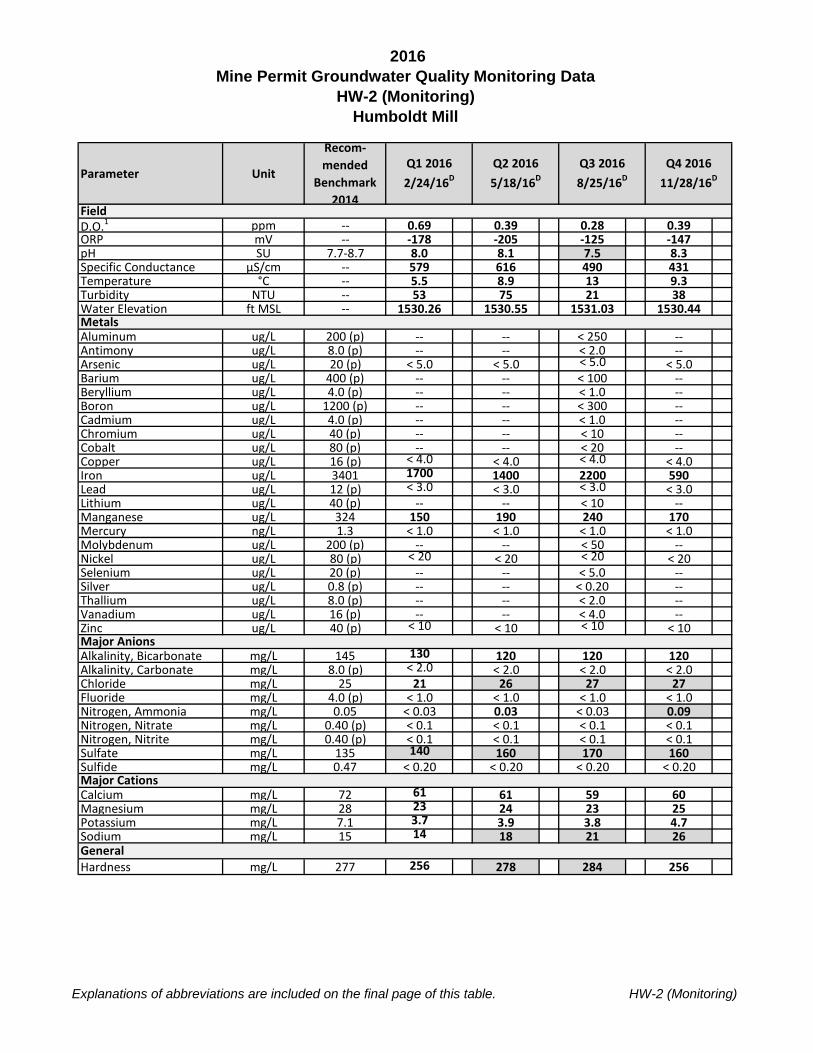
2016Mine Permit Groundwater Quality Monitoring Data
HW-2 (Monitoring)Humboldt Mill
Explanations of abbreviations are included on the final page of this table. HW-2 (Monitoring)
Parameter Unit
Recom- mended
Benchmark 2014
D.O.1 ppm -- 0.69 0.39 0.28 0.39ORP mV -- -178 -205 -125 -147pH SU 7.7-8.7 8.0 8.1 7.5 8.3Specific Conductance µS/cm -- 579 616 490 431Temperature °C -- 5.5 8.9 13 9.3Turbidity NTU -- 53 75 21 38Water Elevation ft MSL -- 1530.26 1530.55 1531.03 1530.44
Aluminum ug/L 200 (p) -- -- < 250 --Antimony ug/L 8.0 (p) -- -- < 2.0 --Arsenic ug/L 20 (p) < 5.0 < 5.0 < 5.0 < 5.0Barium ug/L 400 (p) -- -- < 100 --Beryllium ug/L 4.0 (p) -- -- < 1.0 --Boron ug/L 1200 (p) -- -- < 300 --Cadmium ug/L 4.0 (p) -- -- < 1.0 --Chromium ug/L 40 (p) -- -- < 10 --Cobalt ug/L 80 (p) -- -- < 20 --Copper ug/L 16 (p) < 4.0 < 4.0 < 4.0 < 4.0Iron ug/L 3401 1700 1400 2200 590Lead ug/L 12 (p) < 3.0 < 3.0 < 3.0 < 3.0Lithium ug/L 40 (p) -- -- < 10 --Manganese ug/L 324 150 190 240 170Mercury ng/L 1.3 < 1.0 < 1.0 < 1.0 < 1.0Molybdenum ug/L 200 (p) -- -- < 50 --Nickel ug/L 80 (p) < 20 < 20 < 20 < 20Selenium ug/L 20 (p) -- -- < 5.0 --Silver ug/L 0.8 (p) -- -- < 0.20 --Thallium ug/L 8.0 (p) -- -- < 2.0 --Vanadium ug/L 16 (p) -- -- < 4.0 --Zinc ug/L 40 (p) < 10 < 10 < 10 < 10
Alkalinity, Bicarbonate mg/L 145 130 120 120 120Alkalinity, Carbonate mg/L 8.0 (p) < 2.0 < 2.0 < 2.0 < 2.0Chloride mg/L 25 21 26 27 27Fluoride mg/L 4.0 (p) < 1.0 < 1.0 < 1.0 < 1.0Nitrogen, Ammonia mg/L 0.05 < 0.03 0.03 < 0.03 0.09Nitrogen, Nitrate mg/L 0.40 (p) < 0.1 < 0.1 < 0.1 < 0.1Nitrogen, Nitrite mg/L 0.40 (p) < 0.1 < 0.1 < 0.1 < 0.1Sulfate mg/L 135 140 160 170 160Sulfide mg/L 0.47 < 0.20 < 0.20 < 0.20 < 0.20
Calcium mg/L 72 61 61 59 60Magnesium mg/L 28 23 24 23 25Potassium mg/L 7.1 3.7 3.9 3.8 4.7Sodium mg/L 15 14 18 21 26
Hardness mg/L 277 256 278 284 256
Major Cations
General
Q4 2016 11/28/16D
Q2 2016 5/18/16D
Q1 2016 2/24/16D
Q3 2016 8/25/16D
Field
Metals
Major Anions
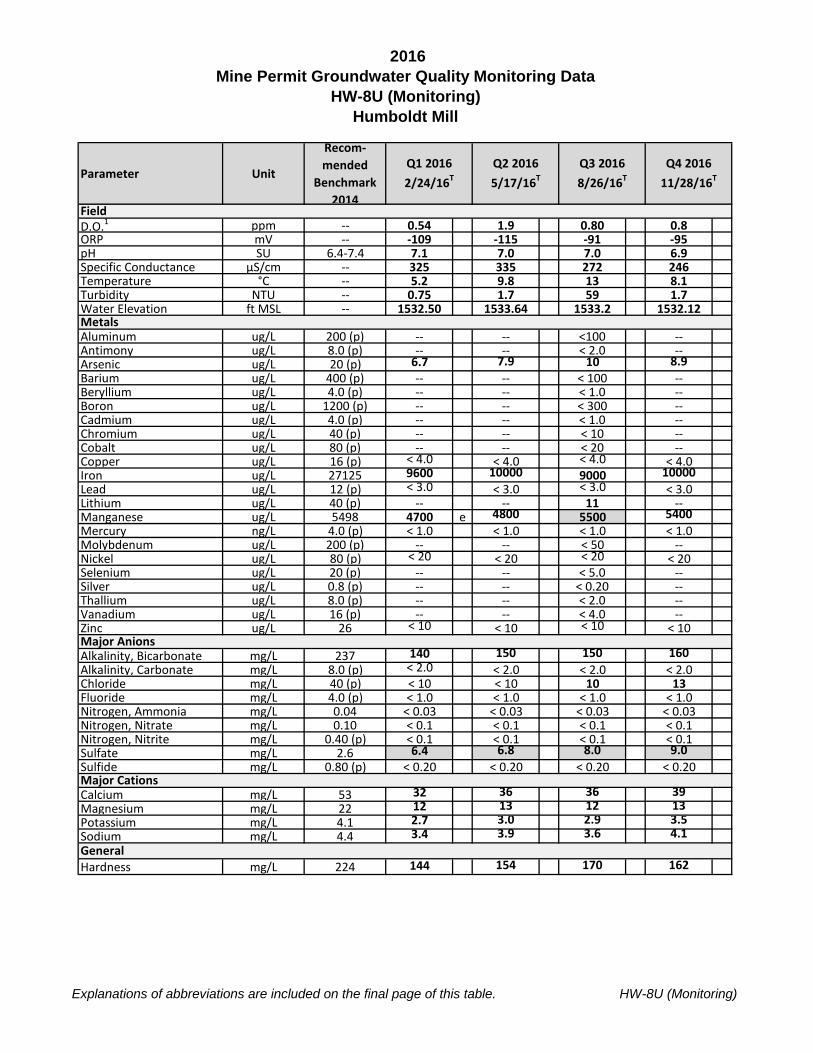
2016Mine Permit Groundwater Quality Monitoring Data
HW-8U (Monitoring)Humboldt Mill
Explanations of abbreviations are included on the final page of this table. HW-8U (Monitoring)
Parameter Unit
Recom- mended
Benchmark 2014
D.O.1 ppm -- 0.54 1.9 0.80 0.8ORP mV -- -109 -115 -91 -95pH SU 6.4-7.4 7.1 7.0 7.0 6.9Specific Conductance µS/cm -- 325 335 272 246Temperature °C -- 5.2 9.8 13 8.1Turbidity NTU -- 0.75 1.7 59 1.7Water Elevation ft MSL -- 1532.50 1533.64 1533.2 1532.12
Aluminum ug/L 200 (p) -- -- <100 --Antimony ug/L 8.0 (p) -- -- < 2.0 --Arsenic ug/L 20 (p) 6.7 7.9 10 8.9Barium ug/L 400 (p) -- -- < 100 --Beryllium ug/L 4.0 (p) -- -- < 1.0 --Boron ug/L 1200 (p) -- -- < 300 --Cadmium ug/L 4.0 (p) -- -- < 1.0 --Chromium ug/L 40 (p) -- -- < 10 --Cobalt ug/L 80 (p) -- -- < 20 --Copper ug/L 16 (p) < 4.0 < 4.0 < 4.0 < 4.0Iron ug/L 27125 9600 10000 9000 10000Lead ug/L 12 (p) < 3.0 < 3.0 < 3.0 < 3.0Lithium ug/L 40 (p) -- -- 11 --Manganese ug/L 5498 4700 e 4800 5500 5400Mercury ng/L 4.0 (p) < 1.0 < 1.0 < 1.0 < 1.0Molybdenum ug/L 200 (p) -- -- < 50 --Nickel ug/L 80 (p) < 20 < 20 < 20 < 20Selenium ug/L 20 (p) -- -- < 5.0 --Silver ug/L 0.8 (p) -- -- < 0.20 --Thallium ug/L 8.0 (p) -- -- < 2.0 --Vanadium ug/L 16 (p) -- -- < 4.0 --Zinc ug/L 26 < 10 < 10 < 10 < 10
Alkalinity, Bicarbonate mg/L 237 140 150 150 160Alkalinity, Carbonate mg/L 8.0 (p) < 2.0 < 2.0 < 2.0 < 2.0Chloride mg/L 40 (p) < 10 < 10 10 13Fluoride mg/L 4.0 (p) < 1.0 < 1.0 < 1.0 < 1.0Nitrogen, Ammonia mg/L 0.04 < 0.03 < 0.03 < 0.03 < 0.03Nitrogen, Nitrate mg/L 0.10 < 0.1 < 0.1 < 0.1 < 0.1Nitrogen, Nitrite mg/L 0.40 (p) < 0.1 < 0.1 < 0.1 < 0.1Sulfate mg/L 2.6 6.4 6.8 8.0 9.0Sulfide mg/L 0.80 (p) < 0.20 < 0.20 < 0.20 < 0.20
Calcium mg/L 53 32 36 36 39Magnesium mg/L 22 12 13 12 13Potassium mg/L 4.1 2.7 3.0 2.9 3.5Sodium mg/L 4.4 3.4 3.9 3.6 4.1
Hardness mg/L 224 144 154 170 162
Major Cations
General
Q4 2016 11/28/16T
Q2 2016 5/17/16T
Q1 2016 2/24/16T
Q3 2016 8/26/16T
Field
Metals
Major Anions
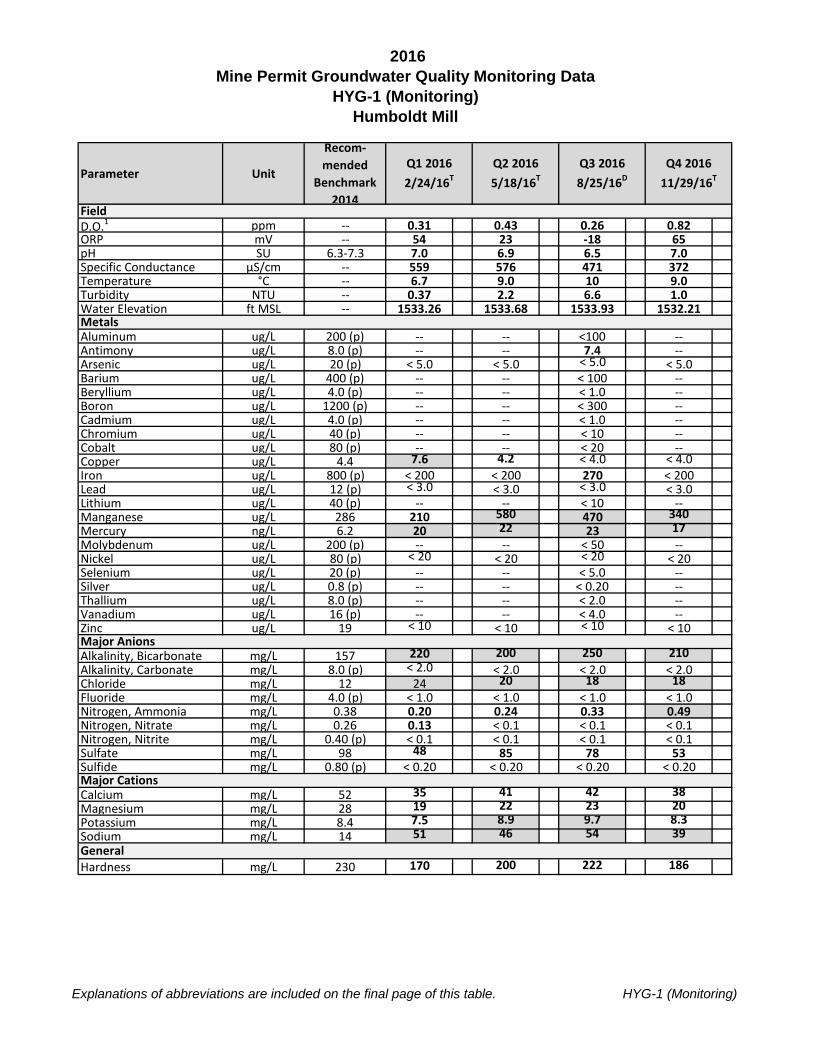
2016Mine Permit Groundwater Quality Monitoring Data
HYG-1 (Monitoring)Humboldt Mill
Explanations of abbreviations are included on the final page of this table. HYG-1 (Monitoring)
Parameter Unit
Recom- mended
Benchmark 2014
D.O.1 ppm -- 0.31 0.43 0.26 0.82ORP mV -- 54 23 -18 65pH SU 6.3-7.3 7.0 6.9 6.5 7.0Specific Conductance µS/cm -- 559 576 471 372Temperature °C -- 6.7 9.0 10 9.0Turbidity NTU -- 0.37 2.2 6.6 1.0Water Elevation ft MSL -- 1533.26 1533.68 1533.93 1532.21
Aluminum ug/L 200 (p) -- -- <100 --Antimony ug/L 8.0 (p) -- -- 7.4 --Arsenic ug/L 20 (p) < 5.0 < 5.0 < 5.0 < 5.0Barium ug/L 400 (p) -- -- < 100 --Beryllium ug/L 4.0 (p) -- -- < 1.0 --Boron ug/L 1200 (p) -- -- < 300 --Cadmium ug/L 4.0 (p) -- -- < 1.0 --Chromium ug/L 40 (p) -- -- < 10 --Cobalt ug/L 80 (p) -- -- < 20 --Copper ug/L 4.4 7.6 4.2 < 4.0 < 4.0Iron ug/L 800 (p) < 200 < 200 270 < 200Lead ug/L 12 (p) < 3.0 < 3.0 < 3.0 < 3.0Lithium ug/L 40 (p) -- -- < 10 --Manganese ug/L 286 210 580 470 340Mercury ng/L 6.2 20 22 23 17Molybdenum ug/L 200 (p) -- -- < 50 --Nickel ug/L 80 (p) < 20 < 20 < 20 < 20Selenium ug/L 20 (p) -- -- < 5.0 --Silver ug/L 0.8 (p) -- -- < 0.20 --Thallium ug/L 8.0 (p) -- -- < 2.0 --Vanadium ug/L 16 (p) -- -- < 4.0 --Zinc ug/L 19 < 10 < 10 < 10 < 10
Alkalinity, Bicarbonate mg/L 157 220 200 250 210Alkalinity, Carbonate mg/L 8.0 (p) < 2.0 < 2.0 < 2.0 < 2.0Chloride mg/L 12 24 20 18 18Fluoride mg/L 4.0 (p) < 1.0 < 1.0 < 1.0 < 1.0Nitrogen, Ammonia mg/L 0.38 0.20 0.24 0.33 0.49Nitrogen, Nitrate mg/L 0.26 0.13 < 0.1 < 0.1 < 0.1Nitrogen, Nitrite mg/L 0.40 (p) < 0.1 < 0.1 < 0.1 < 0.1Sulfate mg/L 98 48 85 78 53Sulfide mg/L 0.80 (p) < 0.20 < 0.20 < 0.20 < 0.20
Calcium mg/L 52 35 41 42 38Magnesium mg/L 28 19 22 23 20Potassium mg/L 8.4 7.5 8.9 9.7 8.3Sodium mg/L 14 51 46 54 39
Hardness mg/L 230 170 200 222 186
Major Cations
General
Q4 2016 11/29/16T
Q2 2016 5/18/16T
Q1 2016 2/24/16T
Q3 2016 8/25/16D
Field
Metals
Major Anions
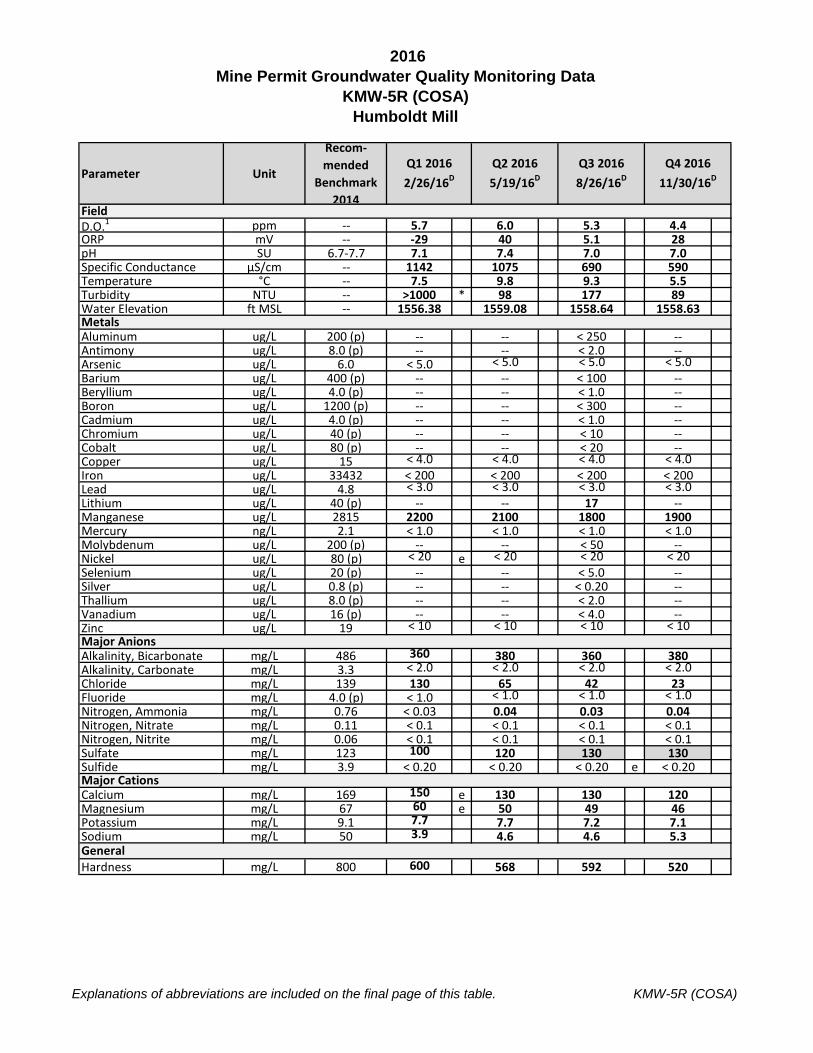
2016Mine Permit Groundwater Quality Monitoring Data
KMW-5R (COSA)Humboldt Mill
Explanations of abbreviations are included on the final page of this table. KMW-5R (COSA)
Parameter Unit
Recom- mended
Benchmark 2014
D.O.1 ppm -- 5.7 6.0 5.3 4.4ORP mV -- -29 40 5.1 28pH SU 6.7-7.7 7.1 7.4 7.0 7.0Specific Conductance µS/cm -- 1142 1075 690 590Temperature °C -- 7.5 9.8 9.3 5.5Turbidity NTU -- >1000 * 98 177 89Water Elevation ft MSL -- 1556.38 1559.08 1558.64 1558.63
Aluminum ug/L 200 (p) -- -- < 250 --Antimony ug/L 8.0 (p) -- -- < 2.0 --Arsenic ug/L 6.0 < 5.0 < 5.0 < 5.0 < 5.0Barium ug/L 400 (p) -- -- < 100 --Beryllium ug/L 4.0 (p) -- -- < 1.0 --Boron ug/L 1200 (p) -- -- < 300 --Cadmium ug/L 4.0 (p) -- -- < 1.0 --Chromium ug/L 40 (p) -- -- < 10 --Cobalt ug/L 80 (p) -- -- < 20 --Copper ug/L 15 < 4.0 < 4.0 < 4.0 < 4.0Iron ug/L 33432 < 200 < 200 < 200 < 200Lead ug/L 4.8 < 3.0 < 3.0 < 3.0 < 3.0Lithium ug/L 40 (p) -- -- 17 --Manganese ug/L 2815 2200 2100 1800 1900Mercury ng/L 2.1 < 1.0 < 1.0 < 1.0 < 1.0Molybdenum ug/L 200 (p) -- -- < 50 --Nickel ug/L 80 (p) < 20 e < 20 < 20 < 20Selenium ug/L 20 (p) -- -- < 5.0 --Silver ug/L 0.8 (p) -- -- < 0.20 --Thallium ug/L 8.0 (p) -- -- < 2.0 --Vanadium ug/L 16 (p) -- -- < 4.0 --Zinc ug/L 19 < 10 < 10 < 10 < 10
Alkalinity, Bicarbonate mg/L 486 360 380 360 380Alkalinity, Carbonate mg/L 3.3 < 2.0 < 2.0 < 2.0 < 2.0Chloride mg/L 139 130 65 42 23Fluoride mg/L 4.0 (p) < 1.0 < 1.0 < 1.0 < 1.0Nitrogen, Ammonia mg/L 0.76 < 0.03 0.04 0.03 0.04Nitrogen, Nitrate mg/L 0.11 < 0.1 < 0.1 < 0.1 < 0.1Nitrogen, Nitrite mg/L 0.06 < 0.1 < 0.1 < 0.1 < 0.1Sulfate mg/L 123 100 120 130 130Sulfide mg/L 3.9 < 0.20 < 0.20 < 0.20 e < 0.20
Calcium mg/L 169 150 e 130 130 120Magnesium mg/L 67 60 e 50 49 46Potassium mg/L 9.1 7.7 7.7 7.2 7.1Sodium mg/L 50 3.9 4.6 4.6 5.3
Hardness mg/L 800 600 568 592 520
Major Cations
General
Q4 2016 11/30/16D
Q2 2016 5/19/16D
Q1 2016 2/26/16D
Q3 2016 8/26/16D
Field
Metals
Major Anions
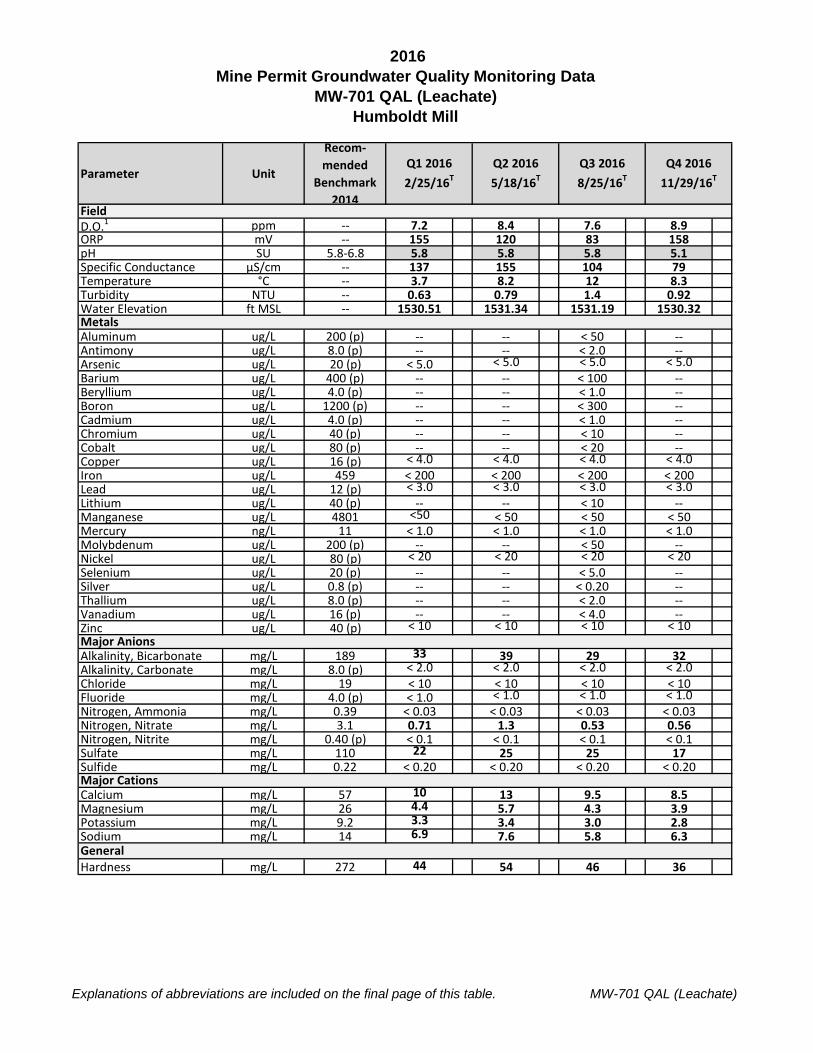
2016Mine Permit Groundwater Quality Monitoring Data
MW-701 QAL (Leachate)Humboldt Mill
Explanations of abbreviations are included on the final page of this table. MW-701 QAL (Leachate)
Parameter Unit
Recom- mended
Benchmark 2014
D.O.1 ppm -- 7.2 8.4 7.6 8.9ORP mV -- 155 120 83 158pH SU 5.8-6.8 5.8 5.8 5.8 5.1Specific Conductance µS/cm -- 137 155 104 79Temperature °C -- 3.7 8.2 12 8.3Turbidity NTU -- 0.63 0.79 1.4 0.92Water Elevation ft MSL -- 1530.51 1531.34 1531.19 1530.32
Aluminum ug/L 200 (p) -- -- < 50 --Antimony ug/L 8.0 (p) -- -- < 2.0 --Arsenic ug/L 20 (p) < 5.0 < 5.0 < 5.0 < 5.0Barium ug/L 400 (p) -- -- < 100 --Beryllium ug/L 4.0 (p) -- -- < 1.0 --Boron ug/L 1200 (p) -- -- < 300 --Cadmium ug/L 4.0 (p) -- -- < 1.0 --Chromium ug/L 40 (p) -- -- < 10 --Cobalt ug/L 80 (p) -- -- < 20 --Copper ug/L 16 (p) < 4.0 < 4.0 < 4.0 < 4.0Iron ug/L 459 < 200 < 200 < 200 < 200Lead ug/L 12 (p) < 3.0 < 3.0 < 3.0 < 3.0Lithium ug/L 40 (p) -- -- < 10 --Manganese ug/L 4801 <50 < 50 < 50 < 50Mercury ng/L 11 < 1.0 < 1.0 < 1.0 < 1.0Molybdenum ug/L 200 (p) -- -- < 50 --Nickel ug/L 80 (p) < 20 < 20 < 20 < 20Selenium ug/L 20 (p) -- -- < 5.0 --Silver ug/L 0.8 (p) -- -- < 0.20 --Thallium ug/L 8.0 (p) -- -- < 2.0 --Vanadium ug/L 16 (p) -- -- < 4.0 --Zinc ug/L 40 (p) < 10 < 10 < 10 < 10
Alkalinity, Bicarbonate mg/L 189 33 39 29 32Alkalinity, Carbonate mg/L 8.0 (p) < 2.0 < 2.0 < 2.0 < 2.0Chloride mg/L 19 < 10 < 10 < 10 < 10Fluoride mg/L 4.0 (p) < 1.0 < 1.0 < 1.0 < 1.0Nitrogen, Ammonia mg/L 0.39 < 0.03 < 0.03 < 0.03 < 0.03Nitrogen, Nitrate mg/L 3.1 0.71 1.3 0.53 0.56Nitrogen, Nitrite mg/L 0.40 (p) < 0.1 < 0.1 < 0.1 < 0.1Sulfate mg/L 110 22 25 25 17Sulfide mg/L 0.22 < 0.20 < 0.20 < 0.20 < 0.20
Calcium mg/L 57 10 13 9.5 8.5Magnesium mg/L 26 4.4 5.7 4.3 3.9Potassium mg/L 9.2 3.3 3.4 3.0 2.8Sodium mg/L 14 6.9 7.6 5.8 6.3
Hardness mg/L 272 44 54 46 36
Major Cations
General
Q4 2016 11/29/16T
Q2 2016 5/18/16T
Q1 2016 2/25/16T
Q3 2016 8/25/16T
Field
Metals
Major Anions

2016Mine Permit Groundwater Quality Monitoring Data
MW-701 UFB (Leachate)Humboldt Mill
Explanations of abbreviations are included on the final page of this table. MW-701 UFB (Leachate)
Parameter Unit
Recom- mended
Benchmark 2014
D.O.1 ppm -- 0.28 0.20 0.20 0.61ORP mV -- -161 -187 -136 -102pH SU 7.2-8.2 7.4 7.4 7.0 7.0Specific Conductance µS/cm -- 378 362 276 248Temperature °C -- 4.8 8.5 12 7.2Turbidity NTU -- 72 106 37 19Water Elevation ft MSL -- 1530.79 1531.63 1530.76 1530.93
Aluminum ug/L 200 (p) -- -- < 50 --Antimony ug/L 8.0 (p) -- -- < 2.0 --Arsenic ug/L 20 (p) < 5.0 < 5.0 < 5.0 < 5.0Barium ug/L 400 (p) -- -- 150 --Beryllium ug/L 4.0 (p) -- -- < 1.0 --Boron ug/L 1200 (p) -- -- < 300 --Cadmium ug/L 4.0 (p) -- -- < 1.0 --Chromium ug/L 40 (p) -- -- < 10 --Cobalt ug/L 80 (p) -- -- < 20 --Copper ug/L 30 < 4.0 < 4.0 < 4.0 < 4.0Iron ug/L 27405 20000 15000 15000 17000Lead ug/L 12 (p) < 3.0 < 3.0 < 3.0 < 3.0Lithium ug/L 40 (p) -- -- 12 --Manganese ug/L 6881 2600 2400 2000 2200Mercury ng/L 4.0 (p) < 1.0 < 1.0 < 1.0 < 1.0Molybdenum ug/L 200 (p) -- -- < 50 --Nickel ug/L 80 (p) < 20 < 20 < 20 < 20Selenium ug/L 20 (p) -- -- < 5.0 --Silver ug/L 0.8 (p) -- -- < 0.20 --Thallium ug/L 8.0 (p) -- -- < 2.0 --Vanadium ug/L 16 (p) -- -- < 4.0 --Zinc ug/L 26 < 10 < 10 < 10 < 10
Alkalinity, Bicarbonate mg/L 172 140 140 140 150Alkalinity, Carbonate mg/L 18 < 2.0 < 2.0 < 2.0 < 2.0Chloride mg/L 43 < 10 < 10 < 10 < 10Fluoride mg/L 4.0 (p) < 1.0 < 1.0 < 1.0 < 1.0Nitrogen, Ammonia mg/L 1.6 < 0.03 < 0.03 < 0.03 < 0.03Nitrogen, Nitrate mg/L 0.40 (p) < 0.1 < 0.1 < 0.1 < 0.1Nitrogen, Nitrite mg/L 0.40 (p) < 0.1 < 0.1 < 0.1 < 0.1Sulfate mg/L 80 28 22 23 21Sulfide mg/L 1.7 < 0.20 < 0.20 < 0.20 < 0.20
Calcium mg/L 40 36 35 31 34Magnesium mg/L 16 15 15 14 15Potassium mg/L 13 2.8 3.2 2.7 3.0Sodium mg/L 56 4.7 5.0 4.3 4.8
Hardness mg/L 163 154 158 158 156
Major Cations
General
Q4 2016 11/29/16D
Q2 2016 5/18/16D
Q1 2016 2/25/16D
Q3 2016 8/25/16D
Field
Metals
Major Anions
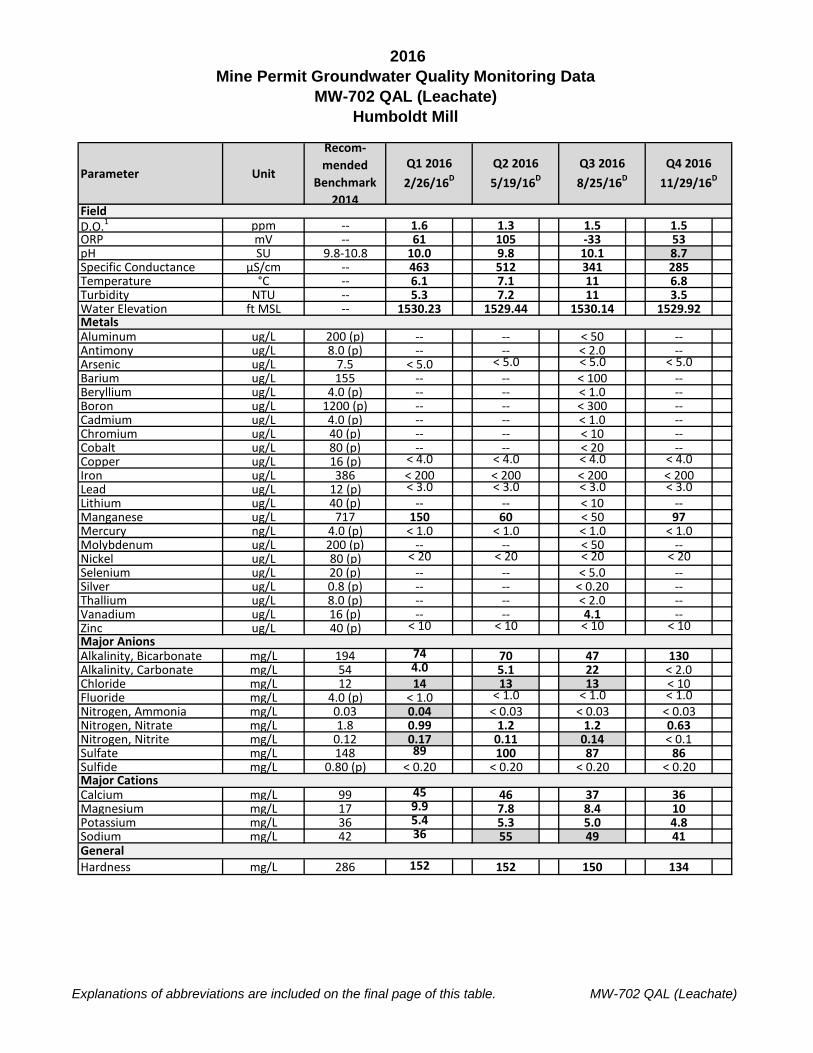
2016Mine Permit Groundwater Quality Monitoring Data
MW-702 QAL (Leachate)Humboldt Mill
Explanations of abbreviations are included on the final page of this table. MW-702 QAL (Leachate)
Parameter Unit
Recom- mended
Benchmark 2014
D.O.1 ppm -- 1.6 1.3 1.5 1.5ORP mV -- 61 105 -33 53pH SU 9.8-10.8 10.0 9.8 10.1 8.7Specific Conductance µS/cm -- 463 512 341 285Temperature °C -- 6.1 7.1 11 6.8Turbidity NTU -- 5.3 7.2 11 3.5Water Elevation ft MSL -- 1530.23 1529.44 1530.14 1529.92
Aluminum ug/L 200 (p) -- -- < 50 --Antimony ug/L 8.0 (p) -- -- < 2.0 --Arsenic ug/L 7.5 < 5.0 < 5.0 < 5.0 < 5.0Barium ug/L 155 -- -- < 100 --Beryllium ug/L 4.0 (p) -- -- < 1.0 --Boron ug/L 1200 (p) -- -- < 300 --Cadmium ug/L 4.0 (p) -- -- < 1.0 --Chromium ug/L 40 (p) -- -- < 10 --Cobalt ug/L 80 (p) -- -- < 20 --Copper ug/L 16 (p) < 4.0 < 4.0 < 4.0 < 4.0Iron ug/L 386 < 200 < 200 < 200 < 200Lead ug/L 12 (p) < 3.0 < 3.0 < 3.0 < 3.0Lithium ug/L 40 (p) -- -- < 10 --Manganese ug/L 717 150 60 < 50 97Mercury ng/L 4.0 (p) < 1.0 < 1.0 < 1.0 < 1.0Molybdenum ug/L 200 (p) -- -- < 50 --Nickel ug/L 80 (p) < 20 < 20 < 20 < 20Selenium ug/L 20 (p) -- -- < 5.0 --Silver ug/L 0.8 (p) -- -- < 0.20 --Thallium ug/L 8.0 (p) -- -- < 2.0 --Vanadium ug/L 16 (p) -- -- 4.1 --Zinc ug/L 40 (p) < 10 < 10 < 10 < 10
Alkalinity, Bicarbonate mg/L 194 74 70 47 130Alkalinity, Carbonate mg/L 54 4.0 5.1 22 < 2.0Chloride mg/L 12 14 13 13 < 10Fluoride mg/L 4.0 (p) < 1.0 < 1.0 < 1.0 < 1.0Nitrogen, Ammonia mg/L 0.03 0.04 < 0.03 < 0.03 < 0.03Nitrogen, Nitrate mg/L 1.8 0.99 1.2 1.2 0.63Nitrogen, Nitrite mg/L 0.12 0.17 0.11 0.14 < 0.1Sulfate mg/L 148 89 100 87 86Sulfide mg/L 0.80 (p) < 0.20 < 0.20 < 0.20 < 0.20
Calcium mg/L 99 45 46 37 36Magnesium mg/L 17 9.9 7.8 8.4 10Potassium mg/L 36 5.4 5.3 5.0 4.8Sodium mg/L 42 36 55 49 41
Hardness mg/L 286 152 152 150 134
Major Cations
General
Q4 2016 11/29/16D
Q2 2016 5/19/16D
Q1 2016 2/26/16D
Q3 2016 8/25/16D
Field
Metals
Major Anions
2016Mine Permit Groundwater Quality Monitoring Data
MW-702 UFB (Leachate)Humboldt Mill
Explanations of abbreviations are included on the final page of this table. MW-702 UFB (Leachate)
Parameter Unit
Recom- mended
Benchmark 2014
D.O.1 ppm -- 0.40 2.9 0.69 1.9ORP mV -- 112 -140 265 137pH SU 8.5-9.5 5.9 7.9 4.0 6.8Specific Conductance µS/cm -- 305 247 175 157Temperature °C -- 6.9 7.1 10 6.4Turbidity NTU -- 18 19 7.6 3Water Elevation ft MSL -- 1522.62 1525.75 1524.61 1526.19
Aluminum ug/L 200 (p) -- -- < 50 --Antimony ug/L 8.0 (p) -- -- < 2.0 --Arsenic ug/L 20 (p) < 5.0 < 5.0 < 5.0 < 5.0Barium ug/L 400 (p) -- -- < 100 --Beryllium ug/L 4.0 (p) -- -- < 1.0 --Boron ug/L 1200 (p) -- -- < 300 --Cadmium ug/L 4.0 (p) -- -- < 1.0 --Chromium ug/L 40 (p) -- -- < 10 --Cobalt ug/L 80 (p) -- -- < 20 --Copper ug/L 16 (p) < 4.0 < 4.0 < 4.0 < 4.0Iron ug/L 2484 850 630 540 630Lead ug/L 12 (p) < 3.0 < 3.0 < 3.0 < 3.0Lithium ug/L 40 (p) -- -- 12 --Manganese ug/L 126 96 85 89 78Mercury ng/L 4.0 (p) < 1.0 < 1.0 < 1.0 < 1.0Molybdenum ug/L 200 (p) -- -- < 50 --Nickel ug/L 80 (p) < 20 < 20 < 20 < 20Selenium ug/L 20 (p) -- -- < 5.0 --Silver ug/L 0.8 (p) -- -- < 0.20 --Thallium ug/L 8.0 (p) -- -- < 2.0 --Vanadium ug/L 16 (p) -- -- < 4.0 --Zinc ug/L 66 < 10 < 10 < 10 < 10
Alkalinity, Bicarbonate mg/L 125 92 89 91 94Alkalinity, Carbonate mg/L 15 < 2.0 < 2.0 < 2.0 < 2.0Chloride mg/L 40 (p) < 10 < 10 < 10 < 10Fluoride mg/L 4.0 (p) < 1.0 < 1.0 < 1.0 < 1.0Nitrogen, Ammonia mg/L 0.12 (p) 0.04 < 0.03 0.07 < 0.03Nitrogen, Nitrate mg/L 0.40 (p) < 0.1 < 0.1 < 0.1 < 0.1Nitrogen, Nitrite mg/L 0.40 (p) < 0.1 < 0.1 < 0.1 < 0.1Sulfate mg/L 36 32 34 31 33Sulfide mg/L 0.80 (p) < 0.20 < 0.20 < 0.20 e < 0.20
Calcium mg/L 49 28 30 26 29Magnesium mg/L 14 9.0 9.6 8.8 9.5Potassium mg/L 22 3.1 3.1 2.9 3.2Sodium mg/L 8.0 2.9 2.9 2.8 3.2
Hardness mg/L 160 110 118 114 116
Major Cations
General
Q4 2016 11/22/16D
Q2 2016 5/17/16D
Q1 2016 3/3/16D
Q3 2016 8/24/16D
Field
Metals
Major Anions
2016Mine Permit Groundwater Quality Monitoring Data
MW-703 QAL (Compliance)Humboldt Mill
Explanations of abbreviations are included on the final page of this table. MW-703 QAL (Compliance)
Parameter Unit
Recom- mended
Benchmark 2014
D.O.1 ppm -- 5.1 4.6 6.5 7.6ORP mV -- 148 81 65 84pH SU 7.2-8.2 6.4 6.6 6.2 5.9Specific Conductance µS/cm -- 155 372 89 97Temperature °C -- 5.7 7.5 9.1 6.5Turbidity NTU -- 3.3 3.7 3.7 2.4Water Elevation ft MSL -- 1533.59 1534.82 1535.66 1534.58
Aluminum ug/L 200 (p) -- -- < 50 --Antimony ug/L 8.0 (p) -- -- < 2.0 --Arsenic ug/L 20 (p) < 5.0 < 5.0 < 5.0 < 5.0Barium ug/L 400 (p) -- -- < 100 --Beryllium ug/L 4.0 (p) -- -- < 1.0 --Boron ug/L 1200 (p) -- -- < 300 --Cadmium ug/L 4.0 (p) -- -- < 1.0 --Chromium ug/L 40 (p) -- -- < 10 --Cobalt ug/L 80 (p) -- -- < 20 --Copper ug/L 16 (p) < 4.0 < 4.0 < 4.0 < 4.0Iron ug/L 255 < 200 < 200 < 200 < 200Lead ug/L 12 (p) < 3.0 < 3.0 < 3.0 < 3.0Lithium ug/L 40 (p) -- -- < 10 --Manganese ug/L 105 < 50 < 50 < 50 < 50Mercury ng/L 4.0 (p) < 1.0 < 1.0 < 1.0 < 1.0Molybdenum ug/L 200 (p) -- -- < 50 --Nickel ug/L 80 (p) < 20 < 20 < 20 < 20Selenium ug/L 20 (p) -- -- < 5.0 --Silver ug/L 0.8 (p) -- -- < 0.20 --Thallium ug/L 8.0 (p) -- -- < 2.0 --Vanadium ug/L 16 (p) -- -- < 4.0 --Zinc ug/L 40 (p) <10 < 10 < 10 < 10
Alkalinity, Bicarbonate mg/L 100 57 61 53 58Alkalinity, Carbonate mg/L 8.0 (p) < 2.0 < 2.0 < 2.0 < 2.0Chloride mg/L 40 (p) < 10 < 10 < 10 < 10Fluoride mg/L 131 < 1.0 < 1.0 < 1.0 < 1.0Nitrogen, Ammonia mg/L 0.12 (p) < 0.03 < 0.03 < 0.03 < 0.03Nitrogen, Nitrate mg/L 0.22 0.54 0.53 0.97 1.1Nitrogen, Nitrite mg/L 0.40 (p) < 0.1 < 0.1 < 0.1 < 0.1Sulfate mg/L 50 21 21 12 13Sulfide mg/L 0.30 < 0.20 < 0.20 < 0.20 < 0.20
Calcium mg/L 40 17 17 13 16Magnesium mg/L 11 7.4 6.9 5.9 6.7Potassium mg/L 3.1 1.5 1.8 1.3 1.5Sodium mg/L 10 3.0 2.9 2.4 2.6
Hardness mg/L 136 80 72 64 66
Major Cations
General
Q4 2016 11/29/16T
Q2 2016 5/18/16D
Q1 2016 2/26/16D
Q3 2016 8/25/16D
Field
Metals
Major Anions
2016Mine Permit Groundwater Quality Monitoring Data
MW-703 UFB (Compliance)Humboldt Mill
Explanations of abbreviations are included on the final page of this table. MW-703 UFB (Compliance)
Parameter Unit
Recom- mended
Benchmark 2014
D.O.1 ppm -- 0.24 0.87 1.0 0.90ORP mV -- -14 -181 114 50pH SU 8.3-9.3 5.3 8.0 6.3 7.4Specific Conductance µS/cm -- 273 268 193 170Temperature °C -- 6.5 7.0 11 6.7Turbidity NTU -- 4.6 4.8 32 4.7Water Elevation ft MSL -- 1529.40 1532.30 1532.69 1532.19
Aluminum ug/L 200 (p) -- -- < 50 --Antimony ug/L 8.0 (p) -- -- < 2.0 --Arsenic ug/L 20 (p) < 5.0 < 5.0 < 5.0 < 5.0Barium ug/L 400 (p) -- -- < 100 --Beryllium ug/L 4.0 (p) -- -- < 1.0 --Boron ug/L 1200 (p) -- -- < 300 --Cadmium ug/L 4.0 (p) -- -- < 1.0 --Chromium ug/L 40 (p) -- -- < 10 --Cobalt ug/L 80 (p) -- -- < 20 --Copper ug/L 16 (p) < 4.0 < 4.0 < 4.0 < 4.0Iron ug/L 2441 1100 910 490 1500Lead ug/L 12 (p) < 3.0 < 3.0 < 3.0 < 3.0Lithium ug/L 40 (p) -- -- 12 --Manganese ug/L 194 170 < 250 160 170Mercury ng/L 4.0 (p) < 1.0 < 1.0 < 1.0 < 1.0Molybdenum ug/L 200 (p) -- -- < 50 --Nickel ug/L 80 (p) < 20 < 20 < 20 < 20Selenium ug/L 20 (p) -- -- < 5.0 --Silver ug/L 0.8 (p) -- -- < 0.20 --Thallium ug/L 8.0 (p) -- -- < 2.0 --Vanadium ug/L 16 (p) -- -- < 4.0 --Zinc ug/L 14 < 10 < 10 < 10 < 10
Alkalinity, Bicarbonate mg/L 127 83 84 83 81Alkalinity, Carbonate mg/L 28 < 2.0 < 2.0 < 2.0 < 2.0Chloride mg/L 40 (p) < 10 < 10 < 10 < 10Fluoride mg/L 4.0 (p) < 1.0 < 1.0 < 1.0 < 1.0Nitrogen, Ammonia mg/L 0.47 < 0.03 < 0.03 0.03 < 0.03Nitrogen, Nitrate mg/L 0.4 (p) < 0.1 < 0.1 < 0.1 < 0.1Nitrogen, Nitrite mg/L 0.4 (p) < 0.1 < 0.1 < 0.1 < 0.1Sulfate mg/L 53 45 46 45 45Sulfide mg/L 0.80 (p) < 0.20 < 0.20 < 0.20 e < 0.20
Calcium mg/L 53 31 32 28 31Magnesium mg/L 17 11 11 9.8 11Potassium mg/L 5.9 2.5 2.4 2.2 2.4Sodium mg/L 35 3.0 2.9 2.7 3.1
Hardness mg/L 193 124 126 128 124
Major Cations
General
Q4 2016 11/22/16D
Q2 2016 5/17/16D
Q1 2016 2/24/16D
Q3 2016 8/24/16D
Field
Metals
Major Anions
2016Mine Permit Groundwater Quality Monitoring Data
MW-703 LLA (Compliance)Humboldt Mill
Explanations of abbreviations are included on the final page of this table. MW-703 LLA (Compliance)
Parameter Unit
Recom- mended
Benchmark 2014
D.O.1 ppm -- 0.13 0.97 0.10 0.36ORP mV -- -219 -219 -127 -136pH SU 8.2-9.2 8.1 8.3 8.0 8.0Specific Conductance µS/cm -- 267 265 190 162Temperature °C -- 5.4 7.8 11 5.8Turbidity NTU -- 4.3 4.3 4.6 1.9Water Elevation ft MSL -- 1531.55 1532.15 1532.75 1532.11
Aluminum ug/L 200 (p) -- -- < 50 --Antimony ug/L 8.0 (p) -- -- < 2.0 --Arsenic ug/L 20 (p) < 5.0 < 5.0 < 5.0 < 5.0Barium ug/L 400 (p) -- -- < 100 --Beryllium ug/L 4.0 (p) -- -- < 1.0 --Boron ug/L 1200 (p) -- -- < 300 --Cadmium ug/L 4.0 (p) -- -- < 1.0 --Chromium ug/L 40 (p) -- -- < 10 --Cobalt ug/L 80 (p) -- -- < 20 --Copper ug/L 16 (p) < 4.0 < 4.0 < 4.0 < 4.0Iron ug/L 2966 590 600 560 750Lead ug/L 12 (p) < 3.0 < 3.0 < 3.0 < 3.0Lithium ug/L 30 -- -- 14 --Manganese ug/L 101 74 74 78 79Mercury ng/L 4.0 (p) < 1.0 < 1.0 < 1.0 < 1.0Molybdenum ug/L 200 (p) -- -- < 50 --Nickel ug/L 80 (p) < 20 < 20 < 20 < 20Selenium ug/L 20 (p) -- -- < 5.0 --Silver ug/L 0.8 (p) -- -- < 0.20 --Thallium ug/L 8.0 (p) -- -- < 2.0 --Vanadium ug/L 16 (p) -- -- < 4.0 --Zinc ug/L 40+ < 10 < 10 < 10 < 10
Alkalinity, Bicarbonate mg/L 84 87 86 86 86Alkalinity, Carbonate mg/L 4.0 < 2.0 < 2.0 < 2.0 < 2.0Chloride mg/L 124 14 14 12 12Fluoride mg/L 4.0 (p) < 1.0 < 1.0 < 1.0 < 1.0Nitrogen, Ammonia mg/L 0.08 <0.03 0.05 0.04 0.04Nitrogen, Nitrate mg/L 0.40 (p) < 0.1 < 0.1 < 0.1 < 0.1Nitrogen, Nitrite mg/L 0.40 (p) < 0.1 < 0.1 < 0.1 < 0.1Sulfate mg/L 44 27 29 30 32Sulfide mg/L 0.80 (p) < 0.20 < 0.20 < 0.20 e < 0.20
Calcium mg/L 39 25 26 25 26Magnesium mg/L 13 11 11 10 11Potassium mg/L 9.7 3.6 3.6 3.1 3.6Sodium mg/L 67 7.7 7.6 6.4 6.5
Hardness mg/L 138 106 110 118 112
Major Cations
General
Q4 2016 11/22/16T
Q2 2016 5/17/16D
Q1 2016 2/24/16D
Q3 2016 8/24/16D
Field
Metals
Major Anions
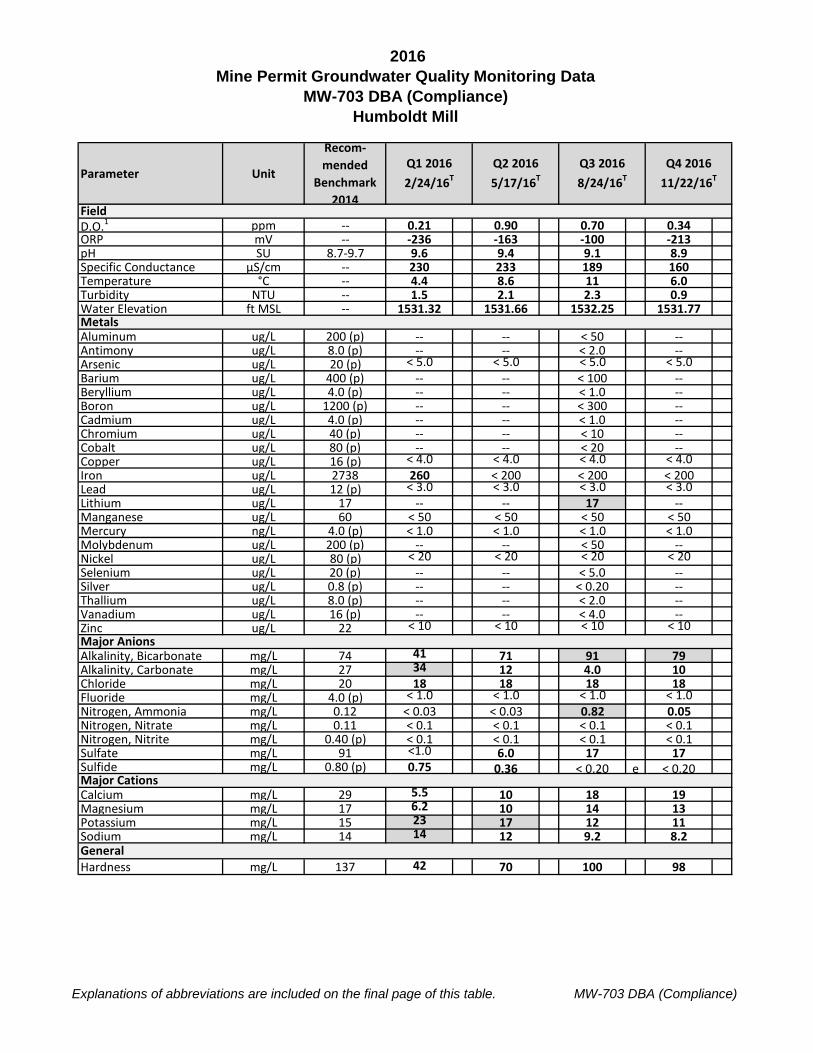
2016Mine Permit Groundwater Quality Monitoring Data
MW-703 DBA (Compliance)Humboldt Mill
Explanations of abbreviations are included on the final page of this table. MW-703 DBA (Compliance)
Parameter Unit
Recom- mended
Benchmark 2014
D.O.1 ppm -- 0.21 0.90 0.70 0.34ORP mV -- -236 -163 -100 -213pH SU 8.7-9.7 9.6 9.4 9.1 8.9Specific Conductance µS/cm -- 230 233 189 160Temperature °C -- 4.4 8.6 11 6.0Turbidity NTU -- 1.5 2.1 2.3 0.9Water Elevation ft MSL -- 1531.32 1531.66 1532.25 1531.77
Aluminum ug/L 200 (p) -- -- < 50 --Antimony ug/L 8.0 (p) -- -- < 2.0 --Arsenic ug/L 20 (p) < 5.0 < 5.0 < 5.0 < 5.0Barium ug/L 400 (p) -- -- < 100 --Beryllium ug/L 4.0 (p) -- -- < 1.0 --Boron ug/L 1200 (p) -- -- < 300 --Cadmium ug/L 4.0 (p) -- -- < 1.0 --Chromium ug/L 40 (p) -- -- < 10 --Cobalt ug/L 80 (p) -- -- < 20 --Copper ug/L 16 (p) < 4.0 < 4.0 < 4.0 < 4.0Iron ug/L 2738 260 < 200 < 200 < 200Lead ug/L 12 (p) < 3.0 < 3.0 < 3.0 < 3.0Lithium ug/L 17 -- -- 17 --Manganese ug/L 60 < 50 < 50 < 50 < 50Mercury ng/L 4.0 (p) < 1.0 < 1.0 < 1.0 < 1.0Molybdenum ug/L 200 (p) -- -- < 50 --Nickel ug/L 80 (p) < 20 < 20 < 20 < 20Selenium ug/L 20 (p) -- -- < 5.0 --Silver ug/L 0.8 (p) -- -- < 0.20 --Thallium ug/L 8.0 (p) -- -- < 2.0 --Vanadium ug/L 16 (p) -- -- < 4.0 --Zinc ug/L 22 < 10 < 10 < 10 < 10
Alkalinity, Bicarbonate mg/L 74 41 71 91 79Alkalinity, Carbonate mg/L 27 34 12 4.0 10Chloride mg/L 20 18 18 18 18Fluoride mg/L 4.0 (p) < 1.0 < 1.0 < 1.0 < 1.0Nitrogen, Ammonia mg/L 0.12 < 0.03 < 0.03 0.82 0.05Nitrogen, Nitrate mg/L 0.11 < 0.1 < 0.1 < 0.1 < 0.1Nitrogen, Nitrite mg/L 0.40 (p) < 0.1 < 0.1 < 0.1 < 0.1Sulfate mg/L 91 <1.0 6.0 17 17Sulfide mg/L 0.80 (p) 0.75 0.36 < 0.20 e < 0.20
Calcium mg/L 29 5.5 10 18 19Magnesium mg/L 17 6.2 10 14 13Potassium mg/L 15 23 17 12 11Sodium mg/L 14 14 12 9.2 8.2
Hardness mg/L 137 42 70 100 98
Major Cations
General
Q4 2016 11/22/16T
Q2 2016 5/17/16T
Q1 2016 2/24/16T
Q3 2016 8/24/16T
Field
Metals
Major Anions
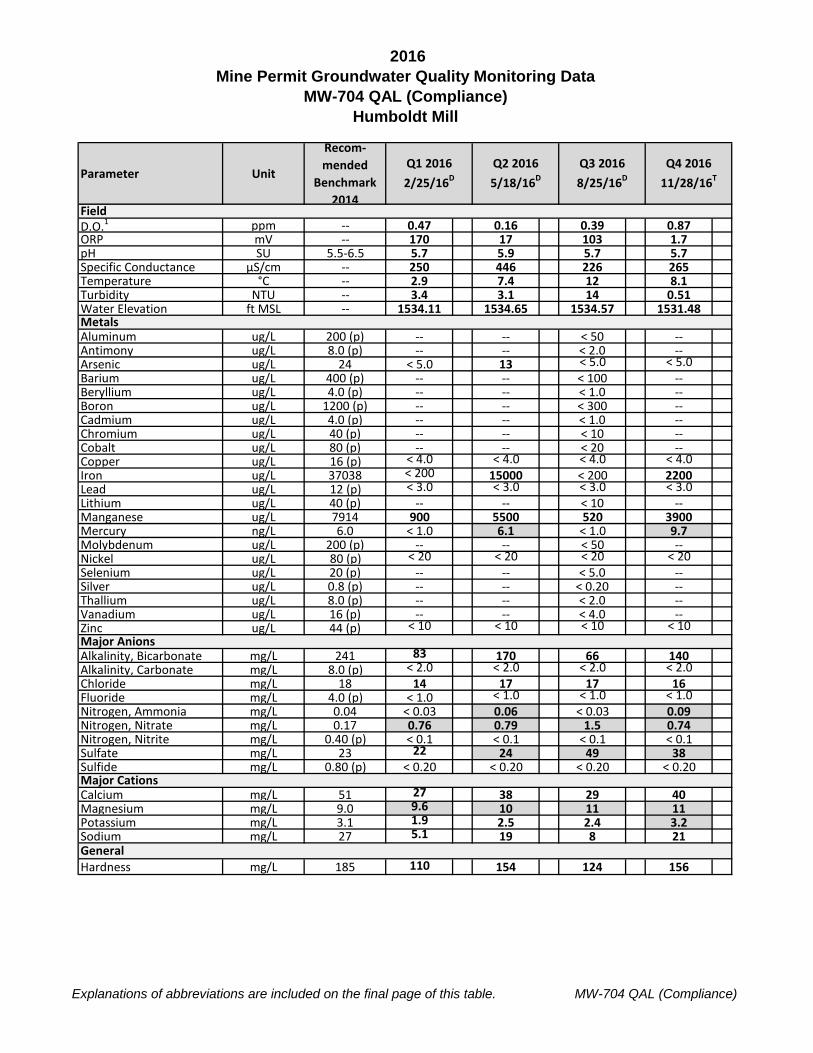
2016Mine Permit Groundwater Quality Monitoring Data
MW-704 QAL (Compliance)Humboldt Mill
Explanations of abbreviations are included on the final page of this table. MW-704 QAL (Compliance)
Parameter Unit
Recom- mended
Benchmark 2014
D.O.1 ppm -- 0.47 0.16 0.39 0.87ORP mV -- 170 17 103 1.7pH SU 5.5-6.5 5.7 5.9 5.7 5.7Specific Conductance µS/cm -- 250 446 226 265Temperature °C -- 2.9 7.4 12 8.1Turbidity NTU -- 3.4 3.1 14 0.51Water Elevation ft MSL -- 1534.11 1534.65 1534.57 1531.48
Aluminum ug/L 200 (p) -- -- < 50 --Antimony ug/L 8.0 (p) -- -- < 2.0 --Arsenic ug/L 24 < 5.0 13 < 5.0 < 5.0Barium ug/L 400 (p) -- -- < 100 --Beryllium ug/L 4.0 (p) -- -- < 1.0 --Boron ug/L 1200 (p) -- -- < 300 --Cadmium ug/L 4.0 (p) -- -- < 1.0 --Chromium ug/L 40 (p) -- -- < 10 --Cobalt ug/L 80 (p) -- -- < 20 --Copper ug/L 16 (p) < 4.0 < 4.0 < 4.0 < 4.0Iron ug/L 37038 < 200 15000 < 200 2200Lead ug/L 12 (p) < 3.0 < 3.0 < 3.0 < 3.0Lithium ug/L 40 (p) -- -- < 10 --Manganese ug/L 7914 900 5500 520 3900Mercury ng/L 6.0 < 1.0 6.1 < 1.0 9.7Molybdenum ug/L 200 (p) -- -- < 50 --Nickel ug/L 80 (p) < 20 < 20 < 20 < 20Selenium ug/L 20 (p) -- -- < 5.0 --Silver ug/L 0.8 (p) -- -- < 0.20 --Thallium ug/L 8.0 (p) -- -- < 2.0 --Vanadium ug/L 16 (p) -- -- < 4.0 --Zinc ug/L 44 (p) < 10 < 10 < 10 < 10
Alkalinity, Bicarbonate mg/L 241 83 170 66 140Alkalinity, Carbonate mg/L 8.0 (p) < 2.0 < 2.0 < 2.0 < 2.0Chloride mg/L 18 14 17 17 16Fluoride mg/L 4.0 (p) < 1.0 < 1.0 < 1.0 < 1.0Nitrogen, Ammonia mg/L 0.04 < 0.03 0.06 < 0.03 0.09Nitrogen, Nitrate mg/L 0.17 0.76 0.79 1.5 0.74Nitrogen, Nitrite mg/L 0.40 (p) < 0.1 < 0.1 < 0.1 < 0.1Sulfate mg/L 23 22 24 49 38Sulfide mg/L 0.80 (p) < 0.20 < 0.20 < 0.20 < 0.20
Calcium mg/L 51 27 38 29 40Magnesium mg/L 9.0 9.6 10 11 11Potassium mg/L 3.1 1.9 2.5 2.4 3.2Sodium mg/L 27 5.1 19 8 21
Hardness mg/L 185 110 154 124 156
Major Cations
General
Q4 2016 11/28/16T
Q2 2016 5/18/16D
Q1 2016 2/25/16D
Q3 2016 8/25/16D
Field
Metals
Major Anions
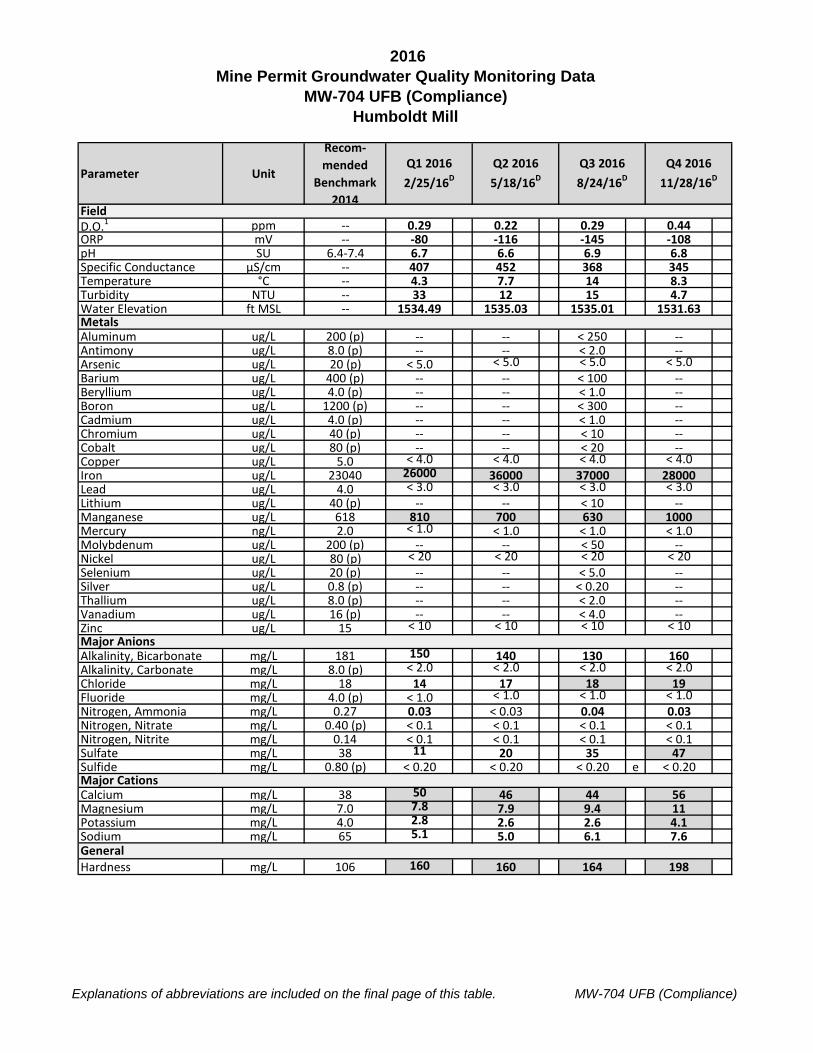
2016Mine Permit Groundwater Quality Monitoring Data
MW-704 UFB (Compliance)Humboldt Mill
Explanations of abbreviations are included on the final page of this table. MW-704 UFB (Compliance)
Parameter Unit
Recom- mended
Benchmark 2014
D.O.1 ppm -- 0.29 0.22 0.29 0.44ORP mV -- -80 -116 -145 -108pH SU 6.4-7.4 6.7 6.6 6.9 6.8Specific Conductance µS/cm -- 407 452 368 345Temperature °C -- 4.3 7.7 14 8.3Turbidity NTU -- 33 12 15 4.7Water Elevation ft MSL -- 1534.49 1535.03 1535.01 1531.63
Aluminum ug/L 200 (p) -- -- < 250 --Antimony ug/L 8.0 (p) -- -- < 2.0 --Arsenic ug/L 20 (p) < 5.0 < 5.0 < 5.0 < 5.0Barium ug/L 400 (p) -- -- < 100 --Beryllium ug/L 4.0 (p) -- -- < 1.0 --Boron ug/L 1200 (p) -- -- < 300 --Cadmium ug/L 4.0 (p) -- -- < 1.0 --Chromium ug/L 40 (p) -- -- < 10 --Cobalt ug/L 80 (p) -- -- < 20 --Copper ug/L 5.0 < 4.0 < 4.0 < 4.0 < 4.0Iron ug/L 23040 26000 36000 37000 28000Lead ug/L 4.0 < 3.0 < 3.0 < 3.0 < 3.0Lithium ug/L 40 (p) -- -- < 10 --Manganese ug/L 618 810 700 630 1000Mercury ng/L 2.0 < 1.0 < 1.0 < 1.0 < 1.0Molybdenum ug/L 200 (p) -- -- < 50 --Nickel ug/L 80 (p) < 20 < 20 < 20 < 20Selenium ug/L 20 (p) -- -- < 5.0 --Silver ug/L 0.8 (p) -- -- < 0.20 --Thallium ug/L 8.0 (p) -- -- < 2.0 --Vanadium ug/L 16 (p) -- -- < 4.0 --Zinc ug/L 15 < 10 < 10 < 10 < 10
Alkalinity, Bicarbonate mg/L 181 150 140 130 160Alkalinity, Carbonate mg/L 8.0 (p) < 2.0 < 2.0 < 2.0 < 2.0Chloride mg/L 18 14 17 18 19Fluoride mg/L 4.0 (p) < 1.0 < 1.0 < 1.0 < 1.0Nitrogen, Ammonia mg/L 0.27 0.03 < 0.03 0.04 0.03Nitrogen, Nitrate mg/L 0.40 (p) < 0.1 < 0.1 < 0.1 < 0.1Nitrogen, Nitrite mg/L 0.14 < 0.1 < 0.1 < 0.1 < 0.1Sulfate mg/L 38 11 20 35 47Sulfide mg/L 0.80 (p) < 0.20 < 0.20 < 0.20 e < 0.20
Calcium mg/L 38 50 46 44 56Magnesium mg/L 7.0 7.8 7.9 9.4 11Potassium mg/L 4.0 2.8 2.6 2.6 4.1Sodium mg/L 65 5.1 5.0 6.1 7.6
Hardness mg/L 106 160 160 164 198
Major Cations
General
Q4 2016 11/28/16D
Q2 2016 5/18/16D
Q1 2016 2/25/16D
Q3 2016 8/24/16D
Field
Metals
Major Anions
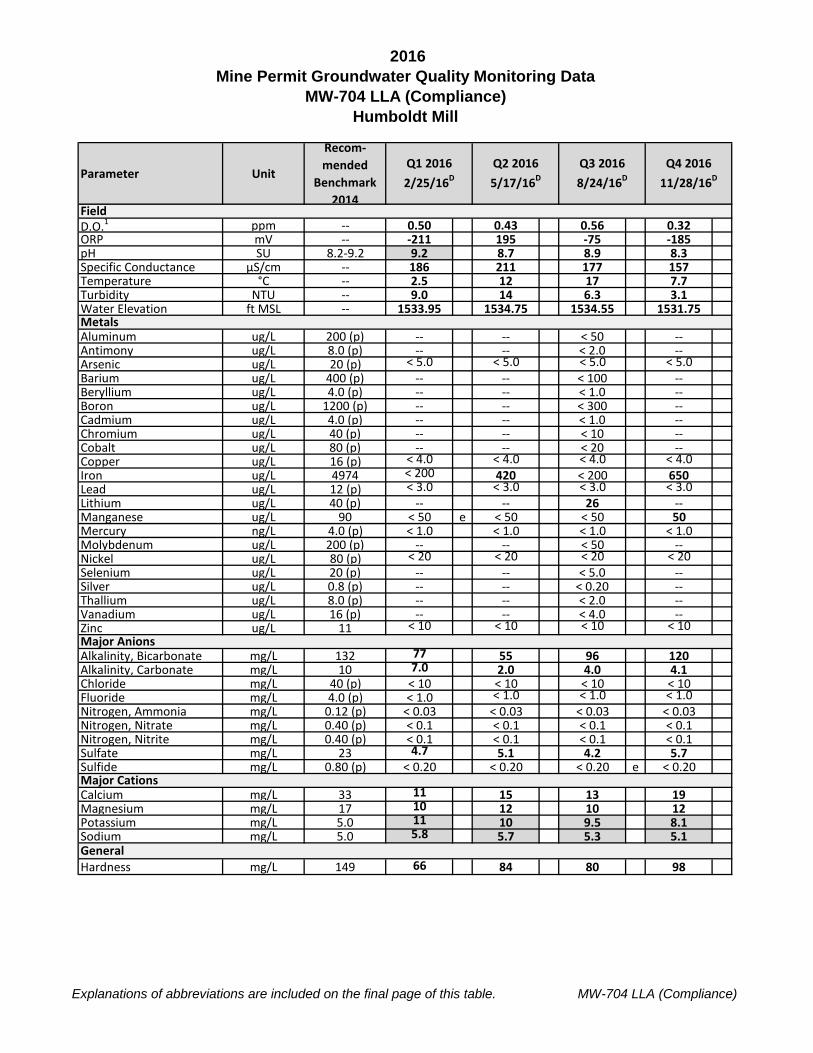
2016Mine Permit Groundwater Quality Monitoring Data
MW-704 LLA (Compliance)Humboldt Mill
Explanations of abbreviations are included on the final page of this table. MW-704 LLA (Compliance)
Parameter Unit
Recom- mended
Benchmark 2014
D.O.1 ppm -- 0.50 0.43 0.56 0.32ORP mV -- -211 195 -75 -185pH SU 8.2-9.2 9.2 8.7 8.9 8.3Specific Conductance µS/cm -- 186 211 177 157Temperature °C -- 2.5 12 17 7.7Turbidity NTU -- 9.0 14 6.3 3.1Water Elevation ft MSL -- 1533.95 1534.75 1534.55 1531.75
Aluminum ug/L 200 (p) -- -- < 50 --Antimony ug/L 8.0 (p) -- -- < 2.0 --Arsenic ug/L 20 (p) < 5.0 < 5.0 < 5.0 < 5.0Barium ug/L 400 (p) -- -- < 100 --Beryllium ug/L 4.0 (p) -- -- < 1.0 --Boron ug/L 1200 (p) -- -- < 300 --Cadmium ug/L 4.0 (p) -- -- < 1.0 --Chromium ug/L 40 (p) -- -- < 10 --Cobalt ug/L 80 (p) -- -- < 20 --Copper ug/L 16 (p) < 4.0 < 4.0 < 4.0 < 4.0Iron ug/L 4974 < 200 420 < 200 650Lead ug/L 12 (p) < 3.0 < 3.0 < 3.0 < 3.0Lithium ug/L 40 (p) -- -- 26 --Manganese ug/L 90 < 50 e < 50 < 50 50Mercury ng/L 4.0 (p) < 1.0 < 1.0 < 1.0 < 1.0Molybdenum ug/L 200 (p) -- -- < 50 --Nickel ug/L 80 (p) < 20 < 20 < 20 < 20Selenium ug/L 20 (p) -- -- < 5.0 --Silver ug/L 0.8 (p) -- -- < 0.20 --Thallium ug/L 8.0 (p) -- -- < 2.0 --Vanadium ug/L 16 (p) -- -- < 4.0 --Zinc ug/L 11 < 10 < 10 < 10 < 10
Alkalinity, Bicarbonate mg/L 132 77 55 96 120Alkalinity, Carbonate mg/L 10 7.0 2.0 4.0 4.1Chloride mg/L 40 (p) < 10 < 10 < 10 < 10Fluoride mg/L 4.0 (p) < 1.0 < 1.0 < 1.0 < 1.0Nitrogen, Ammonia mg/L 0.12 (p) < 0.03 < 0.03 < 0.03 < 0.03Nitrogen, Nitrate mg/L 0.40 (p) < 0.1 < 0.1 < 0.1 < 0.1Nitrogen, Nitrite mg/L 0.40 (p) < 0.1 < 0.1 < 0.1 < 0.1Sulfate mg/L 23 4.7 5.1 4.2 5.7Sulfide mg/L 0.80 (p) < 0.20 < 0.20 < 0.20 e < 0.20
Calcium mg/L 33 11 15 13 19Magnesium mg/L 17 10 12 10 12Potassium mg/L 5.0 11 10 9.5 8.1Sodium mg/L 5.0 5.8 5.7 5.3 5.1
Hardness mg/L 149 66 84 80 98
Major Cations
General
Q4 2016 11/28/16D
Q2 2016 5/17/16D
Q1 2016 2/25/16D
Q3 2016 8/24/16D
Field
Metals
Major Anions
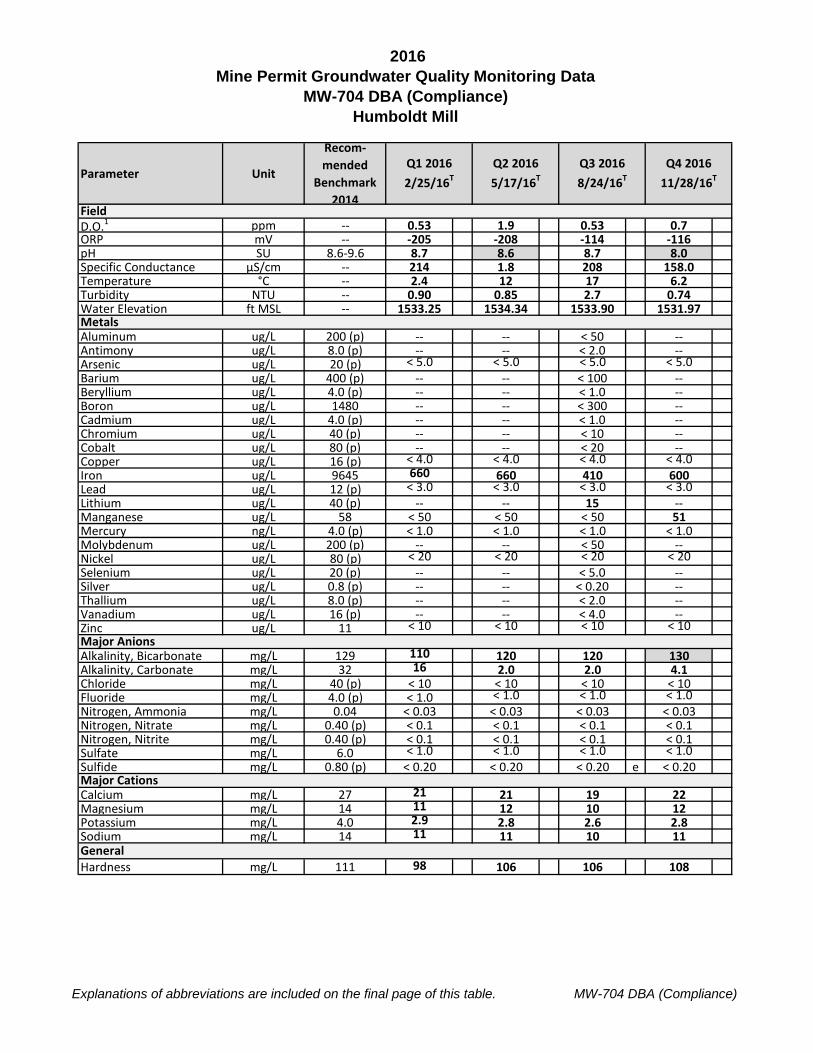
2016Mine Permit Groundwater Quality Monitoring Data
MW-704 DBA (Compliance)Humboldt Mill
Explanations of abbreviations are included on the final page of this table. MW-704 DBA (Compliance)
Parameter Unit
Recom- mended
Benchmark 2014
D.O.1 ppm -- 0.53 1.9 0.53 0.7ORP mV -- -205 -208 -114 -116pH SU 8.6-9.6 8.7 8.6 8.7 8.0Specific Conductance µS/cm -- 214 1.8 208 158.0Temperature °C -- 2.4 12 17 6.2Turbidity NTU -- 0.90 0.85 2.7 0.74Water Elevation ft MSL -- 1533.25 1534.34 1533.90 1531.97
Aluminum ug/L 200 (p) -- -- < 50 --Antimony ug/L 8.0 (p) -- -- < 2.0 --Arsenic ug/L 20 (p) < 5.0 < 5.0 < 5.0 < 5.0Barium ug/L 400 (p) -- -- < 100 --Beryllium ug/L 4.0 (p) -- -- < 1.0 --Boron ug/L 1480 -- -- < 300 --Cadmium ug/L 4.0 (p) -- -- < 1.0 --Chromium ug/L 40 (p) -- -- < 10 --Cobalt ug/L 80 (p) -- -- < 20 --Copper ug/L 16 (p) < 4.0 < 4.0 < 4.0 < 4.0Iron ug/L 9645 660 660 410 600Lead ug/L 12 (p) < 3.0 < 3.0 < 3.0 < 3.0Lithium ug/L 40 (p) -- -- 15 --Manganese ug/L 58 < 50 < 50 < 50 51Mercury ng/L 4.0 (p) < 1.0 < 1.0 < 1.0 < 1.0Molybdenum ug/L 200 (p) -- -- < 50 --Nickel ug/L 80 (p) < 20 < 20 < 20 < 20Selenium ug/L 20 (p) -- -- < 5.0 --Silver ug/L 0.8 (p) -- -- < 0.20 --Thallium ug/L 8.0 (p) -- -- < 2.0 --Vanadium ug/L 16 (p) -- -- < 4.0 --Zinc ug/L 11 < 10 < 10 < 10 < 10
Alkalinity, Bicarbonate mg/L 129 110 120 120 130Alkalinity, Carbonate mg/L 32 16 2.0 2.0 4.1Chloride mg/L 40 (p) < 10 < 10 < 10 < 10Fluoride mg/L 4.0 (p) < 1.0 < 1.0 < 1.0 < 1.0Nitrogen, Ammonia mg/L 0.04 < 0.03 < 0.03 < 0.03 < 0.03Nitrogen, Nitrate mg/L 0.40 (p) < 0.1 < 0.1 < 0.1 < 0.1Nitrogen, Nitrite mg/L 0.40 (p) < 0.1 < 0.1 < 0.1 < 0.1Sulfate mg/L 6.0 < 1.0 < 1.0 < 1.0 < 1.0Sulfide mg/L 0.80 (p) < 0.20 < 0.20 < 0.20 e < 0.20
Calcium mg/L 27 21 21 19 22Magnesium mg/L 14 11 12 10 12Potassium mg/L 4.0 2.9 2.8 2.6 2.8Sodium mg/L 14 11 11 10 11
Hardness mg/L 111 98 106 106 108
Major Cations
General
Q4 2016 11/28/16T
Q2 2016 5/17/16T
Q1 2016 2/25/16T
Q3 2016 8/24/16T
Field
Metals
Major Anions
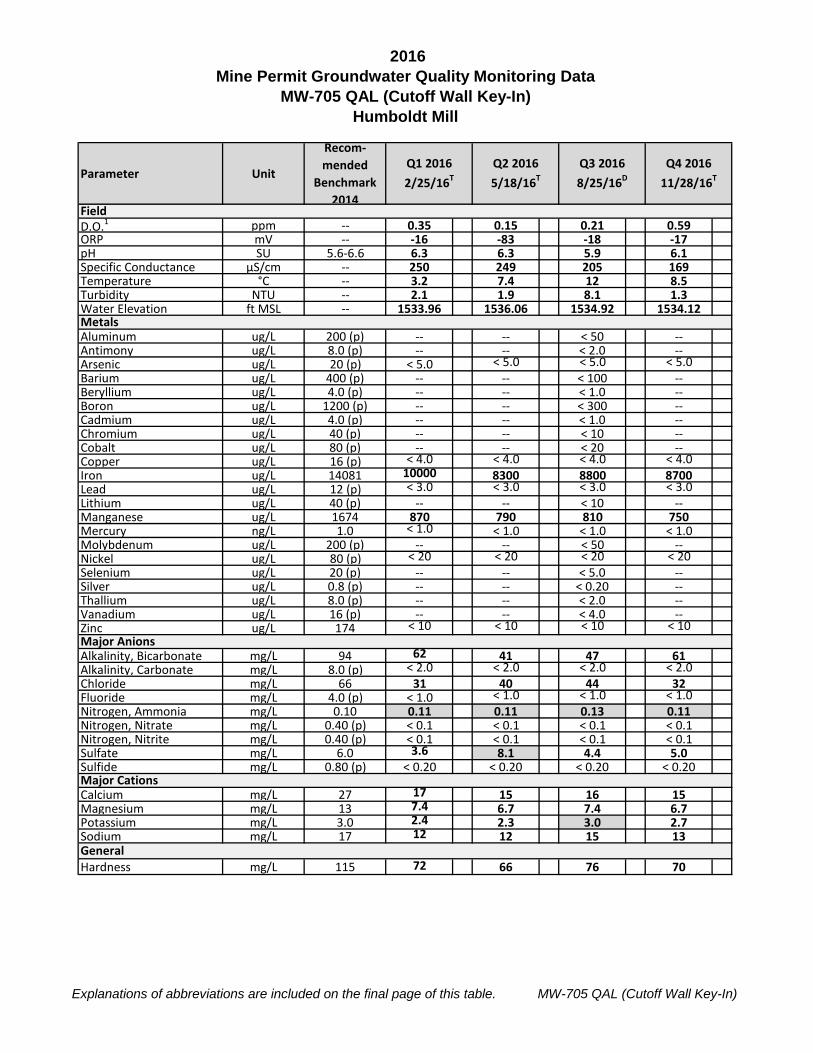
2016Mine Permit Groundwater Quality Monitoring Data
MW-705 QAL (Cutoff Wall Key-In)Humboldt Mill
Explanations of abbreviations are included on the final page of this table. MW-705 QAL (Cutoff Wall Key-In)
Parameter Unit
Recom- mended
Benchmark 2014
D.O.1 ppm -- 0.35 0.15 0.21 0.59ORP mV -- -16 -83 -18 -17pH SU 5.6-6.6 6.3 6.3 5.9 6.1Specific Conductance µS/cm -- 250 249 205 169Temperature °C -- 3.2 7.4 12 8.5Turbidity NTU -- 2.1 1.9 8.1 1.3Water Elevation ft MSL -- 1533.96 1536.06 1534.92 1534.12
Aluminum ug/L 200 (p) -- -- < 50 --Antimony ug/L 8.0 (p) -- -- < 2.0 --Arsenic ug/L 20 (p) < 5.0 < 5.0 < 5.0 < 5.0Barium ug/L 400 (p) -- -- < 100 --Beryllium ug/L 4.0 (p) -- -- < 1.0 --Boron ug/L 1200 (p) -- -- < 300 --Cadmium ug/L 4.0 (p) -- -- < 1.0 --Chromium ug/L 40 (p) -- -- < 10 --Cobalt ug/L 80 (p) -- -- < 20 --Copper ug/L 16 (p) < 4.0 < 4.0 < 4.0 < 4.0Iron ug/L 14081 10000 8300 8800 8700Lead ug/L 12 (p) < 3.0 < 3.0 < 3.0 < 3.0Lithium ug/L 40 (p) -- -- < 10 --Manganese ug/L 1674 870 790 810 750Mercury ng/L 1.0 < 1.0 < 1.0 < 1.0 < 1.0Molybdenum ug/L 200 (p) -- -- < 50 --Nickel ug/L 80 (p) < 20 < 20 < 20 < 20Selenium ug/L 20 (p) -- -- < 5.0 --Silver ug/L 0.8 (p) -- -- < 0.20 --Thallium ug/L 8.0 (p) -- -- < 2.0 --Vanadium ug/L 16 (p) -- -- < 4.0 --Zinc ug/L 174 < 10 < 10 < 10 < 10
Alkalinity, Bicarbonate mg/L 94 62 41 47 61Alkalinity, Carbonate mg/L 8.0 (p) < 2.0 < 2.0 < 2.0 < 2.0Chloride mg/L 66 31 40 44 32Fluoride mg/L 4.0 (p) < 1.0 < 1.0 < 1.0 < 1.0Nitrogen, Ammonia mg/L 0.10 0.11 0.11 0.13 0.11Nitrogen, Nitrate mg/L 0.40 (p) < 0.1 < 0.1 < 0.1 < 0.1Nitrogen, Nitrite mg/L 0.40 (p) < 0.1 < 0.1 < 0.1 < 0.1Sulfate mg/L 6.0 3.6 8.1 4.4 5.0Sulfide mg/L 0.80 (p) < 0.20 < 0.20 < 0.20 < 0.20
Calcium mg/L 27 17 15 16 15Magnesium mg/L 13 7.4 6.7 7.4 6.7Potassium mg/L 3.0 2.4 2.3 3.0 2.7Sodium mg/L 17 12 12 15 13
Hardness mg/L 115 72 66 76 70
Major Cations
General
Q4 2016 11/28/16T
Q2 2016 5/18/16T
Q1 2016 2/25/16T
Q3 2016 8/25/16D
Field
Metals
Major Anions
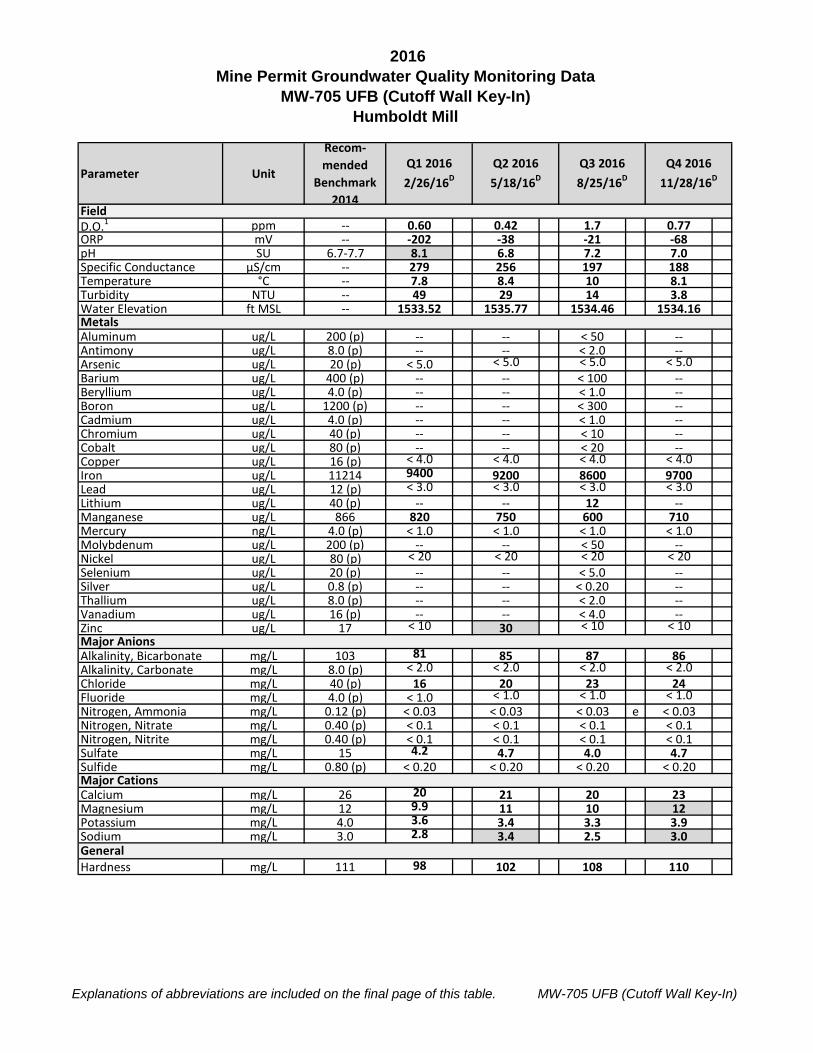
2016Mine Permit Groundwater Quality Monitoring Data
MW-705 UFB (Cutoff Wall Key-In)Humboldt Mill
Explanations of abbreviations are included on the final page of this table. MW-705 UFB (Cutoff Wall Key-In)
Parameter Unit
Recom- mended
Benchmark 2014
D.O.1 ppm -- 0.60 0.42 1.7 0.77ORP mV -- -202 -38 -21 -68pH SU 6.7-7.7 8.1 6.8 7.2 7.0Specific Conductance µS/cm -- 279 256 197 188Temperature °C -- 7.8 8.4 10 8.1Turbidity NTU -- 49 29 14 3.8Water Elevation ft MSL -- 1533.52 1535.77 1534.46 1534.16
Aluminum ug/L 200 (p) -- -- < 50 --Antimony ug/L 8.0 (p) -- -- < 2.0 --Arsenic ug/L 20 (p) < 5.0 < 5.0 < 5.0 < 5.0Barium ug/L 400 (p) -- -- < 100 --Beryllium ug/L 4.0 (p) -- -- < 1.0 --Boron ug/L 1200 (p) -- -- < 300 --Cadmium ug/L 4.0 (p) -- -- < 1.0 --Chromium ug/L 40 (p) -- -- < 10 --Cobalt ug/L 80 (p) -- -- < 20 --Copper ug/L 16 (p) < 4.0 < 4.0 < 4.0 < 4.0Iron ug/L 11214 9400 9200 8600 9700Lead ug/L 12 (p) < 3.0 < 3.0 < 3.0 < 3.0Lithium ug/L 40 (p) -- -- 12 --Manganese ug/L 866 820 750 600 710Mercury ng/L 4.0 (p) < 1.0 < 1.0 < 1.0 < 1.0Molybdenum ug/L 200 (p) -- -- < 50 --Nickel ug/L 80 (p) < 20 < 20 < 20 < 20Selenium ug/L 20 (p) -- -- < 5.0 --Silver ug/L 0.8 (p) -- -- < 0.20 --Thallium ug/L 8.0 (p) -- -- < 2.0 --Vanadium ug/L 16 (p) -- -- < 4.0 --Zinc ug/L 17 < 10 30 < 10 < 10
Alkalinity, Bicarbonate mg/L 103 81 85 87 86Alkalinity, Carbonate mg/L 8.0 (p) < 2.0 < 2.0 < 2.0 < 2.0Chloride mg/L 40 (p) 16 20 23 24Fluoride mg/L 4.0 (p) < 1.0 < 1.0 < 1.0 < 1.0Nitrogen, Ammonia mg/L 0.12 (p) < 0.03 < 0.03 < 0.03 e < 0.03Nitrogen, Nitrate mg/L 0.40 (p) < 0.1 < 0.1 < 0.1 < 0.1Nitrogen, Nitrite mg/L 0.40 (p) < 0.1 < 0.1 < 0.1 < 0.1Sulfate mg/L 15 4.2 4.7 4.0 4.7Sulfide mg/L 0.80 (p) < 0.20 < 0.20 < 0.20 < 0.20
Calcium mg/L 26 20 21 20 23Magnesium mg/L 12 9.9 11 10 12Potassium mg/L 4.0 3.6 3.4 3.3 3.9Sodium mg/L 3.0 2.8 3.4 2.5 3.0
Hardness mg/L 111 98 102 108 110
Major Cations
General
Q4 2016 11/28/16D
Q2 2016 5/18/16D
Q1 2016 2/26/16D
Q3 2016 8/25/16D
Field
Metals
Major Anions
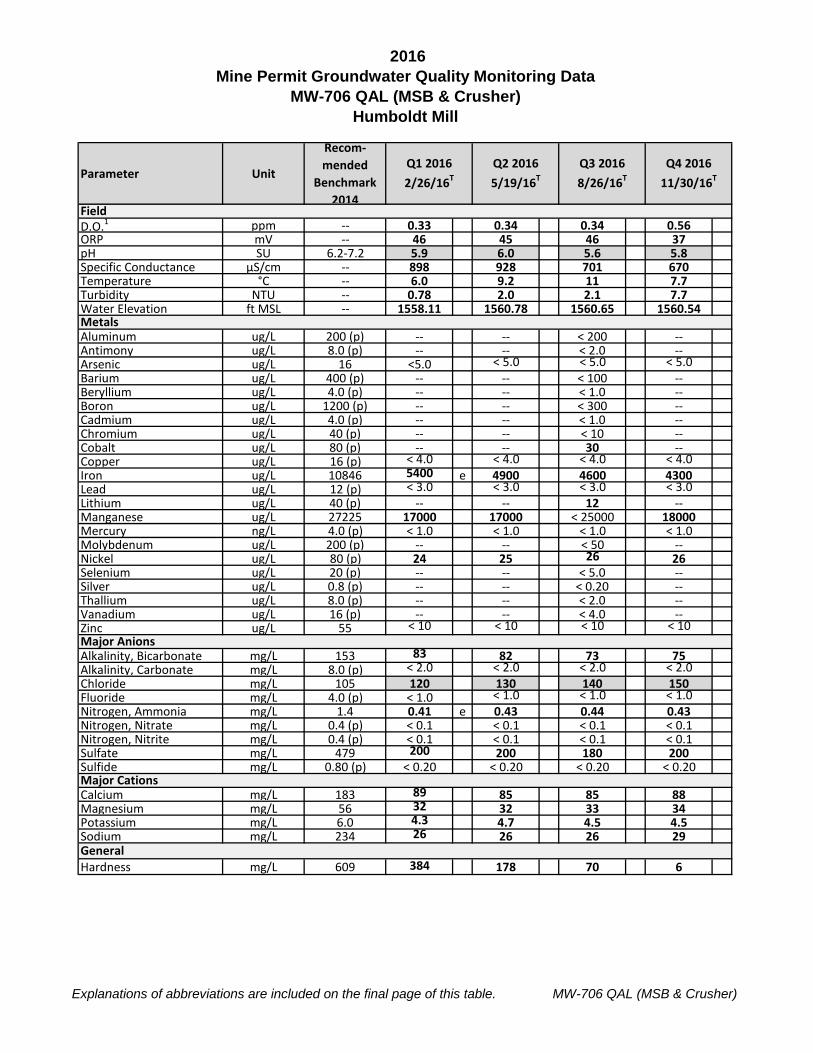
2016Mine Permit Groundwater Quality Monitoring Data
MW-706 QAL (MSB & Crusher)Humboldt Mill
Explanations of abbreviations are included on the final page of this table. MW-706 QAL (MSB & Crusher)
Parameter Unit
Recom- mended
Benchmark 2014
D.O.1 ppm -- 0.33 0.34 0.34 0.56ORP mV -- 46 45 46 37pH SU 6.2-7.2 5.9 6.0 5.6 5.8Specific Conductance µS/cm -- 898 928 701 670Temperature °C -- 6.0 9.2 11 7.7Turbidity NTU -- 0.78 2.0 2.1 7.7Water Elevation ft MSL -- 1558.11 1560.78 1560.65 1560.54
Aluminum ug/L 200 (p) -- -- < 200 --Antimony ug/L 8.0 (p) -- -- < 2.0 --Arsenic ug/L 16 <5.0 < 5.0 < 5.0 < 5.0Barium ug/L 400 (p) -- -- < 100 --Beryllium ug/L 4.0 (p) -- -- < 1.0 --Boron ug/L 1200 (p) -- -- < 300 --Cadmium ug/L 4.0 (p) -- -- < 1.0 --Chromium ug/L 40 (p) -- -- < 10 --Cobalt ug/L 80 (p) -- -- 30 --Copper ug/L 16 (p) < 4.0 < 4.0 < 4.0 < 4.0Iron ug/L 10846 5400 e 4900 4600 4300Lead ug/L 12 (p) < 3.0 < 3.0 < 3.0 < 3.0Lithium ug/L 40 (p) -- -- 12 --Manganese ug/L 27225 17000 17000 < 25000 18000Mercury ng/L 4.0 (p) < 1.0 < 1.0 < 1.0 < 1.0Molybdenum ug/L 200 (p) -- -- < 50 --Nickel ug/L 80 (p) 24 25 26 26Selenium ug/L 20 (p) -- -- < 5.0 --Silver ug/L 0.8 (p) -- -- < 0.20 --Thallium ug/L 8.0 (p) -- -- < 2.0 --Vanadium ug/L 16 (p) -- -- < 4.0 --Zinc ug/L 55 < 10 < 10 < 10 < 10
Alkalinity, Bicarbonate mg/L 153 83 82 73 75Alkalinity, Carbonate mg/L 8.0 (p) < 2.0 < 2.0 < 2.0 < 2.0Chloride mg/L 105 120 130 140 150Fluoride mg/L 4.0 (p) < 1.0 < 1.0 < 1.0 < 1.0Nitrogen, Ammonia mg/L 1.4 0.41 e 0.43 0.44 0.43Nitrogen, Nitrate mg/L 0.4 (p) < 0.1 < 0.1 < 0.1 < 0.1Nitrogen, Nitrite mg/L 0.4 (p) < 0.1 < 0.1 < 0.1 < 0.1Sulfate mg/L 479 200 200 180 200Sulfide mg/L 0.80 (p) < 0.20 < 0.20 < 0.20 < 0.20
Calcium mg/L 183 89 85 85 88Magnesium mg/L 56 32 32 33 34Potassium mg/L 6.0 4.3 4.7 4.5 4.5Sodium mg/L 234 26 26 26 29
Hardness mg/L 609 384 178 70 6
Major Cations
General
Q4 2016 11/30/16T
Q2 2016 5/19/16T
Q1 2016 2/26/16T
Q3 2016 8/26/16T
Field
Metals
Major Anions
2016Mine Permit Groundwater Quality Monitoring Data
MW-707 QAL (Concentrator & CLO)Humboldt Mill
Explanations of abbreviations are included on the final page of this table. MW-707 QAL (Concentrator & CLO)
Parameter Unit
Recom- mended
Benchmark 2014
D.O.1 ppm -- 0.64 0.77 0.32 0.39ORP mV -- -95 -101 -93 -59pH SU 6.3-7.3 7.0 7.1 6.8 6.7Specific Conductance µS/cm -- 318 320 236 219Temperature °C -- 5.5 9.8 11 8.4Turbidity NTU -- 1.3 1.4 2.5 0.96Water Elevation ft MSL -- 1581.84 1583.28 1582.64 1582.02
Aluminum ug/L 200 (p) -- -- < 50 --Antimony ug/L 8.0 (p) -- -- < 2.0 --Arsenic ug/L 20 (p) < 5.0 < 5.0 < 5.0 < 5.0Barium ug/L 400 (p) -- -- < 100 --Beryllium ug/L 4.0 (p) -- -- < 1.0 --Boron ug/L 1200 (p) -- -- < 300 --Cadmium ug/L 4.0 (p) -- -- < 1.0 --Chromium ug/L 40 (p) -- -- < 10 --Cobalt ug/L 80 (p) -- -- < 20 --Copper ug/L 16 (p) < 4.0 < 4.0 < 4.0 < 4.0Iron ug/L 7493 5700 5100 4800 4900Lead ug/L 12 (p) < 3.0 < 3.0 < 3.0 < 3.0Lithium ug/L 40 (p) -- -- < 10 --Manganese ug/L 1189 1000 950 < 1200 810Mercury ng/L 4.0 (p) < 1.0 < 1.0 < 1.0 < 1.0Molybdenum ug/L 200 (p) -- -- < 50 --Nickel ug/L 80 (p) < 20 < 20 < 20 < 20Selenium ug/L 20 (p) -- -- < 5.0 --Silver ug/L 0.8 (p) -- -- < 0.20 --Thallium ug/L 8.0 (p) -- -- < 2.0 --Vanadium ug/L 16 (p) -- -- < 4.0 --Zinc ug/L 19 11 < 10 25 < 10
Alkalinity, Bicarbonate mg/L 150 160 150 160 160Alkalinity, Carbonate mg/L 8.0 (p) < 2.0 < 2.0 < 2.0 < 2.0Chloride mg/L 40 (p) < 10 < 10 < 10 < 10Fluoride mg/L 4.0 (p) < 1.0 < 1.0 < 1.0 < 1.0Nitrogen, Ammonia mg/L 0.34 0.27 0.27 0.26 0.23Nitrogen, Nitrate mg/L 0.40 (p) < 0.1 < 0.1 < 0.1 < 0.1Nitrogen, Nitrite mg/L 0.40 (p) < 0.1 < 0.1 < 0.1 < 0.1Sulfate mg/L 8.0 6.8 4.4 6.3 5.2Sulfide mg/L 0.80 (p) < 0.20 < 0.20 < 0.20 < 0.20
Calcium mg/L 51 41 39 39 41Magnesium mg/L 15 12 11 11 12Potassium mg/L 3.0 2.3 2.3 2.3 2.5Sodium mg/L 4.0 2.7 3.0 2.8 2.9
Hardness mg/L 149 156 154 156 156
Metals
Major Anions
Major Cations
General
Q4 2016 11/30/16T
Q2 2016 5/19/16T
Q1 2016 2/26/16T
Q3 2016 8/26/16T
Field
2016Mine Permit Groundwater Quality Monitoring Data
MW-9R (Concentrator)Humboldt Mill
Explanations of abbreviations are included on the final page of this table. MW-9R (Concentrator)
Parameter Unit
Recom- mended
Benchmark 2014
D.O.1 ppm -- 1.8 0.21 0.56 3.60ORP mV -- 226 91 107 108pH SU 5.4-6.4 5.4 6.4 5.8 5.6Specific Conductance µS/cm -- 554 295 454 427Temperature °C -- 6.0 8.6 14 12Turbidity NTU -- 1.3 1.8 2.4 2.6Water Elevation ft MSL -- 1595.7 1595.74 1596.71 1595.52
Aluminum ug/L 200 (p) -- -- < 200 --Antimony ug/L 8.0 (p) -- -- < 2.0 --Arsenic ug/L 25 < 5.0 < 5.0 < 5.0 < 5.0Barium ug/L 400 (p) -- -- < 100 --Beryllium ug/L 4.0 (p) -- -- < 1.0 --Boron ug/L 1200 (p) -- -- < 300 --Cadmium ug/L 4.0 (p) -- -- < 1.0 --Chromium ug/L 40 (p) -- -- < 10 --Cobalt ug/L 80 (p) -- -- < 20 --Copper ug/L 5.0 4.8 < 4.0 4.1 < 4.0Iron ug/L 25558 < 200 < 200 < 200 < 200Lead ug/L 0.04 < 3.0 < 3.0 < 3.0 < 3.0Lithium ug/L 40 (p) -- -- < 10 --Manganese ug/L 1694 430 79 < 250 66Mercury ng/L 1.0 1.0 < 1.0 < 1.0 1.9Molybdenum ug/L 200 (p) -- -- < 50 --Nickel ug/L 80 (p) 51 < 20 29 25Selenium ug/L 20 (p) -- -- < 5.0 --Silver ug/L 0.8 (p) -- -- < 0.20 --Thallium ug/L 8.0 (p) -- -- < 2.0 --Vanadium ug/L 16 (p) -- -- < 4.0 --Zinc ug/L 25 18 21 19 15
Alkalinity, Bicarbonate mg/L 137 29 24 59 50Alkalinity, Carbonate mg/L 2.0 < 2.0 < 2.0 < 2.0 < 2.0Chloride mg/L 711 16 23 32 14Fluoride mg/L 4.0 (p) < 1.0 < 1.0 < 1.0 < 1.0Nitrogen, Ammonia mg/L 0.36 < 0.03 < 0.03 < 0.03 < 0.03Nitrogen, Nitrate mg/L 1.0 2.1 0.18 1.5 2.2Nitrogen, Nitrite mg/L 0.07 < 0.1 < 0.1 < 0.1 < 0.1Sulfate mg/L 343 210 77 170 200Sulfide mg/L 1.0 < 0.20 < 0.20 < 0.20 < 0.20
Calcium mg/L 123 55 26 59 62Magnesium mg/L 48 21 10 22 25Potassium mg/L 8.0 2.9 2.1 3.5 3.5Sodium mg/L 289 17 8.2 15 15
Hardness mg/L 510 232 114 242 256
Major Cations
General
Q4 2016 11/30/16T
Q2 2016 5/19/16T
Q1 2016 2/26/16T
Q3 2016 8/26/16T
Field
Metals
Major Anions
2016Mine Permit Groundwater Quality Monitoring Data
Abbreviations & Data QualifiersHumboldt Mill
Explanations of abbreviations are included on the final page of this table. Abbreviations & Data Qualifiers
e = estimated value, results of laboratory control parameters were outside of established control limits.
D = Samples for metals and major cation parameters were filtered and values are dissolved concentrations.
T = Sample was not filtered and all values are total concentrations.
Highlighted Cell = Value is equal to or above site-specific benchmark. An exceedance occurs if there are 2 consecutive sampling events with a value equal to or greater than the benchmark at a compliance monitoring location.
Notes:Benchmarks are calculated based on guidance from Eagles Mine's Development of Site Specific Benchmarks for Mine Permit Water Quality Monitoring.
Results in bold text indicate that the parameter was detected at a level greater than the laboratory reporting limit.
(p) = Due to less than two detections in baseline dataset, benchmark defaulted to four times the reporting limit.
--Denotes no benchmark required or parameter was not required to be collected during the sampling quarter.
Appendix G
Humboldt Mill
Groundwater Trend Analysis Summary
2016Groundwater Trend Analysis Summary
Humboldt Mill
Location Classification Parameter Unit Count (n)
Number of Non-
Detects Mean UCL MedianStandard Deviation
Coefficient of Variation Skewness Minimum Maximum
Man-Kendall S Sen Slope
Positive or Negative
Trend (Minimum
95% Confidence)
HW-1L Monitoring Alkalinity Carbonate mg/L 12 0 2.97 4.14 2.00 2.26 0.76 2.06 2.00 7.80 -20 0.0000 NegativeHW-1L Monitoring Boron µg/L 4 1 538.00 680.76 620.00 149.73 0.28 -1.32 300.00 650.00 8 0.312 PositiveHW-1L Monitoring Chloride mg/L 8 0 47.92 50.89 50.50 5.74 0.12 -1.44 34.00 53.00 33 0.007 PositiveHW-1L Monitoring Hardness mg/L 8 0 101.08 114.82 109.00 26.49 0.26 -2.84 22.00 122.00 41 0.018 PositiveHW-1L Monitoring Lithium µg/L 5 0 19.40 21.38 19.00 2.07 0.11 0.24 17.00 22.00 8 0.005 PositiveHW-1L Monitoring Magnesium mg/L 12 0 9.77 11.02 10.50 2.41 0.25 -3.02 2.40 11.00 26 0.001 PositiveHW-1L Monitoring Potassium mg/L 12 0 2.65 3.66 1.90 1.95 0.73 2.43 1.60 8.00 -39 -0.0009 NegativeHW-1L Monitoring Sulfate mg/L 12 0 18.13 21.36 20.00 6.23 0.34 -2.02 1.60 24.00 59 0.010 PositiveHW-1U LLA Monitoring Ammonia µg/L 10 1 94.90 131.39 70.50 62.96 0.66 0.63 25.00 190.00 38 0.204 PositiveHW-1U LLA Monitoring Calcium mg/L 10 0 20.60 23.31 21.50 4.67 0.23 -1.17 10.00 27.00 10 -23 NegativeHW-1U LLA Monitoring Hardness mg/L 10 0 95.60 103.68 93.00 13.94 0.15 -0.27 70.00 113.00 -34 -0.053 NegativeHW-1U LLA Monitoring Magnesium mg/L 10 0 8.63 9.90 8.90 2.19 0.25 -1.25 3.70 11.00 -37 -0.006 NegativeHW-1U LLA Monitoring Potassium mg/L 10 0 5.58 9.29 4.50 6.40 1.15 2.66 0.57 23.00 -39 -0.008 NegativeHW-1U LLA Monitoring Sodium mg/L 10 0 43.20 51.92 38.50 15.05 0.35 1.67 31.00 79.00 37 0.036 PositiveHW-1U LLA Monitoring Sulfate mg/L 10 0 50.30 56.73 48.50 11.09 0.22 1.39 38.00 76.00 29 0.032 PositiveHW-1U UFB Monitoring Arsenic µg/L 16 14 5.44 6.02 5.00 1.31 0.24 3.15 5.00 9.90 -23 0.0000 NegativeHW-1U UFB Monitoring Chloride mg/L 16 5 38.81 52.20 24.50 30.55 0.79 0.74 10.00 98.00 -87 -0.068 NegativeHW-1U UFB Monitoring Hardness mg/L 16 0 81.50 97.06 73.50 35.51 0.44 1.20 45.00 165.00 -46 -0.057 NegativeHW-1U UFB Monitoring Magnesium mg/L 10 0 8.43 10.27 5.95 4.19 0.50 0.64 3.80 16.00 -59 -0.010 NegativeHW-1U UFB Monitoring Manganese µg/L 16 14 52.00 54.53 50.00 5.76 0.11 2.98 50.00 71.00 -23 0.0000 NegativeHW-1U UFB Monitoring Potassium mg/L 16 0 10.32 13.22 6.20 6.63 0.64 0.32 3.30 21.00 -83 -0.018 NegativeHW-1U UFB Monitoring Sodium mg/L 16 0 39.44 47.73 36.50 18.92 0.48 0.60 17.00 77.00 -73 -0.053 NegativeHW-1U UFB Monitoring Sulfate mg/L 10 0 39.9 52.5 44.0 21.7 0.55 0.05 13.0 73.0 -27 -0.107 NegativeHW-1U UFB Monitoring Sulfide mg/L 16 10 0.56 0.84 0.20 0.64 1.15 1.84 0.20 2.10 -37 0.0000 NegativeHW-2 Monitoring Calcium mg/L 14 0 51.89 56.81 54.50 10.40 0.20 -0.66 34.00 65.00 41 0.0190 PositiveHW-2 Monitoring Chloride mg/L 14 0 17.86 20.62 15.00 5.84 0.33 0.69 12.00 27.00 66 0.014 PositiveHW-2 Monitoring Hardness mg/L 14 0 236.00 250.28 240.50 30.17 0.13 -0.12 190.00 284.00 44 0.065 PositiveHW-2 Monitoring Potassium mg/L 14 0 4.45 4.85 4.20 0.84 0.19 0.62 3.30 6.20 -39 -0.002 NegativeHW-2 Monitoring Sodium mg/L 14 0 16.04 17.82 14.50 3.77 0.24 1.70 13.00 26.00 48 0.007 PositiveHW-2 Monitoring Sulfate mg/L 14 0 127.64 137.99 120.00 21.86 0.17 0.84 97.00 170.00 43 0.049 PositiveHW-2 Monitoring Sulfide mg/L 13 9 0.23 0.26 0.20 0.07 0.29 2.72 0.20 0.43 -27 0.0000 NegativeHW-8U Monitoring Alkalinity Bicarbonate mg/L 17 0 157.06 169.56 150.00 29.53 0.19 1.04 130.00 220.00 -59 0.066 NegativeHW-8U Monitoring Arsenic µg/L 17 13 5.79 6.47 5.00 1.60 0.28 1.88 5.00 10.00 56 0.0000 PositiveHW-8U Monitoring Iron µg/L 17 0 13,918 15,658 13,000 4,110 0.30 1.09 9,000 23,000 -89 -10.373 NegativeHW-8U Monitoring Magnesium mg/L 17 0 13.59 14.70 13.00 2.62 0.19 1.36 11.00 19.00 -47 -0.004 NegativeHW-8U Monitoring Sulfate mg/L 17 4 4.32 5.38 4.90 2.49 0.58 0.09 1.00 9.00 115 0.008 PositiveHW-8U Monitoring Zinc µg/L 17 14 11.59 13.14 10.00 3.66 0.32 2.11 10.00 21.00 -31 0.0000 NegativeHYG-1 Monitoring Alkalinity Bicarbonate mg/L 17 0 197.06 221.56 170.00 57.85 0.29 0.96 140.00 330.00 80 0.091 PositiveHYG-1 Monitoring Ammonia µg/L 17 0 277.06 331.63 290.00 128.87 0.47 0.67 85.00 570.00 64 0.277 PositiveHYG-1 Monitoring Chloride mg/L 17 0 15.65 17.35 15.00 4.03 0.26 0.80 12.00 24.00 83 0.008 PositiveHYG-1 Monitoring Manganese µg/L 17 0 224.06 285.52 210.00 145.13 0.65 1.09 60.00 580.00 79 0.357 PositiveHYG-1 Monitoring Mercury ng/L 17 0 14.14 18.27 10.20 9.76 0.69 0.71 4.23 36.70 84 0.022 PositiveHYG-1 Monitoring Sodium mg/L 17 0 31.12 38.48 24.00 17.38 0.56 0.10 12.00 54.00 90 0.038 PositiveHYG-1 Monitoring Sulfate mg/L 17 0 73.12 81.31 78.00 19.35 0.26 -0.16 47.00 95.00 -66 -0.028 NegativeKMW-5R COSA Alkalinity Bicarbonate mg/L 13 0 355.38 364.09 360.00 17.61 0.05 -1.21 310.00 380.00 33 0.026 PositiveKMW-5R COSA Ammonia µg/L 13 0 28.92 31.74 25.00 5.69 0.20 1.44 25.00 42.00 29 0.009 PositiveKMW-5R COSA Lithium µg/L 6 1 15.00 17.94 15.50 3.58 0.24 -0.12 10.00 20.00 11 0.009 PositiveKMW-5R COSA Sodium mg/L 13 0 3.96 4.37 3.80 0.82 0.21 0.97 3.20 5.60 42 0.001 PositiveKMW-5R COSA Sulfate mg/L 13 0 91.69 102.69 82.00 22.26 0.24 0.83 67.00 130.00 75 0.063 PositiveMW-701 QAL Leachate Alkalinity Bicarbonate mg/L 15 0 72.27 92.62 60.00 44.77 0.62 1.00 29.00 150.00 -89 -0.103 NegativeMW-701 QAL Leachate Ammonia µg/L 15 9 104.53 155.04 25.00 111.08 1.06 0.82 25.00 300.00 -60 -0.239 NegativeMW-701 QAL Leachate Calcium mg/L 15 0 25.47 32.20 25.00 14.80 0.58 0.45 8.50 49.00 -97 -0.043 Negative
2016Groundwater Trend Analysis Summary
Humboldt Mill
Location Classification Parameter Unit Count (n)
Number of Non-
Detects Mean UCL MedianStandard Deviation
Coefficient of Variation Skewness Minimum Maximum
Man-Kendall S Sen Slope
Positive or Negative
Trend (Minimum
95% Confidence)
MW-701 QAL Leachate Hardness mg/L 15 0 115.27 146.78 112.00 69.30 0.60 0.53 36.00 228.00 -93 -0.194 NegativeMW-701 QAL Leachate Iron µg/L 15 11 238.00 271.64 200.00 73.99 0.31 1.64 200.00 390.00 -50 0.000 NegativeMW-701 QAL Leachate Magnesium mg/L 15 0 10.94 13.97 10.00 6.67 0.61 0.63 3.90 22.00 -95 -0.019 NegativeMW-701 QAL Leachate Manganese µg/L 15 6 1,626 2,384 1,400 1,666 1.02 0.35 50 4,100 -78 -4.951 NegativeMW-701 QAL Leachate Mercury ng/L 15 5 2.93 4.15 1.56 2.69 0.92 1.30 1.00 9.04 -71 -0.004 NegativeMW-701 QAL Leachate Potassium mg/L 15 0 5.71 6.65 6.00 2.05 0.36 -0.15 2.80 8.30 -89 -0.006 NegativeMW-701 QAL Leachate Sodium mg/L 15 0 8.96 10.04 8.30 2.38 0.27 0.46 5.80 13.00 -77 -0.006 NegativeMW-701 QAL Leachate Sulfate mg/L 15 0 51.07 63.75 46.00 27.88 0.55 0.47 17.00 94.00 -98 -0.081 NegativeMW-701 QAL Leachate Sulfide mg/L 15 13 0.20 0.20 0.20 0.01 0.05 -2.40 0.17 0.20 26 0.000 PositiveMW-701 UFB Leachate Ammonia µg/L 14 11 148.93 324.80 25.00 371.57 2.49 3.41 25.00 1,400.00 -28 0.000 NegativeMW-701 UFB Leachate Chloride mg/L 14 11 13.36 17.18 10.00 8.07 0.60 2.69 10.00 38.00 -36 0.000 NegativeMW-701 UFB Leachate Iron µg/L 14 0 14,936 17,407 16,000 5,219 0.35 -2.02 210 20,000 32 7.463 PositiveMW-701 UFB Leachate Potassium mg/L 14 0 4.49 5.62 3.45 2.40 0.53 1.93 2.70 11.00 -70 -0.004 NegativeMW-701 UFB Leachate Sodium mg/L 14 0 11.73 17.82 5.35 12.87 1.10 2.17 4.30 48.00 -71 -0.011 NegativeMW-701 UFB Leachate Sulfide mg/L 14 10 0.34 0.51 0.20 0.36 1.06 2.96 0.20 1.50 -32 0.000 NegativeMW-702 QAL Leachate Alkalinity Carbonate mg/L 16 1 10.75 16.38 4.55 12.85 1.20 1.99 2.00 49.00 -45 -0.015 NegativeMW-702 QAL Leachate Calcium mg/L 16 0 50.66 56.26 48.50 12.78 0.25 1.61 35.00 87.50 -76 -0.023 NegativeMW-702 QAL Leachate Hardness mg/L 16 0 178.13 193.58 173.00 35.27 0.20 1.22 134.00 270.00 -92 -0.074 NegativeMW-702 QAL Leachate Manganese µg/L 16 4 196.94 265.61 140.00 156.69 0.80 0.94 50.00 550.00 -38 -0.277 NegativeMW-702 QAL Leachate Potassium mg/L 16 0 10.27 13.87 6.25 8.23 0.80 1.60 4.70 29.00 -97 -0.012 NegativeMW-702 QAL Leachate Sodium mg/L 16 0 29.78 35.04 27.00 12.01 0.40 0.76 17.00 55.00 45 0.020 PositiveMW-702 QAL Leachate Sulfate mg/L 16 0 103.13 110.22 100.00 16.18 0.16 0.72 82.00 130.00 -79 -0.043 NegativeMW-703 DBA Compliance Alkalinity Bicarbonate mg/L 16 0 58.69 65.74 59.00 16.08 0.27 0.24 30.00 91.00 38 0.027 PositiveMW-703 DBA Compliance Calcium mg/L 16 0 15.74 19.11 18.50 7.69 0.49 -0.24 4.10 25.00 -53 -0.018 NegativeMW-703 DBA Compliance Chloride mg/L 16 0 18.56 18.92 18.50 0.81 0.04 0.20 17.00 20.00 -65 -0.001 NegativeMW-703 DBA Compliance Hardness mg/L 16 0 88.31 102.91 99.00 33.30 0.38 -0.44 29.00 130.00 -63 -0.081 NegativeMW-703 DBA Compliance Iron µg/L 16 9 449.38 672.10 200.00 508.21 1.13 1.91 200.00 1,700.00 -56 -0.028 NegativeMW-703 DBA Compliance Lithium µg/L 8 2 12.88 14.85 11.50 2.95 0.23 0.52 10.00 17.00 19 0.009 PositiveMW-703 DBA Compliance Magnesium mg/L 16 2 11.74 13.36 13.00 3.69 0.31 -0.72 4.20 16.00 -51 -0.008 NegativeMW-703 DBA Compliance Sodium mg/L 16 0 12.25 13.17 13.00 2.09 0.17 -0.96 8.10 15.00 -37 -0.003 NegativeMW-703 DBA Compliance Sulfate mg/L 16 0 30.84 43.37 17.00 28.59 0.93 0.57 1.00 80.00 -65 -0.075 NegativeMW-703 LLA Compliance Calcium mg/L 11 0 27.55 30.12 26.00 4.72 0.17 0.19 20.00 35.00 -31 -0.020 NegativeMW-703 LLA Compliance Chloride mg/L 11 0 58.18 71.12 61.00 23.68 0.41 -0.11 22.00 100.00 -31 -0.093 NegativeMW-703 LLA Compliance Hardness mg/L 11 0 115.82 122.79 119.00 12.76 0.11 -0.19 96.00 135.00 -43 -0.076 NegativeMW-703 LLA Compliance Manganese µg/L 11 3 10.19 10.78 10.00 1.08 0.11 0.10 8.30 12.00 -21 -0.040 NegativeMW-703 LLA Compliance Potassium mg/L 11 0 5.62 6.35 5.70 1.33 0.24 -0.49 3.00 7.60 -26 -0.004 NegativeMW-703 LLA Compliance Sodium mg/L 11 0 30.23 37.11 30.00 12.60 0.42 0.21 12.00 53.00 -33 -0.050 NegativeMW-703 LLA Compliance Sulfate mg/L 11 0 28.64 34.32 34.00 10.40 0.36 -0.60 10.00 42.00 -46 -0.059 NegativeMW-703 QAL Compliance Alkalinity Bicarbonate mg/L 15 0 70.33 76.75 67.00 14.11 0.20 0.52 53.00 95.00 -84 -0.044 NegativeMW-703 QAL Compliance Calcium mg/L 15 0 20.83 24.43 19.00 7.92 0.38 -0.06 4.00 33.00 -83 -0.019 NegativeMW-703 QAL Compliance Hardness mg/L 15 0 88.13 96.76 80.00 18.98 0.22 0.75 64.00 123.00 -87 -0.053 NegativeMW-703 QAL Compliance Magnesium mg/L 15 0 7.27 8.21 7.30 2.06 0.28 -2.03 1.00 9.65 -54 -0.003 NegativeMW-703 QAL Compliance Manganese µg/L 15 8 63.53 71.60 50.00 17.74 0.28 0.79 50.00 92.00 -51 -0.019 NegativeMW-703 QAL Compliance Nitrate µg/L 15 0 422.00 557.93 350.00 298.96 0.71 1.15 110.00 1,100.00 84 0.759 PositiveMW-703 QAL Compliance Potassium mg/L 15 0 1.86 2.12 1.80 0.57 0.31 -0.54 0.50 2.70 -77 -0.001 NegativeMW-703 QAL Compliance Sodium mg/L 15 0 4.55 5.60 3.70 2.32 0.51 0.65 1.00 9.20 -82 -0.006 NegativeMW-703 QAL Compliance Sulfate mg/L 15 0 25.60 29.85 24.00 9.34 0.36 0.59 12.00 43.00 -75 -0.029 NegativeMW-703 UFB Compliance Alkalinity Bicarbonate mg/L 13 0 77.23 86.47 81.00 18.69 0.24 -3.40 16.00 91.00 33 0.006 PositiveMW-703 UFB Compliance Hardness mg/L 13 0 118.00 131.53 124.00 27.37 0.23 -3.45 28.00 137.00 29 0.005 PositiveMW-703 UFB Compliance Manganese µg/L 13 0 165.62 186.62 160.00 42.50 0.26 0.98 93.00 250.00 37 0.032 PositiveMW-703 UFB Compliance Potassium mg/L 13 0 2.84 3.25 2.50 0.82 0.29 2.61 2.20 5.30 -61 -0.001 NegativeMW-703 UFB Compliance Sodium mg/L 13 0 5.30 8.84 3.00 7.16 1.35 3.53 2.70 29.00 -41 -0.002 Negative
2016Groundwater Trend Analysis Summary
Humboldt Mill
Location Classification Parameter Unit Count (n)
Number of Non-
Detects Mean UCL MedianStandard Deviation
Coefficient of Variation Skewness Minimum Maximum
Man-Kendall S Sen Slope
Positive or Negative
Trend (Minimum
95% Confidence)
MW-704 DBA Compliance Alkalinity Bicarbonate mg/L 17 0 102.41 111.92 110.00 22.46 0.22 -1.48 39.00 130.00 99 0.053 PositiveMW-704 DBA Compliance Alkalinity Carbonate mg/L 17 3 10.96 13.95 12.00 7.06 0.64 0.97 2.00 29.00 -58 -0.013 NegativeMW-704 DBA Compliance Calcium mg/L 17 0 19.14 20.62 20.00 3.48 0.18 -1.73 8.90 23.00 56 0.006 PositiveMW-704 DBA Compliance Hardness mg/L 17 0 92.65 99.02 97.00 15.05 0.16 -1.75 48.00 108.00 101 0.034 PositiveMW-704 DBA Compliance Sulfate mg/L 17 6 2.46 3.14 1.90 1.60 0.65 0.58 1.00 5.50 -110 -0.005 NegativeMW-704 LLA Compliance Alkalinity Bicarbonate mg/L 15 0 96.80 105.30 100.00 18.69 0.19 -0.41 55.00 130.00 -42 -0.037 NegativeMW-704 LLA Compliance Calcium mg/L 15 0 18.83 21.54 19.00 5.95 0.32 0.70 11.00 32.00 -58 -0.015 NegativeMW-704 LLA Compliance Hardness mg/L 15 0 98.00 108.54 96.00 23.18 0.24 0.61 66.00 149.00 -64 -0.069 NegativeMW-704 LLA Compliance Magnesium mg/L 15 0 12.08 12.97 12.00 1.96 0.16 0.32 9.20 15.00 -56 -0.005 NegativeMW-704 LLA Compliance Manganese µg/L 15 9 55.47 59.76 50.00 9.45 0.17 1.74 50.00 80.00 -57 -0.006 NegativeMW-704 LLA Compliance Potassium mg/L 15 0 6.80 8.00 6.20 2.63 0.39 0.32 3.80 11.00 69 0.008 PositiveMW-704 LLA Compliance Sodium mg/L 15 0 6.12 8.51 4.90 5.26 0.86 3.78 3.75 25.00 50 -0.018 PositiveMW-704 LLA Compliance Sulfate mg/L 15 0 11.23 13.88 10.00 5.83 0.52 0.35 4.20 22.00 -88 -0.018 NegativeMW-704 QAL Compliance Ammonia µg/L 15 43.47 52.80 38.00 20.53 0.47 0.70 25.00 89.00 35 0.025 PositiveMW-704 QAL Compliance Chloride mg/L 15 4 15.47 17.59 15.00 4.67 0.30 0.87 10.00 27.00 41 0.007 PositiveMW-704 QAL Compliance Magnesium mg/L 15 7.78 8.62 7.20 1.85 0.24 0.69 5.70 11.00 62 0.005 PositiveMW-704 QAL Compliance Nitrate µg/L 15 330.00 521.81 100.00 421.85 1.28 1.89 100.00 1,500.00 36 0.000 PositiveMW-704 QAL Compliance Sulfate mg/L 15 17.28 22.78 14.00 12.10 0.70 1.63 1.00 49.00 53 0.021 PositiveMW-704 UFB Compliance Ammonia µg/L 14 0 61.07 88.51 33.50 57.98 0.95 1.88 25.00 200.00 -37 -0.047 NegativeMW-704 UFB Compliance Calcium mg/L 14 0 34.54 41.37 33.50 14.44 0.42 -0.15 10.00 56.00 66 0.043 PositiveMW-704 UFB Compliance Chloride mg/L 14 7 13.21 14.94 11.50 3.64 0.28 0.44 10.00 19.00 49 0.043 PositiveMW-704 UFB Compliance Hardness mg/L 14 0 123.21 143.25 118.50 42.32 0.34 0.18 68.00 198.00 75 0.127 PositiveMW-704 UFB Compliance Iron µg/L 14 0 12,906 19,272 7,500 13,450 1.04 0.84 210 37,000 56 23.005 PositiveMW-704 UFB Compliance Magnesium mg/L 14 0 6.61 7.94 7.20 2.82 0.43 -0.43 1.80 11.00 70 0.008 PositiveMW-704 UFB Compliance Manganese µg/L 14 0 576.36 723.20 600.00 310.25 0.54 -0.05 89.00 1,100.00 59 0.764 PositiveMW-704 UFB Compliance Potassium mg/L 14 0 2.77 3.36 3.00 1.26 0.46 -0.29 0.81 4.80 37 0.002 PositiveMW-704 UFB Compliance Sodium mg/L 14 0 17.53 24.68 10.50 15.11 0.86 1.21 5.00 50.00 -61 -0.025 NegativeMW-705 QAL Compliance Alkalinity Bicarbonate mg/L 15 0 60.27 65.56 61.00 11.63 0.19 0.82 41.00 90.00 -51 -0.021 NegativeMW-705 QAL Compliance Ammonia µg/L 15 0 81.87 92.96 74.00 24.39 0.30 0.40 39.00 130.00 73 0.068 PositiveMW-705 QAL Compliance Calcium mg/L 15 0 18.53 19.96 17.00 3.14 0.17 0.50 15.00 24.00 -69 -0.008 NegativeMW-705 QAL Compliance Hardness mg/L 15 0 84.67 91.11 77.00 14.18 0.17 0.35 66.00 109.00 -78 -0.041 NegativeMW-705 QAL Compliance Magnesium mg/L 15 0 8.26 8.96 7.60 1.53 0.19 0.80 6.70 11.00 -70 -0.004 NegativeMW-705 QAL Compliance Manganese µg/L 15 0 1,045 1,153 950 239 0.23 0.48 750 1,500 -69 -0.518 NegativeMW-705 QAL Compliance Sulfate mg/L 15 0 6.22 9.67 4.40 7.59 1.22 3.56 1.80 33.00 46 0.005 PositiveMW-705 UFB Compliance Alkalinity Bicarbonate mg/L 16 0 93.13 99.09 89.00 13.62 0.15 2.99 81.00 140.00 -71 -0.015 NegativeMW-705 UFB Compliance Chloride mg/L 16 10 13.13 15.31 10.00 4.99 0.38 1.41 10.00 24.00 75 0.010 PositiveMW-705 UFB Compliance Iron µg/L 16 0 7,752 8,943 8,600 2,717 0.35 -1.34 680 12,000 71 4.875 PositiveMW-705 UFB Compliance Sulfate mg/L 16 0 8.52 10.01 9.45 3.40 0.40 -0.03 4.00 13.00 -104 -0.011 NegativeMW-706 QAL Mill Services Alkalinity Bicarbonate mg/L 13 0 97.62 107.19 94.00 19.36 0.20 0.87 73.00 140.00 -72 -0.051 NegativeMW-706 QAL Mill Services Arsenic µg/L 13 4 7.26 8.56 6.40 2.64 0.36 1.54 5.00 14.00 -54 -0.005 NegativeMW-706 QAL Mill Services Calcium mg/L 13 0 96.54 107.17 89.00 21.52 0.22 0.91 57.00 150.00 -35 -0.031 NegativeMW-706 QAL Mill Services Chloride mg/L 13 0 107.77 117.81 98.00 20.31 0.19 1.16 86.00 150.00 38 0.050 PositiveMW-706 QAL Mill Services Hardness mg/L 13 0 262.23 358.57 267.00 194.92 0.74 -0.18 6.00 503.00 -34 -0.441 NegativeMW-706 QAL Mill Services Nickel µg/L 13 4 22.54 23.73 22.00 2.40 0.11 0.31 20.00 26.00 61 0.007 PositiveMW-706 QAL Mill Services Potassium mg/L 13 0 4.71 4.96 4.50 0.50 0.11 1.95 4.20 6.10 -34 -0.0007 NegativeMW-706 QAL Mill Services Sodium mg/L 13 0 56.08 81.15 33.00 50.74 0.90 1.95 24.00 190.00 -55 -0.052 NegativeMW-706 QAL Mill Services Sulfate mg/L 13 0 280.77 325.55 250.00 90.60 0.32 0.57 180.00 430.00 -65 -0.271 NegativeMW-707 QAL Concentrator/CLO Alkalinity Bicarbonate mg/L 13 0 154.62 157.18 150.00 5.19 0.03 0.18 150.00 160.00 32 0.000 PositiveMW-707 QAL Concentrator/CLO Hardness mg/L 13 0 151.31 153.27 153.00 3.97 0.03 -0.23 145.00 156.00 62 0.011 PositiveMW-707 QAL Concentrator/CLO Iron µg/L 13 0 5,884.62 6,216.68 6,000.00 671.87 0.11 -0.009 4,800.00 7,200.00 -64 -1.817 NegativeMW-707 QAL Concentrator/CLO Sodium mg/L 13 0 3.08 3.24 3.00 0.31 0.10 1.67 2.70 3.90 -32 -0.0003 NegativeMW-9R Concentrator Ammonia µg/L 13 9 46.23 69.32 25.00 46.72 1.01 2.83 25.00 190.00 -32 0.000 Negative
2016Groundwater Trend Analysis Summary
Humboldt Mill
Location Classification Parameter Unit Count (n)
Number of Non-
Detects Mean UCL MedianStandard Deviation
Coefficient of Variation Skewness Minimum Maximum
Man-Kendall S Sen Slope
Positive or Negative
Trend (Minimum
95% Confidence)
MW-9R Concentrator Chloride mg/L 13 0 61.31 92.57 30.00 63.26 1.03 1.26 14.00 190.00 -35 -0.096 NegativeMW-9R Concentrator Iron µg/L 13 7 1,028.46 1,619.63 200.00 1,196.12 1.16 1.41 200.00 3,800.00 -43 -2.000 NegativeMW-9R Concentrator Manganese µg/L 13 0 518.85 714.50 430.00 395.87 0.76 1.01 66.00 1,400.00 -49 -1.098 NegativeMW-9R Concentrator Potassium mg/L 13 0 3.55 3.98 3.50 0.85 0.24 -0.48 2.10 4.60 -28 -0.001 NegativeMW-9R Concentrator Sodium mg/L 13 0 23.86 30.02 19.00 12.45 0.52 0.72 8.20 47.00 -49 -0.033 Negative
2016 Groundwater Trend Analysis Summary Charts
Humboldt Mill
2016 Groundwater Trend Analysis Summary Charts
Humboldt Mill
2016 Groundwater Trend Analysis Summary Charts
Humboldt Mill
2016 Groundwater Trend Analysis Summary Charts
Humboldt Mill
2016 Groundwater Trend Analysis Summary Charts
Humboldt Mill
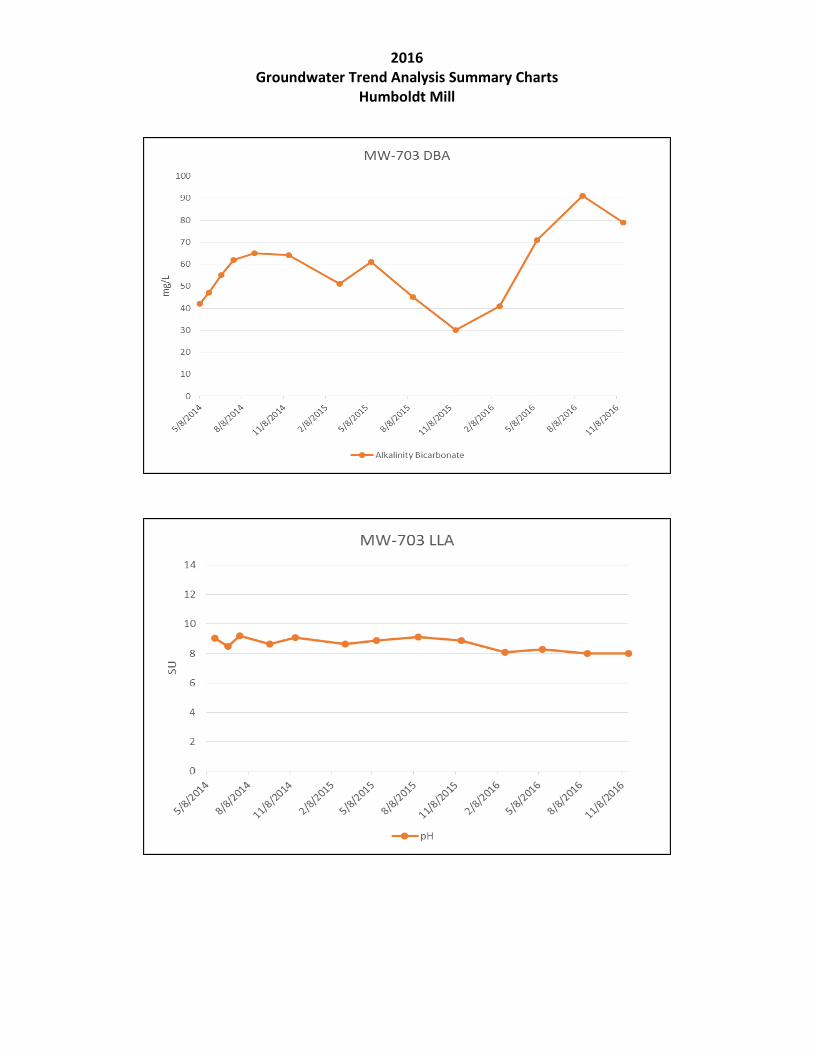
2016 Groundwater Trend Analysis Summary Charts
Humboldt Mill
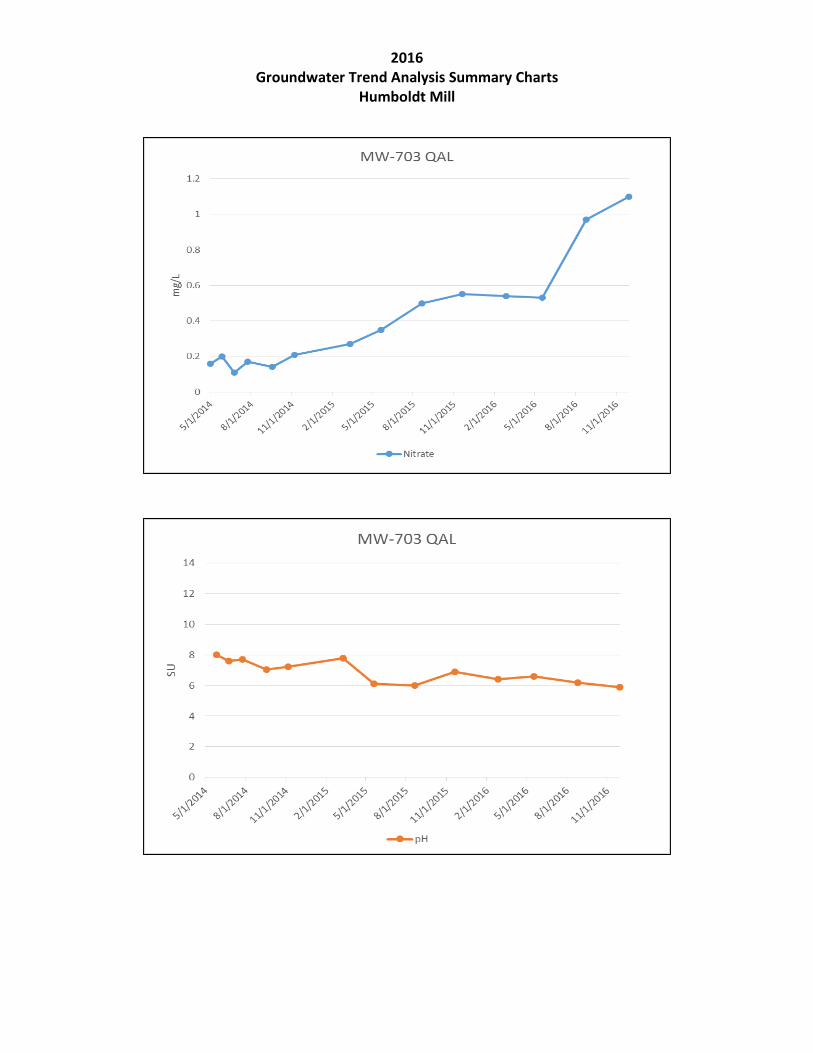
2016 Groundwater Trend Analysis Summary Charts
Humboldt Mill
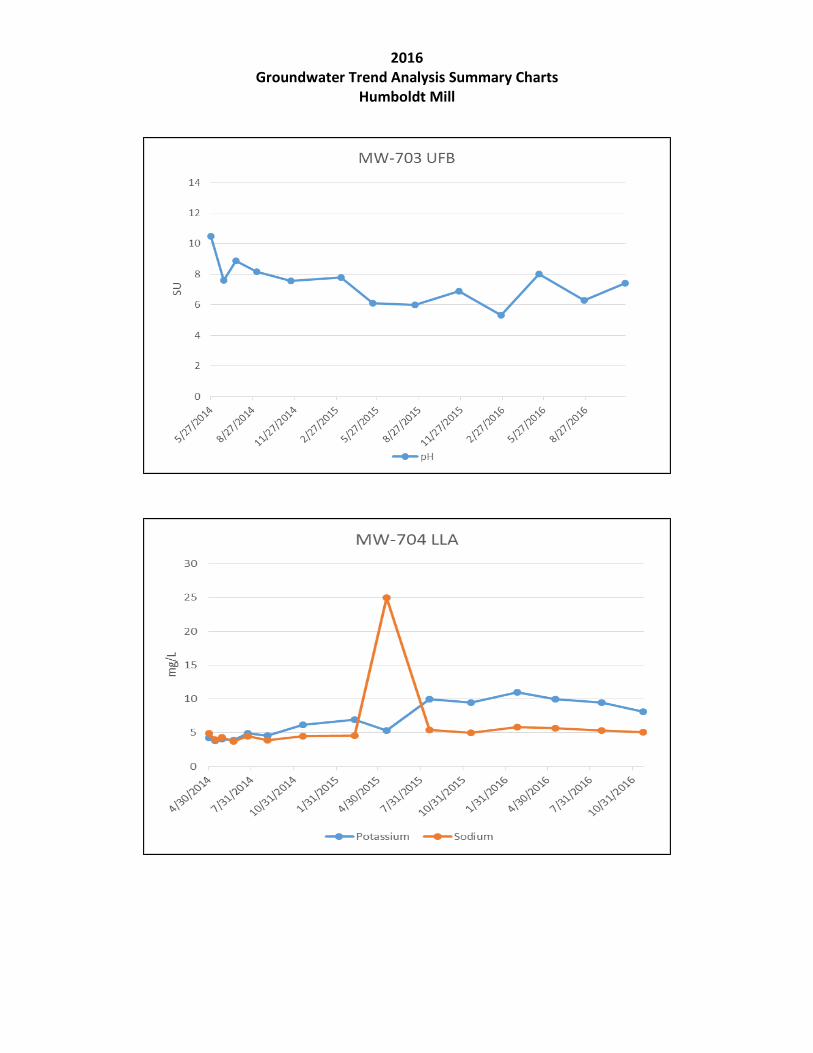
2016 Groundwater Trend Analysis Summary Charts
Humboldt Mill
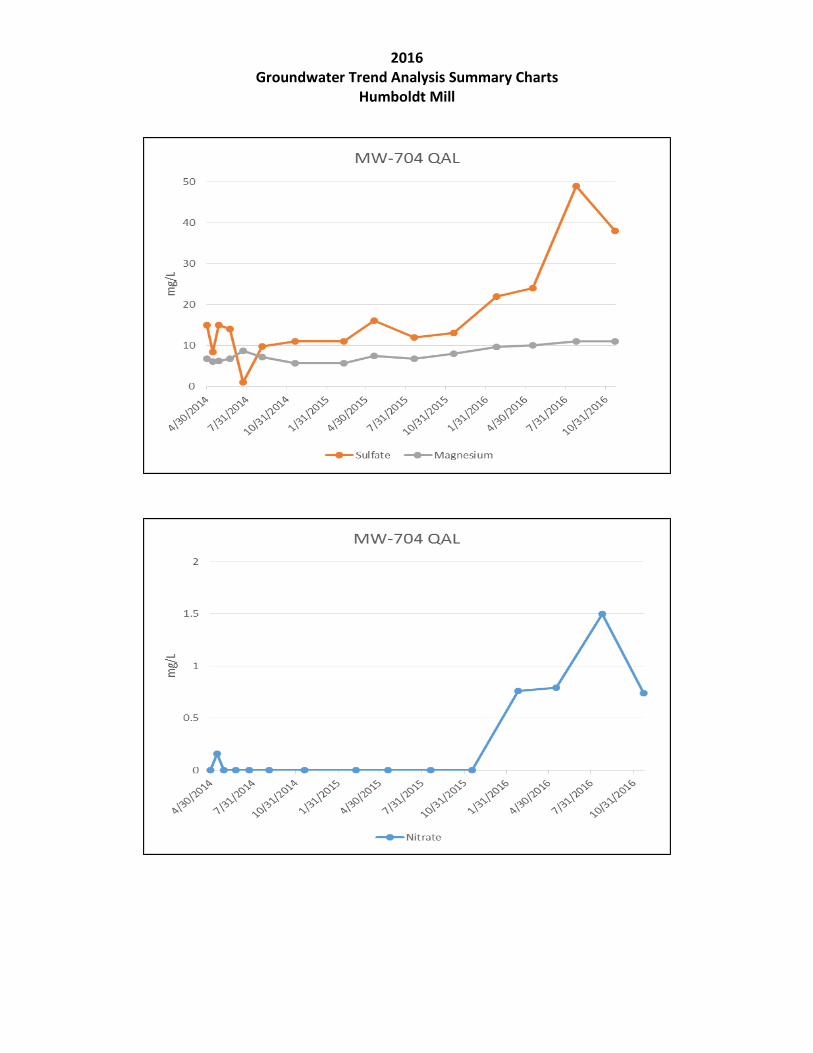
2016 Groundwater Trend Analysis Summary Charts
Humboldt Mill
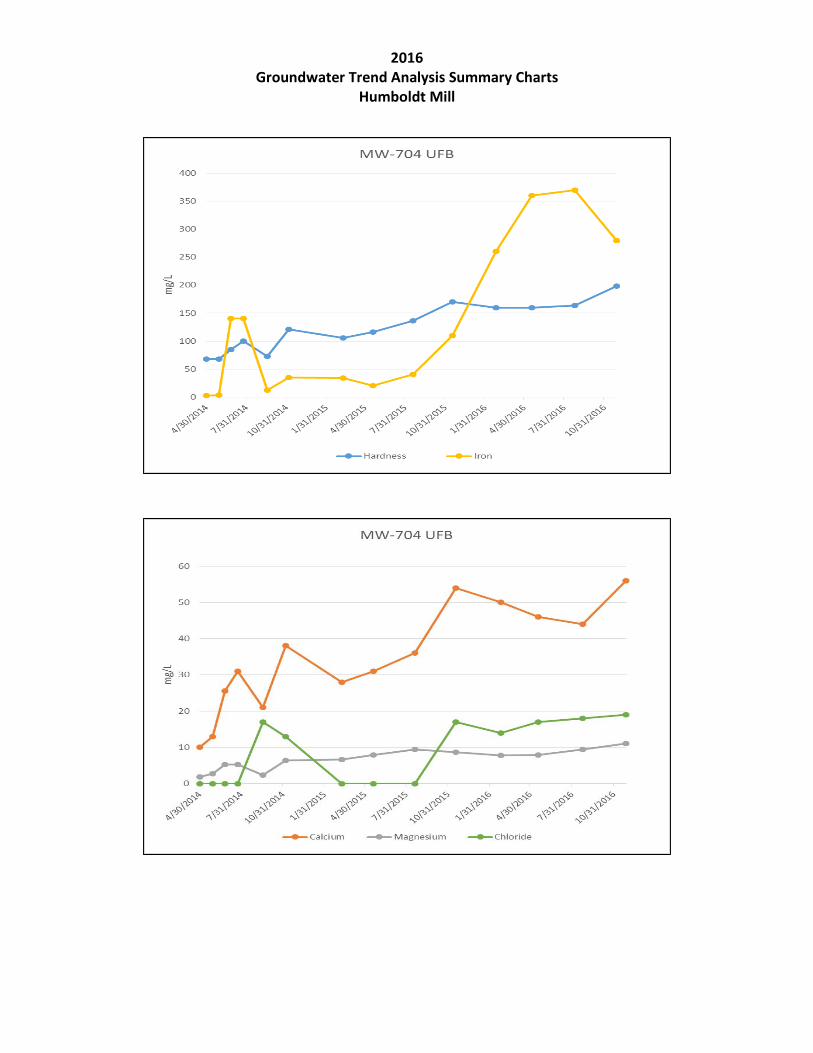
2016 Groundwater Trend Analysis Summary Charts
Humboldt Mill
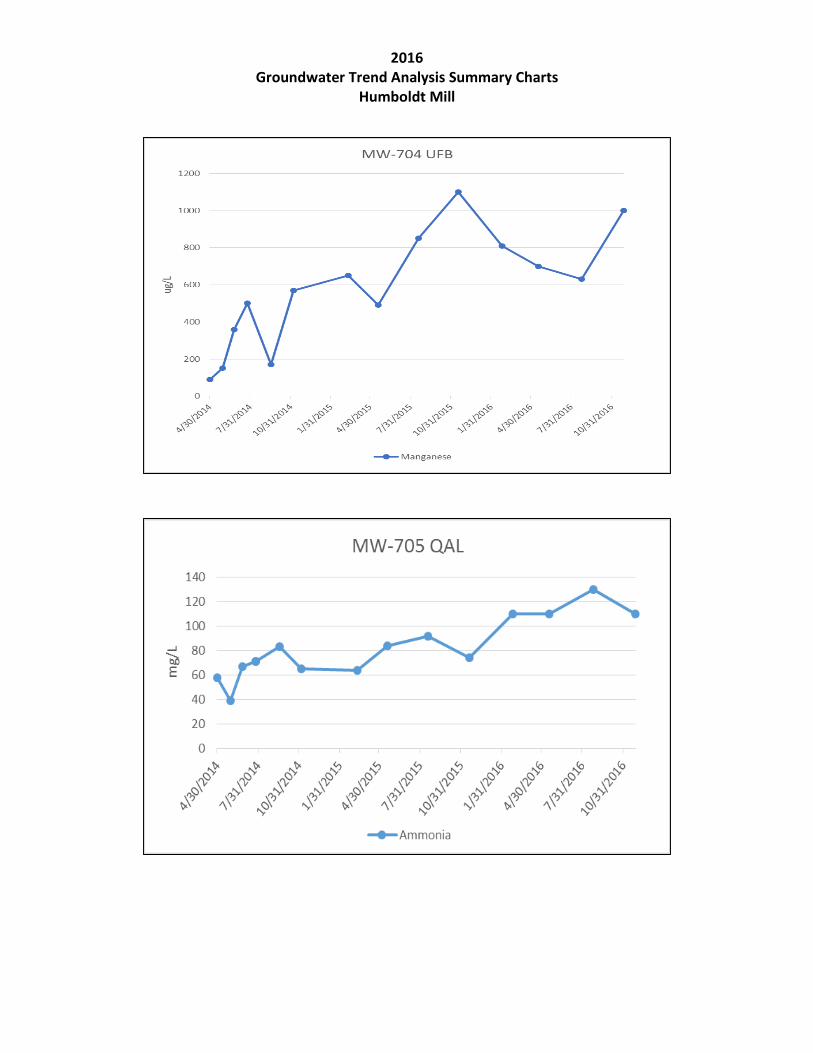
2016 Groundwater Trend Analysis Summary Charts
Humboldt Mill
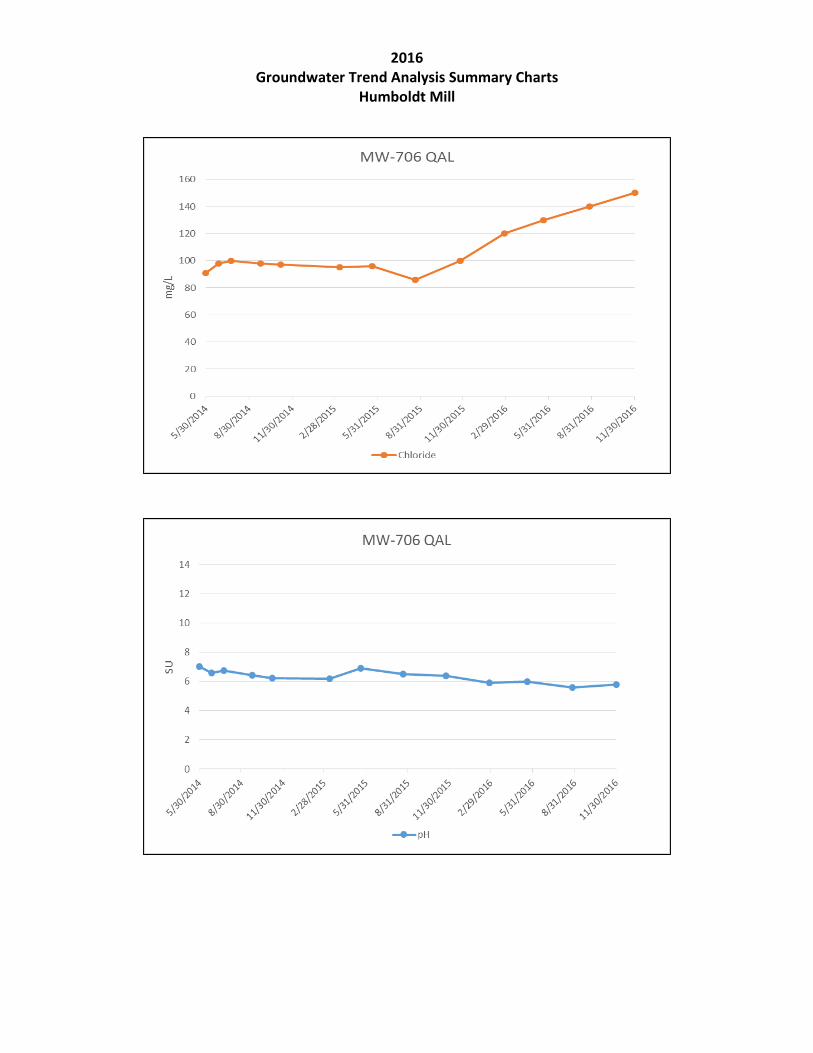
2016 Groundwater Trend Analysis Summary Charts
Humboldt Mill
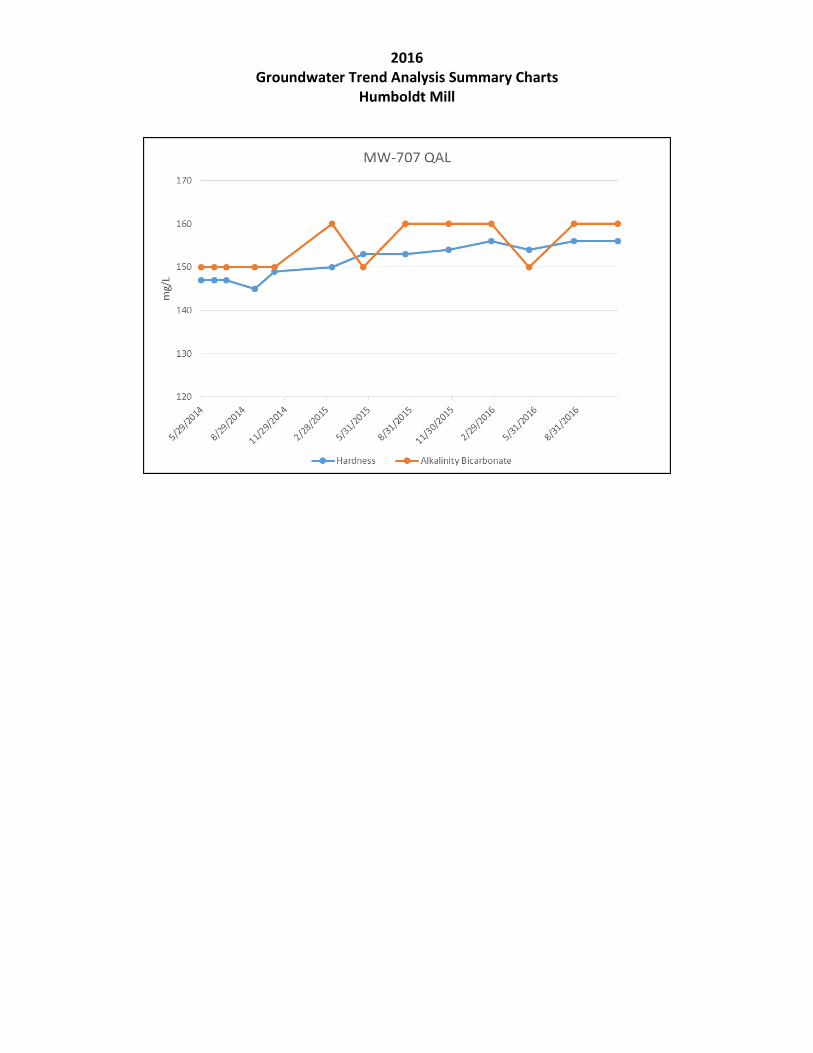
2016 Groundwater Trend Analysis Summary Charts
Humboldt Mill
Appendix H
Humboldt Mill
Surface Water Monitoring Location Map
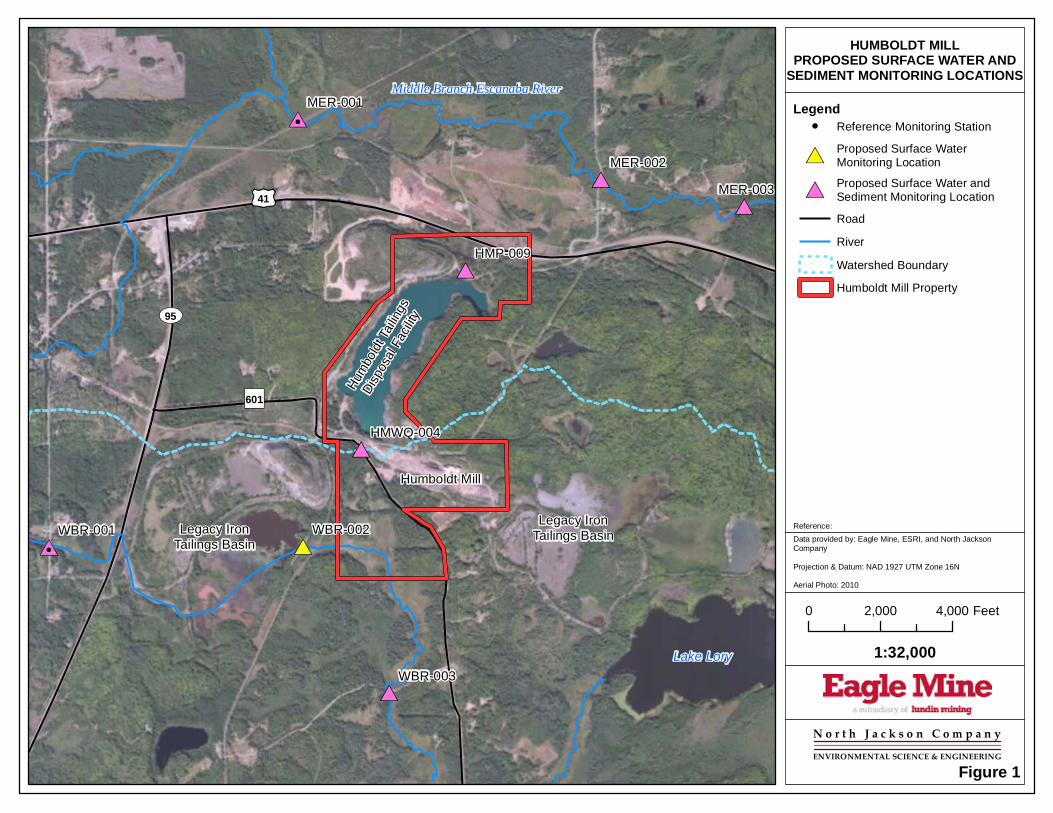
#*
#*#0
#*
#0
#*
#*
#*
HMP-009
MER-003
MER-001
MER-002
WBR-001 WBR-002
WBR-003
HMWQ-004
HUMBOLDT MILLPROPOSED SURFACE WATER AND
SEDIMENT MONITORING LOCATIONS
Reference:Data provided by: Eagle Mine, ESRI, and North JacksonCompany
Projection & Datum: NAD 1927 UTM Zone 16N
Aerial Photo: 2010
1:32,000
0 2,000 4,000 Feet
Middle Branch Escanaba River
Lake Lory
UV95
£¤41
")601
Hum
boldt
Tailin
gs
Disp
osal
Facil
ity
Humboldt Mill
Legacy IronTailings BasinLegacy Iron
Tailings Basin
Figure 1
Legend
Proposed Surface WaterMonitoring Location#*
Road
Humboldt Mill Property
Watershed Boundary
Proposed Surface Water and Sediment Monitoring Location#*
River
Reference Monitoring Station!
N o r t h J a c k s o n C o m p a n yENVIRONMENTAL SCIENCE & ENGINEERING
Appendix I
Humboldt Mill
Surface Water Results
&
Benchmark Summary Table
Humboldt Mill2016 Mine Permit Surface Water Monitoring
Benchmark Comparison Summary
Location Location Classification Q1 Q2 Q3 Q4
HMP-009Compliance - HTDF
subwatershedchloride, sulfate, sodium, total
dissolved solidspH, mercury, chloride, sulfate, sodium, total dissolved solids
HMWQ-004Compliance - Mill
subwatershed
MER-001Reference - HTDF
subwatershed pH pH selenium pH, zinc, total dissolved solids
MER-002Compliance - HTDF
subwatershed cobalt, selenium pH
MER-003Compliance - HTDF
subwatershed pH pH, selenium pH, total suspended solids
WBR-001Reference - Mill subwatershed pH sodium aluminum, selenium, zinc, pH
WBR-002Compliance - Mill
subwatershed pH, lead, nickel, copper, lead, nickel, zinc pH, copper, lead, nickel, selenium pH, copper, lead, nickel
WBR-003Compliance - Mill
subwatershed pH pH, selenium pH
Parameters listed in this table had values reported that were equal to or greater than a site-specific benchmark. Parameters in BOLD are instances in which the Department was notified because benchmarks deviations were identified at compliance monitoring locations for two consecutive sampling events. If the location is classified as background, Department notification is not required for an exceedance.
2016Mine Permit Surface Water Quality Monitoring Data
HMP-009 (Compliance)Humboldt Mill
Explanations of abbreviations are included on the final page of this table. HMP-009 (Compliance)
Parameter Unit
Recom- mended
Benchmark 2014
D.O.1 ppm -- NM 11 14 NMORP mV -- NM 178 31 NMpH SU 7.0-8.0 NM 7.2 6.8 NMSpecific Conductance µS/cm -- NM 637 544 NMTemperature °C -- NM 7.8 21 NMTurbidity NTU -- NM 3.5 7.3 NMFlow cfs -- NM NM NM NM
Aluminum ug/L 200 (p) -- -- < 50 --Antimony ug/L 11.5 -- -- 5.3 --Arsenic ug/L 2.2 NM <1.0 < 1.0 NMBarium ug/L 27 -- -- 13 --Beryllium ug/L 0.67 -- -- < 1.0 --Boron ug/L 113 -- -- 87 --Cadmium ug/L 0.1 -- -- < 0.02 --Chromium ug/L 1.3 -- -- < 1.0 --Cobalt ug/L 3.0 -- -- 1.7 --Copper ug/L 7.9 NM 5.3 3.5 NMIron ug/L 1620 NM 83 89 NMLead ug/L 1.0 NM 0.03 0.02 e NMLithium ug/L 5.3 -- -- < 8.0 --Manganese ug/L 337 NM 23 21 NMMercury ng/L 1.1 NM 0.86 1.5 NMMolybdenum ug/L 13 -- -- 9.5 --Nickel ug/L 17 NM 9.8 6.8 NMSelenium ug/L 0.36 -- -- 3.03 --Silver ug/L 0.12 -- -- < 0.20 --Thallium ug/L 0.68 -- -- < 1.0 --Vanadium ug/L 1.7 -- -- < 1.0 --Zinc ug/L 6.1 NM 0.40 0.77 NM
Alkalinity, Bicarbonate mg/L 124 NM 92 89 NMAlkalinity, Carbonate mg/L 2.0 NM < 2.0 < 2.0 NMChloride mg/L 15 NM 29 30 NMFluoride mg/L 0.41 NM 0.15 < 0.10 NMNitrogen, Ammonia mg/L 2.0 (P) NM < 0.5 < 0.5 NMNitrogen, Nitrate mg/L 2.5 NM < 0.50 < 0.50 NMNitrogen, Nitrite mg/L 0.34 NM < 0.50 < 0.50 NMSulfate mg/L 138 NM 180 150 NMSulfide mg/L 3.0 NM <5.0 <5.0 e NM
Calcium mg/L 68 NM 51 48 NMMagnesium mg/L 26 NM 25 20 NMPotassium mg/L 9.4 NM 8.5 6.9 NMSodium mg/L 15 NM 33 27 NM
Hardness mg/L 251 NM 230 220 NMTotal Dissolved Solids mg/L 361 NM 414 450 NMTotal Suspended Solids mg/L 13 NM < 3.3 < 3.3 NM
General
Q4 2016 11/30/16
Field
Metals
Major Anions
Major Cations
Q2 2016 5/16/16
Q1 2016 2/22/16
Q3 2016 8/23/16
2016Mine Permit Surface Water Quality Monitoring Data
HMWQ-004 (Compliance)Humboldt Mill
Explanations of abbreviations are included on the final page of this table. HMWQ-004 (Compliance)
Parameter Unit
Recom- mended
Benchmark 2014
D.O.1 ppm -- NM NM NM NMORP mV -- NM NM NM NMpH SU 5.7-6.7 NM NM NM NMSpecific Conductance µS/cm -- NM NM NM NMTemperature °C -- NM NM NM NMTurbidity NTU -- NM NM NM NMFlow cfs -- NM NM NM NM
Aluminum ug/L 200 (p) -- -- NM --Antimony ug/L 2.3 -- -- NM --Arsenic ug/L 35 NM NM NM NMBarium ug/L 118 -- -- NM --Beryllium ug/L 4.0 (p) -- -- NM --Boron ug/L 36 -- -- NM --Cadmium ug/L 0.10 -- -- NM --Chromium ug/L 14 -- -- NM --Cobalt ug/L 3.0 -- -- NM --Copper ug/L 11 NM NM NM NMIron ug/L 73,409 NM NM NM NMLead ug/L 2.1 NM NM NM NMLithium ug/L 16 -- -- NM --Manganese ug/L 2541 NM NM NM NMMercury ng/L 43 NM NM NM NMMolybdenum ug/L 4.7 -- -- NM --Nickel ug/L 5.6 NM NM NM NMSelenium ug/L 0.44 -- -- NM --Silver ug/L 0.35 -- -- NM --Thallium ug/L 4.0 (P) -- -- NM --Vanadium ug/L 39 -- -- NM --Zinc ug/L 44 NM NM NM NM
Alkalinity, Bicarbonate mg/L 68 NM NM NM NMAlkalinity, Carbonate mg/L 8.0 (P) NM NM NM NMChloride mg/L 68 NM NM NM NMFluoride mg/L 0.23 NM NM NM NMNitrogen, Ammonia mg/L 1.9 NM NM NM NMNitrogen, Nitrate mg/L 2.0 (P) NM NM NM NMNitrogen, Nitrite mg/L 2.0 (P) NM NM NM NMSulfate mg/L 4.0 (P) NM NM NM NMSulfide mg/L 20 (P) NM NM NM NM
Calcium mg/L 21 NM NM NM NMMagnesium mg/L 8.1 NM NM NM NMPotassium mg/L 3.3 NM NM NM NMSodium mg/L 49 NM NM NM NM
Hardness mg/L 88 NM NM NM NMTotal Dissolved Solids mg/L 209 NM NM NM NMTotal Suspended Solids mg/L 353 NM NM NM NM
General
Q4 2016 11/30/16
Field
Metals
Major Anions
Major Cations
Q2 2016 5/16/16
Q1 2016 2/22/16
Q3 2016 8/23/16
2016Mine Permit Surface Water Quality Monitoring Data
MER-001 (Reference)Humboldt Mill
Explanations of abbreviations are included on the final page of this table. MER-001 (Reference)
Parameter Unit
Recom- mended
Benchmark 2014
D.O.1 ppm -- 10 9.8 6.9 11ORP mV -- 180 341 129 113pH SU 6.1-7.1 6.1 5.9 6.4 5.4Specific Conductance µS/cm -- 83 66 67 35Temperature °C -- 0.1 8.6 17 1.6Turbidity NTU -- 6.7 2.1 7.3 4.3Flow cfs -- NM NM NM NM
Aluminum ug/L 200 (p) -- -- < 50 < 50Antimony ug/L 0.73 -- -- < 1.0 < 1.0Arsenic ug/L 3.4 < 1.0 < 1.0 1.7 < 1.0Barium ug/L 12 -- -- 8.8 --Beryllium ug/L 0.73 -- -- < 1.0 --Boron ug/L 14.8 -- -- < 10 --Cadmium ug/L 0.10 -- -- < 0.1 --Chromium ug/L 1.2 -- -- < 1.0 --Cobalt ug/L 0.42 -- -- 0.19 e --Copper ug/L 0.86 0.44 0.58 0.58 0.54Iron ug/L 3255 1200 880 1800 1100Lead ug/L 0.35 0.11 0.12 0.19 e 0.16Lithium ug/L 5.7 -- -- < 8.0 --Manganese ug/L 226 72 81 91 55Mercury ng/L 8.5 2.5 3.8 5.9 4.2Molybdenum ug/L 1.0 -- -- < 1.0 --Nickel ug/L 1.0 0.52 0.57 0.75 0.75Selenium ug/L 0.19 -- -- 0.48 --Silver ug/L 0.12 -- -- < 0.20 --Thallium ug/L 0.75 -- -- < 1.0 --Vanadium ug/L 1.5 -- -- < 1.0 --Zinc ug/L 2.6 1.6 1.7 1.7 e 18
Alkalinity, Bicarbonate mg/L 50 25 22 27 16Alkalinity, Carbonate mg/L 2.0 < 2.0 < 2.0 < 2.0 < 2.0Chloride mg/L 13 5.2 5.2 7.5 7.8Fluoride mg/L 0.19 < 0.10 < 0.10 < 0.10 < 0.10Nitrogen, Ammonia mg/L 2.0 (P) < 0.50 < 0.50 < 0.50 < 0.50Nitrogen, Nitrate mg/L 0.34 < 0.50 < 0.50 < 0.50 < 0.50Nitrogen, Nitrite mg/L 0.36 < 0.50 < 0.50 < 0.50 < 0.50Sulfate mg/L 10 3.3 < 1.0 < 1.0 < 1.0Sulfide mg/L 3.2 < 5.0 < 5.0 < 5.0 e < 5.0
Calcium mg/L 15 8.5 6.9 8.4 5.9Magnesium mg/L 4.1 2.4 2.2 2.2 1.9Potassium mg/L 1.0 0.57 0.52 0.61 0.61Sodium mg/L 6.9 3.1 3.2 4.1 3.8
Hardness mg/L 56 34 26 36 22Total Dissolved Solids mg/L 111 62 58 104 140 eTotal Suspended Solids mg/L 4.0 < 3.3 < 3.3 < 3.3 < 3.3
Major Cations
General
Q4 2016 11/30/16
Field
Metals
Major Anions
Q2 2016 5/16/16
Q1 2016 2/22/16
Q3 2016 8/23/16

2016Mine Permit Surface Water Quality Monitoring Data
MER-002 (Compliance)Humboldt Mill
Explanations of abbreviations are included on the final page of this table. MER-002 (Compliance)
Parameter Unit
Recom- mended
Benchmark 2014
D.O.1 ppm -- 10 9.2 6.6 12ORP mV -- 141 148 88 125pH SU 6.0-7.0 6.3 6.8 6.5 5.4Specific Conductance µS/cm -- 118 79 78 30Temperature °C -- 0 9.2 17 1.6Turbidity NTU -- 5.7 2.3 8.5 5.4Flow cfs -- 17 38 75 103
Aluminum ug/L 200 (p) -- -- < 50 --Antimony ug/L 0.72 -- -- < 1.0 --Arsenic ug/L 5.1 1.1 < 1.0 2.4 1.1Barium ug/L 20 -- -- 10 --Beryllium ug/L 0.73 -- -- < 1.0 --Boron ug/L 14 -- -- < 10 --Cadmium ug/L 0.09 -- -- < 0.02 --Chromium ug/L 1.2 -- -- < 0.1 --Cobalt ug/L 0.65 -- -- 1.7 e --Copper ug/L 0.90 0.42 0.57 0.56 0.50Iron ug/L 6440 1600 1100 2200 1600Lead ug/L 0.37 0.10 0.11 0.21 0.15Lithium ug/L 5.7 -- -- < 8.0 --Manganese ug/L 560 150 96 110 90Mercury ng/L 7.5 2.4 3.7 6.4 4.0Molybdenum ug/L 0.73 -- -- < 1.0 --Nickel ug/L 1.2 0.96 0.62 0.83 0.57Selenium ug/L 0.19 -- -- 0.44 --Silver ug/L 0.12 -- -- < 0.20 --Thallium ug/L 0.73 -- -- < 1.0 --Vanadium ug/L 3.0 -- -- < 1.0 --Zinc ug/L 3.0 1.5 1.7 2.3 e 2.2
Alkalinity, Bicarbonate mg/L 53 30 21 27 15Alkalinity, Carbonate mg/L 2.0 < 2.0 < 2.0 < 2.0 < 2.0Chloride mg/L 16 7.6 6.4 9.6 6.8Fluoride mg/L 0.19 < 0.10 < 0.10 < 0.10 < 0.10Nitrogen, Ammonia mg/L 2.0 (P) < 0.50 < 0.50 < 0.50 < 0.50 eNitrogen, Nitrate mg/L 0.40 < 0.50 < 0.50 < 0.50 < 0.50Nitrogen, Nitrite mg/L 0.37 < 0.50 < 0.50 < 0.50 < 0.50Sulfate mg/L 14 13 3.9 < 1.0 < 1.0Sulfide mg/L 3.2 < 5.0 < 5.0 < 5.0 e < 5.0
Calcium mg/L 18 11 8.3 8.8 6.5Magnesium mg/L 4.9 3.4 2.4 2.4 2.0Potassium mg/L 1.2 0.94 0.62 0.63 1.0Sodium mg/L 9.4 5.0 4.2 5.0 3.7
Hardness mg/L 67 40 30 34 24Total Dissolved Solids mg/L 125 72 56 114 90 eTotal Suspended Solids mg/L 12 < 3.3 < 3.3 < 3.3 < 3.3
General
Q4 2016 11/30/16
Field
Metals
Major Anions
Major Cations
Q2 2016 5/16/16
Q1 2016 2/22/16
Q3 2016 8/23/16
2016Mine Permit Surface Water Quality Monitoring Data
MER-003 (Compliance)Humboldt Mill
Explanations of abbreviations are included on the final page of this table. MER-003 (Compliance)
Parameter Unit
Recom- mended
Benchmark 2014
D.O.1 ppm -- 10 9.4 6.6 13ORP mV -- 148 89 211 124pH SU 6.0-7.0 6.0 6.7 5.5 5.6Specific Conductance µS/cm -- 130 112 85 47Temperature °C -- 0.1 9.2 16 1.7Turbidity NTU -- 6.2 2.5 8.8 7.7Flow cfs -- NM NM 42.3 NM
Aluminum ug/L 200 (p) -- -- < 50 --Antimony ug/L 0.70 -- -- < 1.0 --Arsenic ug/L 3.3 1.2 <1.0 2.4 2.1Barium ug/L 15 -- -- 10 --Beryllium ug/L 0.73 -- -- < 1.0 --Boron ug/L 15 -- -- 10 --Cadmium ug/L 0.09 -- -- < 0.1 --Chromium ug/L 0.85 -- -- < 1.0 --Cobalt ug/L 0.65 -- -- 0.33 e --Copper ug/L 0.92 0.43 0.55 0.55 0.51Iron ug/L 4268 1700 1200 2300 2900Lead ug/L 0.35 0.09 0.10 0.18 e 0.20Lithium ug/L 5.7 -- -- < 8.0 --Manganese ug/L 280 170 110 100 140Mercury ng/L 7.6 2.2 3.7 6.1 6.2Molybdenum ug/L 0.80 -- -- < 1.0 --Nickel ug/L 1.3 1.2 0.95 1.1 0.68Selenium ug/L 0.20 -- -- 0.53 --Silver ug/L 0.12 -- -- < 0.20 --Thallium ug/L 0.70 -- -- < 1.0 --Vanadium ug/L 1.2 -- -- < 1.0 --Zinc ug/L 2.9 1.6 1.9 2.5 e 2.7
Alkalinity, Bicarbonate mg/L 56 32 25 27 19Alkalinity, Carbonate mg/L 2.0 < 2.0 < 2.0 < 2.0 < 2.0Chloride mg/L 19 8.9 9.4 10 8.6Fluoride mg/L 0.29 < 0.10 < 0.10 < 0.10 < 0.10Nitrogen, Ammonia mg/L 2.0 (P) < 0.50 < 0.50 < 0.50 < 0.50Nitrogen, Nitrate mg/L 0.34 < 0.50 < 0.50 < 0.50 < 0.50Nitrogen, Nitrite mg/L 0.37 < 0.50 < 0.50 < 0.50 < 0.50Sulfate mg/L 16 14 11 < 1.0 < 1.0Sulfide mg/L 3.2 < 5.0 < 5.0 < 5.0 e < 5.0
Calcium mg/L 19 12 9.8 9.5 7.2Magnesium mg/L 5.3 3.7 3.0 2.6 2.3Potassium mg/L 1.4 1.1 0.87 0.75 1.2Sodium mg/L 11 5.8 6.2 5.6 4.9
Hardness mg/L 71 40 34 38 28Total Dissolved Solids mg/L 141 78 82 112 100 eTotal Suspended Solids mg/L 3.1 < 3.3 < 3.3 < 3.3 12
General
Q4 2016 11/30/16
Field
Metals
Major Anions
Major Cations
Q2 2016 5/16/16
Q1 2016 2/22/16
Q3 2016 8/23/16
2016Mine Permit Surface Water Quality Monitoring5Data
WBR-001 (Reference)Humboldt Mill
Explanations of abbreviations are included on the final page of this table. WBR-001 (Reference)
Parameter Unit
Recom- mended
Benchmark 2014
D.O.1 ppm -- 10 8.0 3.8 11ORP mV -- 253 165 90 96pH SU 5.0-6.0 6.0 5.3 5.5 5.0Specific Conductance µS/cm -- 110 99 64 45Temperature °C -- 0.3 13 19 1.6Turbidity NTU -- 3.2 3.5 21 2.4Flow cfs -- NM NM NM NM
Aluminum ug/L 200 (p) -- -- 210 --Antimony ug/L 0.70 -- -- < 1.0 --Arsenic ug/L 8.7 1.2 1.2 1.6 <1.0Barium ug/L 26 -- -- 12 --Beryllium ug/L 0.73 -- -- < 1.0 --Boron ug/L 12.7 -- -- < 10 --Cadmium ug/L 0.06 -- -- < 0.1 --Chromium ug/L 2.7 -- -- < 1.0 --Cobalt ug/L 0.85 -- -- 0.33 e --Copper ug/L 1.0 0.62 0.63 0.81 0.53Iron ug/L 11056 1800 1200 1700 1400Lead ug/L 1.8 1.0 0.69 1.0 0.8Lithium ug/L 8.6 -- -- < 8.0 --Manganese ug/L 641 150 77 89 65Mercury ng/L 17 7.5 7.0 12 7.7Molybdenum ug/L 8.1 -- -- < 1.0 --Nickel ug/L 1.9 0.73 0.67 1.0 0.68Selenium ug/L 0.33 -- -- 0.33 e --Silver ug/L 0.12 -- -- < 0.20 --Thallium ug/L 0.70 -- -- < 1.0 --Vanadium ug/L 4.2 -- -- 1.1 --Zinc ug/L 9.2 6.0 4.9 9.6 5.4
Alkalinity, Bicarbonate mg/L 15 5.5 4.5 7.8 3.0Alkalinity, Carbonate mg/L 2.0 < 2.0 < 2.0 < 2.0 < 2.0Chloride mg/L 24 15 23 12 16Fluoride mg/L 0.26 < 0.10 < 0.10 < 0.10 < 0.10Nitrogen, Ammonia mg/L 0.78 < 0.50 < 0.50 < 0.50 < 0.50Nitrogen, Nitrate mg/L 0.34 < 0.50 < 0.50 < 0.50 < 0.50Nitrogen, Nitrite mg/L 0.37 < 0.50 < 0.50 < 0.50 < 0.50Sulfate mg/L 9.3 < 1.0 e < 1.0 < 1.0 < 1.0Sulfide mg/L 3.2 < 5.0 < 5.0 < 5.0 e < 5.0
Calcium mg/L 8.3 5.1 4.5 4.4 3.9Magnesium mg/L 3.3 2.0 1.8 1.7 1.7Potassium mg/L 2.6 0.89 0.69 0.67 1.1Sodium mg/L 11 6.8 11 5.6 7.1
Hardness mg/L 38 35 20 22 20Total Dissolved Solids mg/L 204 108 92 136 105 eTotal Suspended Solids mg/L 34 < 3.3 < 3.3 < 3.3 < 3.3
General
Q4 2016 11/30/16
Field
Metals
Major Anions
Major Cations
Q2 2016 5/16/16
Q1 2016 2/22/16
Q3 2016 8/23/16

2016Mine Permit Surface Water Quality Monitoring Data
WBR-002 (Compliance)Humboldt Mill
Explanations of abbreviations are included on the final page of this table. WBR-002 (Compliance)
Parameter Unit
Recom- mended
Benchmark 2014
D.O.1 ppm -- 6.9 8.7 1.8 11ORP mV -- 160 125 175 73pH SU 6.3-7.3 6.0 6.8 6.3 6.0Specific Conductance µS/cm -- 233 161 175 106Temperature °C -- 0.2 10 19 2.2Turbidity NTU -- 33 29 24 26Flow cfs -- NM NM NM NM
Aluminum ug/L 200 (p) -- -- < 50 --Antimony ug/L 0.72 -- -- < 1.0 --Arsenic ug/L 10 3.4 2.0 3.4 2.3Barium ug/L 19 -- -- 11 --Beryllium ug/L 0.73 -- -- < 1.0 --Boron ug/L 18 -- -- 14 --Cadmium ug/L 0.09 -- -- < 0.1 --Chromium ug/L 10 -- -- < 1.0 --Cobalt ug/L 0.80 -- -- 0.53 --Copper ug/L 1.3 1.0 1.9 1.3 1.3Iron ug/L 15593 8300 3300 7300 3300Lead ug/L 0.25 0.33 0.42 0.42 0.31Lithium ug/L 5.6 -- -- < 8.0 --Manganese ug/L 1295 400 94 190 120Mercury ng/L 4.3 3.2 3.1 2.2 2.2Molybdenum ug/L 2.8 -- -- < 1.0 --Nickel ug/L 1.9 2.4 2.2 2.3 2.0Selenium ug/L 0.18 -- -- 0.72 --Silver ug/L 0.12 -- -- < 0.20 --Thallium ug/L 0.72 -- -- < 1.0 --Vanadium ug/L 0.8 -- -- < 1.0 --Zinc ug/L 4.5 3.7 4.7 4.3 2.9
Alkalinity, Bicarbonate mg/L 41 28 12 25 19Alkalinity, Carbonate mg/L 2.0 < 2.0 < 2.0 < 2.0 < 2.0Chloride mg/L 56 47 37 42 41Fluoride mg/L 0.31 < 0.10 < 0.10 0.11 < 0.10Nitrogen, Ammonia mg/L 0.61 < 0.50 < 0.50 < 0.50 < 0.50Nitrogen, Nitrate mg/L 0.36 < 0.50 < 0.50 < 0.50 < 0.50Nitrogen, Nitrite mg/L 0.37 < 0.50 < 0.50 < 0.50 < 0.50Sulfate mg/L 10 2.0 5.0 < 1.0 < 1.0Sulfide mg/L 3.2 < 5.0 < 5.0 < 5.0 e < 5.0
Calcium mg/L 13 11 6.1 8.4 7.7Magnesium mg/L 5.8 5.1 3.1 4.0 3.8Potassium mg/L 2.7 1.8 1.8 0.94 1.7Sodium mg/L 28 23 18 21 22
Hardness mg/L 56 50 28 40 32Total Dissolved Solids mg/L 182 172 92 158 76 eTotal Suspended Solids mg/L 9.8 10 9.3 8.3 4.7
General
Q4 2016 11/30/16
Field
Metals
Major Anions
Major Cations
Q2 2016 5/16/16
Q1 2016 2/22/16
Q3 2016 8/23/16

2016Mine Permit Surface Water Quality Monitoring Data
WBR-003 (Compliance)Humboldt Mill
Explanations of abbreviations are included on the final page of this table. WBR-003 (Compliance)
Parameter Unit
Recom- mended
Benchmark 2014
D.O.1 ppm -- 3.6 NM 1.3 8.6ORP mV -- 117 125 90 70pH SU 6.1-7.1 6.0 6.7 6.1 5.6Specific Conductance µS/cm -- 226 151 118 67Temperature °C -- 0.2 12 17 0.8Turbidity NTU -- 19 10 21 16Flow cfs -- NM NM NM NM
Aluminum ug/L 200 (p) -- -- < 50 --Antimony ug/L 0.70 -- -- < 1.0 --Arsenic ug/L 4.4 2.4 1.3 1.8 1.3Barium ug/L 19 -- -- 11 --Beryllium ug/L 0.70 -- -- < 1.0 --Boron ug/L 19 -- -- 13 --Cadmium ug/L 0.09 -- -- < 0.1 --Chromium ug/L 0.74 -- -- < 1.0 --Cobalt ug/L 1.2 -- -- 0.33 e --Copper ug/L 1.0 0.52 0.55 0.65 0.25Iron ug/L 11315 9600 4600 4700 2600Lead ug/L 0.44 0.39 0.13 0.23 0.12Lithium ug/L 5.5 -- -- < 8.0 --Manganese ug/L 2101 1400 320 210 60Mercury ng/L 6.0 3.7 3.3 5.4 1.9Molybdenum ug/L 1.9 -- -- < 1.0 --Nickel ug/L 1.8 1.7 1.5 1.5 0.59Selenium ug/L 0.19 -- -- 0.39 --Silver ug/L 0.12 -- -- < 0.20 --Thallium ug/L 0.72 -- -- < 1.0 --Vanadium ug/L 0.82 -- -- < 1.0 --Zinc ug/L 10 5.3 1.5 4.0 2.2
Alkalinity, Bicarbonate mg/L 56 45 31 26 16Alkalinity, Carbonate mg/L 2.0 < 2.0 < 2.0 < 2.0 < 2.0Chloride mg/L 43 35 25 23 23Fluoride mg/L 0.34 <0.10 0.10 0.10 0.10Nitrogen, Ammonia mg/L 2.0 (P) < 0.50 < 0.50 < 0.50 < 0.50Nitrogen, Nitrate mg/L 0.30 < 0.50 < 0.50 < 0.50 < 0.50Nitrogen, Nitrite mg/L 0.37 < 0.50 < 0.50 < 0.50 < 0.50Sulfate mg/L 14 < 1.0 < 1.0 < 1.0 < 1.0Sulfide mg/L 3.2 < 5.0 < 5.0 < 5.0 e < 5.0
Calcium mg/L 16 13 10 8.1 7.0Magnesium mg/L 6.6 5.5 4.3 3.5 3.5Potassium mg/L 2.0 1.7 1.5 1.1 1.8Sodium mg/L 21 16 13 12 15
Hardness mg/L 69 56 40 32 30Total Dissolved Solids mg/L 184 136 114 136 85 eTotal Suspended Solids mg/L 15 12 7 12 < 3.3
General
Q4 2016 11/30/16
Field
Metals
Major Anions
Major Cations
Q2 2016 5/16/16
Q1 2016 2/22/16
Q3 2016 8/23/16
2016Mine Permit Surface Water Quality Monitoring Data
Abbreviations & Data QualifiersHumboldt Mill
Explanations of abbreviations are included on the final page of this table. Abbreviations & Data Qualifiers
NM = Not measured.
e = estimated value. The laboratory statement of data qualifications indicates that a quality control limit for this parameter was exceeded.
Highlighted Cell = Value is equal to or above site-specific benchmark. An exceedance occurs if there are 2 consecutive sampling events with a value equal to or greater than the benchmark at a compliance monitoring location.
Notes:Benchmarks are calculated based on guidance from Eagles Mine's Development of Site Specific Benchmarks for Mine Permit Water Quality Monitoring.
Results in bold text indicate that the parameter was detected at a level greater than the laboratory reporting limit.
(p) = Due to less than two detections in baseline dataset, benchmark defaulted to four times the reporting limit.
--Denotes no benchmark required or parameter was not required to be collected during the sampling quarter.
Appendix J
Humboldt Mill
Surface Water Trend Analysis Summary
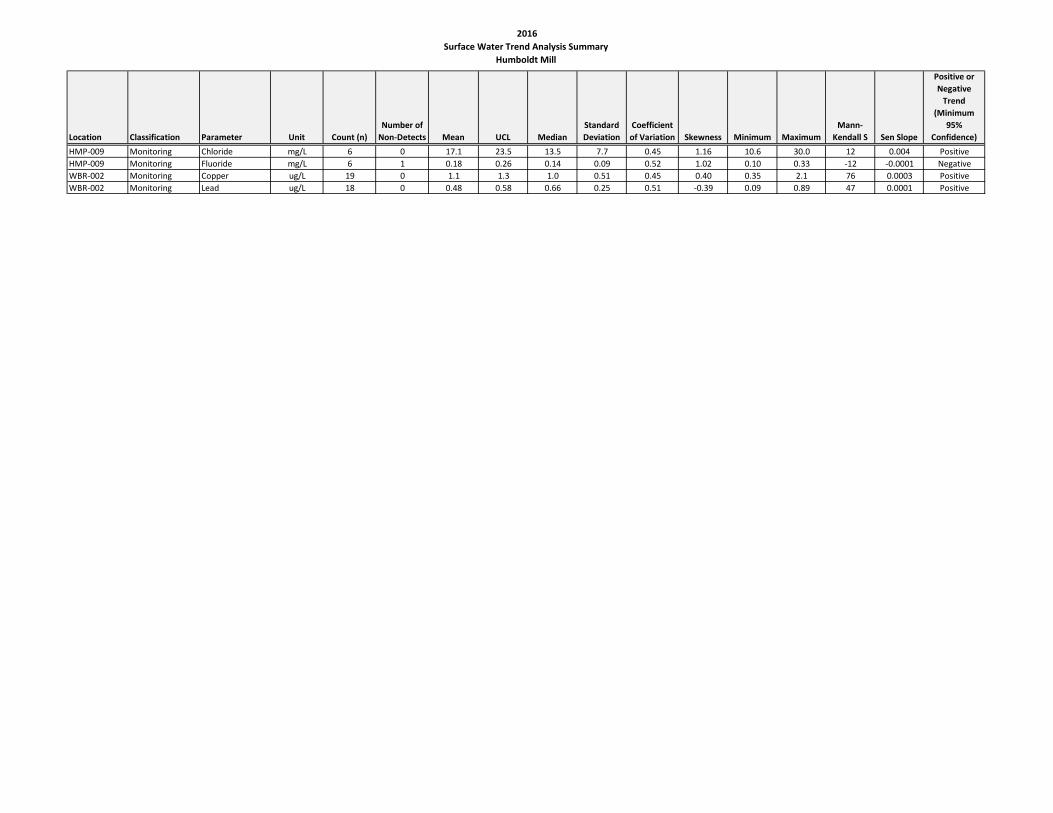
2016Surface Water Trend Analysis Summary
Humboldt Mill
Location Classification Parameter Unit Count (n)Number of
Non-Detects Mean UCL MedianStandard Deviation
Coefficient of Variation Skewness Minimum Maximum
Mann-Kendall S Sen Slope
Positive or Negative
Trend (Minimum
95% Confidence)
HMP-009 Monitoring Chloride mg/L 6 0 17.1 23.5 13.5 7.7 0.45 1.16 10.6 30.0 12 0.004 PositiveHMP-009 Monitoring Fluoride mg/L 6 1 0.18 0.26 0.14 0.09 0.52 1.02 0.10 0.33 -12 -0.0001 NegativeWBR-002 Monitoring Copper ug/L 19 0 1.1 1.3 1.0 0.51 0.45 0.40 0.35 2.1 76 0.0003 PositiveWBR-002 Monitoring Lead ug/L 18 0 0.48 0.58 0.66 0.25 0.51 -0.39 0.09 0.89 47 0.0001 Positive
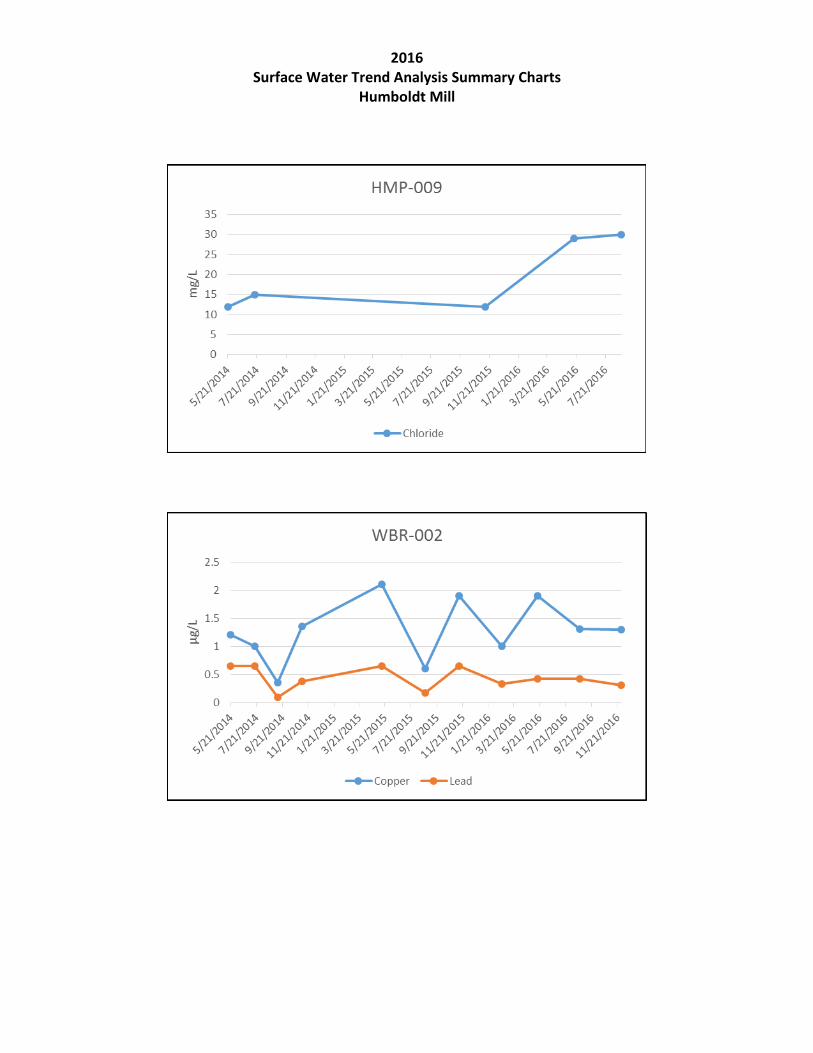
2016 Surface Water Trend Analysis Summary Charts
Humboldt Mill
Appendix K
Humboldt Mill
Sediment Results
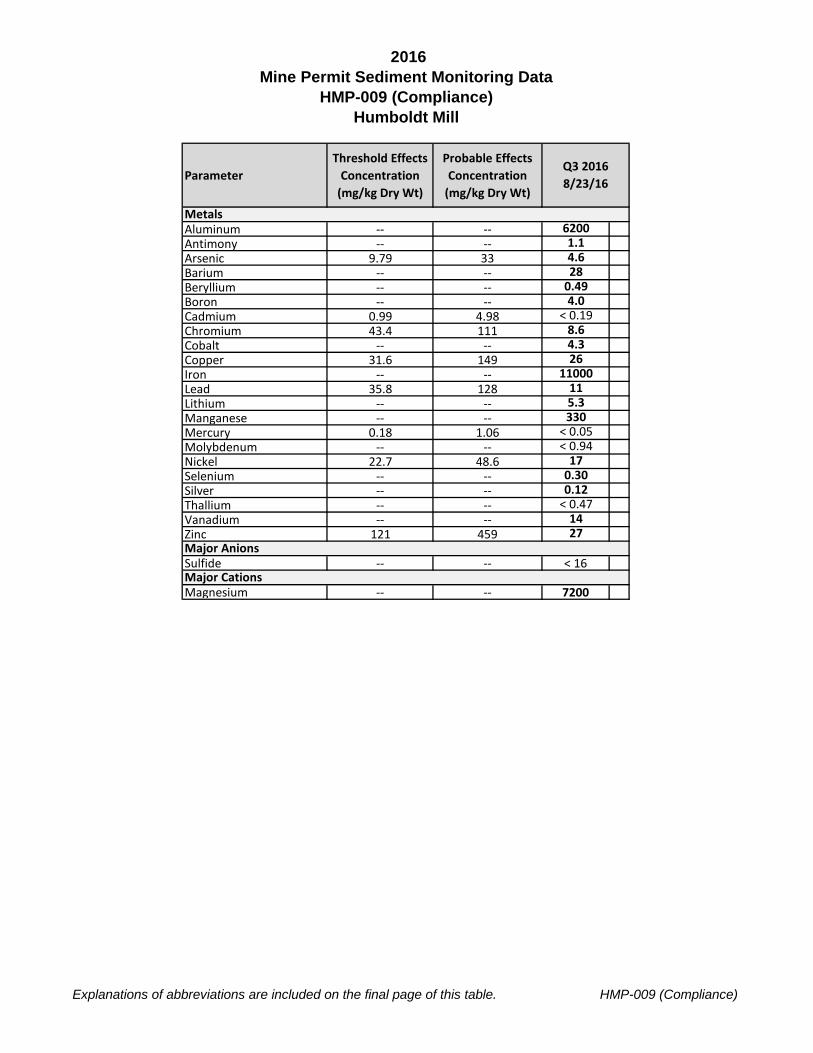
2016Mine Permit Sediment Monitoring Data
HMP-009 (Compliance)Humboldt Mill
Explanations of abbreviations are included on the final page of this table. HMP-009 (Compliance)
ParameterThreshold Effects
Concentration (mg/kg Dry Wt)
Probable Effects Concentration
(mg/kg Dry Wt)
Aluminum -- -- 6200Antimony -- -- 1.1Arsenic 9.79 33 4.6Barium -- -- 28Beryllium -- -- 0.49Boron -- -- 4.0Cadmium 0.99 4.98 < 0.19Chromium 43.4 111 8.6Cobalt -- -- 4.3Copper 31.6 149 26Iron -- -- 11000Lead 35.8 128 11Lithium -- -- 5.3Manganese -- -- 330Mercury 0.18 1.06 < 0.05Molybdenum -- -- < 0.94Nickel 22.7 48.6 17Selenium -- -- 0.30Silver -- -- 0.12Thallium -- -- < 0.47Vanadium -- -- 14Zinc 121 459 27
Sulfide -- -- < 16
Magnesium -- -- 7200
Metals
Major Anions
Major Cations
Q3 2016 8/23/16

2016Mine Permit Sediment Monitoring Data
HMWQ-004 (Compliance)Humboldt Mill
Explanations of abbreviations are included on the final page of this table. HMWQ-004 (Compliance)
ParameterThreshold Effects
Concentration (mg/kg Dry Wt)
Probable Effects Concentration
(mg/kg Dry Wt)
Aluminum -- -- 2100Antimony -- -- < 0.30Arsenic 9.79 33 3.1Barium -- -- 77Beryllium -- -- < 0.47Boron -- -- 2.5Cadmium 0.99 4.98 0.36Chromium 43.4 111 3.7Cobalt -- -- 1.6Copper 31.6 149 6.0Iron -- -- 7300Lead 35.8 128 12Lithium -- -- < 0.94Manganese -- -- 33Mercury 0.18 1.06 < 0.14Molybdenum -- -- < 0.94Nickel 22.7 48.6 3.6Selenium -- -- 0.80Silver -- -- < 0.094Thallium -- -- < 0.47Vanadium -- -- 5.5Zinc 121 459 9.4
Sulfide -- -- < 49
Magnesium -- -- 1700
Metals
Major Anions
Major Cations
Q3 2016 8/23/16
2016Mine Permit Sediment Monitoring Data
MER-001 (Reference)Humboldt Mill
Explanations of abbreviations are included on the final page of this table. MER-001 (Reference)
ParameterThreshold Effects
Concentration (mg/kg Dry Wt)
Probable Effects Concentration
(mg/kg Dry Wt)
Aluminum -- -- 3800Antimony -- -- < 0.28Arsenic 9.79 33 4.3Barium -- -- 9.9Beryllium -- -- < 0.46Boron -- -- < 0.92Cadmium 0.99 4.98 < 0.18Chromium 43.4 111 11Cobalt -- -- 3.5Copper 31.6 149 4.2Iron -- -- 8800Lead 35.8 128 1.1Lithium -- -- 5.5Manganese -- -- 71Mercury 0.18 1.06 < 0.05Molybdenum -- -- < 0.92Nickel 22.7 48.6 13Selenium -- -- < 0.18Silver -- -- < 0.092Thallium -- -- < 0.46Vanadium -- -- 12Zinc 121 459 26
Sulfide -- -- < 12
Magnesium -- -- 2000Major Cations
Metals
Major Anions
Q3 2016 8/23/16

2016Mine Permit Sediment Monitoring Data
MER-002 (Compliance)Humboldt Mill
Explanations of abbreviations are included on the final page of this table. MER-002 (Compliance)
ParameterThreshold Effects
Concentration (mg/kg Dry Wt)
Probable Effects Concentration
(mg/kg Dry Wt)
Aluminum -- -- 6100Antimony -- -- < 0.30Arsenic 9.79 33 3.8Barium -- -- 12Beryllium -- -- < 0.50Boron -- -- 1.9Cadmium 0.99 4.98 < 0.20Chromium 43.4 111 17Cobalt -- -- 5.5Copper 31.6 149 21Iron -- -- 19000Lead 35.8 128 3.2Lithium -- -- 8.1Manganese -- -- 130Mercury 0.18 1.06 < 0.05Molybdenum -- -- < 1.0Nickel 22.7 48.6 18Selenium -- -- < 0.20Silver -- -- < 0.10Thallium -- -- < 0.50Vanadium -- -- 35Zinc 121 459 30
Sulfide -- -- < 11
Magnesium -- -- 3400
Major Anions
Major Cations
Metals
Q3 2016 8/23/16

2016Mine Permit Sediment Monitoring Data
MER-003 (Compliance)Humboldt Mill
Explanations of abbreviations are included on the final page of this table. MER-003 (Compliance)
ParameterThreshold Effects
Concentration (mg/kg Dry Wt)
Probable Effects Concentration
(mg/kg Dry Wt)
Aluminum -- -- 3300Antimony -- -- 0.44Arsenic 9.79 33 6.8Barium -- -- 17Beryllium -- -- 4.2Boron -- -- 2.5Cadmium 0.99 4.98 < 0.20Chromium 43.4 111 6.3Cobalt -- -- 2.6Copper 31.6 149 5.2Iron -- -- 28000Lead 35.8 128 5.4Lithium -- -- 5.6Manganese -- -- 190Mercury 0.18 1.06 < 0.047Molybdenum -- -- < 1.0Nickel 22.7 48.6 12Selenium -- -- < 0.20Silver -- -- < 0.10Thallium -- -- < 0.50Vanadium -- -- 18Zinc 121 459 13
Sulfide -- -- < 13
Magnesium -- -- 2500
Metals
Major Anions
Major Cations
Q3 2016 8/23/16
2016Mine Permit Sediment Monitoring5Data
WBR-001 (Reference)Humboldt Mill
Explanations of abbreviations are included on the final page of this table. WBR-001 (Reference)
ParameterThreshold Effects
Concentration (mg/kg Dry Wt)
Probable Effects Concentration
(mg/kg Dry Wt)
Aluminum -- -- 3800Antimony -- -- < 0.30Arsenic 9.79 33 6.6Barium -- -- 13Beryllium -- -- < 0.50Boron -- -- < 1.0Cadmium 0.99 4.98 < 0.20Chromium 43.4 111 6.7Cobalt -- -- 2.2Copper 31.6 149 8.1Iron -- -- 15000Lead 35.8 128 4.3Lithium -- -- 4.1Manganese -- -- 440Mercury 0.18 1.06 < 0.046Molybdenum -- -- <1.0Nickel 22.7 48.6 7.6Selenium -- -- < 0.20Silver -- -- < 0.10Thallium -- -- < 0.50Vanadium -- -- 12Zinc 121 459 18
Sulfide -- -- < 15
Magnesium -- -- 1800
Metals
Major Anions
Major Cations
Q3 2016 8/23/16
2016Mine Permit Sediment Monitoring Data
WBR-002 (Compliance)Humboldt Mill
Explanations of abbreviations are included on the final page of this table. WBR-002 (Compliance)
ParameterThreshold Effects
Concentration (mg/kg Dry Wt)
Probable Effects Concentration
(mg/kg Dry Wt)
Aluminum -- -- 7800Antimony -- -- 0.49Arsenic 9.79 33 7.1Barium -- -- 26Beryllium -- -- 0.89Boron -- -- 2.6Cadmium 0.99 4.98 < 0.20Chromium 43.4 111 15Cobalt -- -- 7.3Copper 31.6 149 23Iron -- -- 28000Lead 35.8 128 11Lithium -- -- 8.4Manganese -- -- 230Mercury 0.18 1.06 < 0.050Molybdenum -- -- < 1.0Nickel 22.7 48.6 21Selenium -- -- 0.24Silver -- -- < 0.10Thallium -- -- < 0.50Vanadium -- -- 22Zinc 121 459 32
Sulfide -- -- < 16
Magnesium -- -- 2900
Metals
Major Anions
Major Cations
Q3 2016 8/23/16

2016Mine Permit Sediment Monitoring Data
WBR-003 (Compliance)Humboldt Mill
Explanations of abbreviations are included on the final page of this table. WBR-003 (Compliance)
ParameterThreshold Effects
Concentration (mg/kg Dry Wt)
Probable Effects Concentration
(mg/kg Dry Wt)
Aluminum -- -- 4500Antimony -- -- 0.33Arsenic 9.79 33 18Barium -- -- 30Beryllium -- -- 0.0Boron -- -- 2.7Cadmium 0.99 4.98 0.21Chromium 43.4 111 11Cobalt -- -- 4.3Copper 31.6 149 14Iron -- -- 21000Lead 35.8 128 6.3Lithium -- -- 4.8Manganese -- -- 250Mercury 0.18 1.06 0.055Molybdenum -- -- 1.8Nickel 22.7 48.6 12Selenium -- -- 0.73Silver -- -- < 0.10Thallium -- -- < 0.50Vanadium -- -- 19Zinc 121 459 37
Sulfide -- -- < 31
Magnesium -- -- 1600.0
Metals
Major Anions
Major Cations
Q3 2016 8/23/16
2016Mine Permit Sediment Quality Monitoring Data
Abbreviations & Data QualifiersHumboldt Mill
Explanations of abbreviations are included on the final page of this table. Abbreviations & Data Qualifiers
Highlighted Cell = Value is equal to or greater than the TEC or PEC established for the parameter.
Notes:Threshold Effects Concentration (TEC) and Probable Effects Concentration (PEC) are consensus based guidelines developed by D.D. MacDonald, C.G. Inersol, T.A. Berger and published in the Archives of Environmental Contamination and Toxicology, "Development and Evaluation of Consensus Based Sediment Quality Guidelines for Freshwater Ecosystems, " January 2000. Results in bold text indicate that the parameter was detected at a level greater than the laboratory reporting limit.
--Denotes no TEC or PEC is established for the parameter
Appendix L
Humboldt Mill
Groundwater Hydrographs
2016 Groundwater Hydrographs Humboldt Mill
Notes: The large drops in water level are associated with the location being pumped down in preparation of sampling.
Notes: The large drops in water level are associated with the location being pumped down in preparation of sampling.
1430
1450
1470
1490
1510
1530
1550W
ater
Ele
vatio
n (ft
MSL
)HW-1L
GW Elevation HTDF Elevation
1400
1420
1440
1460
1480
1500
1520
1540
Wat
er E
leva
tion
(ft M
SL)
HW-1U LLA
GW Elevation HTDF Elevation
2016 Groundwater Hydrographs Humboldt Mill
Notes: The noticeable drops in groundwater elevation at HW-1U UFB are associated with sampling events.
1524152515261527152815291530153115321533
Wat
er E
leva
tion
(ft M
SL)
HW-1U UFB
GW Elevation HTDF Elevation
1529
1529.5
1530
1530.5
1531
Wat
er E
leva
tion
(ft M
SL)
HW-2
GW Elevation HTDF Elevation
2016 Groundwater Hydrographs Humboldt Mill
Notes: The noticeable drops in groundwater elevation at HW-1U UFB are associated with sampling events.
Notes: The noticeable drops in groundwater elevation at HYG-1 are associated with sampling events.
15151517151915211523152515271529153115331535
Wat
er E
leva
tion
(ft M
SL)
HW-8U
GW Elevation HTDF Elevation
1529
1530
1531
1532
1533
1534
1535
Wat
er E
leva
tion
(ft M
SL)
HYG-1
GW Elevation HTDF Elevation
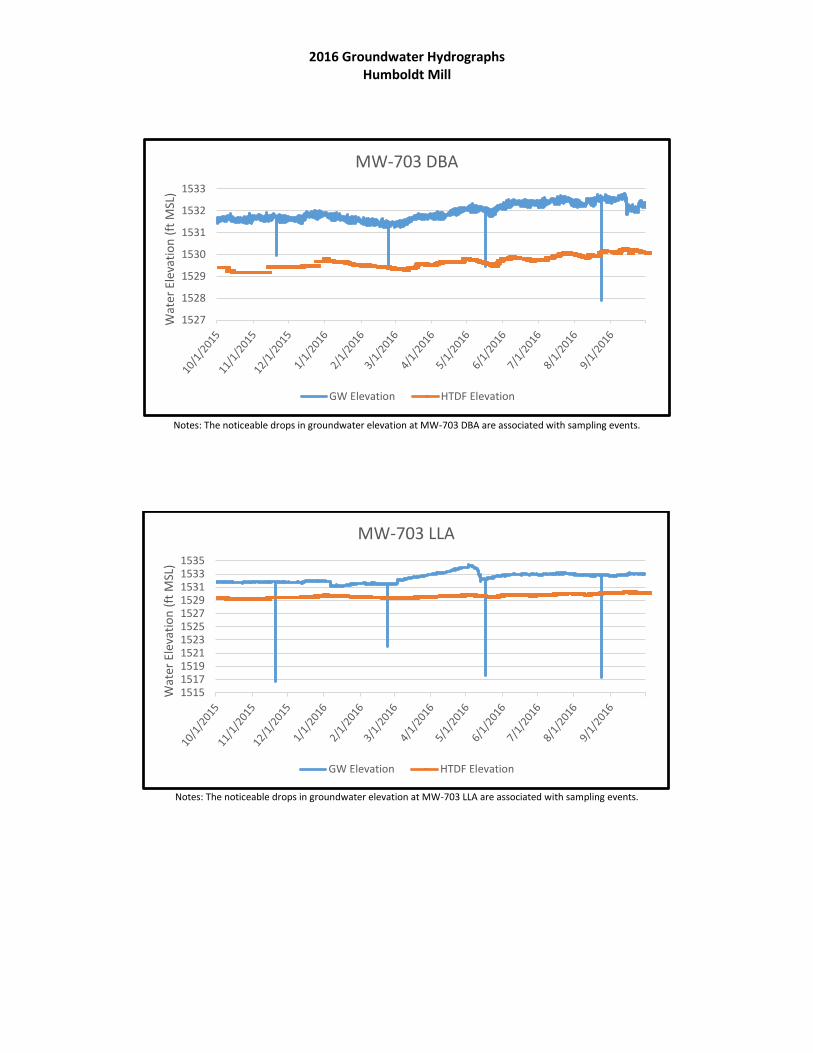
2016 Groundwater Hydrographs Humboldt Mill
Notes: The noticeable drops in groundwater elevation at MW-703 DBA are associated with sampling events.
Notes: The noticeable drops in groundwater elevation at MW-703 LLA are associated with sampling events.
1527
1528
1529
1530
1531
1532
1533W
ater
Ele
vatio
n (ft
MSL
)MW-703 DBA
GW Elevation HTDF Elevation
15151517151915211523152515271529153115331535
Wat
er E
leva
tion
(ft M
SL)
MW-703 LLA
GW Elevation HTDF Elevation
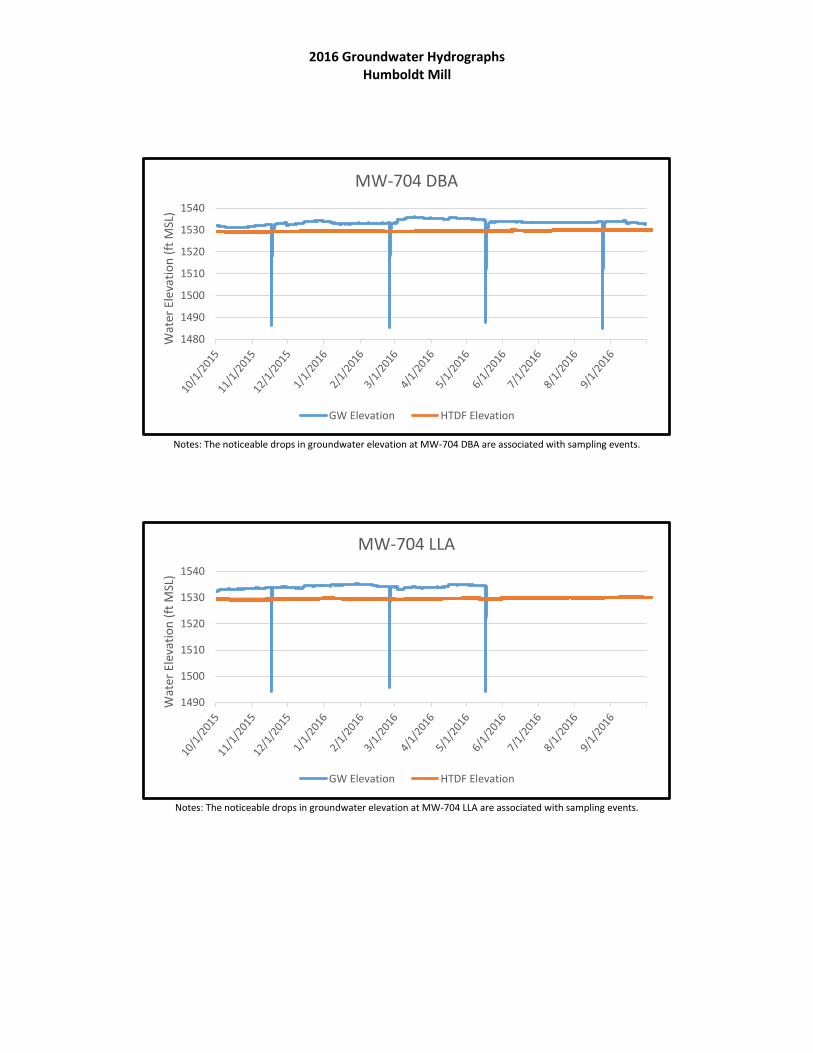
2016 Groundwater Hydrographs Humboldt Mill
Notes: The noticeable drops in groundwater elevation at MW-704 DBA are associated with sampling events.
Notes: The noticeable drops in groundwater elevation at MW-704 LLA are associated with sampling events.
1480
1490
1500
1510
1520
1530
1540
Wat
er E
leva
tion
(ft M
SL)
MW-704 DBA
GW Elevation HTDF Elevation
1490
1500
1510
1520
1530
1540
Wat
er E
leva
tion
(ft M
SL)
MW-704 LLA
GW Elevation HTDF Elevation
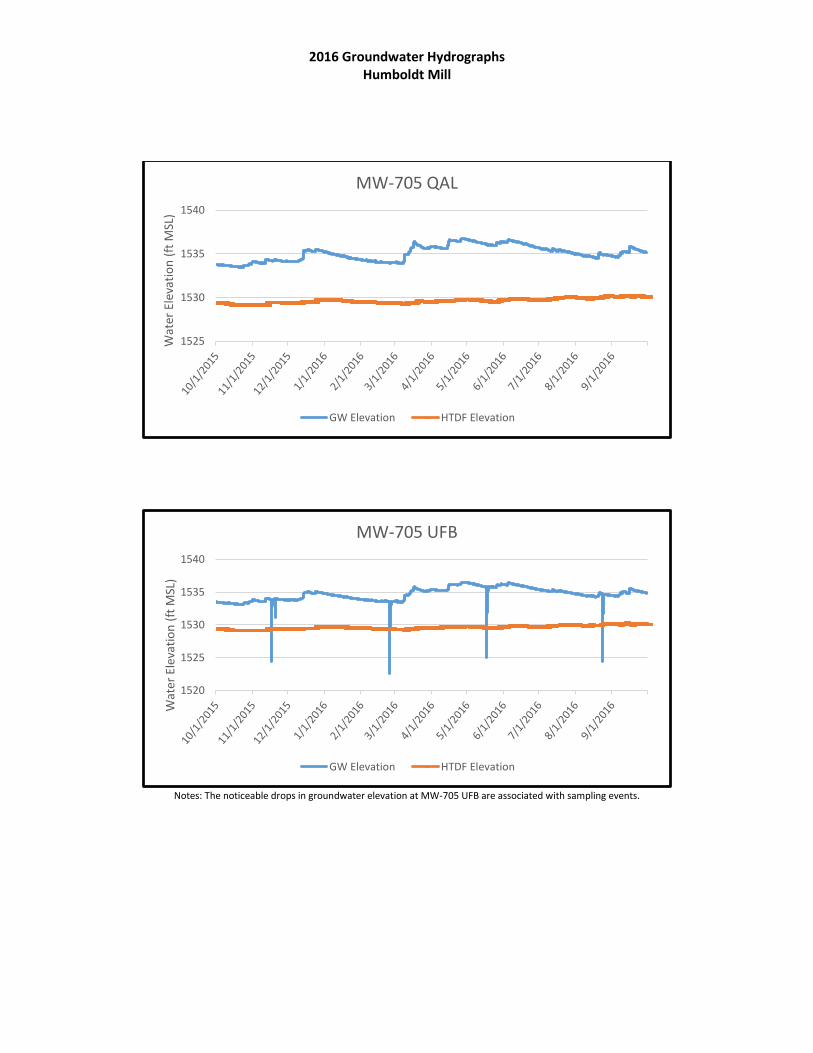
2016 Groundwater Hydrographs Humboldt Mill
Notes: The noticeable drops in groundwater elevation at MW-705 UFB are associated with sampling events.
1525
1530
1535
1540
Wat
er E
leva
tion
(ft M
SL)
MW-705 QAL
GW Elevation HTDF Elevation
1520
1525
1530
1535
1540
Wat
er E
leva
tion
(ft M
SL)
MW-705 UFB
GW Elevation HTDF Elevation
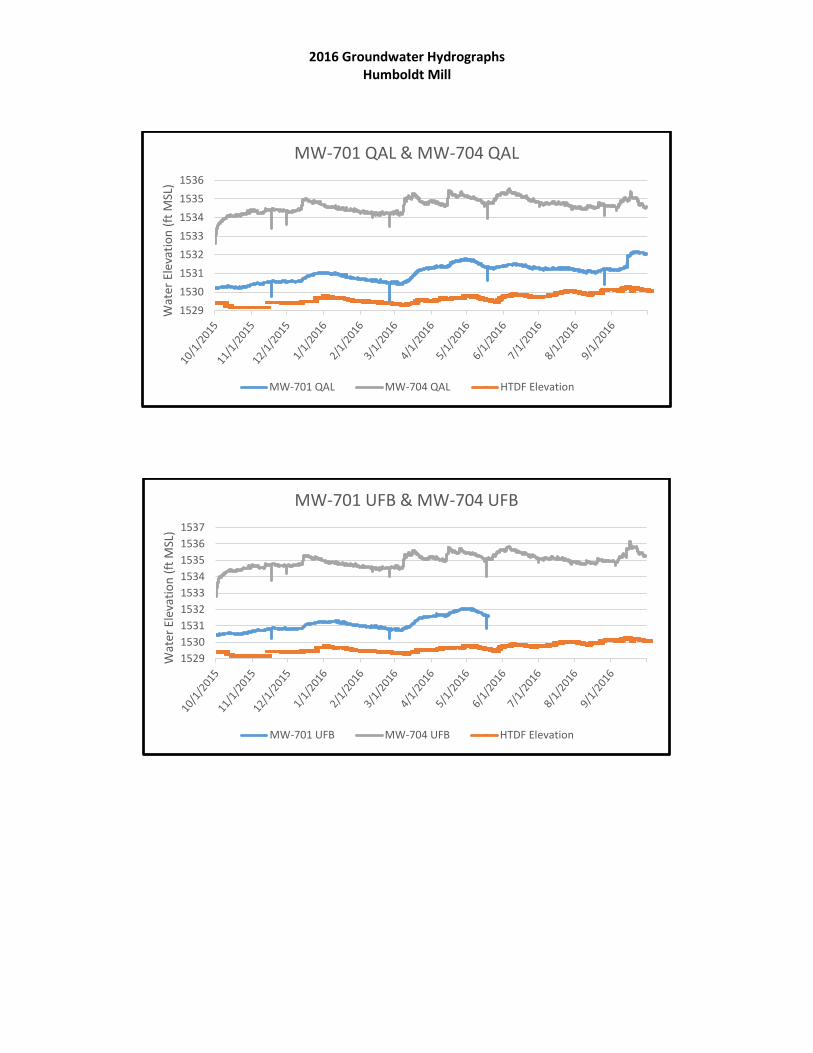
2016 Groundwater Hydrographs Humboldt Mill
15291530153115321533153415351536
Wat
er E
leva
tion
(ft M
SL)
MW-701 QAL & MW-704 QAL
MW-701 QAL MW-704 QAL HTDF Elevation
152915301531153215331534153515361537
Wat
er E
leva
tion
(ft M
SL)
MW-701 UFB & MW-704 UFB
MW-701 UFB MW-704 UFB HTDF Elevation
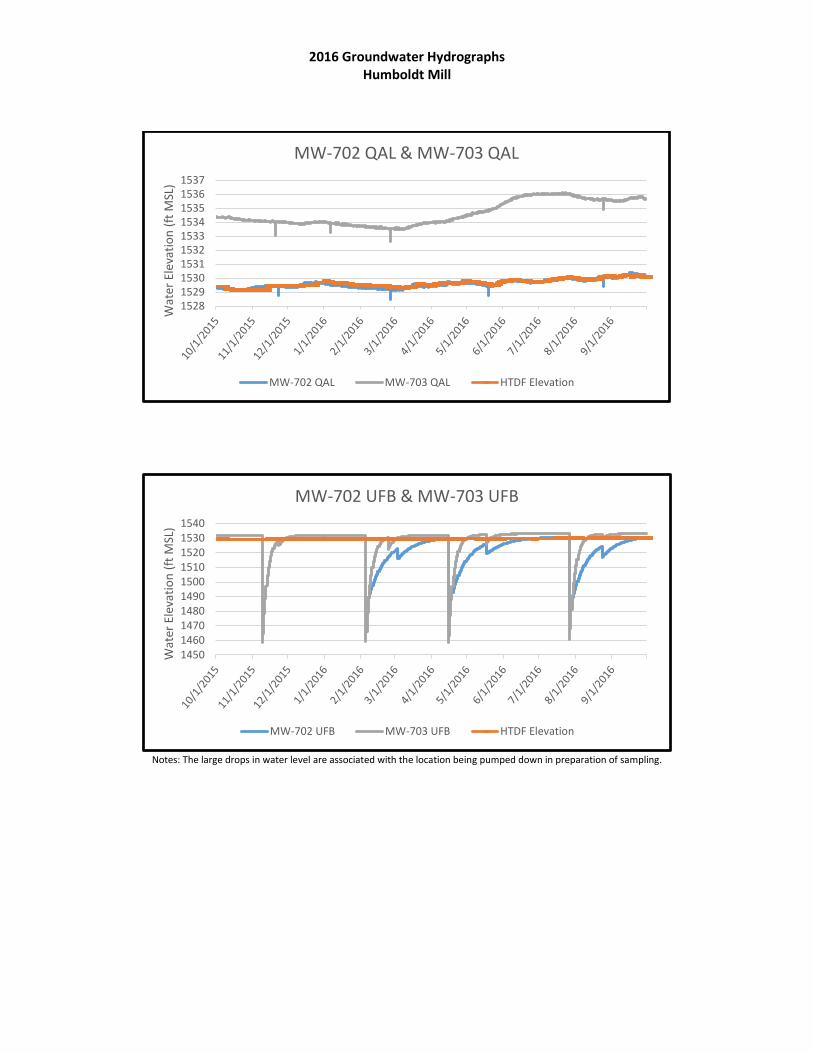
2016 Groundwater Hydrographs Humboldt Mill
Notes: The large drops in water level are associated with the location being pumped down in preparation of sampling.
1528152915301531153215331534153515361537
Wat
er E
leva
tion
(ft M
SL)
MW-702 QAL & MW-703 QAL
MW-702 QAL MW-703 QAL HTDF Elevation
1450146014701480149015001510152015301540
Wat
er E
leva
tion
(ft M
SL)
MW-702 UFB & MW-703 UFB
MW-702 UFB MW-703 UFB HTDF Elevation
Appendix M
Humboldt Mill
Flora & Fauna Survey Location Maps
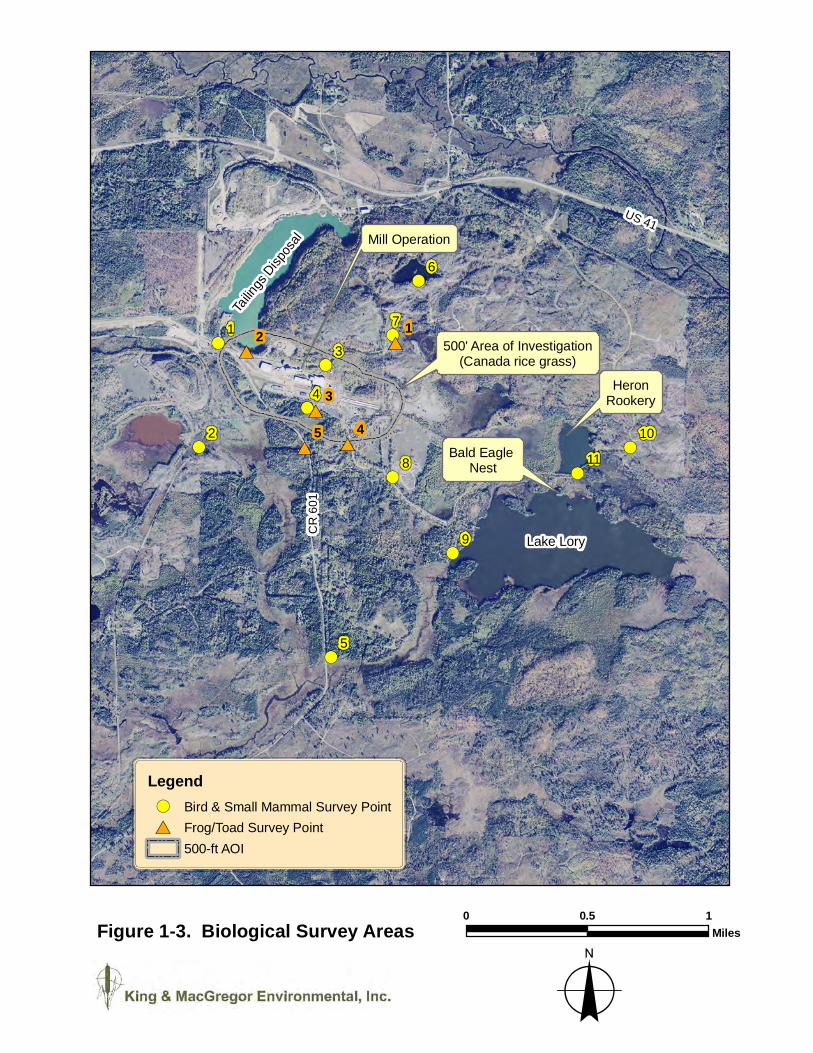
!(
!(
!(
!(
!( !(
!(!(
!(
!(
!(#*
#*
#* #*
#*
Lake Lory
1
45
3
23
5
9
8
2
4
7
6
1
11
10
Tailin
gs D
ispos
al
US 41Mill Operation
Figure 1-3. Biological Survey Areas
Legend!( Bird & Small Mammal Survey Point#* Frog/Toad Survey Point
500-ft AOI
0 10.5Miles
o
Bald Eagle Nest
HeronRookery
CR
601
500' Area of Investigation(Canada rice grass)
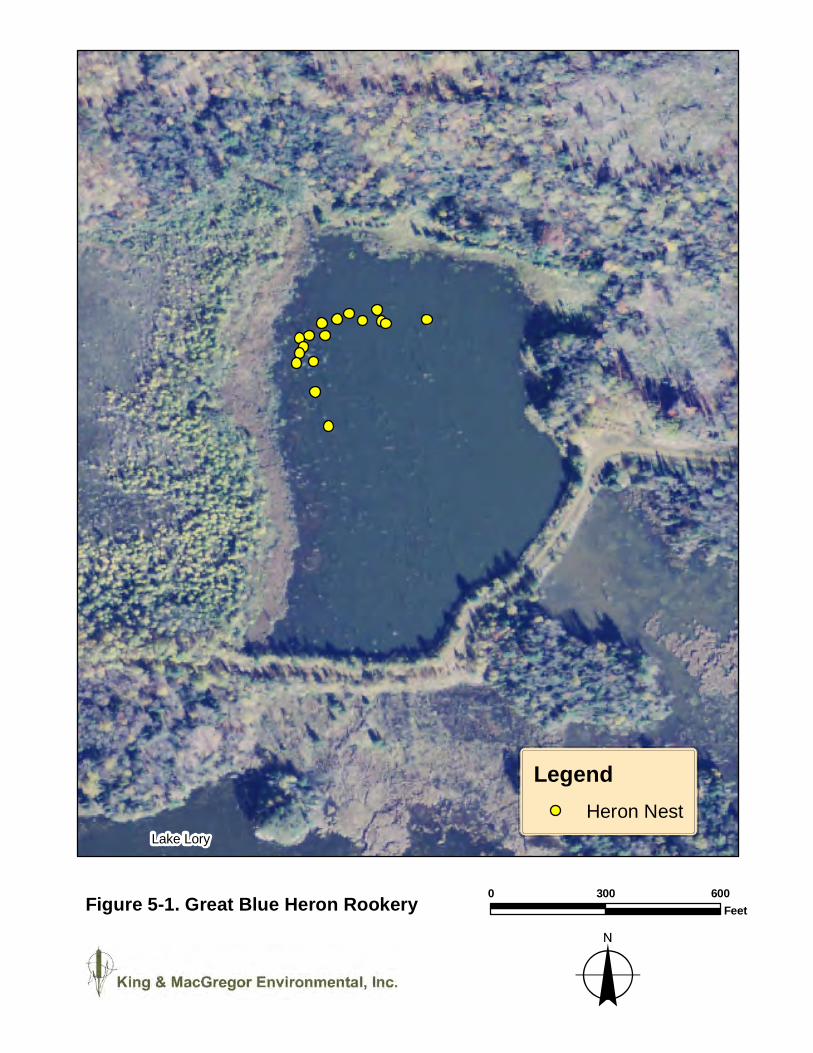
Figure 5-1. Great Blue Heron Rookery 0 600300Feet
o
LegendHeron Nest
Lake Lory
Appendix N
Humboldt Mill
Aquatic Survey Location Maps
0
PROJECT
TITLE
FIGURE
Station MBER2
Station MBER1
Station 5
Station 1
Wetland Complex EE
Middle BranchEscanaba River
US41
US41
CR FX
CR 95
Lake Lory
Exisiting MillBuildings
Humboldt Mill - Eagle Mine
Sample Station Locations
1-2
±Legend
Wetland Complex EE Station
Stream Sample Station Locations
0 1,750 3,500 5,250 7,000875Feet
Aerial imagery obtained from Michigan Center for GeographicInformation (http://www.michigan.gov/cgi/)
"
"
"
"
"
"
# #
#
PROJECT
TITLE
FIGURE
Legend" Fyke Net Locations
# Gill Net Locations
Electroshocker Transect Locations
Aerial imagery obtained from Michigan Center for Geographic Information (http://www.michigan.gov/cgi/)
0 550 1,100 1,650 2,200275Feet
±
Lake Lory
Humboldt Mill - Eagle Mine
Lake Lory Gear Locations
1-3
Appendix O
Humboldt Mill
Contingency Plan Update
Humboldt Mill • 1 Contingency Plan – 2016 Update
1 Contingency Plan – Humboldt Mill
This contingency plan addresses requirements defined in R 425.205. This includes a qualitative assessment of the risk to public health and safety or the environment (HSE risks) associated with potential accidents or failures involving activities with the Eagle Project. Engineering or operational controls to protect human health and the environment are discussed in Section 4 and Section 5 of this document. The focus of this contingency plan is on possible HSE risks and contingency measures. Possible HSE risks to on-site workers will be addressed by Eagle Mine through HSE procedures in accordance with Occupational Safety and Health Administration (OSHA) and Mine Safety and Health Administration (MSHA) requirements.
The Humboldt Mill involves processing ore, as well as storing and treating by-products of that process. The milling, storage, and treatment facilities have been designed, constructed, and are operated in a manner that is protective of the environment through the use of proven technologies and engineering practices.
1.1 Contingency Items
This contingency plan addresses the items listed below in this Section in accordance with R 425.205 (1)(a)(i) - (xii).
• Release or threat of release of toxic or acid-forming materials • Storage, transportation and handling of explosives • Fuel storage and distribution • Fires • Wastewater collection and treatment system • Air emissions • Spills of hazardous substances • Other natural risks defined in the EIA • Power disruption, and • Leaks from containment systems for stockpiles or disposal and storage facilities.
For each contingency item, a description of the risk is provided, followed by a qualitative assessment of the risk(s) to the environment or public health and safety. Next, the response measures to be taken in the event of an accident or failure are described.
1.1.1 Release of Toxic or Acid-Forming Materials Potentially reactive materials generated as a result of processing operations include ore concentrate and tailings. Both materials have the potential to leach metals constituents when exposed to air and water. As described in the following sub-sections, handling and temporary storage of both the ore concentrate and tailings have been carefully considered in the design of the Humboldt Mill so as to prevent the uncontrolled release of acid rock drainage (ARD).
Humboldt Mill • 2 Contingency Plan – 2016 Update
1.1.1.1 Coarse Ore Storage Area (COSA) and Concentrate Load-Out (CLO) Areas
Potential environmental risks associated with the COSA is the release of contact water to the environment via cracks in the floor areas or collection sumps. The COSA is a steel sided building with a full roof that is used for temporary storage of stockpiled coarse ore that has been transported from the mine and is awaiting crushing. The COSA has a concrete floor that is sloped to keep any water associated with the ore inside the facility. The lower level of the facility is equipped with an epoxy lined sump and any water collected is pumped to the Humboldt Tailings Disposal Facility (HTDF) for eventual treatment by the water treatment plant. Contingency planning for this facility includes timely repair of cracks in the floors and walls that could allow the release of material into the environment. An impermeable surface inspection plan has been developed and describes procedures for routine impermeable surface inspections, preventative and remedial actions as well as documentation procedures. Also, in accordance with Air Permit (No. 405-08) all overhead doors must be closed during loading or unloading of ore and a watering program is in place to minimize the generation of dust. 1.1.1.2 Concentrate Load-Out (CLO)
Potential environmental risks associated with the CLO is the release of acid generating material via track out and fugitive emissions. The CLO is a steel sided building with a full roof that is used for temporary storage of stockpiled nickel and copper concentrate prior to loading the material into railcars destined for customers. The CLO has concrete floors and does not contain any floor drains as water use is discouraged in this area. Contingency planning for this facility includes timely repair of cracks in the floors and walls that could allow the release of material into the environment. An impermeable surface inspection plan has been developed and describes procedures for routine impermeable surface inspections, preventative and remedial actions as well as documentation procedures. Also, in accordance with Air Permit (No. 405-08) all overhead doors must be closed during loading operations and a sweeping program in place to minimize the generation of dust and track out of material. Track out is also managed in accordance with procedures outlined in the facilities Standard operating procedures and includes inspecting and removing any residual concentrate from the exterior of the railcars prior to leaving the facility.
1.1.1.3 Humboldt Tailings Disposal Facility (HTDF)
Potential contaminant release from the HTDF could be waters having elevated metal concentrations that impact surface water or groundwater quality. The HTDF is a former open pit mine that was allowed to fill with water. Process tailings are sub-aqueously disposed which is industry best practice for materials that could be potentially acid generating. The anoxic environment minimizes the potential for generation of ARD. The HTDF was originally comprised of bedrock walls on three sides and alluvial soils on the north end in which water was allowed to naturally flow into the nearby wetland. A cut-off wall has been installed on the north end to prevent the release of water from the HTDF through the alluvial soils. Therefore, groundwater quality surrounding the HTDF will not be influenced by HTDF operations. Natural discharges from the HTDF have been essentially eliminated and any water that leaves the HTDF must now pass through the water treatment plant prior to discharge into the environment. Surface water discharge from the HTDF will be treated through the water treatment plant prior to discharge to a nearby wetland. In addition, the installation of the cut-off wall in the alluvial soils along the north perimeter of the HTDF will prevent release to the groundwater.
Humboldt Mill • 3 Contingency Plan – 2016 Update
Groundwater seeps from the HTDF will not occur due to the low permeability of the surrounding Precambrian geologic formation. Furthermore, groundwater and surface water quality and elevations/flow will be routinely monitored in accordance with the Part 632 Mining and NPDES permits and will quickly identify changes to surrounding water quality that would be indicative of groundwater release from the HTDF. Contingency planning from an unlikely groundwater release from the HTDF includes:
• Identify the nature and extent of the release, • Implement additional monitoring to ascertain extent of release, • Develop a remedial action plan to bring facility back into compliance, • Implement remedial action plan.
Specific details of the remedial action plan would be developed based upon the nature of the release and with agreements with the MDEQ. As a further contingency against groundwater seepage from the HTDF, the operating level has been lowered to a level below that of the adjacent wetland creating a reverse gradient that does not facilitate the movement of water from the HTDF to the adjoining wetlands. The lower operating level of the HTDF also provides for additional freeboard in the event of a significant weather event or operational situation that results in the inability to operate the WTP and discharge water. Eagle will monitor water quality in the HTDF during operations and post-closure. The WTP and associated infrastructure will remain in place for five years after tailings disposal has ceased. If monitoring indicated that there are elevated metals in the HTDF that could impact surface water one of the following treatment options may be implemented:
• Continue the treatment of the HTDF water through the WTP until water quality conditions in the HTDF meet surface water standards; and/or
• Amend the HTDF with appropriate reagents to reduce elevated metal parameters in order to meet surface water standards.
Specific reagents and application rate(s) would be identified upon determination of elevated metal parameters of concern. Past phosphate seeding of HTDF by previous owners was shown to be effective for nickel concentration reduction. Alum could also be used as a flocculent to enhance metal precipitation thereby improving water quality. 1.1.1.4 Tailings Transport System
Tailings are transported to the HTDF via slurry contained within a double-cased HDPE pipe conveyance system. The pipe conveyance system consists of a 4-in diameter carrier pipe within an 8-in outer containment pipe. Two tailings lines are available for use, but only one is utilized at a time. In addition, the tailings lines are equipped with a leak detection system; any water released into the outer piping would drain to the shore vault and trigger an alarm, notifying operations of a potential system breach. The shore vault is also visually inspected twice per day (once per shift) by operators and the Environmental Department checks the tailings lines for signs of leakage once per week. If a breach is identified, the slurry pumps will be shut-down until the source of breach is identified and repaired. The contingency plan for moving tailings to the HTDF facility is to use the second set of tailings lines that are already in place. In the event both lines were down, they could either be pumped into a truck with a sealed cargo area or the tailings will be held within the plant thickener vessel until the pipeline is repaired.
Humboldt Mill • 4 Contingency Plan – 2016 Update
1.1.2 Storage, Transportation and Handling of Chemicals
Potential risks associated with chemical use include surface and groundwater quality impacts. Chemicals are brought to the site by certified chemical haulers, meeting MDOT transportation requirements. Storage of these chemicals are provided in secure locations within building(s) or outdoor bulk storage silos designed for that application. Transferring chemicals is conducted by qualified site personnel. Bulk granular products are conveyed pneumatically to the storage silos. Specific procedures for chemical storage and emergency response procedures are included in the facilities Pollution Incident Prevention Plan (PIPP). Because chemicals will be stored in secure areas, the potential for release into the environment is very remote. If a breach of contaminant vessel does occur, the chemical will be contained within the secondary containment area. The spill or release will be immediately cleaned using appropriate methods specified in the Safety Data Sheets (SDS). SDS are maintained on-site for all chemicals. 1.1.3 Fuel Storage and Distribution
There is currently one 4,000 gallon diesel mobile fueling truck located onsite. This truck is used to fuel all mobile equipment onsite. A fuel provider refills this fuel truck on an as needed basis. The fuel truck is parked on an asphalt surface in which any spills or leaks would be captured in a catch basin and routed to the HTDF. In general, fuel spills and leaks will be minimized by the following measures:
• A Spill Prevention Control and Countermeasures Plan (SPCC) has been written and implemented.
• Training of personnel responsible for handling fuel in proper procedures and emergency response;
• Regular equipment inspections and documentation of findings, and • Staging of on-site emergency response equipment to quickly respond to unanticipated spills
or leaks.
Specific procedures have been prepared as part of the project’s SPCC Plan. In addition, a PIPP has been prepared which addresses potential spillage of fuels and other polluting materials. Diesel fuel and propane (fuels) are transported to the Eagle Project by tanker truck from local petroleum distributors. The probability of an accidental release during transportation will be dependent on the location of the supplier(s) and the frequency of shipment. A fuel release resulting from a vehicular accident during transportation is judged to be a low probability event. Transport of fuel in tanker trucks does not pose an unusual risk to the region since tanker trucks currently travel to the region on a regular basis to deliver fuels to gasoline stations located in the communities surrounding the Eagle Mine. Three potential release events associated with the surface-stored fuels are a bulk tank failure, mishandling/leaking hoses, and a construction/reclamation phase release. Bulk Tank Failure – A release may result from a failure of the storage tank on the fuel truck. This type of release is judged to be low probability as the vehicle is inspected on a daily basis prior to use for signs of leakage or potential failure. In addition, as stated above the fuel truck is parked and utilized in locations in which asphalt is present and any spills would be directed to catch basins or sumps in which the fuel would be directed to the HTDF and not to an offsite or unprotected surface location. In addition, a spill
Humboldt Mill • 5 Contingency Plan – 2016 Update
response trailer is located onsite and contains spill containment and clean-up equipment in the event of a spill. Eagle also has a spill response contractor on call to immediately respond to situations that cannot be handled by onsite personnel. Mishandling/Leaking Hoses - A release might result from leaking hoses or valves, or from operator mishandling. This type of release is likely to be small in volume and is judged to be a low probability event given that operators will be trained to manage these types of potential releases. These small spills will be cleaned up by using on-site spill response equipment such as absorbent materials and/or removing impacted soils. Construction/Reclamation Phase Release - A major fuel spill during the construction or reclamation phases could occur from a mobile storage tank failure or mishandling of fuels. Such a release is also considered to be a low probability event given that operators will be trained to manage these types of potential releases and all tanks are required to have secondary containment. As with mishandling or leaking hoses, these small spills will be cleaned up by using on-site spill response equipment such as absorbent materials and/or removing impacted soils. Absorptive materials may be used initially to contain a potential spill. After the initial response, soil impacted with residual fuel would be addressed. Remedial efforts could include, if necessary, the removal of soil to preclude migration of fuel to groundwater or surface water. The project's PIPP and SPCC plans addresses fueling operations, fuel spill prevention measures, inspections, training, security, spill reporting, and equipment needs. In addition standard operating procedures have been developed which cover fueling operations and spill response activities. All responses to a fuel spill, both large and small, will follow the guidelines dictated by the spill response plan and be reported internally. The tanks will be inspected regularly, and records of spills will be kept and reported to MDEQ and other agencies as required. Contingency plans for responding to fuel spills from tanker trucks are required of all mobile transport owners as dictated by Department of Transportation (DOT) regulation 49 CFR 130. These response plans require appropriate personnel training and the development of procedures for timely response to spills. The plan must identify who will respond to the spill and describe the response actions to potential releases, including the complete loss of cargo. The plan must also list the names and addresses of regulatory contacts to be notified in the event of a release.
1.1.4 Fires
Surface fires can be started by a variety of causes including vehicular accidents, accidental ignition of fuels or flammable chemical reagents, and lightning strikes. Smoking is only allowed in designated areas on the site. Contingency measures include having the required safety equipment, appropriate personnel training and standard operating procedures. Given these measures, uncontrolled or large surface fires are considered a low probability event with negligible risk. Because the Humboldt Mill is situated in a forested region, forest fires started off-site could potentially impact the mill site. The cleared area in the vicinity of the surface facilities serves as a fire break to protect surface facilities. Contingency measures discussed below can be implemented in the event of an off-site forest fire. In order to minimize the risk of a fire on-site, stringent safety standards are being followed. All vehicles/equipment are required to be equipped with fire extinguishers and all personnel trained in their
Humboldt Mill • 6 Contingency Plan – 2016 Update
use. Water pipelines and network of fire hydrants have been installed throughout the site and additional fire extinguishers are also located in high risk areas. On-site firefighting equipment includes an above ground water storage tank and distribution system for fire suppression. At Humboldt Mill a Wildfire Response Guideline has been developed in conjunction with Michigan DNR Fire Division to ensure the best possible response to a wildland fire. Contingency planning for managing materials that oxidize includes training equipment operators on the material characteristics. Because the concentrate is only present for short periods of time in either the mill building or concentrate load-out building, and given that the concentrate will have a moisture content of at least 15%, the likelihood of an oxidation is very remote. The temperature of the material is routinely measured and any material exhibiting signs of self-heating is immediately compacted or exposed and spread out depending on the situation. 1.1.5 Wastewater Collection and Treatment
The major source of water from the facility requiring treatment is process water and tailings, groundwater infiltration into the HTDF, precipitation, and storm water runoff. The HTDF is sized to provide wastewater storage and equalization capacity. Water from the HTDF is conveyed to the WTP which is comprised of several unit processes, including: metals precipitation, ultra-filtration and reverse-osmosis filtration (when necessary). The final product water is discharged to a nearby wetland area. This discharge is authorized by the State of Michigan under an NPDES permit. The water treatment system is designed to handle various process upset conditions such as power disruption (Section 1.1.9) or maintenance of the various process units. The effluent is continually monitored for key indicator parameters to verify the proper operation. Effluent not meeting treatment requirements is pumped back to the HTDF for re-treatment. The water level of the HTDF is maintained at a level that provides ample storage capacity that would allow for sufficient time to correct a process upset condition. Potential hazards and chemical reagents associated with the WTP are discussed in Section 1.1.7. 1.1.6 Air Emissions
The operation and reclamation phases of the project will be performed in a manner to minimize the potential for accidents or failures that could result in off-site air quality impacts. All phases of the project will incorporate a combination of operating and work practices, maintenance practices, emission controls and engineering design to minimize potential accidents or failures. Below is a description of identified areas of risk and associated contingency measures that may be required. As part of a comprehensive environmental control plan, these contingency measures will assist in minimizing air impacts to the surrounding area.
1.1.6.1 Air Emissions during Operations
During operation of the mine, potential emissions from the facility will be controlled as detailed in the project’s current Michigan Air Use Permit (No. 405-08). These controls include use of building enclosures for material handling, installation of dust collection or suppression systems such as baghouses or water sprays to control dust during ore crushing and transfer operations and following prescribed preventive maintenance procedures for the facility. Tailings generated during the milling process are slurried to the HTDF and therefore will not generate particulate matter. Ore brought from off-site is transported in covered trucks to minimize dust emissions. Below is a more detailed discussion of potential airborne risks associated with proposed operations at the facility.
Humboldt Mill • 7 Contingency Plan – 2016 Update
To minimize dust emissions from the COSA and concentrate load-out building, these areas are fully enclosed. Ore transported from the mine site may only be dumped in the COSA when the doors are closed to minimize dust emissions from the building. Water sprays are used at the primary crusher, rock breaker, and conveyor transfer points located in the conveyor transfer station and mill building. Fabric filter baghouses are used throughout the facility to minimize emissions of dust. Bag houses are located in the Secondary Crusher building and the Fine Ore Bins. Two insertable filter systems are installed in the transfer building. Baghouse malfunction is a possibility and can include a bag break or offset and excessive dust loading. These potential malfunctions are addressed in the malfunction prevention and abatement plan. The plan includes regular inspections and maintenance activities of dust collection and suppression systems which is accomplished through monitoring of pressure drop across the bags, monitoring of gas flow, and visual observations of stack emissions to assess opacity per permit conditions. In the event the monitoring program indicates a malfunction, a thorough investigation of the cause will occur. If necessary, ore processing operations will be shut down until the problem is corrected. During facility operations, Eagle Mine will utilize certain pieces of mobile equipment to move material about the site. Equipment includes front end loaders, product haul trucks, and miscellaneous delivery trucks. Although the movement of most vehicles across the site is on asphalt surfaces, a comprehensive on-site sweeping and watering program has been developed to control potential fugitive sources of dust. If excessive dust emissions should occur, the facility will take appropriate corrective action, which may include intensifying and/or adjusting the sweeping/watering program to properly address the problem. 1.1.6.2 Air Emissions during Reclamation
Once milling operations are completed at the site, reclamation will commence in accordance with R 425.204. Similar to construction activities, there is a moderate risk fugitive dust emissions could be released during certain re-vegetation activities and during temporary storage of materials in stockpiles. Similar to controls employed during the construction phase, areas that are reclaimed will be re-vegetated to stabilize soil and reduce dust emissions. If severe wind or an excessive rain event reduces the effectiveness of these protective measures, appropriate action will take place as soon as possible to restore vegetated areas to their previous effectiveness and replace covers as necessary. To the extent necessary, areas being reclaimed will be kept in a wet state by continuing the watering program. It is anticipated this program should minimize the possibility of excessive dust associated with mobile equipment. In the event fugitive dust is identified as an issue, corrective action will determine the cause of the problem and appropriate action will occur. 1.1.7 Spills of Hazardous Substances
Chemical reagents onsite are primarily used for the ore flotation and water treatment plant processes. Table 1.1.8 includes a list of reagents reported under the SARA Tier II Emergency and Hazardous Chemical Inventory that are being used onsite along with the approximate storage volumes and storage location.
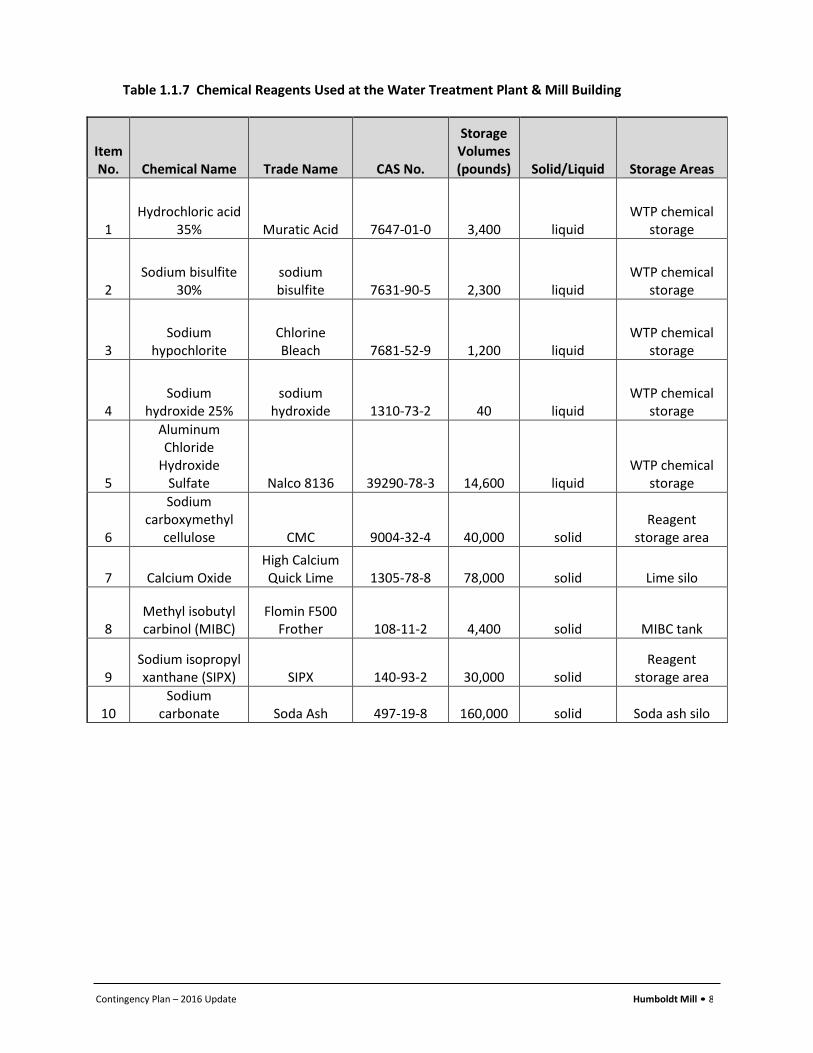
Humboldt Mill • 8 Contingency Plan – 2016 Update
Table 1.1.7 Chemical Reagents Used at the Water Treatment Plant & Mill Building
Item No. Chemical Name Trade Name CAS No.
Storage Volumes (pounds) Solid/Liquid Storage Areas
1 Hydrochloric acid
35% Muratic Acid 7647-01-0 3,400 liquid WTP chemical
storage
2 Sodium bisulfite
30% sodium bisulfite 7631-90-5 2,300 liquid
WTP chemical storage
3 Sodium
hypochlorite Chlorine Bleach 7681-52-9 1,200 liquid
WTP chemical storage
4 Sodium
hydroxide 25% sodium
hydroxide 1310-73-2 40 liquid WTP chemical
storage
5
Aluminum Chloride
Hydroxide Sulfate Nalco 8136 39290-78-3 14,600 liquid
WTP chemical storage
6
Sodium carboxymethyl
cellulose CMC 9004-32-4 40,000 solid Reagent
storage area
7 Calcium Oxide High Calcium Quick Lime 1305-78-8 78,000 solid Lime silo
8 Methyl isobutyl carbinol (MIBC)
Flomin F500 Frother 108-11-2 4,400 solid MIBC tank
9 Sodium isopropyl xanthane (SIPX) SIPX 140-93-2 30,000 solid
Reagent storage area
10 Sodium
carbonate Soda Ash 497-19-8 160,000 solid Soda ash silo
Humboldt Mill • 9 Contingency Plan – 2016 Update
Chemical storage and delivery systems follow current standards that are designed to prevent and to contain spills. All use areas and indoor storage areas were designed, constructed and/or protected to prevent run-on and run-off to surface or groundwater. This includes development of secondary containment areas for liquids. The secondary containment area is constructed of materials that are compatible with and impervious to the liquids that are being stored. A release in the WTP or concentrator building from the associated piping would be contained within the contained plant area, neutralized, and sent to the HTDF for disposal. Absorbent materials are available to contain acid or caustic spills. Eagle Mine has an emergency response contractor on call to immediately respond to environmental incidents, assist with clean-up efforts, and conduct environmental monitoring associated with any spills. Spill containment measures for chemical storage and handling will reduce the risk of a spill from impacting the environment. Due to the low volatility of these chemicals, fugitive emissions from the WTP or concentrator building to the atmosphere during a spill incident are likely to be negligible. Off-site exposures are not expected. It is therefore anticipated that management and handling of WTP and processing reagents will not pose a significant risk to human health or the environment.
1.1.8 Other Natural Risks
Earthquakes – The Upper Peninsula of Michigan is in a seismically stable area. The USGS seismic impact zone maps show the maximum horizontal acceleration to be less than 0.1 g in 250 years at 90% probability. Therefore, the mine site is not located in a seismic impact zone and the risk of an earthquake is minimal. Therefore, no contingency measures are discussed in this section. Floods - High precipitation events have been discussed previously in the section that describes the HTDF. High precipitation could also lead to the failure of erosion control structures. The impacts of such an event would be localized erosion. Contingency measures to control erosion include sandbag sediment barriers and temporary diversion berms. Long term or off-site impacts would not be expected. Failed erosion control structures would be repaired or rebuilt. Impacts from high precipitation are reversible and off-site impacts are not expected to occur. Given the considerable planning and engineering efforts to manage high precipitation events, the risk posed by high precipitation is considered negligible. Severe Thunderstorms or Tornadoes – Severe thunderstorms or tornadoes are addressed in the emergency procedures developed for the Eagle Mine and Humboldt Mill. Certain buildings are designated shelters in the event of severe weather. Evacuation procedures are part of the on- site training of all employees. Blizzard – The mill site will be designed to accommodate the winter conditions anticipated in the Upper Peninsula of Michigan. The Marquette County Road Commission is responsible for maintaining roadways near the Humboldt Mill. If road conditions deteriorate beyond the capability of the county or township maintenance equipment, Eagle will have provisions to keep workers housed on-site for extended periods, as needed. Forest Fires – Forest fires were discussed in Section 1.1.4.
Humboldt Mill • 10 Contingency Plan – 2016 Update
1.1.9 Power Disruption
Electrical power for the project is provided by the Upper Peninsula Power Company. The facility is presently served by a 34 kV overhead electric utility feeder. In the unlikely event that power is disrupted, a back-up generator is on-site to power essential facilities needs including the tailings slurry pump and concentrate and tailings thickeners. In the event the WTP would need to be temporarily shut down during power disruptions, the water level of the HTDF is maintained at a level that provides enough capacity to store water for an extended period of time if necessary.
1.2 Emergency Procedures
This section includes the emergency notification procedures and contacts for the Humboldt Mill Site. In accordance with R 425.205(2), a copy of this contingency plan will be provided to each emergency management coordinator having jurisdiction over the affected area at the time the application is submitted to the MDEQ. Emergency Notification Procedures – An emergency will be defined as any unusual event or circumstance that endangers life, health, property or the environment. If an incident were to occur, all employees are instructed to contact Security via radio or phone. Security then makes the proper notifications to the facility managers and activates the Eagle Mine Emergency Response Guideline as needed. If personnel on site need to be notified of such an event an emergency toned broadcast via radio and all-call speakers will be made with instructions.
Eagle Mine has adopted an emergency response structure that allows key individuals to take immediate responsibility and control of the situation and ensures appropriate public authorities, safety agencies and the general public are notified, depending on the nature of the emergency. A brief description of the key individuals is as follows:
• Health & Safety Officer: The facility H&S manager and H&S staff are responsible for
monitoring activities in response to any emergencies. During an emergency, H&S representatives will manage special situations that expose responders to hazards, coordinate emergency response personnel, mine rescue teams, fire response, and ensure relevant emergency equipment is available for emergency service. This individual will also ensure appropriate personnel are made available to respond to the situation.
• Environmental Officer: The facility environmental manager will be responsible for managing
any environmental aspects of an emergency situation. This individual will coordinate with personnel to ensure environmental impact is minimized, determine the type of response that is needed and act as a liaison between environmental agencies and mine site personnel.
• Public Relations Officer: The facility external relations manager will be responsible for
managing all contacts with the public and will coordinate with the safety and environmental officers to provide appropriate information to the general public.
In addition to the emergency response structure cited above, a Crisis Management Team (CMT) has also been established for situations that may result in injuries, loss of life, environmental damage, property or asset loss, or business interruption. If a situation is deemed a “crisis” the CMT immediately convenes to actively manage the situation. The following is a description of the core members and their roles:
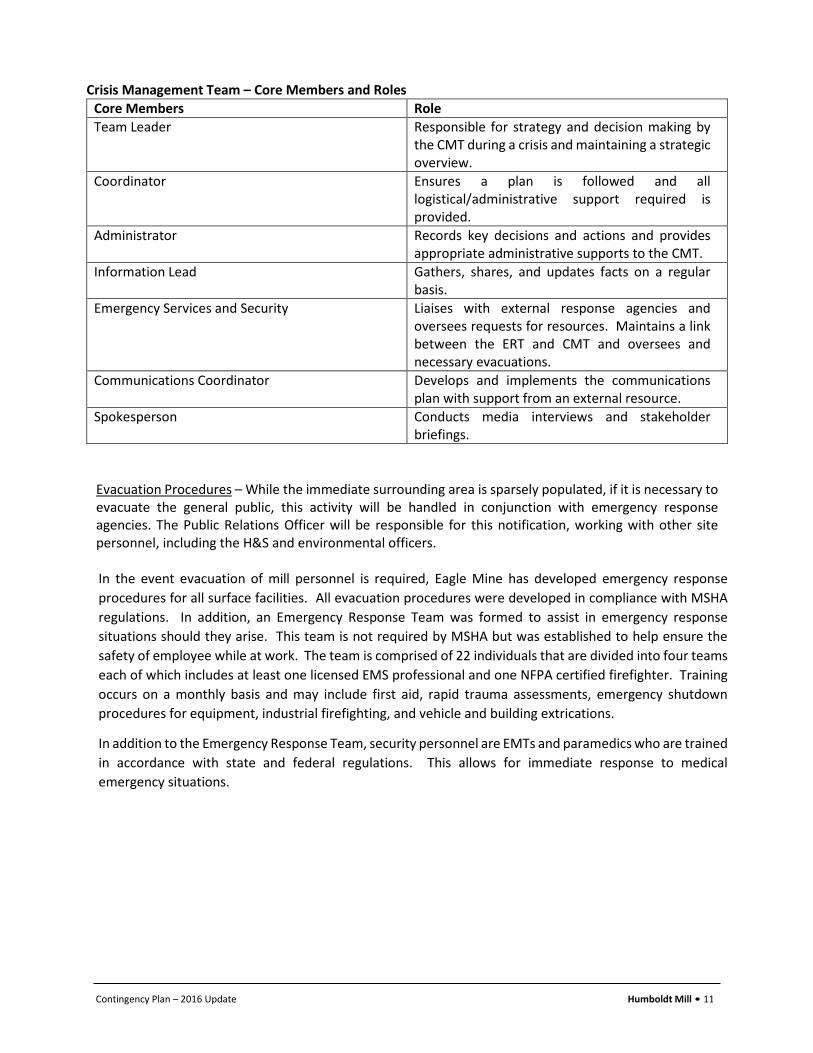
Humboldt Mill • 11 Contingency Plan – 2016 Update
Crisis Management Team – Core Members and Roles Core Members Role Team Leader Responsible for strategy and decision making by
the CMT during a crisis and maintaining a strategic overview.
Coordinator Ensures a plan is followed and all logistical/administrative support required is provided.
Administrator Records key decisions and actions and provides appropriate administrative supports to the CMT.
Information Lead Gathers, shares, and updates facts on a regular basis.
Emergency Services and Security Liaises with external response agencies and oversees requests for resources. Maintains a link between the ERT and CMT and oversees and necessary evacuations.
Communications Coordinator Develops and implements the communications plan with support from an external resource.
Spokesperson Conducts media interviews and stakeholder briefings.
Evacuation Procedures – While the immediate surrounding area is sparsely populated, if it is necessary to evacuate the general public, this activity will be handled in conjunction with emergency response agencies. The Public Relations Officer will be responsible for this notification, working with other site personnel, including the H&S and environmental officers. In the event evacuation of mill personnel is required, Eagle Mine has developed emergency response procedures for all surface facilities. All evacuation procedures were developed in compliance with MSHA regulations. In addition, an Emergency Response Team was formed to assist in emergency response situations should they arise. This team is not required by MSHA but was established to help ensure the safety of employee while at work. The team is comprised of 22 individuals that are divided into four teams each of which includes at least one licensed EMS professional and one NFPA certified firefighter. Training occurs on a monthly basis and may include first aid, rapid trauma assessments, emergency shutdown procedures for equipment, industrial firefighting, and vehicle and building extrications.
In addition to the Emergency Response Team, security personnel are EMTs and paramedics who are trained in accordance with state and federal regulations. This allows for immediate response to medical emergency situations.
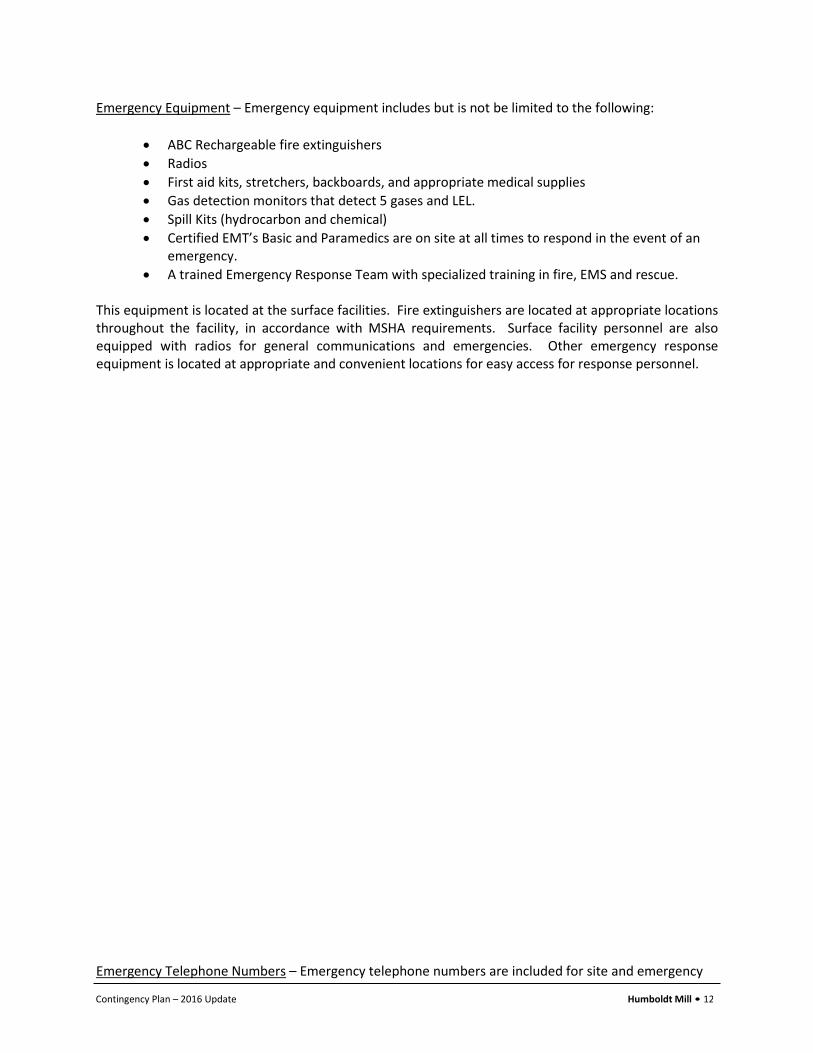
Humboldt Mill • 12 Contingency Plan – 2016 Update
Emergency Equipment – Emergency equipment includes but is not be limited to the following:
• ABC Rechargeable fire extinguishers • Radios • First aid kits, stretchers, backboards, and appropriate medical supplies • Gas detection monitors that detect 5 gases and LEL. • Spill Kits (hydrocarbon and chemical) • Certified EMT’s Basic and Paramedics are on site at all times to respond in the event of an
emergency. • A trained Emergency Response Team with specialized training in fire, EMS and rescue.
This equipment is located at the surface facilities. Fire extinguishers are located at appropriate locations throughout the facility, in accordance with MSHA requirements. Surface facility personnel are also equipped with radios for general communications and emergencies. Other emergency response equipment is located at appropriate and convenient locations for easy access for response personnel. Emergency Telephone Numbers – Emergency telephone numbers are included for site and emergency
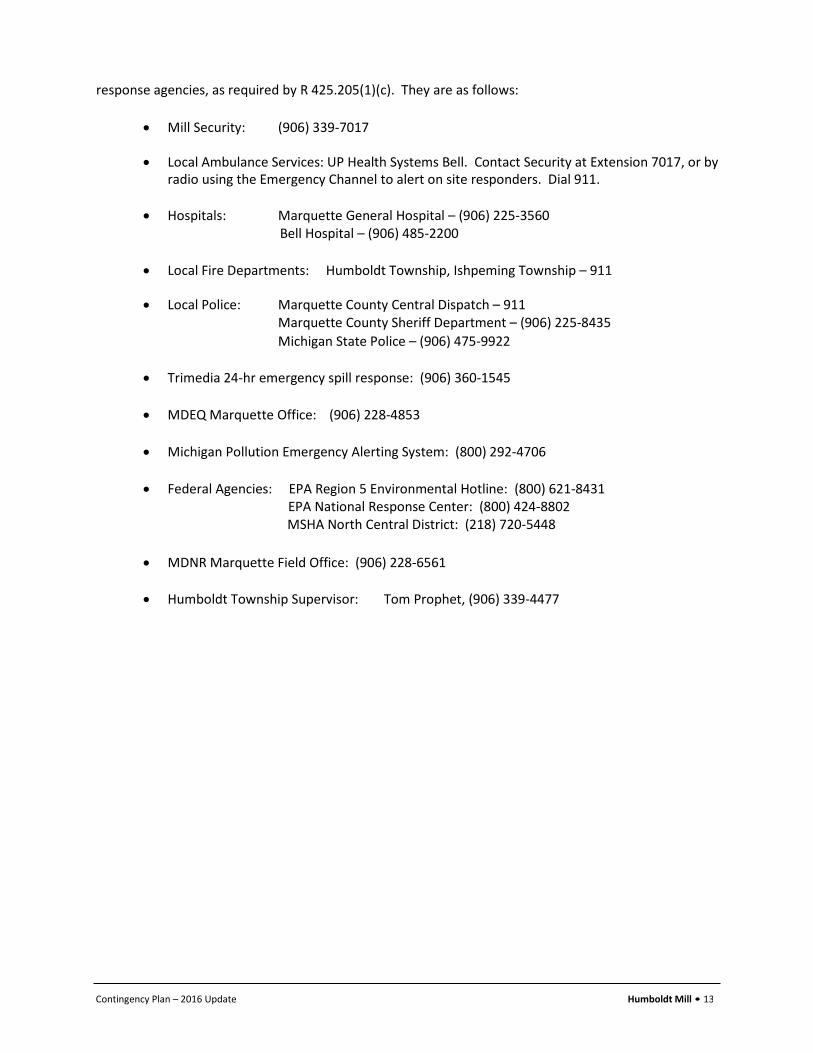
Humboldt Mill • 13 Contingency Plan – 2016 Update
response agencies, as required by R 425.205(1)(c). They are as follows:
• Mill Security: (906) 339-7017
• Local Ambulance Services: UP Health Systems Bell. Contact Security at Extension 7017, or by radio using the Emergency Channel to alert on site responders. Dial 911.
• Hospitals: Marquette General Hospital – (906) 225-3560
Bell Hospital – (906) 485-2200
• Local Fire Departments: Humboldt Township, Ishpeming Township – 911
• Local Police: Marquette County Central Dispatch – 911 Marquette County Sheriff Department – (906) 225-8435 Michigan State Police – (906) 475-9922
• Trimedia 24-hr emergency spill response: (906) 360-1545
• MDEQ Marquette Office: (906) 228-4853
• Michigan Pollution Emergency Alerting System: (800) 292-4706
• Federal Agencies: EPA Region 5 Environmental Hotline: (800) 621-8431 EPA National Response Center: (800) 424-8802
MSHA North Central District: (218) 720-5448
• MDNR Marquette Field Office: (906) 228-6561
• Humboldt Township Supervisor: Tom Prophet, (906) 339-4477
Humboldt Mill • 14 Contingency Plan – 2016 Update
1.3 Testing of Contingency Plan
During the course of each year, the facility will test the effectiveness of the Contingency Plan. Conducting an effective test will be comprised of two components. The first component will include participation in adequate training programs on emergency response procedures for those individuals that will be involved in responding to emergencies. These individuals will include the Incident Commander, Safety Officer, Environmental Officer, Public Relations Officer and other individuals designated to respond to fires and participate in mine rescue. Individuals will receive appropriate information with respect to their specific roles, including procedures and use of certain emergency response equipment. The second component of an effective Contingency Plan will be to conduct mock field tests. At least one mock field test will be performed each year. The Safety Officer will work with the Environmental Officer and the Incident Commander to first define the situation that will be tested. The types of test situations may include responding to a release of a hazardous substance, responding to a fire (aboveground or underground) or responding to a natural disaster such as a tornado. A list of objectives will be developed for planning and evaluating each identified test situation. A date and time will then be established to carry out the test. Local emergency response officials may be involved, depending on the type of situation selected. Once the test is completed, members of the crisis management team and other Eagle Mine officials will evaluate the effectiveness of the response and make recommendations to improve the system. These recommendations will then be incorporated into a revision of the facility Contingency Plan.
Appendix P
Humboldt Mill
Organizational Information
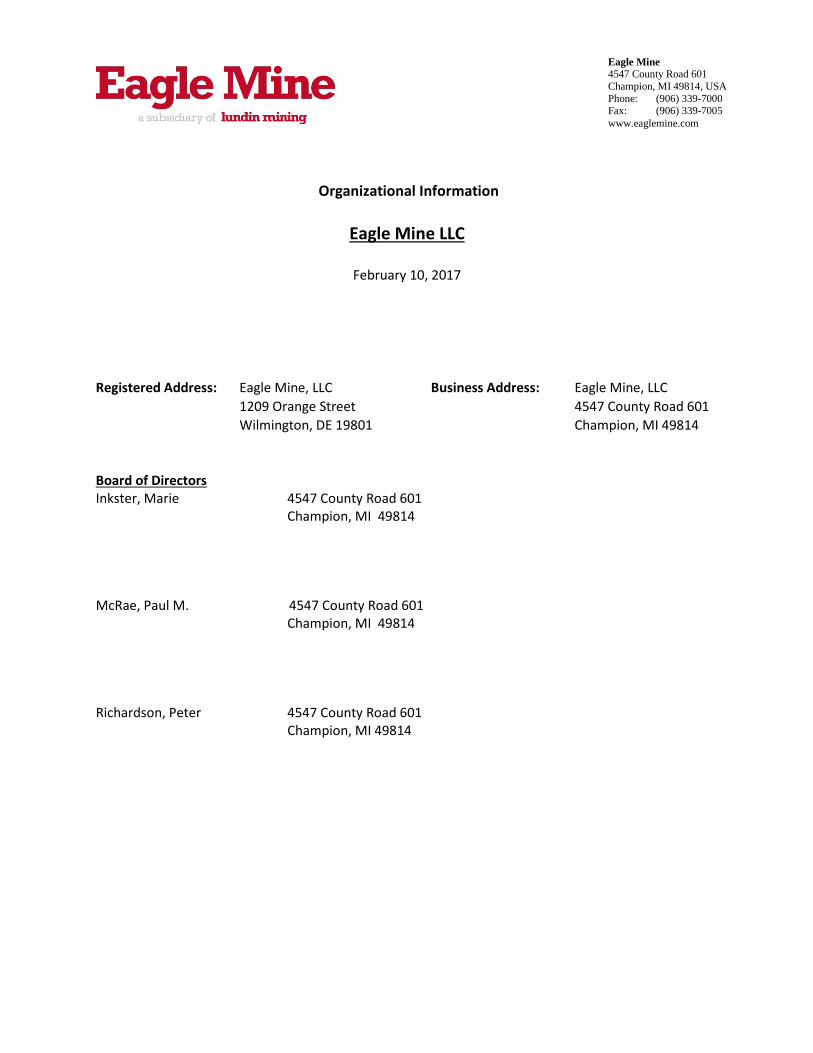
Eagle Mine 4547 County Road 601 Champion, MI 49814, USA Phone: (906) 339-7000 Fax: (906) 339-7005 www.eaglemine.com
Organizational Information
Eagle Mine LLC
February 10, 2017
Registered Address: Eagle Mine, LLC Business Address: Eagle Mine, LLC 1209 Orange Street 4547 County Road 601 Wilmington, DE 19801 Champion, MI 49814 Board of Directors Inkster, Marie 4547 County Road 601 Champion, MI 49814 McRae, Paul M. 4547 County Road 601 Champion, MI 49814 Richardson, Peter 4547 County Road 601 Champion, MI 49814
Eagle Mine 4547 County Road 601 Champion, MI 49814, USA Phone: (906) 339-7000 Fax: (906) 339-7005 www.eaglemine.com
Officers Jinhee Magie Treasurer 4547 County Road 601 Champion, MI 49814 Lesley Duncan Secretary 4547 County Road 601 Champion, MI 49814 Kristen Mariuzza Vice President 4547 County Road 601 Champion, MI 49814 John Kenneth McGonigle President and CFO 4547 County Road 601 Champion, MI 49814


![BLM Star District mine reclamation EA [Environmental Assessment]](https://img.pdfslide.net/doc/110x75/577dae351a28ab223f9024eb/blm-star-district-mine-reclamation-ea-environmental-assessment.jpg)