Embed Size (px)
Citation preview
Report Highlights 1
2016 Annual Report
Activities performed under this contract were sponsored by the
Centers for Medicare & Medicaid Services (CMS) Contract Number HHSM-500-2013-NW014C

End Stage Renal Disease Network of Texas, Inc. Annual Report
Table of Contents Report Highlights ................................................................................................................................3
Introduction .......................................................................................................................................4
CMS’ End Stage Renal Disease Network Organization Program ..........................................................4
Medicare Coverage for Individuals with ESRD ...................................................................................4
History of CMS’ ESRD Network Organization Program .......................................................................4
ESRD Network 14 ............................................................................................................................5
Network Goals ................................................................................................................................5
Profile of Patients in ESRD Network 14’s Service Area ...........................................................................7
Improving Care for ESRD Patients ........................................................................................................8
Quality Improvement Activities .......................................................................................................8
Other Activities ............................................................................................................................. 13
Facilities that Consistently Failed to Cooperate with Network Goals................................................. 14
Recommendations to CMS for Additional Facilities ......................................................................... 14
Grievances and Access to Care .......................................................................................................... 16
Grievance Cases Referred to State Survey Agencies ........................................................................ 17
List of Tables .................................................................................................................................... 19
Appendix. Data Tables ...................................................................................................................... 20
Data Table 1. ESRD Incidence ......................................................................................................... 20
Data Table 2. ESRD Dialysis Prevalence ........................................................................................... 20
Data Table 3. Dialysis Patients Modality and Setting—In Home Report............................................. 20
Data Table 4. Dialysis Patients Modality and Setting—In Center Report............................................ 20
Data Table 5. All Renal Transplant Patients Report .......................................................................... 20
Data Table 6. Renal Transplant Recipient Report ............................................................................. 20
Data Table 7. Dialysis Death Report................................................................................................ 20
Data Table 8. Vocational Rehabilitation Report ............................................................................... 20
Data Table 9a. Incident ESRD Patients in Network 14’s Service Area, by Ethnicity and Race ............... 20
Data Table 9b. Prevalent Dialysis Patients in Network 14’s Service Area, by Ethnicity and Race ......... 20
Data Table 9c. Renal Transplant Recipients* in Network 14’s Service Area, by Ethnicity and Race ...... 20
End Stage Renal Disease Network of Texas, Inc. Annual Report
Report Highlights This report details the work of ESRD Network 14 to promote positive changes to improve ESRD care in the state of Texas in 2016. Interventions and activities targeted patients, dialysis and transplant providers, other providers, and other stakeholders and incorporated a focus on identifying and reducing disparities. The Network served as a convener, organizer, and change agent to drive improvements, and, to facilitate these roles, partnered with: beneficiaries and families on the Patient Advisory Committee (PAC) and National Coordinating Center (NCC) Patient Engagement Learning and Action Network (PE LAN); over 600 dialysis facilities with
diverse ownership and their clinical and corporate staff; other healthcare organizations; and other stakeholders. ESRD Network 14 achieved improvement at the patient level through education,
implementation of interventions, data collection, analysis, and monitoring, as demonstrated in the In-Center Hemodialysis Consumer Assessment of Healthcare Providers (ICH-CAHPS) Quality Improvement Activity (QIA) that increased knowledge of peritoneal dialysis (page 8), reduced bloodstream infections (BSIs) in the Healthcare-Acquired Infections (HAI) QIA (page 9) and increased recommended vaccinations in the Vaccination QIA (page 11). These QIAs achieved statistically significant improvements in 157 facilities caring for 15,589 patients.
ESRD Network 14 led efforts to engage the ESRD community in embracing and implementing patient- and family-centered care through dissemination of the Facility Patient Representative (FPR) Program Toolkit and the continued availability of the Patient Engagement Calendar and
monthly educational handouts. The Network protected ESRD patients’ access to and quality of dialysis care, especially among
vulnerable populations, through patient services that included successfully managing 133 grievances and averting discharge for 80% of patients at risk for involuntary discharge (IVD) (page 16). ESRD Network 14’s use of EMResource, a web-based disaster system adapted for dialysis facilities, was noted as a best practice during the Kidney Community Emergency Response (KCER) drill in 2016 (page 13). ESRD Network 14 engaged providers in activities that increased patient and family engagement, improved and made care safer, decreased disparities, preserved treating facilities for at risk patients, improved the accuracy and timeliness of data reporting in national systems, and facilitated and promoted care provision for the ESRD patient population (over 60,000) in Texas.

End Stage Renal Disease Network of Texas, Inc. Annual Report
Introduction
CMS’ End Stage Renal Disease Network Organization Program The End Stage Renal Disease Network Organization Program (ESRD Network Program) is a national quality improvement program funded by the Centers for Medicare & Medicaid Services (CMS). CMS is a federal agency, part of the U.S. Department of Health and Human Services. CMS defines end stage renal disease (ESRD) as permanent kidney failure in an individual who requires dialysis or kidney transplantation to sustain life.
Under contract with CMS, 18 ESRD Network Organizations, or ESRD Networks, carry out a range of activities to improve the quality of care for individuals with ESRD. The 18 ESRD Networks serve the 50 states, the District of Columbia, Puerto Rico, the Virgin Islands, American Samoa,
Guam, and the Northern Mariana Islands.
Medicare Coverage for Individuals with ESRD Medicare coverage was extended to most ESRD patients in the U.S. under the Social Security Act Amendments of 1972 (Public Law 92-603). Individuals with irreversible kidney failure are
eligible for Medicare if they need regular dialysis or have had a kidney transplant and they meet (or their spouse or parent meets) certain work history requirements under the Social Security program, the railroad retirement system, or federal employment.
History of CMS’ ESRD Network Organization Program Following passage of the 1972 Amendments to the Social Security Act, in response to the need for effective coordination of ESRD care, hospitals and other health care facilities were organized into networks to enhance the delivery of services to people with ESRD. In 1978, Public Law 95-292 modified the Social Security Act to allow for the coordination of dialysis and transplant services by linking dialysis facilities, transplant centers, hospitals, patients, physicians, nurses, social workers, and dietitians into Network Coordinating Councils,
one for each of 32 administrative areas. In 1988, CMS consolidated the 32 jurisdictions into 18 geographic areas and awarded contracts
to 18 ESRD Network Organizations, now commonly known as ESRD Networks. The ESRD Networks, under the terms of their contracts with CMS, are responsible for: supporting use of the most appropriate treatment modalities to maximize quality of care and quality of life; encouraging treatment providers to support patients’ vocational rehabilitation and employment; collecting, validating, and analyzing patient registry data; identifying providers that do not contribute to the achievement of Network goals; and conducting onsite reviews of ESRD providers as necessary.

End Stage Renal Disease Network of Texas, Inc. Annual Report
ESRD Network 14 ESRD Network of Texas, Inc., a subsidiary of Alliant Health Solutions, a not for profit corporation, held the contract to operate ESRD Network 14 in 2016. ESRD Network 14’s geographical area encompasses the state of Texas, the second largest state in land area with
267 thousand square miles and the second most populous state in the nation. A geographic area this large that is home to a large general population and a large population with kidney failure may account for the large number of dialysis facilities and transplant centers operating
in the state (Table A). These dialysis facilities offer wide ranges of available shifts, though only a small percentage of facilities accommodate shifts after 5 PM (Table B), which may influence both vocational rehabilitation and patient decisions regarding continuing to or resuming work (Data Table 8). Texas is the second most populous state with an estimated 28.2 million people and is among the most diverse states. Since 2004, Texas has been a “majority-minority” state, with minority defined as all people except single-race, non-Hispanic whites. Comprising 41% of the 2016 general Texas population (Texas Population Data 2016), Hispanics have been the most highly represented ethnic group in the Texas ESRD population in recent years, with 43% of the prevalent Texas ESRD patients identifying as Hispanic in 2016. African-Americans made up 27.1% of the prevalent ESRD patients in Texas in 2016, as compared with 11% of the general population. Diabetes continues to be the leading cause of ESRD in prevalent patients in Texas at 53.8% (Data Table 2).
Table A. Dialysis Facilities and Transplant Centers in Texas, as of December 31, 2016
Category Number
Number of Dialysis Facilities in Texas 616 Number of Transplant Centers in Texas 23
Source of data: CROWNWeb. Table B. Number of Medicare-certified Dialysis Facilities in Texas and Number and Percent of Dialysis Facilities Offering Dialysis Shifts Starting after 5PM, as of December 31, 2016 Category Number Percent
Number of Dialysis Facilities in Texas 608 Dialysis Facilities in Texas Offering Dialysis Shifts Starting after 5PM 68 11% Source of data: CROWNWeb.
Network Goals CMS establishes priorities for the ESRD Network contractors annually in the Statement of Work section of each Network’s contract with the agency. These priorities support CMS and Department of Health and Human Services (HHS) national quality improvement goals and
priorities. In 2016, the ESRD Network contractors were tasked with meeting the following goals:

End Stage Renal Disease Network of Texas, Inc. Annual Report
Improving care for ESRD patients in the Network’s service area by: o Promoting patient- and family-centered care o Responding to grievances about ESRD-related services filed by, or on behalf of,
ESRD patients o Supporting improvement in patients’ experience of care o Working with dialysis facilities to ensure that all dialysis patients have access to
appropriate care o Promoting best practices in vascular access management o Helping dialysis facilities reduce the incidence of healthcare-associated infections
Improving the health of the ESRD patient population in the Network’s service area
through activities designed to reduce disparities in ESRD care Reducing the costs of ESRD care in the Network’s service area by supporting
performance improvement at the dialysis facility level and supporting facilities’ submission of data to CMS-designated data collection systems

End Stage Renal Disease Network of Texas, Inc. Annual Report
Profile of Patients in ESRD Network 14’s Service Area The ESRD Network Program collects data on incident (new) ESRD patients, prevalent (currently treated) dialysis patients, and renal transplant recipients. ESRD Network 14 uses data on patients’ clinical characteristics—including primary cause of ESRD, treatment modality, and vascular access type—to focus its outreach and quality improvement activities.
Table C. Clinical Characteristics of the ESRD Population in Texas, Calendar Year 2016 Category Number Percent Incident (New) ESRD Patients
Number of Incident ESRD Patients, Calendar Year 2016 11,564
Prevalent Dialysis Patients
Number of Prevalent Dialysis Patients as of December 31, 2016 48,614
Treatment Modality of Prevalent Dialysis Patients as of December 31, 2016
In-Center Hemodialysis or Peritoneal Dialysis 43,801 90% In-Home Hemodialysis or Peritoneal Dialysis 4,822 10%
Total 48,623 100%
Vascular Access Type at Latest Treatment among Prevalent In-Center and In-Home Hemodialysis Patients as of December 31, 2016
Arteriovenous Fistula in Use 26,981 62.5%
Arteriovenous Graft in Use 8,234 19.1%
Catheter in Use for 90 Days or Longer 4,230 9.8%
Other 3,696 8.6%
Total 43,141 100% Renal Transplants
Number of Renal Transplant Recipients,* Calendar Year 2016 1,774
Total 1,774 100%
Source of data: CROWNWeb. *Count of unduplicated individuals receiving renal transplantation during the calendar year.
End Stage Renal Disease Network of Texas, Inc. Annual Report
Improving Care for ESRD Patients The Network works closely with ESRD patients, patients’ family members and friends, nephrologists, dialysis facilities and other healthcare organizations, ESRD advocacy organizations, and other ESRD stakeholders to improve the care for ESRD patients in the Networks service area. Under its contract with CMS, the Network is responsible for:
Identifying opportunities for quality improvement and developing interventions to
improve care for ESRD patients in Texas Identifying opportunities for improvement at the facility level and providing technical
assistance to facilities as needed
Promoting the use of best practices in clinical care for ESRD patients
Encouraging use of all modalities of care, including home modalities and transplantation, as appropriate, to promote patient independence and improve clinical outcomes
Promoting the coordination of care across treatment settings
Ensuring accurate and timely data collection, analysis, and reporting by facilities in accordance with national standards
To meet these responsibilities, ESRD Network 14 enacted several QIAs and other projects with targeted interventions, which achieved improvements in the quality of care provided to its beneficiaries.
Quality Improvement Activities
The QIAs, with exception of the National Healthcare Safety Network (NHSN) QIA, employed project branding with logo and title, as recommended by the Network Council (NC), and an introductory letter and webinar that included the reason for inclusion of the project, the project timeline and notice of required webinars, interventions and reporting. QIA notices were provided to the leaders of the facility corporations that the facilities were affiliated with to garner corporate support. Additionally at the close of each QIA, each facility that participated in a QIA was required to submit a sustainability plan which outlined how they would maintain improvements made during the course of the QIA. The Network created a sustainability model to assist the facilities complete this task. Each QIA required a patient driven component with the facility collaborating with patients to select and complete the activity.
ICH-CAHPS QIA ESRD Network 14 initiated the ICH-CAHPS QIA titled Be the Voice, Be the Change with two objectives: 1) promote patient engagement by providing a platform for patients to be more
involved with changing their experience of care in in-center hemodialysis facilities and 2) achieve a 5% relative improvement score within a cohort of Network in-center hemodialysis facilities by the end of September 2016 on the selected ICH-CAHPS survey question with the

End Stage Renal Disease Network of Texas, Inc. Annual Report
worst patient scores, that being Question #39 (Q#39): “In the last 12 months, did either your kidney doctors or dialysis center staff talk to you about peritoneal dialysis?”. The ESRD Network
14 selected 25 focus facilities with the worst patient scores and whose combined census represented 20% of the Network’s in-center hemodialysis patient population (N=2,542 patients). In addition to the project notifications and activities listed on page 8, ESRD Network 14 disseminated to the focus facilities a patient survey toolkit to facilitate distribution of a survey card containing Q#39 to one-sixth of the patient population each month from April 2016 through September 2016. Also provided was information and tools for patient involvement in the project at the facility level, small patient group discussions, a facility-designed intervention, and facility progress reports.
Figure 1. Average Percentage of Patients who Answered ICH-CAHPS Question #39 Positively for Focus Facilities and Non-Focus Facilities: Baseline and Post-Test
Results The 25 focus facilities were successful in
exceeding the overall 5% relative improvement project goal of > 37.3% with results of 71.9% of patients
answering positively to Q#39 compared to a baseline of 34.0% of patients answering positively to Q#39. There was a statistically significant difference between focus and non-focus facilities’ ICH-CAHPS Q#39 positive
response rates from baseline to post-test. Focus facilities’ ICH-CAHPS rates increased on average from 34% to 59% while the non-focus facilities’ rates stayed the same from baseline to post-test. (Figure 1).
Healthcare-Acquired Infections (HAIs) QIA ESRD Network 14 initiated the HAI QIA titled Infection Detection to reduce dialysis facility BSI rates within a group of focus facilities. BSI data from the NHSN database for the first and second quarters of 2015 was used to rank facilities by their BSI rates, from highest to lowest. ESRD Network 14 selected 20% of the facilities (N=107) with the highest BSI rates, oversampling by three to bring the total number of focus facilities to 110 serving 9,928 patients. These focus facilities reported a pooled mean BSI rate of 1.54 per 100 patient-months (numerator being the number of BSIs defined as positive blood cultures where N=621 cultures and the denominator being the number of patient months where N= 40,319 months), compared to the ESRD Network 14’s average pooled mean BSI rate of 0.60 per 100 patient-months, and the national average
pooled mean BSI rate among all facilities reporting BSIs at 1.27 per 100 patient-months from the NHSN database. The project goal was to achieve a 5% relative improvement, reducing the
59% 59%
34%
59%
0%
20%
40%
60%
80%
100%
Baseline Post-Test
Per
cen
tage
Non-Focus Facilities(n=474)
Focus Facilities(n=25)
Note: p <.0001 for Positive Response Rate

End Stage Renal Disease Network of Texas, Inc. Annual Report
focus facilities’ pooled mean BSI rate by 0.77 to a pooled mean BSI rate of 1.46 per 100 patient-months.
The ESRD Network 14 QIA plan focused on the utilization of the Centers for Disease Control and Prevention (CDC) Core Interventions for Dialysis BSI Prevention. These interventions have shown, when employed correctly, that certain BSI rates can be decreased, and the decrease can be maintained (Yi et al., 2012). Facility staff and management had to ensure that CDC Core Intervention best practices were in active use; select or develop a patient engagement activity that focused on BSIs in collaboration with their FPRs, receive approval from the ESRD Network 14; and engage and empower patients through the execution of the facility and FPR selected patient engagement activity related to healthcare-acquired infections.
Figure 2. Bloodstream Infection QIA Focus Facilities (n=110) Project Goal of a 5% Relative Improvement in the Semi-Annual Pooled Mean BSI Rate = 1.46
Results Out of the 110 facilities in the project, 94 facilities (85%) surpassed the project goal of 5% or greater relative reduction in their pooled mean BSI rate at re-measurement compared to the baseline time period. The remaining 16 facilities that were not able to meet their goal continued into the 2017 BSI QIA.
Figure 3. Bloodstream Infection Rates for Focus Facilities and Non-Focus Facilities: Baseline
vs. Post-Test Further analysis proved there was a significant difference between the focus
and non-focus facilities’ (facilities not in the QIA) BSI rates from baseline to post test. The focus facilities’ BSI rates
decreased on average by .74, while the non-focus facilities increased on average by .15 from baseline to post-test (p<.0001). (Figure 3).
Due to substantial facility staff turnover in the short nine months of the project, the Network recommended that all focus facilities have two NHSN trained associates working in their facility. The two NHSN trained facility staff should be able to enter their facility's data into NHSN's surveillance module for outpatient dialysis facilities. This includes entering data into NHSN on dialysis events (DEs) and prevention process measures (PPMs) which are used to calculate rates of adherence to HAI preventative practices among facility personnel and to inform quality improvement decisions at the facility and Network level.
1.54
0.804
0
0.5
1
1.5
2
Baseline2015
Q1-Q2
Remeasure2016
Q1-Q2
BSI
Rat
e
0.35 0.50
1.54
0.80
0
0.5
1
1.5
2
Baseline BSI Post-Test BSI
NonFocusFacilities(n=399)
FocusFacilities(n=110)
Note: p<.0001 for BSI Rates
End Stage Renal Disease Network of Texas, Inc. Annual Report
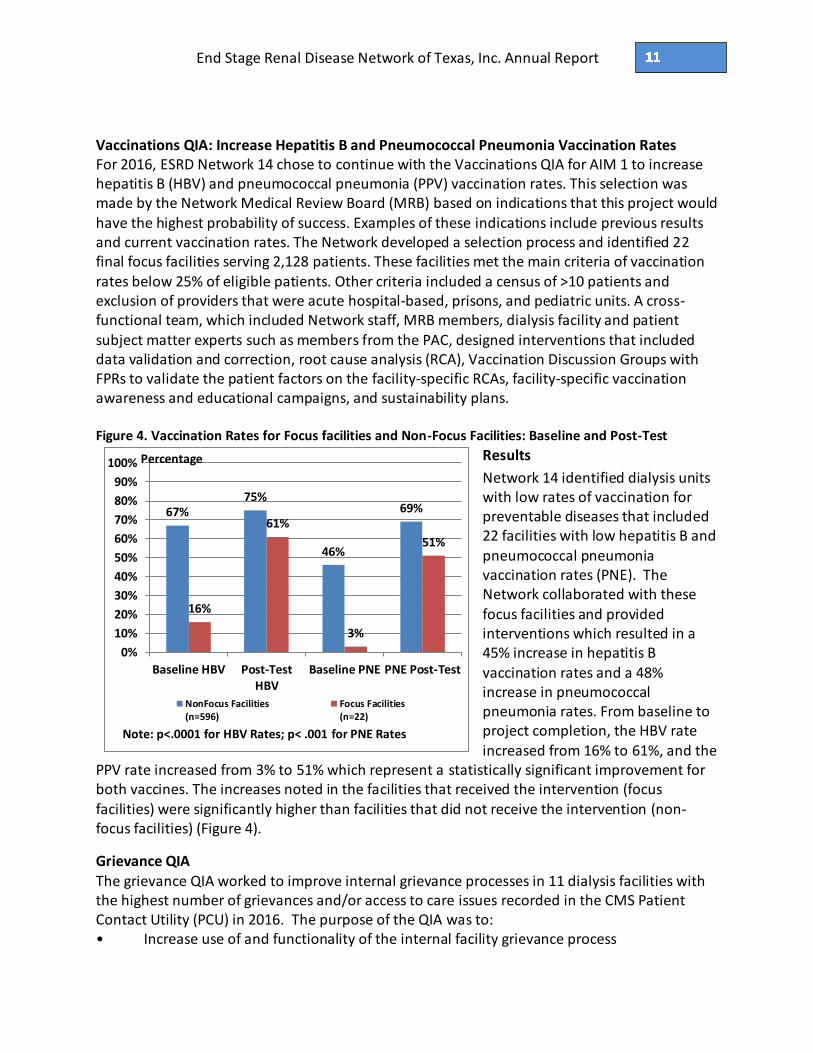
Vaccinations QIA: Increase Hepatitis B and Pneumococcal Pneumonia Vaccination Rates For 2016, ESRD Network 14 chose to continue with the Vaccinations QIA for AIM 1 to increase hepatitis B (HBV) and pneumococcal pneumonia (PPV) vaccination rates. This selection was made by the Network Medical Review Board (MRB) based on indications that this project would have the highest probability of success. Examples of these indications include previous results and current vaccination rates. The Network developed a selection process and identified 22 final focus facilities serving 2,128 patients. These facilities met the main criteria of vaccination rates below 25% of eligible patients. Other criteria included a census of >10 patients and exclusion of providers that were acute hospital-based, prisons, and pediatric units. A cross-functional team, which included Network staff, MRB members, dialysis facility and patient
subject matter experts such as members from the PAC, designed interventions that included data validation and correction, root cause analysis (RCA), Vaccination Discussion Groups with FPRs to validate the patient factors on the facility-specific RCAs, facility-specific vaccination awareness and educational campaigns, and sustainability plans. Figure 4. Vaccination Rates for Focus facilities and Non-Focus Facilities: Baseline and Post-Test
Results
Network 14 identified dialysis units with low rates of vaccination for preventable diseases that included 22 facilities with low hepatitis B and
pneumococcal pneumonia vaccination rates (PNE). The Network collaborated with these
focus facilities and provided interventions which resulted in a 45% increase in hepatitis B
vaccination rates and a 48% increase in pneumococcal pneumonia rates. From baseline to project completion, the HBV rate increased from 16% to 61%, and the
PPV rate increased from 3% to 51% which represent a statistically significant improvement for both vaccines. The increases noted in the facilities that received the intervention (focus facilities) were significantly higher than facilities that did not receive the intervention (non-focus facilities) (Figure 4).
Grievance QIA
The grievance QIA worked to improve internal grievance processes in 11 dialysis facilities with the highest number of grievances and/or access to care issues recorded in the CMS Patient Contact Utility (PCU) in 2016. The purpose of the QIA was to: • Increase use of and functionality of the internal facility grievance process
67%75%
46%
69%
16%
61%
3%
51%
0%
10%
20%
30%
40%
50%
60%
70%
80%
90%
100%
Baseline HBV Post-TestHBV
Baseline PNE PNE Post-Test
Percentage
NonFocus Facilities(n=596)
Focus Facilities(n=22)
Note: p<.0001 for HBV Rates; p< .001 for PNE Rates

End Stage Renal Disease Network of Texas, Inc. Annual Report
• Improve communication between patients and facility staff • Decrease operational and environmental grievances (as defined by CMS) by a 20%
relative improvement from a mean grievance score for the 11 facilities to 11.14 ESRD Network 14 implemented the CMS grievance log and scored the facility’s grievances on a five-point severity scale as established by CMS. The QIA baseline was established by dividing the combined score of the weighed grievances by the total number of facilities in the project. The baseline score for the QIA (14.36) was established in April 2016 following a two-month pilot period (February and March) for the facilities with the logs. The Centers of Medicare & Medicaid (CMS) states that “change occurs when dialysis facilities understand the root cause(s) of the grievance issue and implement steps to resolve the issue
(s)”; therefore, data from a RCA survey was used to determine interventions. Patient Advisory Committee (PAC) members were solicited for involvement and provided input into the development of the QIA and the RCA. The RCA was completed via survey monkey by the focus facilities which allowed for identification of common root causes. CMS directed that Networks secure “commitments to create collaborative relationships between patients and providers through patient and family engagement”. As a result, each facility was required to have FPRs in place early in the QIA. It is an ESRD Network 14 tenet that establishing FPRs as a link between the other patients and the center’s managers and staff facilitates communication. The focus facilities were provided an FPR toolkit and detailed instructions on entering the FPRs into the CROWNWeb database. Data from the RCA survey was used to determine interventions, which were presented to focus facilities in a webinar. To foster buy-in and engagement, facilities were given the liberty to
select three interventions targeted to root causes, implemented in three phases, and were provided with samples of interventions. Mental health issues and lack of access to mental health resources were identified root causes of grievances. Therefore, each focus facility was
mandated to choose a mental health intervention in one of three project phases. Phase I, “thriving” and “staff roles” interventions, focused on allowing the patient/consumer of services to present with an internal locus of control instead of an external locus of control to target
entitlement, depression, and staff burnout. People with a high internal locus of control believe in their own ability to control themselves and influence the world around them while those with an external control believe that control over events and what other people do is outside them, and that they personally have little or no control over such things. Phase II, staffing interventions, focused on allowing employees at the clinic level to educate one another and themselves in areas noted in the RCA such as lack professionalism, empathy, training and cultural diversity. Phase III, combination interventions, provided an opportunity for the patient/consumer of services and clinic staff to form a partnership. Results All facilities fully participated and completed the QIA with a resulting decrease of the grievance score from a baseline of 11.73 to 8.91, exceeding project reduction goal of 9.45.

End Stage Renal Disease Network of Texas, Inc. Annual Report
Other Activities Community Disaster Coalition In addition to its responsibilities under its contract with CMS, the Network achieved recognition
from the Kidney Community Emergency Response (KCER) program for a fourth straight year for its commitment to emergency preparedness within the ESRD community and maintained a constant state of readiness in case of emergencies and disasters through the Texas ESRD
Emergency Coalition (TEEC). TEEC is a statewide disaster coalition formed in 2005 after Hurricanes Katrina and Rita. The mission of TEEC is to coordinate planning, preparedness, response, and recovery for emergency events affecting the Texas ESRD community. TEEC remained active and ready to provide disaster assistance to patients and providers in 2016. The Steering Committee is composed of representatives from Network 14, all of the dialysis corporations and other facilities operating in Texas and the State Survey Agency. TEEC community meetings provide a venue for educating facilities about TEEC, disaster planning, disaster drills, and the use of EMResource, a Web-based system for tracking dialysis facility status provided by the State Health Department. TEEC activities in 2016 included a presentation at the regional Houston Hurricane Conference, community education meetings, and a disaster drill to activate the TEEC Command Center housed at the Dallas County Health and Human Services Dallas Medical Operation Command Center with all steering committee representatives and the Dallas County Preparedness
Coordinator participating. Collaboration and partnership with TEEC and the Texas Department of Health resulted in
consistent compliance of all dialysis facilities in Texas entering monthly data updates into EMResource. In drills and actual emergencies or disasters, real-time disaster information is entered into the system and can be viewed and utilized statewide by Emergency Operations Centers and other providers. The use of EMResource was named a best practice from 2013 through 2016 during the KCER National Exercises. The KCER National Exercises was a formal exercise for all of the ESRD Networks to practice their emergency preparedness, response, and recovery skills.
Patient and Family Engagement Patient Engagement
In continued support of CMS’ heightened focus on patient engagement, ESRD Network 14 disseminated subject matter expert forms to 25 percent of the Network facilities resulting in 65 applications from patients interested in being a subject matter expert for the Network. From
the 65 applications, six of the patients joined the National Coordinating Center Patient and Family Engagement Learning and Action Network (NCC PFE LAN) and seven applied for the Network 14’s PAC. The remaining 57 subject matter experts (SMEs) were divided into the seven QIA groups according to their interests. Each QIA had seven or eight patient SMEs in the group
to offer feedback on the project components and interventions. This disbursement allowed for subject matter experts to participate at the facility level, state level, and national level.

End Stage Renal Disease Network of Texas, Inc. Annual Report
Patient and Family Engagement in Network Quality Improvement (QIA) Activities
The Network is committed to incorporating the perspective of patients, family members, and other caregivers into its projects and, to this end, incorporated patient feedback and suggestions into the design and operation of Network QIAs. Network SMEs serving on the Network PAC were divided into the seven QIA groups of their choosing. The Vaccinations QIA and the Home Referrals QIA each had a total of six patient subject matter experts, the ICH CAHPS QIA group had eight, and both the Bloodstream Infection and the Hypercalcemia QIA had eight. Finally, the Grievance QIA had ten patient subject matter experts. The patients began working with QIA leads on developing and implementing focus facility interventions, designing project logos, and offering a patient perspective on potential patient focused facility interventions. Patient subject matter experts also volunteered to join workgroups for the New
ESRD Patient Orientation Packet (NEPOP), KCER, and the NCC. Additionally, each QIA focus facility was required to design a patient component in collaboration with at least one FPR.
Facilities that Consistently Failed to Cooperate with Network Goals ESRD Network 14 strongly believes in fostering partnerships with the dialysis facilities in Texas to meet and exceed the Network goals established by CMS to support HHS and CMS national
improvement goals and priorities. While Network 14 has always valued a collaborative, collegial approach, in 2016 we initiated the CMS Watch List to address ongoing failure of facilities to fully participate, complete projects and achieve project goals, despite outreach to corporate levels. The CMS Watch List was successful in reducing overall delinquency with only 14 of 332 (4%) project facilities placed on the CMS Watch List with a five day deadline to conduct/submit delinquent project deliverables. The following Medicare-certified providers, listed by their CMS Certification Numbers (CCNs), did not fully participate in one or more designated QIAs because
of failure to complete and submit project deliverables by a given deadline despite a written, verbal notice, thus, they were placed on the CMS Watch List. This process entailed sending the facility leadership a letter that detailed the reason the facility was being placed on the CMS Watch List, the actions required to be removed from the CMS Watch List, and consequences if those actions were not completed within five business days from receipt of the letter. The letter was copied and sent to the facility’s Administrator and a corporate leader (if applicable) as well as the CMS Contracting Officer’s Representative for ESRD Network 14.
Table D. Provider Certified Numbers assigned to CMS Watch list N=14
452517 452732 672692
452571 672511 672723 452618 672520 672754
452635 672538
452640 672593
Recommendations to CMS for Additional Facilities Although the Network has no official role with CMS in the approval process for new or expanded facilities, it does monitor and review overall capabilities in the state.

End Stage Renal Disease Network of Texas, Inc. Annual Report
There was no hurricane activity in 2016 that caused evacuations of large numbers of dialysis
patients from coastal areas into regions with insufficient dialysis surge capacity; however, history has shown this will occur again. The Network continued to receive contacts during 2016 from patients who stated that they were experiencing difficulty locating a facility after being involuntarily discharged due to actual harm or threats of harm to others, ongoing disruptive behaviors, or non-adherence to physicians’ orders. Upon Network investigation, many of these patients who were discharged had been provided adequate opportunities to correct the offending action prior to dismissal. ESRD Network 14 continued to observe the disturbing practice of discharges due to treatment
non-adherence. Physicians may, and sometimes do, discharge patients from their practices, and, when no other admitting physicians will accept the patients, involuntary discharges from the dialysis facilities result. In other cases, such as those involving physical aggression, the patients are dismissed prior to acceptance to other facilities. Forty patients received an Involuntary Discharge (IVD) in 2016, of which 24 were due to immediate and severe threat. When this occurs, patients often experience rejection from facilities under the same physician or corporate group and other providers, and these patients must rely on hospitals to provide treatment on an emergency basis until new facilities are located. The Network recommends that CMS embrace innovation by fostering the establishment of special needs dialysis facilities in the major metropolitan areas to serve displaced patients who require chronic dialysis yet do not have a chronic provider. It is anticipated that these special
needs facilities would require at least the following special services to meet the needs of this population of patients:
Security guards and metal detectors
Social workers and registered nurses on staff whenever patients are dialyzing
Lower patient care staff to patient ratio
Higher hourly pay rate for all staff (high risk/hazardous pay)
Psychological counseling on site These additional services would certainly inflate the cost of delivering services to this population, which would require a higher reimbursement rate for such facilities; however, it is highly likely that these centers would prevent a multitude of emergency department treatments and hospitalizations that would produce a net savings for the Medicare Program. Establishment of these special needs facilities could be fostered through:
A CMS-sponsored demonstration project, implemented through the Center for Medicare & Medicaid Innovation (CMMI)
Higher reimbursement rates for initial set up of facilities
ESRD Seamless Care Organization (ESCO) programs

End Stage Renal Disease Network of Texas, Inc. Annual Report
Grievances and Access to Care ESRD Network 14 received and investigated 133 grievances filed by or on behalf of ESRD patients in Texas. Of these, twenty-two (17%) involved issues related to access to care. The Network also responded to 93 non-grievance access-to-care cases brought to its attention by facility staff. Forty-nine contacts were referred to the State Survey Agency due to their regulatory nature, and 22 were Immediate Advocacy cases processed by Network staff in 2016. Table E. Grievance Data for Calendar Year 2016
Source of data: Patient Contact Utility. * Includes only Clinical Quality of Care, Immediate Advocacy, and General Grievance
In 2016, ESRD Network 14 received 80 contacts from providers in which patients were “at risk” for IVD. When contacted by providers regarding actual or “at risk” IVD cases, the Network,
when appropriate, utilized an IVD packet that included the relevant federal regulations and a checklist outlining appropriate IVD procedures. These materials detailed the Network’s position on IVDs, tools that might be helpful and outlined expected actions of professionals providing
care to prevent and resolve the issues preceding an IVD. The goal of providing these materials to providers is to strongly encourage them to engage in a robust attempt, as described in the federal regulations, to resolve issues prior to an IVD. Of these 80 potential IVDs, the Network averted 64, an IVD aversion rate of 80%. ESRD Network 14 addressed these cases through such efforts as patient advocacy, staff/patient education, site visits, and several patient care conference calls involving ESRD Network 14, the facilities’
Interdisciplinary Teams, and the patients and/or the patients’ personal representatives.
Category Number Number of Grievance Cases Opened by the Network in Calendar Year 2016* 133
Number of Grievance Cases Involving Access to Care 22
Number of Grievance Cases Involving Involuntary Transfer 0 Number of Grievance Cases Involving Involuntary Discharge 8 Number of Grievance Cases Involving Failure to Place 14
Number of Non-Grievance Cases Involving Access to Care 93 Number of Non-Grievance Cases Involving Involuntary Transfer 0
Number of Non-Grievance Cases Involving Involuntary Discharge 79
Number of Non-Grievance Cases Involving Failure to Place 14 Total Number of Grievance and Non-Grievance Cases Involving Access to Care 226
Number of Grievance Cases Closed by the Network in Calendar Year 2016 133
Number of Non-Grievance Access to Care Cases Closed by the Network in Calendar Year 2016
153
End Stage Renal Disease Network of Texas, Inc. Annual Report
Many of the contacts involved patients who were non-adherent to the dialysis regimen (i.e., skipped treatments), and the Network utilized these contacts as opportunities to educate
facility staff regarding patient-centered care and patient engagement and activation. Whenever the Network received calls like this, the staff educated providers on the regulations documented in the Conditions for Coverage for ESRD facilities and emphasized that non-adherence is an invalid reason for an IVD. In light of this information, providers and practitioners became increasingly concerned about the potential liabilities for patients who skip or miss treatments. The percent of patients who were involuntarily discharged remained less than one percent of the total dialysis population in Texas, despite continued growth in the number of dialysis patients each year. Although the number (40) and percent (<0.1%) of patients involuntarily
discharged was small, the adverse outcome for the patient is serious and can be life threatening. Twenty-four of the 40 IVDs (60%) in 2016 were for immediate or severe threats to staff or other patients’ safety. When a pattern of patient grievances or IVDs is identified, ESRD Network 14 works individually with facilities to provide objective input and training. The Conditions for Coverage for ESRD facilities state that a facility must provide a 30-day written notice of discharge when an IVD is imminent, except in the event of an immediate and severe threat to staff or other patients’ safety. In each case, the facility is required to notify both the Network and the State Survey Agency of the IVD. Understanding how detrimental an IVD can be to a patient’s health and well-being, ESRD Network 14 remains diligent in addressing cases with a risk of patient discharge.
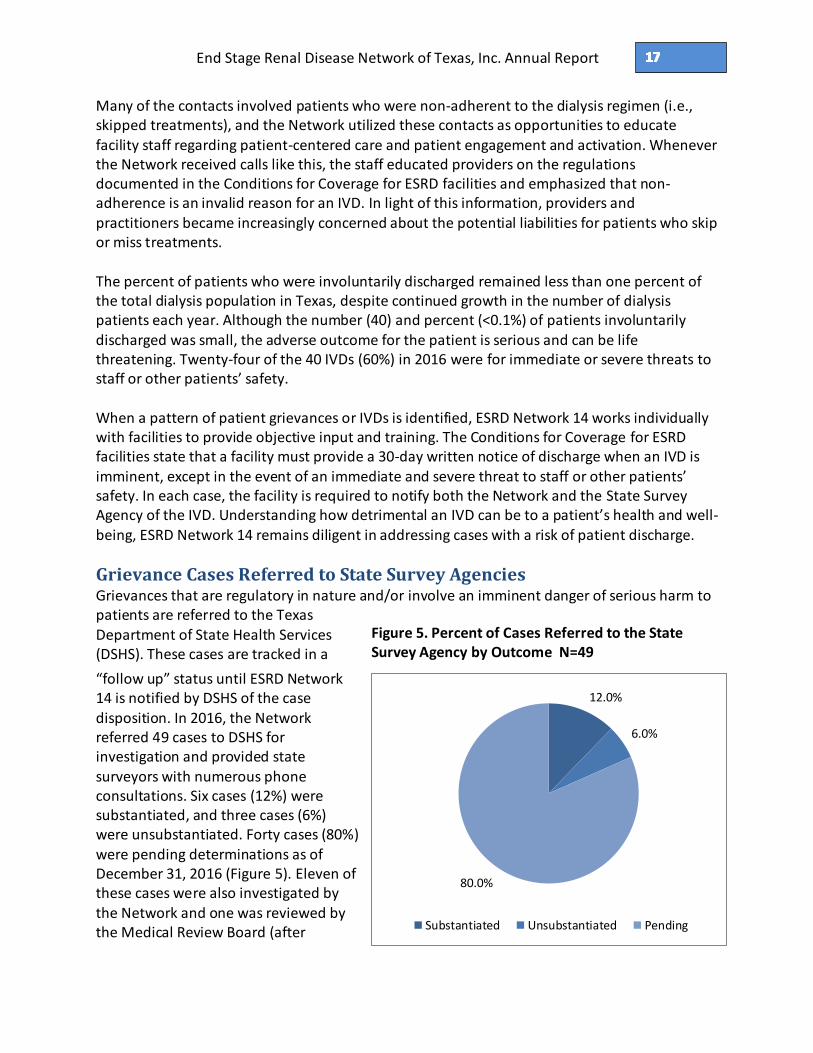
Grievance Cases Referred to State Survey Agencies Grievances that are regulatory in nature and/or involve an imminent danger of serious harm to patients are referred to the Texas Department of State Health Services (DSHS). These cases are tracked in a
“follow up” status until ESRD Network 14 is notified by DSHS of the case
disposition. In 2016, the Network referred 49 cases to DSHS for investigation and provided state
surveyors with numerous phone consultations. Six cases (12%) were substantiated, and three cases (6%) were unsubstantiated. Forty cases (80%) were pending determinations as of December 31, 2016 (Figure 5). Eleven of these cases were also investigated by the Network and one was reviewed by the Medical Review Board (after
12.0%
6.0%
80.0%
Substantiated Unsubstantiated Pending
Figure 5. Percent of Cases Referred to the State Survey Agency by Outcome N=49
End Stage Renal Disease Network of Texas, Inc. Annual Report
referred to State Survey Agency). Four of the cases were referred due to potential of imminent harm to patients of which one was substantiated and three were pending findings as of
December 31, 2016.
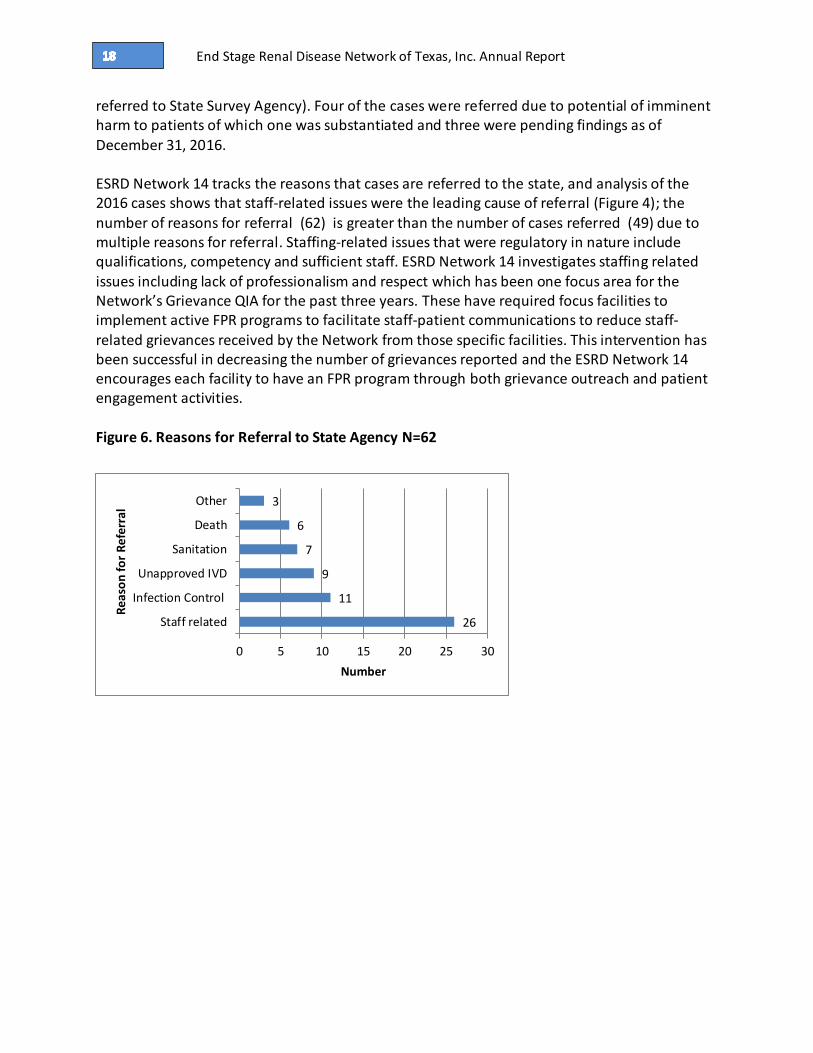
ESRD Network 14 tracks the reasons that cases are referred to the state, and analysis of the 2016 cases shows that staff-related issues were the leading cause of referral (Figure 4); the number of reasons for referral (62) is greater than the number of cases referred (49) due to multiple reasons for referral. Staffing-related issues that were regulatory in nature include qualifications, competency and sufficient staff. ESRD Network 14 investigates staffing related issues including lack of professionalism and respect which has been one focus area for the Network’s Grievance QIA for the past three years. These have required focus facilities to implement active FPR programs to facilitate staff-patient communications to reduce staff-
related grievances received by the Network from those specific facilities. This intervention has been successful in decreasing the number of grievances reported and the ESRD Network 14 encourages each facility to have an FPR program through both grievance outreach and patient engagement activities. Figure 6. Reasons for Referral to State Agency N=62
26
11
9
7
6
3
0 5 10 15 20 25 30
Staff related
Infection Control
Unapproved IVD
Sanitation
Death
Other
Number
Rea
son
for
Ref
erra
l

End Stage Renal Disease Network of Texas, Inc. Annual Report
List of Tables Data Table 1. ESRD Incidence Data Table 2. ESRD Dialysis Prevalence Data Table 3. Dialysis Patients Modality and Setting—In Home Report Data Table 4. Dialysis Patients Modality and Setting—In Center Report Data Table 5. All Renal Transplant Patients Report Data Table 6. Renal Transplant Recipient Report Data Table 7. Dialysis Death Report Data Table 8. Vocational Rehabilitation Report Data Table 9a. Incident ESRD Patients in Network 14’s Service Area, by Ethnicity and Race Data Table 9b. Prevalent Dialysis Patients in Network 14’s Service Area, by Ethnicity and Race
Data Table 9c. Renal Transplant Recipients* in Network 14’s Service Area, by Ethnicity and Race

End Stage Renal Disease Network of Texas, Inc. Annual Report
Appendix. Data Tables
Data Table 1. ESRD Incidence
Data Table 2. ESRD Dialysis Prevalence
Data Table 3. Dialysis Patients Modality and Setting—In Home Report
Data Table 4. Dialysis Patients Modality and Setting—In Center Report
Data Table 5. All Renal Transplant Patients Report
Data Table 6. Renal Transplant Recipient Report
Data Table 7. Dialysis Death Report
Data Table 8. Vocational Rehabilitation Report
Data Table 9a. Incident ESRD Patients in Network 14’s Service Area, by Ethnicity and Race
Data Table 9b. Prevalent Dialysis Patients in Network 14’s Service Area, by Ethnicity and Race
Data Table 9c. Renal Transplant Recipients* in Network 14’s Service Area, by Ethnicity and Race

End Stage Renal Disease Network of Texas, Inc. Annual Report
Network 14
Created: May 19, 2017
Table 1. Incident (New) ESRD Patients in Network 14's Service Area, by Patient Characteristics
January 1, 2016 - December 31, 2016
Network 14's Service Area TX Other Number Percent
Age Group
<= 4 Years 31 1 32 0.3%
5-9 Years 21 0 21 0.2%
10-14 Years 23 1 24 0.2%
15-19 Years 47 0 47 0.4%
20-24 Years 106 1 107 0.9%
25-29 Years 173 4 177 1.5%
30-34 Years 251 3 254 2.2%
35-39 Years 400 9 409 3.5%
40-44 Years 610 12 622 5.3%
45-49 Years 785 14 799 6.8%
50-54 Years 1134 19 1153 9.8%
55-59 Years 1426 14 1440 12.3%
60-64 Years 1567 25 1592 13.5%
65-69 Years 1684 29 1713 14.6%
70-74 Years 1316 21 1337 11.4%
75-79 Years 970 25 995 8.5%
80-84 Years 639 5 644 5.5%
>= 85 Years 381 5 386 3.3%
Network-Level Total 11564 188 11752 100.0%
Median Age 62 63 62
Gender
Female 5037 85 5122 43.6%
Male 6527 103 6630 56.4%
Network-Level Total 11564 188 11752 100.0%
Ethnicity*
Hispanic or Latino 4472 53 4525 38.5%
Not Hispanic or Latino 7067 135 7202 61.3%
Not Specified 25 25 0.2%
Network-Level Total 11564 188 11752 100.0%
Race*
American Indian/Alaska Native 15 2 17 0.1%
Asian 253 3 256 2.2%
Black or African American 2521 32 2553 21.7%
Native Hawaiian or Other Pacific Islander 61 4 65 0.6%
White 8673 145 8818 75.0%
More Than One Race Reported 16 2 18 0.2%
Not Specified 25 25 0.2%
Network-Level Total 11564 188 11752 100.0%

End Stage Renal Disease Network of Texas, Inc. Annual Report
Primary Cause of ESRD*
Diabetes 6185 97 6282 53.5%
Glomerulonephritis 478 11 489 4.2%
Secondary Glomerulonephritis/Vasc
ulitis 184 5 189 1.6%
Interstitial
Nephritis/Pyelonephritis 162 4 166 1.4%
Transplant Complications 35 2 37 0.3%
Hypertension/Large
Vessel Disease 2990 38 3028 25.8%
Cystic/Hereditary/Congen
ital/Other Diseases 284 11 295 2.5%
Neoplasms/Tumors 120 3 123 1.0%
Disorders of Mineral
Metabolism 2 0 2 0.0%
Genitourinary System 17 0 17 0.1%
Acute Kidney Failure 210 4 214 1.8%
Miscellaneous Conditions 371 4 375 3.2%
Not Specified 526 9 535 4.6%
Network-Level Total 11564 188 11752 100.0%
Source of data: CROWNWeb.
*Categories are from the CMS-2728 form.
NOTES:
1. This table includes data on dialysis and transplant patients whose initial “Admit Date” in CROWNWeb was
within the calendar year. Excludes patients with a "Discharge Reason” of acute kidney failure.
2. This table may include data on some patients receiving dialysis services from U.S. Department of Veterans
Affairs (VA) facilities.
3. Data on "ethnicity" and "race" should be interpreted with caution because of the inherent instability of
race/ethnicity data.

End Stage Renal Disease Network of Texas, Inc. Annual Report
Network 14 Created: May 23, 2017
Table 2. Prevalent Dialysis Patients in Network 14's Service Area, by Patient Characteristics
As of December 31, 2016
Network 14's Service Area TX Other Number Percent
Age Group
<= 4 Years 59 2 61 0.1%
5-9 Years 33 0 33 0.1%
10-14 Years 59 0 59 0.1%
15-19 Years 126 0 126 0.3%
20-24 Years 333 14 347 0.7%
25-29 Years 658 14 672 1.4%
30-34 Years 1034 17 1051 2.2%
35-39 Years 1701 26 1727 3.6%
40-44 Years 2550 35 2585 5.3%
45-49 Years 3613 44 3657 7.5%
50-54 Years 4868 65 4933 10.1%
55-59 Years 6162 79 6241 12.8%
60-64 Years 7053 102 7155 14.7%
65-69 Years 6957 103 7060 14.5%
70-74 Years 5253 63 5316 10.9%
75-79 Years 3682 67 3749 7.7%
80-84 Years 2346 53 2399 4.9%
>= 85 Years 1418 25 1443 3.0%
Network-Level Total 47905 709 48614 100.0%
Median Age 61 62 61
Gender
Female 21204 314 21518 44.3%
Male 26701 395 27096 55.7%
Network-Level Total 47905 709 48614 100.0%
Ethnicity*
Hispanic or Latino 20650 236 20886 43.0%
Not Hispanic or Latino 27228 473 27701 57.0%
Not Specified 27 27 0.1%
Network-Level Total 47905 709 48614 100.0%
Race*
American Indian/Alaska Native 61 14 75 0.2%
Asian 992 12 1004 2.1%
Black or African American 13026 172 13198 27.1%
Native Hawaiian or Other Pacific Islander 216 10 226 0.5%
White 33544 498 34042 70.0%
More Than One Race Reported 46 3 49 0.1%
Not Specified 20 20 0.0%
Network-Level Total 47905 709 48614 100.0%

End Stage Renal Disease Network of Texas, Inc. Annual Report
Primary Cause of ESRD*
Diabetes 25784 360 26144 53.8%
Glomerulonephritis 2742 52 2794 5.7%
Secondary Glomerulonephritis/Vasculitis 926 24 950 2.0%
Interstitial
Nephritis/Pyelonephritis 750 15 765 1.6%
Transplant Complications 30 1 31 0.1%
Hypertension/Large Vessel
Disease 12940 172 13112 27.0%
Cystic/Hereditary/Congenital/Oth
er Diseases 1306 30 1336 2.7%
Neoplasms/Tumors 1075 16 1091 2.2%
Disorders of Mineral Metabolism 1 0 1 0.0%
Genitourinary System 18 0 18 0.0%
Acute Kidney Failure 144 3 147 0.3%
Miscellaneous Conditions 1605 31 1636 3.4%
Not Specified 584 5 589 1.2%
Network-Level Total 47905 709 48614 100.0%
Source of data: CROWNWeb.
*Categories are from the CMS-2728 form.
NOTES:
1. This table includes data on all patients identified in CROWNWeb as alive and receiving dialysis services as of
December 31 of the calendar year.
2. This table may include data on some patients receiving dialysis services from U.S. Department of Veterans
Affairs (VA) facilities.
3. Data on "ethnicity" and "race" should be interpreted with caution because of the inherent instability of
race/ethnicity data.

End Stage Renal Disease Network of Texas, Inc. Annual Report
Network 14 Created: May 22,2017
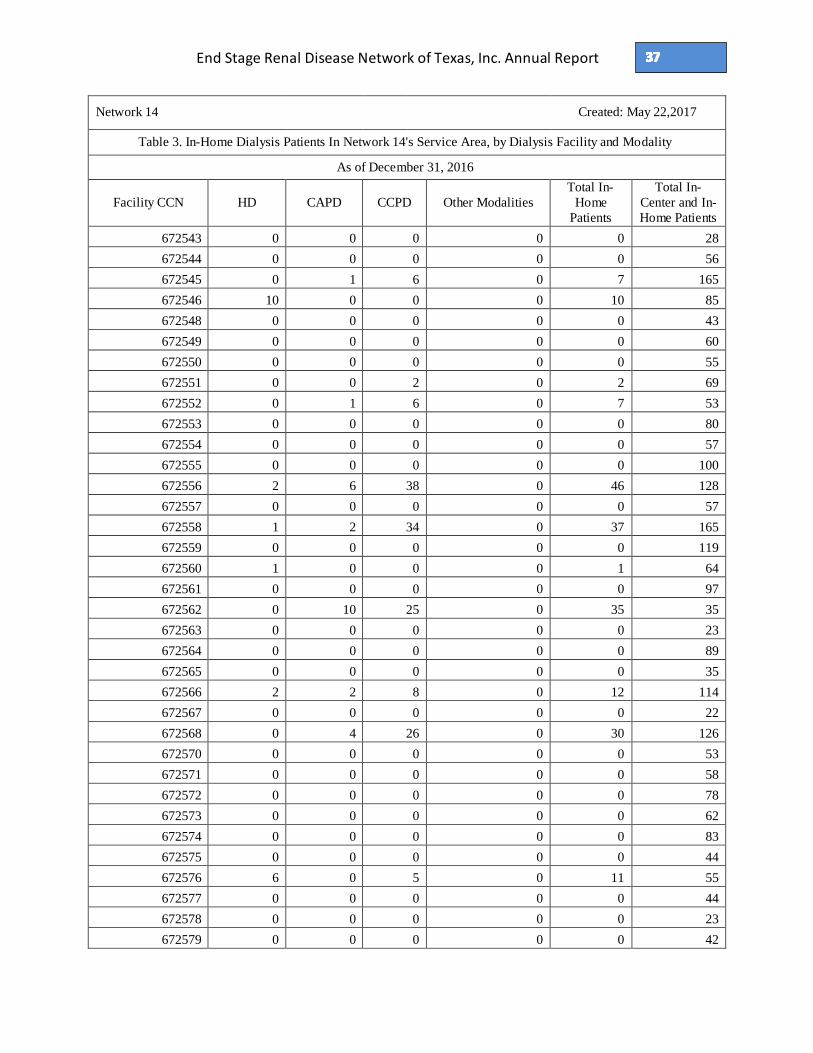
Table 3. In-Home Dialysis Patients In Network 14's Service Area, by Dialysis Facility and Modality
As of December 31, 2016
State HD CAPD CCPD Other
Modalities
Total In-Home
Patients
Total In-Center and In-
Home Patients
TX 539 702 3576 5 4822 48623
Network Total 539 702 3576 5 4822 48623
Source of data: ESRD Facility Survey (CMS-2744A) as recorded in CROWNWeb.
HD = Hemodialysis
CAPD = Continuous Ambulatory Peritoneal Dialysis
CCPD = Continuous Cycling Peritoneal Dialysis
NOTE: This table may include data for some U.S. Department of Veterans Affairs (VA) facilities.

End Stage Renal Disease Network of Texas, Inc. Annual Report
Network 14 Created: May 22,2017
Table 3. In-Home Dialysis Patients In Network 14's Service Area, by Dialysis Facility and Modality
As of December 31, 2016
Facility CCN HD CAPD CCPD Other Modalities
Total In-
Home
Patients
Total In-
Center and In-
Home Patients
450015 0 0 0 0 0 0
450018 5 0 9 0 14 14
450018 0 0 0 0 0 0
45001P 0 0 0 0 0 30
450021 0 0 0 0 0 0
45002P 0 0 0 0 0 1
450044 0 0 0 0 0 0
450051 0 0 0 0 0 0
450054 0 0 0 0 0 0
450068 0 0 0 0 0 0
450068 0 0 3 0 3 14
450083 0 0 0 0 0 0
450107 0 0 0 0 0 0
450135 0 0 0 0 0 0
450137 0 0 0 0 0 0
450193 0 0 0 0 0 0
450201 0 0 0 0 0 33
450213 0 0 7 0 7 14
450213 0 0 0 0 0 0
450237 0 0 0 0 0 0
450237 0 0 2 0 2 13
450271 0 1 0 0 1 94
450358 0 0 0 0 0 0
450369 0 0 0 0 0 16
450388 0 0 0 0 0 0
450571 0 6 7 0 13 143
450584 0 0 0 0 0 25
450647 0 0 0 0 0 0
45066F 0 7 2 0 9 68
450672 0 0 0 0 0 0
45068F 0 0 0 0 0 3
450809 0 0 0 0 0 0
45081F 0 0 0 0 0 50
452500 0 0 0 0 0 0
452501 0 12 20 0 32 32

End Stage Renal Disease Network of Texas, Inc. Annual Report
Network 14 Created: May 22,2017
Table 3. In-Home Dialysis Patients In Network 14's Service Area, by Dialysis Facility and Modality
As of December 31, 2016
Facility CCN HD CAPD CCPD Other Modalities
Total In-
Home
Patients
Total In-
Center and In-
Home Patients
452506 0 14 11 0 25 195
452507 0 2 8 0 10 104
452508 0 7 33 0 40 251
452510 1 3 11 0 15 191
452511 0 1 4 0 5 135
452512 0 2 2 0 4 94
452513 5 0 38 0 43 142
452514 0 0 0 0 0 116
452517 0 0 0 0 0 174
452518 0 0 0 0 0 83
452519 0 0 2 0 2 49
452520 0 0 0 0 0 93
452522 0 0 7 0 7 126
452524 0 0 9 0 9 123
452526 13 1 20 0 34 129
452528 0 0 32 0 32 134
452530 0 0 0 0 0 91
452532 0 0 0 0 0 71
452533 0 14 19 0 33 183
452537 0 0 0 0 0 68
452539 0 0 0 0 0 77
452540 0 0 0 0 0 99
452541 0 0 0 0 0 176
452542 0 1 17 0 18 138
452544 0 0 0 0 0 70
452546 3 6 23 4 36 115
452550 0 1 6 0 7 91
452552 2 35 27 0 64 184
452553 2 1 12 0 15 99
452554 0 0 0 0 0 0
452556 0 0 0 0 0 35
452557 0 0 0 0 0 22
452559 0 0 4 0 4 68
452560 0 0 0 0 0 82
452561 0 0 0 0 0 205

End Stage Renal Disease Network of Texas, Inc. Annual Report
Network 14 Created: May 22,2017
Table 3. In-Home Dialysis Patients In Network 14's Service Area, by Dialysis Facility and Modality
As of December 31, 2016
Facility CCN HD CAPD CCPD Other Modalities
Total In-
Home
Patients
Total In-
Center and In-
Home Patients
452563 0 0 2 0 2 41
452568 4 5 38 0 47 165
452570 0 1 23 0 24 111
452571 0 3 15 0 18 129
452572 0 5 27 0 32 330
452574 0 4 13 0 17 179
452575 0 3 15 0 18 147
452576 0 4 27 0 31 151
452577 0 1 21 0 22 145
452579 0 0 0 0 0 163
452580 0 0 0 0 0 111
452582 0 0 0 0 0 48
452583 0 0 0 0 0 79
452584 0 2 20 0 22 95
452585 0 0 0 0 0 163
452587 0 1 18 0 19 90
452592 0 1 11 0 12 155
452594 0 0 0 0 0 76
452595 6 14 38 0 58 170
452598 0 0 0 0 0 109
452602 0 0 0 0 0 84
452604 0 0 0 0 0 48
452605 0 0 0 0 0 69
452606 0 0 0 0 0 31
452609 0 8 14 0 22 122
452610 0 0 0 0 0 105
452611 0 0 0 0 0 91
452612 0 0 0 0 0 1
452615 0 0 0 0 0 61
452616 0 0 0 0 0 79
452618 12 2 6 0 20 105
452619 0 0 0 0 0 113
452620 0 0 0 0 0 92
452622 0 0 32 0 32 137
452623 0 0 0 0 0 73

End Stage Renal Disease Network of Texas, Inc. Annual Report
Network 14 Created: May 22,2017
Table 3. In-Home Dialysis Patients In Network 14's Service Area, by Dialysis Facility and Modality
As of December 31, 2016
Facility CCN HD CAPD CCPD Other Modalities
Total In-
Home
Patients
Total In-
Center and In-
Home Patients
452624 0 0 0 0 0 53
452626 0 0 0 0 0 62
452629 0 0 0 0 0 109
452630 0 0 0 0 0 48
452631 8 11 38 0 57 213
452633 0 0 0 0 0 84
452635 0 0 0 0 0 81
452636 0 0 0 0 0 126
452637 0 0 0 0 0 102
452638 0 1 2 0 3 153
452639 0 0 17 0 17 107
452640 0 0 7 0 7 67
452641 0 0 0 0 0 47
452642 0 0 0 0 0 87
452644 0 0 0 0 0 74
452645 0 0 0 0 0 55
452646 0 0 0 0 0 71
452647 0 0 0 0 0 88
452648 0 0 0 0 0 104
452651 0 0 0 0 0 86
452654 0 1 9 0 10 166
452655 0 0 0 0 0 80
452656 9 20 81 0 110 110
452658 0 5 29 0 34 151
452660 0 0 0 0 0 56
452661 0 0 0 0 0 47
452663 0 2 15 0 17 72
452664 0 0 0 0 0 73
452665 0 6 14 0 20 98
452666 0 0 0 0 0 99
452667 0 0 0 0 0 186
452668 0 0 0 0 0 100
452669 0 0 0 0 0 45
452671 7 2 14 0 23 123
452672 0 0 0 0 0 133

End Stage Renal Disease Network of Texas, Inc. Annual Report
Network 14 Created: May 22,2017
Table 3. In-Home Dialysis Patients In Network 14's Service Area, by Dialysis Facility and Modality
As of December 31, 2016
Facility CCN HD CAPD CCPD Other Modalities
Total In-
Home
Patients
Total In-
Center and In-
Home Patients
452673 0 0 0 0 0 46
452674 0 1 8 0 9 66
452675 0 0 0 0 0 248
452676 0 0 0 0 0 141
452677 0 0 0 0 0 65
452678 0 0 0 0 0 138
452679 0 0 0 0 0 150
452682 0 0 0 0 0 92
452684 0 0 0 0 0 106
452685 0 0 0 0 0 163
452686 38 2 4 0 44 167
452687 0 0 0 0 0 168
452688 0 0 0 0 0 162
452689 4 1 3 0 8 114
452690 0 0 0 0 0 142
452692 0 0 0 0 0 93
452693 0 0 0 0 0 156
452694 0 0 0 0 0 69
452696 0 0 0 0 0 101
452697 0 0 0 0 0 156
452699 0 0 0 0 0 144
452702 0 0 0 0 0 143
452703 0 0 17 1 18 92
452705 0 0 0 0 0 84
452706 0 0 0 0 0 72
452707 0 3 8 0 11 105
452708 0 0 0 0 0 53
452709 0 0 0 0 0 82
452710 0 0 0 0 0 47
452711 11 5 19 0 35 143
452714 0 0 0 0 0 114
452715 2 5 30 0 37 153
452718 0 0 0 0 0 52
452719 1 1 2 0 4 76
452720 0 0 0 0 0 104

End Stage Renal Disease Network of Texas, Inc. Annual Report
Network 14 Created: May 22,2017
Table 3. In-Home Dialysis Patients In Network 14's Service Area, by Dialysis Facility and Modality
As of December 31, 2016
Facility CCN HD CAPD CCPD Other Modalities
Total In-
Home
Patients
Total In-
Center and In-
Home Patients
452722 0 0 0 0 0 50
452727 2 19 29 0 50 158
452728 0 0 0 0 0 79
452731 0 0 0 0 0 63
452732 0 8 2 0 10 95
452733 0 0 0 0 0 62
452734 0 0 0 0 0 65
452735 4 6 24 0 34 128
452736 0 18 137 0 155 230
452737 0 6 3 0 9 126
452738 0 0 0 0 0 67
452739 0 16 20 0 36 146
452740 0 0 0 0 0 51
452741 0 4 79 0 83 363
452742 0 0 1 0 1 68
452743 0 0 0 0 0 103
452744 4 23 55 0 82 213
452745 0 0 0 0 0 138
452747 0 1 4 0 5 58
452748 0 4 16 0 20 92
452749 0 5 6 0 11 111
452750 2 2 10 0 14 141
452751 0 0 0 0 0 89
452752 0 0 0 0 0 54
452753 0 0 0 0 0 33
452754 0 0 0 0 0 56
452755 0 3 31 0 34 158
452757 0 0 0 0 0 59
452758 0 0 15 0 15 123
452760 0 0 0 0 0 45
452761 0 0 0 0 0 89
452762 0 0 0 0 0 84
452763 0 0 25 0 25 112
452764 0 3 1 0 4 147
452765 0 0 0 0 0 41

End Stage Renal Disease Network of Texas, Inc. Annual Report
Network 14 Created: May 22,2017
Table 3. In-Home Dialysis Patients In Network 14's Service Area, by Dialysis Facility and Modality
As of December 31, 2016
Facility CCN HD CAPD CCPD Other Modalities
Total In-
Home
Patients
Total In-
Center and In-
Home Patients
452767 0 0 0 0 0 115
452768 0 1 4 0 5 48
452769 0 0 0 0 0 50
452772 0 0 0 0 0 69
452773 0 0 0 0 0 165
452774 0 0 0 0 0 93
452776 0 0 0 0 0 67
452777 0 1 4 0 5 111
452778 0 0 0 0 0 86
452779 0 0 0 0 0 54
452780 0 0 0 0 0 118
452781 0 0 0 0 0 143
452782 0 0 0 0 0 78
452783 0 1 10 0 11 60
452784 0 1 13 0 14 177
452785 0 0 0 0 0 69
452786 0 0 0 0 0 104
452787 0 3 15 0 18 112
452788 0 0 0 0 0 81
452789 0 0 0 0 0 226
452790 0 0 0 0 0 127
452791 0 0 10 0 10 85
452792 1 2 21 0 24 196
452793 0 0 0 0 0 87
452794 0 0 0 0 0 37
452796 0 0 0 0 0 70
452797 0 0 0 0 0 171
452798 0 0 3 0 3 98
452799 0 0 0 0 0 117
452800 0 0 0 0 0 108
452801 91 1 22 0 114 114
452802 0 0 0 0 0 36
452803 0 0 0 0 0 54
452804 0 0 0 0 0 21
452805 0 0 0 0 0 55

End Stage Renal Disease Network of Texas, Inc. Annual Report
Network 14 Created: May 22,2017
Table 3. In-Home Dialysis Patients In Network 14's Service Area, by Dialysis Facility and Modality
As of December 31, 2016
Facility CCN HD CAPD CCPD Other Modalities
Total In-
Home
Patients
Total In-
Center and In-
Home Patients
452806 0 0 0 0 0 15
452808 0 0 0 0 0 49
452809 0 0 0 0 0 46
452811 0 3 5 0 8 87
452812 0 1 7 0 8 93
452813 0 0 0 0 0 72
452814 0 0 0 0 0 94
452816 0 0 0 0 0 79
452817 0 3 8 0 11 185
452819 0 2 12 0 14 88
452820 0 0 0 0 0 139
452821 0 0 0 0 0 89
452822 0 0 0 0 0 90
452823 0 0 0 0 0 99
452825 0 0 0 0 0 97
452826 0 0 0 0 0 60
452827 0 1 4 0 5 64
452828 20 0 0 0 20 20
452829 0 0 0 0 0 61
452830 0 0 0 0 0 63
452831 0 0 0 0 0 92
452832 0 0 0 0 0 24
452833 0 1 18 0 19 74
452834 0 2 13 0 15 100
452835 0 1 5 0 6 144
452836 0 0 0 0 0 58
452837 0 0 0 0 0 65
452838 0 0 0 0 0 138
452840 28 1 9 0 38 38
452841 0 1 4 0 5 42
452842 0 0 6 0 6 8
452844 0 0 0 0 0 65
452845 0 1 7 0 8 97
452846 0 2 10 0 12 137
452847 0 0 0 0 0 67

End Stage Renal Disease Network of Texas, Inc. Annual Report
Network 14 Created: May 22,2017
Table 3. In-Home Dialysis Patients In Network 14's Service Area, by Dialysis Facility and Modality
As of December 31, 2016
Facility CCN HD CAPD CCPD Other Modalities
Total In-
Home
Patients
Total In-
Center and In-
Home Patients
452848 0 0 0 0 0 82
452849 0 0 0 0 0 69
452850 0 0 0 0 0 57
452851 0 0 0 0 0 108
452853 0 0 0 0 0 87
452854 0 0 0 0 0 46
452855 0 0 0 0 0 83
452856 0 0 0 0 0 65
452857 5 2 49 0 56 57
452858 0 0 66 0 66 183
452859 0 0 0 0 0 75
452860 0 0 11 0 11 78
452861 0 0 0 0 0 112
452862 0 0 0 0 0 75
452863 0 0 0 0 0 77
452864 0 0 0 0 0 87
452865 0 0 0 0 0 91
452866 0 27 57 0 84 179
452867 0 3 11 0 14 54
452868 0 0 11 0 11 80
452869 0 0 0 0 0 82
452870 0 0 0 0 0 106
452872 0 3 18 0 21 146
452873 0 0 0 0 0 69
452875 0 0 0 0 0 65
452877 7 0 12 0 19 76
452878 0 0 0 0 0 45
452880 0 0 0 0 0 86
452881 0 0 0 0 0 98
452882 9 13 83 0 105 105
452883 0 0 0 0 0 87
452884 0 0 0 0 0 56
452885 0 0 0 0 0 53
452886 0 1 4 0 5 66
452887 0 0 0 0 0 85

End Stage Renal Disease Network of Texas, Inc. Annual Report
Network 14 Created: May 22,2017
Table 3. In-Home Dialysis Patients In Network 14's Service Area, by Dialysis Facility and Modality
As of December 31, 2016
Facility CCN HD CAPD CCPD Other Modalities
Total In-
Home
Patients
Total In-
Center and In-
Home Patients
452889 0 0 0 0 0 50
452890 0 0 0 0 0 128
452891 0 0 0 0 0 31
452892 0 0 0 0 0 90
452893 0 0 0 0 0 55
452894 0 0 0 0 0 57
452895 0 1 16 0 17 73
452896 0 0 0 0 0 98
452897 0 0 0 0 0 50
452898 0 0 9 0 9 61
452899 0 0 0 0 0 91
453300 0 0 21 0 21 35
453300 0 0 0 0 0 0
453301 0 0 0 0 0 0
453301 0 1 4 0 5 14
453302 0 0 38 0 38 69
453302 0 0 0 0 0 0
453304 0 0 0 0 0 0
453304 0 0 17 0 17 52
453500 0 0 0 0 0 135
453501 0 0 0 0 0 60
453502 11 20 18 0 49 291
453503 0 0 0 0 0 70
453504 0 0 0 0 0 87
453509 0 0 0 0 0 98
453511 0 0 0 0 0 158
453512 0 0 0 0 0 77
453513 0 3 30 0 33 147
453514 0 0 0 0 0 20
453516 0 0 0 0 0 4
672500 0 0 0 0 0 90
672501 0 3 13 0 16 191
672502 0 0 0 0 0 141
672503 0 0 0 0 0 85
672504 0 0 0 0 0 88

End Stage Renal Disease Network of Texas, Inc. Annual Report
Network 14 Created: May 22,2017
Table 3. In-Home Dialysis Patients In Network 14's Service Area, by Dialysis Facility and Modality
As of December 31, 2016
Facility CCN HD CAPD CCPD Other Modalities
Total In-
Home
Patients
Total In-
Center and In-
Home Patients
672505 0 0 0 0 0 95
672506 0 0 19 0 19 94
672507 0 0 0 0 0 89
672508 0 1 41 0 42 153
672509 0 0 0 0 0 39
672510 0 0 0 0 0 156
672511 0 0 0 0 0 35
672513 0 0 0 0 0 27
672514 0 0 0 0 0 105
672515 5 8 18 0 31 140
672516 0 0 0 0 0 72
672517 0 0 0 0 0 161
672518 0 0 0 0 0 90
672519 0 0 0 0 0 90
672520 0 0 0 0 0 50
672521 0 0 0 0 0 85
672522 1 6 6 0 13 72
672523 0 0 0 0 0 115
672524 0 0 0 0 0 42
672525 0 0 0 0 0 62
672526 0 0 0 0 0 68
672527 0 17 5 0 22 131
672529 0 0 0 0 0 70
672530 0 0 0 0 0 52
672531 22 1 26 0 49 115
672532 0 0 0 0 0 90
672534 0 1 8 0 9 97
672535 0 0 0 0 0 82
672536 0 0 6 0 6 145
672537 0 0 0 0 0 66
672538 0 4 21 0 25 92
672539 0 0 0 0 0 25
672540 8 5 21 0 34 125
672541 0 0 0 0 0 116
672542 0 5 29 0 34 143
End Stage Renal Disease Network of Texas, Inc. Annual Report
Network 14 Created: May 22,2017
Table 3. In-Home Dialysis Patients In Network 14's Service Area, by Dialysis Facility and Modality
As of December 31, 2016
Facility CCN HD CAPD CCPD Other Modalities
Total In-
Home
Patients
Total In-
Center and In-
Home Patients
672543 0 0 0 0 0 28
672544 0 0 0 0 0 56
672545 0 1 6 0 7 165
672546 10 0 0 0 10 85
672548 0 0 0 0 0 43
672549 0 0 0 0 0 60
672550 0 0 0 0 0 55
672551 0 0 2 0 2 69
672552 0 1 6 0 7 53
672553 0 0 0 0 0 80
672554 0 0 0 0 0 57
672555 0 0 0 0 0 100
672556 2 6 38 0 46 128
672557 0 0 0 0 0 57
672558 1 2 34 0 37 165
672559 0 0 0 0 0 119
672560 1 0 0 0 1 64
672561 0 0 0 0 0 97
672562 0 10 25 0 35 35
672563 0 0 0 0 0 23
672564 0 0 0 0 0 89
672565 0 0 0 0 0 35
672566 2 2 8 0 12 114
672567 0 0 0 0 0 22
672568 0 4 26 0 30 126
672570 0 0 0 0 0 53
672571 0 0 0 0 0 58
672572 0 0 0 0 0 78
672573 0 0 0 0 0 62
672574 0 0 0 0 0 83
672575 0 0 0 0 0 44
672576 6 0 5 0 11 55
672577 0 0 0 0 0 44
672578 0 0 0 0 0 23
672579 0 0 0 0 0 42

End Stage Renal Disease Network of Texas, Inc. Annual Report
Network 14 Created: May 22,2017
Table 3. In-Home Dialysis Patients In Network 14's Service Area, by Dialysis Facility and Modality
As of December 31, 2016
Facility CCN HD CAPD CCPD Other Modalities
Total In-
Home
Patients
Total In-
Center and In-
Home Patients
672580 0 0 0 0 0 51
672581 5 3 11 0 19 94
672583 18 0 0 0 18 18
672584 0 0 0 0 0 49
672585 0 0 0 0 0 48
672586 0 0 0 0 0 89
672587 0 0 0 0 0 116
672588 0 0 0 0 0 24
672589 0 0 7 0 7 98
672590 0 0 0 0 0 115
672591 0 1 9 0 10 61
672592 0 0 0 0 0 69
672593 0 8 36 0 44 158
672594 0 0 0 0 0 23
672595 0 0 0 0 0 34
672596 0 0 0 0 0 30
672598 0 0 0 0 0 18
672599 0 0 0 0 0 30
672600 0 0 8 0 8 102
672601 0 1 22 0 23 75
672602 0 0 1 0 1 40
672603 0 0 0 0 0 48
672604 0 0 0 0 0 73
672605 0 0 0 0 0 84
672606 0 0 0 0 0 66
672607 0 0 0 0 0 29
672608 0 2 25 0 27 123
672610 0 0 1 0 1 46
672611 0 0 0 0 0 56
672612 0 0 0 0 0 60
672613 6 3 50 0 59 60
672614 0 1 8 0 9 51
672615 0 0 4 0 4 54
672616 0 0 2 0 2 92
672617 0 0 1 0 1 53

End Stage Renal Disease Network of Texas, Inc. Annual Report
Network 14 Created: May 22,2017
Table 3. In-Home Dialysis Patients In Network 14's Service Area, by Dialysis Facility and Modality
As of December 31, 2016
Facility CCN HD CAPD CCPD Other Modalities
Total In-
Home
Patients
Total In-
Center and In-
Home Patients
672618 0 0 0 0 0 50
672619 0 0 0 0 0 19
672620 2 0 0 0 2 38
672621 0 0 0 0 0 38
672623 0 0 0 0 0 33
672624 0 0 0 0 0 29
672625 0 0 3 0 3 39
672626 36 1 32 0 69 76
672627 0 3 4 0 7 159
672628 0 0 0 0 0 26
672629 0 0 0 0 0 58
672630 0 0 0 0 0 96
672631 0 1 3 0 4 35
672632 0 6 8 0 14 83
672633 0 0 0 0 0 127
672634 0 0 4 0 4 49
672635 0 0 0 0 0 67
672636 12 0 0 0 12 78
672637 0 0 0 0 0 52
672638 0 0 0 0 0 38
672639 0 0 0 0 0 36
672640 0 0 0 0 0 63
672641 0 2 7 0 9 63
672642 0 0 0 0 0 46
672643 0 0 0 0 0 35
672644 0 0 0 0 0 71
672645 0 0 0 0 0 58
672646 0 0 2 0 2 77
672647 0 0 0 0 0 55
672648 0 0 0 0 0 66
672649 0 2 19 0 21 72
672650 0 0 0 0 0 43
672651 14 7 53 0 74 74
672652 0 0 0 0 0 35
672653 0 4 11 0 15 69

End Stage Renal Disease Network of Texas, Inc. Annual Report
Network 14 Created: May 22,2017
Table 3. In-Home Dialysis Patients In Network 14's Service Area, by Dialysis Facility and Modality
As of December 31, 2016
Facility CCN HD CAPD CCPD Other Modalities
Total In-
Home
Patients
Total In-
Center and In-
Home Patients
672654 0 0 0 0 0 64
672655 0 0 0 0 0 71
672656 0 0 0 0 0 43
672657 0 0 0 0 0 37
672658 0 0 0 0 0 72
672659 0 0 0 0 0 88
672660 0 0 0 0 0 27
672661 0 0 0 0 0 37
672662 0 1 0 0 1 43
672663 0 3 31 0 34 95
672664 2 3 24 0 29 29
672665 0 2 8 0 10 229
672666 0 2 11 0 13 65
672667 0 0 26 0 26 126
672668 0 0 5 0 5 56
672669 0 0 0 0 0 73
672670 0 0 0 0 0 104
672671 0 5 10 0 15 98
672672 0 0 0 0 0 70
672673 0 0 0 0 0 70
672674 0 2 2 0 4 77
672675 0 5 10 0 15 110
672676 0 0 0 0 0 93
672677 0 0 0 0 0 33
672678 3 3 4 0 10 83
672679 0 0 0 0 0 34
672680 0 0 5 0 5 67
672681 7 0 1 0 8 11
672682 0 0 0 0 0 28
672683 0 6 10 0 16 117
672684 0 0 0 0 0 34
672685 0 0 9 0 9 44
672686 0 0 0 0 0 47
672687 0 1 5 0 6 44
672688 0 0 0 0 0 72

End Stage Renal Disease Network of Texas, Inc. Annual Report
Network 14 Created: May 22,2017
Table 3. In-Home Dialysis Patients In Network 14's Service Area, by Dialysis Facility and Modality
As of December 31, 2016
Facility CCN HD CAPD CCPD Other Modalities
Total In-
Home
Patients
Total In-
Center and In-
Home Patients
672689 0 0 0 0 0 19
672690 0 2 24 0 26 26
672691 0 0 0 0 0 80
672692 0 0 0 0 0 109
672693 0 3 5 0 8 99
672694 0 0 0 0 0 39
672695 0 0 0 0 0 32
672696 0 0 0 0 0 71
672697 0 0 0 0 0 77
672698 0 0 0 0 0 8
672699 0 6 1 0 7 96
672700 0 0 0 0 0 53
672701 1 1 16 0 18 64
672702 0 1 10 0 11 50
672703 0 0 0 0 0 59
672704 0 1 4 0 5 69
672705 0 0 0 0 0 92
672706 0 3 20 0 23 104
672707 0 0 19 0 19 99
672708 0 0 6 0 6 99
672709 0 2 12 0 14 147
672710 0 0 0 0 0 24
672711 0 0 0 0 0 52
672712 0 0 0 0 0 51
672713 0 1 4 0 5 56
672714 0 0 40 0 40 40
672715 0 0 0 0 0 33
672716 0 0 0 0 0 44
672717 0 0 21 0 21 63
672718 8 5 21 0 34 34
672719 0 2 3 0 5 47
672720 0 1 3 0 4 38
672721 0 0 0 0 0 35
672722 5 2 16 0 23 97
672723 1 0 6 0 7 64

End Stage Renal Disease Network of Texas, Inc. Annual Report
Network 14 Created: May 22,2017
Table 3. In-Home Dialysis Patients In Network 14's Service Area, by Dialysis Facility and Modality
As of December 31, 2016
Facility CCN HD CAPD CCPD Other Modalities
Total In-
Home
Patients
Total In-
Center and In-
Home Patients
672724 0 0 4 0 4 23
672725 0 3 12 0 15 76
672726 0 5 6 0 11 68
672727 0 2 5 0 7 7
672728 0 0 0 0 0 39
672729 0 0 18 0 18 40
672730 0 0 2 0 2 49
672731 0 0 6 0 6 36
672732 0 0 0 0 0 30
672733 0 0 10 0 10 31
672734 0 2 9 0 11 66
672735 0 0 0 0 0 40
672736 2 0 15 0 17 17
672737 0 0 0 0 0 30
672738 0 0 0 0 0 34
672739 0 0 3 0 3 53
672740 0 0 0 0 0 55
672741 0 0 0 0 0 30
672742 0 0 0 0 0 51
672743 0 0 0 0 0 48
672744 0 2 9 0 11 71
672745 0 1 7 0 8 55
672746 0 5 24 0 29 106
672747 0 3 1 0 4 51
672748 0 0 1 0 1 23
672749 0 0 0 0 0 17
672750 0 0 0 0 0 7
672751 0 0 0 0 0 67
672752 3 4 31 0 38 38
672753 0 6 8 0 14 55
672754 0 0 0 0 0 43
672755 2 0 1 0 3 20
672756 0 0 1 0 1 28
672757 0 0 1 0 1 52
672758 0 0 0 0 0 30

End Stage Renal Disease Network of Texas, Inc. Annual Report
Network 14 Created: May 22,2017
Table 3. In-Home Dialysis Patients In Network 14's Service Area, by Dialysis Facility and Modality
As of December 31, 2016
Facility CCN HD CAPD CCPD Other Modalities
Total In-
Home
Patients
Total In-
Center and In-
Home Patients
672759 0 0 3 0 3 52
672760 2 1 37 0 40 68
672761 0 0 0 0 0 25
672762 0 0 0 0 0 17
672763 1 6 2 0 9 46
672764 0 0 3 0 3 40
672765 1 6 1 0 8 50
672766 4 0 17 0 21 53
672767 0 1 5 0 6 79
672768 0 0 19 0 19 19
672769 0 0 0 0 0 51
672770 0 0 7 0 7 27
672771 0 0 0 0 0 28
672772 2 4 13 0 19 19
672773 0 0 4 0 4 35
672774 1 0 5 0 6 35
672775 0 0 0 0 0 41
672776 0 0 0 0 0 18
672777 0 0 0 0 0 29
672778 0 0 0 0 0 64
672779 0 0 1 0 1 22
672780 0 0 0 0 0 17
672781 0 0 1 0 1 10
672782 0 0 0 0 0 13
672783 0 0 0 0 0 8
672784 0 0 12 0 12 32
672785 3 0 18 0 21 62
672786 0 0 2 0 2 29
672787 3 0 10 0 13 13
672788 0 0 0 0 0 5
672789 0 0 0 0 0 10
672790 0 0 0 0 0 16
672791 12 6 15 0 33 109
672792 1 1 9 0 11 11
672793 7 4 12 0 23 123

End Stage Renal Disease Network of Texas, Inc. Annual Report
Network 14 Created: May 22,2017
Table 3. In-Home Dialysis Patients In Network 14's Service Area, by Dialysis Facility and Modality
As of December 31, 2016
Facility CCN HD CAPD CCPD Other Modalities
Total In-
Home
Patients
Total In-
Center and In-
Home Patients
672794 0 0 0 0 0 17
672795 0 0 0 0 0 6
672796 0 0 0 0 0 11
672797 0 0 0 0 0 4
672798 0 0 0 0 0 7
672799 0 0 0 0 0 6
678853 0 0 0 0 0 0
678863 0 0 5 0 5 5
TX Total 539 702 3576 5 4822 48623
Source of data: ESRD Facility Survey (CMS-2744A) as recorded in CROWNWeb.
HD = Hemodialysis
CAPD = Continuous Ambulatory Peritoneal Dialysis
CCPD = Continuous Cycling Peritoneal Dialysis
NOTE: This table may include data for some U.S. Department of Veterans Affairs (VA) facilities.
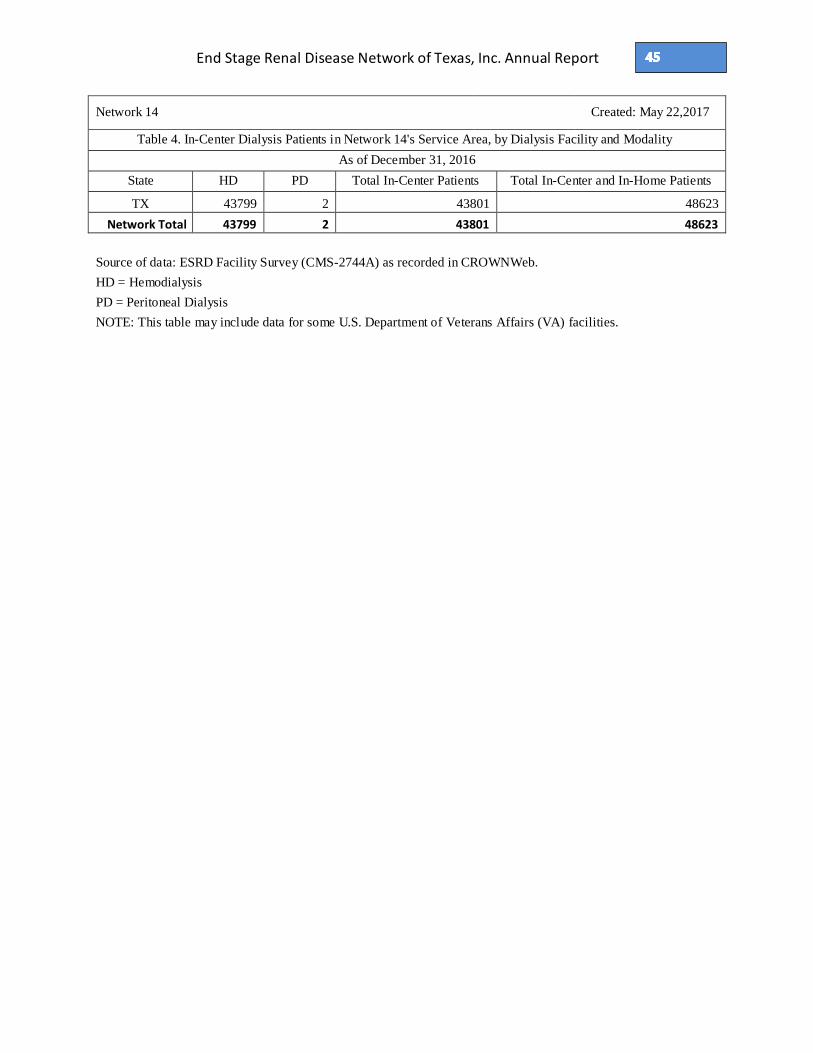
End Stage Renal Disease Network of Texas, Inc. Annual Report
Network 14 Created: May 22,2017
Table 4. In-Center Dialysis Patients in Network 14's Service Area, by Dialysis Facility and Modality
As of December 31, 2016
State HD PD Total In-Center Patients Total In-Center and In-Home Patients
TX 43799 2 43801 48623
Network Total 43799 2 43801 48623
Source of data: ESRD Facility Survey (CMS-2744A) as recorded in CROWNWeb.
HD = Hemodialysis
PD = Peritoneal Dialysis
NOTE: This table may include data for some U.S. Department of Veterans Affairs (VA) facilities.

End Stage Renal Disease Network of Texas, Inc. Annual Report
Network 14 Created: May 22,2017
Table 4. In-Center Dialysis Patients in Network 14's Service Area, by Dialysis Facility and Modality
As of December 31, 2016
Facility CCN HD PD Total In-Center Patients Total In-Center and In-Home Patients
450015 0 0 0 0
450018 0 0 0 14
450018 0 0 0 0
45001P 30 0 30 30
450021 0 0 0 0
45002P 1 0 1 1
450044 0 0 0 0
450051 0 0 0 0
450054 0 0 0 0
450068 0 0 0 0
450068 11 0 11 14
450083 0 0 0 0
450107 0 0 0 0
450135 0 0 0 0
450137 0 0 0 0
450193 0 0 0 0
450201 33 0 33 33
450213 7 0 7 14
450213 0 0 0 0
450237 0 0 0 0
450237 11 0 11 13
450271 93 0 93 94
450358 0 0 0 0
450369 16 0 16 16
450388 0 0 0 0
450571 130 0 130 143
450584 25 0 25 25
450647 0 0 0 0
45066F 59 0 59 68
450672 0 0 0 0
45068F 3 0 3 3
450809 0 0 0 0
45081F 50 0 50 50
452500 0 0 0 0
452501 0 0 0 32
452506 170 0 170 195

End Stage Renal Disease Network of Texas, Inc. Annual Report
Network 14 Created: May 22,2017
Table 4. In-Center Dialysis Patients in Network 14's Service Area, by Dialysis Facility and Modality
As of December 31, 2016
Facility CCN HD PD Total In-Center Patients Total In-Center and In-Home Patients
452507 94 0 94 104
452508 211 0 211 251
452510 176 0 176 191
452511 130 0 130 135
452512 90 0 90 94
452513 99 0 99 142
452514 116 0 116 116
452517 174 0 174 174
452518 83 0 83 83
452519 47 0 47 49
452520 93 0 93 93
452522 119 0 119 126
452524 114 0 114 123
452526 95 0 95 129
452528 102 0 102 134
452530 91 0 91 91
452532 71 0 71 71
452533 150 0 150 183
452537 68 0 68 68
452539 77 0 77 77
452540 99 0 99 99
452541 176 0 176 176
452542 120 0 120 138
452544 70 0 70 70
452546 79 0 79 115
452550 84 0 84 91
452552 120 0 120 184
452553 84 0 84 99
452554 0 0 0 0
452556 35 0 35 35
452557 22 0 22 22
452559 64 0 64 68
452560 82 0 82 82
452561 205 0 205 205
452563 39 0 39 41
452568 118 0 118 165

End Stage Renal Disease Network of Texas, Inc. Annual Report
Network 14 Created: May 22,2017
Table 4. In-Center Dialysis Patients in Network 14's Service Area, by Dialysis Facility and Modality
As of December 31, 2016
Facility CCN HD PD Total In-Center Patients Total In-Center and In-Home Patients
452570 87 0 87 111
452571 111 0 111 129
452572 298 0 298 330
452574 162 0 162 179
452575 129 0 129 147
452576 120 0 120 151
452577 123 0 123 145
452579 163 0 163 163
452580 111 0 111 111
452582 48 0 48 48
452583 79 0 79 79
452584 73 0 73 95
452585 163 0 163 163
452587 71 0 71 90
452592 143 0 143 155
452594 76 0 76 76
452595 112 0 112 170
452598 109 0 109 109
452602 84 0 84 84
452604 48 0 48 48
452605 69 0 69 69
452606 31 0 31 31
452609 100 0 100 122
452610 105 0 105 105
452611 91 0 91 91
452612 1 0 1 1
452615 61 0 61 61
452616 79 0 79 79
452618 85 0 85 105
452619 113 0 113 113
452620 92 0 92 92
452622 105 0 105 137
452623 73 0 73 73
452624 53 0 53 53
452626 62 0 62 62
452629 109 0 109 109
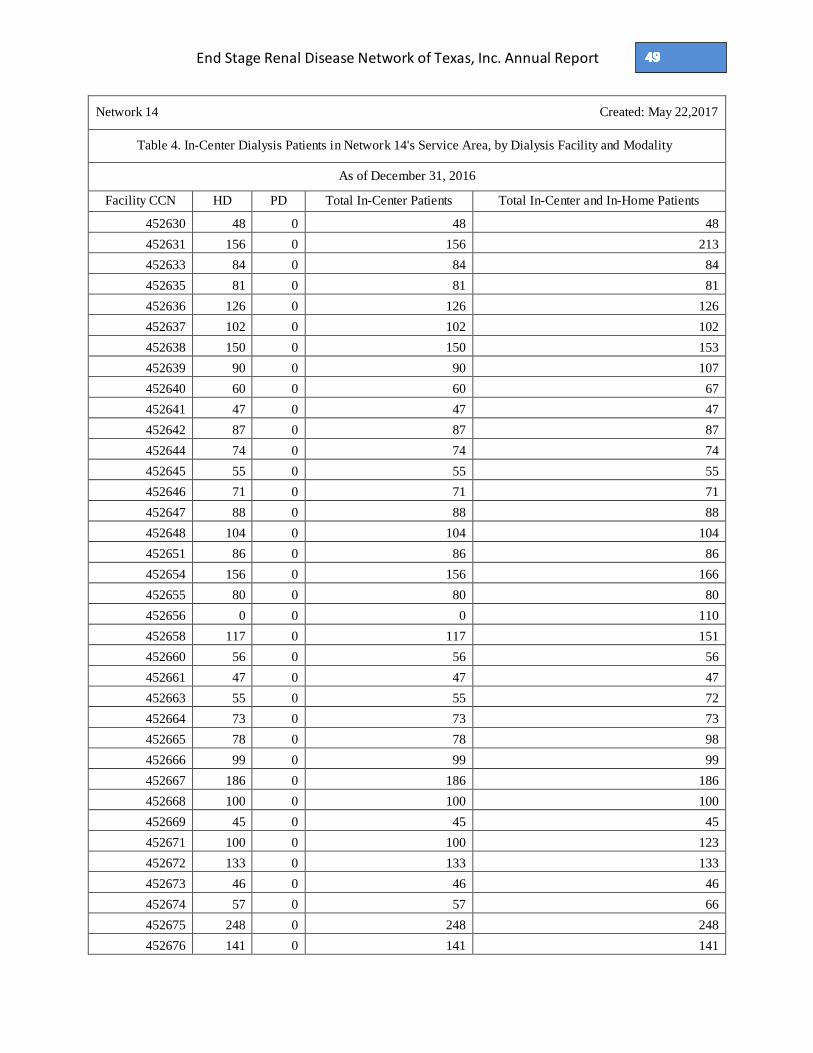
End Stage Renal Disease Network of Texas, Inc. Annual Report
Network 14 Created: May 22,2017
Table 4. In-Center Dialysis Patients in Network 14's Service Area, by Dialysis Facility and Modality
As of December 31, 2016
Facility CCN HD PD Total In-Center Patients Total In-Center and In-Home Patients
452630 48 0 48 48
452631 156 0 156 213
452633 84 0 84 84
452635 81 0 81 81
452636 126 0 126 126
452637 102 0 102 102
452638 150 0 150 153
452639 90 0 90 107
452640 60 0 60 67
452641 47 0 47 47
452642 87 0 87 87
452644 74 0 74 74
452645 55 0 55 55
452646 71 0 71 71
452647 88 0 88 88
452648 104 0 104 104
452651 86 0 86 86
452654 156 0 156 166
452655 80 0 80 80
452656 0 0 0 110
452658 117 0 117 151
452660 56 0 56 56
452661 47 0 47 47
452663 55 0 55 72
452664 73 0 73 73
452665 78 0 78 98
452666 99 0 99 99
452667 186 0 186 186
452668 100 0 100 100
452669 45 0 45 45
452671 100 0 100 123
452672 133 0 133 133
452673 46 0 46 46
452674 57 0 57 66
452675 248 0 248 248
452676 141 0 141 141

End Stage Renal Disease Network of Texas, Inc. Annual Report
Network 14 Created: May 22,2017
Table 4. In-Center Dialysis Patients in Network 14's Service Area, by Dialysis Facility and Modality
As of December 31, 2016
Facility CCN HD PD Total In-Center Patients Total In-Center and In-Home Patients
452677 65 0 65 65
452678 138 0 138 138
452679 150 0 150 150
452682 92 0 92 92
452684 106 0 106 106
452685 163 0 163 163
452686 123 0 123 167
452687 168 0 168 168
452688 162 0 162 162
452689 106 0 106 114
452690 142 0 142 142
452692 93 0 93 93
452693 156 0 156 156
452694 69 0 69 69
452696 101 0 101 101
452697 156 0 156 156
452699 144 0 144 144
452702 143 0 143 143
452703 74 0 74 92
452705 84 0 84 84
452706 72 0 72 72
452707 94 0 94 105
452708 53 0 53 53
452709 82 0 82 82
452710 47 0 47 47
452711 108 0 108 143
452714 114 0 114 114
452715 116 0 116 153
452718 52 0 52 52
452719 72 0 72 76
452720 104 0 104 104
452722 50 0 50 50
452727 108 0 108 158
452728 79 0 79 79
452731 63 0 63 63
452732 85 0 85 95

End Stage Renal Disease Network of Texas, Inc. Annual Report
Network 14 Created: May 22,2017
Table 4. In-Center Dialysis Patients in Network 14's Service Area, by Dialysis Facility and Modality
As of December 31, 2016
Facility CCN HD PD Total In-Center Patients Total In-Center and In-Home Patients
452733 62 0 62 62
452734 65 0 65 65
452735 94 0 94 128
452736 75 0 75 230
452737 117 0 117 126
452738 67 0 67 67
452739 110 0 110 146
452740 51 0 51 51
452741 279 1 280 363
452742 67 0 67 68
452743 103 0 103 103
452744 131 0 131 213
452745 138 0 138 138
452747 53 0 53 58
452748 72 0 72 92
452749 100 0 100 111
452750 127 0 127 141
452751 89 0 89 89
452752 54 0 54 54
452753 33 0 33 33
452754 56 0 56 56
452755 124 0 124 158
452757 59 0 59 59
452758 108 0 108 123
452760 45 0 45 45
452761 89 0 89 89
452762 84 0 84 84
452763 87 0 87 112
452764 143 0 143 147
452765 41 0 41 41
452767 115 0 115 115
452768 43 0 43 48
452769 50 0 50 50
452772 69 0 69 69
452773 165 0 165 165
452774 93 0 93 93

End Stage Renal Disease Network of Texas, Inc. Annual Report
Network 14 Created: May 22,2017
Table 4. In-Center Dialysis Patients in Network 14's Service Area, by Dialysis Facility and Modality
As of December 31, 2016
Facility CCN HD PD Total In-Center Patients Total In-Center and In-Home Patients
452776 67 0 67 67
452777 106 0 106 111
452778 86 0 86 86
452779 54 0 54 54
452780 118 0 118 118
452781 143 0 143 143
452782 78 0 78 78
452783 49 0 49 60
452784 163 0 163 177
452785 69 0 69 69
452786 104 0 104 104
452787 94 0 94 112
452788 81 0 81 81
452789 226 0 226 226
452790 127 0 127 127
452791 75 0 75 85
452792 172 0 172 196
452793 87 0 87 87
452794 37 0 37 37
452796 70 0 70 70
452797 171 0 171 171
452798 95 0 95 98
452799 117 0 117 117
452800 108 0 108 108
452801 0 0 0 114
452802 36 0 36 36
452803 54 0 54 54
452804 21 0 21 21
452805 55 0 55 55
452806 15 0 15 15
452808 49 0 49 49
452809 46 0 46 46
452811 79 0 79 87
452812 85 0 85 93
452813 72 0 72 72
452814 94 0 94 94

End Stage Renal Disease Network of Texas, Inc. Annual Report
Network 14 Created: May 22,2017
Table 4. In-Center Dialysis Patients in Network 14's Service Area, by Dialysis Facility and Modality
As of December 31, 2016
Facility CCN HD PD Total In-Center Patients Total In-Center and In-Home Patients
452816 79 0 79 79
452817 174 0 174 185
452819 74 0 74 88
452820 139 0 139 139
452821 89 0 89 89
452822 90 0 90 90
452823 99 0 99 99
452825 97 0 97 97
452826 60 0 60 60
452827 59 0 59 64
452828 0 0 0 20
452829 61 0 61 61
452830 63 0 63 63
452831 92 0 92 92
452832 24 0 24 24
452833 55 0 55 74
452834 85 0 85 100
452835 138 0 138 144
452836 58 0 58 58
452837 65 0 65 65
452838 138 0 138 138
452840 0 0 0 38
452841 37 0 37 42
452842 2 0 2 8
452844 65 0 65 65
452845 89 0 89 97
452846 125 0 125 137
452847 67 0 67 67
452848 82 0 82 82
452849 69 0 69 69
452850 57 0 57 57
452851 108 0 108 108
452853 87 0 87 87
452854 46 0 46 46
452855 83 0 83 83
452856 65 0 65 65

End Stage Renal Disease Network of Texas, Inc. Annual Report
Network 14 Created: May 22,2017
Table 4. In-Center Dialysis Patients in Network 14's Service Area, by Dialysis Facility and Modality
As of December 31, 2016
Facility CCN HD PD Total In-Center Patients Total In-Center and In-Home Patients
452857 1 0 1 57
452858 117 0 117 183
452859 75 0 75 75
452860 67 0 67 78
452861 112 0 112 112
452862 75 0 75 75
452863 77 0 77 77
452864 87 0 87 87
452865 91 0 91 91
452866 95 0 95 179
452867 40 0 40 54
452868 69 0 69 80
452869 82 0 82 82
452870 106 0 106 106
452872 125 0 125 146
452873 69 0 69 69
452875 65 0 65 65
452877 57 0 57 76
452878 45 0 45 45
452880 86 0 86 86
452881 98 0 98 98
452882 0 0 0 105
452883 87 0 87 87
452884 56 0 56 56
452885 53 0 53 53
452886 61 0 61 66
452887 85 0 85 85
452889 50 0 50 50
452890 128 0 128 128
452891 31 0 31 31
452892 90 0 90 90
452893 55 0 55 55
452894 57 0 57 57
452895 56 0 56 73
452896 98 0 98 98
452897 50 0 50 50

End Stage Renal Disease Network of Texas, Inc. Annual Report
Network 14 Created: May 22,2017
Table 4. In-Center Dialysis Patients in Network 14's Service Area, by Dialysis Facility and Modality
As of December 31, 2016
Facility CCN HD PD Total In-Center Patients Total In-Center and In-Home Patients
452898 52 0 52 61
452899 91 0 91 91
453300 14 0 14 35
453300 0 0 0 0
453301 0 0 0 0
453301 9 0 9 14
453302 31 0 31 69
453302 0 0 0 0
453304 0 0 0 0
453304 35 0 35 52
453500 135 0 135 135
453501 60 0 60 60
453502 242 0 242 291
453503 70 0 70 70
453504 87 0 87 87
453509 98 0 98 98
453511 158 0 158 158
453512 77 0 77 77
453513 114 0 114 147
453514 20 0 20 20
453516 4 0 4 4
672500 90 0 90 90
672501 175 0 175 191
672502 141 0 141 141
672503 85 0 85 85
672504 88 0 88 88
672505 95 0 95 95
672506 75 0 75 94
672507 89 0 89 89
672508 111 0 111 153
672509 39 0 39 39
672510 156 0 156 156
672511 35 0 35 35
672513 27 0 27 27
672514 105 0 105 105
672515 109 0 109 140

End Stage Renal Disease Network of Texas, Inc. Annual Report
Network 14 Created: May 22,2017
Table 4. In-Center Dialysis Patients in Network 14's Service Area, by Dialysis Facility and Modality
As of December 31, 2016
Facility CCN HD PD Total In-Center Patients Total In-Center and In-Home Patients
672516 72 0 72 72
672517 161 0 161 161
672518 90 0 90 90
672519 90 0 90 90
672520 50 0 50 50
672521 85 0 85 85
672522 59 0 59 72
672523 115 0 115 115
672524 42 0 42 42
672525 62 0 62 62
672526 68 0 68 68
672527 109 0 109 131
672529 70 0 70 70
672530 52 0 52 52
672531 66 0 66 115
672532 90 0 90 90
672534 88 0 88 97
672535 82 0 82 82
672536 139 0 139 145
672537 66 0 66 66
672538 67 0 67 92
672539 25 0 25 25
672540 91 0 91 125
672541 116 0 116 116
672542 109 0 109 143
672543 28 0 28 28
672544 56 0 56 56
672545 158 0 158 165
672546 75 0 75 85
672548 43 0 43 43
672549 60 0 60 60
672550 55 0 55 55
672551 67 0 67 69
672552 46 0 46 53
672553 80 0 80 80
672554 57 0 57 57
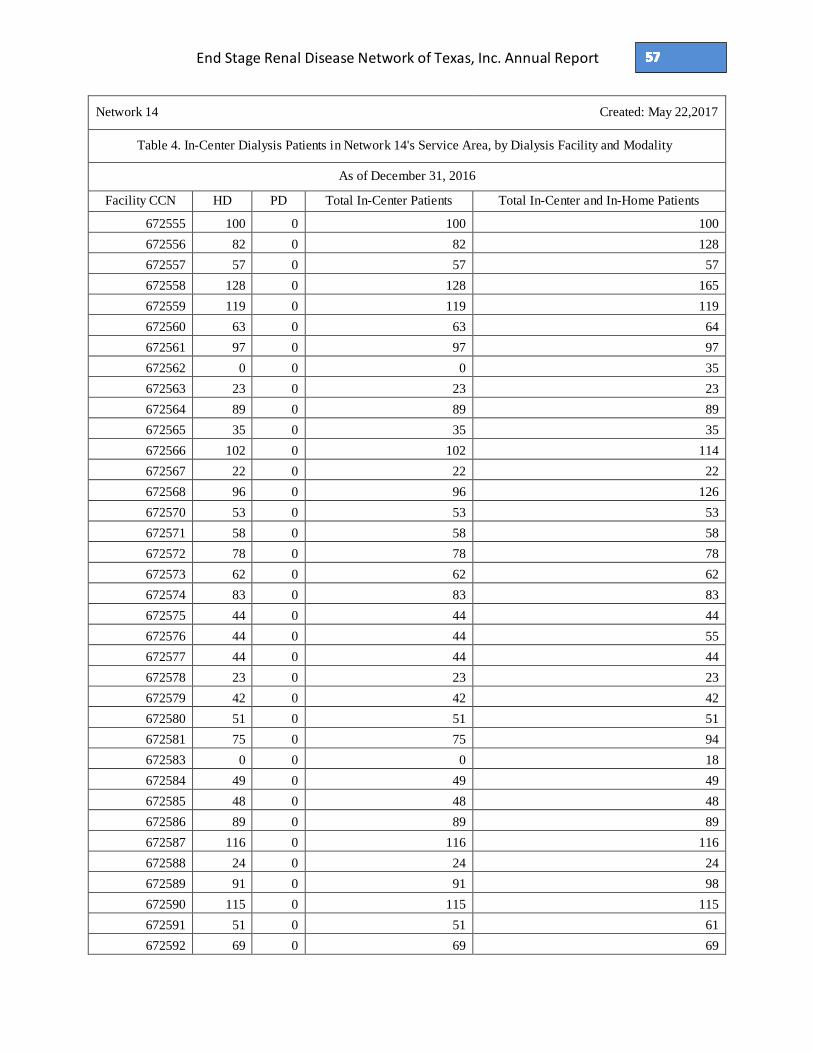
End Stage Renal Disease Network of Texas, Inc. Annual Report
Network 14 Created: May 22,2017
Table 4. In-Center Dialysis Patients in Network 14's Service Area, by Dialysis Facility and Modality
As of December 31, 2016
Facility CCN HD PD Total In-Center Patients Total In-Center and In-Home Patients
672555 100 0 100 100
672556 82 0 82 128
672557 57 0 57 57
672558 128 0 128 165
672559 119 0 119 119
672560 63 0 63 64
672561 97 0 97 97
672562 0 0 0 35
672563 23 0 23 23
672564 89 0 89 89
672565 35 0 35 35
672566 102 0 102 114
672567 22 0 22 22
672568 96 0 96 126
672570 53 0 53 53
672571 58 0 58 58
672572 78 0 78 78
672573 62 0 62 62
672574 83 0 83 83
672575 44 0 44 44
672576 44 0 44 55
672577 44 0 44 44
672578 23 0 23 23
672579 42 0 42 42
672580 51 0 51 51
672581 75 0 75 94
672583 0 0 0 18
672584 49 0 49 49
672585 48 0 48 48
672586 89 0 89 89
672587 116 0 116 116
672588 24 0 24 24
672589 91 0 91 98
672590 115 0 115 115
672591 51 0 51 61
672592 69 0 69 69

End Stage Renal Disease Network of Texas, Inc. Annual Report
Network 14 Created: May 22,2017
Table 4. In-Center Dialysis Patients in Network 14's Service Area, by Dialysis Facility and Modality
As of December 31, 2016
Facility CCN HD PD Total In-Center Patients Total In-Center and In-Home Patients
672593 114 0 114 158
672594 23 0 23 23
672595 34 0 34 34
672596 30 0 30 30
672598 18 0 18 18
672599 30 0 30 30
672600 94 0 94 102
672601 52 0 52 75
672602 39 0 39 40
672603 48 0 48 48
672604 73 0 73 73
672605 84 0 84 84
672606 66 0 66 66
672607 29 0 29 29
672608 96 0 96 123
672610 45 0 45 46
672611 56 0 56 56
672612 60 0 60 60
672613 1 0 1 60
672614 42 0 42 51
672615 50 0 50 54
672616 90 0 90 92
672617 52 0 52 53
672618 50 0 50 50
672619 19 0 19 19
672620 36 0 36 38
672621 38 0 38 38
672623 33 0 33 33
672624 29 0 29 29
672625 36 0 36 39
672626 7 0 7 76
672627 152 0 152 159
672628 26 0 26 26
672629 58 0 58 58
672630 96 0 96 96
672631 31 0 31 35

End Stage Renal Disease Network of Texas, Inc. Annual Report
Network 14 Created: May 22,2017
Table 4. In-Center Dialysis Patients in Network 14's Service Area, by Dialysis Facility and Modality
As of December 31, 2016
Facility CCN HD PD Total In-Center Patients Total In-Center and In-Home Patients
672632 69 0 69 83
672633 127 0 127 127
672634 45 0 45 49
672635 67 0 67 67
672636 66 0 66 78
672637 52 0 52 52
672638 38 0 38 38
672639 36 0 36 36
672640 63 0 63 63
672641 54 0 54 63
672642 46 0 46 46
672643 35 0 35 35
672644 71 0 71 71
672645 58 0 58 58
672646 75 0 75 77
672647 55 0 55 55
672648 66 0 66 66
672649 51 0 51 72
672650 43 0 43 43
672651 0 0 0 74
672652 35 0 35 35
672653 54 0 54 69
672654 64 0 64 64
672655 71 0 71 71
672656 43 0 43 43
672657 37 0 37 37
672658 72 0 72 72
672659 88 0 88 88
672660 27 0 27 27
672661 37 0 37 37
672662 42 0 42 43
672663 61 0 61 95
672664 0 0 0 29
672665 219 0 219 229
672666 52 0 52 65
672667 100 0 100 126

End Stage Renal Disease Network of Texas, Inc. Annual Report
Network 14 Created: May 22,2017
Table 4. In-Center Dialysis Patients in Network 14's Service Area, by Dialysis Facility and Modality
As of December 31, 2016
Facility CCN HD PD Total In-Center Patients Total In-Center and In-Home Patients
672668 51 0 51 56
672669 73 0 73 73
672670 104 0 104 104
672671 83 0 83 98
672672 70 0 70 70
672673 70 0 70 70
672674 73 0 73 77
672675 95 0 95 110
672676 93 0 93 93
672677 33 0 33 33
672678 73 0 73 83
672679 34 0 34 34
672680 62 0 62 67
672681 3 0 3 11
672682 28 0 28 28
672683 101 0 101 117
672684 34 0 34 34
672685 35 0 35 44
672686 47 0 47 47
672687 38 0 38 44
672688 72 0 72 72
672689 19 0 19 19
672690 0 0 0 26
672691 80 0 80 80
672692 109 0 109 109
672693 91 0 91 99
672694 39 0 39 39
672695 32 0 32 32
672696 71 0 71 71
672697 77 0 77 77
672698 7 1 8 8
672699 89 0 89 96
672700 53 0 53 53
672701 46 0 46 64
672702 39 0 39 50
672703 59 0 59 59

End Stage Renal Disease Network of Texas, Inc. Annual Report
Network 14 Created: May 22,2017
Table 4. In-Center Dialysis Patients in Network 14's Service Area, by Dialysis Facility and Modality
As of December 31, 2016
Facility CCN HD PD Total In-Center Patients Total In-Center and In-Home Patients
672704 64 0 64 69
672705 92 0 92 92
672706 81 0 81 104
672707 80 0 80 99
672708 93 0 93 99
672709 133 0 133 147
672710 24 0 24 24
672711 52 0 52 52
672712 51 0 51 51
672713 51 0 51 56
672714 0 0 0 40
672715 33 0 33 33
672716 44 0 44 44
672717 42 0 42 63
672718 0 0 0 34
672719 42 0 42 47
672720 34 0 34 38
672721 35 0 35 35
672722 74 0 74 97
672723 57 0 57 64
672724 19 0 19 23
672725 61 0 61 76
672726 57 0 57 68
672727 0 0 0 7
672728 39 0 39 39
672729 22 0 22 40
672730 47 0 47 49
672731 30 0 30 36
672732 30 0 30 30
672733 21 0 21 31
672734 55 0 55 66
672735 40 0 40 40
672736 0 0 0 17
672737 30 0 30 30
672738 34 0 34 34
672739 50 0 50 53

End Stage Renal Disease Network of Texas, Inc. Annual Report
Network 14 Created: May 22,2017
Table 4. In-Center Dialysis Patients in Network 14's Service Area, by Dialysis Facility and Modality
As of December 31, 2016
Facility CCN HD PD Total In-Center Patients Total In-Center and In-Home Patients
672740 55 0 55 55
672741 30 0 30 30
672742 51 0 51 51
672743 48 0 48 48
672744 60 0 60 71
672745 47 0 47 55
672746 77 0 77 106
672747 47 0 47 51
672748 22 0 22 23
672749 17 0 17 17
672750 7 0 7 7
672751 67 0 67 67
672752 0 0 0 38
672753 41 0 41 55
672754 43 0 43 43
672755 17 0 17 20
672756 27 0 27 28
672757 51 0 51 52
672758 30 0 30 30
672759 49 0 49 52
672760 28 0 28 68
672761 25 0 25 25
672762 17 0 17 17
672763 37 0 37 46
672764 37 0 37 40
672765 42 0 42 50
672766 32 0 32 53
672767 73 0 73 79
672768 0 0 0 19
672769 51 0 51 51
672770 20 0 20 27
672771 28 0 28 28
672772 0 0 0 19
672773 31 0 31 35
672774 29 0 29 35
672775 41 0 41 41

End Stage Renal Disease Network of Texas, Inc. Annual Report
Network 14 Created: May 22,2017
Table 4. In-Center Dialysis Patients in Network 14's Service Area, by Dialysis Facility and Modality
As of December 31, 2016
Facility CCN HD PD Total In-Center Patients Total In-Center and In-Home Patients
672776 18 0 18 18
672777 29 0 29 29
672778 64 0 64 64
672779 21 0 21 22
672780 17 0 17 17
672781 9 0 9 10
672782 13 0 13 13
672783 8 0 8 8
672784 20 0 20 32
672785 41 0 41 62
672786 27 0 27 29
672787 0 0 0 13
672788 5 0 5 5
672789 10 0 10 10
672790 16 0 16 16
672791 76 0 76 109
672792 0 0 0 11
672793 100 0 100 123
672794 17 0 17 17
672795 6 0 6 6
672796 11 0 11 11
672797 4 0 4 4
672798 7 0 7 7
672799 6 0 6 6
678853 0 0 0 0
678863 0 0 0 5
TX Total 43799 2 43801 48623
Source of data: ESRD Facility Survey (CMS-2744A) as recorded in CROWNWeb.
HD = Hemodialysis
PD = Peritoneal Dialysis
NOTE: This table may include data for some U.S. Department of Veterans Affairs (VA) facilities.

End Stage Renal Disease Network of Texas, Inc. Annual Report
Network 14 Created: May 22, 2017
Table 5. Number of Transplants Performed in Network 14's Service Area, by Transplant Center and Donor Type
and Number of Patients on Transplant Waiting List*
January 1, 2016 - December 31, 2016
State Decease
d Donor
Living
Related
Donor
Living Unrelated
Donor
Unknown Donor
Type
Total
Transplants
Performed
Patients on
Transplant
Waiting List
TX 1252 246 277 0 1775 9974
Network Total 1252 246 277 0 1775 9974
Source of data: CROWNWeb. Information on patients awaiting transplant comes from the ESRD Facility Survey
completed by transplant centers (Form CMS-2744B).
*As of December 31, 2016.
NOTE: Cumulative total for January 1, 2016 – December 31, 2016. A patient who had more than one transplant
during the calendar year is represented more than once in the table.

End Stage Renal Disease Network of Texas, Inc. Annual Report
Network 14 Created: May 22, 2017
Table 5. Number of Transplants Performed in Network 14's Service Area, by Transplant Center and Donor Type and
Number of Patients on Transplant Waiting List*
January 1, 2016 - December 31, 2016
Transplant
Center CCN
Deceased
Donor
Living Related
Donor
Living Unrelated
Donor
Unknown
Donor
Type
Total
Transplants
Performed
Patients on
Transplant
Waiting List
450015 17 0 0 0 17 143
450018 80 1 4 0 85 310
450021 95 15 20 0 130 912
450044 37 6 6 0 49 395
450051 58 7 7 0 72 364
450054 61 5 9 0 75 144
450068 62 6 8 0 76 404
450083 19 7 5 0 31 174
450107 34 3 1 0 38 136
450135 23 1 0 0 24 45
450137 66 6 5 0 77 836
450193 90 12 16 0 118 1069
450213 73 12 23 0 108 587
450237 6 1 2 0 9 126
450358 141 42 43 0 226 1355
450388 165 98 104 0 367 2244
450647 50 3 4 0 57 183
450672 110 4 7 0 121 113
450809 16 10 8 0 34 354
453300 7 0 0 0 7 3
453301 6 1 0 0 7 14
453302 13 2 0 0 15 29
453304 23 4 5 0 32 34
TX Total 1252 246 277 0 1775 9974
Source of data: CROWNWeb. Information on patients awaiting transplant comes from the ESRD Facility Survey
completed by transplant centers (Form CMS-2744B).
*As of December 31, 2016.
NOTE: Cumulative total for January 1, 2016 – December 31, 2016. A patient who had more than one transplant
during the calendar year is represented more than once in the table.

End Stage Renal Disease Network of Texas, Inc. Annual Report
Network 14 Created: May 22, 2017
Table 6. Renal Transplant* Recipients in Network 14’s Service Area, by Patient Characteristics
January 1, 2016 - December 31, 2016
Network 14's Service Area TX Other Number Percent
Age Group
<= 4 Years 10 0 10 0.6%
5-9 Years 19 0 19 1.1%
10-14 Years 23 2 25 1.4%
15-19 Years 38 0 38 2.1%
20-24 Years 54 2 56 3.2%
25-29 Years 87 2 89 5.0%
30-34 Years 100 3 103 5.8%
35-39 Years 124 7 131 7.4%
40-44 Years 163 8 171 9.6%
45-49 Years 188 3 191 10.8%
50-54 Years 209 12 221 12.5%
55-59 Years 232 6 238 13.4%
60-64 Years 228 8 236 13.3%
65-69 Years 162 9 171 9.6%
70-74 Years 56 3 59 3.3%
75-79 Years 13 0 13 0.7%
80-84 Years 3 0 3 0.2%
>= 85 Years 0 0 0 0.0%
Network-Level Total 1709 65 1774 100.0%
Median Age 51 52 51
Gender
Female 710 27 737 41.5%
Male 999 38 1037 58.5%
Network-Level Total 1709 65 1774 100.0%
Ethnicity*
Hispanic or Latino 691 21 712 40.1%
Not Hispanic or Latino 1011 44 1055 59.5%
Not Specified 7 7 0.4%
Network-Level Total 1709 65 1774 100.0%
Race*
American Indian/Alaska Native 3 0 3 0.2%
Asian 57 2 59 3.3%
Black or African American 347 21 368 20.7%
Native Hawaiian or Other Pacific Islander 14 0 14 0.8%
White 1276 42 1318 74.3%
More Than One Race Reported 5 0 5 0.3%
Not Specified 7 7 0.4%
Network-Level Total 1709 65 1774 100.0%

End Stage Renal Disease Network of Texas, Inc. Annual Report
Primary Cause of ESRD**
Diabetes 519 19 538 30.3%
Glomerulonephritis 260 9 269 15.2%
Secondary Glomerulonephritis/Vasculitis 83 3 86 4.8%
Interstitial
Nephritis/Pyelonephritis 37 2 39 2.2%
Transplant Complications 10 1 11 0.6%
Hypertension/Large Vessel
Disease 381 12 393 22.2%
Cystic/Hereditary/Congenital/Oth
er Diseases 189 6 195 11.0%
Neoplasms/Tumors 67 5 72 4.1%
Disorders of Mineral Metabolism 0 0 0 0.0%
Genitourinary System 2 0 2 0.1%
Acute Kidney Failure 9 0 9 0.5%
Miscellaneous Conditions 99 4 103 5.8%
Not Specified 53 4 57 3.2%
Network-Level Total 1709 65 1774 100.0%
Source of data: CROWNWeb.
*Data are shown for unduplicated patients. A patient who had more than one transplant during the calendar year is
counted only once in the table.
**Categories are from the CMS-2728 form.
NOTES:
1. Data on “ethnicity” and “race” should be interpreted with caution because of the inherent instability of
race/ethnicity data.

End Stage Renal Disease Network of Texas, Inc. Annual Report
Network 14 Created: May 22,2017
Table 7. Deaths among Dialysis Patients in Network 14’s Service Area, by Patient Characteristics
January 1, 2016 - December 31, 2016
Network 14's Service Area TX Other Number Percent
Age Group
<= 4 Years 3 0 3 0.0%
5-9 Years 1 0 1 0.0%
10-14 Years 2 0 2 0.0%
15-19 Years 2 0 2 0.0%
20-24 Years 11 0 11 0.1%
25-29 Years 36 0 36 0.5%
30-34 Years 63 0 63 0.8%
35-39 Years 98 3 101 1.3%
40-44 Years 178 3 181 2.3%
45-49 Years 317 2 319 4.1%
50-54 Years 479 10 489 6.3%
55-59 Years 799 12 811 10.5%
60-64 Years 1105 9 1114 14.4%
65-69 Years 1189 19 1208 15.6%
70-74 Years 1123 18 1141 14.7%
75-79 Years 940 10 950 12.3%
80-84 Years 679 9 688 8.9%
>= 85 Years 609 10 619 8.0%
Network-Level Total 7634 105 7739 100.0%
Median Age 68 68 68
Gender
Female 3505 49 3554 45.9%
Male 4129 56 4185 54.1%
Network-Level Total 7634 105 7739 100.0%
Ethnicity*
Hispanic or Latino 2820 21 2841 36.7%
Not Hispanic or Latino 4809 84 4893 63.2%
Not Specified 5 5 0.1%
Network-Level Total 7634 105 7739 100.0%
Race*
American Indian/Alaska Native 16 0 16 0.2%
Asian 115 2 117 1.5%
Black or African American 1814 28 1842 23.8%
Native Hawaiian or Other Pacific Islander 29 0 29 0.4%
White 5651 75 5726 74.0%
More Than One Race Reported 6 0 6 0.1%
Not Specified 3 3 0.0%
Network-Level Total 7634 105 7739 100.0%
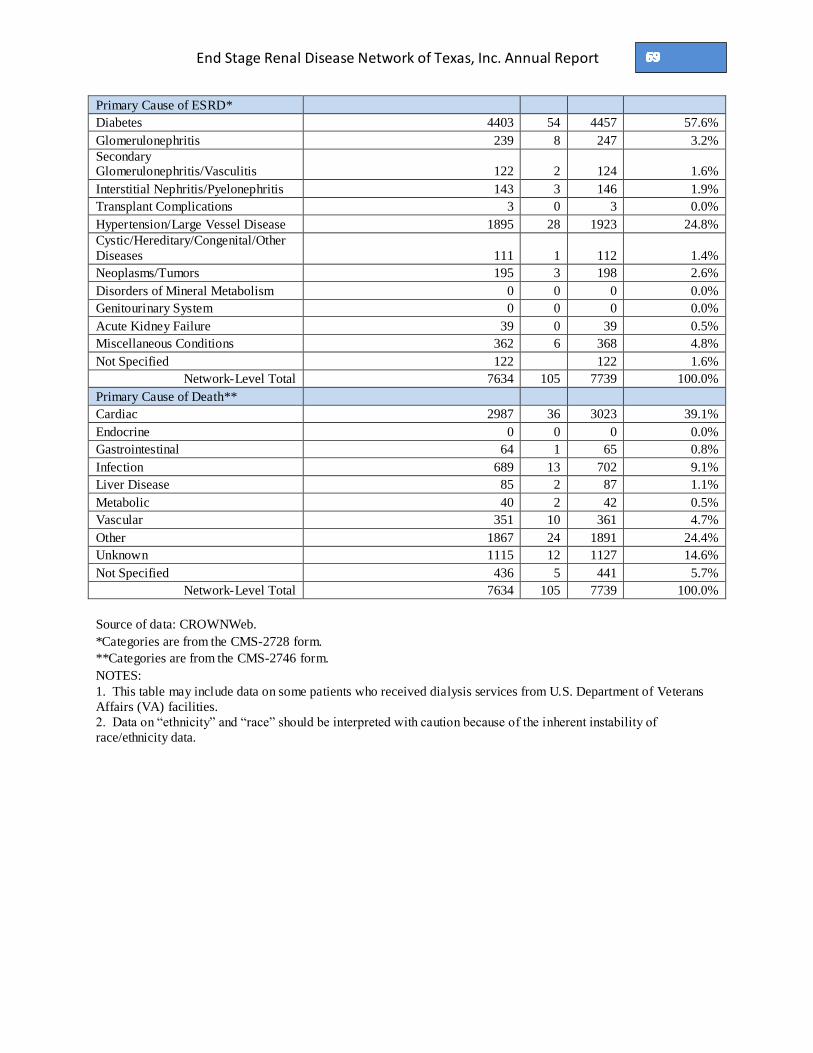
End Stage Renal Disease Network of Texas, Inc. Annual Report
Primary Cause of ESRD*
Diabetes 4403 54 4457 57.6%
Glomerulonephritis 239 8 247 3.2%
Secondary Glomerulonephritis/Vasculitis 122 2 124 1.6%
Interstitial Nephritis/Pyelonephritis 143 3 146 1.9%
Transplant Complications 3 0 3 0.0%
Hypertension/Large Vessel Disease 1895 28 1923 24.8%
Cystic/Hereditary/Congenital/Other
Diseases 111 1 112 1.4%
Neoplasms/Tumors 195 3 198 2.6%
Disorders of Mineral Metabolism 0 0 0 0.0%
Genitourinary System 0 0 0 0.0%
Acute Kidney Failure 39 0 39 0.5%
Miscellaneous Conditions 362 6 368 4.8%
Not Specified 122 122 1.6%
Network-Level Total 7634 105 7739 100.0%
Primary Cause of Death**
Cardiac 2987 36 3023 39.1%
Endocrine 0 0 0 0.0%
Gastrointestinal 64 1 65 0.8%
Infection 689 13 702 9.1%
Liver Disease 85 2 87 1.1%
Metabolic 40 2 42 0.5%
Vascular 351 10 361 4.7%
Other 1867 24 1891 24.4%
Unknown 1115 12 1127 14.6%
Not Specified 436 5 441 5.7%
Network-Level Total 7634 105 7739 100.0%
Source of data: CROWNWeb.
*Categories are from the CMS-2728 form.
**Categories are from the CMS-2746 form.
NOTES:
1. This table may include data on some patients who received dialysis services from U.S. Department of Veterans
Affairs (VA) facilities.
2. Data on “ethnicity” and “race” should be interpreted with caution because of the inherent instability of
race/ethnicity data.

End Stage Renal Disease Network of Texas, Inc. Annual Report
Network 14 Created: May 23, 2017
Table 8. Vocational Rehabilitation Status, Employment Status, and School Attendance of Prevalent Dialysis Patients
Age 18–54 Years in Network 14’s Service Area
As of December 31, 2016
State Aged 18
through 54
Referred to Voc
Rehab Services
Receiving Voc
Rehab Services
Employed Full-
Time or Part-Time
Attending School Full-
Time or Part-Time
TX 15044 539 137 3131 233
Network
Total 15044 539 137 3131 233
Source of data: CROWNWeb.
Voc Rehab = Vocational Rehabilitation

End Stage Renal Disease Network of Texas, Inc. Annual Report
Network 14 (TX) Created: May 23, 2017
Table 8a. Vocational Rehabilitation Status, Employment Status, and School Attendance of Prevalent Dialysis
Patients Age 18–54 Years in Network 14’s Service Area
As of December 31, 2016
Facility
CCN
Aged 18
through 54
Referred to Voc
Rehab Services
Receiving Voc
Rehab Services
Employed Full-
Time or Part-Time
Attending School Full-
Time or Part-Time
450018 6 0 0 2 0
45001P 8 0 0 0 0
450201 9 0 0 0 0
450271 25 5 0 6 1
450369 6 0 0 1 0
450571 32 0 0 5 0
450584 6 0 0 1 0
45066F 8 0 0 0 0
45081F 3 0 0 0 0
452501 17 0 0 9 0
452506 81 0 0 11 0
452507 29 0 0 5 0
452508 74 0 0 17 0
452510 57 0 0 10 0
452511 36 0 0 4 0
452512 40 0 0 7 0
452513 65 0 0 15 0
452514 27 0 0 5 0
452517 45 0 0 5 0
452518 22 0 0 1 0
452519 20 0 0 4 1
452520 18 0 0 5 1
452522 33 0 0 5 1
452524 34 1 0 7 0
452526 58 1 0 17 3
452528 44 3 1 10 1
452530 24 0 0 2 0
452532 20 1 0 4 1
452533 54 4 0 10 0
452537 15 2 0 1 2
452539 30 2 0 3 0
452540 29 0 0 1 0
452541 46 0 0 6 0
452542 43 2 0 8 1
452544 26 0 0 4 0
452546 31 0 0 4 0
452550 28 0 0 1 0
452552 54 0 0 19 1
452553 29 0 0 6 1
452556 10 0 0 4 0
452557 7 0 0 0 0
452559 20 0 1 1 1

End Stage Renal Disease Network of Texas, Inc. Annual Report
Network 14 (TX) Created: May 23, 2017
Table 8a. Vocational Rehabilitation Status, Employment Status, and School Attendance of Prevalent Dialysis
Patients Age 18–54 Years in Network 14’s Service Area
As of December 31, 2016
Facility
CCN
Aged 18
through 54
Referred to Voc
Rehab Services
Receiving Voc
Rehab Services
Employed Full-
Time or Part-Time
Attending School Full-
Time or Part-Time
452560 38 1 1 8 1
452561 76 0 0 6 0
452563 7 0 0 1 0
452568 65 0 0 8 0
452570 35 0 1 8 2
452571 39 0 0 6 0
452572 106 0 5 31 5
452574 64 4 0 14 1
452575 45 0 0 8 0
452576 51 3 0 11 0
452577 53 6 0 2 3
452579 53 1 0 5 0
452580 42 0 0 7 0
452582 16 1 1 1 0
452583 28 4 0 8 0
452584 36 3 0 3 0
452585 54 0 0 8 2
452587 18 1 0 3 0
452592 36 0 2 17 2
452594 31 0 0 6 0
452595 52 1 0 14 0
452598 38 2 0 6 0
452602 32 1 0 3 0
452604 9 0 0 0 0
452605 30 0 0 2 0
452606 13 0 0 3 0
452609 35 13 1 15 0
452610 29 2 1 2 1
452611 29 0 0 0 0
452615 11 0 0 0 0
452616 18 0 0 5 0
452618 41 3 0 11 1
452619 41 0 0 5 0
452620 23 3 0 3 1
452622 49 0 0 19 0
452623 11 0 0 3 0
452624 23 0 0 3 0
452626 18 0 0 5 0
452629 34 0 0 2 0
452630 11 0 0 0 0
452631 58 2 0 15 2
452633 22 0 0 3 0

End Stage Renal Disease Network of Texas, Inc. Annual Report
Network 14 (TX) Created: May 23, 2017
Table 8a. Vocational Rehabilitation Status, Employment Status, and School Attendance of Prevalent Dialysis
Patients Age 18–54 Years in Network 14’s Service Area
As of December 31, 2016
Facility
CCN
Aged 18
through 54
Referred to Voc
Rehab Services
Receiving Voc
Rehab Services
Employed Full-
Time or Part-Time
Attending School Full-
Time or Part-Time
452635 24 1 1 3 0
452636 24 0 0 5 0
452637 35 0 0 9 0
452638 40 0 0 4 0
452639 32 0 1 4 1
452640 24 0 1 1 0
452641 11 0 0 3 0
452642 21 0 0 4 0
452644 19 0 0 1 0
452645 13 0 1 4 0
452646 21 3 0 4 0
452647 29 0 2 9 0
452648 26 1 0 5 0
452651 18 0 0 1 0
452654 37 2 0 4 1
452655 22 7 0 7 2
452656 42 0 1 14 1
452658 49 0 0 11 0
452660 17 0 0 2 0
452661 11 1 0 1 0
452663 25 1 0 6 1
452664 18 0 0 3 0
452665 25 0 0 3 0
452666 23 1 0 0 0
452667 59 1 1 19 1
452668 36 0 0 0 0
452669 15 0 0 2 0
452671 41 4 1 11 1
452672 43 1 2 10 1
452673 9 0 1 0 1
452674 20 0 0 5 0
452675 85 0 0 3 0
452676 46 4 0 7 0
452677 21 0 0 1 0
452678 58 0 0 7 0
452679 48 0 1 7 0
452682 30 1 0 11 1
452684 39 1 0 3 0
452685 66 0 1 12 1
452686 78 1 5 38 2
452687 41 0 0 3 0
452688 58 1 0 2 0

End Stage Renal Disease Network of Texas, Inc. Annual Report
Network 14 (TX) Created: May 23, 2017
Table 8a. Vocational Rehabilitation Status, Employment Status, and School Attendance of Prevalent Dialysis
Patients Age 18–54 Years in Network 14’s Service Area
As of December 31, 2016
Facility
CCN
Aged 18
through 54
Referred to Voc
Rehab Services
Receiving Voc
Rehab Services
Employed Full-
Time or Part-Time
Attending School Full-
Time or Part-Time
452689 41 1 0 4 0
452690 55 2 0 11 3
452692 19 0 0 5 0
452693 63 3 1 11 0
452694 15 0 0 2 0
452696 27 0 0 7 0
452697 60 2 1 11 0
452699 42 6 2 10 3
452702 57 1 1 20 0
452703 31 2 0 10 0
452705 25 1 0 6 0
452706 26 0 0 5 0
452707 23 0 1 2 1
452708 12 1 0 1 0
452709 23 1 1 6 1
452710 14 0 0 1 0
452711 51 0 0 18 1
452714 40 0 0 1 0
452715 46 0 0 12 0
452718 8 0 0 2 0
452719 18 0 0 6 1
452720 25 0 0 3 0
452722 17 0 0 1 0
452727 57 1 0 23 1
452728 19 2 0 5 0
452731 19 0 0 2 0
452732 28 2 2 8 1
452733 16 4 0 1 0
452734 14 0 0 3 0
452735 39 4 0 6 0
452736 106 4 2 35 1
452737 46 0 0 1 0
452738 18 0 0 2 0
452739 52 1 0 8 0
452740 15 0 0 2 0
452741 109 1 0 19 0
452742 16 0 0 4 0
452743 25 1 0 5 0
452744 60 2 0 10 0
452745 37 12 0 6 1
452747 20 0 0 1 0
452748 32 0 1 7 1

End Stage Renal Disease Network of Texas, Inc. Annual Report
Network 14 (TX) Created: May 23, 2017
Table 8a. Vocational Rehabilitation Status, Employment Status, and School Attendance of Prevalent Dialysis
Patients Age 18–54 Years in Network 14’s Service Area
As of December 31, 2016
Facility
CCN
Aged 18
through 54
Referred to Voc
Rehab Services
Receiving Voc
Rehab Services
Employed Full-
Time or Part-Time
Attending School Full-
Time or Part-Time
452749 22 1 0 7 0
452750 53 4 1 14 2
452751 30 0 0 5 0
452752 19 0 0 3 0
452753 8 0 0 0 0
452754 12 1 0 0 0
452755 60 4 1 29 3
452757 15 0 0 4 0
452758 21 0 1 2 1
452760 7 0 0 1 0
452761 25 0 0 4 2
452762 36 2 0 7 0
452763 33 4 0 2 1
452764 36 2 1 3 0
452765 13 1 0 3 0
452767 39 0 1 10 1
452768 7 0 0 2 0
452769 16 1 1 2 1
452772 19 1 0 3 0
452773 54 2 3 5 1
452774 22 0 0 4 0
452776 19 0 0 3 0
452777 34 1 0 8 0
452778 19 0 0 4 0
452779 17 0 0 5 0
452780 44 1 1 6 1
452781 43 0 0 9 0
452782 32 2 0 7 0
452783 11 0 0 3 0
452784 75 22 1 15 5
452785 25 0 0 3 0
452786 23 6 0 7 0
452787 44 6 3 13 3
452788 22 1 0 3 0
452789 82 2 1 15 1
452790 50 6 0 16 1
452791 22 0 0 2 0
452792 49 0 0 8 1
452793 27 0 0 0 0
452794 16 0 0 3 0
452796 18 0 2 2 2
452797 68 0 0 15 0

End Stage Renal Disease Network of Texas, Inc. Annual Report
Network 14 (TX) Created: May 23, 2017
Table 8a. Vocational Rehabilitation Status, Employment Status, and School Attendance of Prevalent Dialysis
Patients Age 18–54 Years in Network 14’s Service Area
As of December 31, 2016
Facility
CCN
Aged 18
through 54
Referred to Voc
Rehab Services
Receiving Voc
Rehab Services
Employed Full-
Time or Part-Time
Attending School Full-
Time or Part-Time
452798 22 1 0 6 0
452799 36 1 0 5 0
452800 35 1 1 5 0
452801 34 0 1 21 1
452802 10 1 0 0 0
452803 12 0 0 1 0
452804 6 0 0 1 0
452805 19 0 0 5 0
452806 6 0 0 0 0
452808 10 0 0 0 0
452809 14 0 0 0 0
452811 22 0 0 3 0
452812 25 0 0 0 0
452813 10 0 0 1 0
452814 24 0 1 4 1
452816 25 2 0 3 0
452817 55 5 0 9 0
452819 37 0 0 10 0
452820 32 2 1 6 1
452821 19 0 0 4 0
452822 39 2 1 2 0
452823 18 0 0 5 0
452825 19 0 0 1 0
452826 12 0 0 0 0
452827 18 1 0 1 0
452828 10 1 0 6 0
452829 10 0 0 2 0
452830 21 0 1 2 0
452831 23 0 0 2 0
452832 6 0 0 3 0
452833 21 1 1 6 1
452834 46 0 1 5 2
452835 38 2 1 9 0
452836 17 0 0 3 0
452837 17 0 1 6 0
452838 45 3 0 10 0
452840 15 0 0 8 1
452841 11 0 0 2 0
452842 3 0 0 0 3
452844 13 0 1 2 0
452845 25 0 0 5 0
452846 37 0 0 10 0

End Stage Renal Disease Network of Texas, Inc. Annual Report
Network 14 (TX) Created: May 23, 2017
Table 8a. Vocational Rehabilitation Status, Employment Status, and School Attendance of Prevalent Dialysis
Patients Age 18–54 Years in Network 14’s Service Area
As of December 31, 2016
Facility
CCN
Aged 18
through 54
Referred to Voc
Rehab Services
Receiving Voc
Rehab Services
Employed Full-
Time or Part-Time
Attending School Full-
Time or Part-Time
452847 12 0 0 2 0
452848 26 1 0 1 0
452849 24 0 1 1 0
452850 10 0 0 4 0
452851 39 0 0 2 0
452853 23 1 0 2 0
452854 11 0 0 1 0
452855 28 1 2 2 2
452856 10 2 0 2 0
452857 24 2 0 11 0
452858 50 0 0 11 3
452859 26 1 0 3 0
452860 33 4 1 6 1
452861 36 0 0 5 0
452862 17 0 0 1 0
452863 24 4 1 6 1
452864 14 0 0 3 0
452865 22 0 1 5 1
452866 63 0 0 20 0
452867 23 2 1 4 0
452868 24 1 0 4 0
452869 21 0 0 5 0
452870 34 0 0 4 0
452872 41 2 0 6 0
452873 21 0 0 6 0
452875 24 0 0 1 0
452877 29 1 1 4 1
452878 17 0 0 1 0
452880 36 2 1 5 0
452881 34 0 0 11 0
452882 39 0 0 12 2
452883 24 6 0 8 1
452884 24 0 1 9 0
452885 16 2 0 2 0
452886 24 1 0 8 1
452887 18 3 0 9 0
452889 14 0 0 1 0
452890 45 0 0 4 0
452891 10 0 0 0 0
452892 32 1 4 10 2
452893 16 0 0 2 0
452894 16 0 0 0 0

End Stage Renal Disease Network of Texas, Inc. Annual Report
Network 14 (TX) Created: May 23, 2017
Table 8a. Vocational Rehabilitation Status, Employment Status, and School Attendance of Prevalent Dialysis
Patients Age 18–54 Years in Network 14’s Service Area
As of December 31, 2016
Facility
CCN
Aged 18
through 54
Referred to Voc
Rehab Services
Receiving Voc
Rehab Services
Employed Full-
Time or Part-Time
Attending School Full-
Time or Part-Time
452895 20 4 0 4 0
452896 29 0 0 12 1
452897 20 3 0 1 0
452898 17 3 0 8 0
452899 17 2 1 5 0
453300 2 0 0 0 0
453301 6 0 0 0 0
453302 14 4 0 0 9
453304 8 4 0 0 2
453500 53 0 0 12 0
453501 26 0 0 7 0
453502 89 0 0 19 0
453503 20 1 0 6 0
453504 32 1 1 12 1
453509 28 0 0 7 0
453511 123 2 0 55 5
453512 40 2 0 8 0
453513 76 7 0 25 1
453514 4 0 0 1 0
453516 3 1 0 0 1
672500 32 0 0 8 0
672501 39 0 0 6 0
672502 36 0 0 2 0
672503 21 0 0 4 0
672504 27 0 0 3 0
672505 39 0 0 1 0
672506 29 5 0 4 2
672507 23 1 0 2 0
672508 47 1 0 6 0
672509 9 1 0 1 0
672510 35 1 0 2 0
672511 10 0 0 2 0
672513 10 0 0 0 0
672514 30 0 1 0 1
672515 52 4 0 14 2
672516 16 1 0 3 0
672517 49 1 0 10 1
672518 32 6 2 3 1
672519 30 8 0 3 0
672520 18 0 0 3 0
672521 23 1 0 3 0
672522 22 4 2 10 2
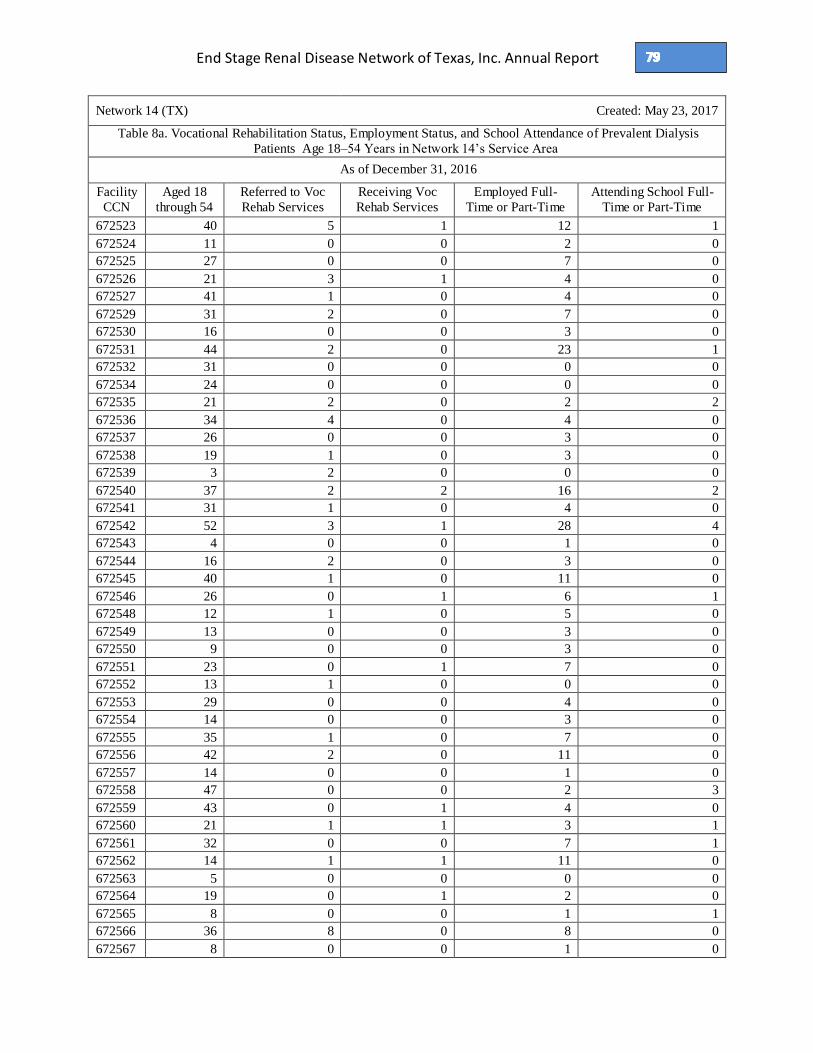
End Stage Renal Disease Network of Texas, Inc. Annual Report
Network 14 (TX) Created: May 23, 2017
Table 8a. Vocational Rehabilitation Status, Employment Status, and School Attendance of Prevalent Dialysis
Patients Age 18–54 Years in Network 14’s Service Area
As of December 31, 2016
Facility
CCN
Aged 18
through 54
Referred to Voc
Rehab Services
Receiving Voc
Rehab Services
Employed Full-
Time or Part-Time
Attending School Full-
Time or Part-Time
672523 40 5 1 12 1
672524 11 0 0 2 0
672525 27 0 0 7 0
672526 21 3 1 4 0
672527 41 1 0 4 0
672529 31 2 0 7 0
672530 16 0 0 3 0
672531 44 2 0 23 1
672532 31 0 0 0 0
672534 24 0 0 0 0
672535 21 2 0 2 2
672536 34 4 0 4 0
672537 26 0 0 3 0
672538 19 1 0 3 0
672539 3 2 0 0 0
672540 37 2 2 16 2
672541 31 1 0 4 0
672542 52 3 1 28 4
672543 4 0 0 1 0
672544 16 2 0 3 0
672545 40 1 0 11 0
672546 26 0 1 6 1
672548 12 1 0 5 0
672549 13 0 0 3 0
672550 9 0 0 3 0
672551 23 0 1 7 0
672552 13 1 0 0 0
672553 29 0 0 4 0
672554 14 0 0 3 0
672555 35 1 0 7 0
672556 42 2 0 11 0
672557 14 0 0 1 0
672558 47 0 0 2 3
672559 43 0 1 4 0
672560 21 1 1 3 1
672561 32 0 0 7 1
672562 14 1 1 11 0
672563 5 0 0 0 0
672564 19 0 1 2 0
672565 8 0 0 1 1
672566 36 8 0 8 0
672567 8 0 0 1 0

End Stage Renal Disease Network of Texas, Inc. Annual Report
Network 14 (TX) Created: May 23, 2017
Table 8a. Vocational Rehabilitation Status, Employment Status, and School Attendance of Prevalent Dialysis
Patients Age 18–54 Years in Network 14’s Service Area
As of December 31, 2016
Facility
CCN
Aged 18
through 54
Referred to Voc
Rehab Services
Receiving Voc
Rehab Services
Employed Full-
Time or Part-Time
Attending School Full-
Time or Part-Time
672568 33 1 0 9 0
672570 17 2 0 1 0
672571 16 1 0 2 0
672572 15 1 0 2 0
672573 11 0 0 2 0
672574 23 0 0 5 0
672575 5 0 0 1 0
672576 10 0 0 4 0
672577 8 0 0 3 0
672578 8 0 0 3 0
672579 12 0 0 3 1
672580 19 2 0 1 1
672581 26 3 3 10 2
672583 9 0 0 4 0
672584 12 0 0 2 0
672585 12 0 1 4 1
672586 20 0 0 7 0
672587 33 0 1 11 0
672588 4 1 0 0 0
672589 30 1 1 10 0
672590 24 1 1 3 0
672591 16 0 0 4 0
672592 22 0 0 2 0
672593 49 2 0 10 1
672594 10 5 0 2 0
672595 8 0 0 0 0
672596 8 0 0 0 0
672598 5 0 0 0 0
672599 9 0 0 0 0
672600 31 1 0 12 1
672601 16 1 0 4 0
672602 11 0 0 4 0
672603 11 0 0 0 0
672604 22 1 0 7 1
672605 31 7 1 7 2
672606 19 0 0 3 0
672607 5 0 0 0 0
672608 43 10 1 11 0
672610 9 0 0 0 0
672611 17 1 0 1 0
672612 17 0 0 4 0
672613 26 2 0 7 2

End Stage Renal Disease Network of Texas, Inc. Annual Report
Network 14 (TX) Created: May 23, 2017
Table 8a. Vocational Rehabilitation Status, Employment Status, and School Attendance of Prevalent Dialysis
Patients Age 18–54 Years in Network 14’s Service Area
As of December 31, 2016
Facility
CCN
Aged 18
through 54
Referred to Voc
Rehab Services
Receiving Voc
Rehab Services
Employed Full-
Time or Part-Time
Attending School Full-
Time or Part-Time
672614 12 0 0 2 0
672615 9 0 0 2 0
672616 20 0 0 0 0
672617 17 0 0 5 0
672618 11 0 1 3 0
672619 3 0 0 0 0
672620 9 0 0 0 0
672621 15 2 0 3 0
672623 11 1 0 2 0
672624 6 1 0 2 1
672625 16 0 0 2 0
672626 29 2 1 10 1
672627 42 0 0 3 0
672628 6 0 0 0 0
672629 19 0 0 0 0
672630 20 0 0 5 1
672631 10 0 0 1 0
672632 46 3 0 12 1
672633 43 0 0 0 0
672634 12 0 0 0 0
672635 32 1 1 7 0
672636 24 0 0 10 5
672637 13 0 0 0 0
672638 6 0 0 1 1
672639 14 0 0 1 0
672640 22 2 0 0 0
672641 16 0 1 4 1
672643 12 0 0 5 0
672644 25 0 0 7 0
672645 14 0 0 2 0
672646 24 0 0 1 0
672647 19 0 1 1 1
672648 20 1 0 10 0
672649 24 0 0 6 0
672650 13 1 0 2 0
672651 30 0 0 18 1
672652 9 0 0 2 0
672653 16 1 1 7 2
672654 15 0 0 6 0
672655 21 2 0 3 0
672656 9 2 0 0 0
672657 15 2 0 0 1

End Stage Renal Disease Network of Texas, Inc. Annual Report
Network 14 (TX) Created: May 23, 2017
Table 8a. Vocational Rehabilitation Status, Employment Status, and School Attendance of Prevalent Dialysis
Patients Age 18–54 Years in Network 14’s Service Area
As of December 31, 2016
Facility
CCN
Aged 18
through 54
Referred to Voc
Rehab Services
Receiving Voc
Rehab Services
Employed Full-
Time or Part-Time
Attending School Full-
Time or Part-Time
672658 24 0 1 13 0
672659 33 0 0 2 0
672660 5 0 0 1 0
672661 13 0 0 1 1
672662 21 0 0 1 0
672663 32 0 0 14 1
672664 8 1 0 2 0
672665 66 0 0 8 2
672666 16 0 0 4 0
672667 45 1 0 8 1
672668 18 2 0 8 0
672669 27 0 0 9 0
672670 27 0 0 6 0
672671 25 0 1 5 2
672672 13 0 0 3 0
672673 15 0 0 5 0
672674 20 0 0 1 0
672675 36 7 0 2 0
672676 25 0 0 4 1
672677 12 0 0 4 0
672678 29 1 0 5 3
672679 14 0 0 1 0
672680 18 1 0 5 1
672681 6 0 0 3 1
672682 5 0 1 2 0
672683 39 2 1 10 1
672684 10 0 0 3 0
672685 17 0 0 7 0
672686 17 1 0 3 2
672687 15 1 0 8 0
672688 26 4 1 6 1
672689 5 1 0 0 0
672690 10 1 0 4 1
672691 18 0 0 3 0
672692 29 1 0 5 0
672693 32 1 0 6 0
672694 12 0 0 8 1
672695 8 0 0 2 0
672696 16 0 0 7 0
672697 23 1 0 6 0
672698 2 0 0 0 0
672699 27 0 0 7 0

End Stage Renal Disease Network of Texas, Inc. Annual Report
Network 14 (TX) Created: May 23, 2017
Table 8a. Vocational Rehabilitation Status, Employment Status, and School Attendance of Prevalent Dialysis
Patients Age 18–54 Years in Network 14’s Service Area
As of December 31, 2016
Facility
CCN
Aged 18
through 54
Referred to Voc
Rehab Services
Receiving Voc
Rehab Services
Employed Full-
Time or Part-Time
Attending School Full-
Time or Part-Time
672700 5 0 0 2 0
672701 25 1 1 9 2
672702 15 0 0 6 0
672703 16 1 0 2 0
672704 10 0 0 1 0
672705 32 0 0 3 0
672706 26 1 0 5 0
672707 30 0 0 2 0
672708 31 0 0 8 1
672709 30 0 0 3 0
672710 3 0 0 1 0
672711 16 2 0 1 0
672712 12 1 1 3 1
672713 19 1 0 4 1
672714 17 4 1 8 0
672715 13 0 0 1 2
672716 16 0 1 9 1
672717 12 1 0 6 0
672718 21 5 0 12 0
672719 11 0 0 4 0
672720 14 0 0 9 0
672721 11 0 0 1 0
672722 25 0 0 5 0
672723 22 3 0 4 0
672724 8 0 0 1 0
672725 37 1 0 11 1
672726 29 1 0 4 1
672727 3 0 1 2 1
672728 8 0 0 2 0
672729 9 0 0 3 0
672730 14 0 1 3 1
672731 8 1 0 3 0
672732 13 1 1 6 0
672733 10 0 0 2 0
672734 28 2 0 3 1
672735 12 0 0 3 0
672736 9 1 0 2 2
672737 5 1 0 2 0
672738 9 0 0 1 0
672739 15 0 0 6 0
672740 16 0 1 9 0
672741 6 1 0 1 0

End Stage Renal Disease Network of Texas, Inc. Annual Report
Network 14 (TX) Created: May 23, 2017
Table 8a. Vocational Rehabilitation Status, Employment Status, and School Attendance of Prevalent Dialysis
Patients Age 18–54 Years in Network 14’s Service Area
As of December 31, 2016
Facility
CCN
Aged 18
through 54
Referred to Voc
Rehab Services
Receiving Voc
Rehab Services
Employed Full-
Time or Part-Time
Attending School Full-
Time or Part-Time
672742 16 1 0 2 0
672743 18 0 0 5 0
672744 19 0 0 4 0
672745 13 2 0 5 0
672746 34 0 0 8 0
672747 16 1 1 3 1
672748 5 0 0 2 0
672749 7 0 1 3 1
672750 3 0 0 0 0
672751 27 4 0 5 0
672752 20 0 0 10 0
672753 25 1 0 14 0
672754 11 0 0 2 0
672755 5 0 0 0 0
672756 7 0 0 1 0
672757 14 0 0 3 0
672758 10 0 0 4 1
672759 26 3 1 5 1
672760 35 0 0 15 0
672761 6 0 0 3 0
672762 3 0 0 0 0
672763 18 0 0 10 0
672764 10 0 0 4 0
672765 21 0 0 11 0
672766 25 0 0 4 1
672767 26 2 0 6 0
672768 5 0 0 3 0
672769 19 0 0 3 0
672770 7 0 0 3 0
672771 9 0 0 0 0
672772 9 0 0 4 0
672773 14 0 0 6 0
672774 16 1 0 4 0
672775 13 0 0 3 0
672776 8 0 0 1 0
672777 12 0 0 1 0
672778 36 1 0 9 0
672779 10 0 0 5 1
672780 5 0 0 2 0
672781 5 0 0 0 0
672782 5 0 0 1 0
672783 4 0 0 1 0
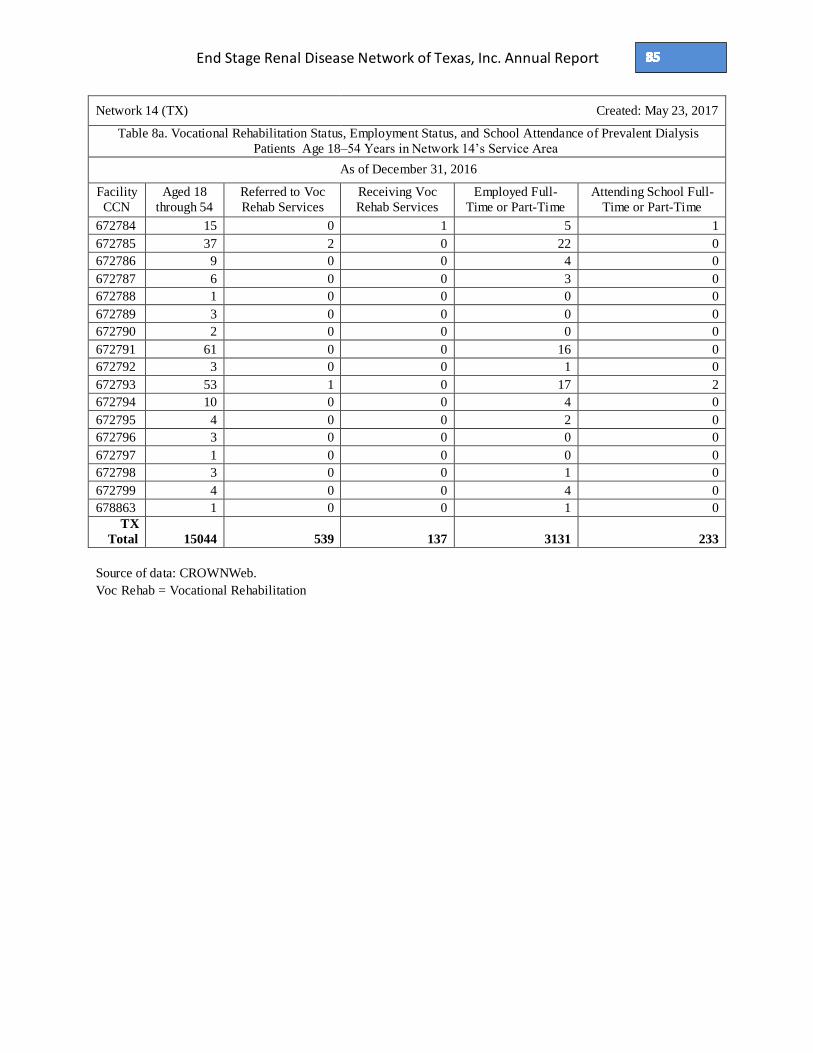
End Stage Renal Disease Network of Texas, Inc. Annual Report
Network 14 (TX) Created: May 23, 2017
Table 8a. Vocational Rehabilitation Status, Employment Status, and School Attendance of Prevalent Dialysis
Patients Age 18–54 Years in Network 14’s Service Area
As of December 31, 2016
Facility
CCN
Aged 18
through 54
Referred to Voc
Rehab Services
Receiving Voc
Rehab Services
Employed Full-
Time or Part-Time
Attending School Full-
Time or Part-Time
672784 15 0 1 5 1
672785 37 2 0 22 0
672786 9 0 0 4 0
672787 6 0 0 3 0
672788 1 0 0 0 0
672789 3 0 0 0 0
672790 2 0 0 0 0
672791 61 0 0 16 0
672792 3 0 0 1 0
672793 53 1 0 17 2
672794 10 0 0 4 0
672795 4 0 0 2 0
672796 3 0 0 0 0
672797 1 0 0 0 0
672798 3 0 0 1 0
672799 4 0 0 4 0
678863 1 0 0 1 0
TX
Total 15044 539 137 3131 233
Source of data: CROWNWeb.
Voc Rehab = Vocational Rehabilitation

End Stage Renal Disease Network of Texas, Inc. Annual Report
Network 14 Created: May 23, 2017
Table 8b. Vocational Rehabilitation Status, Employment Status, and School Attendance of Prevalent Dialysis
Patients Age 18–54 Years in Network 14’s Service Area
As of December 31, 2016
Category
Referred
to Voc
Rehab
Services
Receiving
Voc
Rehab
Services
Completed
Voc Rehab
Services
Not
Eligible for
Voc Rehab
Services
Declined
Voc Rehab
Services
No Voc
Rehab
Status
Employed Full-Time
Attending School Full-Time 1 2 0 0 2 2
Attending School Part-Time 0 2 1 2 3 4
Not Attending School 25 6 3 198 439 104
School Status Not Specified 4 3 0 32 42 1431
Employed Part-Time
Attending School Full-Time 0 1 0 3 7 1
Attending School Part-Time 2 9 2 2 6 7
Not Attending School 51 12 7 59 237 24
School Status Not Specified 5 2 1 9 26 352
Employment Status Not Specified
Attending School Full-Time 4 2 0 0 0 4
Attending School Part-Time 0 3 0 0 2 3
Not Attending School 3 1 1 3 31 18
School Status Not Specified 20 3 1 9 60 2125
Homemaker
Attending School Full-Time 0 0 0 0 0 0
Attending School Part-Time 1 0 0 0 0 0
Not Attending School 10 2 1 19 140 10
School Status Not Specified 1 1 1 1 16 144
Retired*
Attending School Full-Time 0 1 0 0 4 0
Attending School Part-Time 5 5 0 1 5 4
Not Attending School 147 16 7 186 1308 86
School Status Not Specified 26 2 0 18 167 1504
Medical Leave of Absence
Attending School Full-Time 0 0 0 0 0 0
Attending School Part-Time 1 0 0 0 0 0
Not Attending School 11 1 0 16 92 18
School Status Not Specified 2 1 0 2 14 334
Other**
Attending School Full-Time 9 20 0 3 19 25
Attending School Part-Time 6 13 1 1 19 13
Not Attending School 169 27 6 197 1004 264
School Status Not Specified 36 2 0 10 136 3309 Source of data: CROWNWeb.
*Retired due to preference or disability.
**Other = Employment Status of Student or Unemployed
Voc Rehab = Vocational Rehabilitation
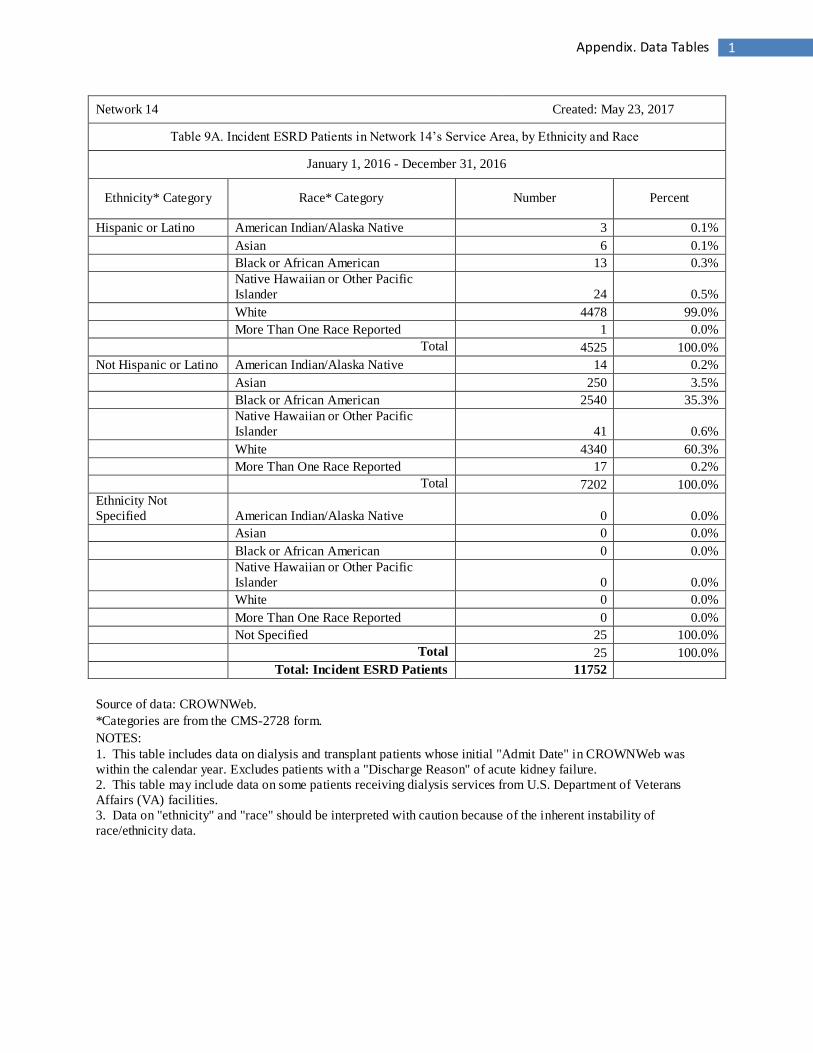
1 Appendix. Data Tables
Network 14 Created: May 23, 2017
Table 9A. Incident ESRD Patients in Network 14’s Service Area, by Ethnicity and Race
January 1, 2016 - December 31, 2016
Ethnicity* Category Race* Category Number Percent
Hispanic or Latino American Indian/Alaska Native 3 0.1%
Asian 6 0.1%
Black or African American 13 0.3%
Native Hawaiian or Other Pacific
Islander 24 0.5%
White 4478 99.0%
More Than One Race Reported 1 0.0%
Total 4525 100.0%
Not Hispanic or Latino American Indian/Alaska Native 14 0.2%
Asian 250 3.5%
Black or African American 2540 35.3%
Native Hawaiian or Other Pacific
Islander 41 0.6%
White 4340 60.3%
More Than One Race Reported 17 0.2%
Total 7202 100.0%
Ethnicity Not
Specified American Indian/Alaska Native 0 0.0%
Asian 0 0.0%
Black or African American 0 0.0%
Native Hawaiian or Other Pacific
Islander 0 0.0%
White 0 0.0%
More Than One Race Reported 0 0.0%
Not Specified 25 100.0%
Total 25 100.0%
Total: Incident ESRD Patients 11752
Source of data: CROWNWeb.
*Categories are from the CMS-2728 form.
NOTES:
1. This table includes data on dialysis and transplant patients whose initial "Admit Date" in CROWNWeb was
within the calendar year. Excludes patients with a "Discharge Reason" of acute kidney failure.
2. This table may include data on some patients receiving dialysis services from U.S. Department of Veterans
Affairs (VA) facilities.
3. Data on "ethnicity" and "race" should be interpreted with caution because of the inherent instability of
race/ethnicity data.

2
Network 14 Created: May 23, 2017
Table 9B. Prevalent Dialysis Patients in Network 14’s Service Area, by Ethnicity and Race
January 1, 2016 - December 31, 2016
Ethnicity* Category Race* Category Number Percent
Hispanic or Latino American Indian/Alaska Native 9 0.0%
Asian 9 0.0%
Black or African American 47 0.2%
Native Hawaiian or Other Pacific Islander 56 0.3%
White 20754 99.4%
More Than One Race Reported 11 0.1%
Total 20886 100.0%
Not Hispanic or Latino American Indian/Alaska Native 66 0.2%
Asian 995 3.6%
Black or African American 13146 47.5%
Native Hawaiian or Other Pacific Islander 170 0.6%
White 13284 48.0%
More Than One Race Reported 38 0.1%
Not Specified 2 0.0%
Total 27701 100.0%
Ethnicity Not Specified American Indian/Alaska Native 0 0.0%
Asian 0 0.0%
Black or African American 5 18.5%
Native Hawaiian or Other Pacific Islander 0 0.0%
White 4 14.8%
More Than One Race Reported 0 0.0%
Not Specified 18 66.7%
Total 27 100.0%
Total: Prevalent ESRD Patients 48614
Source of data: CROWNWeb.
*Categories are from the CMS-2728 form.
NOTES:
1. This table includes data on all patients identified in CROWNWeb as alive and receiving dialysis services as of
December 31 of the calendar year.
2. This table may include data on some patients receiving dialysis services from U.S. Department of Veterans
Affairs (VA) facilities.
3. Data on "ethnicity" and "race" should be interpreted with caution because of the inherent instability of
race/ethnicity data.

3
Network 14 Created: May 23, 2017
Table 9C. Renal Transplant Recipients* in Network 14’s Service Area, by Ethnicity and Race
January 1, 2016 - December 31, 2016
Ethnicity** Category Race** Category Number Percent
Hispanic or Latino American Indian/Alaska Native 1 0.1%
Asian 1 0.1%
Black or African American 3 0.4%
Native Hawaiian or Other Pacific Islander 2 0.3%
White 704 98.9%
More Than One Race Reported 1 0.1%
Total 712 100.0%
Not Hispanic or Latino American Indian/Alaska Native 2 0.2%
Asian 58 5.5%
Black or African American 365 34.6%
Native Hawaiian or Other Pacific Islander 12 1.1%
White 614 58.2%
More Than One Race Reported 4 0.4%
Total 1055 100.0%
Ethnicity Not Specified American Indian/Alaska Native 0 0.0%
Asian 0 0.0%
Black or African American 0 0.0%
Native Hawaiian or Other Pacific Islander 0 0.0%
White 0 0.0%
More Than One Race Reported 0 0.0%
Not Specified 7 100.0%
Total 7 100.0%
Total: Transplant ESRD Patients 1774
Source of data: CROWNWeb.
*Data are shown for unduplicated patients. A patient who had more than one transplant during the calendar year is
counted only once in the table.
**Categories are from the CMS-2728 form.
NOTES:
1. Data on "ethnicity" and "race" should be interpreted with caution because of the inherent instability of
race/ethnicity data.

4
References Texas Department of State Health Services, 2016 Population Data, http://dshs.texas.gov/chs/popdat/ST2016p.shtm,accessed on April 10, 2017. Yi, Sarah H., Kallen, Alexander J., Jernigan, John A., Patel, Priti R., “Reduction in Bloodstream Infection Rates in Outpatient Hemodialysis Centers Participating in a CDC Prevention Collaborative,” 1 Nov. 2012, https://www.cdc.gov/dialysis/collaborative/news-reports/reduction-in-BSI-rates.html, accessed on March 23, 2017.