Embed Size (px)
Citation preview
ANGLO AMERICAN PLATINUM2016 ANNUAL RESULTS PRESENTATION15 FEBRUARY 2017
PGI – Platinum wedding bands
2
CAUTIONARY STATEMENT
Disclaimer: This presentation has been prepared for Anglo American Platinum Limited and the entities in the Anglo American Platinum group (“Anglo American Platinum”) and comprises the written
materials/slides for a presentation concerning Anglo American Platinum. By attending this presentation and/or reviewing the slides you agree to the following conditions, and accept that all
statements attributable to Anglo American Platinum or persons acting on their behalf are qualified in their entirety by the cautionary statements set out below:
• This presentation is for information purposes only. It does not constitute an offer to sell or the solicitation of an offer to buy shares in Anglo American Platinum. Further, it does not constitute a
recommendation by Anglo American Platinum or any other party to sell or buy shares in Anglo American Platinum (or any other securities).
• Nothing in this presentation should be interpreted to mean that future earnings per share of Anglo American Platinum will necessarily match or exceed its historical published earnings per share.
• Certain statistical and other information about Anglo American Platinum included in this presentation is sourced from publicly available third party sources. As such it presents the views of those
third parties, which does not necessarily correspond to the views held by Anglo American Platinum.
Forward-looking statements
• This presentation includes forward-looking statements. All statements other than statements of historical facts in this presentation are forward-looking statements, including those regarding Anglo
American Platinum’s financial position, business and acquisition strategy, plans and objectives of management for future operations (including development plans and objectives relating to Anglo
American Platinum’s products, production forecasts and reserve and resource positions). Known and unknown risks, uncertainties and other factors may cause the actual results, performance or
achievements of Anglo American Platinum, or industry results, to be materially different from those expressed in or implied by such forward-looking statements. Such forward-looking statements
are based on assumptions, including in relation to Anglo American Platinum’s present and future business strategies and the environment in which Anglo American Platinum will operate in the
future.
• Factors that could cause Anglo American Platinum’s actual results, performance or achievements to differ materially from those in the forward-looking statements include, among others, levels of
actual production during any period, levels of global demand and commodity market prices, mineral resource exploration and development capabilities, recovery rates and other operational
capabilities, the availability of mining and processing equipment, the ability to produce and transport products profitably, the impact of foreign currency exchange rates on market prices and
operating costs, the availability of sufficient credit, the effects of inflation, political uncertainty and operating conditions in relevant areas of the world, the actions of competitors, activities by
governmental authorities such as changes in taxation or safety, health, environmental or other types of regulation in the countries where Anglo American Platinum operates, conflicts over land
and resource ownership rights and such other risk factors identified in Anglo American Platinum’s most recent Integrated Report. Forward-looking statements should, therefore, be construed in
light of such risk factors and undue reliance should not be placed on forward-looking statements.
• These forward-looking statements speak only as of the date of this presentation. Anglo American Platinum disclaims any obligation (except as required by applicable law, the Listings
Requirements of the securities exchange of the JSE Limited in South Africa and other applicable regulations) to release publicly any updates or revisions to any forward-looking statement
contained herein, notwithstanding any change in any of Anglo American Platinum’s expectations or in anything on which any such statement is based.
No investment advice
• This presentation has been prepared without reference to your particular investment objectives, financial situation, taxation position and particular needs. You should consult your stockbroker,
bank manager, solicitor, accountant, taxation adviser or other independent financial adviser (where applicable, as authorised under the Financial Advisory and Intermediary Services Act 37 of
2002 in South Africa) for financial or investment advice.
AGENDA
• Overview of 2016
• Operations
• Financials
• Markets
• Strategy
• Outlook
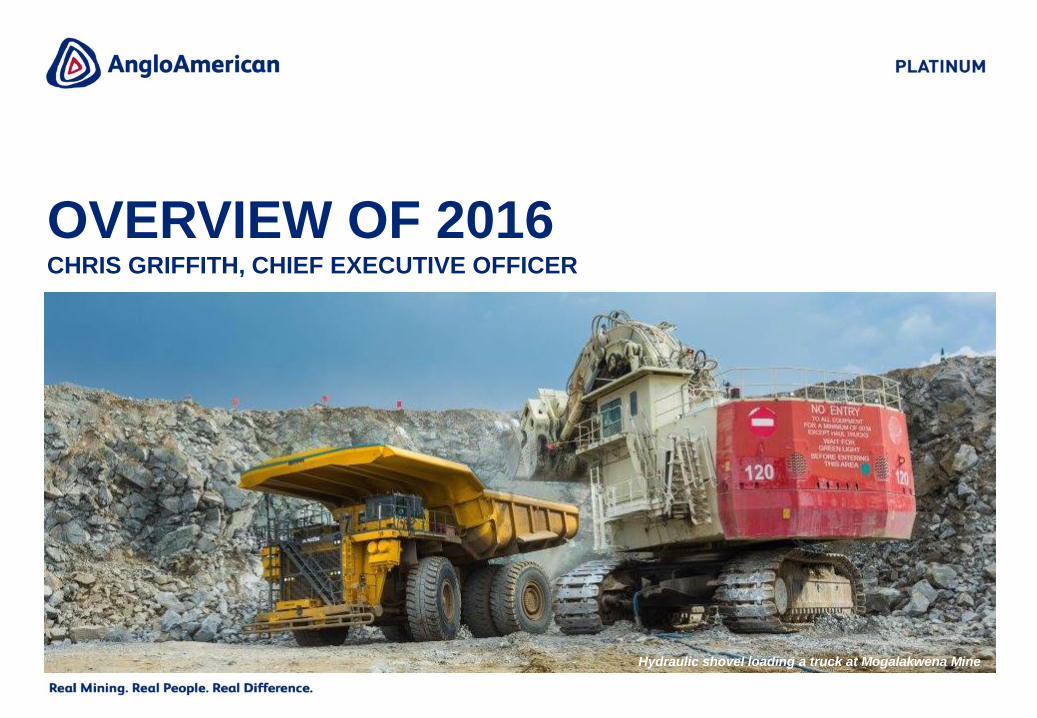
OVERVIEW OF 2016CHRIS GRIFFITH, CHIEF EXECUTIVE OFFICER
Hydraulic shovel loading a truck at Mogalakwena Mine
5
12.8
7.3
31 Dec 15 31 Dec 16
19,266
19,545
2015 2016
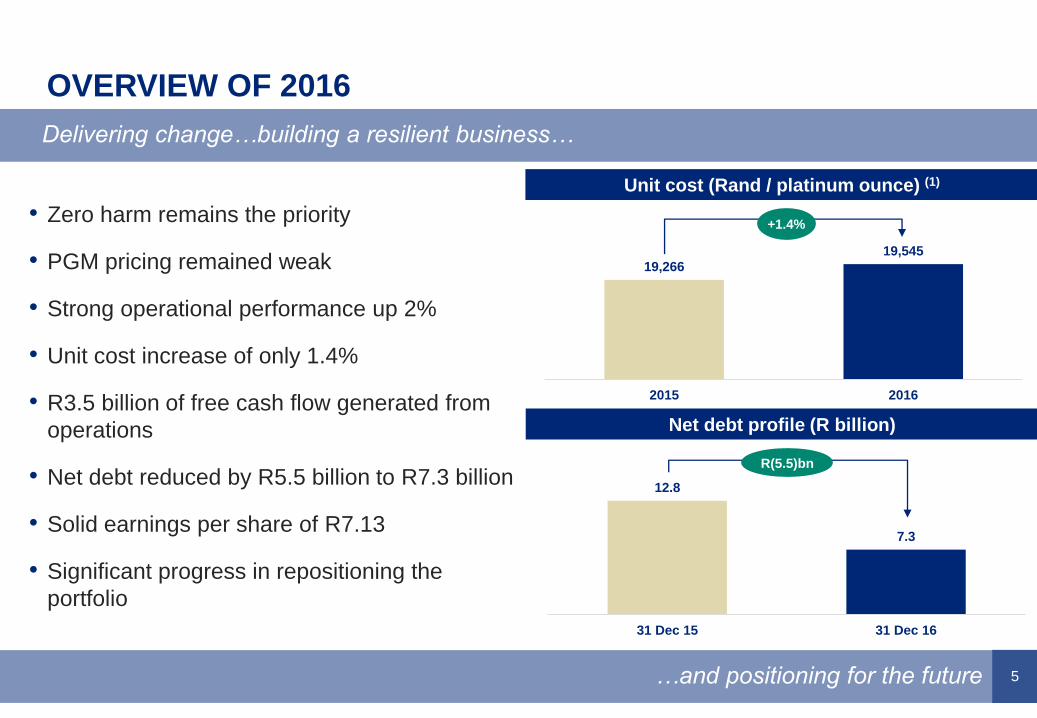
OVERVIEW OF 2016
Delivering change…building a resilient business…
…and positioning for the future
• Zero harm remains the priority
• PGM pricing remained weak
• Strong operational performance up 2%
• Unit cost increase of only 1.4%
• R3.5 billion of free cash flow generated from
operations
• Net debt reduced by R5.5 billion to R7.3 billion
• Solid earnings per share of R7.13
• Significant progress in repositioning the
portfolio
Unit cost (Rand / platinum ounce) (1)
Net debt profile (R billion)
+1.4%
R(5.5)bn
OPERATIONAL REVIEWCHRIS GRIFFITH, CHIEF EXECUTIVE OFFICER
Precious Metals RefineryAmandelbult Chrome Plant
7
SAFETY, HEALTH & ENVIRONMENT
Disappointing fatality performance…
…remain committed to zero harm
Number of fatalities – own mine operations
Lost time injury frequency rate (LTIFR) (2)
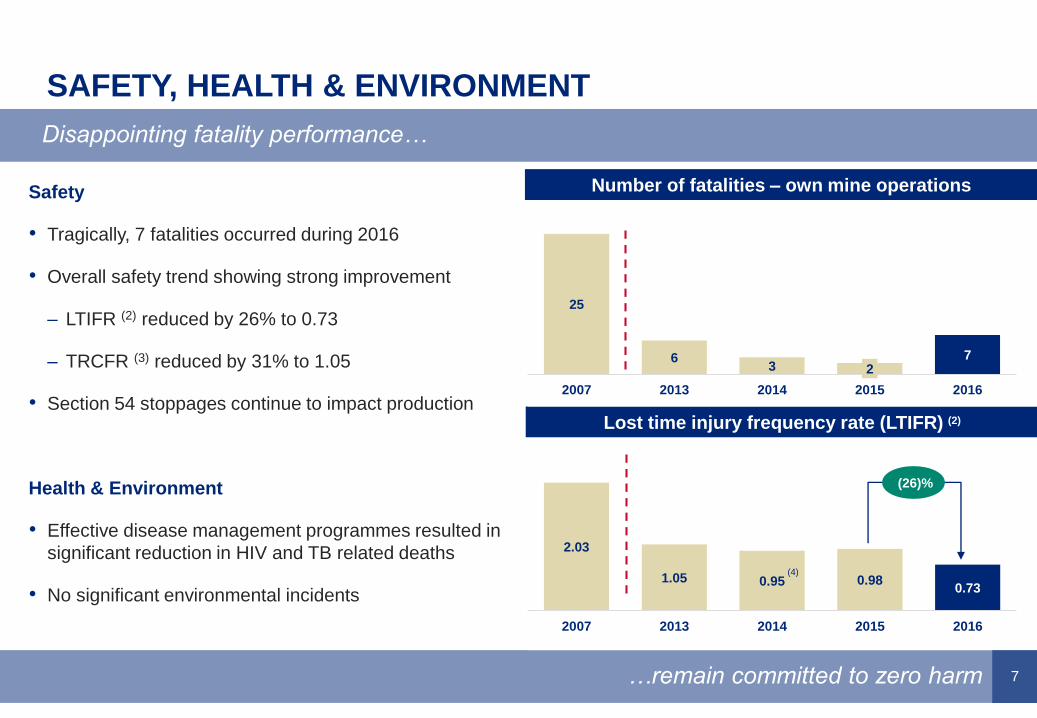
Safety
• Tragically, 7 fatalities occurred during 2016
• Overall safety trend showing strong improvement
– LTIFR (2) reduced by 26% to 0.73
– TRCFR (3) reduced by 31% to 1.05
• Section 54 stoppages continue to impact production
Health & Environment
• Effective disease management programmes resulted in
significant reduction in HIV and TB related deaths
• No significant environmental incidents
25
63 2
7
2007 2013 2014 2015 2016
2.03
1.05 0.95 0.980.73
2007 2013 2014 2015 2016
(4)
(26)%
8
440 440
630
440
65*
Dec 14 Dec 15 Jun 16 Dec 16
OPERATIONAL PERFORMANCE IN 2016
Efficiencies improving at operations…
…leading to an increase in profitable production
Total platinum production (million ounces) (5)
Pipeline & refined platinum inventory (‘000 ounces)
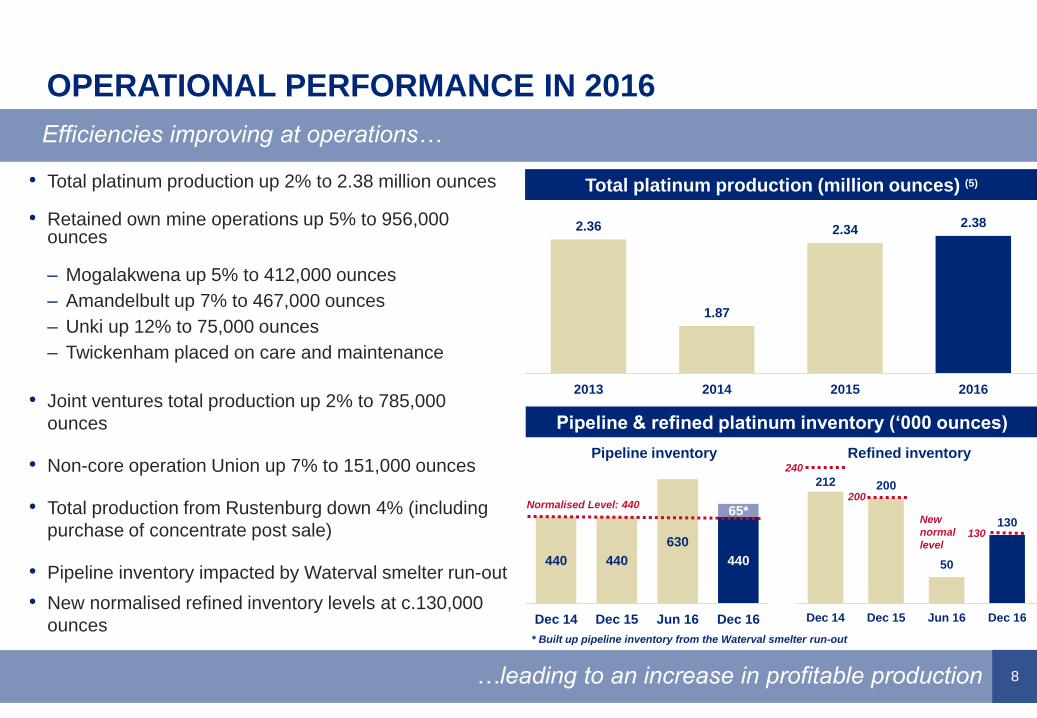
• Total platinum production up 2% to 2.38 million ounces
• Retained own mine operations up 5% to 956,000 ounces
– Mogalakwena up 5% to 412,000 ounces
– Amandelbult up 7% to 467,000 ounces
– Unki up 12% to 75,000 ounces
– Twickenham placed on care and maintenance
• Joint ventures total production up 2% to 785,000
ounces
• Non-core operation Union up 7% to 151,000 ounces
• Total production from Rustenburg down 4% (including
purchase of concentrate post sale)
• Pipeline inventory impacted by Waterval smelter run-out
• New normalised refined inventory levels at c.130,000
ounces
Pipeline inventory Refined inventory
Normalised Level: 440
212 200
50
130
Dec 14 Dec 15 Jun 16 Dec 16
2.36
1.87
2.342.38
2013 2014 2015 2016
New
normal
level
* Built up pipeline inventory from the Waterval smelter run-out
240
200
130
9
46%49% 50%
47%
30,130
35,62432,850
34,309
0%
10%
20%
30%
40%
50%
2013 2014 2015 2016
Cash Operating Margin Rand Basket Price
325353
369 38116
22
2331
2013 2014 2015 2016
Mogalakwena Baobab
MOGALAKWENA
Another record performance…
...through increased operational efficiencies, without the need for growth capital
Platinum production (‘000 ounces) (5)
Cash operating margin (%) (6)
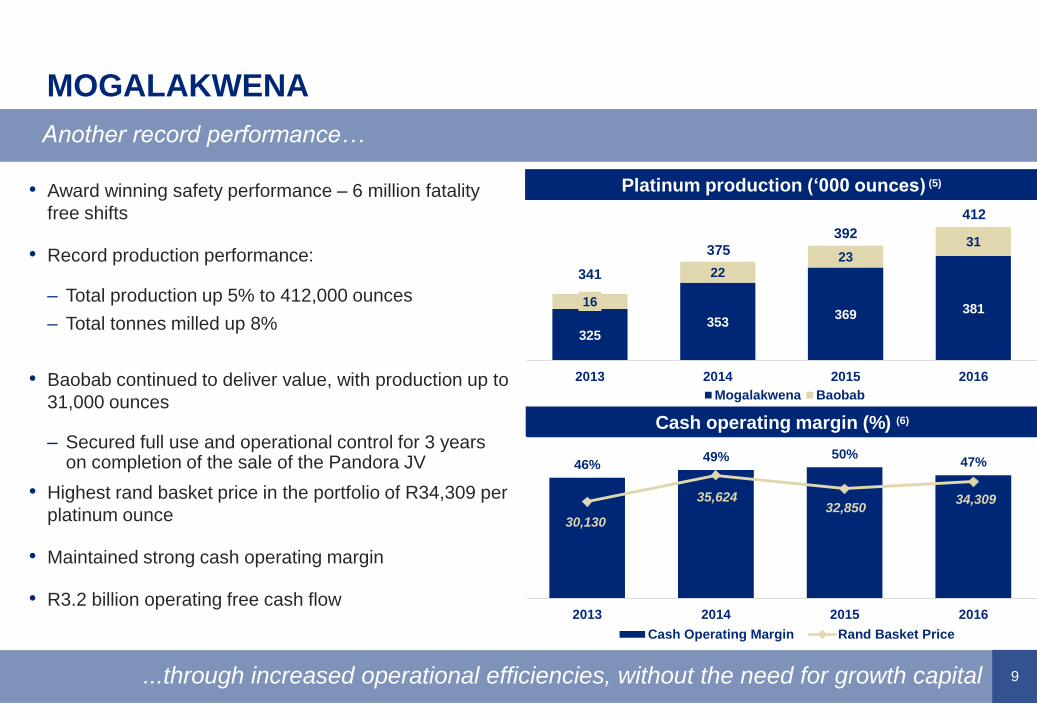
• Award winning safety performance – 6 million fatality
free shifts
• Record production performance:
– Total production up 5% to 412,000 ounces
– Total tonnes milled up 8%
• Baobab continued to deliver value, with production up to
31,000 ounces
– Secured full use and operational control for 3 years on completion of the sale of the Pandora JV
• Highest rand basket price in the portfolio of R34,309 per
platinum ounce
• Maintained strong cash operating margin
• R3.2 billion operating free cash flow
341
375
392
412
10
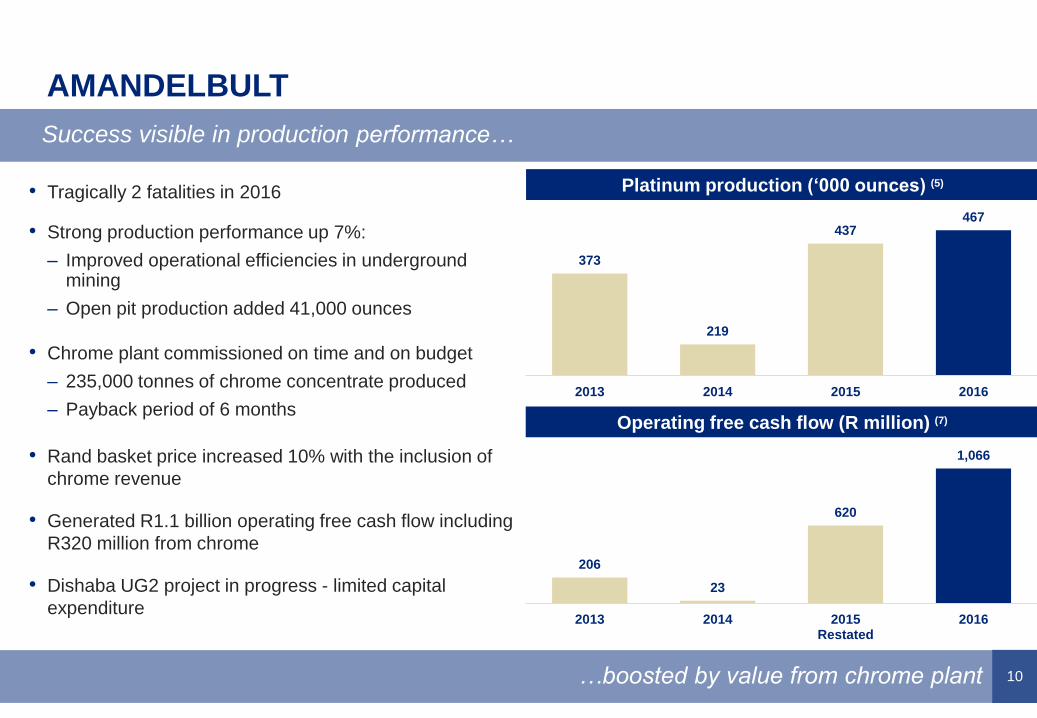
AMANDELBULT
Success visible in production performance…
…boosted by value from chrome plant
Platinum production (‘000 ounces) (5)
Operating free cash flow (R million) (7)
• Tragically 2 fatalities in 2016
• Strong production performance up 7%:
– Improved operational efficiencies in underground mining
– Open pit production added 41,000 ounces
• Chrome plant commissioned on time and on budget
– 235,000 tonnes of chrome concentrate produced
– Payback period of 6 months
• Rand basket price increased 10% with the inclusion of
chrome revenue
• Generated R1.1 billion operating free cash flow including
R320 million from chrome
• Dishaba UG2 project in progress - limited capital
expenditure
373
219
437467
2013 2014 2015 2016
206
23
620
1,066
2013 2014 2015Restated
2016
11
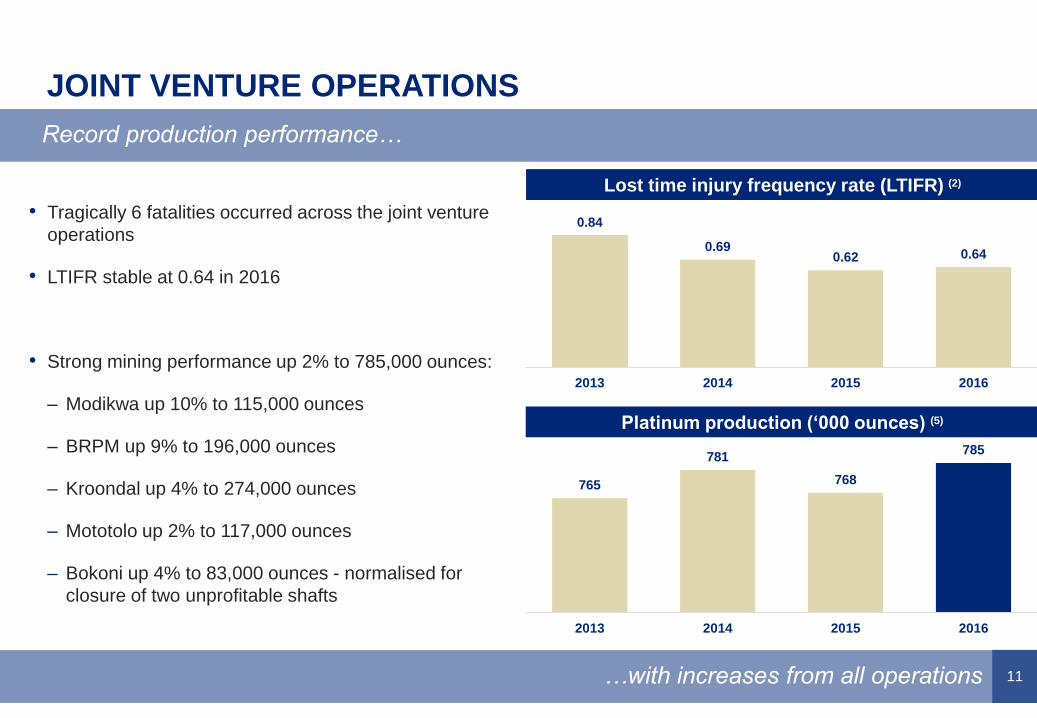
JOINT VENTURE OPERATIONS
Record production performance…
…with increases from all operations
Lost time injury frequency rate (LTIFR) (2)
Platinum production (‘000 ounces) (5)
• Tragically 6 fatalities occurred across the joint venture
operations
• LTIFR stable at 0.64 in 2016
• Strong mining performance up 2% to 785,000 ounces:
– Modikwa up 10% to 115,000 ounces
– BRPM up 9% to 196,000 ounces
– Kroondal up 4% to 274,000 ounces
– Mototolo up 2% to 117,000 ounces
– Bokoni up 4% to 83,000 ounces - normalised for
closure of two unprofitable shafts
0.84
0.690.62 0.64
2013 2014 2015 2016
388
765
781
768
785
2013 2014 2015 2016
12
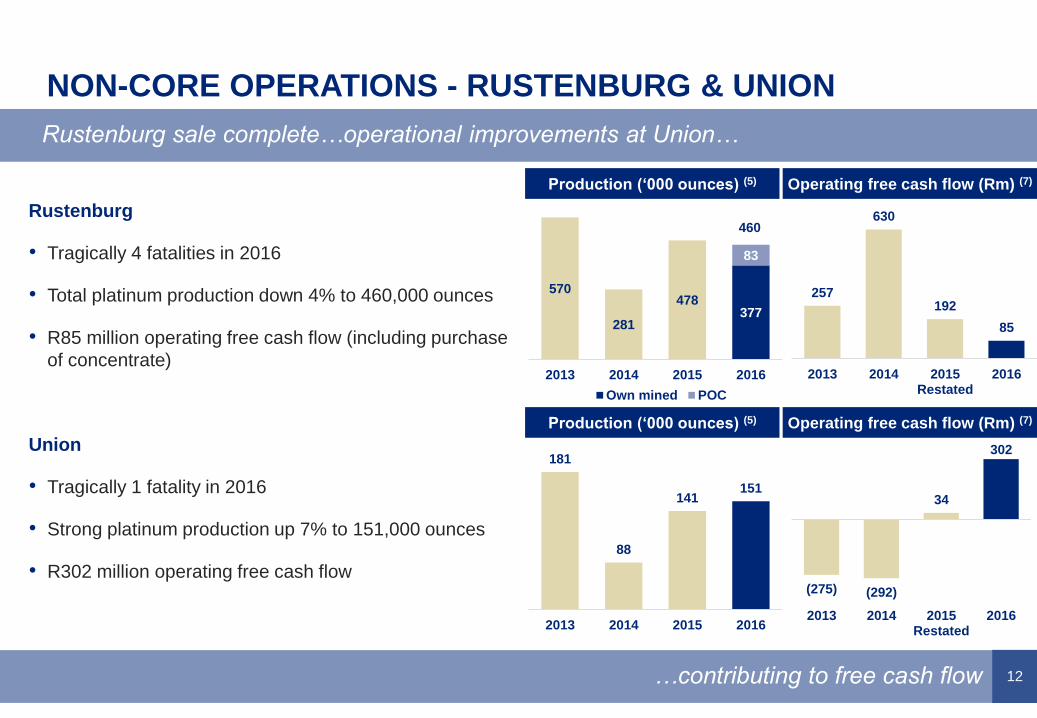
NON-CORE OPERATIONS - RUSTENBURG & UNION
Rustenburg sale complete…operational improvements at Union…
…contributing to free cash flow
Production (‘000 ounces) (5)
Rustenburg
• Tragically 4 fatalities in 2016
• Total platinum production down 4% to 460,000 ounces
• R85 million operating free cash flow (including purchase
of concentrate)
Union
• Tragically 1 fatality in 2016
• Strong platinum production up 7% to 151,000 ounces
• R302 million operating free cash flow
Production (‘000 ounces) (5)
570
281
478377
83
2013 2014 2015 2016
Own mined POC
460
181
88
141151
2013 2014 2015 2016
Operating free cash flow (Rm) (7)
Operating free cash flow (Rm) (7)
257
630
192
85
2013 2014 2015Restated
2016
(275) (292)
34
302
2013 2014 2015Restated
2016
13
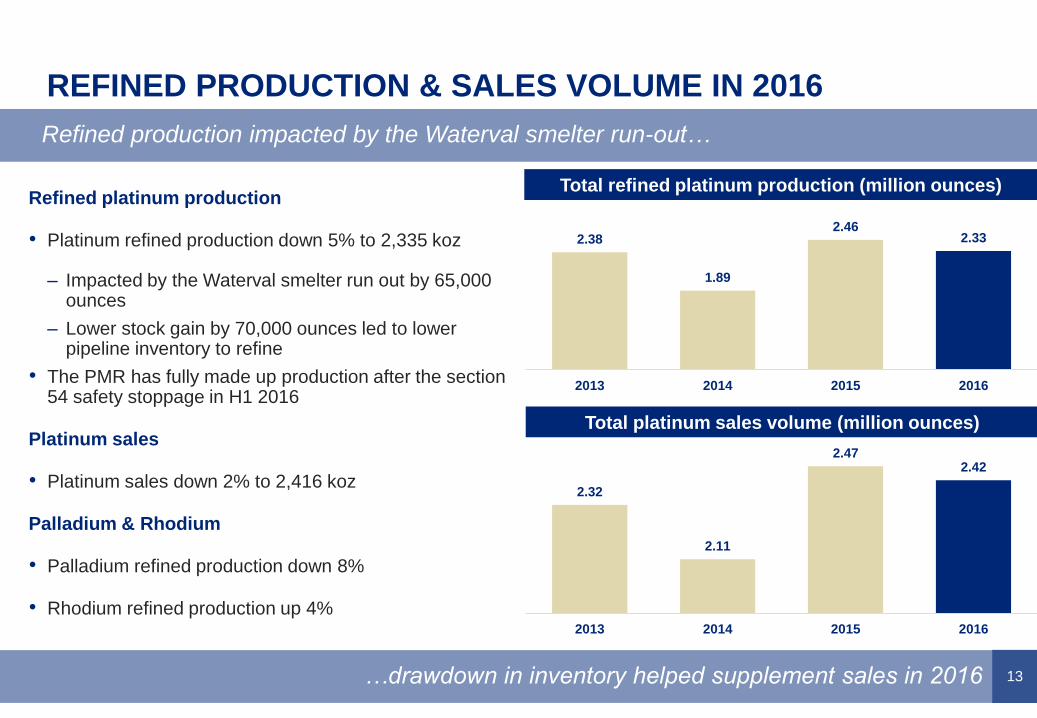
REFINED PRODUCTION & SALES VOLUME IN 2016
Refined production impacted by the Waterval smelter run-out…
…drawdown in inventory helped supplement sales in 2016
Total refined platinum production (million ounces)
Total platinum sales volume (million ounces)
Refined platinum production
• Platinum refined production down 5% to 2,335 koz
– Impacted by the Waterval smelter run out by 65,000 ounces
– Lower stock gain by 70,000 ounces led to lower pipeline inventory to refine
• The PMR has fully made up production after the section 54 safety stoppage in H1 2016
Platinum sales
• Platinum sales down 2% to 2,416 koz
Palladium & Rhodium
• Palladium refined production down 8%
• Rhodium refined production up 4%
2.38
1.89
2.462.33
2013 2014 2015 2016
2.32
2.11
2.472.42
2013 2014 2015 2016
FINANCIAL REVIEWIAN BOTHA, FINANCE DIRECTOR
PLATINUM
Valcambi Suisse
500g Platinum Bar
15
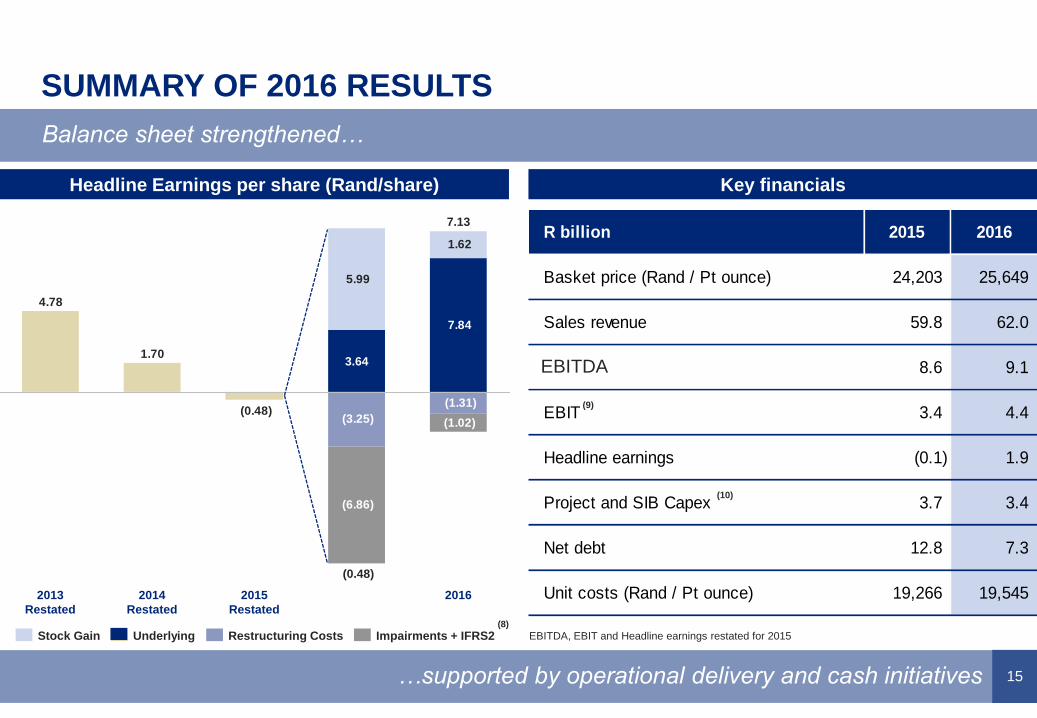
R billion 2015 2016
Basket price (Rand / Pt ounce) 24,203 25,649
Sales revenue 59.8 62.0
EBITDA 8.6 9.1
EBIT ⁽⁷⁾ 3.4 4.4
Headline earnings (0.1) 1.9
Project and SIB Capex ⁽⁸⁾ 3.7 3.4
Net debt 12.8 7.3
Unit costs (Rand / Pt ounce) 19,266 19,545
SUMMARY OF 2016 RESULTS
Balance sheet strengthened…
…supported by operational delivery and cash initiatives
Headline Earnings per share (Rand/share) Key financials
(3.25)
(1.31) (0.48)
(1.02)
(6.86)
1.70
4.78
7.84
1.62
5.99
7.13
2016
3.64
(0.48)
2013
Restated
2015
Restated
2014
Restated
Stock Gain Impairments + IFRS2Underlying Restructuring Costs(8)
EBITDA, EBIT and Headline earnings restated for 2015
(9)
(10)
EBITDA
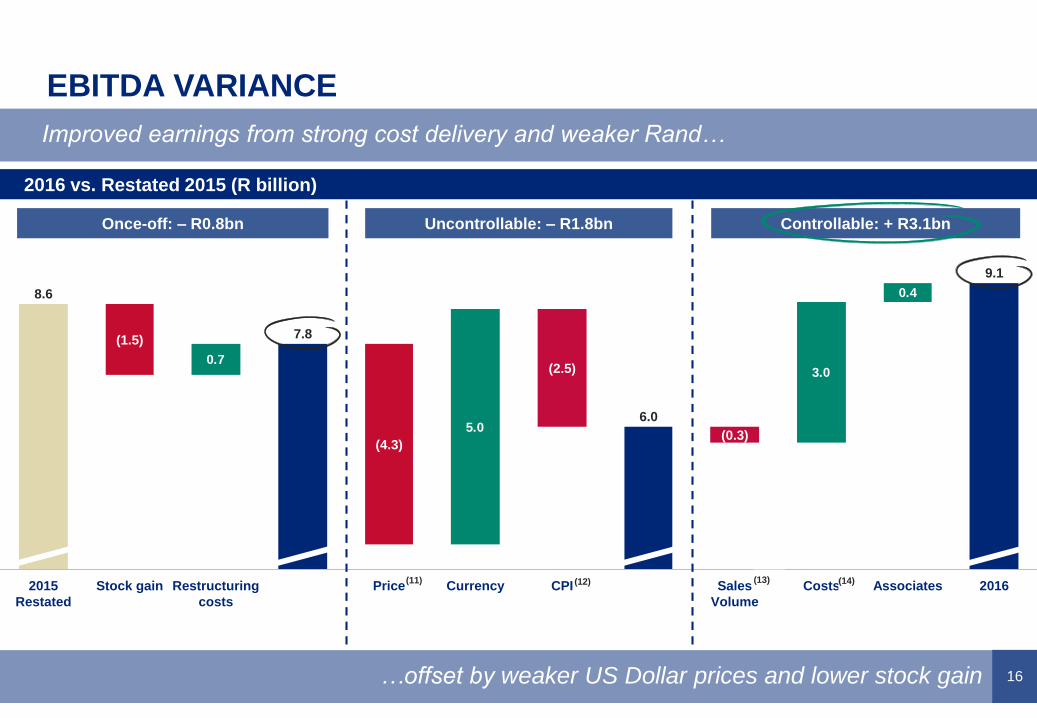
16
0.4
3.0
5.0
0.7
2016
6.0
(4.3)
(1.5)
(2.5)
8.6
7.8
9.1
CostsSales
Volume
CPI
(0.3)
Price CurrencyStock gain AssociatesRestructuring
costs
2015
Restated
EBITDA VARIANCE
…offset by weaker US Dollar prices and lower stock gain
Improved earnings from strong cost delivery and weaker Rand…
(10)(9)
Uncontrollable: – R1.8bn Controllable: + R3.1bn Once-off: – R0.8bn
2016 vs. Restated 2015 (R billion)
(11) (12)(11) (12) (13) (14)
17
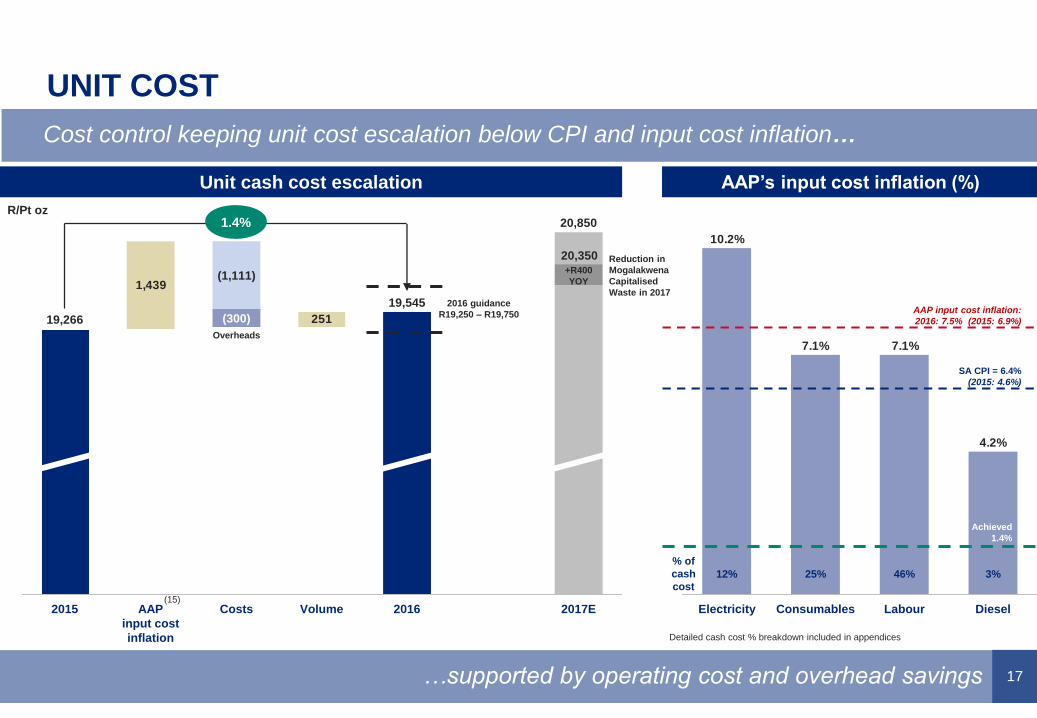
4.2%
7.1%7.1%
10.2%
LabourConsumablesElectricity Diesel
UNIT COST
Cost control keeping unit cost escalation below CPI and input cost inflation…
…supported by operating cost and overhead savings
AAP’s input cost inflation (%)Unit cash cost escalation
251
1,439
VolumeCosts
19,545
(300)
AAP
input cost
inflation
2015
(1,111)
19,266
2016 2017E
20,8501.4%
(15)
R/Pt oz
2016 guidance
R19,250 – R19,750AAP input cost inflation:
2016: 7.5% (2015: 6.9%)
SA CPI = 6.4%
(2015: 4.6%)
12% 46% 3%25%
% of
cash
cost
20,350
Overheads
Reduction in
Mogalakwena
Capitalised
Waste in 2017
+R400
YOY
Achieved
1.4%
Detailed cash cost % breakdown included in appendices
1.4%
18
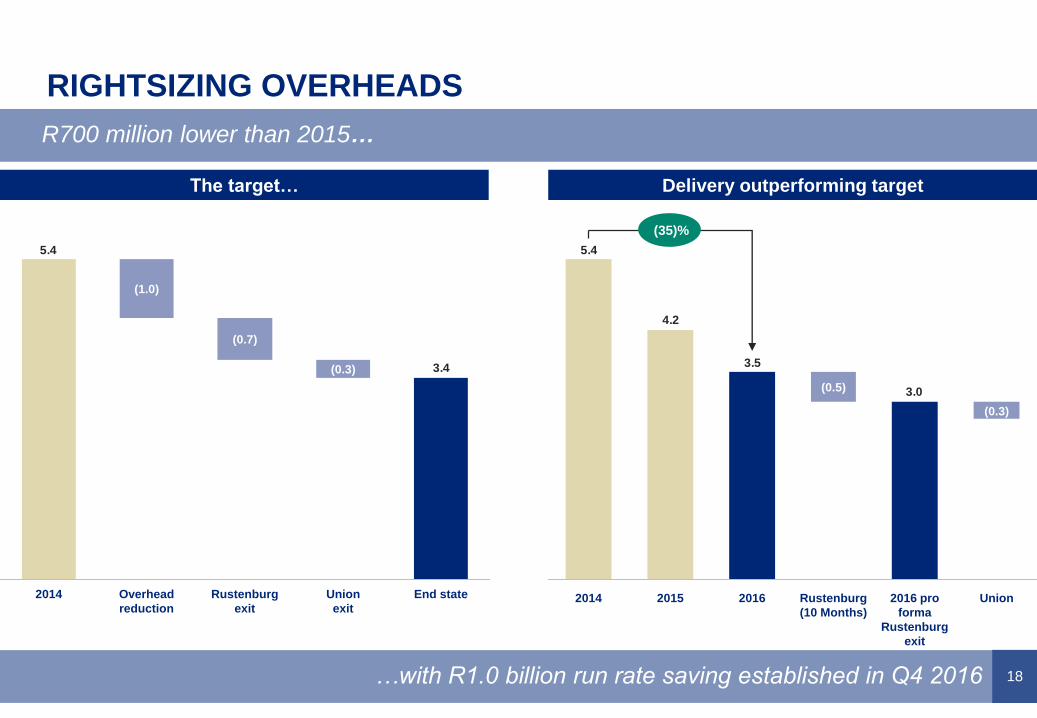
R700 million lower than 2015…
…with R1.0 billion run rate saving established in Q4 2016
RIGHTSIZING OVERHEADS
The target… Delivery outperforming target
3.4
5.4
End state2014 Rustenburg
exit
Union
exit
(0.7)
Overhead
reduction
(0.3)
(1.0)
3.0
3.5
4.2
5.4
2014
(0.3)
2016 pro
forma
Rustenburg
exit
Rustenburg
(10 Months)
(35)%
20162015
(0.5)
Union
(35)%
19
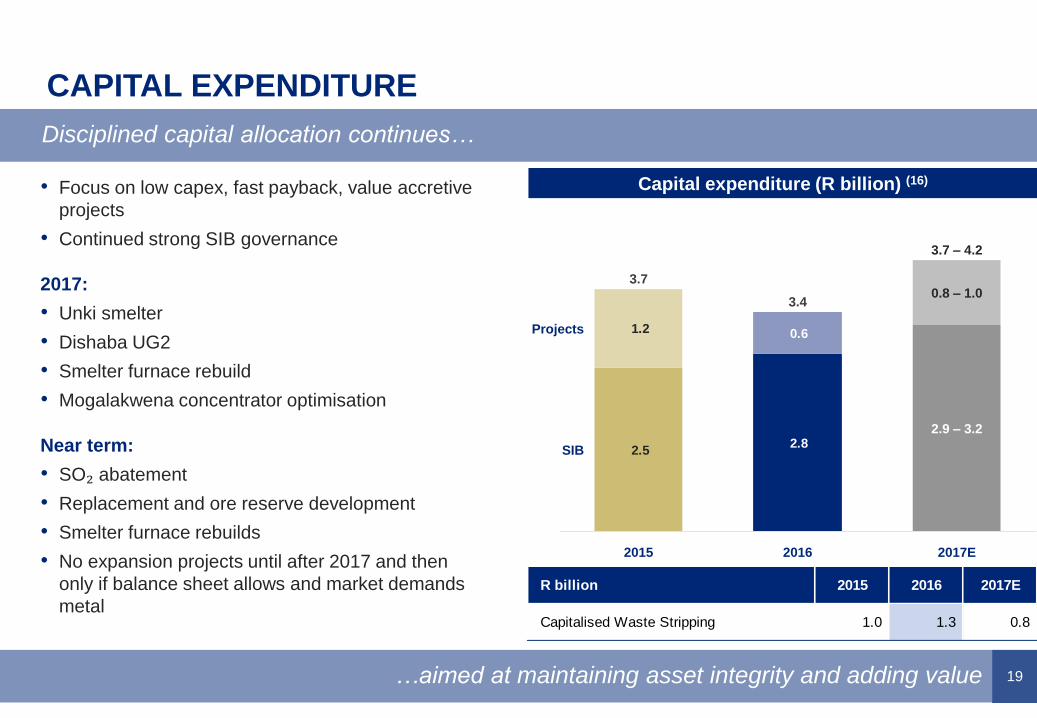
CAPITAL EXPENDITURE
Disciplined capital allocation continues…
…aimed at maintaining asset integrity and adding value
Capital expenditure (R billion) (16)
2.8 2.5
0.6 1.2
3.7 – 4.2
2017E
2.9 – 3.2
0.8 – 1.03.4
2015 2016
3.7
Projects
SIB
• Focus on low capex, fast payback, value accretive
projects
• Continued strong SIB governance
2017:
• Unki smelter
• Dishaba UG2
• Smelter furnace rebuild
• Mogalakwena concentrator optimisation
Near term:
• SO₂ abatement
• Replacement and ore reserve development
• Smelter furnace rebuilds
• No expansion projects until after 2017 and then
only if balance sheet allows and market demands
metal
R billion 2015 2016 2017E
Capitalised Waste Stripping 1.0 1.3 0.8
20
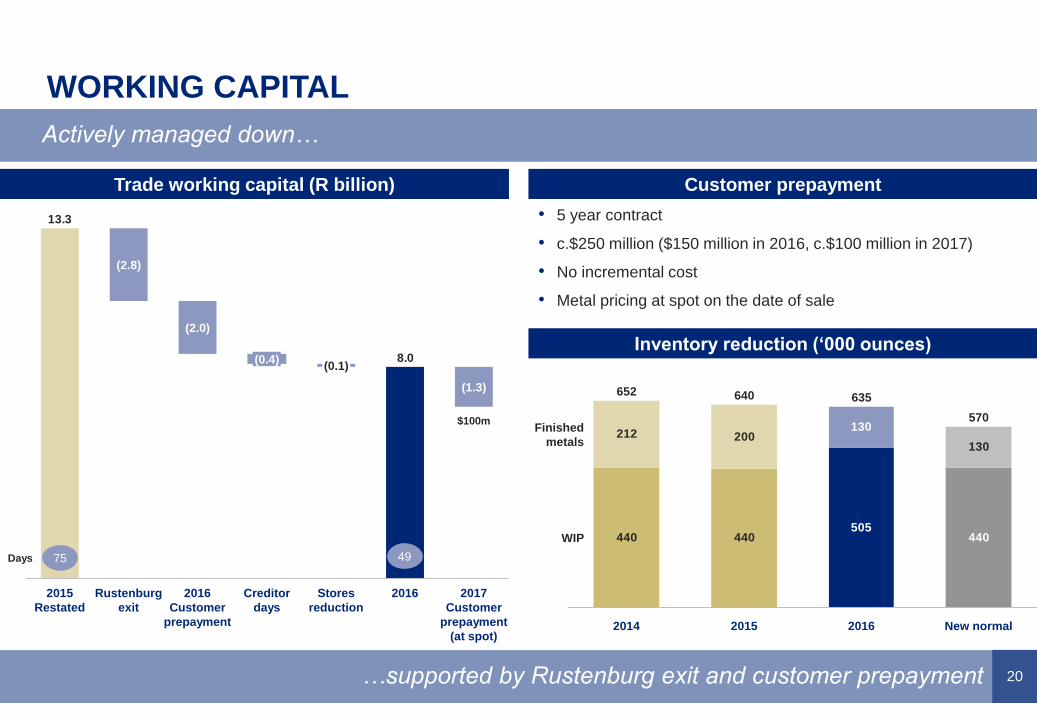
WORKING CAPITAL
Actively managed down…
…supported by Rustenburg exit and customer prepayment
Trade working capital (R billion) Customer prepayment
Inventory reduction (‘000 ounces)8.0
13.3
Creditor
days
Stores
reduction
2016
(0.1)
(1.3)
(0.4)
Rustenburg
exit
2015
Restated
2017
Customer
prepayment
(at spot)
(2.0)
2016
Customer
prepayment
(2.8)
• 5 year contract
• c.$250 million ($150 million in 2016, c.$100 million in 2017)
• No incremental cost
• Metal pricing at spot on the date of sale
440 440
212 200130
440505
130
WIP
Finished
metals
635
New normal2016
570
640
20152014
652
Days
$100m
75 49
21
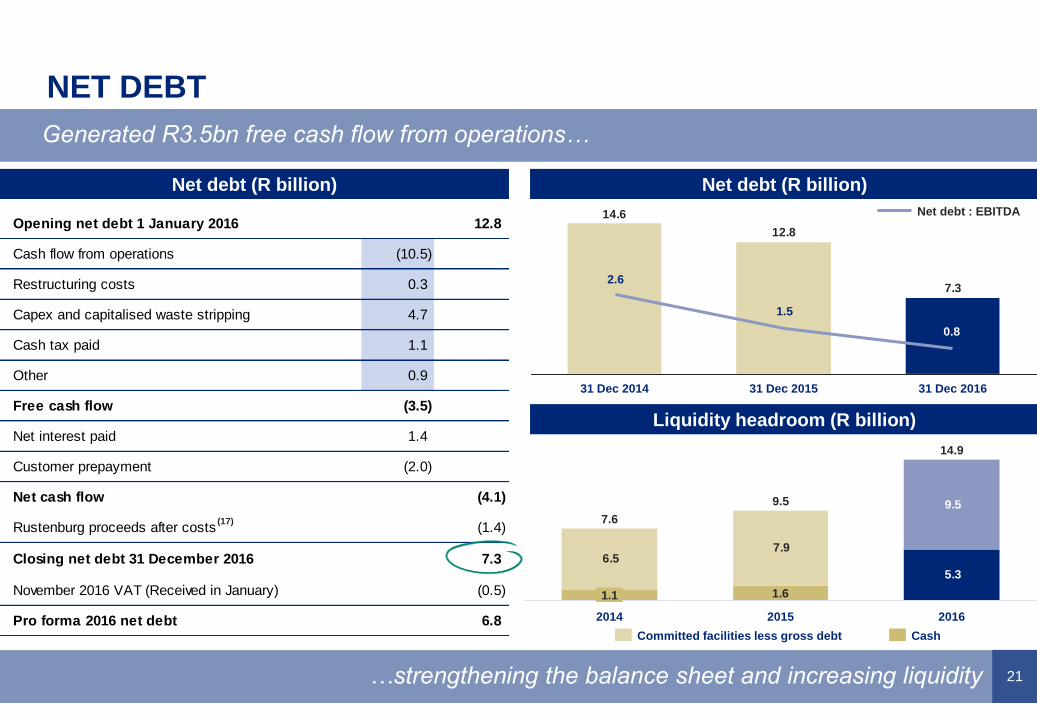
Opening net debt 1 January 2016 12.8
Cash flow from operations (10.5)
Restructuring costs 0.3
Capex and capitalised waste stripping 4.7
Cash tax paid 1.1
Other 0.9
Free cash flow (3.5)
Net interest paid 1.4
Customer prepayment (2.0)
Net cash flow (4.1)
Rustenburg proceeds after costs ⁽¹⁵⁾ (1.4)
Closing net debt 31 December 2016 7.3
November 2016 VAT (Received in January) (0.5)
Pro forma 2016 net debt 6.8
NET DEBT
Generated R3.5bn free cash flow from operations…
…strengthening the balance sheet and increasing liquidity
Net debt (R billion)Net debt (R billion)
Liquidity headroom (R billion)
9.5
5.3
1.6
7.9 6.5
1.1
9.5
2015 20162014
14.9
7.6
CashCommitted facilities less gross debt
7.3
12.8
14.6
31 Dec 2014 31 Dec 2015 31 Dec 2016
Net debt : EBITDA
2.6
1.5
0.8
(17)
MARKETS REVIEWCHRIS GRIFFITH, CHIEF EXECUTIVE OFFICER
Hydrogenious – Hydrogen supply
system for a hydrogen filling station
23
MARKET PRICES
Average US Dollar PGM prices were lower year-on-year in 2016…
…with US Dollar strength weighing on prices in H2
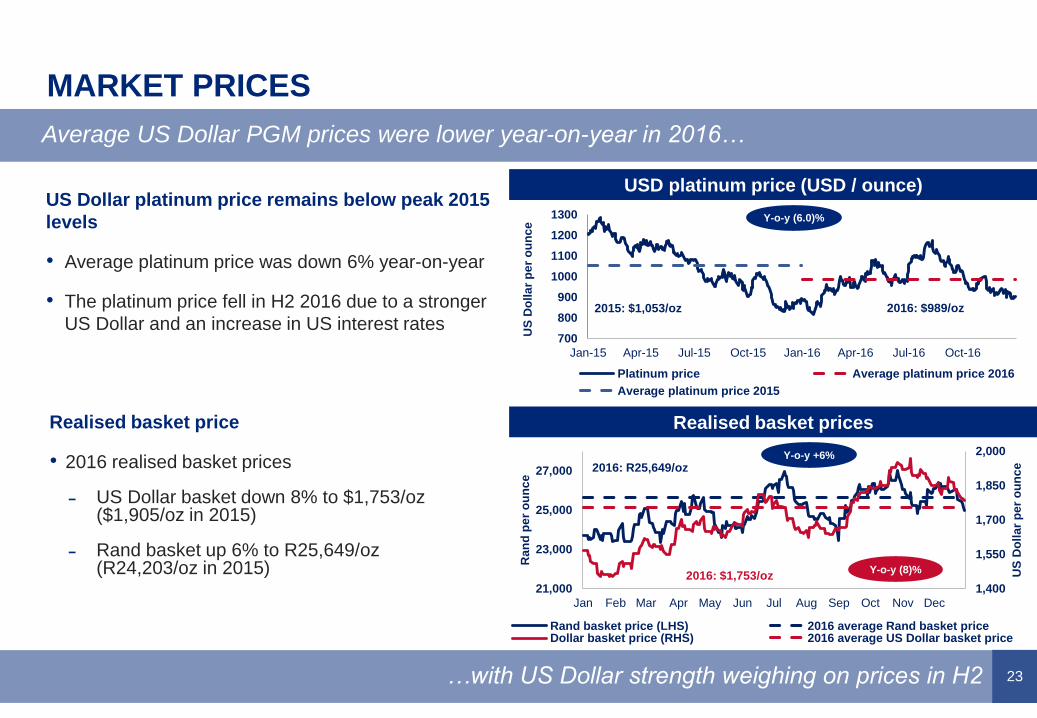
USD platinum price (USD / ounce)US Dollar platinum price remains below peak 2015
levels
• Average platinum price was down 6% year-on-year
• The platinum price fell in H2 2016 due to a stronger
US Dollar and an increase in US interest rates
Realised basket price
• 2016 realised basket prices
˗ US Dollar basket down 8% to $1,753/oz($1,905/oz in 2015)
˗ Rand basket up 6% to R25,649/oz(R24,203/oz in 2015)
Realised basket prices
1,400
1,550
1,700
1,850
2,000
21,000
23,000
25,000
27,000
Jan Feb Mar Apr May Jun Jul Aug Sep Oct Nov Dec
US
Do
lla
r p
er
ou
nc
e
Ran
d p
er
ou
nc
e
Rand basket price (LHS) 2016 average Rand basket priceDollar basket price (RHS) 2016 average US Dollar basket price
2016: R25,649/oz
2016: $1,753/oz
700
800
900
1000
1100
1200
1300
Jan-15 Apr-15 Jul-15 Oct-15 Jan-16 Apr-16 Jul-16 Oct-16
US
Do
lla
r p
er
ou
nc
e
Platinum price Average platinum price 2016
Average platinum price 2015
2016: $989/oz2015: $1,053/oz
Y-o-y (6.0)%
Y-o-y +6%
Y-o-y (8)%
24
PLATINUM MARKET
Platinum in deficit in 2016 due to strong industrial and investment demand…
…despite headwinds in automotive and jewellery sectors
(185)
(791)(856)
(457) (422)
2012 2013 2014 2015 2016E
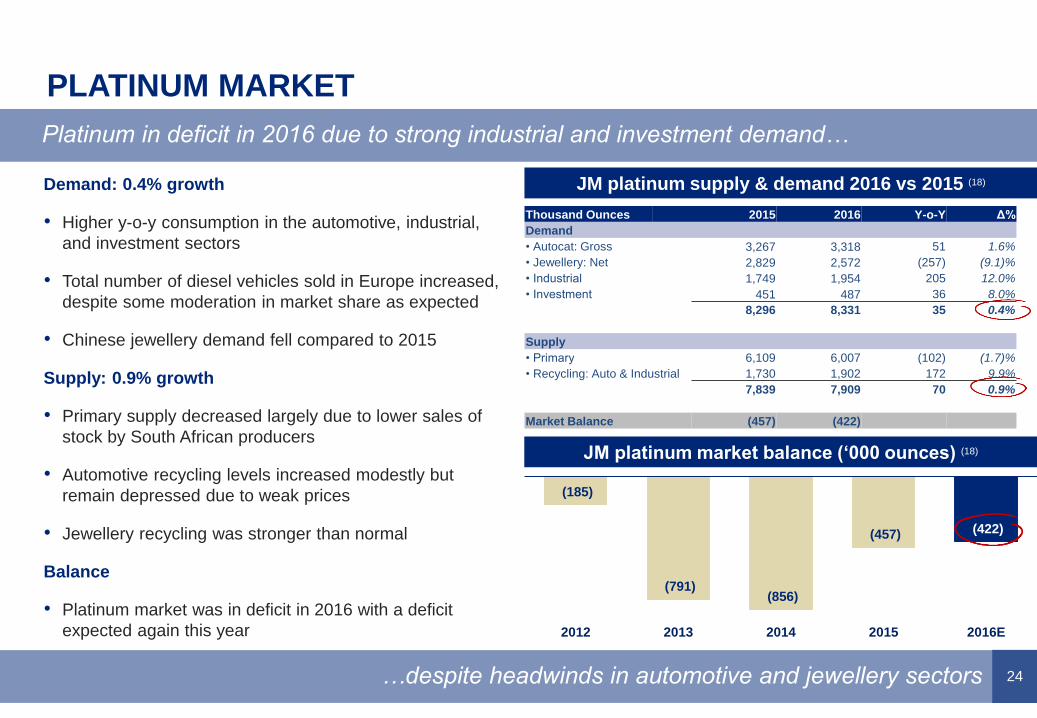
Demand: 0.4% growth
• Higher y-o-y consumption in the automotive, industrial,
and investment sectors
• Total number of diesel vehicles sold in Europe increased,
despite some moderation in market share as expected
• Chinese jewellery demand fell compared to 2015
Supply: 0.9% growth
• Primary supply decreased largely due to lower sales of
stock by South African producers
• Automotive recycling levels increased modestly but
remain depressed due to weak prices
• Jewellery recycling was stronger than normal
Balance
• Platinum market was in deficit in 2016 with a deficit
expected again this year
JM platinum market balance (‘000 ounces) (18)
JM platinum supply & demand 2016 vs 2015 (18)
Thousand Ounces 2015 2016 Y-o-Y Δ%
Demand
• Autocat: Gross 3,267 3,318 51 1.6%
• Jewellery: Net 2,829 2,572 (257) (9.1)%
• Industrial 1,749 1,954 205 12.0%
• Investment 451 487 36 8.0%
8,296 8,331 35 0.4%
Supply
• Primary 6,109 6,007 (102) (1.7)%
• Recycling: Auto & Industrial 1,730 1,902 172 9.9%
7,839 7,909 70 0.9%
Market Balance (457) (422)
25
PLATINUM MARKET - AUTOMOTIVE
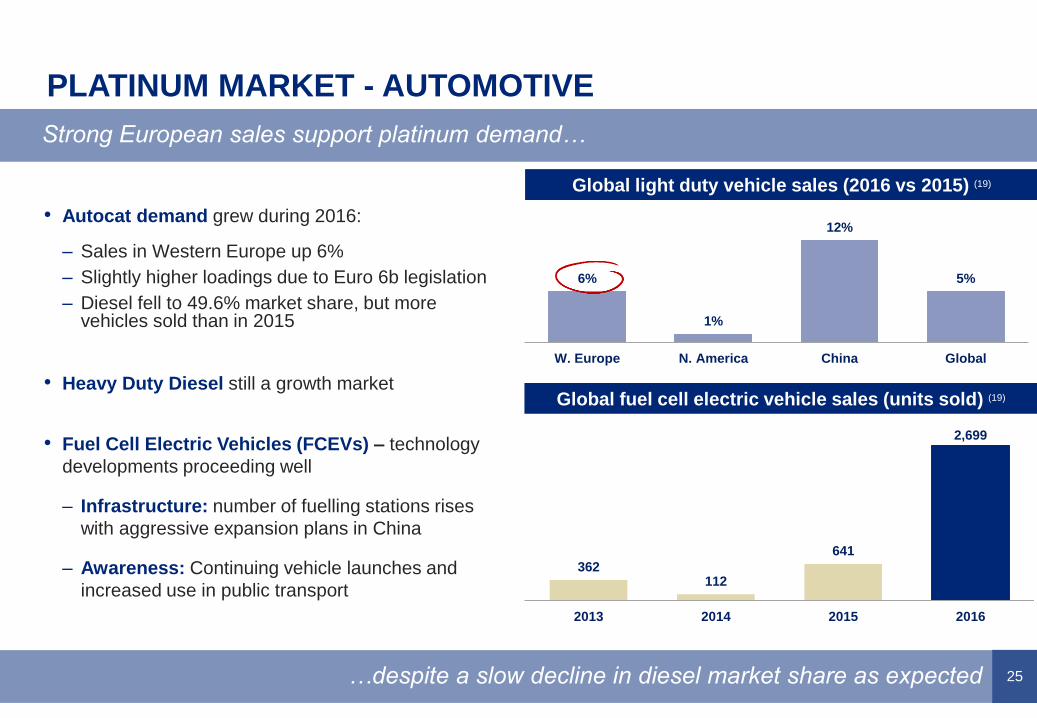
Strong European sales support platinum demand…
…despite a slow decline in diesel market share as expected
6%
1%
12%
5%
W. Europe N. America China Global
• Autocat demand grew during 2016:
– Sales in Western Europe up 6%
– Slightly higher loadings due to Euro 6b legislation
– Diesel fell to 49.6% market share, but more vehicles sold than in 2015
• Heavy Duty Diesel still a growth market
• Fuel Cell Electric Vehicles (FCEVs) – technology
developments proceeding well
– Infrastructure: number of fuelling stations rises
with aggressive expansion plans in China
– Awareness: Continuing vehicle launches and
increased use in public transport
Global light duty vehicle sales (2016 vs 2015) (19)
Global fuel cell electric vehicle sales (units sold) (19)
362112
641
2,699
2013 2014 2015 2016
26
PLATINUM MARKET - JEWELLERY
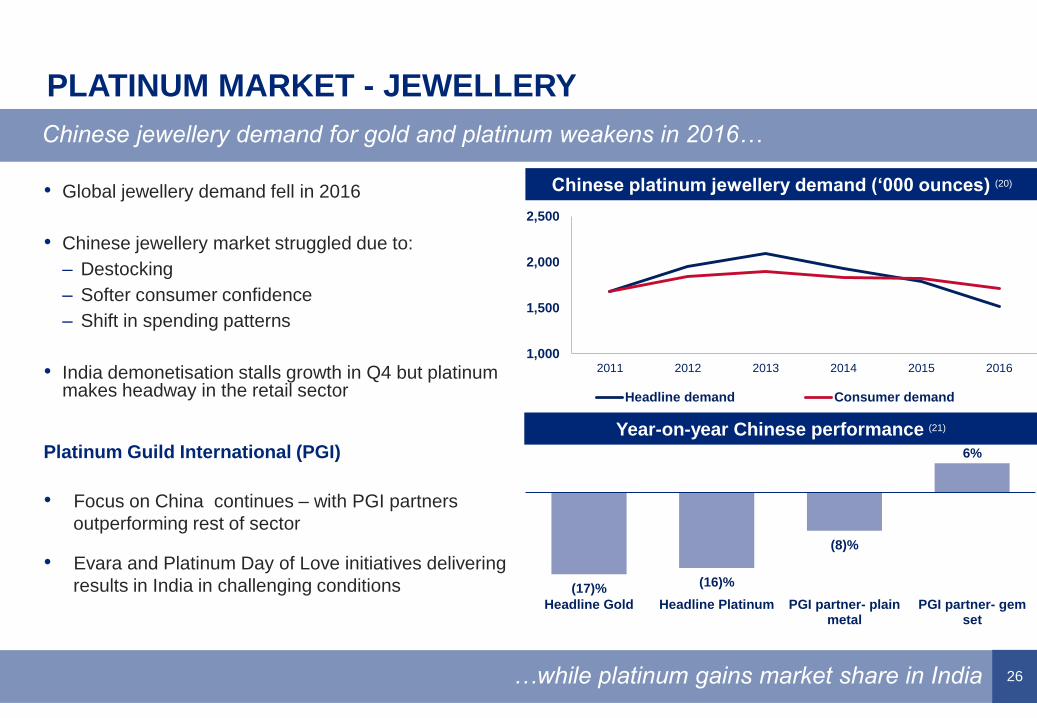
Chinese jewellery demand for gold and platinum weakens in 2016…
…while platinum gains market share in India
• Global jewellery demand fell in 2016
• Chinese jewellery market struggled due to:
– Destocking
– Softer consumer confidence
– Shift in spending patterns
• India demonetisation stalls growth in Q4 but platinum makes headway in the retail sector
Platinum Guild International (PGI)
• Focus on China continues – with PGI partners
outperforming rest of sector
• Evara and Platinum Day of Love initiatives delivering
results in India in challenging conditions
Year-on-year Chinese performance (21)
Chinese platinum jewellery demand (‘000 ounces) (20)
1,000
1,500
2,000
2,500
2011 2012 2013 2014 2015 2016
Headline demand Consumer demand
(17)%(16)%
(8)%
6%
Headline Gold Headline Platinum PGI partner- plainmetal
PGI partner- gemset
27
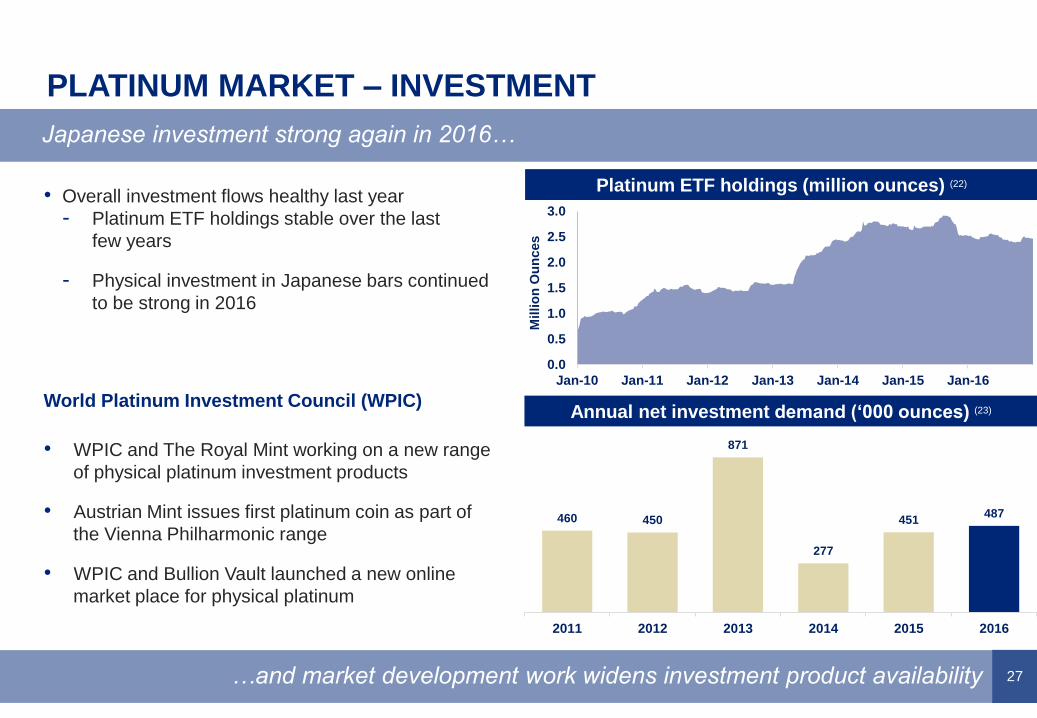
PLATINUM MARKET – INVESTMENT
Japanese investment strong again in 2016…
…and market development work widens investment product availability
Platinum ETF holdings (million ounces) (22)
Annual net investment demand (‘000 ounces) (23)
• Overall investment flows healthy last year
- Platinum ETF holdings stable over the last
few years
- Physical investment in Japanese bars continued
to be strong in 2016
World Platinum Investment Council (WPIC)
• WPIC and The Royal Mint working on a new range
of physical platinum investment products
• Austrian Mint issues first platinum coin as part of
the Vienna Philharmonic range
• WPIC and Bullion Vault launched a new online
market place for physical platinum
0.0
0.5
1.0
1.5
2.0
2.5
3.0
Jan-10 Jan-11 Jan-12 Jan-13 Jan-14 Jan-15 Jan-16
Millio
n O
un
ces
460 450
871
277
451487
2011 2012 2013 2014 2015 2016
28
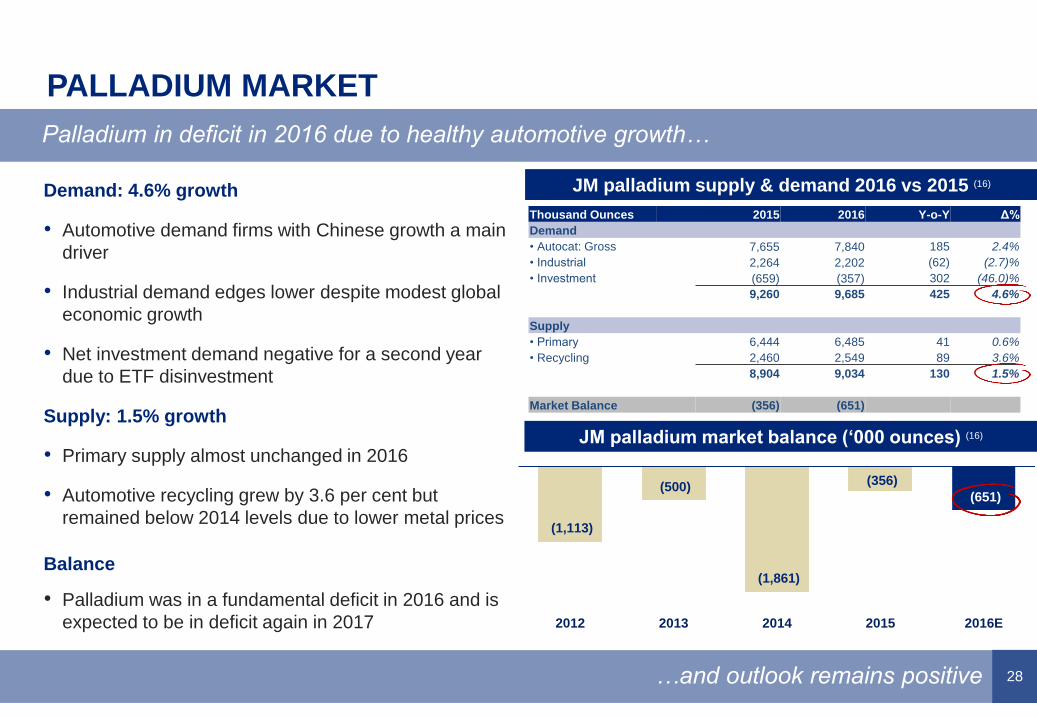
PALLADIUM MARKET
Palladium in deficit in 2016 due to healthy automotive growth…
…and outlook remains positive
(1,113)
(500)
(1,861)
(356)
(651)
2012 2013 2014 2015 2016E
Demand: 4.6% growth
• Automotive demand firms with Chinese growth a main
driver
• Industrial demand edges lower despite modest global
economic growth
• Net investment demand negative for a second year
due to ETF disinvestment
Supply: 1.5% growth
• Primary supply almost unchanged in 2016
• Automotive recycling grew by 3.6 per cent but
remained below 2014 levels due to lower metal prices
Balance
• Palladium was in a fundamental deficit in 2016 and is
expected to be in deficit again in 2017
JM palladium supply & demand 2016 vs 2015 (16)
JM palladium market balance (‘000 ounces) (16)
Thousand Ounces 2015 2016 Y-o-Y Δ%
Demand
• Autocat: Gross 7,655 7,840 185 2.4%
• Industrial 2,264 2,202 (62) (2.7)%
• Investment (659) (357) 302 (46.0)%
9,260 9,685 425 4.6%
Supply
• Primary 6,444 6,485 41 0.6%
• Recycling 2,460 2,549 89 3.6%
8,904 9,034 130 1.5%
Market Balance (356) (651)
STRATEGY REVIEWCHRIS GRIFFITH, CHIEF EXECUTIVE OFFICER
Process operator at the Precious Metals Refinery
30
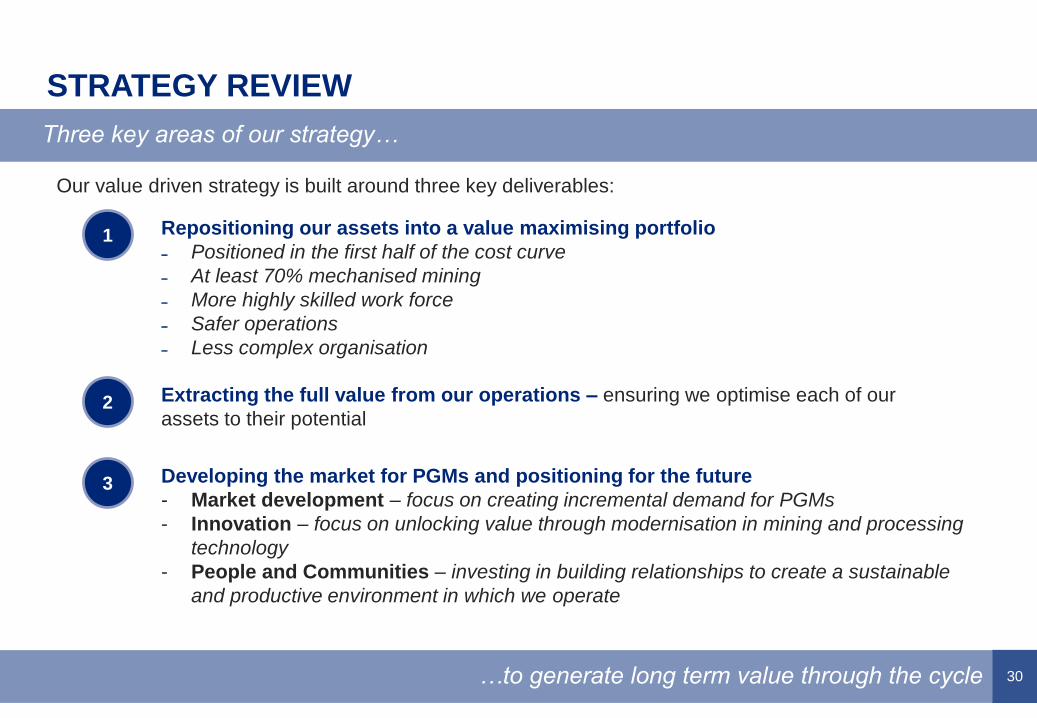
Developing the market for PGMs and positioning for the future
- Market development – focus on creating incremental demand for PGMs
- Innovation – focus on unlocking value through modernisation in mining and processing
technology
- People and Communities – investing in building relationships to create a sustainable
and productive environment in which we operate
…to generate long term value through the cycle
STRATEGY REVIEW
Three key areas of our strategy…
Our value driven strategy is built around three key deliverables:
1 Repositioning our assets into a value maximising portfolio
˗ Positioned in the first half of the cost curve
˗ At least 70% mechanised mining
˗ More highly skilled work force
˗ Safer operations
˗ Less complex organisation
2 Extracting the full value from our operations – ensuring we optimise each of our
assets to their potential
3
31
5.4
4.2
3.53.0 3.0
2.7
(0.5)
(0.3)
20
14
20
15
20
16
Ru
ste
nb
urg
(10 m
on
ths)
2016
pro
-fo
rma
Ru
ste
nb
urg
exit
Un
ion
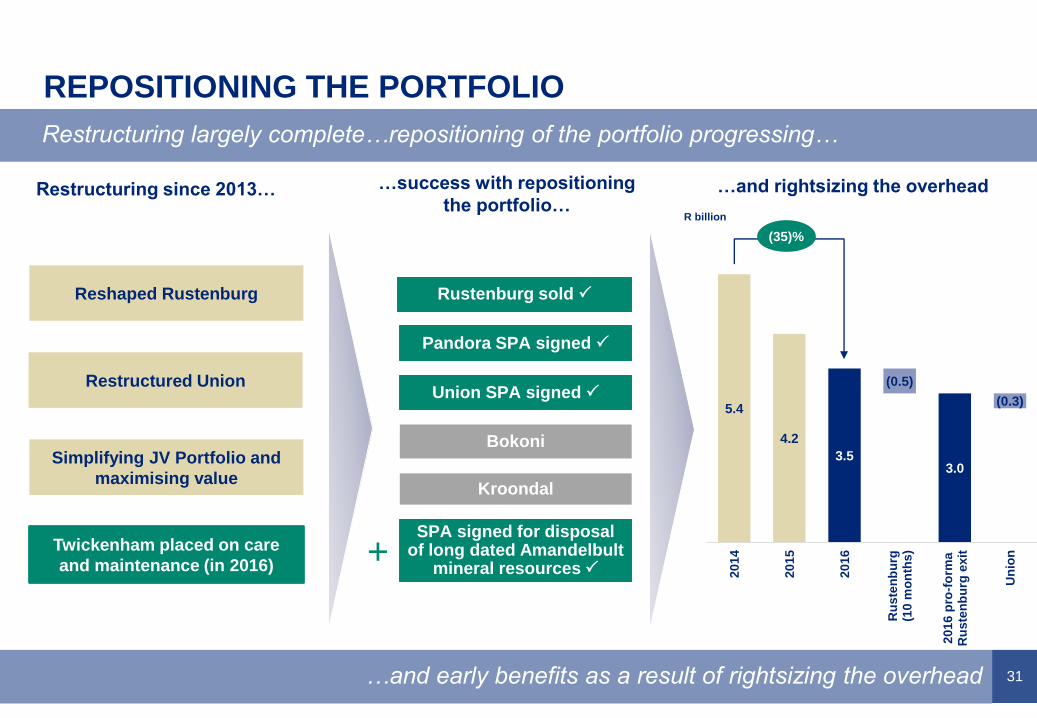
REPOSITIONING THE PORTFOLIO
Restructuring largely complete…repositioning of the portfolio progressing…
…and early benefits as a result of rightsizing the overhead
Rustenburg sold
Pandora SPA signed
Union SPA signed
Bokoni
Kroondal
Restructuring since 2013… …success with repositioning
the portfolio…
Reshaped Rustenburg
Restructured Union
Simplifying JV Portfolio and
maximising value
…and rightsizing the overhead
Twickenham placed on care
and maintenance (in 2016)
SPA signed for disposal of long dated Amandelbult
mineral resources
R billion
(35)%
+
32
SALE OF UNION MINE & MASA CHROME
Another strategic success in the repositioning strategy…with R400m upfront consideration…
…further upside consideration potential and life of mine POC and tolling contract
Strategic Rationale
• As announced in 2013, the Union mine is a non-core operation
• Significant effort was made to make the mine profitable including:
- Closing unprofitable production areas by consolidating two mines into one and closing declines
- Undertaking restructuring to reduce the labour force by ~1,000 employees
• Created a sustainable operation, with improved cost position and cash generation
• However, the retained portfolio has better capital investment options so the mine remains non-core
Terms of the Transaction
• A subsidiary of Siyanda will purchase the mine from AAP for R400 million cash upfront consideration
• In addition, AAP will participate in 35% of positive cumulative distributable free cash flow for 10 years
• Purchase of concentrate agreement for 7 years and thereafter tolling arrangement for 4E metals for the life of mine
• Conditions precedent include Competition Commission approval and Section 11 approval from the DMR
OUTLOOKCHRIS GRIFFITH, CHIEF EXECUTIVE OFFICER
30 kW off-grid electricity supply system by Hydrogenious Technologies
34
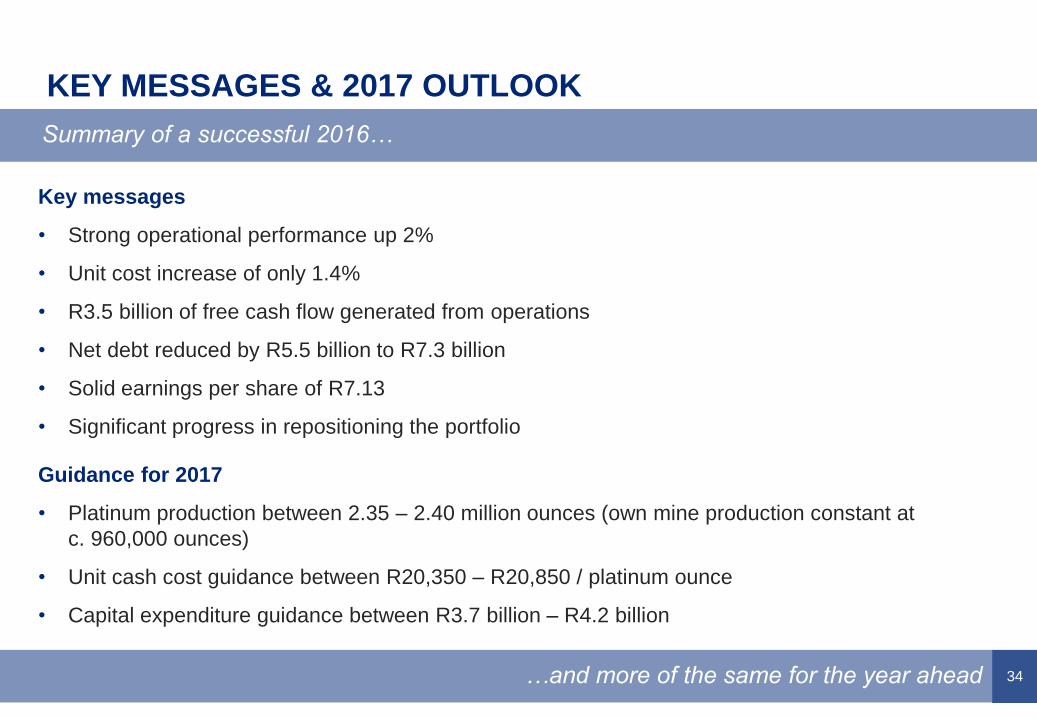
KEY MESSAGES & 2017 OUTLOOK
Summary of a successful 2016…
…and more of the same for the year ahead
Guidance for 2017
• Platinum production between 2.35 – 2.40 million ounces (own mine production constant at
c. 960,000 ounces)
• Unit cash cost guidance between R20,350 – R20,850 / platinum ounce
• Capital expenditure guidance between R3.7 billion – R4.2 billion
Key messages
• Strong operational performance up 2%
• Unit cost increase of only 1.4%
• R3.5 billion of free cash flow generated from operations
• Net debt reduced by R5.5 billion to R7.3 billion
• Solid earnings per share of R7.13
• Significant progress in repositioning the portfolio
Q&A
APPENDICES
37
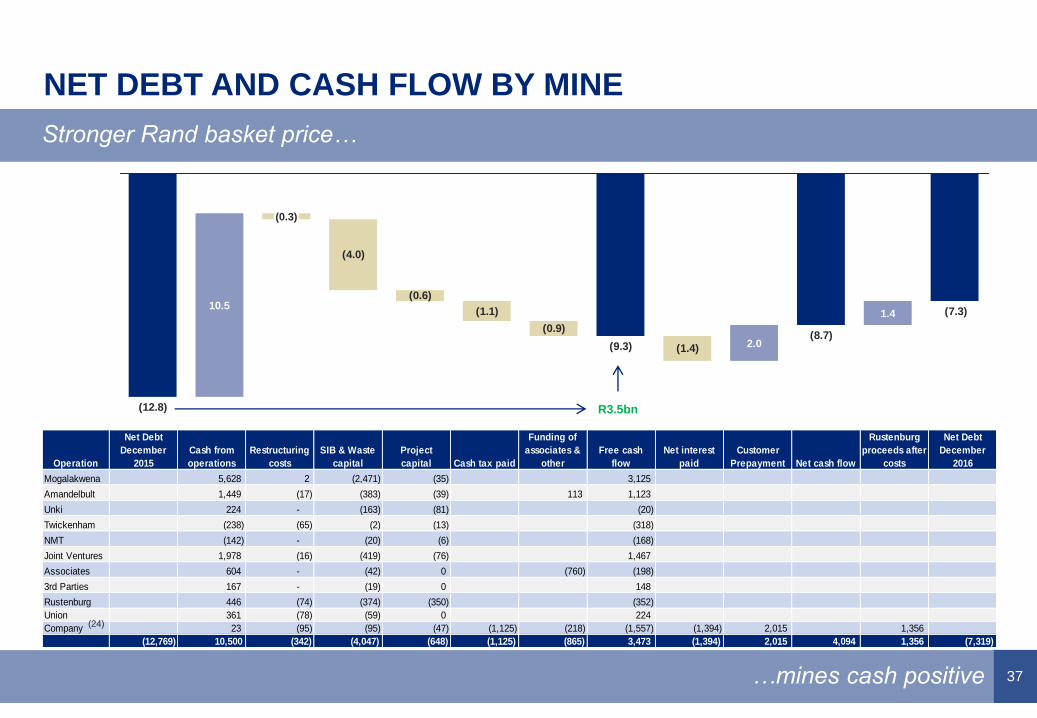
Operation
Net Debt
December
2015
Cash from
operations
Restructuring
costs
SIB & Waste
capital
Project
capital Cash tax paid
Funding of
associates &
other
Free cash
flow
Net interest
paid
Customer
Prepayment Net cash flow
Rustenburg
proceeds after
costs
Net Debt
December
2016
Mogalakwena 5,628 2 (2,471) (35) 3,125
Amandelbult 1,449 (17) (383) (39) 113 1,123
Unki 224 - (163) (81) (20)
Twickenham (238) (65) (2) (13) (318)
NMT (142) - (20) (6) (168)
Joint Ventures 1,978 (16) (419) (76) 1,467
Associates 604 - (42) 0 (760) (198)
3rd Parties 167 - (19) 0 148
Rustenburg 446 (74) (374) (350) (352)
Union 361 (78) (59) 0 224
Company 23 (95) (95) (47) (1,125) (218) (1,557) (1,394) 2,015 1,356
(12,769) 10,500 (342) (4,047) (648) (1,125) (865) 3,473 (1,394) 2,015 4,094 1,356 (7,319)
Stronger Rand basket price…
…mines cash positive
NET DEBT AND CASH FLOW BY MINE
(4.0)
(0.6)
(1.1)
(0.9)
(1.4)
(7.3)
(8.7)(9.3)
(12.8)
10.51.4
(0.3)
2.0
R3.5bn
(24)
38
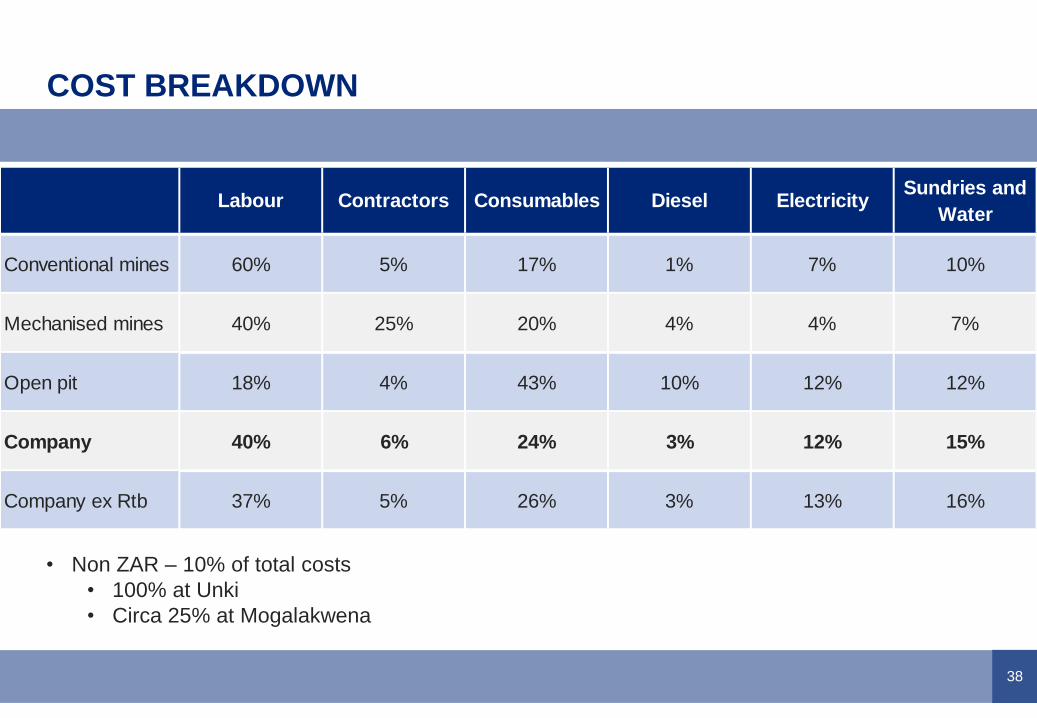
• Non ZAR – 10% of total costs
• 100% at Unki
• Circa 25% at Mogalakwena
COST BREAKDOWN
Conventional mines 60% 5% 17% 1% 7% 10%
Mechanised mines 40% 25% 20% 4% 4% 7%
Open pit 18% 4% 43% 10% 12% 12%
Company 40% 6% 24% 3% 12% 15%
Company ex Rtb 37% 5% 26% 3% 13% 16%
Sundries and
WaterLabour Consumables Diesel ElectricityContractors
39
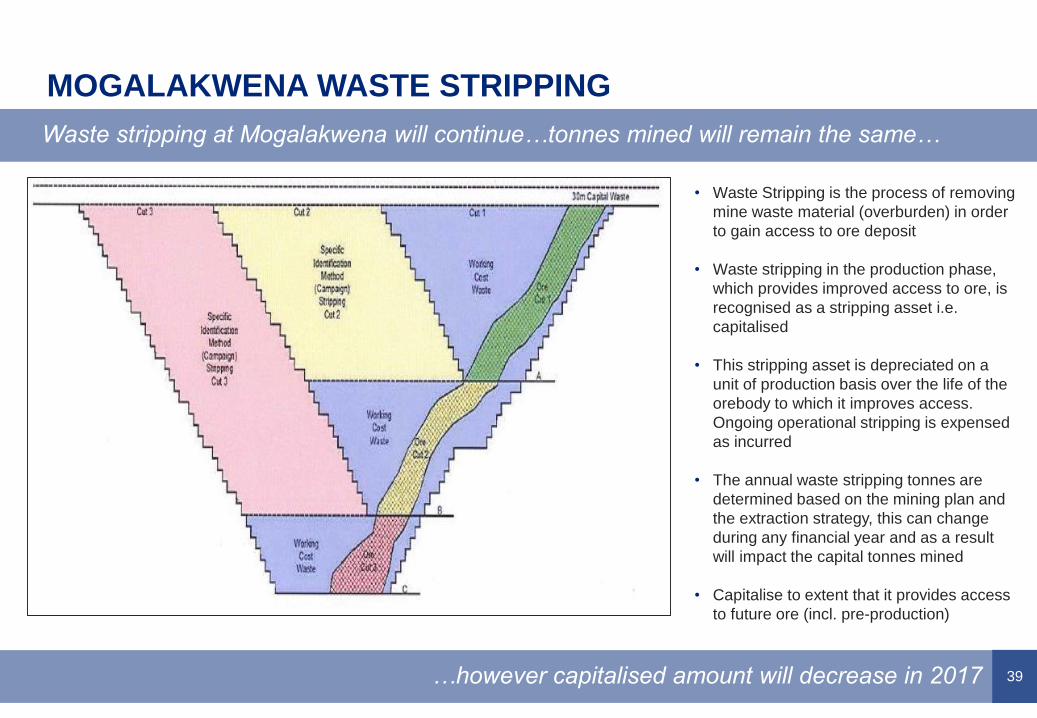
MOGALAKWENA WASTE STRIPPING
Waste stripping at Mogalakwena will continue…tonnes mined will remain the same…
…however capitalised amount will decrease in 2017
• Waste Stripping is the process of removing
mine waste material (overburden) in order
to gain access to ore deposit
• Waste stripping in the production phase,
which provides improved access to ore, is
recognised as a stripping asset i.e.
capitalised
• This stripping asset is depreciated on a
unit of production basis over the life of the
orebody to which it improves access.
Ongoing operational stripping is expensed
as incurred
• The annual waste stripping tonnes are
determined based on the mining plan and
the extraction strategy, this can change
during any financial year and as a result
will impact the capital tonnes mined
• Capitalise to extent that it provides access
to future ore (incl. pre-production)
40
0
2
4
6
8
10
2015 2016 2017 2018 2019 2020 2021 2022 2023
Electric Hybrids
0
20
40
60
80
100
120
2015 2016 2017 2018 2019 2020 2021 2022 2023
Diesel Gasoline Electric Hybrids
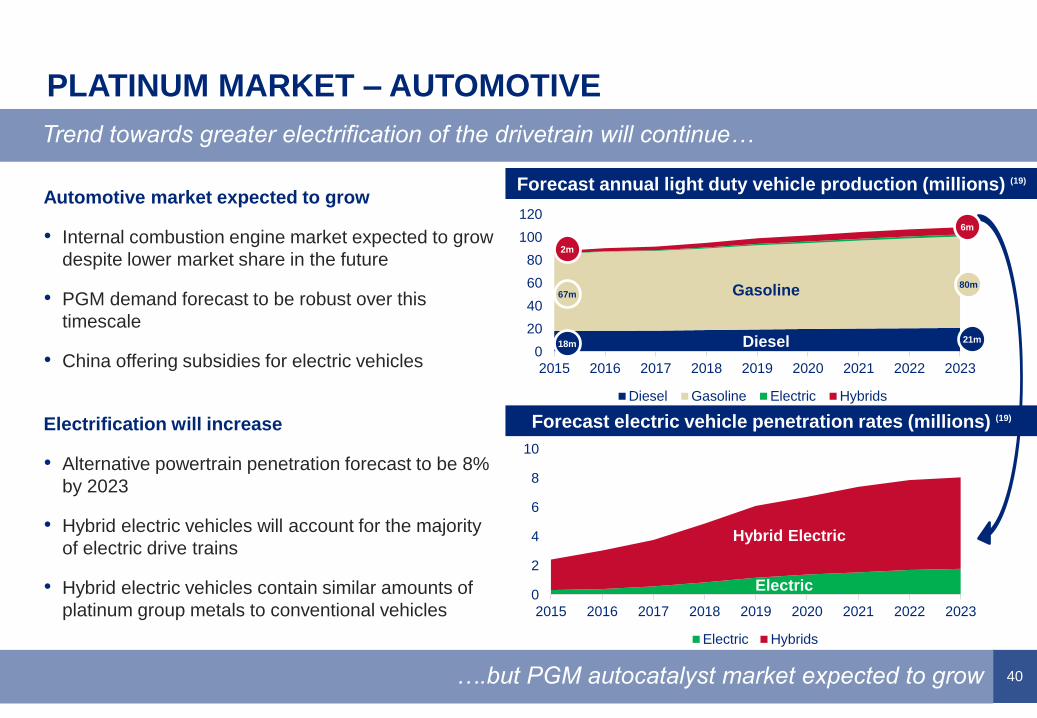
PLATINUM MARKET – AUTOMOTIVE
Trend towards greater electrification of the drivetrain will continue…
….but PGM autocatalyst market expected to grow
Forecast annual light duty vehicle production (millions) (19)
Forecast electric vehicle penetration rates (millions) (19)
Automotive market expected to grow
• Internal combustion engine market expected to grow
despite lower market share in the future
• PGM demand forecast to be robust over this
timescale
• China offering subsidies for electric vehicles
Electrification will increase
• Alternative powertrain penetration forecast to be 8%
by 2023
• Hybrid electric vehicles will account for the majority
of electric drive trains
• Hybrid electric vehicles contain similar amounts of
platinum group metals to conventional vehicles
2m
Gasoline
Diesel
Hybrid Electric
67m
18m
6m
80m
21m
Electric
41
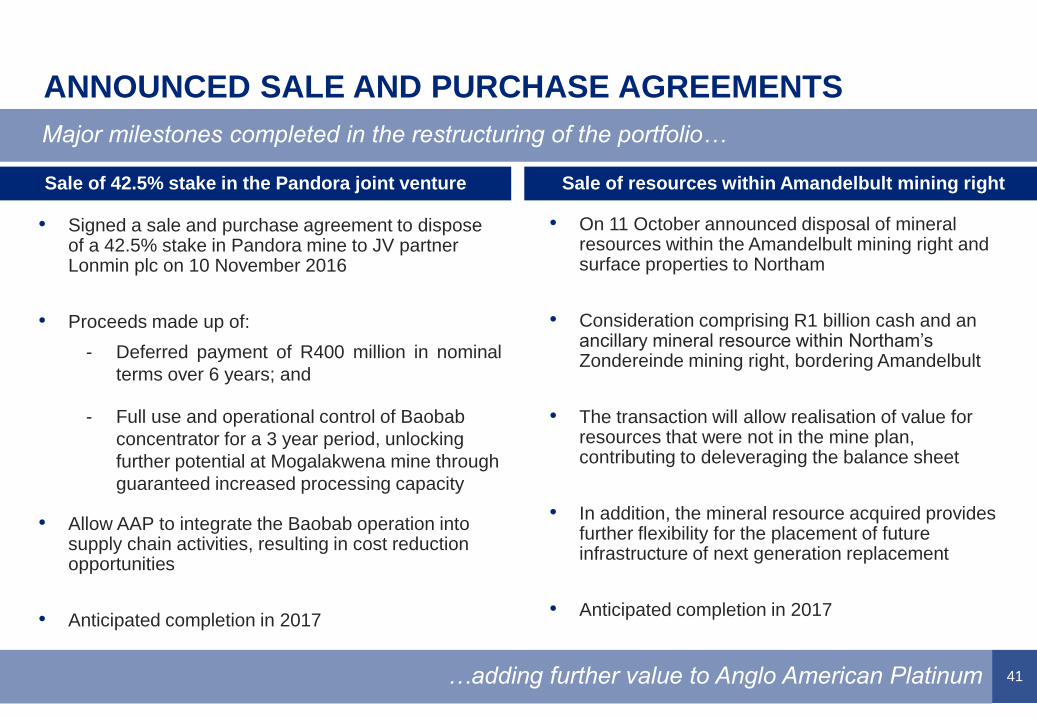
ANNOUNCED SALE AND PURCHASE AGREEMENTS
Major milestones completed in the restructuring of the portfolio…
…adding further value to Anglo American Platinum
• Signed a sale and purchase agreement to dispose of a 42.5% stake in Pandora mine to JV partner Lonmin plc on 10 November 2016
• Proceeds made up of:
- Deferred payment of R400 million in nominal
terms over 6 years; and
- Full use and operational control of Baobab
concentrator for a 3 year period, unlocking
further potential at Mogalakwena mine through
guaranteed increased processing capacity
• Allow AAP to integrate the Baobab operation into supply chain activities, resulting in cost reduction opportunities
• Anticipated completion in 2017
Sale of 42.5% stake in the Pandora joint venture Sale of resources within Amandelbult mining right
• On 11 October announced disposal of mineral resources within the Amandelbult mining right and surface properties to Northam
• Consideration comprising R1 billion cash and an ancillary mineral resource within Northam’s Zondereinde mining right, bordering Amandelbult
• The transaction will allow realisation of value for resources that were not in the mine plan, contributing to deleveraging the balance sheet
• In addition, the mineral resource acquired provides further flexibility for the placement of future infrastructure of next generation replacement
• Anticipated completion in 2017
42
(1) Unit cost on a produced metal in concentrate basis
(2) Lost time in jury frequency rate (LTIFR) based per 200,000 hours worked
(3) TRCFR is total recordable case frequency rate
(4) 2014 LTIFR normalised for the 5 month long strike
(5) Total platinum production is on a metal in concentrate basis
(6) Cash operating margin is defined as (revenue less cash operating costs) / revenue
(7) Operating free cash flow is defined as free cash flow for operating mines after full overhead allocation, SIB capex, capitalised waste stripping
and minorities. It is presented before project capex and one-off restructuring costs
(8) Impairment and IFRS2 includes impairments for Bokoni and IFRS2 charge for Amandelbult Chrome Plant
(9) EBIT is Earnings before interest and tax including pre-tax profits and losses from associates normalised for impairments
(10) Project and SIB capital expenditure excludes Capitalised waste stripping and Interest capitalised. 2016 capital excludes Rustenburg for
November and December 2016
(11) Price variance calculated as increase/(decrease) in Dollar price multiplied by current period sales volume
(12) Inflation variance calculated using CPI on prior period cash operating costs that have been impacted directly by inflation
(13) Sales volume variance calculated as increase/(decrease) in sales volume multiplied by prior period cash margin
(14) Costs include cash operating costs, inventory movements and depreciation
(15) AAP Mining inflation is CPI and inflation above CPI as experienced by AAP based on its basket of costs
(16) Capital expenditure excludes capitalised waste stripping and Interest capitalised
(17) Rustenburg disposal proceeds offset by transaction costs
(18) Johnson Matthey data as of PGM Market Report November 2016
(19) Source: LMC Automotive
(20) Headline demand as measured by Johnson Matthey. Consumer demand based on Company estimates
(21) Source: Johnson Matthey, World Gold Council, Platinum Guild International
(22) ETF publically available data
(23) Johnson Matthey data as of PGM Market Report November 2016 & November 2015
(24) Company costs includes mainly marketing expenses, Corporate SIB expenditure and Twickenham new mining technology
FOOTNOTES