Embed Size (px)
Citation preview
2016 FINANCIAL REPORT SEPARATE FINANCIAL STATEMENTS
CONTENTS
2016 FINANCIAL REPORT
3 SEPARATE FINANCIAL STATEMENTS
4 Income Statement and Other Components of the Comprehensive Income Statement 5 Balance Sheet 6 Cash Flow Statement 7 Statement of Changes in Shareholders’ Equity
9 NOTES TO THE SEPARATE FINANCIAL STATEMENTS
10 Accounting Principles and Valuation Criteria 19 Notes to the Income Statement 28 Notes to the Balance Sheet 45 Net Financial Debt 46 Commitments, Risks and Contingent Assets 55 Tax status of Share Capital and Reserves in the Event of Repayment or Distribution 57 Financial Risk Management 67 Intercompany and Related-party Transactions 70 Other Information 71 Significant Events Occurring after December 31, 2016 72 List of Equity Investments 78 Certification Pursuant to Article 81-ter of CONSOB Regulation No. 11971 79 Report of the Independent Auditors
This document has been translated into English for the convenience of readers outside of Italy. The original Italian document should be considered the authoritative version.
2016FINANCIAL REPORT SEPARATE FINANCIAL STATEMENTS

2 I 2016 FINANCIAL REPORT

2016 FINANCIAL REPORT I 3
SEPARATE FINANCIAL STATEMENTS AT DECEMBER 31, 2016
4 I 2016 FINANCIAL REPORT
INCOME STATEMENT OF EDISON SPA
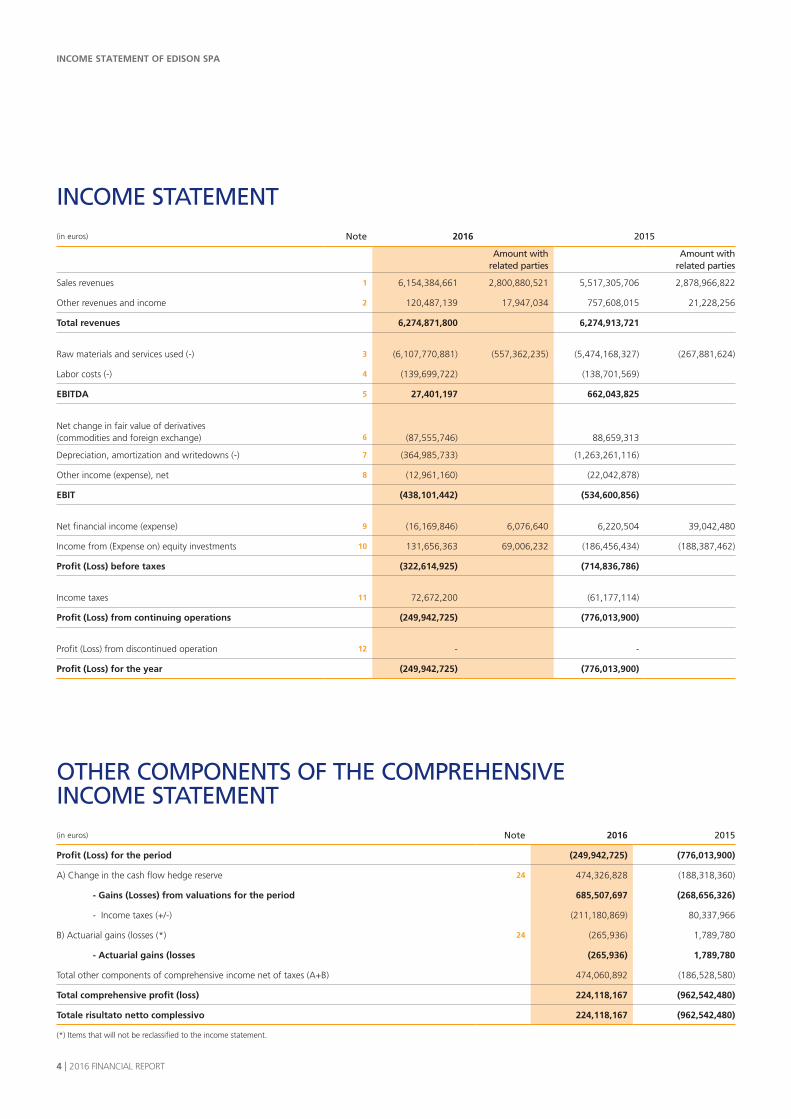
INCOME STATEMENT(in euros) Note 2016 2015
Amount with
related partiesAmount with
related parties
Sales revenues 1 6,154,384,661 2,800,880,521 5,517,305,706 2,878,966,822
Other revenues and income 2 120,487,139 17,947,034 757,608,015 21,228,256
Total revenues 6,274,871,800 6,274,913,721
Raw materials and services used (-) 3 (6,107,770,881) (557,362,235) (5,474,168,327) (267,881,624)
Labor costs (-) 4 (139,699,722) (138,701,569)
EBITDA 5 27,401,197 662,043,825
Net change in fair value of derivatives (commodities and foreign exchange) 6 (87,555,746) 88,659,313
Depreciation, amortization and writedowns (-) 7 (364,985,733) (1,263,261,116)
Other income (expense), net 8 (12,961,160) (22,042,878)
EBIT (438,101,442) (534,600,856)
Net financial income (expense) 9 (16,169,846) 6,076,640 6,220,504 39,042,480
Income from (Expense on) equity investments 10 131,656,363 69,006,232 (186,456,434) (188,387,462)
Profit (Loss) before taxes (322,614,925) (714,836,786)
Income taxes 11 72,672,200 (61,177,114)
Profit (Loss) from continuing operations (249,942,725) (776,013,900)
Profit (Loss) from discontinued operation 12 - -
Profit (Loss) for the year (249,942,725) (776,013,900)
OTHER COMPONENTS OF THE COMPREHENSIVE INCOME STATEMENT(in euros) Note 2016 2015
Profit (Loss) for the period (249,942,725) (776,013,900)
A) Change in the cash flow hedge reserve 24 474,326,828 (188,318,360)
- Gains (Losses) from valuations for the period 685,507,697 (268,656,326)
- Income taxes (+/-) (211,180,869) 80,337,966
B) Actuarial gains (losses (*) 24 (265,936) 1,789,780
- Actuarial gains (losses (265,936) 1,789,780
Total other components of comprehensive income net of taxes (A+B) 474,060,892 (186,528,580)
Total comprehensive profit (loss) 224,118,167 (962,542,480)
Totale risultato netto complessivo 224,118,167 (962,542,480)
(*) Items that will not be reclassified to the income statement.
2016 FINANCIAL REPORT I 5
BALANCE SHEET OF EDISON SPA
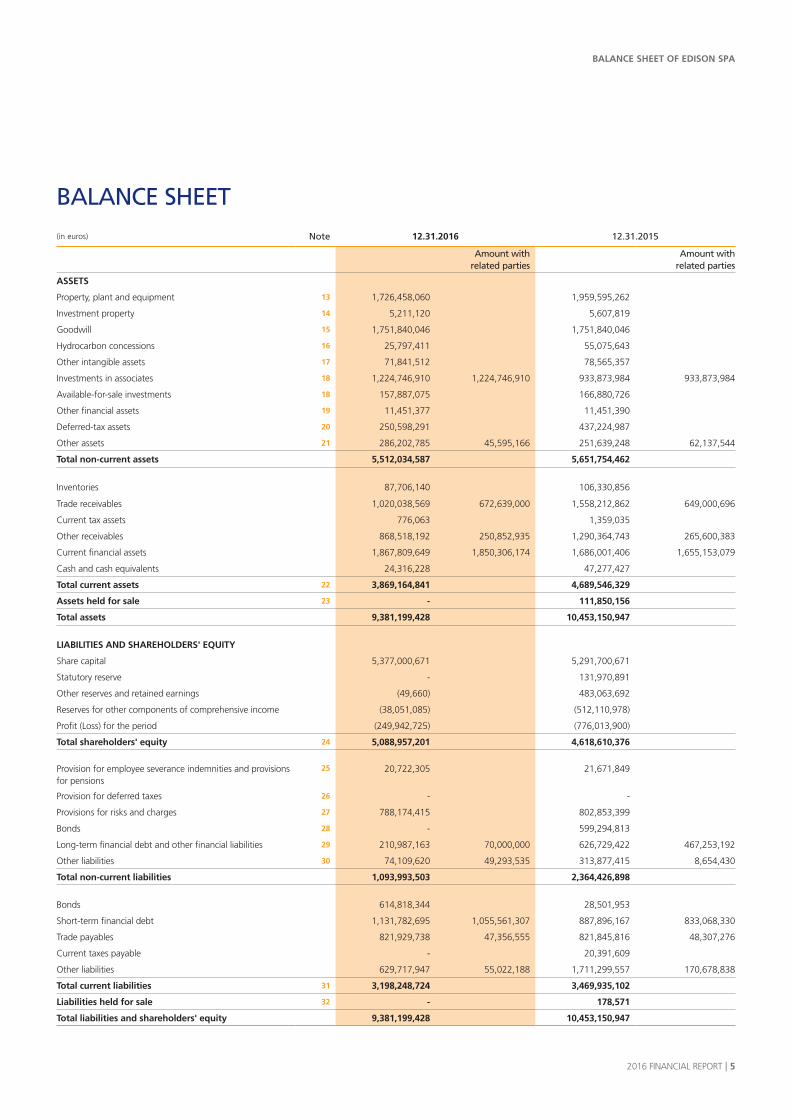
BALANCE SHEET(in euros) Note 12.31.2016 12.31.2015
Amount with related parties
Amount with related parties
ASSETS
Property, plant and equipment 13 1,726,458,060 1,959,595,262
Investment property 14 5,211,120 5,607,819
Goodwill 15 1,751,840,046 1,751,840,046
Hydrocarbon concessions 16 25,797,411 55,075,643
Other intangible assets 17 71,841,512 78,565,357
Investments in associates 18 1,224,746,910 1,224,746,910 933,873,984 933,873,984
Available-for-sale investments 18 157,887,075 166,880,726
Other financial assets 19 11,451,377 11,451,390
Deferred-tax assets 20 250,598,291 437,224,987
Other assets 21 286,202,785 45,595,166 251,639,248 62,137,544
Total non-current assets 5,512,034,587 5,651,754,462
Inventories 87,706,140 106,330,856
Trade receivables 1,020,038,569 672,639,000 1,558,212,862 649,000,696
Current tax assets 776,063 1,359,035
Other receivables 868,518,192 250,852,935 1,290,364,743 265,600,383
Current financial assets 1,867,809,649 1,850,306,174 1,686,001,406 1,655,153,079
Cash and cash equivalents 24,316,228 47,277,427
Total current assets 22 3,869,164,841 4,689,546,329
Assets held for sale 23 - 111,850,156
Total assets 9,381,199,428 10,453,150,947
LIABILITIES AND SHAREHOLDERS' EQUITY
Share capital 5,377,000,671 5,291,700,671
Statutory reserve - 131,970,891
Other reserves and retained earnings (49,660) 483,063,692
Reserves for other components of comprehensive income (38,051,085) (512,110,978)
Profit (Loss) for the period (249,942,725) (776,013,900)
Total shareholders' equity 24 5,088,957,201 4,618,610,376
Provision for employee severance indemnities and provisions for pensions
25 20,722,305 21,671,849
Provision for deferred taxes 26 - -
Provisions for risks and charges 27 788,174,415 802,853,399
Bonds 28 - 599,294,813
Long-term financial debt and other financial liabilities 29 210,987,163 70,000,000 626,729,422 467,253,192
Other liabilities 30 74,109,620 49,293,535 313,877,415 8,654,430
Total non-current liabilities 1,093,993,503 2,364,426,898
Bonds 614,818,344 28,501,953
Short-term financial debt 1,131,782,695 1,055,561,307 887,896,167 833,068,330
Trade payables 821,929,738 47,356,555 821,845,816 48,307,276
Current taxes payable - 20,391,609
Other liabilities 629,717,947 55,022,188 1,711,299,557 170,678,838
Total current liabilities 31 3,198,248,724 3,469,935,102
Liabilities held for sale 32 - 178,571
Total liabilities and shareholders' equity 9,381,199,428 10,453,150,947
6 I 2016 FINANCIAL REPORT
CASH FLOWS STATEMENT OF EDISON SPA
CASH FLOWS STATEMENT
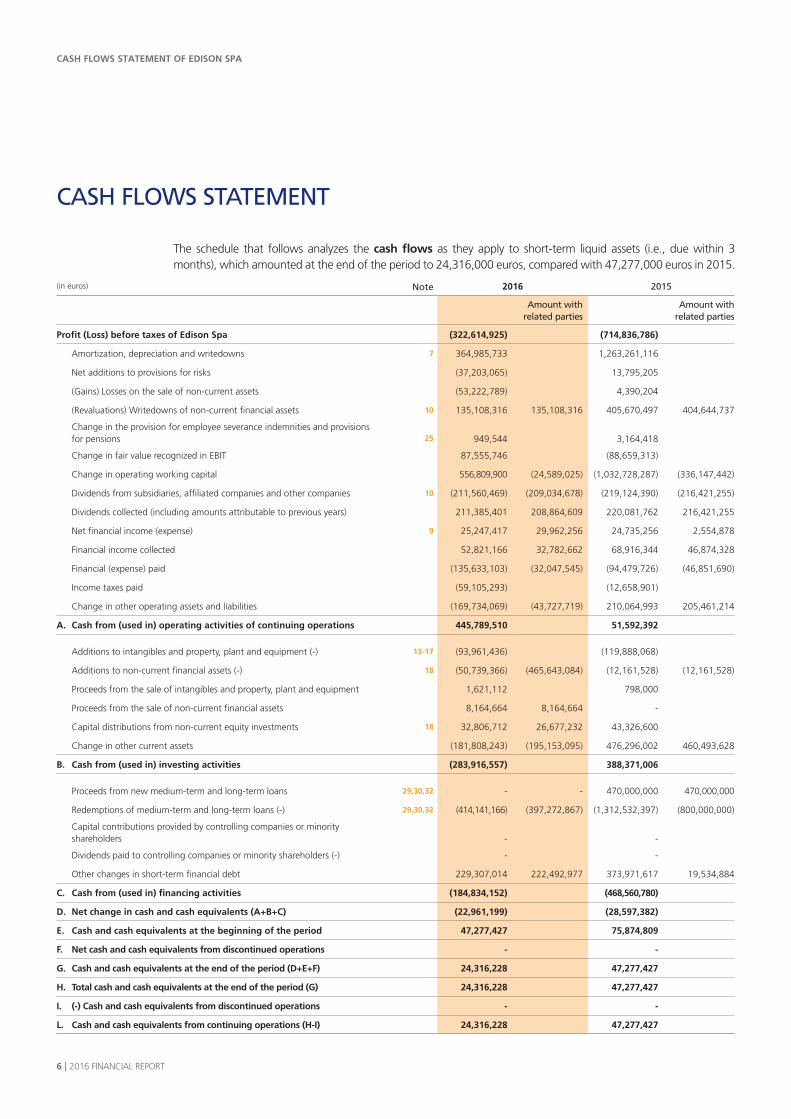
The schedule that follows analyzes the cash flows as they apply to short-term liquid assets (i.e., due within 3 months), which amounted at the end of the period to 24,316,000 euros, compared with 47,277,000 euros in 2015.
(in euros) Note 2016 2015
Amount with related parties
Amount with related parties
Profit (Loss) before taxes of Edison Spa (322,614,925) (714,836,786)
Amortization, depreciation and writedowns 7 364,985,733 1,263,261,116
Net additions to provisions for risks (37,203,065) 13,795,205
(Gains) Losses on the sale of non-current assets (53,222,789) 4,390,204
(Revaluations) Writedowns of non-current financial assets 10 135,108,316 135,108,316 405,670,497 404,644,737
Change in the provision for employee severance indemnities and provisions for pensions 25 949,544 3,164,418
Change in fair value recognized in EBIT 87,555,746 (88,659,313)
Change in operating working capital 556,809,900 (24,589,025) (1,032,728,287) (336,147,442)
Dividends from subsidiaries, affiliated companies and other companies 10 (211,560,469) (209,034,678) (219,124,390) (216,421,255)
Dividends collected (including amounts attributable to previous years) 211,385,401 208,864,609 220,081,762 216,421,255
Net financial income (expense) 9 25,247,417 29,962,256 24,735,256 2,554,878
Financial income collected 52,821,166 32,782,662 68,916,344 46,874,328
Financial (expense) paid (135,633,103) (32,047,545) (94,479,726) (46,851,690)
Income taxes paid (59,105,293) (12,658,901)
Change in other operating assets and liabilities (169,734,069) (43,727,719) 210,064,993 205,461,214
A. Cash from (used in) operating activities of continuing operations 445,789,510 51,592,392
Additions to intangibles and property, plant and equipment (-) 13-17 (93,961,436) (119,888,068)
Additions to non-current financial assets (-) 18 (50,739,366) (465,643,084) (12,161,528) (12,161,528)
Proceeds from the sale of intangibles and property, plant and equipment 1,621,112 798,000
Proceeds from the sale of non-current financial assets 8,164,664 8,164,664 -
Capital distributions from non-current equity investments 18 32,806,712 26,677,232 43,326,600
Change in other current assets (181,808,243) (195,153,095) 476,296,002 460,493,628
B. Cash from (used in) investing activities (283,916,557) 388,371,006
Proceeds from new medium-term and long-term loans 29,30,32 - - 470,000,000 470,000,000
Redemptions of medium-term and long-term loans (-) 29,30,32 (414,141,166) (397,272,867) (1,312,532,397) (800,000,000)
Capital contributions provided by controlling companies or minority shareholders - -
Dividends paid to controlling companies or minority shareholders (-) - -
Other changes in short-term financial debt 229,307,014 222,492,977 373,971,617 19,534,884
C. Cash from (used in) financing activities (184,834,152) (468,560,780)
D. Net change in cash and cash equivalents (A+B+C) (22,961,199) (28,597,382)
E. Cash and cash equivalents at the beginning of the period 47,277,427 75,874,809
F. Net cash and cash equivalents from discontinued operations - -
G. Cash and cash equivalents at the end of the period (D+E+F) 24,316,228 47,277,427
H. Total cash and cash equivalents at the end of the period (G) 24,316,228 47,277,427
I. (-) Cash and cash equivalents from discontinued operations - -
L. Cash and cash equivalents from continuing operations (H-I) 24,316,228 47,277,427

2016 FINANCIAL REPORT I 7
SHAREHOLDERS’ EQUITY OF EDISON SPA
STATEMENT OF CHANGES IN SHAREHOLDERS’ EQUITY
(in euros) Reserve for other components
Sharecapital
Statutoryreserve
Other reserves
and retainedearnings
CashFlow
Hedge
Actuarialgains
(losses)
Profit (Loss)
Total shareholders’
equity
Balance at December 31, 2014 5,291,700,671 131,970,891 520,533,367 (323,109,075) (2,473,322) (37,469,676) 5,581,152,856
Appropriation of the 2014 result - - (37,469,676) - - 37,469,676 -
Total comprehensive profit (loss) for 2014 - - - (188,318,360) 1,789,780 (776,013,900) (962,542,480)
including:
Change in comprehensive income for the period - - - (188,318,360) 1,789,780 - (186,528,580)
Profit (Loss) for 2015 - - - - - (776,013,900) (776,013,900)
Balance at December 31, 2015 5,291,700,671 131,970,891 483,063,691 (511,427,435) (683,542) (776,013,900) 4,618,610,376
Appropriation of the 2015 result - (131,970,891) (644,726,551) - 683,542 776,013,900 -
Share capital increase 85,300,000 - 161,694,680 - - - 246,994,680
Merger by absorption - - (81,480) - - - (81,480)
Total comprehensive profit (loss) for 2016 - - - 474,325,828 (949,478) (249,942,725) 223,433,625
including:
Change in comprehensive income for the period - - - 474,325,828 (949,478) - 473,376,350
Profit (Loss) for 2016 - - - - - (249,942,725) (249,942,725)
Balance at December 31, 2016 5,377,000,671 - (49,660) (37,101,607) (949,478) (249,942,725) 5,088,957,201

8 I 2016 FINANCIAL REPORT
2016 FINANCIAL REPORT I 9
NOTES TO THE SEPARATE FINANCIAL STATEMENTS AT DECEMBER 31, 2016
NOTES TO THE SEPARATE FINANCIAL STATEMENTS
10 I 2016 FINANCIAL REPORT
ACCOUNTING PRINCIPLES AND VALUATION CRITERIA
CONTENT AND PRESENTATION
Dear Shareholders:We submit for your approval the separate financial statements of Edison Spa at December 31, 2016, which consist of an Income Statement, a Statement of Other Components of Comprehensive Income, a Balance Sheet, a Cash Flow Statement, a Statement of Changes in Shareholders’ Equity and the accompanying notes.These financial statements were prepared in accordance with the International Financial Reporting Standards (IFRS) issued by the International Financial Accounting Standards Board (IASB), as published in the Official Journal of the European Union (O.J.E.U.).
Methods Applied to the Preparation of the Financial Statements The accounting principles applied are consistent with those used for the 2015 Separate Financial Statements.It is worth of mentioning that Edison, from January 1, 2016, applied a different accounting option choice regarding some derivative contracts of commodities and foreign exchanges, to which was applied the Fair Value Hedge relationship, this taking into account the indexing formulas and the inherent risk factors. To this purpose some Cash Flow Hedge relationship were revoked and the related fair value, recognized at the date when the hedging relationship was revoked, was retained in the “Reserve for other components of comprehensive cash flow hedge result” and will be recognized in profit or loss concurrently with the economic effects produced by the hedged item.Two new accounting principles applicable on or before January 1, 2018 were published in 2016:• IFRS 15 “Revenues from contracts with customers”: the purpose of IFRS 15 is improve revenues recognition
methods by introducing a new accounting model that calls for: (i) identifying a contract with a customer; ii) identifying the obligations entailed by the contract; (iii) determining the transaction price; (iv) allocating the transaction price to the individual contractual obligations; (v) recognizing the revenues when each individual contractual obligation is satisfied. The adoption of this principle could modify, not significantly, the revenue amount; its potential impact is currently being determined.
• IFRS 9 “Financial instruments,” for which first-time adoption modalities are still being defined. The new IFRS 9 standard calls for a single model to classify and measure financial instruments. Within the model, financial assets are classified into three categories (amortized cost, fair value in Other comprehensive Income and fair value in the income statement) depending on the entity’s business model (because of this dependency link, reclassifications between categories are forbidden, except when the business model itself is changed). It is introduced a new model to determine receivables and payables write-downs linked to the so-called “Perdite attese” and the default risk is valued ex-ante. With regard to equity investments, the exemption from the requirement to apply fair value to measure investments that are not publicly traded has been eliminated. Hedge accounting rules have also been changed.
The Board of Directors, meeting on February 13, 2017, authorized the publication of these separate financial statements, which were audited by Deloitte & Touche Spa in accordance with an assignment awarded by the Shareholders’ Meeting of April 26, 2011, pursuant to Legislative Decree No. 39 of January 27, 2010, for a period of nine years (2011-2019).
Unless otherwise stated, the amounts that appear in the Notes to the Separate Financial Statements are in thousands of euros.

NOTES TO THE SEPARATE FINANCIAL STATEMENTS
2016 FINANCIAL REPORT I 11
Presentation Formats of the Financial Statements Adopted by the CompanyThe presentation formats chosen by the Company for its financial statements have the following characteristics:• The Income Statement is a step-by-step income statement, with the different components broken down by
nature. It includes a schedule of Other Components of the Comprehensive Income Statement, which shows the components of net profit or loss provisionally recognized in equity.
• In the Balance Sheet assets and liabilities are analyzed by maturity. Current and non-current items, which are due within or after 12 months from the end of the reporting period, respectively, are shown separately.
• The Cash Flow Statement shows the cash flows in accordance with the indirect method, as allowed by IAS 7.• The Statement of Changes in Shareholders’ Equity shows separately the flows from component of the
reserve for other components of comprehensive income.
Disclosure Pursuant to IFRS 3 Revised
Idreg PiemonteOn May 25, 2016, Edison Spa acquired nine hydroelectric power plants, including seven in the Piedmont region and two in the Friuli Venezia Giulia region, for an installed capacity of 15 MW and average annual output of 70 GWh.This acquisition, which originates from certain business operation part of the bankruptcy of IDREG Piemonte Spa, for a total consideration of 34 million euros plus 2 million euros in registration fees, will enable Edison to realize synergies with its facilities in Piedmont and Friuli in terms of plant management and maintenance.Please note that any prior-period liabilities related to the bankruptcy are being borne by the bankrupt entity.
Disclosure Pursuant to IFRS 5
Disposal Group - “Restructuring of Hydroelectric Operations” On May 31,2016, with effective date on June 1, 2016, the process that began with the signing, on December 29, 2015, of an agreement between Edison and SEL - Società Elettrica Altoatesina (now Alperia) for the swap between Edison and Alperia of Edison’s equity stakes in Hydros and Sel Edison in the province of Bolzano with Alperia’a equity stake in Cellina Energy, a company that owns the Cellina hydroelectric hub in the Friuli Venezia Giulia region, came to a conclusion on May 31, 2016. With this agreement, Edison strengthened its position in the hydroelectric area, a key sector for the Company’s growth strategy, and lengthened the average life of its hydroelectric portfolio, thereby reducing the risks related to concession renewals. This transaction had a negative net effect of about 3 million euros on net financial debt and generated a gain of about 56 million euros from the divestment of equity investments. It is worth to mention that the company has retained 25 million euros as warranty.
Merger of ShenWith the merger of Shen Spa company, owned 100%, with effective date on March 1, 2016, was incorporated an hydroelectric power station on the banks of the river Adda in the municipality of Maleo (LO). This transaction did not have any major effects on society. The transaction, under common control, was accounted in continuity of value.
Capital increaseOn March 22, 2016, the Shareholders’ Meeting of Edison Spa approved a paid share capital increase reserved exclusively for the controlling company Transalpina di Energia Spa, of 246,994,680 euros, through the issuance of 85,300,000 common shares and 161,695,000 euros as additional paid-in capital. The capital increase was subscribed by the transfer in Edison, by the controlling Transalpina di Energia Spa, with effective date April 1, 2016, of the 100% Fenice Qualità per l’Ambiente Spa share capital, company of the EDF group specialized in energy and environmental services, which operates in Italy, Russia and, through two subsidiaries, in Poland and Spain. The contribution value of Fenice was determined according to an independent appraisal; moreover, as Transalpina di Energia Spa is the parent company of Edison, the Fenice transfer appears as a related party transaction of minor relevance, therefore and was required and obtained the favorable opinion of the Independent Committee, expressed on the basis of a fairness opinion by an independent consultant.
NOTES TO THE SEPARATE FINANCIAL STATEMENTS
12 I 2016 FINANCIAL REPORT
Valuation Criteria
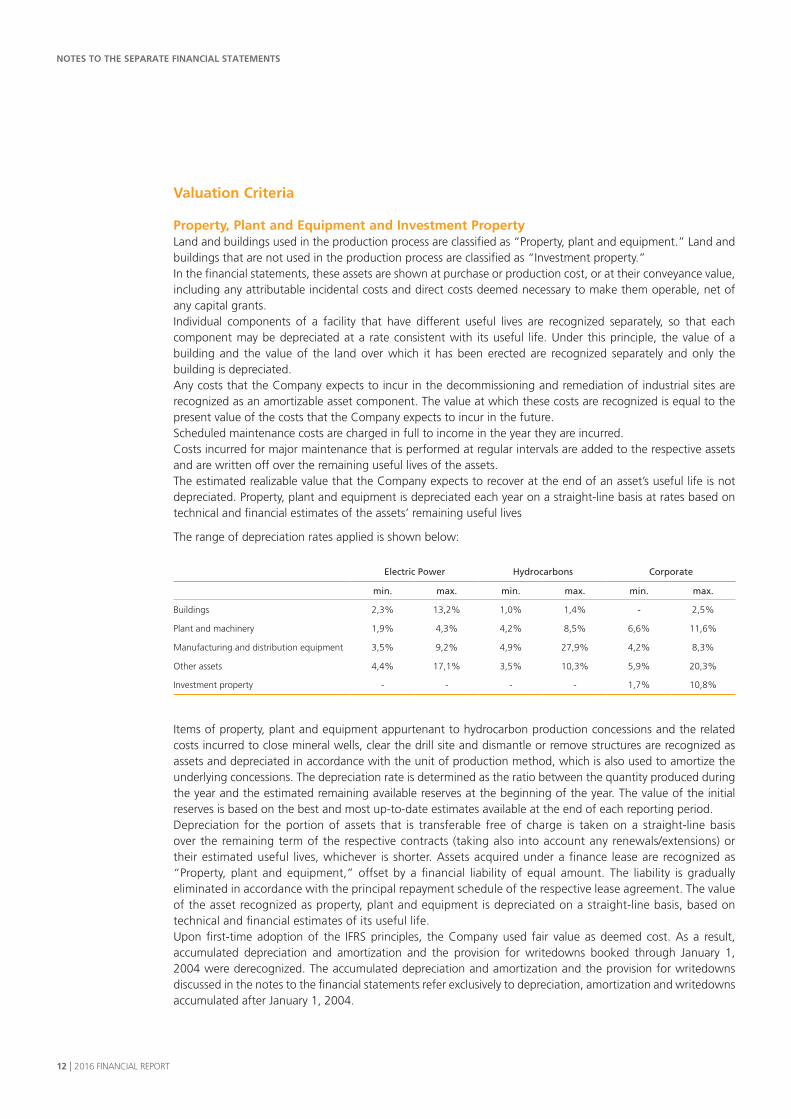
Property, Plant and Equipment and Investment Property Land and buildings used in the production process are classified as “Property, plant and equipment.” Land and buildings that are not used in the production process are classified as “Investment property.” In the financial statements, these assets are shown at purchase or production cost, or at their conveyance value, including any attributable incidental costs and direct costs deemed necessary to make them operable, net of any capital grants.Individual components of a facility that have different useful lives are recognized separately, so that each component may be depreciated at a rate consistent with its useful life. Under this principle, the value of a building and the value of the land over which it has been erected are recognized separately and only the building is depreciated. Any costs that the Company expects to incur in the decommissioning and remediation of industrial sites are recognized as an amortizable asset component. The value at which these costs are recognized is equal to the present value of the costs that the Company expects to incur in the future. Scheduled maintenance costs are charged in full to income in the year they are incurred.Costs incurred for major maintenance that is performed at regular intervals are added to the respective assets and are written off over the remaining useful lives of the assets.The estimated realizable value that the Company expects to recover at the end of an asset’s useful life is not depreciated. Property, plant and equipment is depreciated each year on a straight-line basis at rates based on technical and financial estimates of the assets’ remaining useful lives
The range of depreciation rates applied is shown below:
Electric Power Hydrocarbons Corporate
min. max. min. max. min. max.
Buildings 2,3% 13,2% 1,0% 1,4% - 2,5%
Plant and machinery 1,9% 4,3% 4,2% 8,5% 6,6% 11,6%
Manufacturing and distribution equipment 3,5% 9,2% 4,9% 27,9% 4,2% 8,3%
Other assets 4,4% 17,1% 3,5% 10,3% 5,9% 20,3%
Investment property - - - - 1,7% 10,8%
Items of property, plant and equipment appurtenant to hydrocarbon production concessions and the related costs incurred to close mineral wells, clear the drill site and dismantle or remove structures are recognized as assets and depreciated in accordance with the unit of production method, which is also used to amortize the underlying concessions. The depreciation rate is determined as the ratio between the quantity produced during the year and the estimated remaining available reserves at the beginning of the year. The value of the initial reserves is based on the best and most up-to-date estimates available at the end of each reporting period.Depreciation for the portion of assets that is transferable free of charge is taken on a straight-line basis over the remaining term of the respective contracts (taking also into account any renewals/extensions) or their estimated useful lives, whichever is shorter. Assets acquired under a finance lease are recognized as “Property, plant and equipment,” offset by a financial liability of equal amount. The liability is gradually eliminated in accordance with the principal repayment schedule of the respective lease agreement. The value of the asset recognized as property, plant and equipment is depreciated on a straight-line basis, based on technical and financial estimates of its useful life.Upon first-time adoption of the IFRS principles, the Company used fair value as deemed cost. As a result, accumulated depreciation and amortization and the provision for writedowns booked through January 1, 2004 were derecognized. The accumulated depreciation and amortization and the provision for writedowns discussed in the notes to the financial statements refer exclusively to depreciation, amortization and writedowns accumulated after January 1, 2004.
NOTES TO THE SEPARATE FINANCIAL STATEMENTS
2016 FINANCIAL REPORT I 13
If there are indications of a reduction in value, assets are tested for impairment in the manner described below in the section entitled “Impairment of Assets.” When the reasons for a writedown no longer apply, the asset’s cost can be reinstated.Beginning on January 1, 2009, borrowing costs directly attributable to the acquisition, construction or production of an asset with a significant useful life are capitalized, when the investment amount exceeds a predetermined threshold. Until December 31, 2008, financial expense was not capitalized.
Goodwill, Hydrocarbon Concessions and Other Intangible Assets Only identifiable assets that are controlled by the Company and are capable of producing future benefits qualify as intangible assets. Intangible assets include goodwill acquired for consideration. Intangible assets are recognized at their purchase price or internal production cost, including incidentals, in accordance with the same criteria used for “Property, plant and equipment.” Development costs can be capitalized, provided they can be identified reliably and it can be demonstrated that the asset is capable of producing future economic benefits.Please note that, upon transition to the IFRS (at January 1, 2004) goodwill was recognized at the same carrying amount as in the statutory financial statements at December 31, 2003. The decision to take the conservative approach of using the same carrying amounts as those used in the statutory financial statements previously prepared in accordance with Italian accounting principles was motivated by uncertainty with respect to the accounting treatment that should be applied to these assets in the separate financial statements prepared in accordance with the IFRS principles.Intangible assets with finite useful lives are amortized on a straight-line basis over their useful lives, starting when they are available for use.Goodwill and other intangible assets with indefinite useful lives are not amortized, but the recoverability of their carrying amounts is tested annually (impairment test) for each Cash Generating Unit (CGU) or group of CGUs to which assets with indefinite lives can be reasonably allocated. The impairment test is described below in the section entitled “Impairment of Assets.” Writedowns charged to goodwill cannot be reversed in subsequent periods.
Hydrocarbon Concessions, Exploration Activities and Measurement of Mineral ResourcesThe costs incurred to acquire mineral leases or extend the duration of existing concessions are recognized as intangible assets and amortized on a straight line basis over the length of the exploration license. If an exploration project is later abandoned, the residual cost is immediately recognized in profit or loss.Exploration costs and costs incurred in connection with geological surveys, exploratory testing, geological and geophysical mapping and exploratory drilling are classified as intangible assets but their full amount is amortized in the year they are incurred. Development costs related to successful mineral wells and production costs incurred to build facilities to extract and store hydrocarbons are classified as “Property, plant and equipment,” in accordance with the nature of the asset, and are depreciated by the unit of production (UOP) method.The costs incurred to shut down wells, abandon the drill site and dismantle or remove the equipment (decommissioning and industrial site remediation costs) are capitalized and amortized in accordance with the unit of production (UOP) method.Hydrocarbon production concessions are amortized in accordance with the unit of production method (UOP). The amortization rate is determined as the ratio between the quantity produced during the year and the estimated remaining available reserves at the beginning of the year. The value of the initial reserves is based on the best and most up-to-date estimates available at the end of each reporting period. In addition, a test is conducted each year to ensure that the carrying amounts of these assets are not greater than their realizable values computed by discounting future cash flows, which are estimated based on future production programs and market values.Please note that mineral assets owned and/or operated through contractual agreements (joint operations) are recognized in the financial statements only in relation to the attributable interest.
NOTES TO THE SEPARATE FINANCIAL STATEMENTS
14 I 2016 FINANCIAL REPORT
Environmental SecuritiesEdison Spa secures mainly a supply of emissions rights to meet its own requirements in the exercise of its industrial activities (so-called “own use”).Specifically, “Other intangible assets” can include emissions rights, which are recognized at the cost incurred to acquire them, provided the rights carried by the Company at the end of the reporting period represent a surplus over its requirements of such instruments, based on the emissions released during the year. Emissions rights allocated free of charge and used for compliance purposes are recognized at a zero carrying value. These assets are tested for impairment; their recoverable value is their value in use or their market value, whichever is greater. On the other hand, if, at the end of the reporting period, the value of the emissions actually generated is greater than the volume of allocated emissions and any purchased emissions, a special provision for risks and charges is recognized to account for the difference. Any emissions rights that are surrendered each year, based on the volume of polluting emissions released into the atmosphere each calendar year or the production generated, will be derecognized (compliance) using an special reserves for risks set aside the previous year.
Equity Investments in Subsidiaries, Joint Ventures and Affiliated CompaniesSubsidiaries are companies with respect to which Edison has the power to independently make strategic corporate decisions for the purpose of obtaining the resulting benefits. As a rule, control is presumed to exist when the controlling company holds, directly or indirectly, more than half of the votes that can be cast at an Ordinary Shareholders’ Meeting, counting the so-called “potential votes” (i.e., votes conveyed by convertible instruments).Other equity investments include joint ventures that do not qualify as joint operations and affiliated companies with respect to which Edison exercises a significant influence over the process of making strategic corporate decisions, even though it does not have control, when the so-called “potential votes” (i.e., voting rights conveyed by convertible instruments) are counted. A significant influence is presumed to exist when Edison holds, directly or indirectly, more than 20% of the votes that can be cast at an Ordinary Shareholders’ Meeting.Equity investments in subsidiaries, joint ventures and affiliated companies are valued at cost, permanently written down to reflect any distributions of share capital or equity reserves or any impairment losses detected as a result of an impairment test. If the reasons that justified the write-down cease to apply in subsequent years, the original cost can be reinstated.
Impairment of AssetsIAS 36 requires that an entity test its property, plant and equipment and intangible assets for impairment when there are indications that an impairment has occurred.In the case of goodwill and other assets with indefinite lives or assets that are not available for use, an impairment test must be performed at least once a year.The recoverability of an asset’s carrying amount is tested by comparing (i) its carrying amount with (ii) its fair value, less cost to sell, or its value in use, whichever is greater, after deducting from both the amount of the provision recognized for industrial site decommissioning and remediation. IAS 36 defines recoverable value as the fair value of an asset or cash generating unit, less cost to sell, or its value in use, whichever is greater.As a rule, value in use is the present value of the future cash flows that an asset or a cash generating unit is expected to generate, plus the amount expected from its disposal at the end of its useful life. CGUs, which have been identified in a way that is consistent with Edison’s organizational and business structure, are homogeneous groups of assets that generate cash inflows independently, through the continued use of the assets included in each group.
Translation of Items Denominated in Foreign CurrenciesTransactions in foreign currencies are translated into euros at the exchange rate in force on the transaction date. At the end of the year, cash assets and liabilities are translated at the exchange rates in force at the end of the reporting period. Any resulting foreign exchange translation differences are recognized in profit or loss. Non-cash assets and liabilities denominated in foreign currencies are valued at cost and translated at the exchange rates in force on the transaction date.

NOTES TO THE SEPARATE FINANCIAL STATEMENTS
2016 FINANCIAL REPORT I 15
Financial InstrumentsFinancial instruments include equity investments (other than investments in subsidiaries, joint ventures and affiliate companies) that are held for trading (trading equity investments) and available-for-sale investments. They also include long-term loans and receivables, trade receivables and other receivables generated by the Company, and current financial assets, such as cash and cash equivalents. Cash and cash equivalents include bank and postal deposit accounts, readily marketable securities purchased as temporary investments of cash and loans receivable due within three months. Financial instruments also include loans payable, trade and other payables, other financial liabilities and derivatives. Financial assets and financial liabilities are recognized at fair value when the Company acquires the rights or assumes obligations conveyed contractually by the financial instrument.The initial amount at which these items are recognized must include transaction costs directly attributable to the purchase or issue costs that are included in the initial valuation of all those assets and liabilities that can be classified as financial instruments. Subsequent measurements will depend on the type of instrument, as follows:• With the exception of derivatives, assets held for trading are valued at fair value, with any resulting gains
or losses recognized in the income statement. This class of assets consists mainly of equity investments held for trading and the so-called Trading Activities reviewed below.
• Provided they are not derivatives and equity investments, other financial assets and liabilities with fixed or determinable payments are valued at their amortized cost. Any initial transaction costs (e.g., issue premiums or discounts, the costs incurred to secure loans, etc.) are recognized directly as adjustments to the face value of the corresponding asset or liability. Financial income and expense is computed in accordance with the effective interest rate method. Financial assets are measured on a regular basis to determine whether there is any objective evidence that their value may have been impaired. More specifically, the measurement of receivables takes into account the solvency of creditors and the level of credit risk, which is indicative of individual debtors’ ability to pay. Any losses are recognized in the income statement for the corresponding period. This category includes long-term loans and receivables, trade receivables and other receivables generated by the Company, as well as loans payable, trade and other payables and other financial liabilities.
• Available-for-sale assets are measured at fair value and any resulting gains or losses are recognized in equity, more specifically in the “Reserve for other components of comprehensive income”, until disposal, when they are transferred to the income statement. Losses that result from measurement at fair value are recognized directly in the income statement when there is objective evidence that the value of a financial asset has been impaired, even if the asset has not been sold. Equity investments in companies that are not publicly traded, the fair value of which cannot be measured reliably, are valued at cost less impairment losses. This category includes equity investments representing an interest of less than 20%.
• Derivatives are measured at fair value and any resulting changes are recognized in the income statement. However, whenever possible, the Company uses hedge accounting and, consequently, derivatives are classified as hedges when the relationship between the derivative and the hedged item is formally documented and the effectiveness of the hedging relationship, which is tested periodically, is high in accordance with IAS 39 rules. If this is the case, the following accounting treatments are applied:a) When derivatives hedge the risk of fluctuations in the cash flow of the hedged items (Cash Flow Hedge),
the effective portion of any change in the fair value of the derivatives is recognized directly in equity, more specifically in the “Reserve for other components of comprehensive income”, while the ineffective portion is recognized directly in the income statement. The amounts recognized in equity are transferred to the income statement in conjunction with the gains or losses generated by the hedged item.
b) When derivatives hedge the risk of changes in the fair value of the hedged items (Fair Value Hedge), any changes in the fair value of the derivatives are recognized directly in the income statement. The carrying amount of the hedged items is adjusted accordingly in the income statement, to reflect changes in fair value associated with the hedged risk.
Financial assets are derecognized when they no longer convey the right to receive the related cash flows and substantially all of the risks and benefits conveyed by the ownership of the assets have been transferred or when an asset is deemed to be totally non-recoverable after all necessary recovery procedures have been carried out.
NOTES TO THE SEPARATE FINANCIAL STATEMENTS
16 I 2016 FINANCIAL REPORT
Financial liabilities are derecognized when the corresponding contractual obligations are extinguished. Changes to existing contract terms can qualify as an extinguishing event if the new terms materially alter the original stipulations and, in any case, when the present value of the cash flows that will be generated under the revised agreements differs by more than 10% from the value of the discounted cash flows of the original liability.The fair value of financial instruments that are traded on an active market is based on their market price at the end of the reporting period. The fair value of financial instruments that are not traded on an active market is determined using appropriate valuation techniques.
Trading ActivitiesApproved activities that are part of the Company’s core businesses include physical and financial trading in commodities. These activities must be carried out in accordance with special procedures and are segregated at inception in special Trading Portfolios, separate from the other core activities (so-called Industrial Activities). Trading Activities include physical and financial contracts for commodities and environmental securities, which are measured at fair value, with changes in fair value recognized in the income statement. Individual contracts may require physical delivery. In such cases, any inventories are measured at fair value, with changes in fair value recognized in the income statement.The amounts show in income statement for revenues and raw materials and services used reflect a presentation that recognizes only the resulting “trading margin” (so-called net presentation).
InventoriesInventories attributable to the Industrial Activities are valued at purchase or production cost, including incidental expenses, determined primarily by the FIFO method, or at estimated realizable value, based on market conditions, whichever is lower. Inventories attributable to Trading Activities are deemed to be assets held for trading and,
consequently, are measured at fair value, with changes in fair value recognized in the income statement.
Valuation of Long-term Take or pay ContractsUnder the terms of medium/long-term contracts for the importation of natural gas, the Group is required to take delivery of a minimum annual quantity of natural gas. If delivery of the minimum annual quantity is not achieved, the Group is required to pay the consideration attributable to the undelivered quantity. This payment can be treated either as an advance on future deliveries or as a penalty for the failure to take delivery. The first situation (advance on future deliveries) occurs in the case of undelivered quantities at the end of the reporting period for which there is a reasonable certainty that, over the remaining term of the contract, the shortfall will be made up in future years by means of increased deliveries of natural gas, in excess of minimum annual contract quantities. The second situation (penalty for failure to take delivery) occurs in the case of undelivered quantities for which there is no expectation that the shortfall can be made up in the future. The portion of the payment that qualifies as an advance on future deliveries is initially recognized in “Other assets” pursuant to IAS 38. The recognized amount is maintained after periodical ascertaining that: i) over the residual duration of the contract, the Company estimates that it will be able to recover the volumes below the contractual minimum (quantitative valuation); ii) the Company believes that the contracts entail, over their entire residual lives, expected positive net cash flows based on approved Company plans (economic valuation). These recoverability assessments are also applied to quantities that, while scheduled for delivery, were still undelivered and unpaid at the end of the reporting period, the payment for which will occur in the following period. The corresponding amount is recognized as a commitment. Advances are reclassified to inventory only when the Company actually takes delivery of the gas or are recognized in profit or loss as penalties when it is unable to take delivery of the gas. With regard to the valuation of the gas inventory, estimates of the net realizable value are based on the best price estimates available at the time of valuation, taking into account the target market. These estimates may take into account as a price adjustment, if applicable, any contractual renegotiations on a three-year basis of the price of delivered natural gas.
Employee BenefitsThe provision for employee severance indemnities and the provision for pensions are computed on an actuarial basis. The amount of employee benefits that vested during the year is recognized in the income statement

NOTES TO THE SEPARATE FINANCIAL STATEMENTS
2016 FINANCIAL REPORT I 17
as a “Labor costs”. The theoretical finance charge that the Company would incur if it were to borrow in the marketplace an amount equal to the provision for employee severance indemnities is posted to “Net financial income (expense)”. Actuarial gains and losses that arise from changes in the actuarial assumptions used are recognized in the comprehensive income statement, taking into account the average working lives of the employees. Specifically, in accordance with Budget Law No. 296 of December 27, 2006, only the liability for vested employee severance benefits that remained at the Company was valued for IAS 19 purposes, since the portion applicable to future vesting benefits was paid to separate entities (supplemental pension funds or INPS funds). As a result of these payments, the Company has no further obligations with regard to the work that employees will perform in the future (so-called “defined-contribution plan”).
Provisions for Risks and ChargesProvision for risks and charges are recognized exclusively when there is a present obligation arising from past events that can be reliably estimated. These obligations can be legal or contractual in nature or can be the result of representations or actions of the Company that created valid expectations in the relevant counterparties that the Company will be responsible for complying or will assume the responsibility of causing others to comply with an obligation (implied obligations). If the time value of money is significant, the liability is discounted and the effect of the discounting process is recognized as a financial expense..
Recognition of Revenues and Expenses Revenues and income, costs and expenses are recognized net of returns, discounts, allowances, bonuses and any taxes directly related to the sale of products or the provision of services. Sales revenues are recognized when title to the goods passes to the buyer. As a rule, this occurs when the goods are delivered or shipped. The full amount of operating grants is recognized in the income statement when the conditions for recognition can be met. Items that qualify as operating grants include the incentives provided for the production of electric power with facilities that use renewable sources which are measured at fair value in accordance with IAS 20. Materials used include the cost of environmental securities attributable to the period and, if applicable, those referred to facilities divested during the period attributable to the seller. Purchases of emission rights held for trading are added to inventory. Financial income and expense is recognized when accrued. Dividends are recognized when the shareholders are awarded the rights to collect them, which generally occurs in the year when the disbursing investee company holds a Shareholders’ Meeting that approves a distribution of earnings or reserves.
Income TaxesCurrent income taxes are recognized based on an estimate of its taxable income, in accordance with the tax rates and laws that have been enacted or substantively enacted at the end of the reporting year and taking into account any applicable exemptions or available tax credits.Deferred-tax assets and liabilities are computed on the temporary differences between the carrying amounts of assets and liabilities and the corresponding tax bases, using the tax rates that are expected to be in effect when the temporary differences are reversed. Deferred-tax assets are recognized only when their future recovery is probable. The valuation of deferred-tax assets must be carried out taking into account the taxable income projected in industrial plans approved by the Company. When gains and losses are recognized directly in equity, more specifically in the “Reserve for other components of comprehensive income,” the deferred-tax assets and the deferred-tax liabilities must also be recognized directly in equity.
Use of Estimated Values The preparation of the financial statements and the accompanying notes requires the use of estimates and assumptions both in the measurement of certain assets and liabilities and in the valuation of contingent assets and liabilities. The actual results that will arise upon the occurrence of the relevant events could differ from these estimates.The estimates and assumptions used are revised on an ongoing basis, and the impact of any such revision is immediately recognized in the income statement. Valuations related to the impairment test were made based on a scenario updated as specified later in these notes.
NOTES TO THE SEPARATE FINANCIAL STATEMENTS
18 I 2016 FINANCIAL REPORT
The use of estimates is particularly significant for the following items:• Amortization and depreciation (assets with a finite useful life) and impairment tests of property, plant and
equipment, goodwill and intangible assets. For the impairment test please refer to the section of these Notes entitled “Impairment Test in Accordance with IAS 36 Applied to the Value of Goodwill, Property, Plant and Equipment and Other Intangibles.” The valuation of the provision for industrial site decommissioning and remediation is affected by assumptions concerning cost, inflation rate and discount rate, as well as assumptions regarding the timing of payments; at each balance sheet date the estimates are reviewed to verify whether the amounts recognized are the best estimates of the costs that the Company may incur and, if significant discrepancies are detected, the amounts are revised.
• Valuation of derivatives and financial instruments in general, with regard to which please refer to the criteria explained in the “Financial instruments” section and, for quantitative evidence, to the “Notes to the financial statements. Please note that the methods applied to measure fair value and manage inherent risks in connection with the energy commodities handled by the Company, foreign exchange rates and interest rates are described in the section of these notes entitled “Financial Risk Management.”
• Measurement of certain sales revenues, the provisions for risks and charges, the allowances for doubtful accounts and other provisions for writedowns, employee benefits and income taxes. These measurements represent best estimates based on currently available information.

NOTES TO THE SEPARATE FINANCIAL STATEMENTS
2016 FINANCIAL REPORT I 19
NOTES TO THE INCOME STATEMENT
OPERATING PERFORMANCE IN 2016
The net result of Edison Spa at December 31, 2016 was a loss of 250 million euros, improved compared to the loss of 776 million euros incurred in 2015, which, more specifically, reflected the negative impact of the impairment test (1,017 million euros in 2015 and 182 million euros in 2016) applied to some industrial asset, concessions and investments in associates.
In 2016, sales revenues grew to 6,154 million euros, for a gain of 11.5% compared with the previous year (5,517 million euros), particularly referred to the hydrocarbon sector, largely attributable to the increase in sales volumes which more than offset the decrease in prices.
EBITDA were positive by 27 million euros (positive by 662 million euros in the 2015). More specifically:• the hydrocarbons operations reported positive EBITDA of 228 million euros, positive by 755 million euros
in 2015, influenced by the one-off benefit deriving from the arbitration for the libyan gas. The Company’s performance in this area benefitted both from higher sales volumes of natural gas, mainly driven by higher sales to thermoelectric users and spot-market sales, and an improvement in the margins earned made possible by the revision of the cost of Libyan gas that resulted from the commercial agreement with ENI, concluded in the second quarter of 2016. Moreover, in September 2016, a price review agreement was signed with RasGas with reference to the long term gas agreement from Qatari which align conditions to the market. The contribution provided by the Exploration & Production activities, while still significant thanks to the contribution of Clara Nord-West started in April 2016, reflected a decrease in volumes due to the natural depletion of the fields and continued to be penalized by the ongoing negative scenario in the oil market.
• in the electric power operations were negative by 107 million euros (less than 1 million euros in 2015). The result reflects a reduction in hydroelectric generation due to the a lower availability of water resources than in previous year, offset by an higher thermoelectric generation affected by lower margins. The average PUN TWh price is 42.7 euro/MWh, decreased by 18% compared to 52.3 euro/MWh in 2015;
• in the corporate activities sector, which includes central and transversal management activities and activities not directly tied to a specific business, EBITDA were negative by 93 million euros, in line with the result reported in 2015.
EBIT, which were negative by 438 million euros (535 million euros in 2015) reflect the combined effect of lower EBITDA and the following factors:• 88 million euros for the negative impact of the net change in the fair value of commodity and foreign
exchange derivatives (positive by 89 million euros un 2015);• 180 million euros in write-downs of non-current assets and hydrocarbon concessions (524 million euros in
2015) and 2 million euros for some electric power assets required by the results of an impairment test, and 182 million euros for depreciation and amortization (246 million euros in 2015), which decreased due to the write-downs recognized in 2015;
• 13 million euros in net other expense (22 million euros in net others expense in 2015), consisting mainly of legal costs not directly related to the Company’s industrial and financial activities.
In addition to the industrial margin dynamics discussed above, the following factors affected this year’s performance:• 16 million euros in net financial expense (6 million euros in net financial income in 2015), with the negative
change mainly attributable to the net foreign exchange gains earned on derivative hedges due to the favorable trend in the euro/dollar exchange rate, which produced exceptionally positive results in 2015;
• 132 million euros in net income from equity investments (186 million euros in net expense in 2015) consisting mainly of 212 million euros in dividends (220 million euros in 2015) and 55 million euros in net gains on the divestment of equity investments, net of 135 million euros in write-downs of some investee companies (406 million euros in 2015), as a consequence of the impairment test on the same.

NOTES TO THE SEPARATE FINANCIAL STATEMENTS
20 I 2016 FINANCIAL REPORT
• Income taxes, which were positive by 73 million euros (negative by 61 million euros in 2015) and include the benefit from the filing of the consolidate tax return for the remuneration of the loss and the recognition of deferred tax assets on the impaired assets.
1. Sales Revenues - 6,154,385,000 euros
(in thousands of euros) 2016 2015 Change % change
Natural gas 3,933,893 3,899,783 34,110 0.9%
Electric power 942,709 934,458 8,251 0.9%
Oil 64,619 89,962 (25,343) (28.2%)
Steam 37,582 33,611 3,971 11.8%
Green certificates 79,087 58,064 21,023 36.2%
Sundry items 1,070 963 107 11.1%
Total sales 5,058,960 5,016,841 42,119 0.8%
Realized commodity derivatives 1,030,043 448,886 581,157 n.s.
Sundry service revenues 60,703 42,847 17,856 41.7%
Power plant maintenance revenues 4,679 8,729 (4,050) (46.4%)
Margin on physical trading activity - 3 (3) n.m.
Total sales revenues 6,154,385 5,517,306 637,079 11.5%
Breakdown by business segment:
Hydrocarbons operations 5,047,031 4,452,782 594,249 13.3%
Electric power operations 1,081,712 1,040,464 41,248 4.0%
Corporate activities 25,642 24,060 1,582 6.6%
Total sales revenues 6,154,385 5,517,306 637,079 11.5%
The following developments are also worth mentioning:• in the hydrocarbons operations the gain of 13.3%, compared with 2015, is mainly attributable to positive
effects on realized commodity derivative transactions and to an increase in sales volumes of natural gas (+22%), mainly to industrial and thermoelectric users, which more than offset the adverse effects of medium a negative trend in the benchmark scenario and oil production due to the natural depletion of the fields;
• in the electric power operations the increase of 4%, compared with 2015, that reflects, as mentioned above, higher thermoelectric generation;
• the revenues generated by the corporate activities refer to services provided to third parties, consisting mainly of coordination activities provided by Edison to Group companies and engineering services.
Revenues from realized commodity derivatives amounting to 1,030,043,000 euros, which should be analyzed concurrently with the corresponding cost included in raw materials and services used (1,294,697 euros), reflect mainly the results of commodity and foreign exchange hedges executed to mitigate the risk of fluctuations in the cost of natural gas and in the sale of gas.
2. Other Revenues and Income - 120,487,000 euros
(in thousands of euros) 2016 2015 Change % change
Recovery of costs from partners in hydrocarbon exploration projects 20,425 23,984 (3,559) (14.8%)
Reversals of provisions for risks and sundry provisions 35,981 2,142 33,839 n.m.
Recovery of costs, out-of-period income and sundry items 64,081 731,482 (667,401) n.m.
Total other revenues and income 120,487 757,608 (637,121) n.m.
NOTES TO THE SEPARATE FINANCIAL STATEMENTS
2016 FINANCIAL REPORT I 21
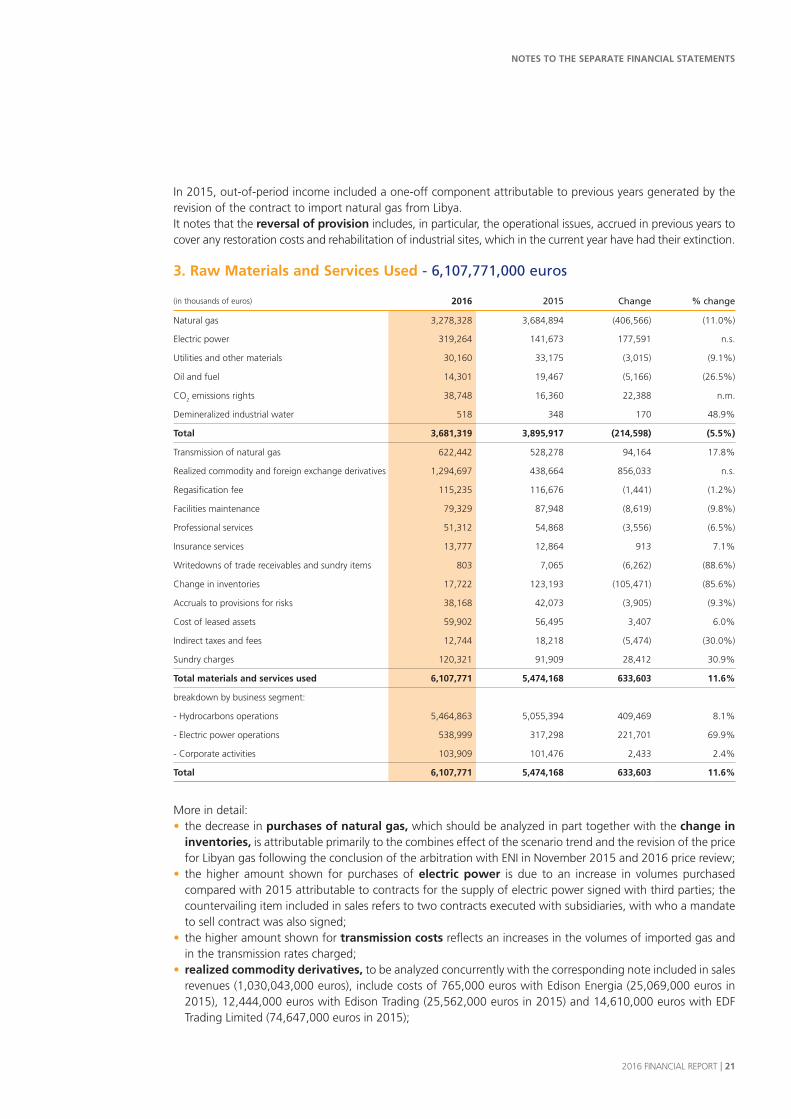
In 2015, out-of-period income included a one-off component attributable to previous years generated by the revision of the contract to import natural gas from Libya. It notes that the reversal of provision includes, in particular, the operational issues, accrued in previous years to cover any restoration costs and rehabilitation of industrial sites, which in the current year have had their extinction.
3. Raw Materials and Services Used - 6,107,771,000 euros
(in thousands of euros) 2016 2015 Change % change
Natural gas 3,278,328 3,684,894 (406,566) (11.0%)
Electric power 319,264 141,673 177,591 n.s.
Utilities and other materials 30,160 33,175 (3,015) (9.1%)
Oil and fuel 14,301 19,467 (5,166) (26.5%)
CO2 emissions rights 38,748 16,360 22,388 n.m.
Demineralized industrial water 518 348 170 48.9%
Total 3,681,319 3,895,917 (214,598) (5.5%)
Transmission of natural gas 622,442 528,278 94,164 17.8%
Realized commodity and foreign exchange derivatives 1,294,697 438,664 856,033 n.s.
Regasification fee 115,235 116,676 (1,441) (1.2%)
Facilities maintenance 79,329 87,948 (8,619) (9.8%)
Professional services 51,312 54,868 (3,556) (6.5%)
Insurance services 13,777 12,864 913 7.1%
Writedowns of trade receivables and sundry items 803 7,065 (6,262) (88.6%)
Change in inventories 17,722 123,193 (105,471) (85.6%)
Accruals to provisions for risks 38,168 42,073 (3,905) (9.3%)
Cost of leased assets 59,902 56,495 3,407 6.0%
Indirect taxes and fees 12,744 18,218 (5,474) (30.0%)
Sundry charges 120,321 91,909 28,412 30.9%
Total materials and services used 6,107,771 5,474,168 633,603 11.6%
breakdown by business segment:
- Hydrocarbons operations 5,464,863 5,055,394 409,469 8.1%
- Electric power operations 538,999 317,298 221,701 69.9%
- Corporate activities 103,909 101,476 2,433 2.4%
Total 6,107,771 5,474,168 633,603 11.6%
More in detail:• the decrease in purchases of natural gas, which should be analyzed in part together with the change in
inventories, is attributable primarily to the combines effect of the scenario trend and the revision of the price for Libyan gas following the conclusion of the arbitration with ENI in November 2015 and 2016 price review;
• the higher amount shown for purchases of electric power is due to an increase in volumes purchased compared with 2015 attributable to contracts for the supply of electric power signed with third parties; the countervailing item included in sales refers to two contracts executed with subsidiaries, with who a mandate to sell contract was also signed;
• the higher amount shown for transmission costs reflects an increases in the volumes of imported gas and in the transmission rates charged;
• realized commodity derivatives, to be analyzed concurrently with the corresponding note included in sales revenues (1,030,043,000 euros), include costs of 765,000 euros with Edison Energia (25,069,000 euros in 2015), 12,444,000 euros with Edison Trading (25,562,000 euros in 2015) and 14,610,000 euros with EDF Trading Limited (74,647,000 euros in 2015);

NOTES TO THE SEPARATE FINANCIAL STATEMENTS
22 I 2016 FINANCIAL REPORT
• the regasification fee reflects the charges paid to Terminale GNL Adriatico Srl for regasification of liquefied gas originating from Qatar.
• the accruals to sundry provisions for risks, amounting to 38,168,000 euros, consist mainly of accruals for future taxes.
4. Labor Costs - 139,700,000 euros
2016 2015 Change
Labor costs (in thousands
of euros)
Numberof employees
at endof period
Average number
of employees
Labor costs (in thousands
of euros)
Numberof employees
at endof period
Average number
of employees
Labor costs (in thousands
of euros)
% Numberof employees
at endof period
% Average number
of employees
%
139,700 1,419 1,457 138,702 1,473 1,492 998 0.7% (54) (3.8%) (35) (2.4%)
Changes in wage dynamics accounts for most of the increase in labor costs which more than offset the decrease in the number of employees is due to the sale of some business operations.The table below shows the changes that occurred in the Company’s staff broken down by employment category:
(number of employees) Beginning of year
Added Removed Change in category
End of year Average staff 2016
Average staff 2015
% change
Executives 123 8 (8) 5 128 126 124 1.6%
Office staff and middle managers
1,170 46 (89) (5) 1,122 1,154 1,183 (2.5%)
Production staff 180 6 (17) - 169 177 185 (4.3%)
Total 1,473 60 (114) - 1,419 1,457 1,492 (2.3%)
5. EBITDA - 27,401,000 euros
(in thousands of euros) 2016 as a % of sales revenues
2015 as a % of sales revenues
% change
Hydrocarbons operations 227,609 2.6% 755,376 8.9% n.m.
Electric power operations (106,987) (9.9%) (311) n.s n.m.
Corporate (93,221) n.m. (93,021) n.s (0.2%)
Total 27,401 0.3% 662,044 6.9% n.m.
For an analysis of EBITDA, as widely commented earlier in the “Operating Performance in 2016” section of this Report. In summary:• in the hydrocarbons operations, positive for 228 million euros, benefitted from higher sales volumes which
more than offset decrease in prices.• in the electric power operations negative by 107 million euros due to the significant decrease in related
prices. For the sake of complete information, please note that EBITDA includes the allocated purchase costs related to the procurement of gas incurred by the hydrocarbons operations to the Electric Power Operations based on the volumes used.
NOTES TO THE SEPARATE FINANCIAL STATEMENTS
2016 FINANCIAL REPORT I 23
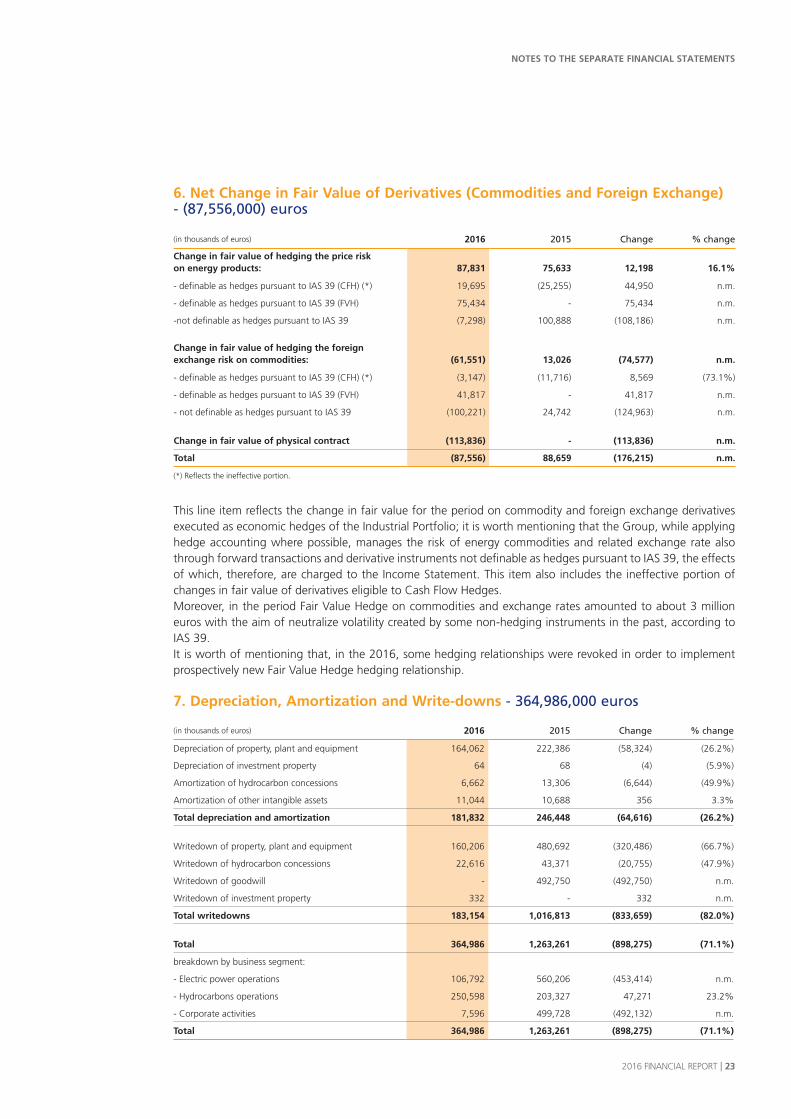
6. Net Change in Fair Value of Derivatives (Commodities and Foreign Exchange) - (87,556,000) euros
(in thousands of euros) 2016 2015 Change % change
Change in fair value of hedging the price risk on energy products: 87,831 75,633 12,198 16.1%
- definable as hedges pursuant to IAS 39 (CFH) (*) 19,695 (25,255) 44,950 n.m.
- definable as hedges pursuant to IAS 39 (FVH) 75,434 - 75,434 n.m.
-not definable as hedges pursuant to IAS 39 (7,298) 100,888 (108,186) n.m.
Change in fair value of hedging the foreign exchange risk on commodities: (61,551) 13,026 (74,577) n.m.
- definable as hedges pursuant to IAS 39 (CFH) (*) (3,147) (11,716) 8,569 (73.1%)
- definable as hedges pursuant to IAS 39 (FVH) 41,817 - 41,817 n.m.
- not definable as hedges pursuant to IAS 39 (100,221) 24,742 (124,963) n.m.
Change in fair value of physical contract (113,836) - (113,836) n.m.
Total (87,556) 88,659 (176,215) n.m.
(*) Reflects the ineffective portion.
This line item reflects the change in fair value for the period on commodity and foreign exchange derivatives executed as economic hedges of the Industrial Portfolio; it is worth mentioning that the Group, while applying hedge accounting where possible, manages the risk of energy commodities and related exchange rate also through forward transactions and derivative instruments not definable as hedges pursuant to IAS 39, the effects of which, therefore, are charged to the Income Statement. This item also includes the ineffective portion of changes in fair value of derivatives eligible to Cash Flow Hedges.Moreover, in the period Fair Value Hedge on commodities and exchange rates amounted to about 3 million euros with the aim of neutralize volatility created by some non-hedging instruments in the past, according to IAS 39.It is worth of mentioning that, in the 2016, some hedging relationships were revoked in order to implement prospectively new Fair Value Hedge hedging relationship.
7. Depreciation, Amortization and Write-downs - 364,986,000 euros
(in thousands of euros) 2016 2015 Change % change
Depreciation of property, plant and equipment 164,062 222,386 (58,324) (26.2%)
Depreciation of investment property 64 68 (4) (5.9%)
Amortization of hydrocarbon concessions 6,662 13,306 (6,644) (49.9%)
Amortization of other intangible assets 11,044 10,688 356 3.3%
Total depreciation and amortization 181,832 246,448 (64,616) (26.2%)
Writedown of property, plant and equipment 160,206 480,692 (320,486) (66.7%)
Writedown of hydrocarbon concessions 22,616 43,371 (20,755) (47.9%)
Writedown of goodwill - 492,750 (492,750) n.m.
Writedown of investment property 332 - 332 n.m.
Total writedowns 183,154 1,016,813 (833,659) (82.0%)
Total 364,986 1,263,261 (898,275) (71.1%)
breakdown by business segment:
- Electric power operations 106,792 560,206 (453,414) n.m.
- Hydrocarbons operations 250,598 203,327 47,271 23.2%
- Corporate activities 7,596 499,728 (492,132) n.m.
Total 364,986 1,263,261 (898,275) (71.1%)
NOTES TO THE SEPARATE FINANCIAL STATEMENTS
24 I 2016 FINANCIAL REPORT
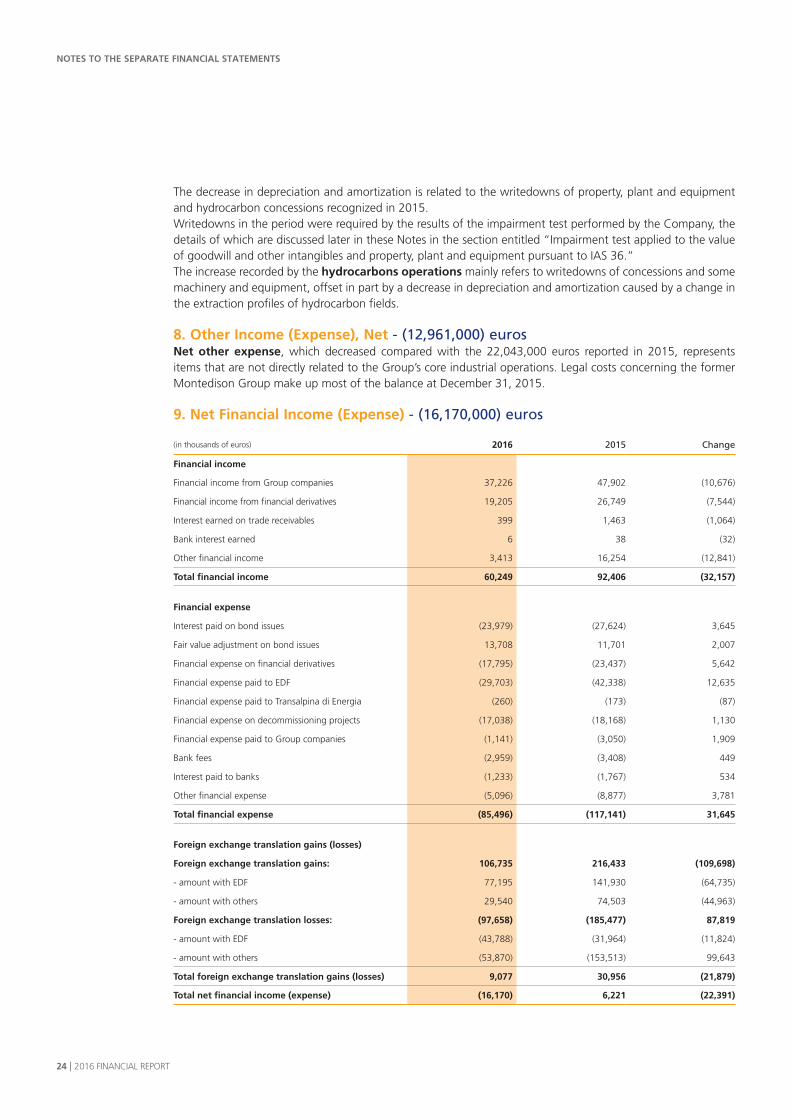
The decrease in depreciation and amortization is related to the writedowns of property, plant and equipment and hydrocarbon concessions recognized in 2015.Writedowns in the period were required by the results of the impairment test performed by the Company, the details of which are discussed later in these Notes in the section entitled “Impairment test applied to the value of goodwill and other intangibles and property, plant and equipment pursuant to IAS 36.”The increase recorded by the hydrocarbons operations mainly refers to writedowns of concessions and some machinery and equipment, offset in part by a decrease in depreciation and amortization caused by a change in the extraction profiles of hydrocarbon fields.
8. Other Income (Expense), Net - (12,961,000) eurosNet other expense, which decreased compared with the 22,043,000 euros reported in 2015, represents items that are not directly related to the Group’s core industrial operations. Legal costs concerning the former Montedison Group make up most of the balance at December 31, 2015.
9. Net Financial Income (Expense) - (16,170,000) euros
(in thousands of euros) 2016 2015 Change
Financial income
Financial income from Group companies 37,226 47,902 (10,676)
Financial income from financial derivatives 19,205 26,749 (7,544)
Interest earned on trade receivables 399 1,463 (1,064)
Bank interest earned 6 38 (32)
Other financial income 3,413 16,254 (12,841)
Total financial income 60,249 92,406 (32,157)
Financial expense
Interest paid on bond issues (23,979) (27,624) 3,645
Fair value adjustment on bond issues 13,708 11,701 2,007
Financial expense on financial derivatives (17,795) (23,437) 5,642
Financial expense paid to EDF (29,703) (42,338) 12,635
Financial expense paid to Transalpina di Energia (260) (173) (87)
Financial expense on decommissioning projects (17,038) (18,168) 1,130
Financial expense paid to Group companies (1,141) (3,050) 1,909
Bank fees (2,959) (3,408) 449
Interest paid to banks (1,233) (1,767) 534
Other financial expense (5,096) (8,877) 3,781
Total financial expense (85,496) (117,141) 31,645
Foreign exchange translation gains (losses)
Foreign exchange translation gains: 106,735 216,433 (109,698)
- amount with EDF 77,195 141,930 (64,735)
- amount with others 29,540 74,503 (44,963)
Foreign exchange translation losses: (97,658) (185,477) 87,819
- amount with EDF (43,788) (31,964) (11,824)
- amount with others (53,870) (153,513) 99,643
Total foreign exchange translation gains (losses) 9,077 30,956 (21,879)
Total net financial income (expense) (16,170) 6,221 (22,391)
NOTES TO THE SEPARATE FINANCIAL STATEMENTS
2016 FINANCIAL REPORT I 25
The balance benefits from lower financial expenses deriving from decrease in average financial debt and a lower financial cost due to a different mix of financial resources. The negative change that occurred compared with last year, despite the positive effects of a, is attributable primarily to lower net foreign exchange translation gains resulting from the effect of the trend in the EUR/USD exchange rate, which in 2015 recorded an exceptional positive one-off.Please note that financial expense paid to EDF include the breakage cost for the early repayment of a facility, commented in “Note 29”. Long-term financial debt and other financial liabilities, and that other financial expense includes 3,604,000 euros in financial expense to update provisions for risks and 577,000 euros for securitization transactions.
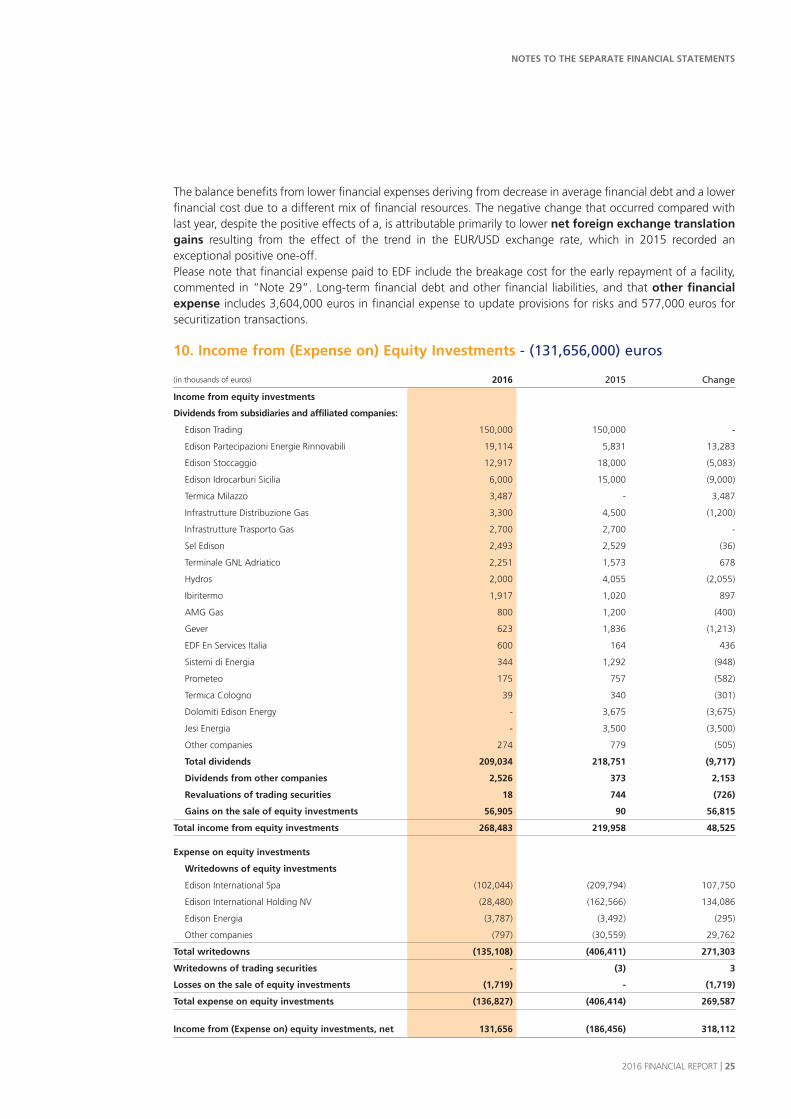
10. Income from (Expense on) Equity Investments - (131,656,000) euros
(in thousands of euros) 2016 2015 Change
Income from equity investments
Dividends from subsidiaries and affiliated companies:
Edison Trading 150,000 150,000 -
Edison Partecipazioni Energie Rinnovabili 19,114 5,831 13,283
Edison Stoccaggio 12,917 18,000 (5,083)
Edison Idrocarburi Sicilia 6,000 15,000 (9,000)
Termica Milazzo 3,487 - 3,487
Infrastrutture Distribuzione Gas 3,300 4,500 (1,200)
Infrastrutture Trasporto Gas 2,700 2,700 -
Sel Edison 2,493 2,529 (36)
Terminale GNL Adriatico 2,251 1,573 678
Hydros 2,000 4,055 (2,055)
Ibiritermo 1,917 1,020 897
AMG Gas 800 1,200 (400)
Gever 623 1,836 (1,213)
EDF En Services Italia 600 164 436
Sistemi di Energia 344 1,292 (948)
Prometeo 175 757 (582)
Termica Cologno 39 340 (301)
Dolomiti Edison Energy - 3,675 (3,675)
Jesi Energia - 3,500 (3,500)
Other companies 274 779 (505)
Total dividends 209,034 218,751 (9,717)
Dividends from other companies 2,526 373 2,153
Revaluations of trading securities 18 744 (726)
Gains on the sale of equity investments 56,905 90 56,815
Total income from equity investments 268,483 219,958 48,525
Expense on equity investments
Writedowns of equity investments
Edison International Spa (102,044) (209,794) 107,750
Edison International Holding NV (28,480) (162,566) 134,086
Edison Energia (3,787) (3,492) (295)
Other companies (797) (30,559) 29,762
Total writedowns (135,108) (406,411) 271,303
Writedowns of trading securities - (3) 3
Losses on the sale of equity investments (1,719) - (1,719)
Total expense on equity investments (136,827) (406,414) 269,587
Income from (Expense on) equity investments, net 131,656 (186,456) 318,112

NOTES TO THE SEPARATE FINANCIAL STATEMENTS
26 I 2016 FINANCIAL REPORT
More specifically:• dividends from other companies include for 2,405,000 euros received from Emittenti Titoli;• the gain on the sale of equity investments for 56,905,000 euros is mainly attributable to the sale in May
of the Hydros e Sel Edison subsidiaries, which had been classified as assets held for sale (Disposal Group) at the end of 2015. This line item also reflects the positive effect, for 687,000 euros, from the sale of RCS Mediagroup carried out at the price listed on the Milan Stock Exchange;
• writedowns of equity investments were recognized to align the carrying amounts of investments in some subsidiaries due to impairments identified through impairment tests of the assets of those subsidiaries (see Note 18);
• the loss on the sale of equity investments refers to the sale of Termica Milazzo.
11. Income Taxes - (72,672,000) eurosNet Income taxes are positive for 72,672,000 euros, mainly resulting from remuneration for the national consolidated tax return and from the appreciation of the deferred tax assets on period losses.The following table shows a breakdown, compared with the previous year which it included the effects of the abolition of the so-called “Robin Hood Tax”, the surcharge levied on companies in the oil and energy sector, resulting in elimination of the deferred tax assets and deferred tax liabilities related to IRES surtax of 6.5%.
(in thousands of euros) 2016 2015 Change
Current taxes (46,332) 176,308 (222,640)
Net deferred-tax liabilities (assets) (24,838) (113,723) 88,885
Taxes attributable to previous years (1,502) (1,408) (94)
Total (72,672) 61,177 (133,849)
The option for group taxation for IRES purposes of Art. 117 and following articles of the Uniform Income Tax Code so-called National Consolidated Tax Return - headed by Transalpina di Energia Spa, was renewed, as provided by law, for a further three years (2016-2018).
Net deferred-tax liabilities/assets show a positive balance, including reversal, of 24,838,000 euros and reflect the recognition of the deferred tax expenses and the tax loss for the period within the future estimated period of recoverability. This analysis was conducted based on the results of medium-term plans consistent with those used for the impairment tests performed in the group.
The table below shows the tax rate for 2015 compared with the rate for the previous year:
(in thousands of euros) 2016 2015
Result before taxes (322,615) (714,837)
Taxes applicable in 2016 (88,719) 27.5% (196,580) 27.5%
Non-taxable dividends (55,279) 17.1% (57,247) 8.0%
Writedowns (Revaluations) of equity investments 37,150 (11.5%) 111,559 (15.6%)
Permanent differences (117) 0.0% 149,194 (20.9%)
Income taxes attributable to previous years and other differences (630) 0.2% (1,500) 0.2%
Effect of applying the Robin Hood tax surcharge - - 54,719 (7.7%)
Delta IRES rate on deferred taxation 12,797 (4.0%) - -
Non-valued tax assets 25,133 (7.8%) - -
Regionl tax (IRAP) - - 24,800 (3.5%)
Deferred taxes (3,007) 0.9% (23,768) 3.3%
Total income taxes in the income statement (72,672) 22.5% 61,177 n.m.
NOTES TO THE SEPARATE FINANCIAL STATEMENTS
2016 FINANCIAL REPORT I 27
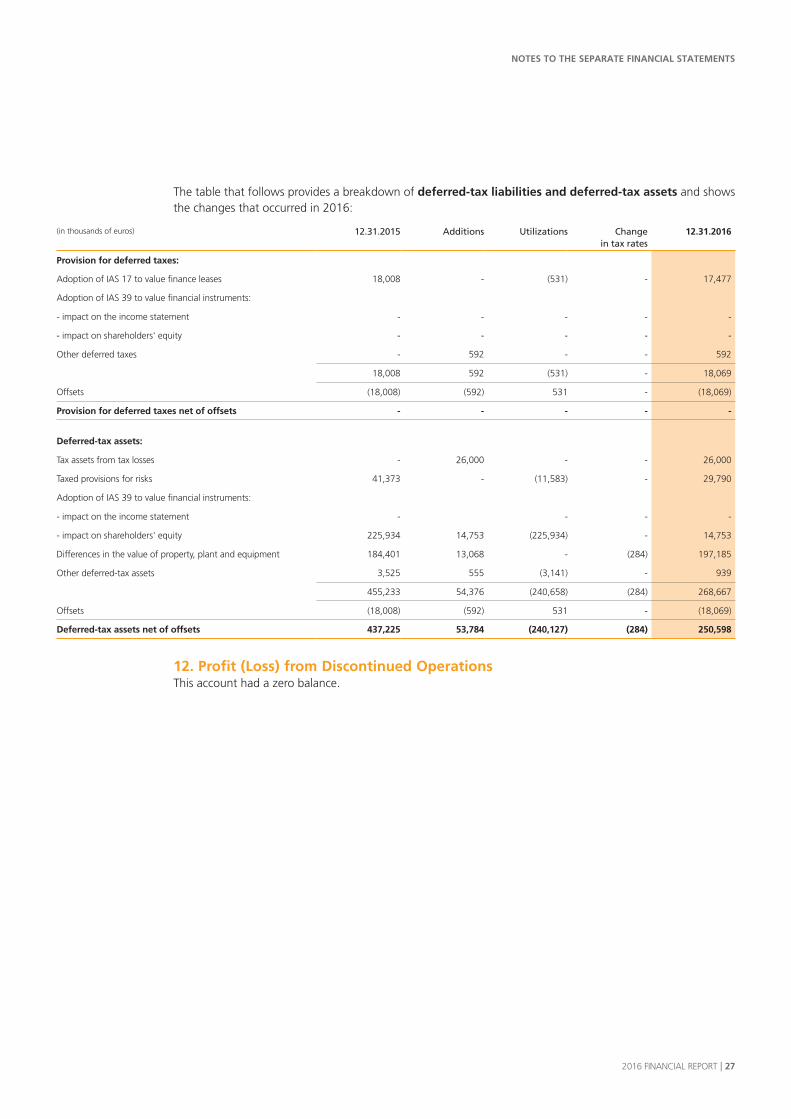
The table that follows provides a breakdown of deferred-tax liabilities and deferred-tax assets and shows the changes that occurred in 2016:
(in thousands of euros) 12.31.2015 Additions Utilizations Change in tax rates
12.31.2016
Provision for deferred taxes:
Adoption of IAS 17 to value finance leases 18,008 - (531) - 17,477
Adoption of IAS 39 to value financial instruments:
- impact on the income statement - - - - -
- impact on shareholders' equity - - - - -
Other deferred taxes - 592 - - 592
18,008 592 (531) - 18,069
Offsets (18,008) (592) 531 - (18,069)
Provision for deferred taxes net of offsets - - - - -
Deferred-tax assets:
Tax assets from tax losses - 26,000 - - 26,000
Taxed provisions for risks 41,373 - (11,583) - 29,790
Adoption of IAS 39 to value financial instruments:
- impact on the income statement - - - -
- impact on shareholders' equity 225,934 14,753 (225,934) - 14,753
Differences in the value of property, plant and equipment 184,401 13,068 - (284) 197,185
Other deferred-tax assets 3,525 555 (3,141) - 939
455,233 54,376 (240,658) (284) 268,667
Offsets (18,008) (592) 531 - (18,069)
Deferred-tax assets net of offsets 437,225 53,784 (240,127) (284) 250,598
12. Profit (Loss) from Discontinued OperationsThis account had a zero balance.
NOTES TO THE SEPARATE FINANCIAL STATEMENTS
28 I 2016 FINANCIAL REPORT
NOTES TO THE BALANCE SHEET
ASSETS
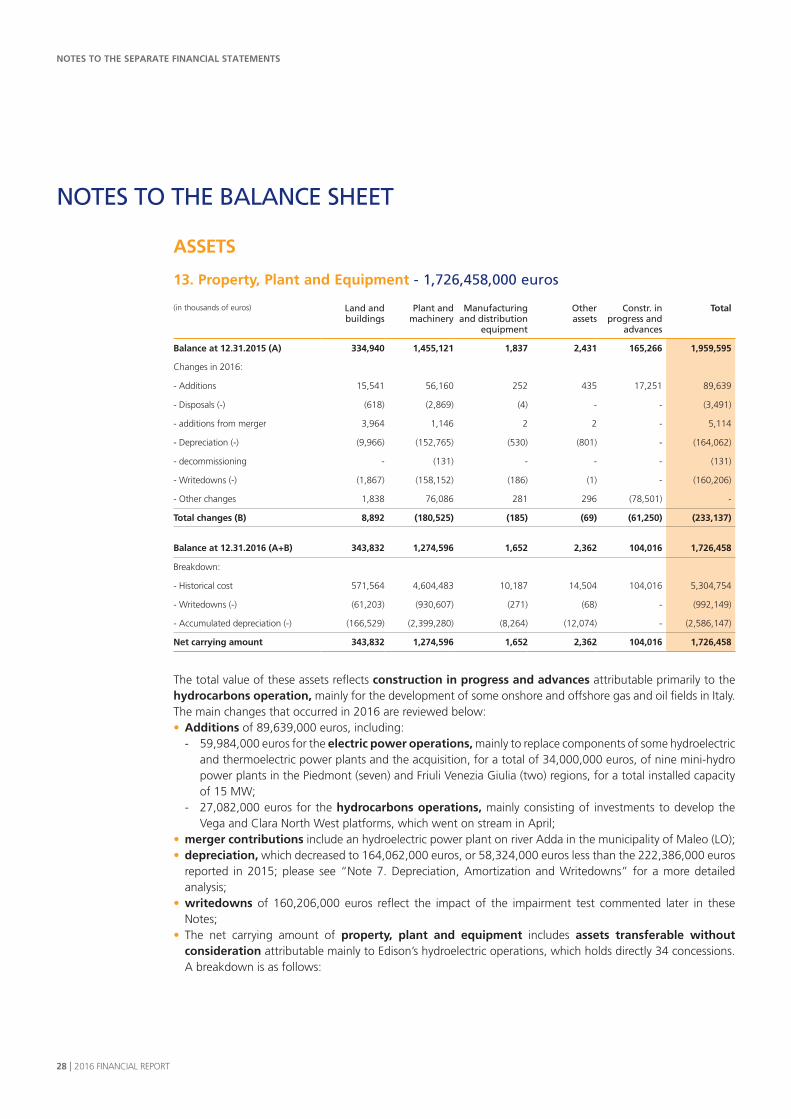
13. Property, Plant and Equipment - 1,726,458,000 euros
(in thousands of euros) Land and buildings
Plant and machinery
Manufacturing and distribution
equipment
Otherassets
Constr. in progress and
advances
Total
Balance at 12.31.2015 (A) 334,940 1,455,121 1,837 2,431 165,266 1,959,595
Changes in 2016:
- Additions 15,541 56,160 252 435 17,251 89,639
- Disposals (-) (618) (2,869) (4) - - (3,491)
- additions from merger 3,964 1,146 2 2 - 5,114
- Depreciation (-) (9,966) (152,765) (530) (801) - (164,062)
- decommissioning - (131) - - - (131)
- Writedowns (-) (1,867) (158,152) (186) (1) - (160,206)
- Other changes 1,838 76,086 281 296 (78,501) -
Total changes (B) 8,892 (180,525) (185) (69) (61,250) (233,137)
Balance at 12.31.2016 (A+B) 343,832 1,274,596 1,652 2,362 104,016 1,726,458
Breakdown:
- Historical cost 571,564 4,604,483 10,187 14,504 104,016 5,304,754
- Writedowns (-) (61,203) (930,607) (271) (68) - (992,149)
- Accumulated depreciation (-) (166,529) (2,399,280) (8,264) (12,074) - (2,586,147)
Net carrying amount 343,832 1,274,596 1,652 2,362 104,016 1,726,458
The total value of these assets reflects construction in progress and advances attributable primarily to the hydrocarbons operation, mainly for the development of some onshore and offshore gas and oil fields in Italy.The main changes that occurred in 2016 are reviewed below:• Additions of 89,639,000 euros, including:
- 59,984,000 euros for the electric power operations, mainly to replace components of some hydroelectric and thermoelectric power plants and the acquisition, for a total of 34,000,000 euros, of nine mini-hydro power plants in the Piedmont (seven) and Friuli Venezia Giulia (two) regions, for a total installed capacity of 15 MW;
- 27,082,000 euros for the hydrocarbons operations, mainly consisting of investments to develop the Vega and Clara North West platforms, which went on stream in April;
• merger contributions include an hydroelectric power plant on river Adda in the municipality of Maleo (LO); • depreciation, which decreased to 164,062,000 euros, or 58,324,000 euros less than the 222,386,000 euros
reported in 2015; please see “Note 7. Depreciation, Amortization and Writedowns” for a more detailed analysis;
• writedowns of 160,206,000 euros reflect the impact of the impairment test commented later in these Notes;
• The net carrying amount of property, plant and equipment includes assets transferable without consideration attributable mainly to Edison’s hydroelectric operations, which holds directly 34 concessions. A breakdown is as follows:
NOTES TO THE SEPARATE FINANCIAL STATEMENTS
2016 FINANCIAL REPORT I 29
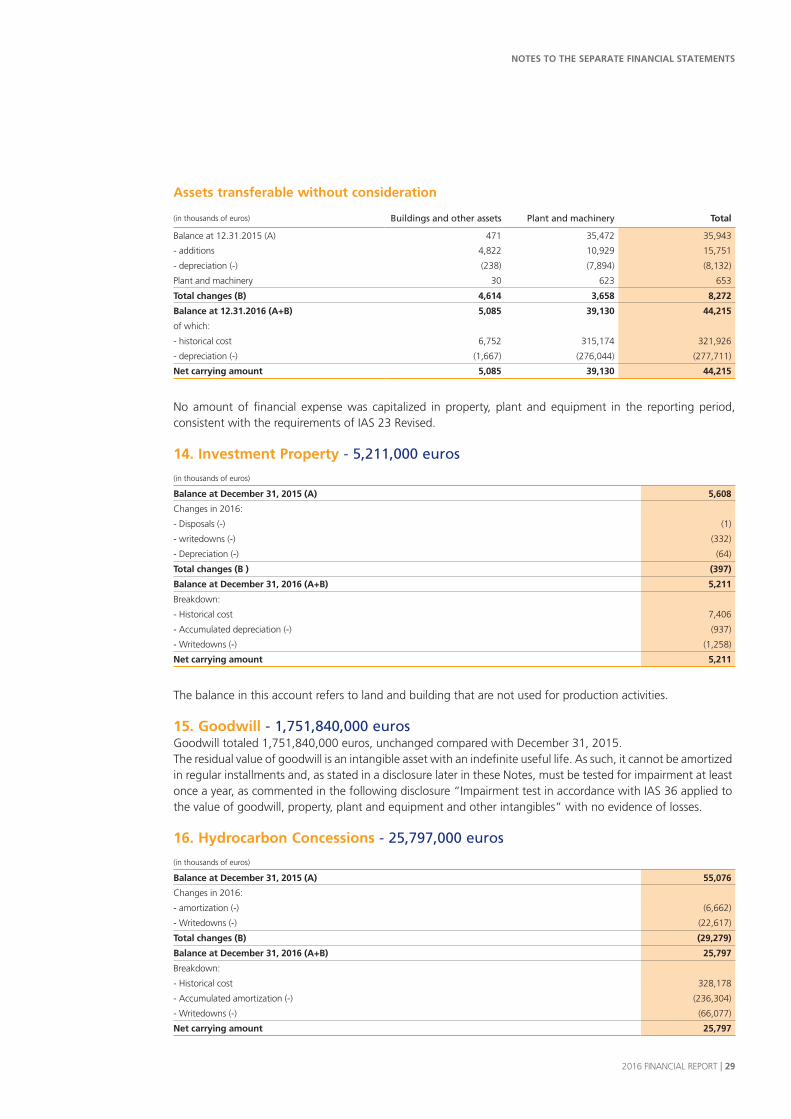
Assets transferable without consideration
(in thousands of euros) Buildings and other assets Plant and machinery Total
Balance at 12.31.2015 (A) 471 35,472 35,943
- additions 4,822 10,929 15,751
- depreciation (-) (238) (7,894) (8,132)
Plant and machinery 30 623 653
Total changes (B) 4,614 3,658 8,272
Balance at 12.31.2016 (A+B) 5,085 39,130 44,215
of which:
- historical cost 6,752 315,174 321,926
- depreciation (-) (1,667) (276,044) (277,711)
Net carrying amount 5,085 39,130 44,215
No amount of financial expense was capitalized in property, plant and equipment in the reporting period, consistent with the requirements of IAS 23 Revised.
14. Investment Property - 5,211,000 euros
(in thousands of euros)
Balance at December 31, 2015 (A) 5,608
Changes in 2016:
- Disposals (-) (1)
- writedowns (-) (332)
- Depreciation (-) (64)
Total changes (B ) (397)
Balance at December 31, 2016 (A+B) 5,211
Breakdown:
- Historical cost 7,406
- Accumulated depreciation (-) (937)
- Writedowns (-) (1,258)
Net carrying amount 5,211
The balance in this account refers to land and building that are not used for production activities.
15. Goodwill - 1,751,840,000 eurosGoodwill totaled 1,751,840,000 euros, unchanged compared with December 31, 2015.The residual value of goodwill is an intangible asset with an indefinite useful life. As such, it cannot be amortized in regular installments and, as stated in a disclosure later in these Notes, must be tested for impairment at least once a year, as commented in the following disclosure “Impairment test in accordance with IAS 36 applied to the value of goodwill, property, plant and equipment and other intangibles” with no evidence of losses.
16. Hydrocarbon Concessions - 25,797,000 euros
(in thousands of euros)
Balance at December 31, 2015 (A) 55,076
Changes in 2016:
- amortization (-) (6,662)
- Writedowns (-) (22,617)
Total changes (B) (29,279)
Balance at December 31, 2016 (A+B) 25,797
Breakdown:
- Historical cost 328,178
- Accumulated amortization (-) (236,304)
- Writedowns (-) (66,077)
Net carrying amount 25,797
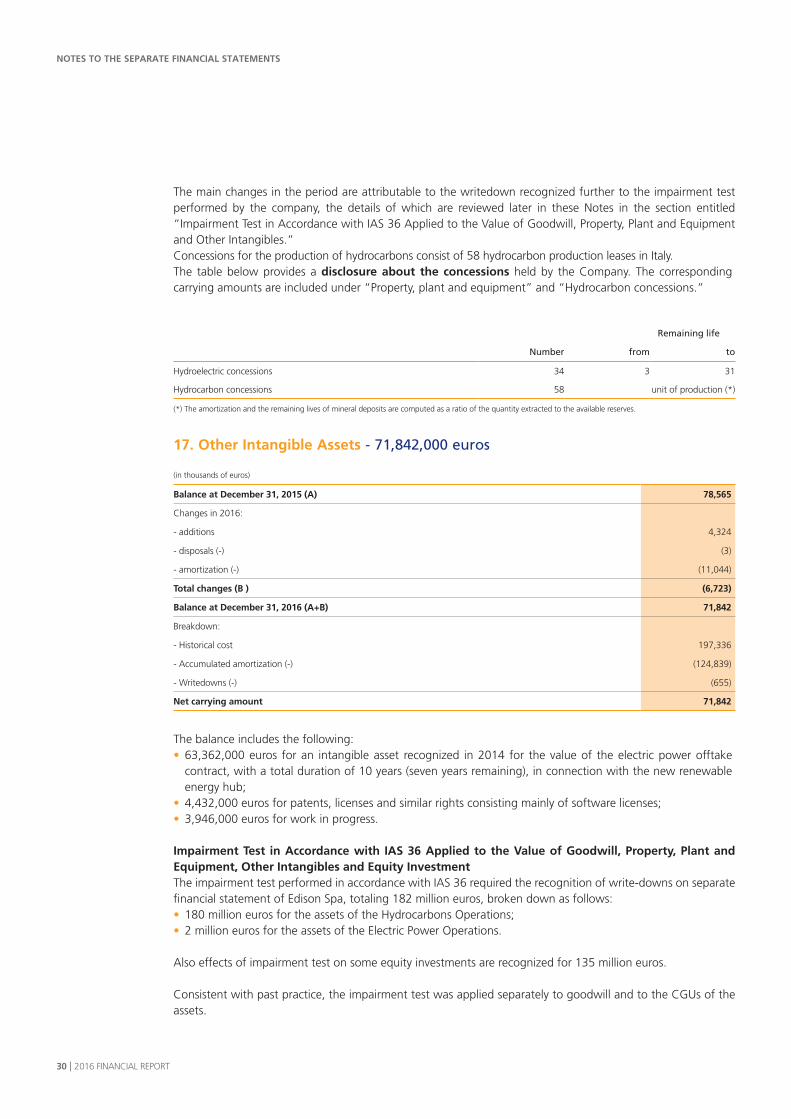
NOTES TO THE SEPARATE FINANCIAL STATEMENTS
30 I 2016 FINANCIAL REPORT
The main changes in the period are attributable to the writedown recognized further to the impairment test performed by the company, the details of which are reviewed later in these Notes in the section entitled “Impairment Test in Accordance with IAS 36 Applied to the Value of Goodwill, Property, Plant and Equipment and Other Intangibles.”Concessions for the production of hydrocarbons consist of 58 hydrocarbon production leases in Italy.The table below provides a disclosure about the concessions held by the Company. The corresponding carrying amounts are included under “Property, plant and equipment” and “Hydrocarbon concessions.”
Remaining life
Number from to
Hydroelectric concessions 34 3 31
Hydrocarbon concessions 58 unit of production (*)
(*) The amortization and the remaining lives of mineral deposits are computed as a ratio of the quantity extracted to the available reserves.
17. Other Intangible Assets - 71,842,000 euros
(in thousands of euros)
Balance at December 31, 2015 (A) 78,565
Changes in 2016:
- additions 4,324
- disposals (-) (3)
- amortization (-) (11,044)
Total changes (B ) (6,723)
Balance at December 31, 2016 (A+B) 71,842
Breakdown:
- Historical cost 197,336
- Accumulated amortization (-) (124,839)
- Writedowns (-) (655)
Net carrying amount 71,842
The balance includes the following:• 63,362,000 euros for an intangible asset recognized in 2014 for the value of the electric power offtake
contract, with a total duration of 10 years (seven years remaining), in connection with the new renewable energy hub;
• 4,432,000 euros for patents, licenses and similar rights consisting mainly of software licenses;• 3,946,000 euros for work in progress.
Impairment Test in Accordance with IAS 36 Applied to the Value of Goodwill, Property, Plant and Equipment, Other Intangibles and Equity InvestmentThe impairment test performed in accordance with IAS 36 required the recognition of write-downs on separate financial statement of Edison Spa, totaling 182 million euros, broken down as follows:• 180 million euros for the assets of the Hydrocarbons Operations;• 2 million euros for the assets of the Electric Power Operations.
Also effects of impairment test on some equity investments are recognized for 135 million euros.
Consistent with past practice, the impairment test was applied separately to goodwill and to the CGUs of the assets.
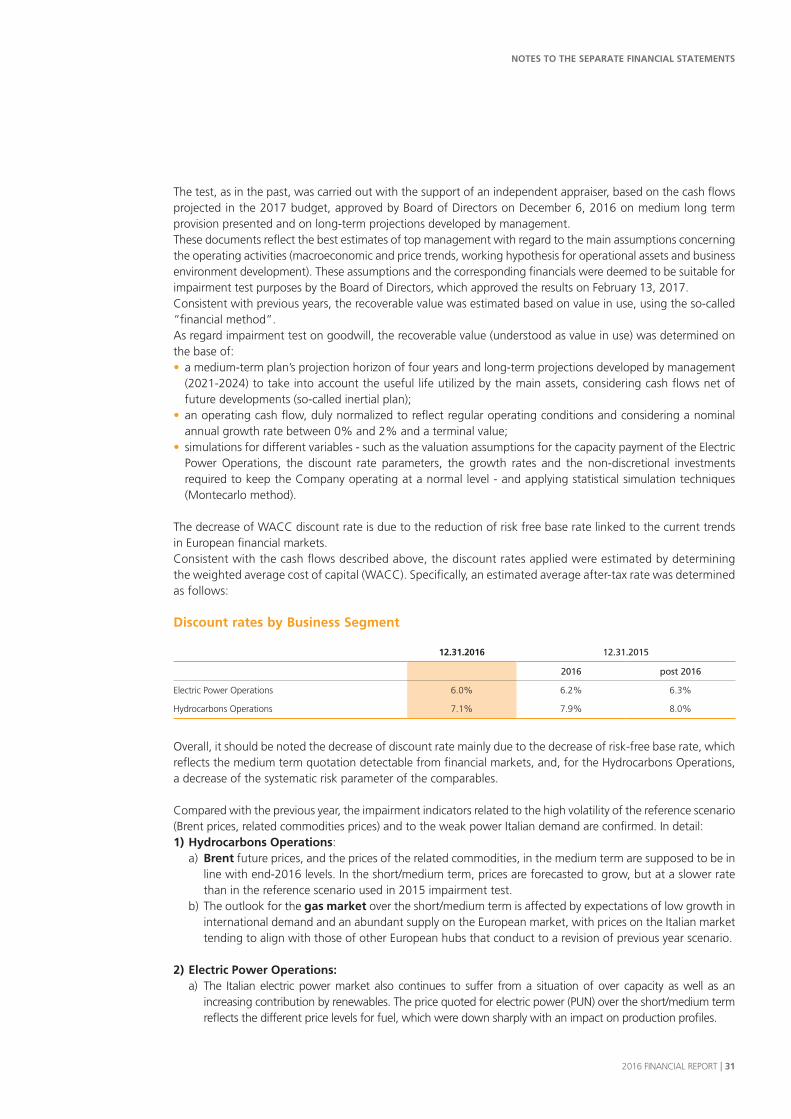
NOTES TO THE SEPARATE FINANCIAL STATEMENTS
2016 FINANCIAL REPORT I 31
The test, as in the past, was carried out with the support of an independent appraiser, based on the cash flows projected in the 2017 budget, approved by Board of Directors on December 6, 2016 on medium long term provision presented and on long-term projections developed by management.These documents reflect the best estimates of top management with regard to the main assumptions concerning the operating activities (macroeconomic and price trends, working hypothesis for operational assets and business environment development). These assumptions and the corresponding financials were deemed to be suitable for impairment test purposes by the Board of Directors, which approved the results on February 13, 2017.Consistent with previous years, the recoverable value was estimated based on value in use, using the so-called “financial method”.As regard impairment test on goodwill, the recoverable value (understood as value in use) was determined on the base of:• a medium-term plan’s projection horizon of four years and long-term projections developed by management
(2021-2024) to take into account the useful life utilized by the main assets, considering cash flows net of future developments (so-called inertial plan);
• an operating cash flow, duly normalized to reflect regular operating conditions and considering a nominal annual growth rate between 0% and 2% and a terminal value;
• simulations for different variables - such as the valuation assumptions for the capacity payment of the Electric Power Operations, the discount rate parameters, the growth rates and the non-discretional investments required to keep the Company operating at a normal level - and applying statistical simulation techniques (Montecarlo method).
The decrease of WACC discount rate is due to the reduction of risk free base rate linked to the current trends in European financial markets.Consistent with the cash flows described above, the discount rates applied were estimated by determining the weighted average cost of capital (WACC). Specifically, an estimated average after-tax rate was determined as follows:
Discount rates by Business Segment
12.31.2016 12.31.2015
2016 post 2016
Electric Power Operations 6.0% 6.2% 6.3%
Hydrocarbons Operations 7.1% 7.9% 8.0%
Overall, it should be noted the decrease of discount rate mainly due to the decrease of risk-free base rate, which reflects the medium term quotation detectable from financial markets, and, for the Hydrocarbons Operations, a decrease of the systematic risk parameter of the comparables.
Compared with the previous year, the impairment indicators related to the high volatility of the reference scenario (Brent prices, related commodities prices) and to the weak power Italian demand are confirmed. In detail:1) Hydrocarbons Operations:
a) Brent future prices, and the prices of the related commodities, in the medium term are supposed to be in line with end-2016 levels. In the short/medium term, prices are forecasted to grow, but at a slower rate than in the reference scenario used in 2015 impairment test.
b) The outlook for the gas market over the short/medium term is affected by expectations of low growth in international demand and an abundant supply on the European market, with prices on the Italian market tending to align with those of other European hubs that conduct to a revision of previous year scenario.
2) Electric Power Operations:a) The Italian electric power market also continues to suffer from a situation of over capacity as well as an
increasing contribution by renewables. The price quoted for electric power (PUN) over the short/medium term reflects the different price levels for fuel, which were down sharply with an impact on production profiles.

NOTES TO THE SEPARATE FINANCIAL STATEMENTS
32 I 2016 FINANCIAL REPORT
b) The unit margin in the thermoelectric sector is expected – in line with previous year’s impairment test – to be depressed in the short/medium term. In the long term, the decrease of national spare capacity will boost the margins to a profitability level faster than supposed in the 2015 reference scenario.
Statistical simulation tools (Montecarlo method) were assess some hypothesis may be affected by strong volatility: remuneration of the capacity payment, components of WACC, future growth rates.
In accordance with the process described above, the independent appraiser determined the recoverable value interval. Average recoverable value is higher than the carrying value so no writedown was recorded on the Goodwill.
In order to determine if the value of its property, plant and equipment and intangibles had been impaired, Edison tested the property, plant and equipment and intangibles held by the Company’s core businesses that could be identified as cash generating units. These assets are used for the production of electric power and hydrocarbons.Consistent with the previous year’s practice, the assets were aggregated in CGUs, defined by two factors relating on one side to the production source and the corresponding technology and from the other side to the current target market, also differentiating between reference countries.As was the case for the goodwill impairment test, the analysis was carried out by identifying the recoverable value (understood as value in use) of the CGUs, based on:• the economic-financial plans for each CGU with time horizons that reflect the useful lives of its assets, which,
until 2020, were those obtained from the Company’s medium-term plan;• the financial flows indicative of specific production profiles and prices and including eventual residual values• the post-tax cash flows for each CGU discounted using rates that were consistent with those applied when
testing goodwill for impairment.
The table below shows the main impairment indicators and the writedowns for group of CGUs.
Main impairment indicators and write-downs for group of CGU’s
Business segment/CGU Main impairment indicators Writedowns (in millions of euros)
Electric Power Operations
- Thermoelectric CGU Production profiles 2
Hydrocarbons Operations (*)
- Italian E&P CGU Scenario/Production profiles 180
Total Impairment test assets’ writedown 182
(*) of which write-down on concessions for 23 million of euros.

NOTES TO THE SEPARATE FINANCIAL STATEMENTS
2016 FINANCIAL REPORT I 33
18. Investments in Associates and Available-for-sale Investments - 1,382,634,000 euros
(in thousands of euros) Equity investments Available-for-sale investments
Total
Balance at 12/31/15 (A) 933,874 166,881 1,100,755
Changes in 2016:
- Disposals (-) (5,861) (2,907) (8,768)
- Acquisitions 418,143 - 418,143
- Changes in share capital and reserves 47,500 - 47,500
- Distribution of share capital and reserves (26,677) (6,129) (32,806)
- Coverage of losses - - -
- Revaluations (+)/writedowns (-) recognized in P&L (135,108) - (135,108)
- Other changes (-) (7,124) 42 (7,082)
Total changes (B) 290,873 (8,994) 281,879
Balance at 12/31/16 (A+B) 1,224,747 157,887 1,382,634
Breakdown:
- Historical cost 2,295,402 165,017 2,460,419
- Writedowns (-) (1,070,655) (7,130) (1,077,785)
Net carrying amount 1,224,747 157,887 1,382,634
As required by the Italian Civil Code, information about the changes that occurred during the year and detailed data about investments in subsidiaries, affiliated companies, joint ventures and other companies is provided in the schedule entitled “List of Equity Investments at December 31, 2016” annexed to these Separate Financial Statements. The main changes are reviewed below:• disposals include the sale of Termica Milazzo and RCS Mediagroup;• additions include the following transactions:
- 171,128,000 euros for the acquisition of Cellina Energy Srl, which owns a hydroelectric hub on the Cellina River, with concessions expiring in 2029. The hub includes 23 large and mini-hydro plants in the province of Pordenone, for a total installed capacity of 90 MW.
- 246,995,000 euros for the conveyance of Fenice Spa (a company that operates in the energy efficiency sector) by the controlling company Transalpina di Energia Spa, effective as of April 1, 2016, with regard to which the Board of Directors performed, with positive results, the required verifications regarding the valuation of the acquired equity investment. In order to carry out this conveyance in kind, the Extraordinary Shareholders’ Meeting of Edison Spa of March 22, 2016 approved a resolution for an in-kind share capital increase, for 247 million euros, as commented in “Note 24. Shareholders’ Equity.”
• The distribution of share capital and reserves refers to the distributions carried out by Termica Cologno (3,250,000 euros), Termica Milazzo (21,300,000 euros) and Terminale GNL Adriatico Srl (6,129,000 euros).
• Write-downs recognized in profit or loss reflect adjustments to the carrying values of some equity investments; as described earlier in note about impairment test, shareholder’s equity and net result are considered in the valuation of equity investments. It is worth to mention losses incurred as a result of the impairment test by the Edison International Holding NV subsidiary, which through its investee companies owns E&P activities in the UK, and the Edison International Spa subsidiary, which owns directly E&P activities in Egypt and Croatia and indirectly, through its subsidiary, in Norway;
• Other changes reflect primarily the effects of the merger by absorption of Shen Spa, a company that owns a hydroelectric power plant on the bank of the Adda River in the municipality of Maleo (LO).
19. Other Financial Assets - 11,451,000 eurosThis item, the balance of which was unchanged compared with December 31, 2015, includes loans receivable with a maturity of more than 12 months.
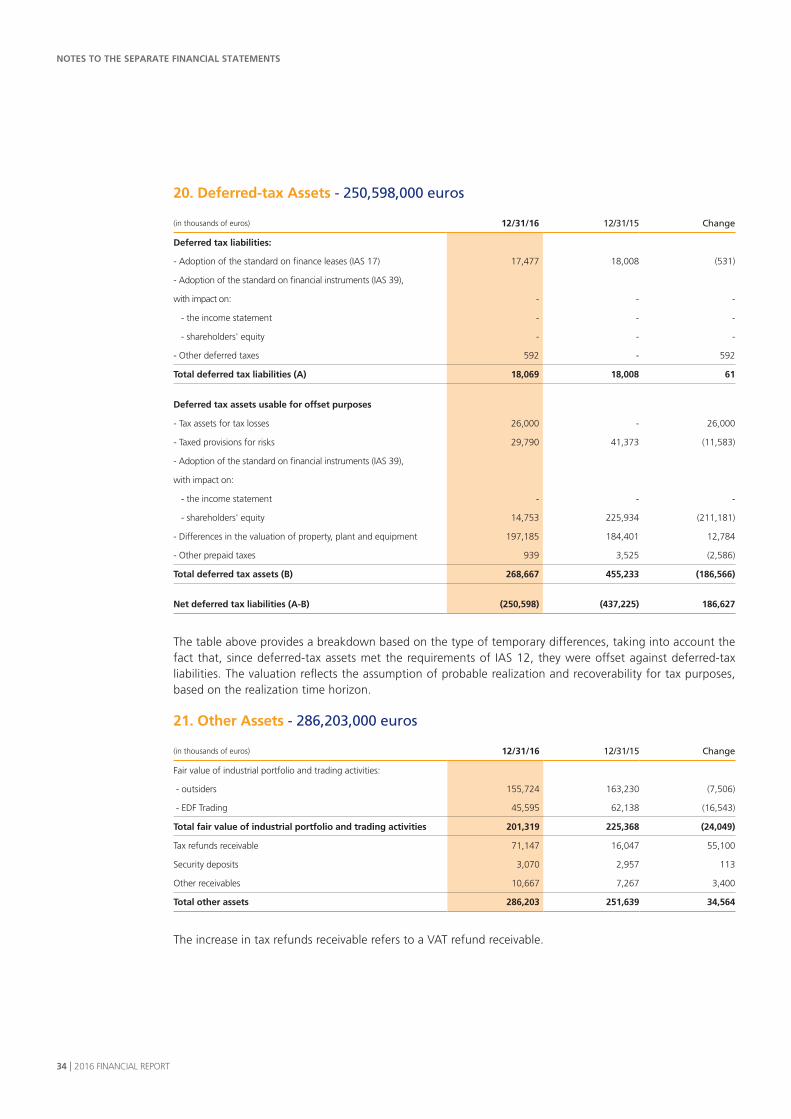
NOTES TO THE SEPARATE FINANCIAL STATEMENTS
34 I 2016 FINANCIAL REPORT
20. Deferred-tax Assets - 250,598,000 euros
(in thousands of euros) 12/31/16 12/31/15 Change
Deferred tax liabilities:
- Adoption of the standard on finance leases (IAS 17) 17,477 18,008 (531)
- Adoption of the standard on financial instruments (IAS 39),
with impact on: - - -
- the income statement - - -
- shareholders' equity - - -
- Other deferred taxes 592 - 592
Total deferred tax liabilities (A) 18,069 18,008 61
Deferred tax assets usable for offset purposes
- Tax assets for tax losses 26,000 - 26,000
- Taxed provisions for risks 29,790 41,373 (11,583)
- Adoption of the standard on financial instruments (IAS 39),
with impact on:
- the income statement - - -
- shareholders' equity 14,753 225,934 (211,181)
- Differences in the valuation of property, plant and equipment 197,185 184,401 12,784
- Other prepaid taxes 939 3,525 (2,586)
Total deferred tax assets (B) 268,667 455,233 (186,566)
Net deferred tax liabilities (A-B) (250,598) (437,225) 186,627
The table above provides a breakdown based on the type of temporary differences, taking into account the fact that, since deferred-tax assets met the requirements of IAS 12, they were offset against deferred-tax liabilities. The valuation reflects the assumption of probable realization and recoverability for tax purposes, based on the realization time horizon.
21. Other Assets - 286,203,000 euros
(in thousands of euros) 12/31/16 12/31/15 Change
Fair value of industrial portfolio and trading activities:
- outsiders 155,724 163,230 (7,506)
- EDF Trading 45,595 62,138 (16,543)
Total fair value of industrial portfolio and trading activities 201,319 225,368 (24,049)
Tax refunds receivable 71,147 16,047 55,100
Security deposits 3,070 2,957 113
Other receivables 10,667 7,267 3,400
Total other assets 286,203 251,639 34,564
The increase in tax refunds receivable refers to a VAT refund receivable.
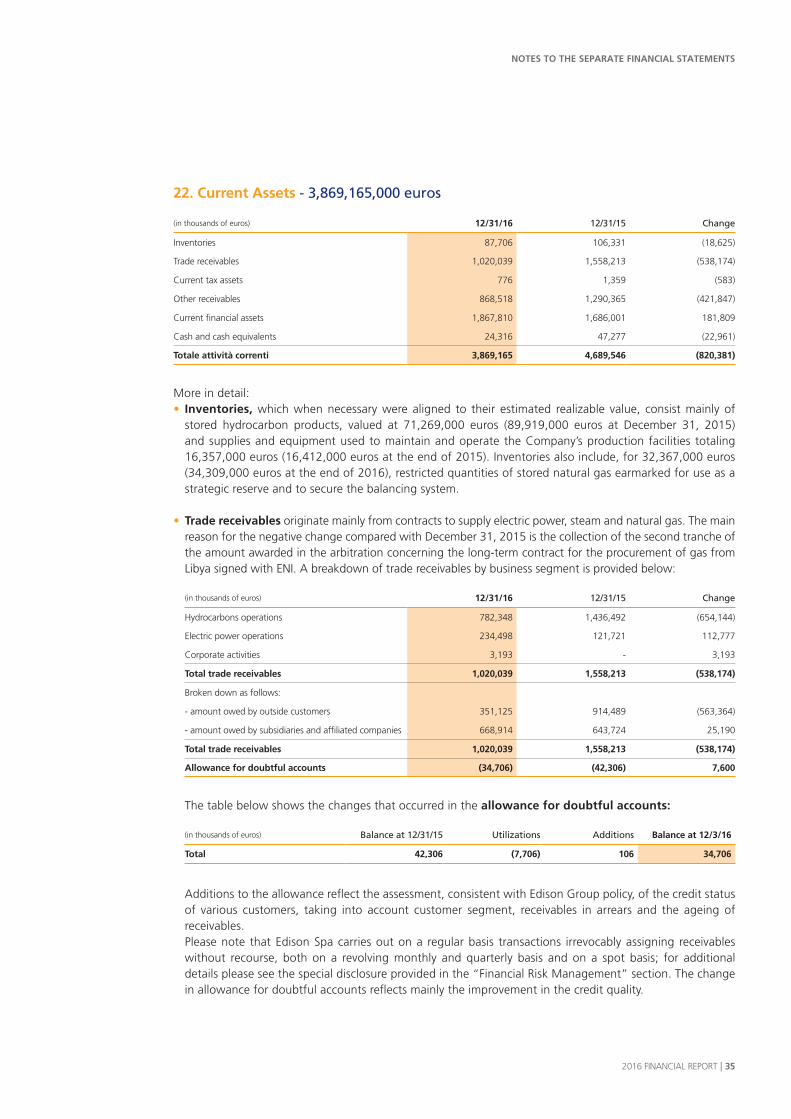
NOTES TO THE SEPARATE FINANCIAL STATEMENTS
2016 FINANCIAL REPORT I 35
22. Current Assets - 3,869,165,000 euros
(in thousands of euros) 12/31/16 12/31/15 Change
Inventories 87,706 106,331 (18,625)
Trade receivables 1,020,039 1,558,213 (538,174)
Current tax assets 776 1,359 (583)
Other receivables 868,518 1,290,365 (421,847)
Current financial assets 1,867,810 1,686,001 181,809
Cash and cash equivalents 24,316 47,277 (22,961)
Totale attività correnti 3,869,165 4,689,546 (820,381)
More in detail:• Inventories, which when necessary were aligned to their estimated realizable value, consist mainly of
stored hydrocarbon products, valued at 71,269,000 euros (89,919,000 euros at December 31, 2015) and supplies and equipment used to maintain and operate the Company’s production facilities totaling 16,357,000 euros (16,412,000 euros at the end of 2015). Inventories also include, for 32,367,000 euros (34,309,000 euros at the end of 2016), restricted quantities of stored natural gas earmarked for use as a strategic reserve and to secure the balancing system.
• Trade receivables originate mainly from contracts to supply electric power, steam and natural gas. The main reason for the negative change compared with December 31, 2015 is the collection of the second tranche of the amount awarded in the arbitration concerning the long-term contract for the procurement of gas from Libya signed with ENI. A breakdown of trade receivables by business segment is provided below:
(in thousands of euros) 12/31/16 12/31/15 Change
Hydrocarbons operations 782,348 1,436,492 (654,144)
Electric power operations 234,498 121,721 112,777
Corporate activities 3,193 - 3,193
Total trade receivables 1,020,039 1,558,213 (538,174)
Broken down as follows:
- amount owed by outside customers 351,125 914,489 (563,364)
- amount owed by subsidiaries and affiliated companies 668,914 643,724 25,190
Total trade receivables 1,020,039 1,558,213 (538,174)
Allowance for doubtful accounts (34,706) (42,306) 7,600
The table below shows the changes that occurred in the allowance for doubtful accounts:
(in thousands of euros) Balance at 12/31/15 Utilizations Additions Balance at 12/3/16
Total 42,306 (7,706) 106 34,706
Additions to the allowance reflect the assessment, consistent with Edison Group policy, of the credit status of various customers, taking into account customer segment, receivables in arrears and the ageing of receivables.Please note that Edison Spa carries out on a regular basis transactions irrevocably assigning receivables without recourse, both on a revolving monthly and quarterly basis and on a spot basis; for additional details please see the special disclosure provided in the “Financial Risk Management” section. The change in allowance for doubtful accounts reflects mainly the improvement in the credit quality.

NOTES TO THE SEPARATE FINANCIAL STATEMENTS
36 I 2016 FINANCIAL REPORT
The table that follows provides a breakdown of receivables owed by subsidiaries and affiliated companies:
(in thousands of euros) 12/31/16 12/31/15 Change
Subsidiaries
Edison Energia 435,227 508,121 (72,894)
Edison Trading 232,467 128,247 104,220
Edison International 767 307 460
Termica Cologno 155 145 10
Edison Idricarburi Sicilia 102 46 56
Edison Stoccaggio 49 275 (226)
Termica Milazzo - 6,209 (6,209)
Edison E&P UK - 80 (80)
Other companies 7 25 (18)
Total subsidiaries (A) 668,774 643,455 25,319
Joint ventures and affiliated companies
Prometeo 140 269 (129)
Total joint ventures and affiliated companies (B) 140 269 (129)
Total (A+B) 668,914 643,724 25,190
• Current-tax assets is referred to receivable from the revenue administration for Robin Hood IRES.
• A breakdown of other receivables is provided below:
(in thousands of euros) 12/31/16 12/31/15 Change
Fair value of industrial portfolio and trading activities
- outsiders 378,762 783,146 (404,384)
- subsidiaries 11,188 155,488 (144,300)
- EDF Trading 89,777 65,261 24,516
Total fair value of industrial portfolio and trading activities 479,727 1,003,895 (524,168)
Receivables from Transalpina di Energia Spa - consolidated income tax return 46,515 - 46,515
Amounts owed by partners and assoc. in hydrocarbon exploration projects 15,827 25,826 (9,999)
Provision of technical, admin. and financial services to Group companies 59,578 36,429 23,149
VAT receivable from the tax administration 168,346 126,208 42,138
VAT pool receivables 7,548 10,001 (2,453)
Sundry items 90,977 88,006 2,971
Total other receivables 868,518 1,290,365 (421,847)
Broken down as follows:
- amount owed by outsiders 779,209 1,088,537 (309,328)
- amount owed by subsidiaries and affiliated companies 89,309 201,828 (112,519)
Total other receivables 868,518 1,290,365 (421,847)
amount of allowance for doubtful accounts (4,760) (16,328) 11,568
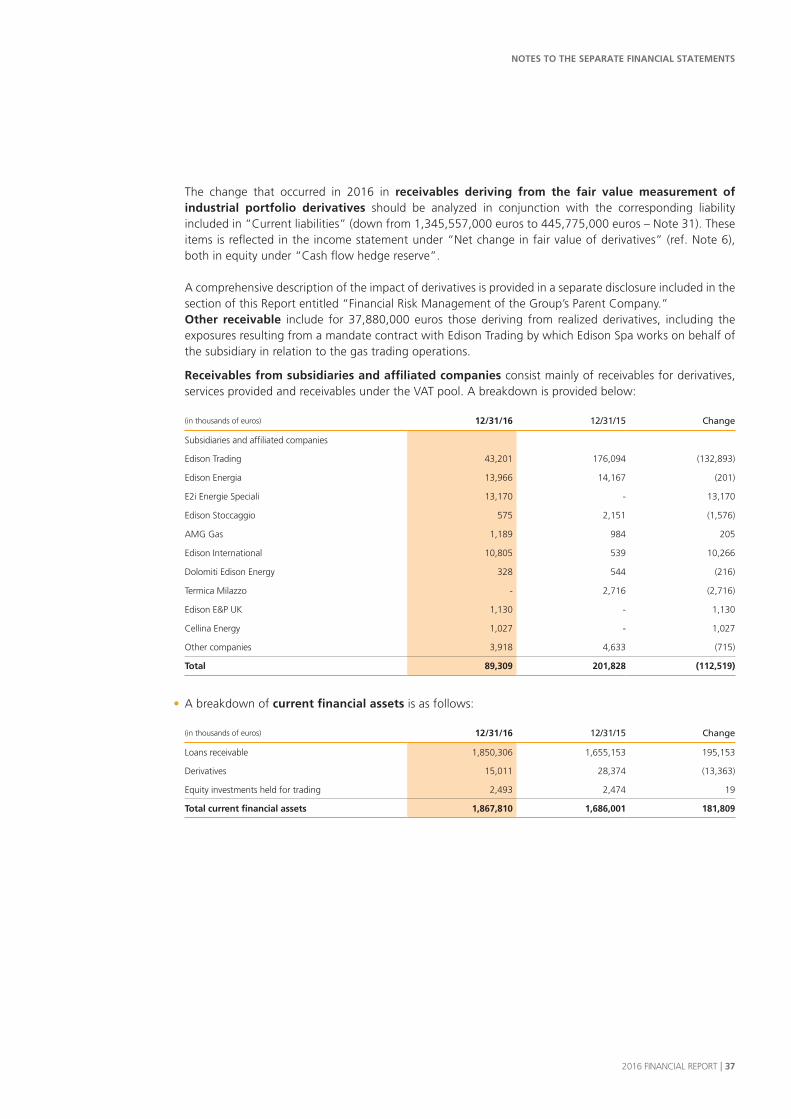
NOTES TO THE SEPARATE FINANCIAL STATEMENTS
2016 FINANCIAL REPORT I 37
The change that occurred in 2016 in receivables deriving from the fair value measurement of industrial portfolio derivatives should be analyzed in conjunction with the corresponding liability included in “Current liabilities” (down from 1,345,557,000 euros to 445,775,000 euros – Note 31). These items is reflected in the income statement under “Net change in fair value of derivatives” (ref. Note 6), both in equity under “Cash flow hedge reserve”.
A comprehensive description of the impact of derivatives is provided in a separate disclosure included in the section of this Report entitled “Financial Risk Management of the Group’s Parent Company.” Other receivable include for 37,880,000 euros those deriving from realized derivatives, including the exposures resulting from a mandate contract with Edison Trading by which Edison Spa works on behalf of the subsidiary in relation to the gas trading operations.
Receivables from subsidiaries and affiliated companies consist mainly of receivables for derivatives, services provided and receivables under the VAT pool. A breakdown is provided below:
(in thousands of euros) 12/31/16 12/31/15 Change
Subsidiaries and affiliated companies
Edison Trading 43,201 176,094 (132,893)
Edison Energia 13,966 14,167 (201)
E2i Energie Speciali 13,170 - 13,170
Edison Stoccaggio 575 2,151 (1,576)
AMG Gas 1,189 984 205
Edison International 10,805 539 10,266
Dolomiti Edison Energy 328 544 (216)
Termica Milazzo - 2,716 (2,716)
Edison E&P UK 1,130 - 1,130
Cellina Energy 1,027 - 1,027
Other companies 3,918 4,633 (715)
Total 89,309 201,828 (112,519)
• A breakdown of current financial assets is as follows:
(in thousands of euros) 12/31/16 12/31/15 Change
Loans receivable 1,850,306 1,655,153 195,153
Derivatives 15,011 28,374 (13,363)
Equity investments held for trading 2,493 2,474 19
Total current financial assets 1,867,810 1,686,001 181,809
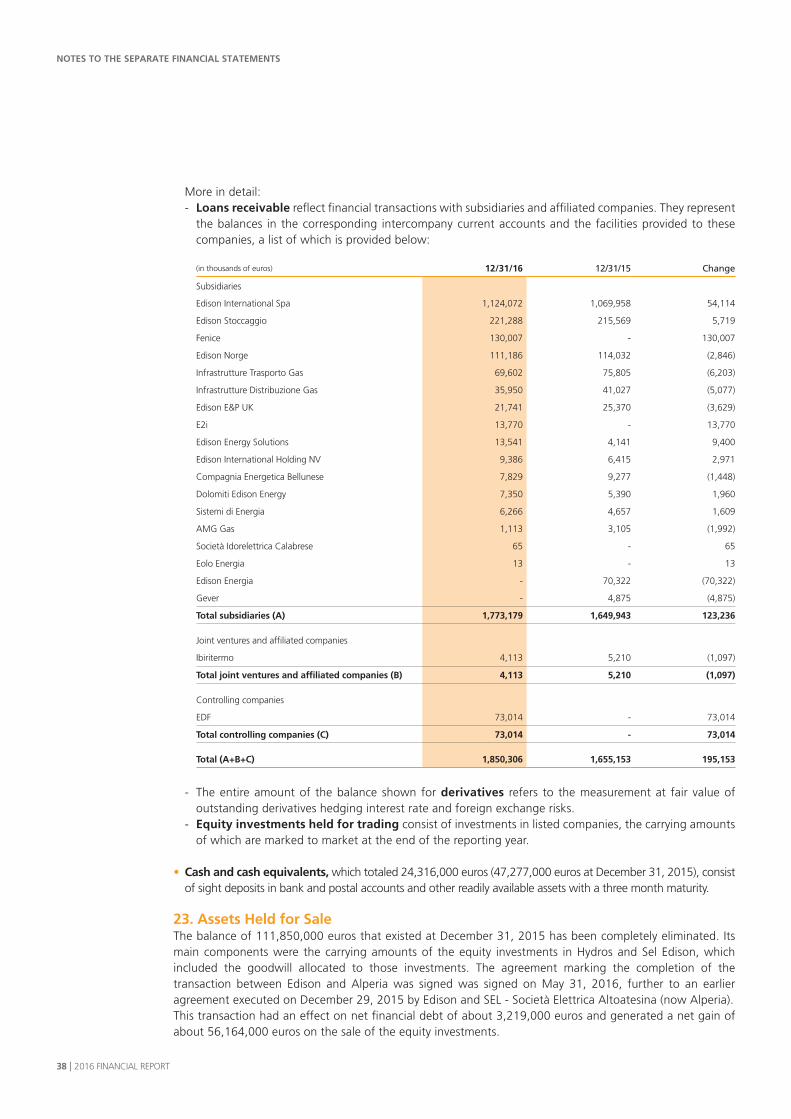
NOTES TO THE SEPARATE FINANCIAL STATEMENTS
38 I 2016 FINANCIAL REPORT
More in detail:- Loans receivable reflect financial transactions with subsidiaries and affiliated companies. They represent
the balances in the corresponding intercompany current accounts and the facilities provided to these companies, a list of which is provided below:
(in thousands of euros) 12/31/16 12/31/15 Change
Subsidiaries
Edison International Spa 1,124,072 1,069,958 54,114
Edison Stoccaggio 221,288 215,569 5,719
Fenice 130,007 - 130,007
Edison Norge 111,186 114,032 (2,846)
Infrastrutture Trasporto Gas 69,602 75,805 (6,203)
Infrastrutture Distribuzione Gas 35,950 41,027 (5,077)
Edison E&P UK 21,741 25,370 (3,629)
E2i 13,770 - 13,770
Edison Energy Solutions 13,541 4,141 9,400
Edison International Holding NV 9,386 6,415 2,971
Compagnia Energetica Bellunese 7,829 9,277 (1,448)
Dolomiti Edison Energy 7,350 5,390 1,960
Sistemi di Energia 6,266 4,657 1,609
AMG Gas 1,113 3,105 (1,992)
Società Idorelettrica Calabrese 65 - 65
Eolo Energia 13 - 13
Edison Energia - 70,322 (70,322)
Gever - 4,875 (4,875)
Total subsidiaries (A) 1,773,179 1,649,943 123,236
Joint ventures and affiliated companies
Ibiritermo 4,113 5,210 (1,097)
Total joint ventures and affiliated companies (B) 4,113 5,210 (1,097)
Controlling companies
EDF 73,014 - 73,014
Total controlling companies (C) 73,014 - 73,014
Total (A+B+C) 1,850,306 1,655,153 195,153
- The entire amount of the balance shown for derivatives refers to the measurement at fair value of outstanding derivatives hedging interest rate and foreign exchange risks.
- Equity investments held for trading consist of investments in listed companies, the carrying amounts of which are marked to market at the end of the reporting year.
• Cash and cash equivalents, which totaled 24,316,000 euros (47,277,000 euros at December 31, 2015), consist of sight deposits in bank and postal accounts and other readily available assets with a three month maturity.
23. Assets Held for Sale The balance of 111,850,000 euros that existed at December 31, 2015 has been completely eliminated. Its main components were the carrying amounts of the equity investments in Hydros and Sel Edison, which included the goodwill allocated to those investments. The agreement marking the completion of the transaction between Edison and Alperia was signed was signed on May 31, 2016, further to an earlier agreement executed on December 29, 2015 by Edison and SEL - Società Elettrica Altoatesina (now Alperia). This transaction had an effect on net financial debt of about 3,219,000 euros and generated a net gain of about 56,164,000 euros on the sale of the equity investments.
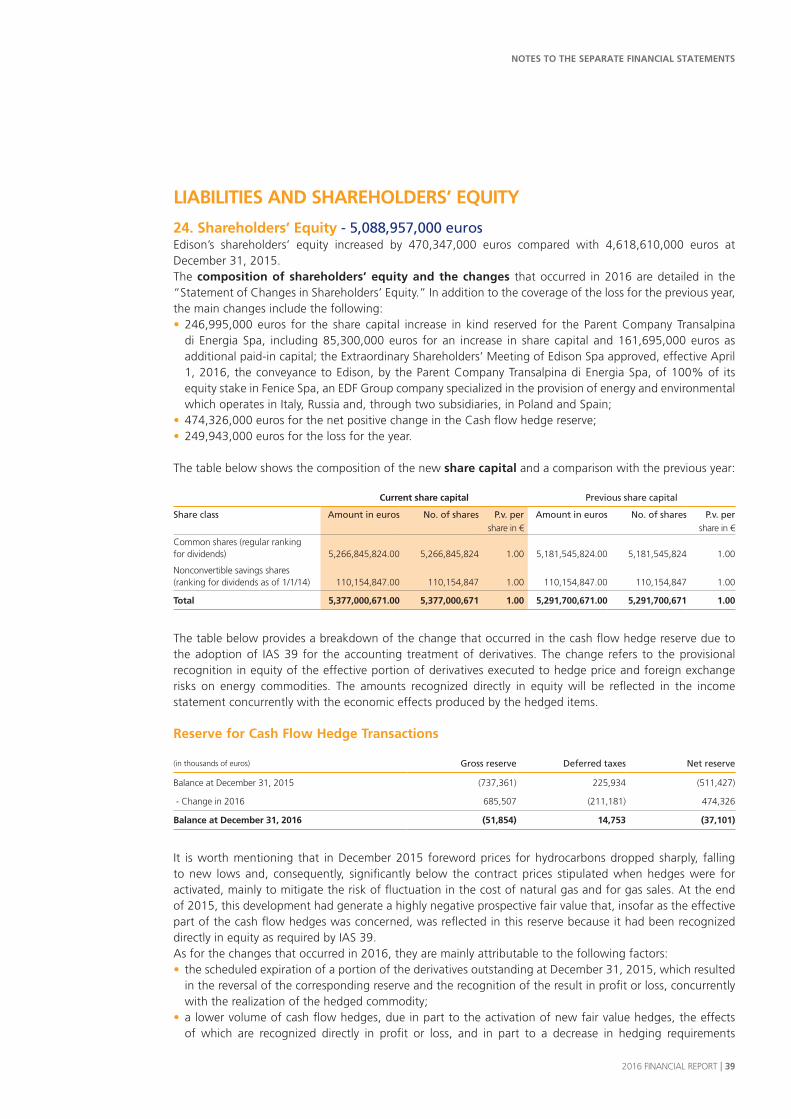
NOTES TO THE SEPARATE FINANCIAL STATEMENTS
2016 FINANCIAL REPORT I 39
LIABILITIES AND SHAREHOLDERS’ EQUITY
24. Shareholders’ Equity - 5,088,957,000 eurosEdison’s shareholders’ equity increased by 470,347,000 euros compared with 4,618,610,000 euros at December 31, 2015.The composition of shareholders’ equity and the changes that occurred in 2016 are detailed in the “Statement of Changes in Shareholders’ Equity.” In addition to the coverage of the loss for the previous year, the main changes include the following:• 246,995,000 euros for the share capital increase in kind reserved for the Parent Company Transalpina
di Energia Spa, including 85,300,000 euros for an increase in share capital and 161,695,000 euros as additional paid-in capital; the Extraordinary Shareholders’ Meeting of Edison Spa approved, effective April 1, 2016, the conveyance to Edison, by the Parent Company Transalpina di Energia Spa, of 100% of its equity stake in Fenice Spa, an EDF Group company specialized in the provision of energy and environmental which operates in Italy, Russia and, through two subsidiaries, in Poland and Spain;
• 474,326,000 euros for the net positive change in the Cash flow hedge reserve;• 249,943,000 euros for the loss for the year. The table below shows the composition of the new share capital and a comparison with the previous year:
Current share capital Previous share capital
Share class Amount in euros No. of shares P.v. per Amount in euros No. of shares P.v. pershare in € share in €
Common shares (regular ranking for dividends) 5,266,845,824.00 5,266,845,824 1.00 5,181,545,824.00 5,181,545,824 1.00
Nonconvertible savings shares (ranking for dividends as of 1/1/14) 110,154,847.00 110,154,847 1.00 110,154,847.00 110,154,847 1.00
Total 5,377,000,671.00 5,377,000,671 1.00 5,291,700,671.00 5,291,700,671 1.00
The table below provides a breakdown of the change that occurred in the cash flow hedge reserve due to the adoption of IAS 39 for the accounting treatment of derivatives. The change refers to the provisional recognition in equity of the effective portion of derivatives executed to hedge price and foreign exchange risks on energy commodities. The amounts recognized directly in equity will be reflected in the income statement concurrently with the economic effects produced by the hedged items.
Reserve for Cash Flow Hedge Transactions
(in thousands of euros) Gross reserve Deferred taxes Net reserve
Balance at December 31, 2015 (737,361) 225,934 (511,427)
- Change in 2016 685,507 (211,181) 474,326
Balance at December 31, 2016 (51,854) 14,753 (37,101)
It is worth mentioning that in December 2015 foreword prices for hydrocarbons dropped sharply, falling to new lows and, consequently, significantly below the contract prices stipulated when hedges were for activated, mainly to mitigate the risk of fluctuation in the cost of natural gas and for gas sales. At the end of 2015, this development had generate a highly negative prospective fair value that, insofar as the effective part of the cash flow hedges was concerned, was reflected in this reserve because it had been recognized directly in equity as required by IAS 39.As for the changes that occurred in 2016, they are mainly attributable to the following factors:• the scheduled expiration of a portion of the derivatives outstanding at December 31, 2015, which resulted
in the reversal of the corresponding reserve and the recognition of the result in profit or loss, concurrently with the realization of the hedged commodity;
• a lower volume of cash flow hedges, due in part to the activation of new fair value hedges, the effects of which are recognized directly in profit or loss, and in part to a decrease in hedging requirements

NOTES TO THE SEPARATE FINANCIAL STATEMENTS
40 I 2016 FINANCIAL REPORT
resulting from the agreements stipulated during the year with regard to some long-term contracts for the procurement of natural gas;
• the stabilizing of foreword prices at levels in line with contract prices.
For additional information, see the chapter entitled “Financial Risk Management.”
Reserve for actuarial gains and losses (IAS 19)
(in thousands of euros) Reserve
Balance at December 31, 2015 (683)
- Change in 2016 (266)
Balance at December 31, 2016 (949)
25. Provision for Employee Severance Indemnities and Provisions for Pensions - 20,722,000 euros
(in thousands of euros)
Balance at December 31, 2015 (A) 21,672
Changes in 2015
- Utilizations (-) (2,391)
- Discounting (gains) losses (+/-) 949
- Financial expense (+) 492
Total changes (B ) (950)
Balance at December 31, 2016 (A+B) 20,722
This provision reflects the accrued severance indemnities and other benefits owed to employees at the end of the reporting period. Actuarial gains and losses, the net amount of which was 949,000 euros (683,000 euros at December 31, 2015), are recognized directly in equity. An actuarial valuation in accordance with IAS 19 was performed only for the liability corresponding to the Provision for employee severance indemnities that is still held by the Company. The parameters used for this valuation are as follows:
12/31/16 12/31/15
- Technical annual discount rate 1.90% 2.40%
- Annual inflation rate 1.00% 0.60%
26. Provision for Deferred TaxesSince it met the requirements of IAS 12, this item was offset against available deferred-tax assets. Please see the note on deferred-tax assets for additional information.
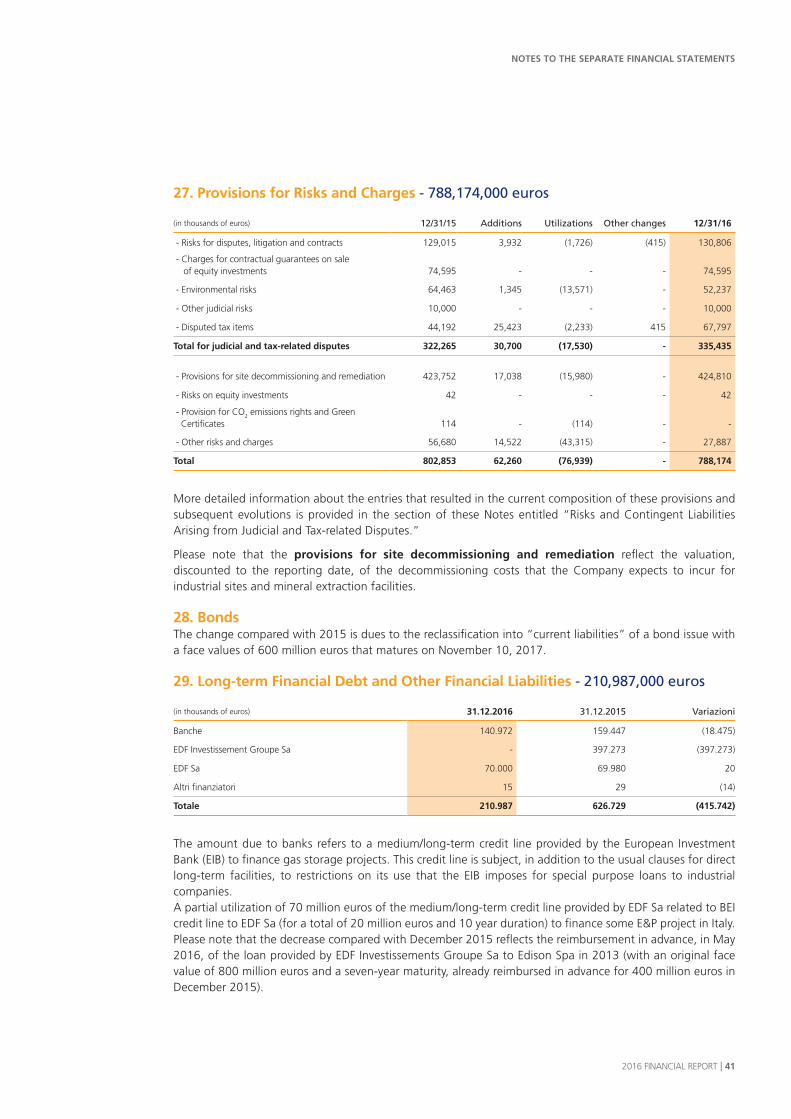
NOTES TO THE SEPARATE FINANCIAL STATEMENTS
2016 FINANCIAL REPORT I 41
27. Provisions for Risks and Charges - 788,174,000 euros
(in thousands of euros) 12/31/15 Additions Utilizations Other changes 12/31/16
- Risks for disputes, litigation and contracts 129,015 3,932 (1,726) (415) 130,806
- Charges for contractual guarantees on sale of equity investments 74,595 - - - 74,595
- Environmental risks 64,463 1,345 (13,571) - 52,237
- Other judicial risks 10,000 - - - 10,000
- Disputed tax items 44,192 25,423 (2,233) 415 67,797
Total for judicial and tax-related disputes 322,265 30,700 (17,530) - 335,435
- Provisions for site decommissioning and remediation 423,752 17,038 (15,980) - 424,810
- Risks on equity investments 42 - - - 42
- Provision for CO2 emissions rights and Green Certificates 114 - (114) - -
- Other risks and charges 56,680 14,522 (43,315) - 27,887
Total 802,853 62,260 (76,939) - 788,174
More detailed information about the entries that resulted in the current composition of these provisions and subsequent evolutions is provided in the section of these Notes entitled “Risks and Contingent Liabilities Arising from Judicial and Tax-related Disputes.”
Please note that the provisions for site decommissioning and remediation reflect the valuation, discounted to the reporting date, of the decommissioning costs that the Company expects to incur for industrial sites and mineral extraction facilities.
28. Bonds The change compared with 2015 is dues to the reclassification into “current liabilities” of a bond issue with a face values of 600 million euros that matures on November 10, 2017.
29. Long-term Financial Debt and Other Financial Liabilities - 210,987,000 euros
(in thousands of euros) 31.12.2016 31.12.2015 Variazioni
Banche 140.972 159.447 (18.475)
EDF Investissement Groupe Sa - 397.273 (397.273)
EDF Sa 70.000 69.980 20
Altri finanziatori 15 29 (14)
Totale 210.987 626.729 (415.742)
The amount due to banks refers to a medium/long-term credit line provided by the European Investment Bank (EIB) to finance gas storage projects. This credit line is subject, in addition to the usual clauses for direct long-term facilities, to restrictions on its use that the EIB imposes for special purpose loans to industrial companies.A partial utilization of 70 million euros of the medium/long-term credit line provided by EDF Sa related to BEI credit line to EDF Sa (for a total of 20 million euros and 10 year duration) to finance some E&P project in Italy.Please note that the decrease compared with December 2015 reflects the reimbursement in advance, in May 2016, of the loan provided by EDF Investissements Groupe Sa to Edison Spa in 2013 (with an original face value of 800 million euros and a seven-year maturity, already reimbursed in advance for 400 million euros in December 2015).
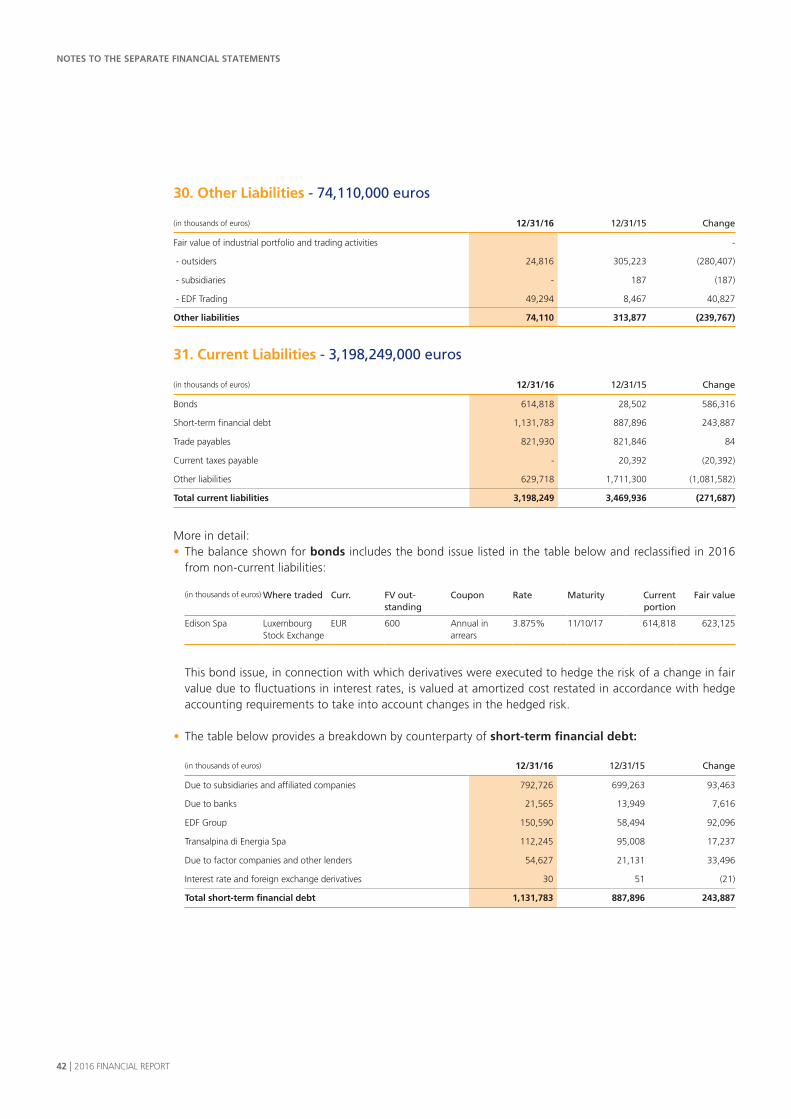
NOTES TO THE SEPARATE FINANCIAL STATEMENTS
42 I 2016 FINANCIAL REPORT
30. Other Liabilities - 74,110,000 euros
(in thousands of euros) 12/31/16 12/31/15 Change
Fair value of industrial portfolio and trading activities -
- outsiders 24,816 305,223 (280,407)
- subsidiaries - 187 (187)
- EDF Trading 49,294 8,467 40,827
Other liabilities 74,110 313,877 (239,767)
31. Current Liabilities - 3,198,249,000 euros
(in thousands of euros) 12/31/16 12/31/15 Change
Bonds 614,818 28,502 586,316
Short-term financial debt 1,131,783 887,896 243,887
Trade payables 821,930 821,846 84
Current taxes payable - 20,392 (20,392)
Other liabilities 629,718 1,711,300 (1,081,582)
Total current liabilities 3,198,249 3,469,936 (271,687)
More in detail:• The balance shown for bonds includes the bond issue listed in the table below and reclassified in 2016
from non-current liabilities:
(in thousands of euros) Where traded Curr. FV out-standing
Coupon Rate Maturity Current portion
Fair value
Edison Spa Luxembourg Stock Exchange
EUR 600 Annual in arrears
3.875% 11/10/17 614,818 623,125
This bond issue, in connection with which derivatives were executed to hedge the risk of a change in fair value due to fluctuations in interest rates, is valued at amortized cost restated in accordance with hedge accounting requirements to take into account changes in the hedged risk.
• The table below provides a breakdown by counterparty of short-term financial debt:
(in thousands of euros) 12/31/16 12/31/15 Change
Due to subsidiaries and affiliated companies 792,726 699,263 93,463
Due to banks 21,565 13,949 7,616
EDF Group 150,590 58,494 92,096
Transalpina di Energia Spa 112,245 95,008 17,237
Due to factor companies and other lenders 54,627 21,131 33,496
Interest rate and foreign exchange derivatives 30 51 (21)
Total short-term financial debt 1,131,783 887,896 243,887

NOTES TO THE SEPARATE FINANCIAL STATEMENTS
2016 FINANCIAL REPORT I 43
The table below shows the amounts owed to subsidiaries and affiliated companies:
(in thousands of euros) 31/12/16 31/12/15 Change
Edison Trading 474,290 530,312 (56,022)
Edison Energia 103,213 - 103,213
Edison International Holding NV 70,078 47,668 22,410
Cellina Energy 40,084 - 40,084
Fenice 31,810 - 31,810
Edison Partecipazioni Energie Rinnovabili 17,400 35,210 (17,810)
Termica Milazzo - 23,773 (23,773)
Edison Idrocarburi Sicilia 10,598 18,325 (7,727)
Other subsidiaries 45,253 43,975 1,278
Total subsidiaries 792,726 699,263 93,463
• Trade payables originate primarily from natural gas purchases under long-term contracts. A breakdown by business segment is provided below:
(in thousands of euros) 12/31/16 12/31/15 Change
Hydrocarbons 638,262 700,175 (61,913)
Electric power 155,417 76,510 78,907
Corporate 28,251 45,161 (16,910)
Total trade payables 821,930 821,846 84
Breakdown:
- outsiders 786,616 786,620 (4)
- subsidiaries and affiliated companies 35,314 35,226 88
Total trade payables 821,930 821,846 84
The table below shows the amounts owed to subsidiaries and affiliated companies:
(in thousands of euros) 12/31/16 12/31/15 Change
E2i Energie Speciali 5,787 9,784 (3,997)
Edison Trading 27,877 21,375 6,502
Other companies 1,650 4,067 (2,417)
Total 35,314 35,226 2,505

NOTES TO THE SEPARATE FINANCIAL STATEMENTS
44 I 2016 FINANCIAL REPORT
• The current tax liabilities account had a zero balance due to payments made during the year.
• A breakdown of Other liabilities is provided below:
(in thousands of euros) 12/31/16 12/31/15 Change
Fair value of industrial portfolio and trading activities:
- outsiders 397,914 1,302,836 (904,922)
- subsidiaries 1,421 14,613 (13,192)
- EDF Trading 46,440 28,108 18,332
Total fair value of industrial portfolio and trading activities: 445,775 1,345,557 (899,782)
Joint holders of permits and concessions for the production of hydrocarbons 28,471 59,787 (31,316)
Amounts payable to employees 24,205 21,914 2,291
Due to pension and social security institutions 16,809 16,492 317
Payables for VAT in pool with subsidiaries 811 2,511 (1,700)
Due to Transalpina di Energia Spa - consolidated tax return - 153,082 (153,082)
Sundry items 113,647 111,957 1,690
Total other liabilities 629,718 1,711,300 (1,081,582)
Breakdown:
- outsiders 625,637 1,687,478 (1,061,841)
- subsidiaries and affiliated companies 4,081 23,822 (19,741)
Totale 629,718 1,711,300 (1,081,582)
The change in liabilities from the measurement at fair value of derivatives executed to hedge the industrial portfolio should be analyzed in conjunction with the corresponding receivable included in current assets, which decreased from 1,003,895,000 euros to 479,727,000 euros) (Nota 22). As above mentioned, these items is reflected in the income statement under “Net change in fair value of derivatives” (ref. Note 6), both in equity under “Cash flow hedge reserve”.
Other liabilities reflect, for 83,999,000 euros, the amounts of realized derivatives, which include the exposures resulting from a mandate contract with Edison Trading by which Edison Spa works on behalf of the subsidiary in relation to the gas trading operations.
The amount owed to the controlling company Transalpina di Energia under the consolidated tax return was settled during the year.
Other liabilities towards subsidiaries and affiliated companies refer mainly to liabilities deriving from derivative transactions and the VAT pool. A breakdown is provided below:
(in thousands of euros) 12/31/16 12/31/15 Change
Subsidiaries
Edison Trading 2,294 17,450 (15,156)
Edison Energia 618 3,194 (2,576)
Edison Idrocarburi Sicilia 571 571 -
Gever - 546 (546)
Other companies 598 2,061 (1,463)
Total 4,081 23,822 (19,741)
32. Liabilities Held for SaleThis account had a zero at December 31, 2016. The balance at December 31, 2015 included trade payables owed to Hydros and Sel Edison. See the section entitled “Disclosure Pursuant to IFRS 5 – Disposal Group.”

NOTES TO THE SEPARATE FINANCIAL STATEMENTS
2016 FINANCIAL REPORT I 45
NET FINANCIAL DEBT
(in millions of euros) Note 12/31/16 12/31/15 Change
Bonds – non-current portion 28 - 599 (599)
Amounts due to other lenders – non-current portion 29 70 467 (397)
Non-current bank loans 29 141 160 (19)
Net long-term financial debt 211 1,226 (1,015)
Bonds – current portion 31 615 29 586
Current loans payable 31 1,132 888 244
Current financial assets 22 (1,868) (1,686) (109)
Cash and cash equivalents 22 (24) (47) 23
Net short-term financial debt (145) (816) 744
Total net financial debt 66 410 (271)
Net financial debt totaled 66 million euros at December 31, 2016, compared with net financial debt of 410 million euros at December 31, 2015.The aggregate change reflects primarily the impact of working capital dynamics, specifically regarding the collection of the second tranche of the gain generated by the award in the ENI arbitration. The amount thus collected made it possible to repay, at the end of May 2016, the remaining balance of 400 million euros (400 million euros had been repaid in 2015) owed on the facility provided by EDF Investissements Groupe Sa, thereby significantly reducing long-term debt.The change shown for bonds, maturing on October 10, 2017, is due to their reclassification from non-current to current,This item also includes the effects of the outlays for net investments in property, plant and equipment, intangibles and equity investments (145 million euros), income taxes paid within the framework of the consolidated income tax return filed together with the Parent Company Transalpina di Energia (170 million euros) and net financial expense paid (6 million euros), offset in part by the collection of dividends (211 million euros) and capital distributions by Group companies (33 million euros). Net financial debt includes the following items:• 148 million euros in net indebtedness owed to EDF Group companies, including:
- 70 million euros in non-current debt owed to other lenders;- 151 million euros in current financial debt;- 73 million euros in current financial assets.
• 112 million euros in debt owed to the parent company Transalpina di Energia, carried as current financial debt.
These amounts are also listed in a special table included in the section of these Notes entitled “Intercompany and Related-Party Transactions.”
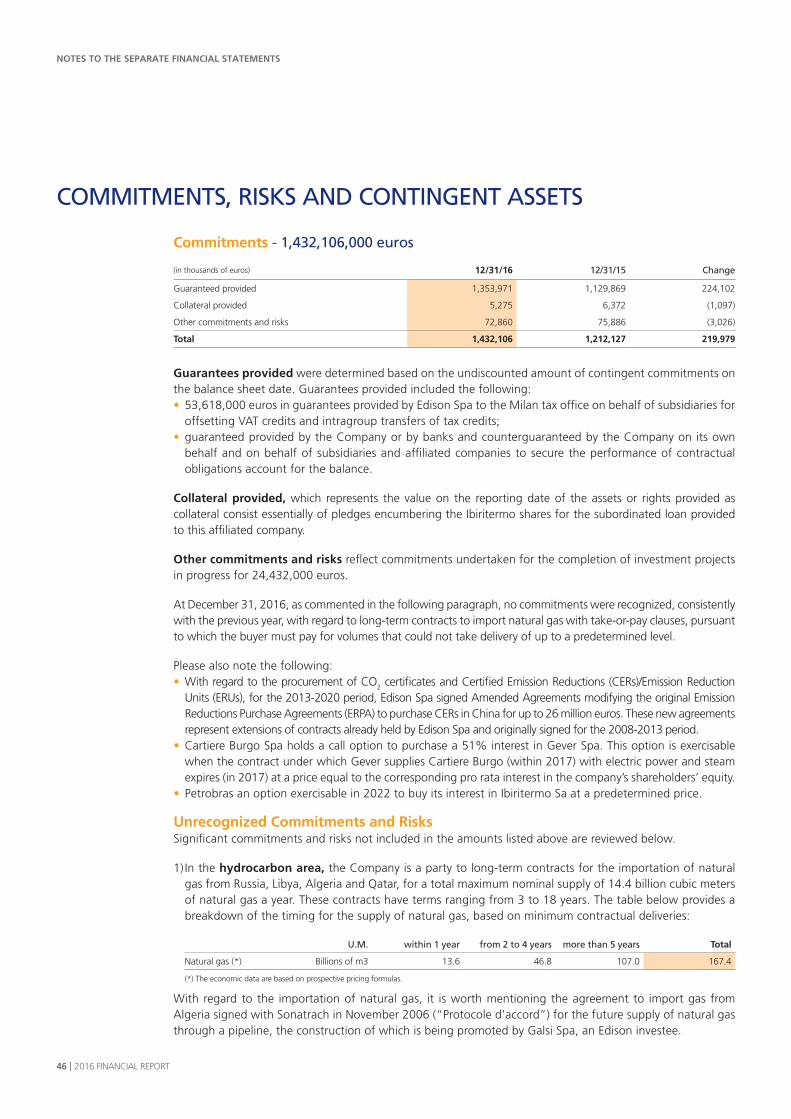
NOTES TO THE SEPARATE FINANCIAL STATEMENTS
46 I 2016 FINANCIAL REPORT
COMMITMENTS, RISKS AND CONTINGENT ASSETS
Commitments - 1,432,106,000 euros
(in thousands of euros) 12/31/16 12/31/15 Change
Guaranteed provided 1,353,971 1,129,869 224,102
Collateral provided 5,275 6,372 (1,097)
Other commitments and risks 72,860 75,886 (3,026)
Total 1,432,106 1,212,127 219,979
Guarantees provided were determined based on the undiscounted amount of contingent commitments on the balance sheet date. Guarantees provided included the following:• 53,618,000 euros in guarantees provided by Edison Spa to the Milan tax office on behalf of subsidiaries for
offsetting VAT credits and intragroup transfers of tax credits;• guaranteed provided by the Company or by banks and counterguaranteed by the Company on its own
behalf and on behalf of subsidiaries and affiliated companies to secure the performance of contractual obligations account for the balance.
Collateral provided, which represents the value on the reporting date of the assets or rights provided as collateral consist essentially of pledges encumbering the Ibiritermo shares for the subordinated loan provided to this affiliated company.
Other commitments and risks reflect commitments undertaken for the completion of investment projects in progress for 24,432,000 euros.
At December 31, 2016, as commented in the following paragraph, no commitments were recognized, consistently with the previous year, with regard to long-term contracts to import natural gas with take-or-pay clauses, pursuant to which the buyer must pay for volumes that could not take delivery of up to a predetermined level.
Please also note the following:• With regard to the procurement of CO
2 certificates and Certified Emission Reductions (CERs)/Emission Reduction Units (ERUs), for the 2013-2020 period, Edison Spa signed Amended Agreements modifying the original Emission Reductions Purchase Agreements (ERPA) to purchase CERs in China for up to 26 million euros. These new agreements represent extensions of contracts already held by Edison Spa and originally signed for the 2008-2013 period.
• Cartiere Burgo Spa holds a call option to purchase a 51% interest in Gever Spa. This option is exercisable when the contract under which Gever supplies Cartiere Burgo (within 2017) with electric power and steam expires (in 2017) at a price equal to the corresponding pro rata interest in the company’s shareholders’ equity.
• Petrobras an option exercisable in 2022 to buy its interest in Ibiritermo Sa at a predetermined price.
Unrecognized Commitments and RisksSignificant commitments and risks not included in the amounts listed above are reviewed below.
1) In the hydrocarbon area, the Company is a party to long-term contracts for the importation of natural gas from Russia, Libya, Algeria and Qatar, for a total maximum nominal supply of 14.4 billion cubic meters of natural gas a year. These contracts have terms ranging from 3 to 18 years. The table below provides a breakdown of the timing for the supply of natural gas, based on minimum contractual deliveries:
U.M. within 1 year from 2 to 4 years more than 5 years Total
Natural gas (*) Billions of m3 13.6 46.8 107.0 167.4
(*) The economic data are based on prospective pricing formulas.
With regard to the importation of natural gas, it is worth mentioning the agreement to import gas from Algeria signed with Sonatrach in November 2006 (“Protocole d’accord”) for the future supply of natural gas through a pipeline, the construction of which is being promoted by Galsi Spa, an Edison investee.
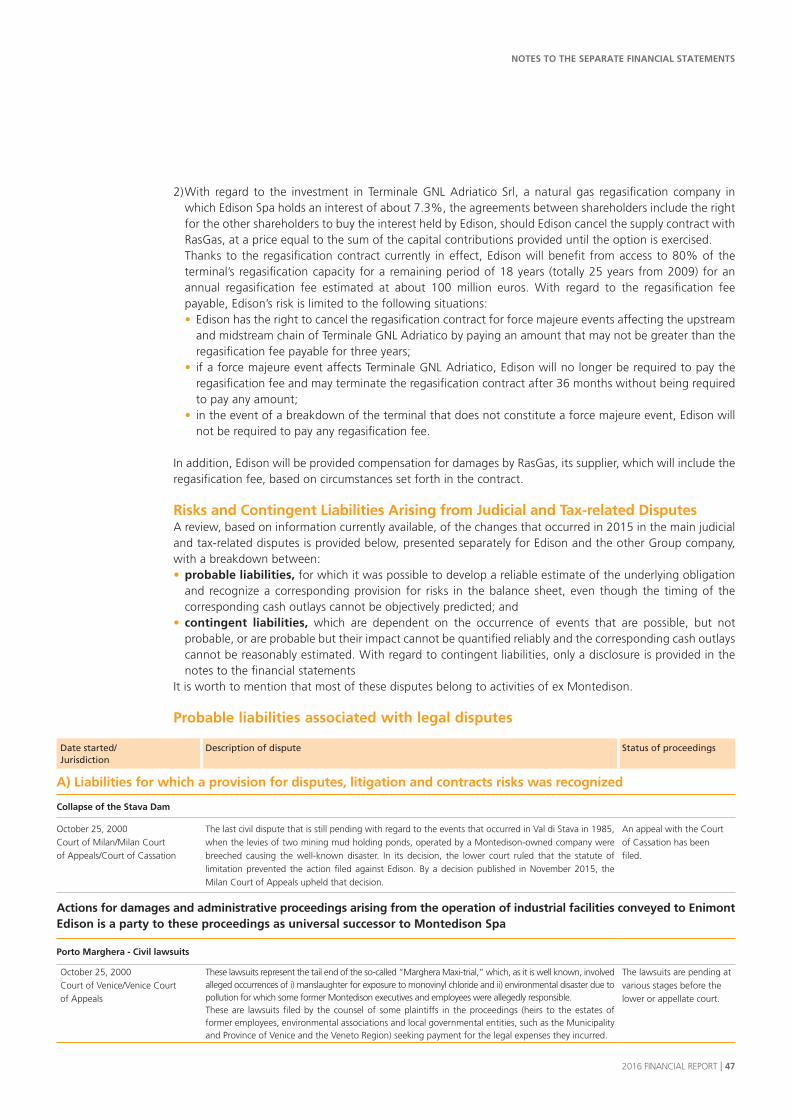
NOTES TO THE SEPARATE FINANCIAL STATEMENTS
2016 FINANCIAL REPORT I 47
2) With regard to the investment in Terminale GNL Adriatico Srl, a natural gas regasification company in which Edison Spa holds an interest of about 7.3%, the agreements between shareholders include the right for the other shareholders to buy the interest held by Edison, should Edison cancel the supply contract with RasGas, at a price equal to the sum of the capital contributions provided until the option is exercised.Thanks to the regasification contract currently in effect, Edison will benefit from access to 80% of the terminal’s regasification capacity for a remaining period of 18 years (totally 25 years from 2009) for an annual regasification fee estimated at about 100 million euros. With regard to the regasification fee payable, Edison’s risk is limited to the following situations:• Edison has the right to cancel the regasification contract for force majeure events affecting the upstream
and midstream chain of Terminale GNL Adriatico by paying an amount that may not be greater than the regasification fee payable for three years;
• if a force majeure event affects Terminale GNL Adriatico, Edison will no longer be required to pay the regasification fee and may terminate the regasification contract after 36 months without being required to pay any amount;
• in the event of a breakdown of the terminal that does not constitute a force majeure event, Edison will not be required to pay any regasification fee.
In addition, Edison will be provided compensation for damages by RasGas, its supplier, which will include the regasification fee, based on circumstances set forth in the contract.
Risks and Contingent Liabilities Arising from Judicial and Tax-related Disputes A review, based on information currently available, of the changes that occurred in 2015 in the main judicial and tax-related disputes is provided below, presented separately for Edison and the other Group company, with a breakdown between:• probable liabilities, for which it was possible to develop a reliable estimate of the underlying obligation
and recognize a corresponding provision for risks in the balance sheet, even though the timing of the corresponding cash outlays cannot be objectively predicted; and
• contingent liabilities, which are dependent on the occurrence of events that are possible, but not probable, or are probable but their impact cannot be quantified reliably and the corresponding cash outlays cannot be reasonably estimated. With regard to contingent liabilities, only a disclosure is provided in the notes to the financial statements
It is worth to mention that most of these disputes belong to activities of ex Montedison.
Probable liabilities associated with legal disputes
Date started/Jurisdiction
Description of dispute Status of proceedings
A) Liabilities for which a provision for disputes, litigation and contracts risks was recognized
Collapse of the Stava Dam
October 25, 2000Court of Milan/Milan Court of Appeals/Court of Cassation
The last civil dispute that is still pending with regard to the events that occurred in Val di Stava in 1985, when the levies of two mining mud holding ponds, operated by a Montedison-owned company were breeched causing the well-known disaster. In its decision, the lower court ruled that the statute of limitation prevented the action filed against Edison. By a decision published in November 2015, the Milan Court of Appeals upheld that decision.
An appeal with the Court of Cassation has been filed.
Actions for damages and administrative proceedings arising from the operation of industrial facilities conveyed to EnimontEdison is a party to these proceedings as universal successor to Montedison Spa
Porto Marghera - Civil lawsuits
October 25, 2000Court of Venice/Venice Court of Appeals
These lawsuits represent the tail end of the so-called “Marghera Maxi-trial,” which, as it is well known, involved alleged occurrences of i) manslaughter for exposure to monovinyl chloride and ii) environmental disaster due to pollution for which some former Montedison executives and employees were allegedly responsible.These are lawsuits filed by the counsel of some plaintiffs in the proceedings (heirs to the estates of former employees, environmental associations and local governmental entities, such as the Municipality and Province of Venice and the Veneto Region) seeking payment for the legal expenses they incurred.
The lawsuits are pending at various stages before the lower or appellate court.

NOTES TO THE SEPARATE FINANCIAL STATEMENTS
48 I 2016 FINANCIAL REPORT
Date started/Jurisdiction
Description of dispute Status of proceedings
Mantua - Criminal Proceedings
October 25, 2000Court of Mantua/Brescia Court of Appeals/Court of Cassation
This trial concerns the Mantua petrochemical facility operated for several decades first by companies of the Montedison Group and later by companies of the Eni Group. The facts subject of the pending trial concern determining the fortuity for a series of death caused by cancer identified by the Public Prosecutor and concerning employees of the facility.After a first ruling set by the lower court of Mantua, under which 10 of the 12 defendants were convicted and found guilty of manslaughter in the death of 11 people, the Court of Appeal of Brescia on February 5th 2016 confirmed 9 convictions, largely reducing the punishments. However, also the Court of Appeal dismissed a charge, aggravated by the disaster, of “removal or negligent omission of protections against occupational accidents.”
The proceedings are now pending before the Court of Cassation.
Mantua - Administrative proceedings
2012 – 2016Lombardy Regional Administrative Court – Brescia Section
All of the injunctions issued pursuant to Article 244 of Legislative Decree No. 152/2006 (so-called “Environmental Code”) and notified to Edison between 2012 and 2015 by the Province of Mantua concerning the remediation of various areas inside and outside the petrochemical facility formerly operated in Mantua by Montedison and currently operated by the Eni Group (areas called “Versalis, former chlorine sodium production facility,” “Mercury mud landfill area L,” “Intake canal for the Versalis plant and the Formigosa fornix,” “Basso Mincio,” “Sisma Canal,” “N,” “B+I” and “R1”) were challenged by the Company and the respective proceeding are pending at the lower level before the Regional Administrative Court of Lombardy – Brescia Section.
For all pending proceedings the Court has yet to schedule a hearing for oral arguments.
Brindisi - Administrative proceedings
February 25, 2013Apulia Regional Administrative Court – Lecce Section
These proceedings concern the industrial park of the Port of Brindisi, where the Montedison Group operated petrochemical facilities for over 60 years.On February 25, 2013, the Province of Brindisi notified to Edison, Eni, Syndial and Versalis an injunction pursuant to Article 244, Section 2, of Legislative Decree No. 152/2006 (so-called “Environmental Code”) concerning an alleged landfill adjacent to the Brindisi petrochemical plant.The Company challenged this injunction and, after its plea was denied by the lower court, is waiting for a pronouncement at the appellate level by the Council of State.
Waiting for a hearing for oral arguments to be scheduled.
Crotone - Criminal Proceedings
2005Court of Crotone
The proceedings concerned are three.The first concerns the alleged occupational diseases that would have been determined by exposure to asbestos of workers of the chemical facility operated in Crotone by Montecatini Spa (Montedison Group), for events occurring until 1989. The trial is in the final phase.The second is related to a dispute of poisoning of the groundwater and, consequently, of the water intended for feed and the pre-trial hearing is in progress.Also the third is related to occupational disease and the pre-trial hearing is in progress.
As per the description of the dispute.
Belvedere di Spinello - Civil Proceedings
October 31, 1986Court of Catanzaro/ Catanzaro Court of Appeals
These proceedings concerning the Belvedere di Spinello mining concession, derives from rock salt mining activities carried out at this location by Montedipe Spa for over 20 years. The proceeding have to do with compensation for the damages suffered by two provincial administrations due to the destruction of a provincial road caused by the collapse of the mine in 1984.These proceedings are pending at the appellate level and the Court requested a technical expert’s report.
The filing of the expert’s report is expected.
Claims for Damages Caused by Exposure to Asbestos
In recent years, there has been a significant increase in the number of claims for damages arising from the deaths or illnesses of workers that were allegedly caused by exposure to different forms of asbestos at factories formerly owned by Montedison Spa (now Edison) or from judicial cases taken over by Edison as a result of corporate transactions. Without rendering an opinion on the merits of these claims, considering the long latency of illnesses related to exposure to different types of asbestos and the industrial activities carried out in the past by Group companies that belonged to the chemical industry, the presence of these companies throughout Italy and the manufacturing technologies used (considering the dates when these activities were carried out and the state of technological advancement at the time), which complied fully with the laws in force at that time, the possibility that new legitimate claims for damages may emerge in addition to those that are already the subject of several civil and criminal proceedings cannot be excluded.

NOTES TO THE SEPARATE FINANCIAL STATEMENTS
2016 FINANCIAL REPORT I 49
Date started/Jurisdiction
Description of dispute Status of proceedings
B) Liabilities for which a provision for risks for contractual guarantees on sale of equity investments was recognized in the balance sheet:Civil lawsuits, criminal trials and administrative proceedings concerning the sale of Agorà Spa, which owned 100% of the shares of Ausimont SpaEdison is a party to these proceedings in its capacity as universal successor to Montedison Spa
Ausimont - Bussi sul Tirino - Administrative proceedings
June 2011Latium Regional Administrative Court – Rome Section and Abruzzo Regional administrative Court – Pescara Section
This dispute concerns the activities to ensure site safety and remediation that Solvay Solexis (now Solvay Specialty Polymers) and Solvay Chimica Bussi were required to implement at areas inside the Bussi sul Tirino chemical plant, operated, until 2002 by Ausimont Spa, a Montedison Group company that was sold to the Solvay. Edison was sued by the companies of the Solvay Group as counter-interested party and as former parent of Ausimont.These proceedings are still pending before the Council of State, after the Regional Administrative Court of Latium, by a decision handed down in March 2011, found that part of the complaints filed by Solvay Chimica Bussi and Solvay Solexis were inadmissible and dismissed other complaints.
As per the description of the disputes.
Ausimont - Bussi sul Tirino - Criminal proceedings
2008 Court of Pescara/Chieti Court of Assizes/Court of Cassation/ Court of Assizes of Appeals of L’Aquila
The events concerning the alleged negligent poisoning of water intended for human consumption and environmental disaster, for which three former managers and employees of the Montedison Group and others are allegedly responsible, is currently pending before the Court of Cassation.As mentioned earlier in the notes to the financial statements, in December 2014, the Chieti Court of Assizes acquitted all defendants.This decision was then appealed directly to the Court of Cassation both by the Public Prosecutor and the counsels for the defendants, for different profiles. However, in March 2016, the Court denied the appeals converting them into appeals to the appellate court, sending the record of the proceedings back to the Court of Assizes of Appeals of L’Aquila.Oral arguments began in December 2016 and a decision is expected in February 2017.
* * *However, it is important to keep in mind that Edison, further to the decision by all defendant to opt for summary judgment proceedings, was excluded ex lege from this trial in which it was being sued as the civilly liable party. Edison is thus faced with the following alternative scenarios: i) if the decision acquitting the three former Montedison employees were to become final, the decision would have a direct effect on the civil law plaintiffs, excluding any right to receive compensation for damages from Edison, the civil law respondent; ii) on the other hand, if upon a reversal of the recent acquittal decision, the courts were to hand down a final guilty verdict against the three defendants, former employees of the Montedison Group, the decision would have a direct effect only on the defendants. but not with regard to Edison Spa. Any interested party would then have to pursue new proceedings before a civil court to determine the liability of Edison Spa for the actions of its former employees.
As per the description of the disputes.
Ausimont - Spinetta Marengo - Administrative proceedings
February 2012Piedmont Regional Administrative Court
The case concerns activities that Solvay Specialty Polymers was ordered to carry out, under various titles, to ensure safety and environmental remediation of areas inside the Spinetta Marengo (AL) chemical plant. This plant was operated until 2002 by Ausimont Spa, a Montedison Group company sold to the Solvay Group in May 2002.Edison joined these proceedings exclusively to protect its rights and legitimate interests in connection with the challenges filed against the administrative actions of the relevant Services Conference by Solvay Specialty Polymers, which specifically contested the failure to identify Edison as a respondent or correspondent in the proceedings.
As per the description of the proceedings.
Ausimont - Spinetta Marengo - Criminal proceedings
October 2009Alessandria Court of Assizes
Also with regard to the former Ausimont industrial site of Spinetta Marengo, the local court’s Public Prosecutor began an investigation targeting several individuals, including three former managers of Montedison (now Edison), alleging that they may have committed environmental crimes. Edison is being sued by certain parties as the civilly liable party.On December 14, 2015, the Court of Assizes convicted four of the eight defendants of the crime of negligent environmental disaster and ordered them, jointly with Solvay Specialty Polymers, to pay civil damages to the civil plaintiffs who joined the proceedings. This decision has been appealed to the Turin Court of Assizes of Appeals of Turin and a hearing for oral arguments has not yet been scheduled.
As per the description of the dispute.

NOTES TO THE SEPARATE FINANCIAL STATEMENTS
50 I 2016 FINANCIAL REPORT
Date started/Jurisdiction
Description of dispute Status of proceedings
Ausimont - Solvay Arbitration
May 2012ICC – Geneva
These arbitration proceedings were initiated in 2012 by Solvay Sa and Solvay Specialty Polymers Italy Spa against Edison, for alleged violations of certain representations and warrantees in the environmental area concerning the industrial sites of Bussi sul Tirino and Spinetta Marengo included in the deed of sale of Agorà Spa (parent company of Ausimont Spa) executed on the one hand by Montedison Spa and Longside International Sa and on the other hand by Solvay Solexis Spa (now Solvay Specialty Polymers) in December 2001.Further to the publication of the rationale for the lower court’s decision in the criminal proceedings pending for the Bussi sul Tirino and Spinetta Marengo sites, the parties agreed to continue the proceedings and discuss the merit of the respective claims.
As per the description of the dispute.
C) Liabilities for which a provision for environmental risks was recognized
Montedison - Former-Montedison area called “Old Officine del Gas” in Milan - Bovisa
June 2013Court of Milan
On May 5, 2016, the parties, without prejudice to the criticism formulated during the course of the judgment, reached a settlement for an overall amount of about 5 million euros.
Concluded.
Bussi sul Tirino National Interest Site - “former Montedison srl area” and Bolognano site
2011 and 2015Abruzzo Regional administrative Court, Pescara Section
“Former Montedison srl area”: the site in question is the so-called “Tre Monti” area, currently owned by Edison Spa (formerly Montedison S.r.l., merged into Edison as of July 1, 2010), which is adjoining the Bussi sul Tirino industrial site currently owned by the Solvay Group and where in the 1970s waste, including industrial waste, was dumped. This site, seized under a court order since 2007, is currently managed by the Ministry of the Environment and the Protection of the Territory and the Sea, which in 2016 replaced the Delegated Commissioner appointed by the Office of the Prime Minister in 2007. Please note that Edison has already provided economic support for activities to ensure the area’s safety between 2010 and 2011. However, in November 2012, subsequent to a request for additional activities issued by the abovementioned Commissioner when a soil characterization had not yet been performed, Edison appealed to the Abruzzo Regional administrative Court – Pescara challenging the legitimacy of the Commissioner’s actions.
Bolognano site: with regard to the Bussi sul Tirino National Interest Site, on September 24, 2015, the Pescara Provincial Administration served Edison Spa with a remediation and environmental restoration injunction pursuant to Article 244 of Legislative Decree No. 152/2006 concerning the “former Montecatini” site in Piano d’Orta, located in the municipality of Bolognano (PE), where Montecatini operated a chemical plant in the 1960s. Edison filed a challenge with the Regional Administrative Court of Abruzzo – Pescara contesting the legality of this order.
Waiting for an oral argument hearing to be scheduled in both proceedings.
D) Liabilities for which a provision for other legal risks was recognized
Dispute between Axpo Italia and Edison - Supply contract for natural gas
December 23, 2013Court of Milan
The lawsuit filed by Axpo Italia Spa against Edison Spa is aimed at obtaining compensation for damages resulting from an alleged breach by Edison of an existing contract to supply natural gas that the parties executed on October 26, 2012. Specifically, Axpo Italia is demanding compensation for damages resulting from Edison’s alleged failure to provide the contractually stipulated gas volumes. Edison joined the proceeding flatly denying any breach and filing a counterclaim against Axpo Italia for breach of contract.
These proceedings are currently pending before the lower court in the discovery phase.
~~~~~~~~~~
Contingent Liabilities Associated with Legal Disputes
Environmental Legislation
In addition to the probable liabilities for environmental risks, already covered by provisions and previously described, in recent years, we have witnessed an expansion and evolution of environmental laws (most recently with Legislative Decree No. 152 of April 3, 2006 “Environmental Regulations”, as amended), specifically with regard to liability for environmental damages, which is especially relevant to the purposes of these notes. In particular, the discussion and adoption in several legal systems of the principle of “internalization” of environmental costs (summarized in the expression “those who pollute must pay”) have resulted in the development of two new types of liabilities for the act of polluting: objective liability (which does not require the subjective element of guilt) and indirect liability (which stems from the actions of others), which can arise as a result of an earlier act that constitutes a violation of acceptable contamination levels under current laws. Therefore, taking into account the current and past scope of the industrial operations of the Company and the Group, particularly in the chemical industry, which were carried out in full compliance with the statutes then in force, it cannot be excluded that, in light of current legislation, new allegations of contaminations may arise, in addition to those currently subject to administrative and judicial proceedings.
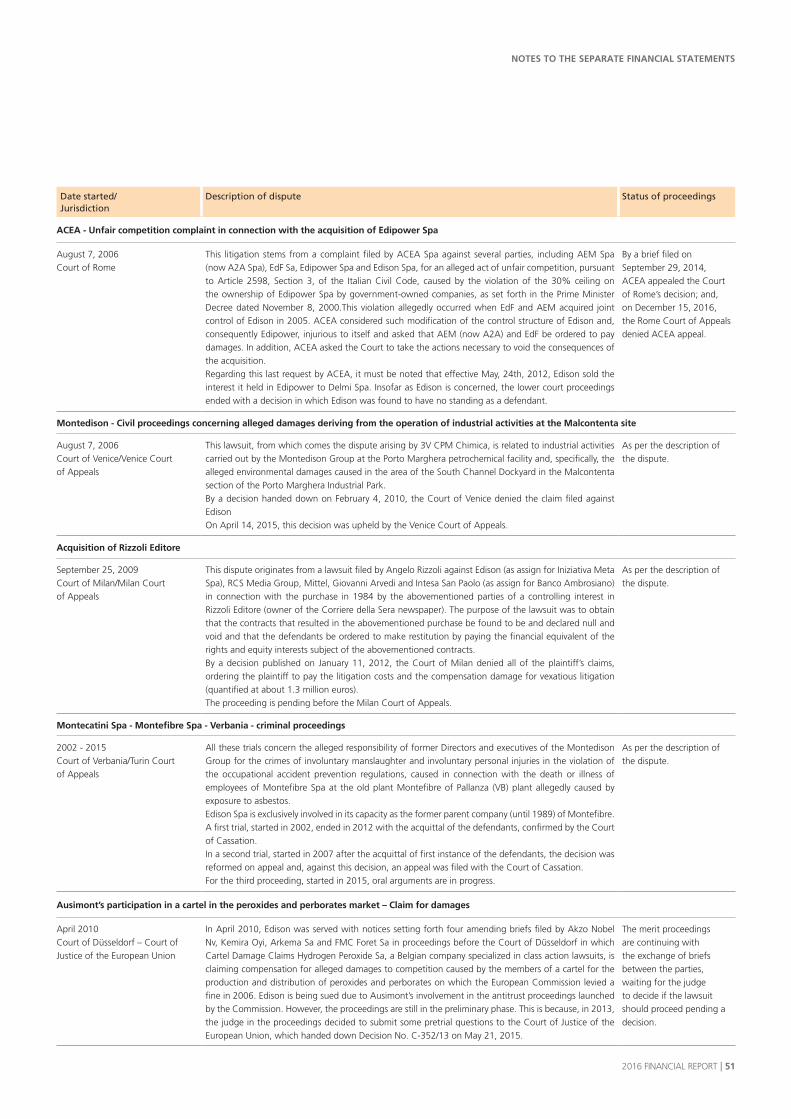
NOTES TO THE SEPARATE FINANCIAL STATEMENTS
2016 FINANCIAL REPORT I 51
Date started/Jurisdiction
Description of dispute Status of proceedings
ACEA - Unfair competition complaint in connection with the acquisition of Edipower Spa
August 7, 2006Court of Rome
This litigation stems from a complaint filed by ACEA Spa against several parties, including AEM Spa (now A2A Spa), EdF Sa, Edipower Spa and Edison Spa, for an alleged act of unfair competition, pursuant to Article 2598, Section 3, of the Italian Civil Code, caused by the violation of the 30% ceiling on the ownership of Edipower Spa by government-owned companies, as set forth in the Prime Minister Decree dated November 8, 2000.This violation allegedly occurred when EdF and AEM acquired joint control of Edison in 2005. ACEA considered such modification of the control structure of Edison and, consequently Edipower, injurious to itself and asked that AEM (now A2A) and EdF be ordered to pay damages. In addition, ACEA asked the Court to take the actions necessary to void the consequences of the acquisition. Regarding this last request by ACEA, it must be noted that effective May, 24th, 2012, Edison sold the interest it held in Edipower to Delmi Spa. Insofar as Edison is concerned, the lower court proceedings ended with a decision in which Edison was found to have no standing as a defendant.
By a brief filed on September 29, 2014, ACEA appealed the Court of Rome’s decision; and, on December 15, 2016, the Rome Court of Appeals denied ACEA appeal.
Montedison - Civil proceedings concerning alleged damages deriving from the operation of industrial activities at the Malcontenta site
August 7, 2006Court of Venice/Venice Court of Appeals
This lawsuit, from which comes the dispute arising by 3V CPM Chimica, is related to industrial activities carried out by the Montedison Group at the Porto Marghera petrochemical facility and, specifically, the alleged environmental damages caused in the area of the South Channel Dockyard in the Malcontenta section of the Porto Marghera Industrial Park.By a decision handed down on February 4, 2010, the Court of Venice denied the claim filed against EdisonOn April 14, 2015, this decision was upheld by the Venice Court of Appeals.
As per the description of the dispute.
Acquisition of Rizzoli Editore
September 25, 2009Court of Milan/Milan Court of Appeals
This dispute originates from a lawsuit filed by Angelo Rizzoli against Edison (as assign for Iniziativa Meta Spa), RCS Media Group, Mittel, Giovanni Arvedi and Intesa San Paolo (as assign for Banco Ambrosiano) in connection with the purchase in 1984 by the abovementioned parties of a controlling interest in Rizzoli Editore (owner of the Corriere della Sera newspaper). The purpose of the lawsuit was to obtain that the contracts that resulted in the abovementioned purchase be found to be and declared null and void and that the defendants be ordered to make restitution by paying the financial equivalent of the rights and equity interests subject of the abovementioned contracts.By a decision published on January 11, 2012, the Court of Milan denied all of the plaintiff’s claims, ordering the plaintiff to pay the litigation costs and the compensation damage for vexatious litigation (quantified at about 1.3 million euros).The proceeding is pending before the Milan Court of Appeals.
As per the description of the dispute.
Montecatini Spa - Montefibre Spa - Verbania - criminal proceedings
2002 - 2015Court of Verbania/Turin Court of Appeals
All these trials concern the alleged responsibility of former Directors and executives of the Montedison Group for the crimes of involuntary manslaughter and involuntary personal injuries in the violation of the occupational accident prevention regulations, caused in connection with the death or illness of employees of Montefibre Spa at the old plant Montefibre of Pallanza (VB) plant allegedly caused by exposure to asbestos.Edison Spa is exclusively involved in its capacity as the former parent company (until 1989) of Montefibre.A first trial, started in 2002, ended in 2012 with the acquittal of the defendants, confirmed by the Court of Cassation.In a second trial, started in 2007 after the acquittal of first instance of the defendants, the decision was reformed on appeal and, against this decision, an appeal was filed with the Court of Cassation.For the third proceeding, started in 2015, oral arguments are in progress.
As per the description of the dispute.
Ausimont’s participation in a cartel in the peroxides and perborates market – Claim for damages
April 2010Court of Düsseldorf – Court of Justice of the European Union
In April 2010, Edison was served with notices setting forth four amending briefs filed by Akzo Nobel Nv, Kemira Oyi, Arkema Sa and FMC Foret Sa in proceedings before the Court of Düsseldorf in which Cartel Damage Claims Hydrogen Peroxide Sa, a Belgian company specialized in class action lawsuits, is claiming compensation for alleged damages to competition caused by the members of a cartel for the production and distribution of peroxides and perborates on which the European Commission levied a fine in 2006. Edison is being sued due to Ausimont’s involvement in the antitrust proceedings launched by the Commission. However, the proceedings are still in the preliminary phase. This is because, in 2013, the judge in the proceedings decided to submit some pretrial questions to the Court of Justice of the European Union, which handed down Decision No. C-352/13 on May 21, 2015.
The merit proceedings are continuing with the exchange of briefs between the parties, waiting for the judge to decide if the lawsuit should proceed pending a decision.
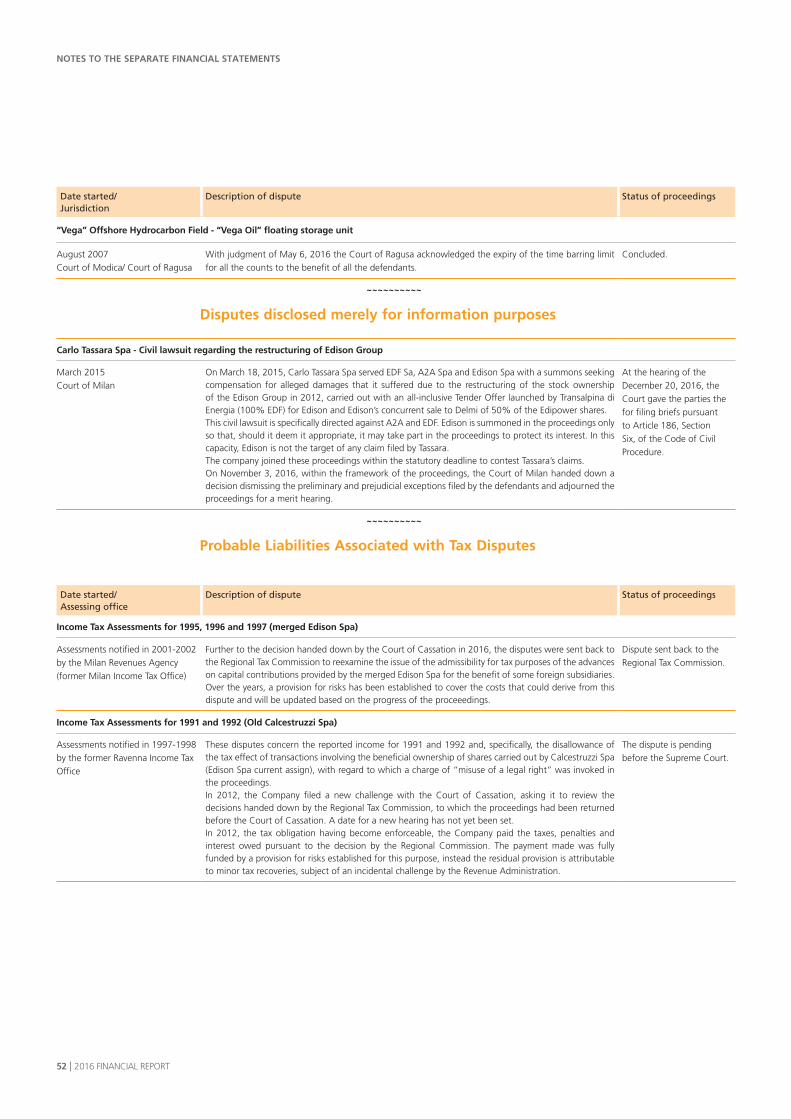
NOTES TO THE SEPARATE FINANCIAL STATEMENTS
52 I 2016 FINANCIAL REPORT
Date started/Jurisdiction
Description of dispute Status of proceedings
“Vega” Offshore Hydrocarbon Field - “Vega Oil” floating storage unit
August 2007Court of Modica/ Court of Ragusa
With judgment of May 6, 2016 the Court of Ragusa acknowledged the expiry of the time barring limit for all the counts to the benefit of all the defendants.
Concluded.
~~~~~~~~~~
Disputes disclosed merely for information purposes
Carlo Tassara Spa - Civil lawsuit regarding the restructuring of Edison Group
March 2015Court of Milan
On March 18, 2015, Carlo Tassara Spa served EDF Sa, A2A Spa and Edison Spa with a summons seeking compensation for alleged damages that it suffered due to the restructuring of the stock ownership of the Edison Group in 2012, carried out with an all-inclusive Tender Offer launched by Transalpina di Energia (100% EDF) for Edison and Edison’s concurrent sale to Delmi of 50% of the Edipower shares.This civil lawsuit is specifically directed against A2A and EDF. Edison is summoned in the proceedings only so that, should it deem it appropriate, it may take part in the proceedings to protect its interest. In this capacity, Edison is not the target of any claim filed by Tassara.The company joined these proceedings within the statutory deadline to contest Tassara’s claims.On November 3, 2016, within the framework of the proceedings, the Court of Milan handed down a decision dismissing the preliminary and prejudicial exceptions filed by the defendants and adjourned the proceedings for a merit hearing.
At the hearing of the December 20, 2016, the Court gave the parties the for filing briefs pursuant to Article 186, Section Six, of the Code of Civil Procedure.
~~~~~~~~~~
Probable Liabilities Associated with Tax Disputes
Date started/Assessing office
Description of dispute Status of proceedings
Income Tax Assessments for 1995, 1996 and 1997 (merged Edison Spa)
Assessments notified in 2001-2002 by the Milan Revenues Agency (former Milan Income Tax Office)
Further to the decision handed down by the Court of Cassation in 2016, the disputes were sent back to the Regional Tax Commission to reexamine the issue of the admissibility for tax purposes of the advances on capital contributions provided by the merged Edison Spa for the benefit of some foreign subsidiaries.Over the years, a provision for risks has been established to cover the costs that could derive from this dispute and will be updated based on the progress of the proceeedings.
Dispute sent back to the Regional Tax Commission.
Income Tax Assessments for 1991 and 1992 (Old Calcestruzzi Spa)
Assessments notified in 1997-1998 by the former Ravenna Income Tax Office
These disputes concern the reported income for 1991 and 1992 and, specifically, the disallowance of the tax effect of transactions involving the beneficial ownership of shares carried out by Calcestruzzi Spa (Edison Spa current assign), with regard to which a charge of “misuse of a legal right” was invoked in the proceedings.In 2012, the Company filed a new challenge with the Court of Cassation, asking it to review the decisions handed down by the Regional Tax Commission, to which the proceedings had been returned before the Court of Cassation. A date for a new hearing has not yet been set.In 2012, the tax obligation having become enforceable, the Company paid the taxes, penalties and interest owed pursuant to the decision by the Regional Commission. The payment made was fully funded by a provision for risks established for this purpose, instead the residual provision is attributable to minor tax recoveries, subject of an incidental challenge by the Revenue Administration.
The dispute is pending before the Supreme Court.

NOTES TO THE SEPARATE FINANCIAL STATEMENTS
2016 FINANCIAL REPORT I 53
Date started/Assessing office
Description of dispute Status of proceedings
IRES and IRAP Assessments - 2005-2009 Tax Years
Assessments notified in 2011 – 2014 by the Revenue Agency – Lombardy Regional Office
Further to the findings of the general audit completed in 2011 by the Revenue Police concerning income taxes, regional taxes (IRAP) and VAT for the tax years from 2005 to 2009, the Company received IRES and IRAP notices of assessment for the years 2005-2008, which were voided in the course of the proceedings in connection with the settlements for the part regarding back-listed costs. Currently, the assessments for the years 2005 to 2007 are being appealed before the Court of Cassation by the Agency with regard to tax recoveries, voided in the merit venues, of costs found to be “not attributable” to the year in which they were deducted, but nevertheless deductible in another tax period.The assessment for the 2008 year is currently pending before the Regional Commission, also further to an appeal filed by the Revenue Agency, while the assessment for 2009 was settled through a negotiated settlement.The VAT assessment for 2006 is currently pending before the Court of Cassation further to a challenge filed by the Company. The amount owed in terms of additional tax, penalties and interest in accordance with the Regional Commission decision was paid in September 2014 while the proceedings are in progress.Any charges that may be potentially incurred from these disputes are covered by a special provision for risks.
Assessments pending before Court of Cassation and the Regional Tax Commission.
Disputed municipal property taxes (ICI and IMU) and assessed property values of hydroelectric and thermoelectric power plants
Various assessments to revise the assessed property values notified over the years by the Territorial Agency, offices with territorial jurisdiction.Assessments for local property taxes (ICI and IMU) notified over the years by various municipalities where power plants or parts of them are located
The Company is a party to disputes concerning assessments for municipal property taxes (originally ICI and later IMU) issued by some municipalities where its power plants or parts of them are located. The outcomes of these disputes have not been uniform. Over the years, whenever possible, the Company settled amicably or preemptively, pending or potential disputes.The provision for risks, which is updated on a regular basis, takes into account the possible costs that may arise from these disputes or incurred for negotiated settlements with municipalities for local taxes.The Company is also a party to disputes related to the decision by the Revenue Agency (formerly the Territorial Agency) to contest the assessed property values for industrial facilities recorded in the property registers. Also in this case, the outcomes of these disputes have not been uniform and whenever possible, agreements were achieved with the administration to define amicable the new assessed property values.
It is worth mentioning that the 2016 Stability Law provided, for industrial facilities classified in the D Category of the property register, a change in the elements that are relevant for the purpose of determining the assessed value. Consequently, in 2016, the Company updated the assessed property values, excluding from the value that is relevant for assessment purposes the portion of the facilities functional to the specific production process (so-called “bolted down”), resulting in a reduction of the expense starting from 2016.
Assessments pending, at various levels of the judicial process, before the merit and relevant courts.
Disputed municipal property taxes (ICI) on offshore hydrocarbon production platforms
Various assessments for local taxes (ICI and IMU) from various municipalities, from 2005 to the present
In recent years, Edison Spa was served with notices of assessment for property taxes (ICI and later IMU) by which some municipal administrations on the Adriatic coast (Termoli, Porto Sant’Elpidio, Torino di Sangro, Scicli, Vasto and Civitanova Marche) demanded payment of municipal property taxes they claim are owed on some hydrocarbon production platforms located in the Adriatic Sea. and the Strait of Sicily.After developments that were substantially favorable for the Company in the merit hearings up to 2015,in February 2016, the Court of Cassation, in the ENI/Municipality of Pineto ruled that offshore platforms within the territorial waters were subject to local taxes based on their book value, whether or not they are listed in the Property Register.In June 2016, the Ministry of Finance issued an official pronouncement stating that the levying of local taxes on the platforms was illegitimate, emphasizing the need for a two-fold expressed legislative action both to define the territorial jurisdiction and the criteria for Property Register listing and to extensively amend the IMU statute.However, in September 2016, the Court of Cassation handed down its decisions regarding two appeals filed by Edison Spa and the Municipality of Termoli for two different ICI disputes concerning Rospo Mare, which produced opposite outcomes in the appellate phase. The Court of Cassation, citing in part the arguments of the February decision voided both decisions sending the disputes back to the Regional Commission, asking it to determine the assessed value based on financial statement data and, in one dispute, verify whether the Municipality of Termoli does in fact have territorial jurisdiction.The Company recognized a conservative provision for risks and will resume pursuit of these disputes within the required deadline. However, it is important to emphasize the lack of a clear legislation in this area also with regard to determining the assessed property values. Any adjustment to the provision for risks will be dictated by the evolution of the situation.
Assessments pending, at various levels of the judicial process, before the merit and relevant courts.
~~~~~~~~~~

NOTES TO THE SEPARATE FINANCIAL STATEMENTS
54 I 2016 FINANCIAL REPORT
Date started/Assessing office
Description of dispute Status of proceedings
Contingent liabilities associated with tax disputes
IRPEG and IRAP assessments for 2002
Assessments notified in 2005 by the Revenue Agency of Milan 1
The dispute concerns the IRPEG and IRAP assessments for 2002 by which the reported loss was adjusted and the tax deductibility of the costs incurred for divestment transactions executed during the year was contested.The decisions at the various levels of the merit process were largely favorable and, in 2016, the Court of Cassation definitively voided the main tax recovery sending the proceedings back to the lower court for some tax minor recoveries. Consequently, the dispute was sent back to the Regional Tax CommissionThe Company never found it necessary to recognize a provision for risks given the nature of the dispute and the amount of the potential charges.
Dispute sent back to the Regional Tax Commission.
Dispute for registration fees on transactions requalified as disposal of business operations for the Taranto plants
Payment notice notified in 2012 by the Rho Revenue Agency
In 2012, the Rho Revenue Agency sought to requalify, for registration tax purposes, a transaction involving the conveyance of business operations (consisting of the assets and liabilities attributable to the CET2 and CET3 thermoelectric power plants in Taranto) to Taranto Energia Srl and the subsequent sale of the equity interest in this company to ILVA Spa as a mere sale of a business. Consequently, it demanded, by a payment notice, the payment of the proportional registration tax in the amount of 17 million euros.Actually the judgment is pending before the Court of Cassation because the Company challenged the decision of the Regional Tax Commission (instead the decision in first instance was totally favorable). As of today the date of a discussion hearing for the assessment has not yet been set.The Company believes that its actions were proper, fully in compliance with the law and not pursued solely for tax avoidance purposes. The Company believes that any cost arising from this dispute should be viewed as part of the possible contractual risks deriving from the contract signed with ILVA, for which suitable coverage has been recognized in the financial statements.
Waiting for a hearing before the Supreme Court of Cassation.
~~~~~~~~~~
Contingent assets
Contingent assets in the tax area, the benefit of which cannot be recognized in the financial statements pursuant to IAS 37 because it is not virtually certain, are reviewed below:
Edison Spa - Dispute for registration fees on transactions requalified as disposal of business operations regarding CIP 6/92 power plants
Payment notice notified in 2010 by the Rho Revenue Agency
In 2010, the Rho Revenue Agency sought to requalify, for registration tax purposes, a transaction involving the conveyance of business operations (consisting of the assets and liabilities attributable to the CIP 6/92 thermoelectric power plants) to a newco and the subsequent sale of the equity interest in this company to Cofatech Spa as a mere sale of a business. Consequently, it demanded, by a payment notice, the payment of the proportional registration tax in the amount of 11 million euros, which the Company paid in order to avoid incurring penalties and absent a stay of collection activities.This dispute is currently pending before the Court of Cassation, following an appeal filed by the Company against an unfavorable decision by the Milan Regional Tax Commission (instead the Provincial Commission had ruled totally in the Company’s favor).Any amounts paid while the proceedings are in progress can be refunded to the Company upon final disposition of this dispute, which the Company believes could end favorably with the recognition of the economic and legal rationale underlying the decision to use the legal structure of conveyance of business operations.
Waiting for a hearing before the Supreme Court of Cassation.

NOTES TO THE SEPARATE FINANCIAL STATEMENTS
2016 FINANCIAL REPORT I 55
TAX STATUS OF SHARE CAPITAL AND RESERVES IN THE EVENT OF REPAYMENT OR DISTRIBUTION
The types of tax status and utilization options of the different items that constitute the Company’s shareholders’ equity are reviewed below:
Tax status
(in thousands of euros) Balance sheet amount Type Amount Utilization options Distributable portion
Share capital 5,377,001
breakdown B 192,082 - -
C 588,628 - -
Share capital reserves
Additional paid-in capital 32 D - 1, 2, 3 -
Earnings reserves
Statutory reserve -
breakdown A - 2 -
Other reserves (38,133)
breakdown A (999) 1, 2 -
E (37,102) - -
Retained earnings - A - 1, 2, 3 -
Tax StatusA: Reserves that, if distributed, would be included in the taxable income of the shareholders.B: Reserves the taxation of which has been suspended that are part of share capital. If the share capital is
reduced upon a shareholder distribution, these reserves would become taxable.C: Portion of shareholders’ equity restricted pursuant to Section 469 of Law No. 266/2005 (so-called
realignment), which, if utilized, would be included in the Company’s taxable income, increased by a 12% substitute tax, with the concurrent earning of a 12% tax credit (equal to the substitute tax paid).
D: Reserves that, if distributed, would not be included in the taxable income of the shareholders.E: Cash flow hedge reserve.
Utilization Options1: Share capital increase.2: Replenishment of losses.3: Distribution to shareholders.
A breakdown according to tax status is provided below:• The reserves the taxation of which has been suspended that are part of share capital, with B status, include
the following (in thousands of euros):No. 576 of 12/1/75 (old Edison form. Montedison) 31,064No. 72 of 3/19/83 (old Edison form. Montedison) 15,283No. 576 of 12/1/75 (former Finagro) 1,331No. 72 of 3/19/83 (former Finagro) 3,310No. 72 of 3/19/83 (former Montedison) 8,561No. 72 of 3/19/83 (former Silos di Genova S.p.A) 186No. 413 of 12/30/91 (former Finagro) 4,762No. 576 of 12/1/75 (former Calcemento) 976No. 72 of 3/19/83 (former Calcemento) 4,722No. 413 of 12/30/91 (former Sondel) 2,976No. 413 of 12/30/91 (old Edison) 118,911

NOTES TO THE SEPARATE FINANCIAL STATEMENTS
56 I 2016 FINANCIAL REPORT
Any taxes that may be due on the reserves would amount to 46 million euros for those of Item B, 83 million euros (net of tax credit) for those of Item C.
Should be noted that the extraordinary shareholder’s meeting of March 22, 2016 resolved not to replenish the designated legal reserve Pursuant to Section 469 Law No. 266/2005 for the amount of 17,552,676.35 euros and the non-distributable reserve Pursuant to subsection 147 L.147/2013 for the amount of 236,673,228.01 euros; These reserves had been used to cover 2015 tax loss.
As for the negative income components that are not reflected in the income statement, which until 2008 could be deducted by listing them on a separate schedule annexed to the income tax return, the provision of the tax code require that a corresponding amount of the unrestricted reserves and retained earnings should be maintained on the Company’s financial statements and, if the abovementioned amount is distributed, it would be included in the Company’s taxable income.
As a result of non-accounting depreciation and amortization taken in 2006 and 2007 and the derecognition in 2004 of entries booked for tax purposes but which had no relevance for statutory reporting purposes, non-accounting deductions still available totaled about 21 million euros. Deferred taxes totaling about 5 million euros were recognized in connection with these entries.
Therefore, should the Company choose to distribute earnings or reserves, it must have residual qualified reserves, as defined in Article 109 of the Uniform Tax Code, totaling 16 million euros. If the Company lacks or has insufficient qualified reserves, any uncovered portion of the distribution, increased by the applicable deferred taxes, would become part of the Company’s taxable income.Lastly, the reform of the corporate income tax system, which went into effect on January 1, 2004, introduced the overriding presumption that the profit for the year and the portion of reserves other than share capital reserves that has not been set aside in a suspended taxation status will be distributed, irrespective of the motions approved by the Shareholder’s Meeting (Article 47 of the Uniform Tax Code).
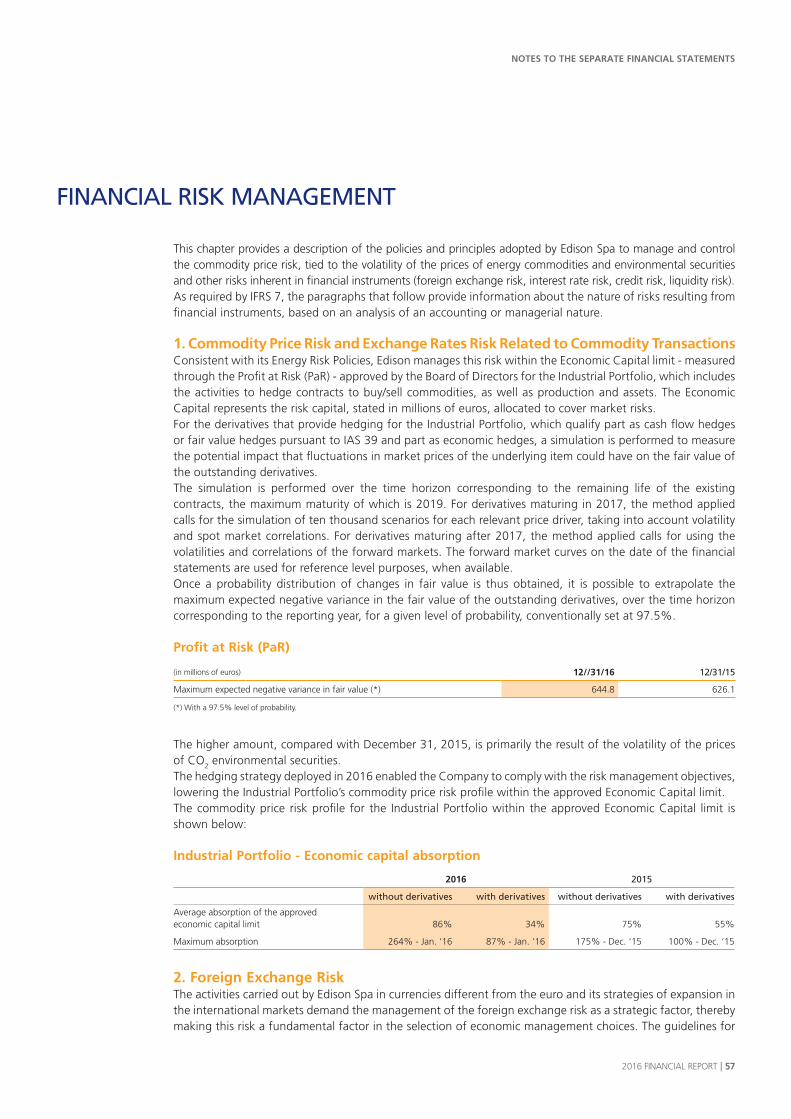
NOTES TO THE SEPARATE FINANCIAL STATEMENTS
2016 FINANCIAL REPORT I 57
FINANCIAL RISK MANAGEMENT
This chapter provides a description of the policies and principles adopted by Edison Spa to manage and control the commodity price risk, tied to the volatility of the prices of energy commodities and environmental securities and other risks inherent in financial instruments (foreign exchange risk, interest rate risk, credit risk, liquidity risk).As required by IFRS 7, the paragraphs that follow provide information about the nature of risks resulting from financial instruments, based on an analysis of an accounting or managerial nature.
1. Commodity Price Risk and Exchange Rates Risk Related to Commodity Transactions Consistent with its Energy Risk Policies, Edison manages this risk within the Economic Capital limit - measured through the Profit at Risk (PaR) - approved by the Board of Directors for the Industrial Portfolio, which includes the activities to hedge contracts to buy/sell commodities, as well as production and assets. The Economic Capital represents the risk capital, stated in millions of euros, allocated to cover market risks.For the derivatives that provide hedging for the Industrial Portfolio, which qualify part as cash flow hedges or fair value hedges pursuant to IAS 39 and part as economic hedges, a simulation is performed to measure the potential impact that fluctuations in market prices of the underlying item could have on the fair value of the outstanding derivatives.The simulation is performed over the time horizon corresponding to the remaining life of the existing contracts, the maximum maturity of which is 2019. For derivatives maturing in 2017, the method applied calls for the simulation of ten thousand scenarios for each relevant price driver, taking into account volatility and spot market correlations. For derivatives maturing after 2017, the method applied calls for using the volatilities and correlations of the forward markets. The forward market curves on the date of the financial statements are used for reference level purposes, when available.Once a probability distribution of changes in fair value is thus obtained, it is possible to extrapolate the maximum expected negative variance in the fair value of the outstanding derivatives, over the time horizon corresponding to the reporting year, for a given level of probability, conventionally set at 97.5%.
Profit at Risk (PaR)
(in millions of euros) 12//31/16 12/31/15
Maximum expected negative variance in fair value (*) 644.8 626.1
(*) With a 97.5% level of probability.
The higher amount, compared with December 31, 2015, is primarily the result of the volatility of the prices of CO2 environmental securities.The hedging strategy deployed in 2016 enabled the Company to comply with the risk management objectives, lowering the Industrial Portfolio’s commodity price risk profile within the approved Economic Capital limit. The commodity price risk profile for the Industrial Portfolio within the approved Economic Capital limit is shown below:
Industrial Portfolio - Economic capital absorption
2016 2015
without derivatives with derivatives without derivatives with derivatives
Average absorption of the approvedeconomic capital limit 86% 34% 75% 55%
Maximum absorption 264% - Jan. ‘16 87% - Jan. ‘16 175% - Dec. ‘15 100% - Dec. ‘15
2. Foreign Exchange Risk The activities carried out by Edison Spa in currencies different from the euro and its strategies of expansion in the international markets demand the management of the foreign exchange risk as a strategic factor, thereby making this risk a fundamental factor in the selection of economic management choices. The guidelines for
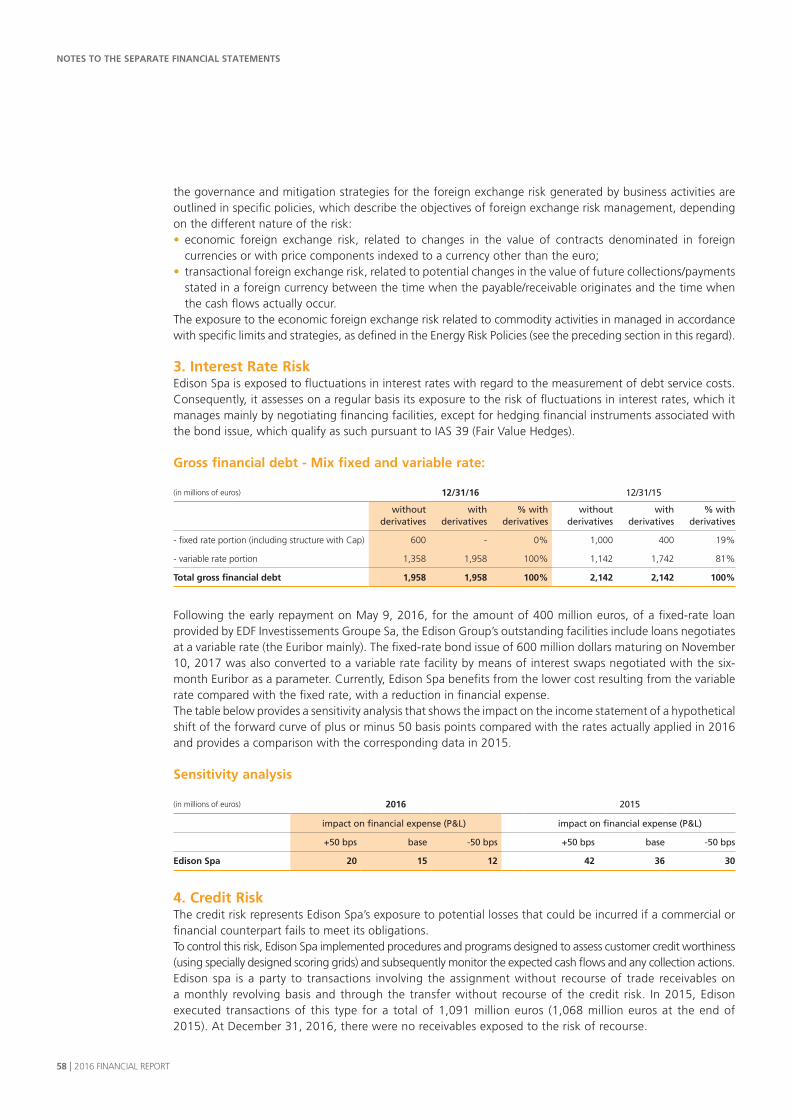
NOTES TO THE SEPARATE FINANCIAL STATEMENTS
58 I 2016 FINANCIAL REPORT
the governance and mitigation strategies for the foreign exchange risk generated by business activities are outlined in specific policies, which describe the objectives of foreign exchange risk management, depending on the different nature of the risk:• economic foreign exchange risk, related to changes in the value of contracts denominated in foreign
currencies or with price components indexed to a currency other than the euro;• transactional foreign exchange risk, related to potential changes in the value of future collections/payments
stated in a foreign currency between the time when the payable/receivable originates and the time when the cash flows actually occur.
The exposure to the economic foreign exchange risk related to commodity activities in managed in accordance with specific limits and strategies, as defined in the Energy Risk Policies (see the preceding section in this regard).
3. Interest Rate RiskEdison Spa is exposed to fluctuations in interest rates with regard to the measurement of debt service costs. Consequently, it assesses on a regular basis its exposure to the risk of fluctuations in interest rates, which it manages mainly by negotiating financing facilities, except for hedging financial instruments associated with the bond issue, which qualify as such pursuant to IAS 39 (Fair Value Hedges).
Gross financial debt - Mix fixed and variable rate:
(in millions of euros) 12/31/16 12/31/15
without derivatives
with derivatives
% with derivatives
without derivatives
with derivatives
% with derivatives
- fixed rate portion (including structure with Cap) 600 - 0% 1,000 400 19%
- variable rate portion 1,358 1,958 100% 1,142 1,742 81%
Total gross financial debt 1,958 1,958 100% 2,142 2,142 100%
Following the early repayment on May 9, 2016, for the amount of 400 million euros, of a fixed-rate loan provided by EDF Investissements Groupe Sa, the Edison Group’s outstanding facilities include loans negotiates at a variable rate (the Euribor mainly). The fixed-rate bond issue of 600 million dollars maturing on November 10, 2017 was also converted to a variable rate facility by means of interest swaps negotiated with the six-month Euribor as a parameter. Currently, Edison Spa benefits from the lower cost resulting from the variable rate compared with the fixed rate, with a reduction in financial expense.The table below provides a sensitivity analysis that shows the impact on the income statement of a hypothetical shift of the forward curve of plus or minus 50 basis points compared with the rates actually applied in 2016 and provides a comparison with the corresponding data in 2015.
Sensitivity analysis
(in millions of euros) 2016 2015
impact on financial expense (P&L) impact on financial expense (P&L)
+50 bps base -50 bps +50 bps base -50 bps
Edison Spa 20 15 12 42 36 30
4. Credit RiskThe credit risk represents Edison Spa’s exposure to potential losses that could be incurred if a commercial or financial counterpart fails to meet its obligations.To control this risk, Edison Spa implemented procedures and programs designed to assess customer credit worthiness (using specially designed scoring grids) and subsequently monitor the expected cash flows and any collection actions.Edison spa is a party to transactions involving the assignment without recourse of trade receivables on a monthly revolving basis and through the transfer without recourse of the credit risk. In 2015, Edison executed transactions of this type for a total of 1,091 million euros (1,068 million euros at the end of 2015). At December 31, 2016, there were no receivables exposed to the risk of recourse.

NOTES TO THE SEPARATE FINANCIAL STATEMENTS
2016 FINANCIAL REPORT I 59
When choosing counterparties for transactions to manage temporary excess liquidity or execute financial hedging contracts (derivatives), Edison Spa deals only with entities with a high credit rating. At December 31, 2016, there were no significant exposures to risks related to a possible further deterioration of the overall financial environment or significant concentrations with individual non-institutional counterparties.
The table below shows an overview of gross trade receivables, the corresponding allowance for doubtful accounts and the guarantees that the Group holds to secure its receivables.
(in millions of euros) 12/31/16 12/31/15
Gross trade receivables 384 957
Allowance for doubtful accounts (-) (35) (42)
Trade receivables 349 915
Guarantees held (*) 174 172
Receivables in arrears
- up to 6 months 7 4
- from 6 to 12 months 1 -
- past 12 months 33 38
(*) Including guarantees covering receivables outstanding at December 31, 2016 totaling 37 million euros.
The Company continues to pursue a credit management approach differentiated over three market segments (Retail, Business and Public Administration), which is aimed, through structural actions, at preventing the formation of new credit and aggressively collect both current and non-performing receivables.The size of the allowance for doubtful accounts is determined conservatively, based on the different underlying credit statuses or, particularly for receivables owed by retail customers, taking into account the relative age of the non-performing receivables.
5. Liquidity Risk The liquidity risk is the risk that Edison Spa may not have access to sufficient financial resources to meet its financial and commercial obligations in accordance with agreed terms and maturities. The table that follows, representing the worst case scenario, provides a prudential evaluation of liabilities, in fact:• includes, in addition to principal and accrued interest, all future interest payments estimated for the entire
length of the underlying debt obligation and the effect of interest rate derivatives;• assets (cash and cash equivalents, trade receivables, etc.) are not taken into account;• financing facilities are treated as if repayable on demand, in the case of revocable lines of credit, or on the
first due date when repayment can be demanded, in other cases.Consequently, the aggregate liability thus computed is larger then the gross financial debt amount used to determine the net financial debt of Edison Spa.
Worst case scenario
(in millions of euros) 12/31/16 12/31/15
1 to 3 months
over 3 months and up to 1 year
more than 1 year
1 to 3 months
over 3 months and up to 1 year
more than1 year
Bonds - 623 - - 23 623
Financial debt and other financial liabilities 265 4 223 152 12 664
Trade payables 779 43 - 779 29 -
Total 1,044 670 223 931 64 1,287
Guarantees provided to third parties (*) 817 213 403 682 188 259
(*) These guarantees, mainly of a commercial nature and related to the Group’s core businesses, are shown based on their remaining contractual maturity. For further details, see the “Commitments and Contingent Risks” section of this Report.

NOTES TO THE SEPARATE FINANCIAL STATEMENTS
60 I 2016 FINANCIAL REPORT
The financial debt maturing within one year (892 million euros) mainly derives from the bond with a face value of 600 million euros, due on November 10, 2017. It also includes, to a lesser extent, a drawdown (150 million euros) on the 600-million-euros credit line provided by EDF Sa, expiring in April 2017.In this regard, it should be noted that Edison is already preparing an overall refinancing plan that will not only provide coverage for all the financial needs contemplated in the expenditure plan but, more generally, the necessary cash flexibility to tackle the forecast uncertainties. The finalization of this plan will take place in 2017, well in advance the main financial maturities. To ensure coverage of the foreseeable Edison financial cash needs in the short term, contribute, in addition to cash generated by operating activities:• custody amounted to 199 million euro on the treasury account with EDF Sa (fully available at December 31,
2016),• credit facilities granted by EDF Sa amounted to 600 million euro and used for 450 million euro, maturing
in April 2017.Medium/long-term debt decreased: in May 2016, Edison repaid ahead of schedule the remaining balance of 400 million euros owed on a facility provided by EDF Investissements Groupe Sa, following another early repayment in December 2015. This transaction was made possible by the collection of the second tranche of the gain generated by the award in the ENI arbitration.Consequently, financial debt due in more than one year (223 million euros) includes the following:• the facility (27 million euros) provided by Intesa Sanpaolo ad Edison S.p.A. for the original amount of 120
million euros, subject to an amortization plan and maturing on June 15, 2019;• the amounts drawn (132 million euros) from the medium/long-term direct line provided by the European
Investment Bank (EIB) to finance gas storage projects;• a drawdown of 70 million euros from a ten-year line totaling 200 million euros, provided by EDF Sa with
EIB funds to finance Exploration & Production investment projects in Italy.
The table below shows expiration date and counterparties:
(in millions of euros) 12/31/2017 12/31/2018 12/31/2019 12/31/2020 12/31/2021 Over 5 years Total
Bonds 614,818 - - - - - 614,818
Debt and other financial liabilities due to third parties 76,217 22,837 17,367 11,913 11,913 76,957 217,204
Gross financial debt due to third parties 691,035 22,837 17,367 11,913 11,913 76,957 832,022
Intragroup gross financial debt 792,734 - - - - - 792,734
Financial debt due to TDE 112,246 - - - - - 112,246
Financial debt due to EDF 150,585 - 10,000 10,000 10,000 40,000 220,585
Total gross financial debt 1,746,600 22,837 27,367 21,913 21,913 116,957 1,957,587
6. Default Risk and Debt CovenantsThis type of risk arises from the possibility that loan agreements or bond indentures executed by Edison Spa may contain provisions that, if certain events were to occur, would empower the lenders, be they banks or bondholders, to demand that the borrower repay immediately the loaned amounts, which, consequently, would create a liquidity risk (see the “Liquidity Risk” section above).The following bond issue floated by Edison Spa (Euro Medium Term Notes) with a total face value of 600 million euros was outstanding at December 31, 2016:
Description Issuer Market where traded
ISIN Code Term (years) Maturity
Face value(millions of euros)
Coupon
Currentrate
EMTN 2010 Edison Spa LuxembourgStock Exch.
XS0557897203 7 11/10/17 600 Fixedannual
3.875%
In addition, the outstanding debt of Edison Spa includes non-syndicated facilities totaling 829 million euros, 450 million euros of which are available.

NOTES TO THE SEPARATE FINANCIAL STATEMENTS
2016 FINANCIAL REPORT I 61
Consistent with international practice for similar transactions, both the bank loan agreements and the Euro Medium Term Note Program provide the lender or the bondholder with the right to demand the payment of the loaned amount and terminate ahead of schedule their relationship with the borrower whenever the borrower is declared insolvent and/or is a party to bankruptcy proceedings (such as receivership or composition with creditors) or is undergoing liquidation or other proceedings with a similar effect.Specifically, the bond indentures, consistent with market practices, include a series of standard clauses that, in the event of non-performance, require that the issuer immediately redeem the bonds. The main clauses of this type are: (i) negative pledge clauses, by virtue of which the borrower undertakes to refrain from providing to the new bondholders Edison Group assets as collateral beyond a specific amount; (ii) cross default/cross acceleration clauses, which establish an obligation to immediately repay the bonds in the event of material failures to perform obligations that arise from or are generated by other loan agreements that affect a significant portion of the total indebtedness owed by Edison Group companies; and (iii) clauses that establish an obligation of immediate repayment even if just some Edison Group companies were to be declared insolvent.As for credit line agreements and loan agreements to which Edison is a party, it is important to note that the loans with EDF Sa set forth Edison’s obligation to comply with certain commitments, which include making sure that the lenders are being afforded a treatment equal to the one offered to other unsecured creditors (pari passu clause), as well as restrictions on Edison’s Spa ability to provide collateral to new lenders (negative pledge clause).Neither the loan agreement nor the bond indentures contain clauses that could determine, ipso facto, the early termination of the loan if the credit rating assigned to Edison Spa by the rating agencies is downgraded or cancelled. Moreover, Edison Spa is not required, under the terms of any of its credit lines, to comply with specific financial statement ratios that limit the level of debt based on economic performance (financial covenants).Lastly, please note that the direct medium/long-term credit line provided by the European Investment Bank (EIB) (132 million euros fully utilized) earmarked to finance natural gas storage projects is subject, in addition to clauses that are standard for direct long-term facilities to usage restrictions that the EIB imposes for special purpose facilities provided to industrial companies. Similar clauses, albeit less strict, apply to the new credit line of 200 million euros provided by EDF Sa, with EIB funds, to finance some Italian investment projects in the hydrocarbon sector.At present, Edison Spa is not aware of the existence of any default situation or failure to satisfy the covenants.
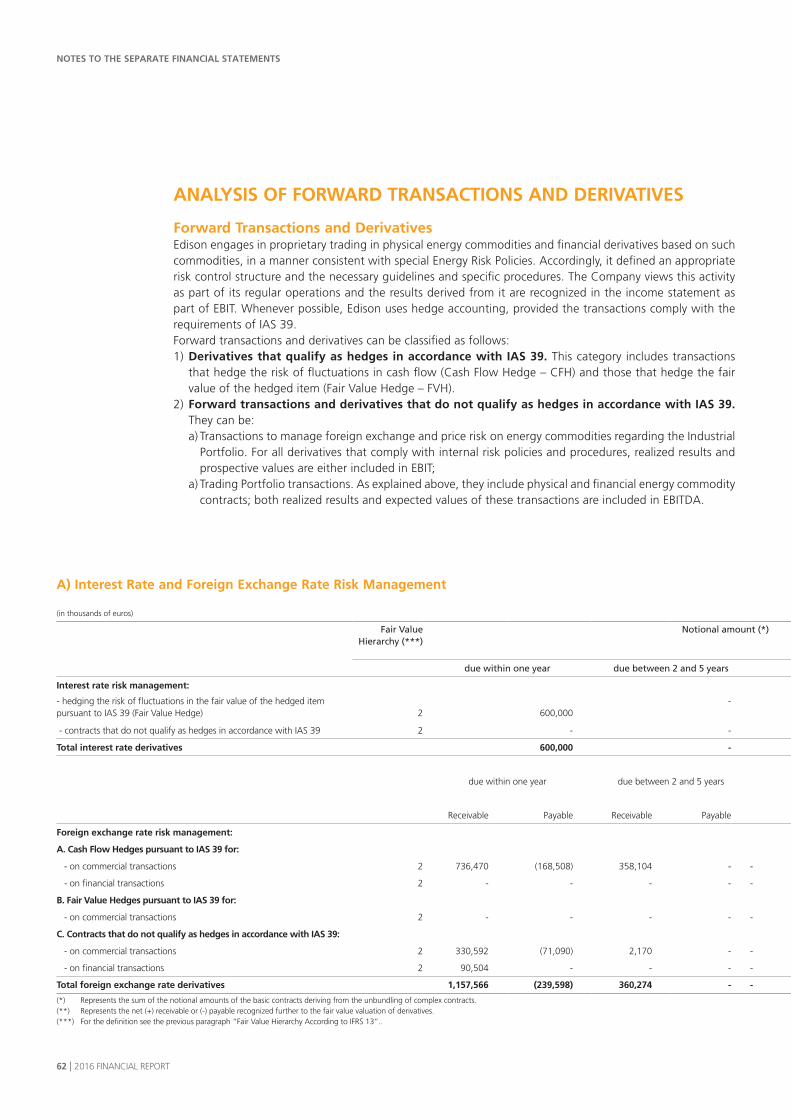
NOTES TO THE SEPARATE FINANCIAL STATEMENTS
62 I 2016 FINANCIAL REPORT
ANALYSIS OF FORWARD TRANSACTIONS AND DERIVATIVES
Forward Transactions and DerivativesEdison engages in proprietary trading in physical energy commodities and financial derivatives based on such commodities, in a manner consistent with special Energy Risk Policies. Accordingly, it defined an appropriate risk control structure and the necessary guidelines and specific procedures. The Company views this activity as part of its regular operations and the results derived from it are recognized in the income statement as part of EBIT. Whenever possible, Edison uses hedge accounting, provided the transactions comply with the requirements of IAS 39.Forward transactions and derivatives can be classified as follows:1) Derivatives that qualify as hedges in accordance with IAS 39. This category includes transactions
that hedge the risk of fluctuations in cash flow (Cash Flow Hedge – CFH) and those that hedge the fair value of the hedged item (Fair Value Hedge – FVH).
2) Forward transactions and derivatives that do not qualify as hedges in accordance with IAS 39. They can be:a) Transactions to manage foreign exchange and price risk on energy commodities regarding the Industrial
Portfolio. For all derivatives that comply with internal risk policies and procedures, realized results and prospective values are either included in EBIT;
a) Trading Portfolio transactions. As explained above, they include physical and financial energy commodity contracts; both realized results and expected values of these transactions are included in EBITDA.
A) Interest Rate and Foreign Exchange Rate Risk Management
(in thousands of euros) December 31, 2016 December 31, 2015
Fair Value Hierarchy (***)
Notional amount (*) Carrying amount (**)
Notional amount (*)
Cumulative impact on the income
statement (***)
due within one year due between 2 and 5 years due after 5 years Total
Interest rate risk management:
- hedging the risk of fluctuations in the fair value of the hedged item pursuant to IAS 39 (Fair Value Hedge) 2 600,000
- - 600,000 15,011 600,000 28,374
- contracts that do not qualify as hedges in accordance with IAS 39 2 - - - - (29) - (51)
Total interest rate derivatives 600,000 - - 600,000 14,982 600,000 28,323
due within one year due between 2 and 5 years due after 5 years Total Total
Receivable Payable Receivable Payable Receivable Payable Receivable Payable Receivable Payable
Foreign exchange rate risk management:
A. Cash Flow Hedges pursuant to IAS 39 for:
- on commercial transactions 2 736,470 (168,508) 358,104 - - - 1,094,574 (168,508) 53,013 2,748,772 (15,964) 134695 134,695
- on financial transactions 2 - - - - - - - - - - - - -
B. Fair Value Hedges pursuant to IAS 39 for:
- on commercial transactions 2 - - - - - - - - 47,967 - - - -
C. Contracts that do not qualify as hedges in accordance with IAS 39:
- on commercial transactions 2 330,592 (71,090) 2,170 - - - 332,762 (71,090) 22,366 1,116,504 (400,270) 122,630 122,630
- on financial transactions 2 90,504 - - - - - 90,504 - (159) 274 274 274 274
Total foreign exchange rate derivatives 1,157,566 (239,598) 360,274 - - - 1,517,840 (239,598) 123,187 3,865,550 (415,960) 257,599 257,599
(*) Represents the sum of the notional amounts of the basic contracts deriving from the unbundling of complex contracts. (**) Represents the net (+) receivable or (-) payable recognized further to the fair value valuation of derivatives.(***) For the definition see the previous paragraph “Fair Value Hierarchy According to IFRS 13”..

NOTES TO THE SEPARATE FINANCIAL STATEMENTS
2016 FINANCIAL REPORT I 63
Fair Value Hierarchy According to IFRS 13The classification of financial instruments at fair value required by IFRS 13, which is determined based on the reliability of inputs used to measure fair value, uses the following hierarchical ranking:• Level 1: Determination of fair value based on quoted prices (unadjusted) for identical assets or liabilities in
active markets; this category includes the instruments with which the Company operates directly in active markets (e.g., futures).
• Level 2: Determination of fair value based on inputs other than the quoted prices of Level 1 but which are directly or indirectly observable. (e.g., forward contracts or swaps in futures markets);
• Level 3: Determination of fair value based on valuation models with inputs not based on observable market data (unobservable inputs). At this point, as was the case at December 31, 2015, there is no one category of instruments classified at this level.
The valuation of financial instruments can entail significant subjective judgment. However, Edison Spa uses prices quoted in active markets, when available, as the best estimate of the fair value of all derivative
Instruments Outstanding at December 31, 2016The tables that follow provide an illustration of the information listed below: • fair value hierarchy;• derivatives that were outstanding, classified by maturity; • the value at which these contracts are reflected on the balance sheet, which is their fair value.
A) Interest Rate and Foreign Exchange Rate Risk Management
(in thousands of euros) December 31, 2016 December 31, 2015
Fair Value Hierarchy (***)
Notional amount (*) Carrying amount (**)
Notional amount (*)
Cumulative impact on the income
statement (***)
due within one year due between 2 and 5 years due after 5 years Total
Interest rate risk management:
- hedging the risk of fluctuations in the fair value of the hedged item pursuant to IAS 39 (Fair Value Hedge) 2 600,000
- - 600,000 15,011 600,000 28,374
- contracts that do not qualify as hedges in accordance with IAS 39 2 - - - - (29) - (51)
Total interest rate derivatives 600,000 - - 600,000 14,982 600,000 28,323
due within one year due between 2 and 5 years due after 5 years Total Total
Receivable Payable Receivable Payable Receivable Payable Receivable Payable Receivable Payable
Foreign exchange rate risk management:
A. Cash Flow Hedges pursuant to IAS 39 for:
- on commercial transactions 2 736,470 (168,508) 358,104 - - - 1,094,574 (168,508) 53,013 2,748,772 (15,964) 134695 134,695
- on financial transactions 2 - - - - - - - - - - - - -
B. Fair Value Hedges pursuant to IAS 39 for:
- on commercial transactions 2 - - - - - - - - 47,967 - - - -
C. Contracts that do not qualify as hedges in accordance with IAS 39:
- on commercial transactions 2 330,592 (71,090) 2,170 - - - 332,762 (71,090) 22,366 1,116,504 (400,270) 122,630 122,630
- on financial transactions 2 90,504 - - - - - 90,504 - (159) 274 274 274 274
Total foreign exchange rate derivatives 1,157,566 (239,598) 360,274 - - - 1,517,840 (239,598) 123,187 3,865,550 (415,960) 257,599 257,599
(*) Represents the sum of the notional amounts of the basic contracts deriving from the unbundling of complex contracts. (**) Represents the net (+) receivable or (-) payable recognized further to the fair value valuation of derivatives.(***) For the definition see the previous paragraph “Fair Value Hierarchy According to IFRS 13”..
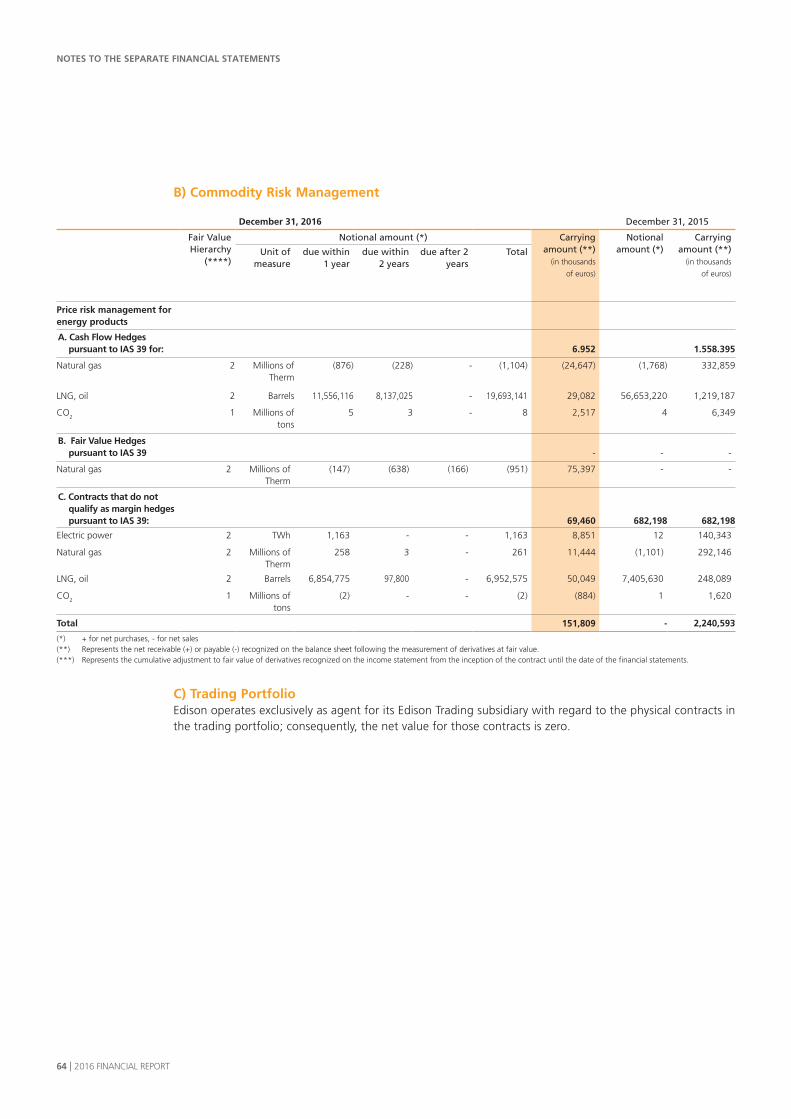
NOTES TO THE SEPARATE FINANCIAL STATEMENTS
64 I 2016 FINANCIAL REPORT
B) Commodity Risk Management
December 31, 2016 December 31, 2015
Fair Value Hierarchy
(****)
Notional amount (*) Carrying amount (**)
(in thousands
of euros)
Notional amount (*)
Carrying amount (**)
(in thousands
of euros)
Unit of measure
due within 1 year
due within 2 years
due after 2 years
Total
Price risk management for energy products
A. Cash Flow Hedges pursuant to IAS 39 for: 6.952 1.558.395
Natural gas 2 Millions of Therm
(876) (228) - (1,104) (24,647) (1,768) 332,859
LNG, oil 2 Barrels 11,556,116 8,137,025 - 19,693,141 29,082 56,653,220 1,219,187
CO2 1 Millions of tons
5 3 - 8 2,517 4 6,349
B. Fair Value Hedges pursuant to IAS 39 - - -
Natural gas 2 Millions of Therm
(147) (638) (166) (951) 75,397 - -
C. Contracts that do not qualify as margin hedges pursuant to IAS 39: 69,460 682,198 682,198
Electric power 2 TWh 1,163 - - 1,163 8,851 12 140,343
Natural gas 2 Millions of Therm
258 3 - 261 11,444 (1,101) 292,146
LNG, oil 2 Barrels 6,854,775 97,800 - 6,952,575 50,049 7,405,630 248,089
CO2 1 Millions of tons
(2) - - (2) (884) 1 1,620
Total 151,809 - 2,240,593
(*) + for net purchases, - for net sales(**) Represents the net receivable (+) or payable (-) recognized on the balance sheet following the measurement of derivatives at fair value.(***) Represents the cumulative adjustment to fair value of derivatives recognized on the income statement from the inception of the contract until the date of the financial statements.
C) Trading PortfolioEdison operates exclusively as agent for its Edison Trading subsidiary with regard to the physical contracts in the trading portfolio; consequently, the net value for those contracts is zero.
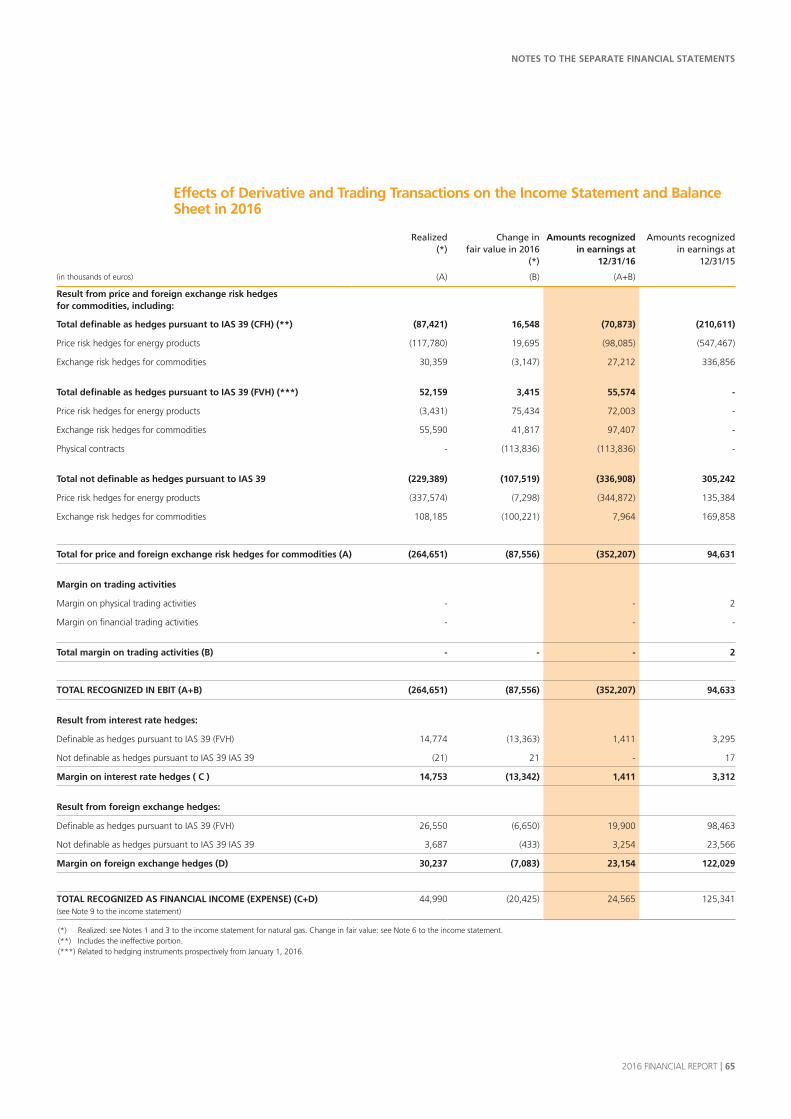
NOTES TO THE SEPARATE FINANCIAL STATEMENTS
2016 FINANCIAL REPORT I 65
Effects of Derivative and Trading Transactions on the Income Statement and Balance Sheet in 2016
Realized(*)
Change in fair value in 2016
(*)
Amounts recognized in earnings at
12/31/16
Amounts recognized in earnings at
12/31/15
(in thousands of euros) (A) (B) (A+B)
Result from price and foreign exchange risk hedges for commodities, including:
Total definable as hedges pursuant to IAS 39 (CFH) (**) (87,421) 16,548 (70,873) (210,611)
Price risk hedges for energy products (117,780) 19,695 (98,085) (547,467)
Exchange risk hedges for commodities 30,359 (3,147) 27,212 336,856
Total definable as hedges pursuant to IAS 39 (FVH) (***) 52,159 3,415 55,574 -
Price risk hedges for energy products (3,431) 75,434 72,003 -
Exchange risk hedges for commodities 55,590 41,817 97,407 -
Physical contracts - (113,836) (113,836) -
Total not definable as hedges pursuant to IAS 39 (229,389) (107,519) (336,908) 305,242
Price risk hedges for energy products (337,574) (7,298) (344,872) 135,384
Exchange risk hedges for commodities 108,185 (100,221) 7,964 169,858
Total for price and foreign exchange risk hedges for commodities (A) (264,651) (87,556) (352,207) 94,631
Margin on trading activities
Margin on physical trading activities - - 2
Margin on financial trading activities - - -
Total margin on trading activities (B) - - - 2
TOTAL RECOGNIZED IN EBIT (A+B) (264,651) (87,556) (352,207) 94,633
Result from interest rate hedges:
Definable as hedges pursuant to IAS 39 (FVH) 14,774 (13,363) 1,411 3,295
Not definable as hedges pursuant to IAS 39 IAS 39 (21) 21 - 17
Margin on interest rate hedges ( C ) 14,753 (13,342) 1,411 3,312
Result from foreign exchange hedges:
Definable as hedges pursuant to IAS 39 (FVH) 26,550 (6,650) 19,900 98,463
Not definable as hedges pursuant to IAS 39 IAS 39 3,687 (433) 3,254 23,566
Margin on foreign exchange hedges (D) 30,237 (7,083) 23,154 122,029
TOTAL RECOGNIZED AS FINANCIAL INCOME (EXPENSE) (C+D)(see Note 9 to the income statement)
44,990 (20,425) 24,565 125,341
(*) Realized: see Notes 1 and 3 to the income statement for natural gas. Change in fair value: see Note 6 to the income statement.(**) Includes the ineffective portion.(***) Related to hedging instruments prospectively from January 1, 2016.

NOTES TO THE SEPARATE FINANCIAL STATEMENTS
66 I 2016 FINANCIAL REPORT
The table below provides a breakdown of the amounts recognized on the balance sheet for the measurement at fair value of derivatives and physical contracts outstanding at December 31, 2016 and their classification in accordance with the fair value hierarchy according to IFRS 13:
(in thousands of euros) 12/31/16 12/31/15
Receivables Payables Net Receivables Payables Net
- “Current financial assets” and “Short term financial debt” 15,011 (29) 14,982 28,374 (51) 28,323
- “Other receivables and payables” 479,727 (445,775) 33,952 1,004,027 (1,345,214) (341,187)
- “Other assets” and “Other liabilities” 201,319 (74,110) 127,209 225,368 (313,877) (88,509)
Fair value recognized as a current asset or a current liability (A) 696,057 (519,914) 176,143 1,257,769 (1,659,142) (401,373)
Transactions on:
- interest rates 15,011 (29) 14,982 28,374 (51) 28,323
- foreign exchange 135,300 (12,113) 123,187 274,050 (9,787) 264,263
- commodities 507,785 (355,976) 151,809 954,870 (1,648,829) (693,959)
- Trading transactions - - - 475 (475) -
- Fair Value on physical contracts 37,961 (151,796) (113,835) - - -
Of which fair value hierarchy:
- Level 1 7,128 (5,496) 1,632 8,090 (121) 7,969
- Level 2 281,654 (206,875) 74,779 1,249,678 (1,659,020) (409,342)
IFRS7 potential offsetting (B) (355,202) 355,202 (506,675) 506,675
Potential fair value (A+B) 340,855 (164,712) 176,143 751,094 (1,152,467) (401,373)
With regard to the items listed above, please note that the receivables and payables shown are offset in shareholders’ equity by a negative cash flow hedge reserve amounting to 51,854.,000 euros (negative by 737,361,000 euros at December 31, 2015), before the applicable deferred taxes.
It is worth of mentioning that, as result of the prospective application of the Fair Value Hedge as of January 1, 2016, some hedging relationships have been revoked. The fair value recorded at the date of revocation was maintained in the Cash Flow Hedge Reserves and is reflected in the income statement in line with the effects of the hedged item; at December 31, 2016 this fair value is negative by about 103 million euros.In 2016 were also revoke some Cash Flow Hedge relationships in order to ensure, prospectively, new Cash Flow Hedge relationships.
To complete the information provided above with regard to the fair value hierarchy pursuant to IFRS 13, please note that:• Available-for-sale investments include for 153 million euros (159 million euros at December 31, 2015)
unlisted securities classified at Level 3. Consequent to the disposal of RCS MediaGroup shares, no securities are classified at Level 1.
• Current financial assets include for 2 million euros, unchanged compared to December 31, 2015 equity investment held for trading classified at Level 1.
Please also note that Edison Spa chose not to adopt the fair value option and, consequently neither financial debt nor bonds were restated at fair value.

NOTES TO THE SEPARATE FINANCIAL STATEMENTS
2016 FINANCIAL REPORT I 67
INTERCOMPANY AND RELATED-PARTY TRANSACTIONS
Consistent with the applicable policies adopted by the Company, transactions with related parties affecting the income statement and balance sheet that were outstanding at December 31, 2016 are reviewed below. as required to meet the disclosure requirements of IAS 24. These transactions were executed in the normal course of business and on contractual terms that were consistent with standard market practices. Please note that on March 22, 2016, effective April 1, 2016, the Extraordinary Shareholders’ Meeting of Edison Spa approved, the conveyance to Edison, by the Parent Company Transalpina di Energia Spa, of 100% of its equity stake in Fenice Spa, an EDF Group company specialized in the provision of energy and environmental services which operates in Italy, Russia and, through two subsidiaries, in Poland and Spain; in September 2016 Fenice Rus Llc was disposed.The transaction was carried out through a share capital increase in kind reserved for Transalpina di Energia Spa, for a total of 247 million dollars, including about 85 million euros in share capital increase and about 162 million euros in additional paid-in capital.In order to meet its foreseeable financial needs, Fenice was provided with financing in the original amount of 150 million euros, at December 31, 2016 decreased to 130 million of euros, on terms consistent with the best available on the market. The table below summarizes the Company’s related-party transactions:
(in thousands of euros)
Related Parties pursuant to IAS 24 Total forfinancial statem.
line item
% impact
With Edison Group companies
With controlling companies
With other EDF Group companies
Total for related parties
Balance Sheet transactions:
Investments in associates 1,224,211 - 536 1,224,747 1,224,747 100.0%
Other assets - - 45,595 45,595 286,203 15.9%
Trade receivables 668,914 126 3,599 672,639 1,020,039 65.9%
Other receivables 89,309 51,583 109,961 250,853 868,518 28.9%
Current financial assets 1,777,292 73,014 - 1,850,306 1,867,810 99.1%
Financial debt and other fin. liabilities - 70,000 - 70,000 210,987 33.2%
Other liabilities - - 49,294 49,294 74,110 66.5%
Current financial debt 792,726 262,835 - 1,055,561 1,113,782 94.8%
Trade payables 35,314 1,229 10,814 47,357 821,930 5.8%
Other payables 4,081 2,643 48,299 55,023 629,718 8.7%
Income Statement transactions:
Sales revenues 2,617,971 3,903 179,007 2,800,881 6,154,385 45.5%
Other revenues and income 16,004 1,434 509 17,947 120,487 14.9%
Raw materials and services used 510,367 18,263 28,732 557,362 6,107,771 9.1%
Financial income 37,223 - - 37,223 60,249 61.8%
Financial expense 1,184 2,647 27,315 31,146 85,496 36.4%
Foreign exchange gains and losses - 33,433 - 33,433 9,077 n.s.
Income from equity investments 208,434 - 600 209,034 268,483 77.9%
Expense on equity investments 135,108 - - 135,108 136,827 98.7%
NOTES TO THE SEPARATE FINANCIAL STATEMENTS
68 I 2016 FINANCIAL REPORT
A) Intercompany Transactions and with Controlling CompaniesTransactions between Edison Spa and its subsidiaries and affiliated companies and its controlling companies consist primarily of:• commercial transactions involving the buying and selling of electric power, natural gas, green certificates;• transactions involving contracts for the provision of services (technical, organizational, legal and
administrative) by headquarters staff functions;• financial transactions involving lending, risk hedging and current account facilities established within the
framework of the cash pooling system of Edison Spa with its subsidiaries and of EDF Sa with Edison Spa;• transactions required to file a consolidated VAT return for the Company (so-called VAT Pool;• transactions required to file the consolidated IRES return with its controlling company Transalpina di Energia Spa;• transactions with EDF Sa involving the provision of services (mainly financial and insurance).
With the exception of transactions related to the VAT Pool and the consolidated corporate income tax return, which are executed first of all pursuant to law, all of the transactions listed above are governed by contracts with conditions that are consistent with market terms, i.e., the terms that would be applied by two independent parties. In the area of commercial transactions, the Group’s Parent Company, Edison Spa, sells natural gas and electric power to Edison Trading Spa and Edison Energia Spa, respectively, under special contracts that, taking into account the specific functions of the two buyer companies within the Group, provide the seller with adequate coverage of its fixed and variable costs.
Consolidated VAT ReturnEdison Spa files a consolidated VAT return (so-called VAT Pool) that includes those companies of the Edison Group that meet the requirements of Article 73, Section 3, of Presidential Decree No. 633/72. The VAT Group return for December 31, 2016 showed a credit of 126 million euros which will be issued for requests for partial reimbursements in the annual income tax return.
B)Transactions with Controlling CompaniesConsolidated Corporate Income Tax (IRES) Return Filed by Transalpina di Energia SpaThe Group taxation option for corporate income tax (IRES) purposes pursuant to Article 117 and following articles of the Uniform Income Tax Code - so-called National Consolidated Tax Return - which is filed by Transalpina di Energia Spa (TdE) and involves all the main Group companies, was renewed within the statutory deadline for another three years (2016-2018). Consequently, the companies included in the return must determine their IRES liability in coordination with the Parent Company TdE. Mutually agreed commitments and actions are governed by new bilateral agreements executed.by TdE the consolidating entity and the individual companies.
Intercompany current account by Transalpina di Energia SpaWith the aim to optimize available financial resources, TdE provided Edison Spa with funding in the form of a short term deposit; this deposit totaled 95 million euros at December 31, 2015). In the interests of simplification and standardization of intragroup financial transactions in December 2016 this deposit was replaced by a intercompany current account. The current account has a debit balance for 112,246,000 euros.
Centralized Cash Management System by EDF SaPlease note that, in 2012, EDF Sa and Edison Spa signed a centralized cash management contract, pursuant to which EDF manages the cash surpluses and needs of the Edison Group, with the aim of optimizing short-term cash flows. At December 31, 2016, Edison’s current account with EDF had a credit balance of 73,014,000 euros (debit balance of 56,778,000 euros a December 31, 2015).
Loan by EDF SaThe credit line provided by EDF to Edison Spa (600 million euros face value), renewed in 2015 with expiration date on April 9 2017, had been drawn for 150 million euros at December 31, 2016. The loan was provided on terms in line with those granted in the market to companies with Edison’s credit rating. In addition, in December 2015, EDF Sa provided Edison Spa with a new medium/long-term credit line (for up to 200 million euros and ten year duration) earmarked for investment projects and linked with a credit
NOTES TO THE SEPARATE FINANCIAL STATEMENTS
2016 FINANCIAL REPORT I 69
line provided by the BEI to EDF Sa; at December 31, 2016, this line had been utilized by 70,000,000 euros unchanged compared to the previous year.
Other transactions with EDF SaWith regard to the contracts for the provision of services by EDF Sa (mainly financial and insurance) and the rebilling of other charges, the cost for the year amounted to about 18,263,000 euros (15,942,000 euros in 2015). Please note that within the framework of certain financial transactions Edison executed transaction to hedge foreign exchange risks that, due to the trend in foreign exchange rate, generated net realized gains for 33,433,000 euros (174,895,000 euros in 2015).
C) Transactions with other Companies of EDF GroupThe main transactions with EDF Group companies are reviewed below:
1) Commercial transactions Transactions executed in 2015 with EDT Trading limited included revenues from the sale of electric power and natural gas for 37,141,000 euros (106,415,000 euros in 2015) and costs realized under commodity trading contracts for 29,677,000 euros (106,019,000 euros in 2015). These amounts include realized commodity derivative transactions with EDF Trading Limited, that generated gains for 260,767,000 euros (70,493,000 euros in 2015) and charges for 14,610,000 euros (74,647,000 euros in 2015), included in “Realized commodity derivatives” “Sales revenues” and “Raw materials and services used.”
As for the amounts of the balance sheet positions resulting from the transactions reviewed above, please see the data in the preceding table.
2) Financial transactionsOutstanding loan with EDF Investissements Groupe SaThe remaining balance of 400 million euros on a long-term facility provided to Edison Spa (800 million euros original face value amount, maturing on April 9, 2020, 400 million euros of which had already been paid ahead of schedule in December 215) was repaid in full ahead of schedule in May 2016. The interest accrued during the year totaled 27,714,000 euros, including 19,908,000 euros di breakage costs.

NOTES TO THE SEPARATE FINANCIAL STATEMENTS
70 I 2016 FINANCIAL REPORT
OTHER INFORMATION
Significant Nonrecurring Events and Transactions Pursuant to Consob Communication No. DEM/6064293 of July 28, 2006, please note that:• on March 22, 2016, effective April 1, 2016, the Extraordinary Shareholders’ Meeting of Edison Spa
approved the conveyance to Edison, by the Parent Company Transalpina di Energia Spa, of 100% of its equity stake in Fenice Spa, an EDF Group company specialized in the provision of energy and environmental services that operates in Italy and, through subsidiaries in Poland and Spain. The transaction was carried out through a share capital increase in kind reserved for Transalpina di Energia Spa, for a total of 247 million dollars, including about 85 million euros in share capital increase and about 162 million euros in additional paid-in capital.
• in the second quarter of 2016, Edison and ENI signed an agreement revising the price formula of the long-term contract for importation of natural gas from Libya. The new formula is being applied to imported volumes starting on October 1, 2015 and is valid for three years. The signing of this agreement marks the conclusion of the price review of the long-term contract to import a total of four billion cubic meters of gas a year, started by ENI in the last quarter of 2015;
• On September 1, 2016, Edison and RasGas signed an agreement revising the price formula of the long-term contract for importation of natural gas from Qatar, bringing in line with current market terms. This agreements marks the completion of commercial negotiations that began at the end of 2015 and strengthens the collaborative spirit of the two companies regarding the long-term contract for the supply of 6.4 billion cubic meters of gas a year, in effect since 2009.
Transactions Resulting from Atypical and/or Unusual ActivitiesEdison Spa declares that it did not execute atypical and/or unusual transactions in 2015, as defined in the CONSOB Communication No. DEM/6064293 of July 28, 2006.
Treasury SharesAt December 31, 2016, the Company did not hold any treasury shares.
Compensation, Stock Options and Equity Investments of Directors, Executives and Statutory AuditorsFor information concerning:• the compensation of Directors and Statutory Auditors;• stock options awarded to Directors;• equity investments of Directors;
please consult the Annual Compensation Report.
NOTES TO THE SEPARATE FINANCIAL STATEMENTS
2016 FINANCIAL REPORT I 71
SIGNIFICANT EVENTS OCCURRING AFTER DECEMBER 31, 2016
No significant events requiring disclosure occurred since December 31, 2016.
Milan, February 13, 2017
The Board of Directors by Marc BenayounChief Executive Officer

72 I 2016 FINANCIAL REPORT
LIST OF EQUITY INVESTMENTS
LIST OF EQUITY INVESTMENTS
(1) Amounts in euros.(*) Company subject to management and coordination by Edison Spa.
The currency codes used are consistent with the ISO 4217 International Standard.
BRL Brazilian real CHF Swiss franc EUR Euro GBP British pound USD U.S. dollar
A1. Investments in subsidiaries(Amounts in euros) Share capital Shares or par value interests held Initial value Changes during the year Eding value at December 31, 2016
Company Head office Curr. Amount Parvalue
pershare
% Number or parvalue
Cost(1)
Revaluations (Writedowns)
Netcarryingamount
(1)
Additions Disposals Advance on (Distribution
of) capital and reserves
Coverage of loss
Revaluations (Writedowns)
Conveyance Other changes
Cost (1)
Revaluations (Writedowns)
Net carrying amount
(1)
S.E last financial
statements
Pro rata interest
in S.E
Net result last fin.
statements
Pro rata interest
in net result
AMG Gas Srl Palermo (*) EUR 100,000 - 80.000 80,000 25,100,000 (800,000) 24,300,000 - - - - - - - 25,100,000 (800,000) 24,300,000 6,878,824 5,503,059 2,269,290 1,815,432
Atema DAC Dublin Ireland EUR 1,500,000 0.50 100.000 3,000,000 1,381,681 - 1,381,681 - - - - - - - 1,381,681 - 1,381,681 1,849,536 1,849,536 (60,132) (60,132)
Cellina Energy Srl Milan EUR 5,000,000 - 100.000 5,000,000 - - - 171,128,000 - - - - - - 171,128,000 - 171,128,000 179,850,841 179,850,841 (3,382,614) (3,382,614)
Dolomiti Edison Energy Srl Trent EUR 5,000,000 - 49.000 2,450,000 8,187,900 - 8,187,900 - - - - - - - 8,187,900 - 8,187,900 25,680,940 12,583,661 3,757,068 1,840,963
Edison Egypt Energy Service Jsc New Cairo (Egypt) EGP 20,000,000 1.00 1.000 200,000 - - - 10,404 - - - - - - 10,404 - 10,404 - - - -
Edison Energia Spa (Sole shareholder) Milan (*) EUR 23,000,000 1.00 100.000 23,000,000 141,944,253 (106,133,533) 35,810,720 - - 30,000,000 - (3,787,360) - - 171,944,253 (109,920,893) 62,023,360 47,247,794 47,247,794 (3,787,360) (3,787,360)
Edison Engineering Sa Athens (Greece) EUR 260,001 3.00 100.000 86,667 260,001 (123,001) 137,000 - - - - (26,000) - - 260,001 (149,001) 111,000 111,288 111,288 (23,212) (23,212)
Edison Hellas Sa Athens (Greece) EUR 263,700 2.93 100.000 90,000 187,458 (8,000) 179,458 - - - - - - - 187,458 (8,000) 179,458 454,096 454,096 39,860 39,860
Edison Idrocarburi Sicilia Srl(Sole shareholder)
Ragusa (*) EUR 1,000,000 - 100.000 1,000,000 11,643,346 (18,000) 11,625,346 - - - - - - - 11,643,346 (18,000) 11,625,346 32,625,727 32,625,727 (6,572,298) (6,572,298)
Edison International Spa Milan (*) EUR 75,000,000 1.00 100.000 75,000,000 773,221,794 (460,793,794) 312,428,000 - - - - (102,044,000) - - 773,221,794 (562,837,794) 210,384,000 251,309,683 251,309,683 (86,513,867) (86,513,867)
Edison International Holding NV Amsterdam (Netherlands) EUR 123,500,000 1.00 100.000 123,500,000 310,087,200 (244,685,245) 65,401,955 - - 17,500,000 - (28,479,956) - - 327,587,200 (273,165,201) 54,421,999 54,725,968 54,725,968 (50,822,117) (50,822,117)
Edison Stoccaggio Spa(Sole shareholder)
Milan (*) EUR 90,000,000 1.00 100.000 90,000,000 134,280,847 - 134,280,847 - - - - - - - 134,280,847 - 134,280,847 179,397,195 179,397,195 16,962,096 16,962,096
Edison Trading Spa (Sole shareholder) Milan (*) EUR 30,000,000 1.00 100.000 30,000,000 30,000,000 - 30,000,000 - - - - - - - 30,000,000 - 30,000,000 245,402,468 245,402,468 136,471,410 136,471,410
Edison Partecipazioni Energie Rinnovabili Srl
Milan (*) EUR 20,000,000 - 83.300 16,660,000 153,499,666 - 153,499,666 - - (2,127,232) - - - - 151,372,434 - 151,372,434 141,183,662 117,605,990 4,714,060 3,926,812
Eolo Energia Srl Milan (*) EUR 10,000 - 100.000 10,000 - - - 10,000 (10,000) - - - - - - - - - - - -
Euroil Exploration Ltd London (England) GBP 9,250,000 1.00 0.000 1 950 - 950 - - - - - - - 950 - 950 938,042 - (11,739,638) -
Fenice Qualità per l'ambiente Spa Rivoli (TO)(*) EUR 330,500,000 100.00 100.000 3,305,000 - - - - - - - - 246,994,680 - 246,994,680 - 246,994,680 305,885,616 305,885,616 (672,757) (672,757)
Gever Spa Milan EUR 10,500,000 1,000.00 51.000 5,355 24,055,699 (16,244,539) 7,811,160 - - - - - - - 24,055,699 (16,244,539) 7,811,160 32,030,513 16,335,562 3,924,316 2,001,401
Shen Spa Milan (*) EUR 120,000 1.00 100.000 120,000 7,124,008 - 7,124,008 - - - - - - (7,124,008) - - - - - - -
Jesi Energia Spa Milan (*) EUR 5,350,000 1.00 70.000 3,745,000 15,537,145 (11,252,445) 4,284,700 - - - - - - - 15,537,145 (11,252,445) 4,284,700 6,082,020 4,257,414 (230,793) (161,555)
Infrastrutture Distribuzione Gas Spaex Edison D.G. Spa
SelvazzanoDentro (PD) (*)
EUR 460,000 1.00 100.000 460,000 38,512,802 - 38,512,802 - - - - - - - 38,512,802 - 38,512,802 49,247,490 49,247,490 5,924,098 5,924,098
Infrastrutture Trasporto Gas Spa(Sole shareholder)
Milan EUR 10,000,000 1.00 100.000 10,000,000 32,336,454 (32,330) 32,304,124 - - - - - - - 32,336,454 (32,330) 32,304,124 44,899,365 44,899,365 5,131,045 5,131,045
Nuova Alba Srl (Sole shareholder) Milan (*) EUR 2,016,457 - 100.000 2,016,457 32,669,151 (30,644,069) 2,025,082 - - - - (343,000) - - 32,669,151 (30,987,069) 1,682,082 1,681,888 1,681,888 (343,194) (343,194)
Nuova Cisa Spa in liquidation(Sole shareholder)
Milan (*) EUR 1,549,350 1.00 100.000 1,549,350 3,500,109 (1,086,596) 2,413,513 - - - - - - - 3,500,109 (1,086,596) 2,413,513 4,358,487 4,358,487 (254,223) (254,223)
Presenzano Energia Srl in liquidation Milan (*) EUR 120,000 - 90.000 108,000 304,400 (304,398) 2 - - - - - - (2) 304,398 (304,398) - - - - -
Sistemi di Energia Spa Milan (*) EUR 10,083,205 1.00 86.122 8,683,878 4,249,906 4,150,094 8,400,000 - - - - - - - 4,249,906 4,150,094 8,400,000 13,494,377 11,621,627 608,424 523,987
Società Generale per Progettazioni Cons. e Part. Spa(extraordinary administration)
Rome LIT 300,000,000 10,000.00 59.333 17,800 1 - 1 - - - - - - - 1 - 1 - - - -
Società Idroelettrica Calabrese Srl(Sole shareholder)
Milan (*) EUR 10,000 - 100.000 10,000 280,000 (206,000) 74,000 - - - - (74,000) - - 280,000 (280,000) - (5,119) (5,119) (79,083) (79,083)
Termica Cologno Srl Milan (*) EUR 1,000,000 - 65.000 650,000 6,069,782 - 6,069,782 - - (3,250,000) - - - - 2,819,782 - 2,819,782 5,372,298 3,491,994 (319,301) (207,546)
Termica Milazzo Srl Milan (*) EUR 23,241,000 - 60.000 13,944,600 69,957,191 (42,806,591) 27,150,600 - (5,850,600) (21,300,000) - - - - 42,806,591 (42,806,591) - - - - -
Total A1. Investments in subsidiaries 1,824,391,744 (910,988,447) 913,403,297 171,148,404 (5,860,600) 20,822,768 - (134,754,316) 246,994,680 (7,124,010) 2,250,372,986 (1,045,742,763) 1,204,630,223
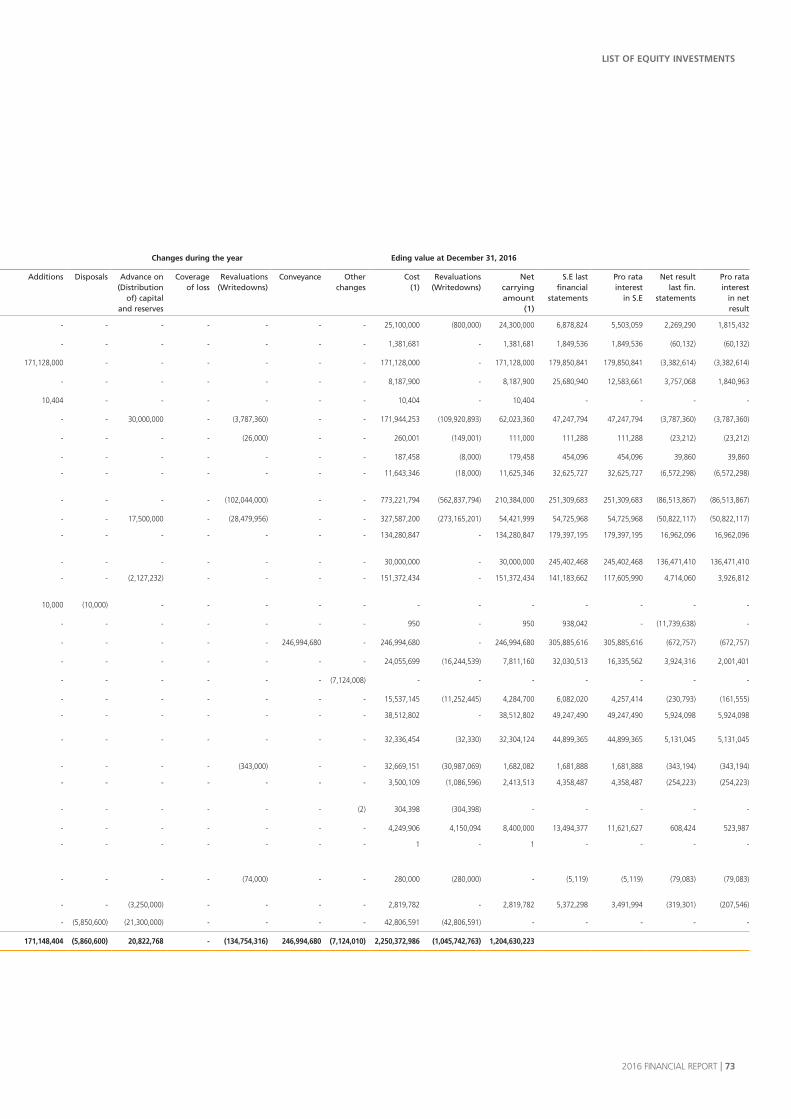
2016 FINANCIAL REPORT I 73
LIST OF EQUITY INVESTMENTS
A1. Investments in subsidiaries(Amounts in euros) Share capital Shares or par value interests held Initial value Changes during the year Eding value at December 31, 2016
Company Head office Curr. Amount Parvalue
pershare
% Number or parvalue
Cost(1)
Revaluations (Writedowns)
Netcarryingamount
(1)
Additions Disposals Advance on (Distribution
of) capital and reserves
Coverage of loss
Revaluations (Writedowns)
Conveyance Other changes
Cost (1)
Revaluations (Writedowns)
Net carrying amount
(1)
S.E last financial
statements
Pro rata interest
in S.E
Net result last fin.
statements
Pro rata interest
in net result
AMG Gas Srl Palermo (*) EUR 100,000 - 80.000 80,000 25,100,000 (800,000) 24,300,000 - - - - - - - 25,100,000 (800,000) 24,300,000 6,878,824 5,503,059 2,269,290 1,815,432
Atema DAC Dublin Ireland EUR 1,500,000 0.50 100.000 3,000,000 1,381,681 - 1,381,681 - - - - - - - 1,381,681 - 1,381,681 1,849,536 1,849,536 (60,132) (60,132)
Cellina Energy Srl Milan EUR 5,000,000 - 100.000 5,000,000 - - - 171,128,000 - - - - - - 171,128,000 - 171,128,000 179,850,841 179,850,841 (3,382,614) (3,382,614)
Dolomiti Edison Energy Srl Trent EUR 5,000,000 - 49.000 2,450,000 8,187,900 - 8,187,900 - - - - - - - 8,187,900 - 8,187,900 25,680,940 12,583,661 3,757,068 1,840,963
Edison Egypt Energy Service Jsc New Cairo (Egypt) EGP 20,000,000 1.00 1.000 200,000 - - - 10,404 - - - - - - 10,404 - 10,404 - - - -
Edison Energia Spa (Sole shareholder) Milan (*) EUR 23,000,000 1.00 100.000 23,000,000 141,944,253 (106,133,533) 35,810,720 - - 30,000,000 - (3,787,360) - - 171,944,253 (109,920,893) 62,023,360 47,247,794 47,247,794 (3,787,360) (3,787,360)
Edison Engineering Sa Athens (Greece) EUR 260,001 3.00 100.000 86,667 260,001 (123,001) 137,000 - - - - (26,000) - - 260,001 (149,001) 111,000 111,288 111,288 (23,212) (23,212)
Edison Hellas Sa Athens (Greece) EUR 263,700 2.93 100.000 90,000 187,458 (8,000) 179,458 - - - - - - - 187,458 (8,000) 179,458 454,096 454,096 39,860 39,860
Edison Idrocarburi Sicilia Srl(Sole shareholder)
Ragusa (*) EUR 1,000,000 - 100.000 1,000,000 11,643,346 (18,000) 11,625,346 - - - - - - - 11,643,346 (18,000) 11,625,346 32,625,727 32,625,727 (6,572,298) (6,572,298)
Edison International Spa Milan (*) EUR 75,000,000 1.00 100.000 75,000,000 773,221,794 (460,793,794) 312,428,000 - - - - (102,044,000) - - 773,221,794 (562,837,794) 210,384,000 251,309,683 251,309,683 (86,513,867) (86,513,867)
Edison International Holding NV Amsterdam (Netherlands) EUR 123,500,000 1.00 100.000 123,500,000 310,087,200 (244,685,245) 65,401,955 - - 17,500,000 - (28,479,956) - - 327,587,200 (273,165,201) 54,421,999 54,725,968 54,725,968 (50,822,117) (50,822,117)
Edison Stoccaggio Spa(Sole shareholder)
Milan (*) EUR 90,000,000 1.00 100.000 90,000,000 134,280,847 - 134,280,847 - - - - - - - 134,280,847 - 134,280,847 179,397,195 179,397,195 16,962,096 16,962,096
Edison Trading Spa (Sole shareholder) Milan (*) EUR 30,000,000 1.00 100.000 30,000,000 30,000,000 - 30,000,000 - - - - - - - 30,000,000 - 30,000,000 245,402,468 245,402,468 136,471,410 136,471,410
Edison Partecipazioni Energie Rinnovabili Srl
Milan (*) EUR 20,000,000 - 83.300 16,660,000 153,499,666 - 153,499,666 - - (2,127,232) - - - - 151,372,434 - 151,372,434 141,183,662 117,605,990 4,714,060 3,926,812
Eolo Energia Srl Milan (*) EUR 10,000 - 100.000 10,000 - - - 10,000 (10,000) - - - - - - - - - - - -
Euroil Exploration Ltd London (England) GBP 9,250,000 1.00 0.000 1 950 - 950 - - - - - - - 950 - 950 938,042 - (11,739,638) -
Fenice Qualità per l'ambiente Spa Rivoli (TO)(*) EUR 330,500,000 100.00 100.000 3,305,000 - - - - - - - - 246,994,680 - 246,994,680 - 246,994,680 305,885,616 305,885,616 (672,757) (672,757)
Gever Spa Milan EUR 10,500,000 1,000.00 51.000 5,355 24,055,699 (16,244,539) 7,811,160 - - - - - - - 24,055,699 (16,244,539) 7,811,160 32,030,513 16,335,562 3,924,316 2,001,401
Shen Spa Milan (*) EUR 120,000 1.00 100.000 120,000 7,124,008 - 7,124,008 - - - - - - (7,124,008) - - - - - - -
Jesi Energia Spa Milan (*) EUR 5,350,000 1.00 70.000 3,745,000 15,537,145 (11,252,445) 4,284,700 - - - - - - - 15,537,145 (11,252,445) 4,284,700 6,082,020 4,257,414 (230,793) (161,555)
Infrastrutture Distribuzione Gas Spaex Edison D.G. Spa
SelvazzanoDentro (PD) (*)
EUR 460,000 1.00 100.000 460,000 38,512,802 - 38,512,802 - - - - - - - 38,512,802 - 38,512,802 49,247,490 49,247,490 5,924,098 5,924,098
Infrastrutture Trasporto Gas Spa(Sole shareholder)
Milan EUR 10,000,000 1.00 100.000 10,000,000 32,336,454 (32,330) 32,304,124 - - - - - - - 32,336,454 (32,330) 32,304,124 44,899,365 44,899,365 5,131,045 5,131,045
Nuova Alba Srl (Sole shareholder) Milan (*) EUR 2,016,457 - 100.000 2,016,457 32,669,151 (30,644,069) 2,025,082 - - - - (343,000) - - 32,669,151 (30,987,069) 1,682,082 1,681,888 1,681,888 (343,194) (343,194)
Nuova Cisa Spa in liquidation(Sole shareholder)
Milan (*) EUR 1,549,350 1.00 100.000 1,549,350 3,500,109 (1,086,596) 2,413,513 - - - - - - - 3,500,109 (1,086,596) 2,413,513 4,358,487 4,358,487 (254,223) (254,223)
Presenzano Energia Srl in liquidation Milan (*) EUR 120,000 - 90.000 108,000 304,400 (304,398) 2 - - - - - - (2) 304,398 (304,398) - - - - -
Sistemi di Energia Spa Milan (*) EUR 10,083,205 1.00 86.122 8,683,878 4,249,906 4,150,094 8,400,000 - - - - - - - 4,249,906 4,150,094 8,400,000 13,494,377 11,621,627 608,424 523,987
Società Generale per Progettazioni Cons. e Part. Spa(extraordinary administration)
Rome LIT 300,000,000 10,000.00 59.333 17,800 1 - 1 - - - - - - - 1 - 1 - - - -
Società Idroelettrica Calabrese Srl(Sole shareholder)
Milan (*) EUR 10,000 - 100.000 10,000 280,000 (206,000) 74,000 - - - - (74,000) - - 280,000 (280,000) - (5,119) (5,119) (79,083) (79,083)
Termica Cologno Srl Milan (*) EUR 1,000,000 - 65.000 650,000 6,069,782 - 6,069,782 - - (3,250,000) - - - - 2,819,782 - 2,819,782 5,372,298 3,491,994 (319,301) (207,546)
Termica Milazzo Srl Milan (*) EUR 23,241,000 - 60.000 13,944,600 69,957,191 (42,806,591) 27,150,600 - (5,850,600) (21,300,000) - - - - 42,806,591 (42,806,591) - - - - -
Total A1. Investments in subsidiaries 1,824,391,744 (910,988,447) 913,403,297 171,148,404 (5,860,600) 20,822,768 - (134,754,316) 246,994,680 (7,124,010) 2,250,372,986 (1,045,742,763) 1,204,630,223

74 I 2016 FINANCIAL REPORT
LIST OF EQUITY INVESTMENTS
LIST OF EQUITY INVESTMENTS (continued)
(1) Amounts in euros.(*) Company subject to management and coordination by Edison Spa.
The currency codes used are consistent with the ISO 4217 International Standard.
BRL Brazilian real CHF Swiss franc EUR Euro GBP British pound USD U.S. dollar
A2. Investments in joint ventures and affiliated companies(Amounts in euros) Share capital Shares or par value interests held Initial value Changes during the year Eding value at December 31, 2016
Company Head office Curr. Amount Parvalue
pershare
% Number or parvalue
Cost(1)
Revaluations (Writedowns)
Netcarryingamount
(1)
Additions Disposals Advance on (Distribution
of) capital and reserves
Coverage of loss
Revaluations (Writedowns)
Conveyance Other changes
Cost (1)
Revaluations (Writedowns)
Net carrying amount
(1)
S.E last financial
statements
Pro rata interest
in S.E
Net result last fin.
statements
Pro rata interest
in net result
EDF En Services Italia Srl Bologna EUR 10,000 - 30.000 3,000 536,400 - 536,400 - - - - - - - 536,400 - 536,400 6,421,013 1,926,304 3,202,281 960,684
EL.I.T.E. Spa Milan EUR 3,888,500 1.00 48.449 1,883,940 1,883,940 - 1,883,940 - - - - - - - 1,883,940 - 1,883,940 - - - -
Eta 3 Spa Arezzo EUR 2,000,000 1.00 33.013 660,262 660,262 - 660,262 - - - - - - - 660,262 - 660,262 - - - -
Ibiritermo Sa Ibiritè (Brazil) BRL 7,651,814 1.00 50.000 3,825,907 1,161,904 - 1,161,904 - - - - - - - 1,161,904 - 1,161,904 68,231,453 34,115,727 13,986,882 6,993,441
Iniziativa Universitaria 1991 Spa Varese EUR 16,120,000 520.00 32.258 10,000 4,405,565 (378,938) 4,026,627 - - - - - - - 4,405,565 (378,938) 4,026,627 - - - -
Kraftwerke Hinterrhein (KHR) Ag Thusis (Switzerland) CHF 100,000,000 1,000.00 20.000 20,000 11,362,052 - 11,362,052 - - - - - - - 11,362,052 - 11,362,052 - - - -
Nuova ISI Impiamti selez.inerti Srl in bankruptcy
Vazia (RI) LIT 150,000,000 - 33.333 50,000,000 1 - 1 - - - - - - - 1 - 1 - - - -
Parco Eolico Castelnuovo Srl Castelnuovo di Conza (SA) EUR 10,200 - 50.000 5,100 854,000 (14,500) 839,500 - - - - (354,000) - - 854,000 (368,500) 485,500 - - - -
Società Gasdotti Algeria Italia - Galsi Spa
Milan EUR 37,419,179 1.00 23.529 8,804,516 24,164,757 (24,164,756) 1 - - - - - - - 24,164,757 (24,164,756) 1 - - - -
Total A2. Investments in joint ventures and affiliated companies 45,028,881 (24,558,194) 20,470,687 - - - - (354,000) - - 45,028,881 (24,912,194) 20,116,687
Total A. Equity investments 1,869,420,625 (935,546,641) 933,873,984 171,148,404 (5,860,600) 20,822,768 - (135,108,316) 246,994,680 (7,124,010) 2,295,401,867 (1,070,654,957) 1,224,746,910
A1. Investments in subsidiaries Disposal Group(Amounts in euros) Share capital Shares or par value interests held Initial value Changes during the year Eding value at December 31, 2016
Company Head office Curr. Amount Parvalue
pershare
% Number or parvalue
Cost(1)
Revaluations (Writedowns)
Netcarryingamount
(1)
Additions Disposals Advance on (Distribution
of) capital and reserves
Coverage of loss
Revaluations (Writedowns)
Conveyance Other changes
Cost (1)
Revaluations (Writedowns)
Net carrying amount
(1)
S.E last financial
statements
Pro rata interest
in S.E
Net result last fin.
statements
Pro rata interest
in net result
Hydros Srl Bolzano EUR 30,018,000 - 40,000 12,007,200 33,379,456 - 33,379,456 - (33,379,456) - - - - - - - - - - - -
Total A1. Investments in subsidiaries Disposal Group 33,379,456 - 33,379,456 - (33,379,456) - - - - - - - -
A2. Investments in joint ventures and affiliated companies Disposal Group(Amounts in euros) Share capital Shares or par value interests held Initial value Changes during the year Eding value at December 31, 2016
Company Head office Curr. Amount Parvalue
pershare
% Number or parvalue
Cost(1)
Revaluations (Writedowns)
Netcarryingamount
(1)
Additions Disposals Advance on (Distribution
of) capital and reserves
Coverage of loss
Revaluations (Writedowns)
Conveyance Other changes
Cost (1)
Revaluations (Writedowns)
Net carrying amount
(1)
S.E last financial
statements
Pro rata interest
in S.E
Net result last fin.
statements
Pro rata interest
in net result
Sel Edison Spa Castelbello (BZ) EUR 84,798,000 1.00 42.000 35,615,160 35,615,160 - 35,615,160 - (35,615,160) - - - - - - - - - - - -
Total A2.Investments in joint ventures and affiliated companies Disposal Group 35,615,160 - 35,615,160 - (35,615,160) - - - - - - - -
Total equity investments Disposal Group 68,994,616 - 68,994,616 - (68,994,616) - - - - - - - -

2016 FINANCIAL REPORT I 75
A2. Investments in joint ventures and affiliated companies(Amounts in euros) Share capital Shares or par value interests held Initial value Changes during the year Eding value at December 31, 2016
Company Head office Curr. Amount Parvalue
pershare
% Number or parvalue
Cost(1)
Revaluations (Writedowns)
Netcarryingamount
(1)
Additions Disposals Advance on (Distribution
of) capital and reserves
Coverage of loss
Revaluations (Writedowns)
Conveyance Other changes
Cost (1)
Revaluations (Writedowns)
Net carrying amount
(1)
S.E last financial
statements
Pro rata interest
in S.E
Net result last fin.
statements
Pro rata interest
in net result
EDF En Services Italia Srl Bologna EUR 10,000 - 30.000 3,000 536,400 - 536,400 - - - - - - - 536,400 - 536,400 6,421,013 1,926,304 3,202,281 960,684
EL.I.T.E. Spa Milan EUR 3,888,500 1.00 48.449 1,883,940 1,883,940 - 1,883,940 - - - - - - - 1,883,940 - 1,883,940 - - - -
Eta 3 Spa Arezzo EUR 2,000,000 1.00 33.013 660,262 660,262 - 660,262 - - - - - - - 660,262 - 660,262 - - - -
Ibiritermo Sa Ibiritè (Brazil) BRL 7,651,814 1.00 50.000 3,825,907 1,161,904 - 1,161,904 - - - - - - - 1,161,904 - 1,161,904 68,231,453 34,115,727 13,986,882 6,993,441
Iniziativa Universitaria 1991 Spa Varese EUR 16,120,000 520.00 32.258 10,000 4,405,565 (378,938) 4,026,627 - - - - - - - 4,405,565 (378,938) 4,026,627 - - - -
Kraftwerke Hinterrhein (KHR) Ag Thusis (Switzerland) CHF 100,000,000 1,000.00 20.000 20,000 11,362,052 - 11,362,052 - - - - - - - 11,362,052 - 11,362,052 - - - -
Nuova ISI Impiamti selez.inerti Srl in bankruptcy
Vazia (RI) LIT 150,000,000 - 33.333 50,000,000 1 - 1 - - - - - - - 1 - 1 - - - -
Parco Eolico Castelnuovo Srl Castelnuovo di Conza (SA) EUR 10,200 - 50.000 5,100 854,000 (14,500) 839,500 - - - - (354,000) - - 854,000 (368,500) 485,500 - - - -
Società Gasdotti Algeria Italia - Galsi Spa
Milan EUR 37,419,179 1.00 23.529 8,804,516 24,164,757 (24,164,756) 1 - - - - - - - 24,164,757 (24,164,756) 1 - - - -
Total A2. Investments in joint ventures and affiliated companies 45,028,881 (24,558,194) 20,470,687 - - - - (354,000) - - 45,028,881 (24,912,194) 20,116,687
Total A. Equity investments 1,869,420,625 (935,546,641) 933,873,984 171,148,404 (5,860,600) 20,822,768 - (135,108,316) 246,994,680 (7,124,010) 2,295,401,867 (1,070,654,957) 1,224,746,910
A1. Investments in subsidiaries Disposal Group(Amounts in euros) Share capital Shares or par value interests held Initial value Changes during the year Eding value at December 31, 2016
Company Head office Curr. Amount Parvalue
pershare
% Number or parvalue
Cost(1)
Revaluations (Writedowns)
Netcarryingamount
(1)
Additions Disposals Advance on (Distribution
of) capital and reserves
Coverage of loss
Revaluations (Writedowns)
Conveyance Other changes
Cost (1)
Revaluations (Writedowns)
Net carrying amount
(1)
S.E last financial
statements
Pro rata interest
in S.E
Net result last fin.
statements
Pro rata interest
in net result
Hydros Srl Bolzano EUR 30,018,000 - 40,000 12,007,200 33,379,456 - 33,379,456 - (33,379,456) - - - - - - - - - - - -
Total A1. Investments in subsidiaries Disposal Group 33,379,456 - 33,379,456 - (33,379,456) - - - - - - - -
A2. Investments in joint ventures and affiliated companies Disposal Group(Amounts in euros) Share capital Shares or par value interests held Initial value Changes during the year Eding value at December 31, 2016
Company Head office Curr. Amount Parvalue
pershare
% Number or parvalue
Cost(1)
Revaluations (Writedowns)
Netcarryingamount
(1)
Additions Disposals Advance on (Distribution
of) capital and reserves
Coverage of loss
Revaluations (Writedowns)
Conveyance Other changes
Cost (1)
Revaluations (Writedowns)
Net carrying amount
(1)
S.E last financial
statements
Pro rata interest
in S.E
Net result last fin.
statements
Pro rata interest
in net result
Sel Edison Spa Castelbello (BZ) EUR 84,798,000 1.00 42.000 35,615,160 35,615,160 - 35,615,160 - (35,615,160) - - - - - - - - - - - -
Total A2.Investments in joint ventures and affiliated companies Disposal Group 35,615,160 - 35,615,160 - (35,615,160) - - - - - - - -
Total equity investments Disposal Group 68,994,616 - 68,994,616 - (68,994,616) - - - - - - - -
LIST OF EQUITY INVESTMENTS

76 I 2016 FINANCIAL REPORT
LIST OF EQUITY INVESTMENTS
(1) Amounts in euros.
The currency codes used are consistent with the ISO 4217 International Standard.
BRL Brazilian real CHF Swiss franc EUR Euro GBP British pound USD U.S. dollar
LIST OF EQUITY INVESTMENTS (continued)
B. Available-for-sale investments(Amounts in euros) Share capital Shares or par vaalue interests held Initial value Changes during the year Eding value at December 31, 2016
Company Head office Curr. Amount Par value per share
% Number or par value
Cost(1)
Revaluations (Writedowns)
Net carrying amount
(1)
Additions Disposals Advance on (Distribution of)
capital and reserves
Coverage of loss
Revaluations (Writedowns)
Conveyance Other changes
Cost(1)
Revaluations(Writedowns)
Net carrying amount
(1)
Cartiere Riunite Donzelli e Meridionali Spa
Milan LIT. 25,602,759,000 200.00 0.000 1 1 - 1 - - - - - - (1) - - -
Consorzio Adda Milan EUR - - 0.000 - - - - - - - - - - 42,828 42,828 - 42,828
Emittenti Titoli Spa Milan EUR 4,264,000 0.52 3.890 319,000 164,263 - 164,263 - - - - - - - 164,263 - 164,263
European Energy Exchange Ag - EEX Leipzig Germany) EUR 40,050,000 1.00 0.757 303,106 680,500 - 680,500 - - - - - - - 680,500 - 680,500
Finligure Spa (in bankruptcy) Genoa LIT. 6,261,874,080 3.135 0.035 700 1 - 1 - - - - - - (1) - - -
Istituto Europero di Oncologia Srl Milan EUR 80,579,007 - 4.284 3,451,632 4,074,528 (550,686) 3,523,842 - - - - - - - 4,074,528 (550,686) 3,523,842
I.SV.E.UR. Spa Rome EUR 2,500,000 1.000.00 1.000 25 5,620 - 5,620 - - - - - - - 5,620 - 5,620
Mandelli Spa (under extraordinary administration)
Piacenza EUR 10,200,000 0.51 0.000 11 13 (12) 1 - - - - - - (1) - - -
MIP Politecnico di Milano Graduate School of Business Scpa
Milan EUR 378,000 1.00 3.390 12,000 12,000 - 12,000 - - - - - - - 12,000 - 12,000
Nomisma - Società di studi economici Spa
Bologna EUR 6,963,500 0.24 1.096 320,000 479,473 (404,393) 75,080 - - - - - - - 479,473 (404,393) 75,080
Orione - Soc. Ind. Per Sic. E Vig. Cons. per Azioni
Turin EUR 120,000 1.00 0.218 261 261 - 261 - - - - - - - 261 - 261
Pro.Cal. Scrl (in bankruptcy) Naples LIT. 500,000,000 - 4.348 21,739,000 11,228 (11,227) 1 - - - - - - (1) - - -
Prometeo Spa Osimo (AN) EUR 2,818,277 1.00 14.446 407,136 451,289 - 451,289 - - - - - - - 451,289 - 451,289
RCS Mediagroup Spa - Common shares (shares without par value)
Milan EUR 475,134,602 - 1.102 4,681,152 9,134,098 (6,227,103) 2,906,995 (2,906,995) - - - - - - - - -
Reggente Spa Lucera (FG) EUR 260,000 0.52 5.209 26,043 13,450 - 13,450 - - - - - - - 13,450 - 13,450
Sirio - Sicurezza Industriale Scpa Turin EUR 120,000 1.00 0.259 311 27 - 27 - - - - - - - 27 - 27
Sistema Permanente di Servizi Spa (in bankruptcy)
Rome EUR 154,950 51.65 12.600 378 1 - 1 - - - - - - - 1 - 1
Syremont Spa Rose (CS) EUR 1,550,000 1.00 19.355 300,000 400 - 400 - - - - - - - 400 - 400
Terminale GNL Adriatico Srl Milan EUR 200,000.000 - 7,297 14,594,000 165,221,944 (6,174,950) 159,046,994 - - (6,129,480) - - - - 159,092,464 (6,174,950) 152,917,514
Total B. Available-for-sale investments 180,249,097 (13,368,371) 166,880,726 (2,906,995) - (6,129,480) - - - 42,824 165,017,104 (7,130,029) 157,887,075
C. Investments held for trading(Amounts in euros) Share capital Shares or par value interests held Initial value Changes during the year Eding value at December 31, 2016
Company Head office Curr. Amount Par value per share
% Number or par value
Cost(1)
Mark to market
Net carrying amount
(1)
Additions Disposals Increase of share capital and reserves
Mark to market
Cost(1)
Mark to market
Net carrying amount
(1)
ACSM - AGAM Spa Monza EUR 76,619,105 1.00 1.942 1,488,000 5,360,000 (2,979,200) 2,380,800 - - - - 5,360,000 (2,979,200) 2,380,800
American Superconductor Devens (United States) USD 141,992 0.01 0.113 16,000 4,975,111 (4,881,495) 93,616 - - - 18,252 4,975,111 (4,863,243) 111,868
Total C. Investments held for trading 10,335,111 (7,860,695) 2,474,416 - - - 18,252 10,335,111 (7,842,443) 2,492,668
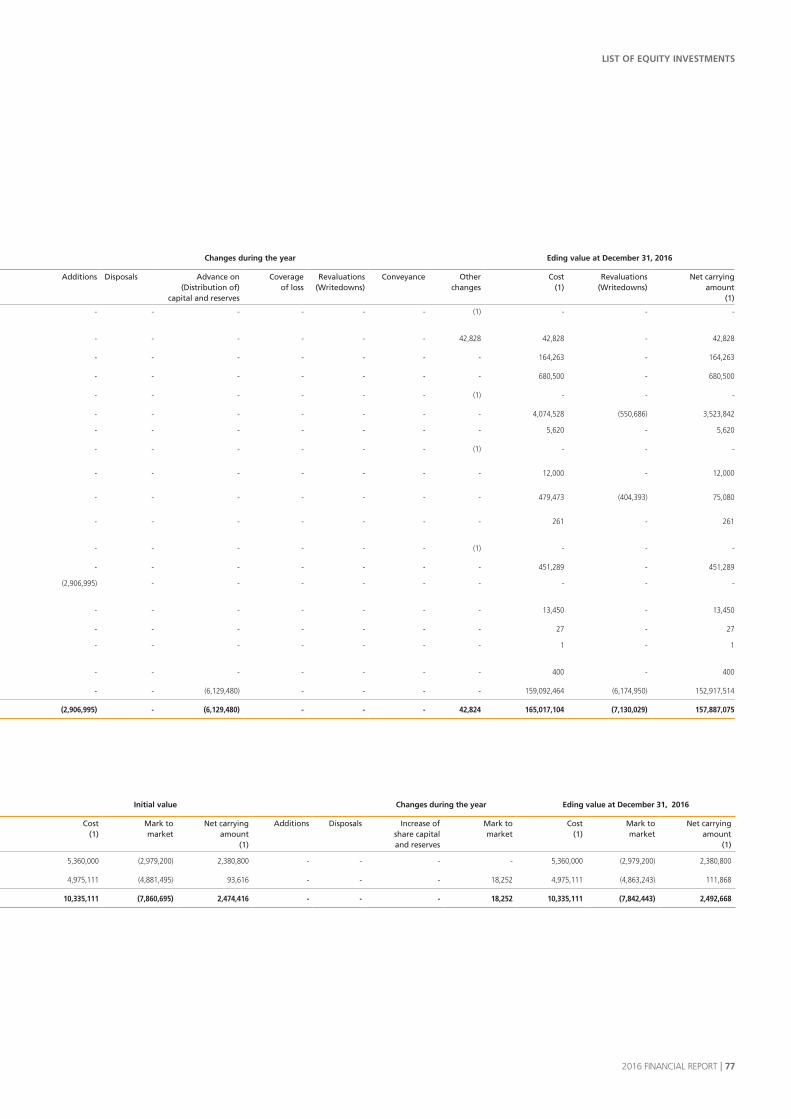
2016 FINANCIAL REPORT I 77
LIST OF EQUITY INVESTMENTS
B. Available-for-sale investments(Amounts in euros) Share capital Shares or par vaalue interests held Initial value Changes during the year Eding value at December 31, 2016
Company Head office Curr. Amount Par value per share
% Number or par value
Cost(1)
Revaluations (Writedowns)
Net carrying amount
(1)
Additions Disposals Advance on (Distribution of)
capital and reserves
Coverage of loss
Revaluations (Writedowns)
Conveyance Other changes
Cost(1)
Revaluations(Writedowns)
Net carrying amount
(1)
Cartiere Riunite Donzelli e Meridionali Spa
Milan LIT. 25,602,759,000 200.00 0.000 1 1 - 1 - - - - - - (1) - - -
Consorzio Adda Milan EUR - - 0.000 - - - - - - - - - - 42,828 42,828 - 42,828
Emittenti Titoli Spa Milan EUR 4,264,000 0.52 3.890 319,000 164,263 - 164,263 - - - - - - - 164,263 - 164,263
European Energy Exchange Ag - EEX Leipzig Germany) EUR 40,050,000 1.00 0.757 303,106 680,500 - 680,500 - - - - - - - 680,500 - 680,500
Finligure Spa (in bankruptcy) Genoa LIT. 6,261,874,080 3.135 0.035 700 1 - 1 - - - - - - (1) - - -
Istituto Europero di Oncologia Srl Milan EUR 80,579,007 - 4.284 3,451,632 4,074,528 (550,686) 3,523,842 - - - - - - - 4,074,528 (550,686) 3,523,842
I.SV.E.UR. Spa Rome EUR 2,500,000 1.000.00 1.000 25 5,620 - 5,620 - - - - - - - 5,620 - 5,620
Mandelli Spa (under extraordinary administration)
Piacenza EUR 10,200,000 0.51 0.000 11 13 (12) 1 - - - - - - (1) - - -
MIP Politecnico di Milano Graduate School of Business Scpa
Milan EUR 378,000 1.00 3.390 12,000 12,000 - 12,000 - - - - - - - 12,000 - 12,000
Nomisma - Società di studi economici Spa
Bologna EUR 6,963,500 0.24 1.096 320,000 479,473 (404,393) 75,080 - - - - - - - 479,473 (404,393) 75,080
Orione - Soc. Ind. Per Sic. E Vig. Cons. per Azioni
Turin EUR 120,000 1.00 0.218 261 261 - 261 - - - - - - - 261 - 261
Pro.Cal. Scrl (in bankruptcy) Naples LIT. 500,000,000 - 4.348 21,739,000 11,228 (11,227) 1 - - - - - - (1) - - -
Prometeo Spa Osimo (AN) EUR 2,818,277 1.00 14.446 407,136 451,289 - 451,289 - - - - - - - 451,289 - 451,289
RCS Mediagroup Spa - Common shares (shares without par value)
Milan EUR 475,134,602 - 1.102 4,681,152 9,134,098 (6,227,103) 2,906,995 (2,906,995) - - - - - - - - -
Reggente Spa Lucera (FG) EUR 260,000 0.52 5.209 26,043 13,450 - 13,450 - - - - - - - 13,450 - 13,450
Sirio - Sicurezza Industriale Scpa Turin EUR 120,000 1.00 0.259 311 27 - 27 - - - - - - - 27 - 27
Sistema Permanente di Servizi Spa (in bankruptcy)
Rome EUR 154,950 51.65 12.600 378 1 - 1 - - - - - - - 1 - 1
Syremont Spa Rose (CS) EUR 1,550,000 1.00 19.355 300,000 400 - 400 - - - - - - - 400 - 400
Terminale GNL Adriatico Srl Milan EUR 200,000.000 - 7,297 14,594,000 165,221,944 (6,174,950) 159,046,994 - - (6,129,480) - - - - 159,092,464 (6,174,950) 152,917,514
Total B. Available-for-sale investments 180,249,097 (13,368,371) 166,880,726 (2,906,995) - (6,129,480) - - - 42,824 165,017,104 (7,130,029) 157,887,075
C. Investments held for trading(Amounts in euros) Share capital Shares or par value interests held Initial value Changes during the year Eding value at December 31, 2016
Company Head office Curr. Amount Par value per share
% Number or par value
Cost(1)
Mark to market
Net carrying amount
(1)
Additions Disposals Increase of share capital and reserves
Mark to market
Cost(1)
Mark to market
Net carrying amount
(1)
ACSM - AGAM Spa Monza EUR 76,619,105 1.00 1.942 1,488,000 5,360,000 (2,979,200) 2,380,800 - - - - 5,360,000 (2,979,200) 2,380,800
American Superconductor Devens (United States) USD 141,992 0.01 0.113 16,000 4,975,111 (4,881,495) 93,616 - - - 18,252 4,975,111 (4,863,243) 111,868
Total C. Investments held for trading 10,335,111 (7,860,695) 2,474,416 - - - 18,252 10,335,111 (7,842,443) 2,492,668

78 I 2016 FINANCIAL REPORT
CERTIFICATION OF THE STATUTORY FINANCIAL STATEMENTS PURSUANT TO ARTICLE 81-TER OF CONSOB REGULATION NO. 11971 OF MAY 14, 1999, AS AMENDED
1. We, the undersigned Marc Benayoun, in my capacity as “Chief Executive Officer,” and Didier Calvez and Roberto Buccelli, in our capacity as “Dirigenti Preposti alla redazione dei documenti contabili societari,” employees of Edison Spa, taking into account the provisions of Article 154-bis, Sections 3 and 4, of Legislative Decree No. 58 of February 24, 1998, certify that the administrative and accounting procedures applied to prepare the Statutory Financial Statements for the period from January to December 31, 2016:
• were adequate in light of the Company’s characteristics; and• were properly applied.
2. We further certify that:
2.1. the Statutory Financial Statements:
a) were prepared in accordance with applicable international accounting principles recognized by the European Union pursuant to Regulation (EC) No. 1606/2002 of the European Parliament and Council of July 19, 2002;
b) are consistent with the data in the accounting records and other corporate documents;c) provide a truthful and fair presentation of the balance sheet, income statement and financial
position of the issuer;
2.2. the Report on Operations includes a reliable analysis of the Group performance and results from operations and of the position of the issuer and of all of the companies included in the scope of consolidation, together with a description of the main risks and uncertainties to which they are exposed.
Milan, February 13, 2017
Marc Benayoun Didier Calvez
Chief Executive Officer Roberto Buccelli
Dirigenti Preposti alla redazione dei documenti contabili societari
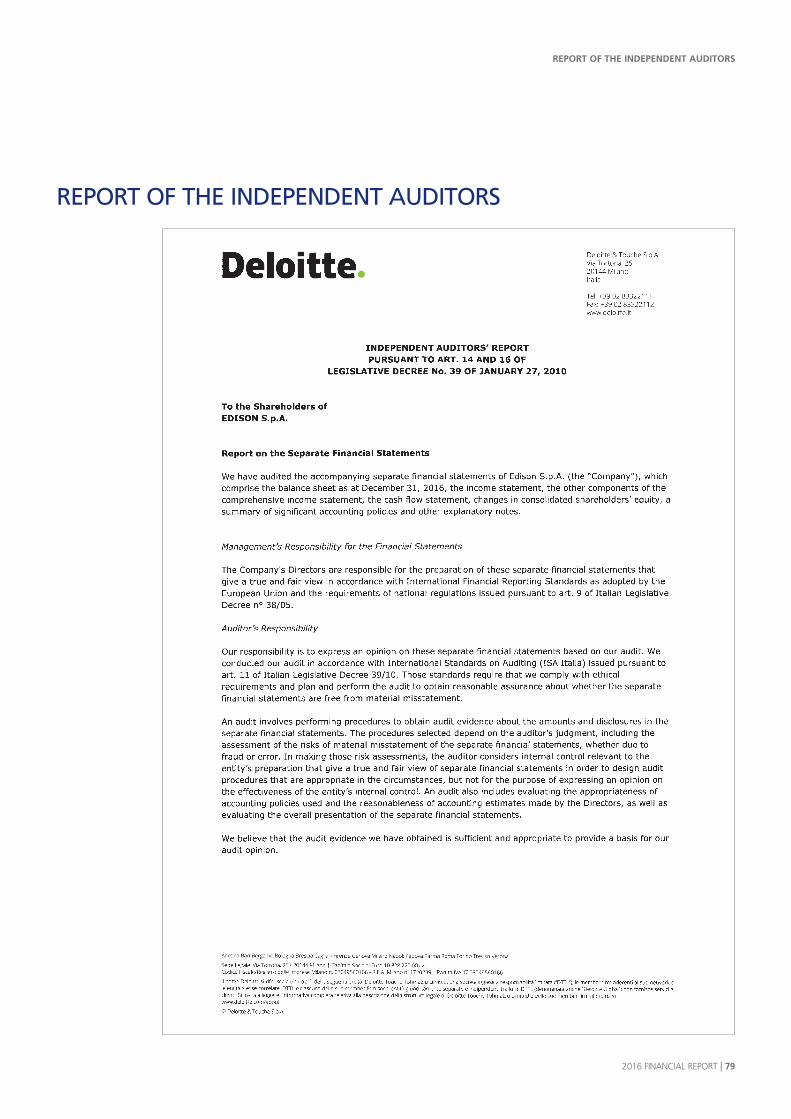
2016 FINANCIAL REPORT I 79
REPORT OF THE INDEPENDENT AUDITORS
REPORT OF THE INDEPENDENT AUDITORS
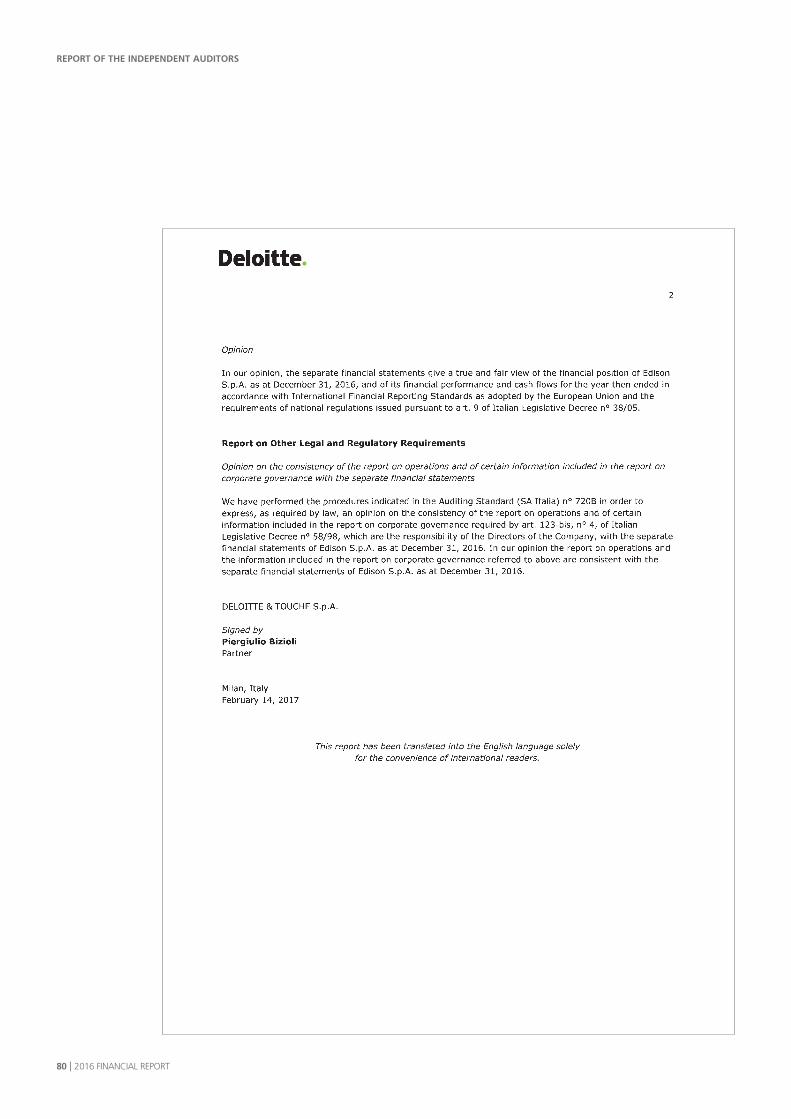
80 I 2016 FINANCIAL REPORT
REPORT OF THE INDEPENDENT AUDITORS
This document is also available on theCompany website: www.edison.it
Editorial coordinationEdison External Relations and Communications
Art direction byIn Pagina, Saronno (Italy)
Photographs bywww.edisonmediacenter.it
Printed byMastergraph, Milan (Italy
Milan, March 2017
This publication was printed on environmentally friedly paper with low impact on the environment.
Edison Spa31 Foro Buonaparte
20121 Milan, Italy
Capital stock 5,377,000,671,00 euros, fully paidin Milan Company Register
and Tax I.D. No. 06722600019VAT No. 08263330014
REA Milan No. [email protected]

www.edison.it