Embed Size (px)
Citation preview

Investor Presentation
September 2016

Forward-looking statements
This presentation may contain forward-looking statements and information that both represents management's current expectations or beliefs concerning future
events and are subject to known and unknown risks and uncertainties.
A number of factors could cause actual results, performance or events to differ materially from those expressed or implied by these forward-looking statements.
September 2016 | P1

Cost reductions delivered
High production efficiency
Step change in production
Continued portfolio upgrading
Refinancing in progress
2016 1H highlights
1
2
3
4
5
2014 2016 1H
84% 93%
2015A 2016 1H 2016 2H
Solan
E.ON
58 kboepd 61 kboepd
80 kboepd
E.ON acquisition case 2016 2H
15 kboepd
18 kboepd
2014 cash cost breakeven 2016 cash cost breakeven
$35/boe
$25/boe
Drawn Debt Total Facilities (incl LCs)
$3.2 bn
$4 bn
Undrawn
September 2016 | P2

Indonesia • 97% production efficiency
• Strong demand (44% of GSA 1, record GSA 2 delivery)
• $9/boe opex
• Increase demand post 2020
– Quick payback, high return projects – Bison, Iguana, Gajah Puteri
• Longer term growth opportunities
– Tuna, 3rd party business
Asia – providing cash flow for the business
Vietnam
• 90% production efficiency
• $9/boe opex
• Further cost reductions
– Renegotiation of vessel and helicopter contracts
– Revised terms for FPSO agreed
• High return, low cost projects include infill drilling in 2017
Low cost, high return
opportunities to maintain / grow
production
September 2016 | P3

UK North Sea – growth story
Wytch Farm (30.1%) • Long life field • Infill opportunities
Solan (100% op) • Plateau production of 20-25 kboepd • Opex <$10/bbl
UK overview • 88% production efficiency • UK drives production growth:
• Strong operating base • Tax advantaged position
Babbage (47%) • Moving to unmanned • Cobra potential tie-back
Elgin-Franklin (5.2%) • Long life field • Rates of >130 kboepd (gross) • On-going infill drilling and well
intervention programme
Glenelg (18.57%) • Recommenced production in May • Rates of >20 kboepd (gross)
Huntington (100% op) • Increased equity • Production exceeding budget
Catcher (50% op) • On track for first oil 2017 • 20% cost reduction secured
Tolmount (50% op) • Low cost, high return project • Significant area upside
September 2016 | P4
2015A 20161H
2016 EFY
2017 2018
E.ON Catcher
Solan Base

0
200
400
600
800
1000
1200
1400
2014 2015 2016 2017 2018
Exploration & pre-dev projects
Sanctioned developments
Production maintenance & abex
0
100
200
300
400
500
600
FY 2014 2016 Forecast
Solan, Huntington
E.ON
Underlying
0
5
10
15
20
25
30
35
40
2014 2016F
Continued cost reduction
Lower underlying 0perating costs ($mm)
Significantly lower forward committed capex ($mm)
2014 2015 2016 1H 2016F
UK 37.2 30.0 31.2 23
Indonesia 10.0 10.0 9.5 10
Pakistan 3.3 3.7 3.3 4
Vietnam 14.6 11.7 9.1 11
Group 18.5 15.5 16.5 15-17
Operating costs ($/boe)
Falling cash cost break even ($/boe)
Potential for further savings • FPSO renegotiations • Synergies post E.ON
integration • Collaboration with
other operators • Opex optimisation • FX benefits
September 2016 | P5

• Templates, flowline bundles, midwater arches and gas export pipeline installed
• Buoy and moorings system installed
• Hook up of risers & umbilicals completed
• Installation complete by Q4 2016
• Subsea programme below budget
Subsea
• 6 wells drilled with excellent operational performance
• Pre-drill predictions for reservoir quality and flow rates at or above prognosis
• Drilling programme below budget
Catcher – ahead of plan
Burgman BP3 producer well
Tay reservoir
Drilling
September 2016 | P6

September 2016| P7
Lifting of first Catcher topsides modules onto FPSO
Topside modules in Dyna-Mac yard

Catcher schedule
2017 2016 2H
• Plateau rates of 50 kboepd (gross)
• $1.8bn total project cost
• Potential savings from reduced well count, contingency release and FX
• On track for FPSO sail-away summer 2017
BP3 & BP 5 completed
Drilling at Varadero (4 wells)
Installation of Buoy
and Mooring System
Module Lifts
Installation of risers
Hull mated
Topsides integration
Onshore pre-comm and comm
Drilling at Burgman (2 wells)
FPSO transit to Catcher
field
FPSO buoy and
hook-up
First oil
Capex - 20% reduction in costs secured *
$m
m
September 2016 | P8
Drilling at Catcher (4 wells)
0
50
100
150
200
250
300
350
2014 2015 2016 2017 2018
Sanctioned budgetActual/current forecast
* Assumes $1.45/£ from 2017 and 22 wells drilled

Southern Gas Basin: portfolio of opportunities
Babbage (47% op) • Infill opportunities
Artemis (100% op) • 150 Bcf discovery • 3 wells drilled • Potential tie back to
Tolmount or Minerva
Ravenspurn Deep (5% carried interest) • BP/Perenco long-reach well planned
for late 2016
Newton (50% op)
Cobra (50% op) • 250 Bcf gas discovery • Potential tie back to Babbage
30km radii
Portfolio of opportunities which are economic at <30p/therm
September 2016 | P9
Minerva
Tolmount (50% op) • Discovered Oct 2011 • 2 appraisal wells in 2013 • 450 bcf of resource • Largest UK gas discovery since Breagh in 1997 • Significant upside (E.Tolmount, Malin)

Tolmount – illustrative development solution
Indicative metrics (gross) • 450 Bcf • Capex <$600m • Opex: c.$7/boe • Peak production : 200 mcfd • First gas 2020
High return project in a
low gas price environment
Timetable to sanction • Concept select by year-end
– Standalone, normally unmanned or subsea tie-back to nearby facilities
• Project optimisation
– Capex reducing
– Potential 3rd party funding
• FID targeted for 2017
September 2016 | P10

September 2016 | P11
• Licence extended to 2020
• FEED progressing well
– Facilities capex and opex cost estimate reductions from FEED contractors’ collaboration
– Logistics and drilling cost estimate reductions following extensive market engagement
– $45/bbl current estimated breakeven price
• Forward programme to sanction depends on project economics and successful farm-down
Estimated capex to
first oil now $1.5bn
Sea Lion Phase 1 – reducing breakeven price

• Sureste Basin is a prolific hydrocarbon province (62 bn bbls of proven oil)
• Awarded 2 high quality blocks in 2015 licensing round
• Current carried 10% interests; option to increase to 25%
− Shallow water (<150m)
− Same salt flanks and sub-salt plays as the US Gulf of Mexico
− Multiple 100-150 mmbbls prospects identified
Mexico – potential for material value creation
2017 - 2018 2016 2H
Delivery of reprocessed 3D seismic across 2
blocks
Confirm final drilling
candidates
Tender for a moored, semi-
sub rig for Block 7
First exploration well on Block 7
First exploration well on Block 2
September 2016 | P12

• Liquidity preserved; cash and undrawn facilities of c.$800m at 30 June
• Amended financial covenants
• Revised maturity profile
• Security
• Enhanced economics
• Net debt of $2.6 bn, flat on end Q1 position
• Net debt expected to peak in Q3 2016 at $2.9 bn
• Net debt/EBITDAX ratio of 5.2x at 30 June 2016
• Finalise full terms and implementation with lenders during H2
• Start to deleverage from Q4
• Target return to investment grade metrics as a priority (Net debt/EBITDAX<3x)
• Sufficient headroom to deliver Catcher and progress new investments
Net debt and refinancing update
Progress with lending
group
Net debt
Outlook
September 2016 | P13
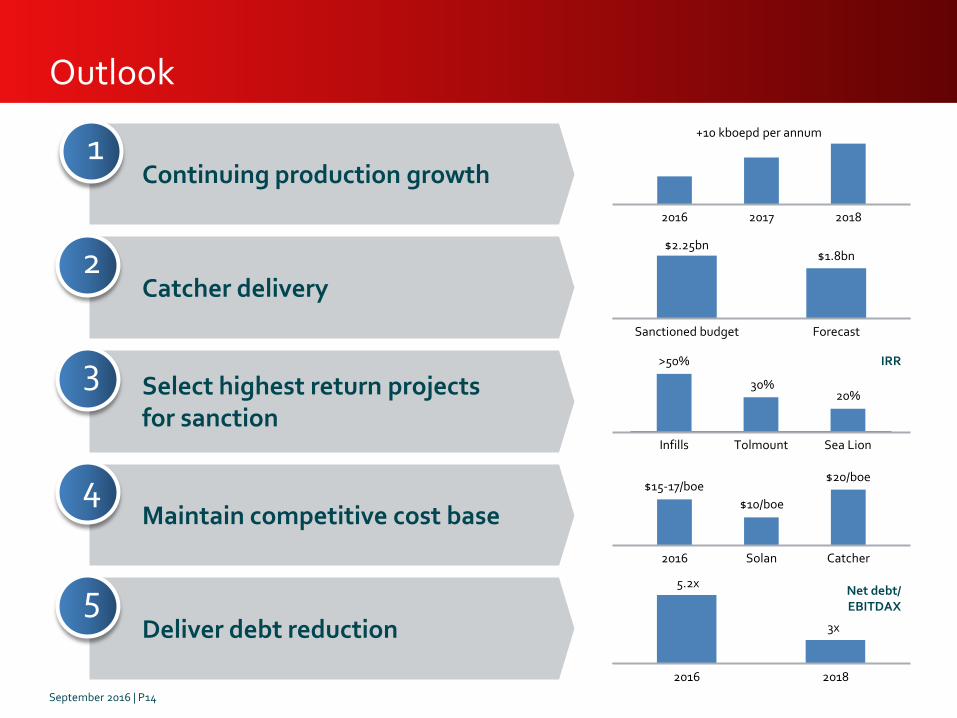
2016 2018
Infills Tolmount Sea Lion
$2.25bn $1.8bn
Sanctioned budget Forecast
Maintain competitive cost base
Continuing production growth
Catcher delivery
Select highest return projects for sanction
Deliver debt reduction
Outlook
1
2
3
4
5
20%
>50%
30%
2016 Solan Catcher
$15-17/boe
5.2x
3x
$10/boe
$20/boe
September 2016 | P14
2016 2017 2018
+10 kboepd per annum
IRR
Net debt/ EBITDAX

Premier Oil Plc 23 Lower Belgrave Street London SW1W 0NR Tel: +44 (0)20 7730 1111 Fax: +44 (0)20 7730 4696 Email: [email protected]
www.premier-oil.com
September 2016