Embed Size (px)
Citation preview

2016 Highlights & 2017 Survey Findings
John P. Heimlich
Vice President & Chief Economist
Quarterly Media Briefing
March 20, 2017

U.S. Airlines Set Multiple Traffic and Capacity Records in 2016; Load Factor Fell
airlines.org 2
466
45
2
475
48
9
529
548
581
595
613
636
666
62
2
614
647
704
739
745
770
743
70
4
720
731
737
743
763
798
823
1990
1992
1994
1996
1998
2000
2002
2004
2006
2008
2010
2012
2014
2016
2018
Passengers Enplaned (Millions) – Jan-Dec Revenue Passenger Miles (Billions) – Jan-Dec
458
448
47
9
490
519
541
57
9
603
618
652
693
652
64
2
657
734
779
79
7
829
812
769
79
8
814
823
840
863
902
933
1990
1992
1994
1996
1998
2000
2002
2004
2006
2008
2010
2012
2014
2016
2018
Available Seat Miles (Billions) – Jan-Dec
733
715
75
3
772
784
807
835
857
873
91
8
957
931
895
895
972
1,0
03
1
,00
6
1,0
38
1
,02
1
957
973
993
995
1,0
11
1
,03
4
1,0
77
1
,11
9
1990
1992
1994
1996
1998
2000
2002
2004
2006
2008
2010
2012
2014
2016
2018
Load Factor (Percent) – Jan-Dec
62.4
6
2.6
6
3.6
6
3.5
6
6.2
6
7.0
6
9.3
7
0.4
7
0.7
7
1.0
7
2.4
7
0.0
7
1.8
7
3.5
7
5.5
7
7.6
7
9.2
7
9.9
7
9.5
8
0.4
8
2.1
8
2.0
8
2.8
8
3.1
8
3.4
8
3.8
8
3.4
1990
1992
1994
1996
1998
2000
2002
2004
2006
2008
2010
2012
2014
2016
2018
Source: U.S. Bureau of Transportation Statistics T1, systemwide scheduled service on U.S. airlines
+3.1%
+3.9%
+3.5%
(0.35)

U.S. Airlines Transported More Cargo in 2016; Most Tons Enplaned Since 2007
airlines.org 3
36.5
50.8
0
10
20
30
40
50
60
70
0
10
20
30
40
50
60
70
2005 2006 2007 2008 2009 2010 2011 2012 2013 2014 2015 2016
Carg
o R
eve
nu
e T
on
Mil
es
(B
illio
ns)
Ca
rgo
Re
ve
nu
e T
on
s E
np
lan
ed
pe
r Da
y (0
00
)
Source: U.S. Bureau of Transportation Statistics T1 and T100, systemwide, all services on U.S. passenger and cargo airlines
Billion RTMs per Year (Left Axis)
000 Tons per Day (Right Axis)

SPRING 2017 AIR TRAVEL:
DEMAND FORECAST AND DRIVERS
airlines.org 4

A4A Projects Spring* 2017 Air Travel to Rise 4 Percent to All-Time High
Airlines Adding 110,000 Seats/Day to Accommodate 89,000 Additional Passengers/Day
airlines.org 5
11
8.8
11
9.6
107.8
11
0.6
12
3.5
13
1.4
13
1.8
13
5.1
13
3.7
12
3.0
12
4.2
12
6.8
12
8.4
12
8.2
13
2.2
13
6.2
13
9.5
14
4.9
20
00
20
01
20
02
20
03
20
04
20
05
20
06
20
07
20
08
20
09
20
10
20
11
20
12
20
13
20
14
20
15
20
16
20
17
F
Source: A4A and BTS T100 segment data – U.S. carriers only; scheduled and nonscheduled services
U.S. Airline Onboard Passengers (Millions) – All Services, March 1 through April 30
145M passengers (nearly 2.4M/day)
• Includes 18M (296K/day) traveling internationally
• Projected average load factor: low-to-mid-80s
• YOY: passengers up 89K/day, seats up 110K/day
+ 4%
* For this purpose, defined as March 1 through April 30
Drivers of year-over-year growth
• Rising GDP and employment
• Higher personal incomes, household net worth
• Continued air travel affordability

U.S. Household Net Worth Reached All-Time High in 2016; Job Growth Strong
airlines.org
1.7
2.4 2.6
1.6
2.3
0
1
2
3
2013 2014 2015 2016 2017F
Real GDP Growth Rate (% CAGR)
6
Monthly Employment Growth (000)
192
250 226
187
238 235
0
100
200
300
2013 2014 2015 2016 Jan Feb
Sources: BEA, BLS, Federal Reserve and IHS Economics; U.S. GDP real annual average growth rate (%), U.S. nonfarm payroll employment growth (month-over-month, in
000s, seasonally adjusted), U.S. disposable personal income per capita (chained 2009 dollars, SAAR); U.S. household net worth in current dollars, not seasonally adjusted
36.4 37.4 38.4 39.2
0
10
20
30
40
50
2013 2014 2015 2016
Th
ou
san
ds
Real ($2009) Personal Incomes ($000) Household Net Worth ($ Trillion, NSA)
78.9 83.9 87.3 92.8
0
50
100
150
2013 2014 2015 2016

Average Round-Trip Airfare Down $27.82 (7%) Since 2014; Fees Up 37¢ (1.6%)
Airfare Has Constituted 94 Percent of Total Ticket Price in Each of the Past Six Years
airlines.org 7
Source: A4A analysis of data from BTS Data Bank 1B (10% sample of tickets: all cabins and fare basis codes) and DOT Form 41
31
5.1
2
34
2.9
5 35
4.6
3
36
2.9
1 3
76
.24
36
3.2
3
34
8.8
9
$300
$310
$320
$330
$340
$350
$360
$370
$380
2010
2011
2012
2013
2014
2015
1H
16
Airfare* (~94% of total)
21
.77
21
.71
22
.38
22
.41
22
.87
22
.87
$0
$5
$10
$15
$20
$25
20
10
20
11
20
12
20
13
20
14
20
15
Ancillary* (~6% of total) Airfare + Ancillary*
33
6.8
9
36
4.6
6
37
7.0
0
38
5.3
2 39
9.1
1
38
6.1
1
37
1.7
9
$300
$320
$340
$360
$380
$400
2010
2011
2012
2013
2014
2015
1H
16
* Domestic round-trip average

With Personal Incomes Outpacing the Price of Air Travel, Americans Can Purchase
~2.5 Times the Amount of Air Travel They Could at the Outset of Deregulation
Adjusted for Inflation, Domestic Air Travel Remains 40+ Percent Below 1980 Levels
airlines.org
0.0
0.5
1.0
1.5
2.0
2.5
3.0
1979
1983
1987
1991
1995
1999
2003
2007
2011
2015
2019
Fare Fare + Ancillary
Domestic R/T Airfare as Share (%) of
Per-Capita Disposable Personal Income
8
Source: A4A analysis of data from BEA, BLS and BTS Data Bank 1B (10% sample of tickets for all cabins and fare basis codes)
$300
$350
$400
$450
$500
$550
$600
$650
1979
1983
1987
1991
1995
1999
2003
2007
2011
2015
2019
Fare Fare + Ancillary
Domestic R/T Airfare Adjusted for
Inflation (in CY2015 Dollars)

Sources: BTS and DOT Air Travel Consumer Report (http://www.dot.gov/airconsumer/air-travel-consumer-reports)
airlines.org 9
U.S. Airlines Saw Continued Improvements in DOT Operational Metrics in 2016
Gains Driven by Investments in Aircraft, Systems, Procedures, Staffing
97.82
98.46
98.83
2014
2015
2016
Flight Completion Factor (%) – Jan-Dec
99.64
99.68
99.73
2014
2015
2016
Properly Handled Bag Rate (%) – Jan-Dec
0.92
0.76
0.62
2014
2015
2016
Oversales per 10,000 Customers – Jan-Dec
On-Time Arrival Rate (%) – Jan-Dec
76.25
79.92
81.42
2014
2015
2016Best since 1992
Best ever recorded
Best since 2012
Best ever recorded

2016 HIGHLIGHTS AND 2017 INSIGHTS
airlines.org 10

Steadier Oil and Jet-Fuel Prices Boosting Seats, Wages and Reinvestment
Every Penny per Gallon per Year Equates to ~$190M in U.S. Airline Industry Fuel Expenses
EIA Spot Price* of Crude Oil/Barrel (Brent)
airlines.org 11
0.6
1
0.8
5
2.1
5
3.0
0
3.0
6
2.9
2
2.6
9
1.5
2
1.2
5
1.5
3
$0.00
$0.50
$1.00
$1.50
$2.00
$2.50
$3.00
$3.50
199
1
200
0
201
0
201
1
201
2
201
3
201
4
201
5
201
6
201
7
EIA Spot Price* of Jet Fuel/Gallon (U.S. Gulf) 2
0 29
80
111
112
10
9
99
52
44
55
$0
$20
$40
$60
$80
$100
$120
199
1
200
0
201
0
201
1
201
2
201
3
201
4
201
5
201
6
201
7
Source: A4A and Energy Information Administration (http://www.eia.gov/dnav/pet/pet_pri_spt_s1_d.htm) * 2017 reflects year-to-date average

2016 Revenues Down 1% As 5.2% Lower Fares1 Offset 3.1% More Passenger Traffic
2016 Expenses Up 0.9% As Higher Labor and Other Expenses Offset Lower Fuel
airlines.org 12
% Change YOY in Operating Revenues
3.1
(5.2)
(9.8)
6.2
(1.0)
Source: A4A analysis of reports by Alaska/Virgin America, Allegiant, American, Delta, Hawaiian, JetBlue, Southwest, Spirit and United
% Change YOY in Operating Expenses
9.3
(17.0)
2.5 2.0
6.4 4.4
0.9
1. Yield = fare per mile (cents per RPM)
2. Sale of frequent flyer award miles to airline business partners, pet transportation, in-sourced aircraft and engine repair, flight simulator rentals, inflight sales, etc.
3. Professional fees, food/beverage, insurance, commissions, GDS fees, communications, advertising, utilities, office supplies, crew hotels, nonfuel payments to regionals

airlines.org 13
Faster-Falling Revenues Drove Modest Reduction in 2016 U.S. Airline Profitability
Pre-Tax Profit Margin of 14.2 Percent Remains Below Average for U.S. Companies
$158.6
$157.1
2015
2016
Operating Revenues (Billions) – Jan-Dec
$23.3
$22.3
2015
2016
Pre-Tax Income (Billions) – Jan-Dec
14.7
14.2
2015
2016
Pre-Tax Profit Margin (%) – Jan-Dec
Operating Expenses (Billions) – Jan-Dec
$131.3
$132.5
2015
2016
Source: A4A analysis of reports by Alaska/Virgin America, Allegiant, American, Delta, Hawaiian, JetBlue, Southwest, Spirit and United

In 2016, U.S. Airlines* Posted Respectable Margins, Averaging 14.2% Before Taxes
U.S. Passenger Airline* Profitability Was Substantially Below Starbucks/McDonald’s/Apple
airlines.org
28.5 27.9 26.7 26.6
24.8
19.7
14.2
4.5
1.0
Ap
ple
McD
on
ald
´s
Dis
ne
y
Com
cast
CS
X
Sta
rbucks
Air
lines*
Fo
rd
Chip
otle
14
* A4A analysis of reports by Alaska/Virgin America, Allegiant, American, Delta, Hawaiian, JetBlue, Southwest, Spirit and United
2016 Pre-Tax Profit Margin
(% of Operating Revenues)
$2
2.3
B
$6
1.3
B
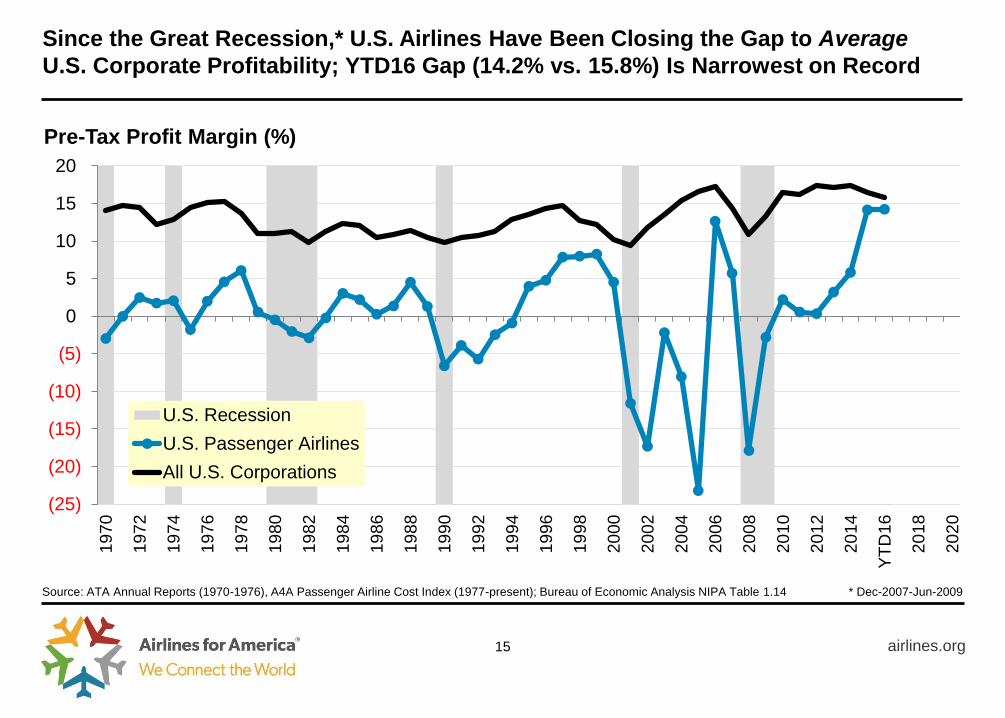
Since the Great Recession,* U.S. Airlines Have Been Closing the Gap to Average
U.S. Corporate Profitability; YTD16 Gap (14.2% vs. 15.8%) Is Narrowest on Record
airlines.org
Source: ATA Annual Reports (1970-1976), A4A Passenger Airline Cost Index (1977-present); Bureau of Economic Analysis NIPA Table 1.14
(25)
(20)
(15)
(10)
(5)
0
5
10
15
20
19
70
19
72
19
74
19
76
19
78
19
80
19
82
19
84
19
86
19
88
19
90
19
92
19
94
19
96
19
98
20
00
20
02
20
04
20
06
20
08
20
10
20
12
20
14
YT
D1
6
20
18
20
20
U.S. Recession
U.S. Passenger Airlines
All U.S. Corporations
Pre-Tax Profit Margin (%)
15
* Dec-2007-Jun-2009

U.S. Airlines Are Putting More Than $20 per Passenger* Right Back Into the Product
Use of Operating Cash from 2010-2016 Included $82B of Capital Reinvestment
airlines.org 16
* SEC filings of Alaska/Allegiant/American/Delta/Hawaiian/JetBlue/Southwest/Spirit/United/Virgin America
$17.5B
Enhance
Product
$13.1B
Reward
Shareholders
$8.5B
Retire
Debt
2016 2010-2015
$64.9B
Enhance
Product
$17.4B
Reward
Shareholders
$54.3B
Retire
Debt

airlines.org 17
Following 2001-2009 Financial Hemorrhaging, U.S. Airlines Have Retired $63B in Debt
Carriers Ended 2016 With $75B in Gross Debt1 and $22B in Liquidity2
Source: SEC filings of AAL/ALGT/AAL/DAL/HA/JBLU/LUV/SAVE/UAL/VA
$9.1 $11.2 $7.5 $7.9
$10.5 $8.0 $8.5
$62.8
$0
$20
$40
$60
$80
2010 2011 2012 2013 2014 2015 2016
Th
ou
san
ds
Annual Cumulative
Payments on Long-Term Debt and Capital Lease Obligations (Billions)
1 Includes 7x annual aircraft rents (capitalized operating leases) 2 Cash, cash equivalents and short-term investments
Year-End 2016
$75.1B gross debt1
$21.6B liquidity2

Improving Finances Enabling Significant Reinvestment in Customer Experience
2016 Capital Outlays Averaged Almost $1.5B per Month, Exceeding 2015 Rate
airlines.org 18
1.29
1.15
0.64 0.55
0.49 0.43
0.55
0.82
1.04 1.16
1.41 1.46
2000 2001 2002 2003-08 2009 2010 2011 2012 2013 2014 2015 2016 2017
* SEC filings of Alaska, Allegiant, American, Delta, Hawaiian, JetBlue, Southwest, Spirit, United and Virgin America
U.S. Passenger Airline* Capital Expenditures ($ Billions per Month)
Exp
ecte
d d
eliv
ery
of 3
37
aircra
ft
Inclu
ded
deli
very
of
1x p
lan
e/d
ay

Improving Finances Enabling Significant Reinvestment in Customer Experience
airlines.org 19
» New or refurbished aircraft, larger overhead bins for luggage
» Availability of lie-flat seating with AC power and USB, proliferation of Wi-Fi and inflight entertainment
» Expanded route networks (scope and frequency) and schedules (seat growth)
» Improved airport check-in areas, lounges, gate amenities, baggage systems, ground equipment
» Investments in new automated security screening lanes (including automatic bin returns)
» Continued development and roll-out of mobile technology and website/kiosk functionality
» Increasing operational reliability (controlled for weather conditions)
» Enhanced tools (computers, tablets, software) and training for customer-contact employees

2,5
74
2,4
94
2,5
46
2,4
51
2,2
92
2,2
85
2,2
94
2,2
59
2,2
74
2,2
89
2,3
66
2,4
54
2,5
46
2005
2006
2007
2008
2009
2010
2011
2012
2013
2014
2015
2016
2017
As Airlines See Higher Returns on Capital, Customers Are Seeing More Seats
Domestic Supply at Highest Level Since 2005; International Supply at All-Time High
airlines.org
Domestic USA (Thousand Daily Seats)
20
Source: Innovata (via Diio Mi) published schedules as of Mar. 10, 2017, for all airlines providing scheduled passenger service from U.S. airports to all destinations
27
2
27
8
28
8
29
2
27
5
28
2
29
2
29
9
31
0
33
0
35
1
36
8
39
2
2005
2006
2007
2008
2009
2010
2011
2012
2013
2014
2015
2016
2017
International (Thousand Daily Seats)
Up
3.7
% Y
OY
Up
6.4
% Y
OY
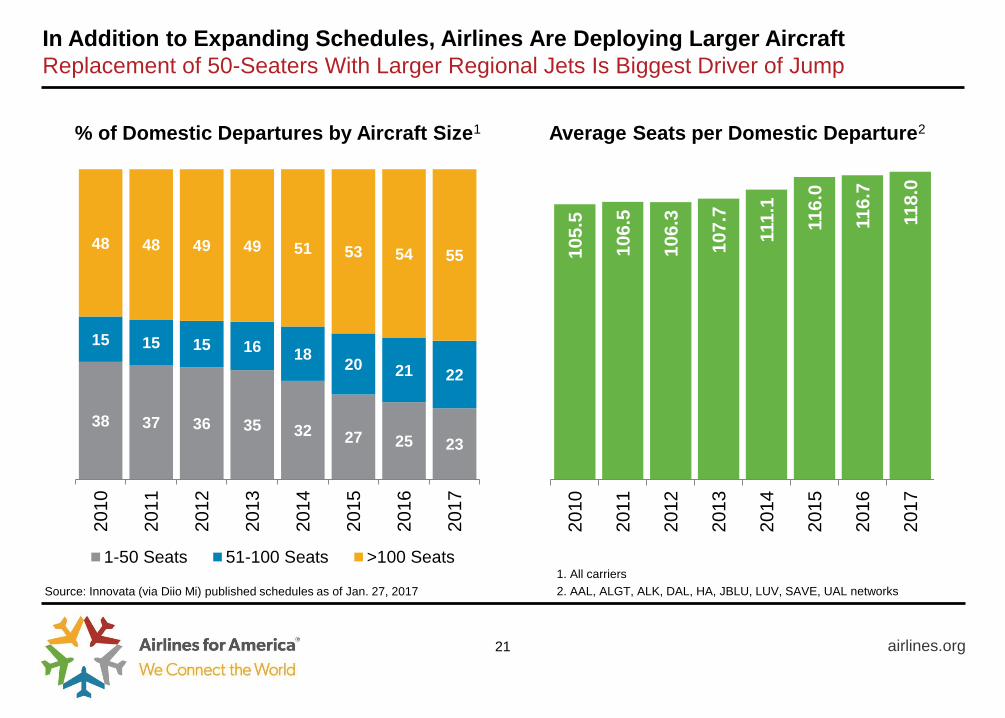
In Addition to Expanding Schedules, Airlines Are Deploying Larger Aircraft
Replacement of 50-Seaters With Larger Regional Jets Is Biggest Driver of Jump
airlines.org 21
38 37 36 35 32 27 25 23
15 15 15 16 18
20 21 22
48 48 49 49 51 53 54 55
2010
2011
2012
2013
2014
2015
2016
2017
1-50 Seats 51-100 Seats >100 Seats
% of Domestic Departures by Aircraft Size1
Source: Innovata (via Diio Mi) published schedules as of Jan. 27, 2017 1
05
.5
10
6.5
106.3
10
7.7
111
.1
11
6.0
11
6.7
11
8.0
2010
2011
2012
2013
2014
2015
2016
2017
Average Seats per Domestic Departure2
1. All carriers
2. AAL, ALGT, ALK, DAL, HA, JBLU, LUV, SAVE, UAL networks

Use of Larger RJs and Mainline Replacement of RJs Boosting Avg. Seats per Flight
Selected Examples of Airline Deployment of Larger Aircraft on Domestic Routes
airlines.org 22
Source: Innovata (via Diio Mi) published schedules as of Mar. 3, 2017, comparing 3/6/2017 to 3/9/2015
Airline Hub Spoke Mar-2015 Mar-2017
Alaska Seattle Omaha RJ-70 B737
American Dallas/Ft. Worth Greensboro RJ-50 RJ-76
Dallas/Ft. Worth Madison RJ-50 RJ-76
Dallas/Ft. Worth Mobile RJ-50 RJ-76
Dallas/Ft. Worth Tallahassee RJ-50 RJ-76
Los Angeles Albuquerque RJ-50 RJ-76
Los Angeles El Paso RJ-50 RJ-76
Los Angeles Phoenix RJ-76 A321/B757
Delta Atlanta Scranton RJ-76 B717
Atlanta Sioux Falls RJ-76 B717
Cincinnati Hartford RJ-50 RJ-76
Cincinnati Raleigh-Durham RJ-50 RJ-76
United Chicago Rochester 4x RJ-50, 2x A319 2x RJ-50, 4x A319
Denver Des Moines RJ-50/70 A319/B737
Newark Cincinnati RJ-50 RJ-70/76
Newark Jacksonville RJ-50/70 RJ-50/A320
San Francisco Eugene RJ-50 A319/A320
San Francisco Reno RJ-50/70 RJ/B737
Wash. Dulles New York LGA RJ-50 RJ-70
Wash. Dulles Philadelphia RJ-50 RJ-70

U.S. Airports of All Sizes Have Realized Air Service Gains Over Past Two Years
176 Small and Non-Hub Markets Saw Seats Grow at Least Half a Percent
airlines.org 23
27
27
57
118
229
1
13
97
111
1
1
1
2
3
2
3
17
22
Large
Medium
Small
Non
Total
Grew ≥ 0.5% Shrank ≥ 0.5% New Cut Other
Number of U.S. Airports by Change in Scheduled Seats from 3Q15 to 3Q17 by DOT “Hub” Size
Source: Innovata (via Diio Mi) published schedules as of Mar. 10, 2017, for all airlines providing scheduled passenger service from U.S. airports to all destinations
+ 8.0%
+ 10.2%
+ 12.2%
+ 4.6%
+ 8.4%

198
151
161
134
37
17
2016
2017
Added
Discontinued
Net Change
airlines.org
Airlines Added 198 New U.S.-Based Routes in 2016, Have Added 151 More in 2017
Over Two Years, Fliers See Net Expansion of 54 Nonstop Routes to/from U.S. Airports
Year-Over-Year Change in Number of Scheduled-Service Routes to/from U.S. Airports
24
Source: Innovata (via Diio Mi) published schedules from March 2017 and July 2016 for all airlines providing scheduled service from U.S. airports to all destinations
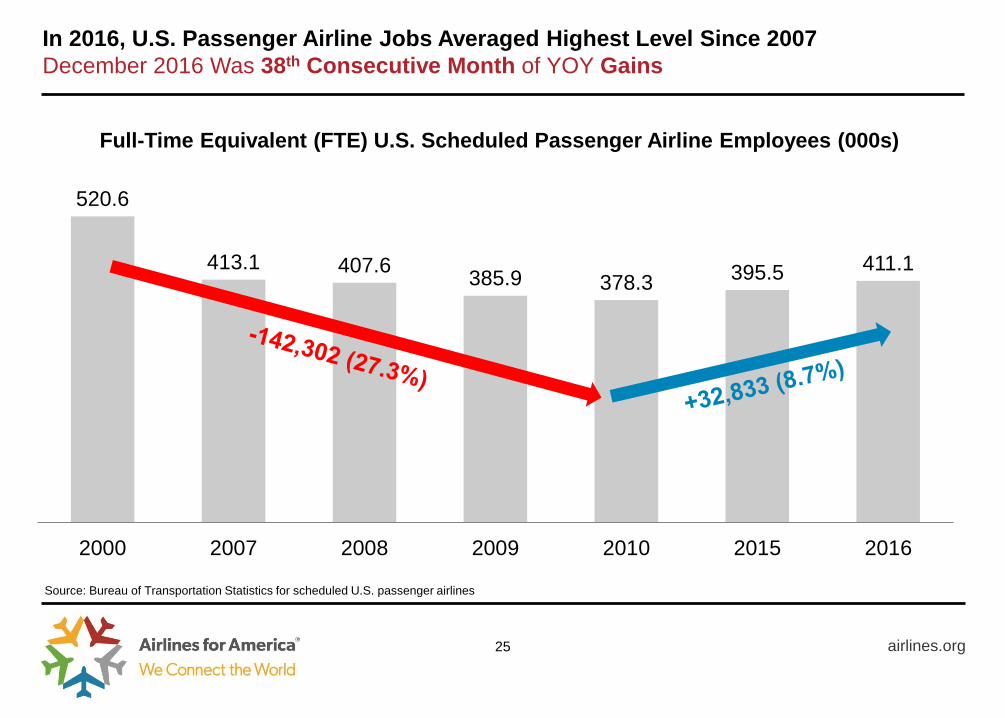
In 2016, U.S. Passenger Airline Jobs Averaged Highest Level Since 2007
December 2016 Was 38th Consecutive Month of YOY Gains
airlines.org 25
Source: Bureau of Transportation Statistics for scheduled U.S. passenger airlines
520.6
413.1 407.6 385.9 378.3
395.5 411.1
2000 2007 2008 2009 2010 2015 2016
Full-Time Equivalent (FTE) U.S. Scheduled Passenger Airline Employees (000s)

Since April 2015, U.S. Airline Job Growth Has Exceeded Overall U.S. Job Growth
Airline Employment Growing at 4% – More Than Double the Rate of Overall U.S. Jobs
airlines.org
Source: Bureau of Labor Statistics and Bureau of Transportation Statistics
(2)
(1)
0
1
2
3
4
5Jan
-13
Jul-
13
Jan
-14
Jul-
14
Jan
-15
Jul-
15
Jan
-16
Jul-
16
Jan
-17
Ye
ar-
Ove
r-Y
ea
r C
ha
ng
e (
%)
U.S. Passenger Airlines FTEs U.S. Nonfarm Jobs
26

U.S. Airlines* Continue to Pump More Wages and Benefits into the Economy
Airlines* Spent $3.7 Billion/Month on the Workforce in 2016 – Up 44 Percent from 2010
airlines.org 27
2.55 2.61
2.73 2.76
2.99
3.35
3.66
2010 2011 2012 2013 2014 2015 2016
* SEC filings of Alaska/Virgin America, Allegiant, American, Delta, Hawaiian, JetBlue, Southwest, Spirit, United
Total Employee Wages and Benefits*
($ Billions per Month)

U.S. Passenger Airline Wages Averaged 38% More Than U.S. Private Sector in 2015
From 2010 to 2015, Airline Wages Rose 29% (More Than Double 13% for Overall USA)
airlines.org 28
Source: BEA NIPA Table 6.6D and A4A Passenger Airline Cost Index
$51.9 $53.5
$54.9 $55.4 $56.4 $58.7
$62.6 $63.1
$67.3 $70.0
$74.5
$80.9
$84.4
$50
$55
$60
$65
$70
$75
$80
$85
$90
2010 2011 2012 2013 2014 2015 YTD16 2017
Th
ou
san
ds
USA* Airlines
Wages and Salaries (000) per Full-Time Equivalent Employee (FTE)
* For al private industries
+38%
N/A

airlines.org 29
In 2016, U.S. Airlines Continued Efforts to Retain and Lure New Equity Investors,
Returning $13B to Shareholders Via Stock Buybacks ($12B) and Dividends ($1B)
Stock Repurchases (Billions) Dividends (Billions)
$1.2
$0.0
$0.2
$0.4
$0.6
$0.8
$1.0
$1.2
$1.4
2010 2011 2012 2013 2014 2015 2016
$12.0
$0
$2
$4
$6
$8
$10
$12
$14
2010 2011 2012 2013 2014 2015 2016
* SEC filings of Alaska, Allegiant, American, Delta, Hawaiian, JetBlue, Southwest, Spirit, United and Virgin America

JANUARY 2017 AIR TRAVEL SURVEY FINDINGS
airlines.org 30
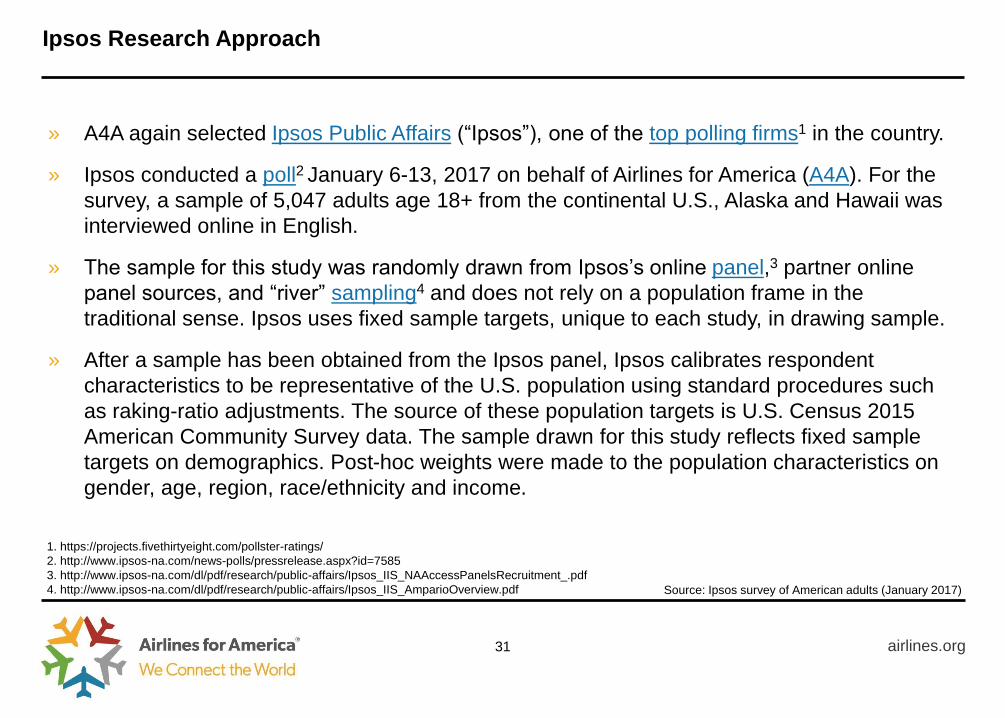
Ipsos Research Approach
airlines.org
» A4A again selected Ipsos Public Affairs (“Ipsos”), one of the top polling firms1 in the country.
» Ipsos conducted a poll2 January 6-13, 2017 on behalf of Airlines for America (A4A). For the
survey, a sample of 5,047 adults age 18+ from the continental U.S., Alaska and Hawaii was
interviewed online in English.
» The sample for this study was randomly drawn from Ipsos’s online panel,3 partner online
panel sources, and “river” sampling4 and does not rely on a population frame in the
traditional sense. Ipsos uses fixed sample targets, unique to each study, in drawing sample.
» After a sample has been obtained from the Ipsos panel, Ipsos calibrates respondent
characteristics to be representative of the U.S. population using standard procedures such
as raking-ratio adjustments. The source of these population targets is U.S. Census 2015
American Community Survey data. The sample drawn for this study reflects fixed sample
targets on demographics. Post-hoc weights were made to the population characteristics on
gender, age, region, race/ethnicity and income.
31
Source: Ipsos survey of American adults (January 2017)
1. https://projects.fivethirtyeight.com/pollster-ratings/
2. http://www.ipsos-na.com/news-polls/pressrelease.aspx?id=7585
3. http://www.ipsos-na.com/dl/pdf/research/public-affairs/Ipsos_IIS_NAAccessPanelsRecruitment_.pdf
4. http://www.ipsos-na.com/dl/pdf/research/public-affairs/Ipsos_IIS_AmparioOverview.pdf

Ipsos Poll Accuracy
airlines.org
» Statistical margins of error are not applicable to online polls. All sample surveys and polls
may be subject to other sources of error, including, but not limited to coverage error and
measurement error. Where figures do not sum to 100, this is due to the effects of rounding.
» The precision of Ipsos online polls is measured using a credibility interval.1 In this case, the
poll has a credibility interval of plus or minus 1.6 percentage points for all respondents.
» Ipsos calculates a design effect (DEFF) for each study based on the variation of the weights,
following the formula of Kish (1965). This study had a credibility interval adjusted for design
effect of the following (n=5,047, DEFF=1.5, adjusted Confidence Interval=3.1).
32
1. http://www.ipsos-na.com/dl/pdf/research/public-affairs/IpsosPA_CredibilityIntervals.pdf Source: Ipsos survey of American adults (January 2017)
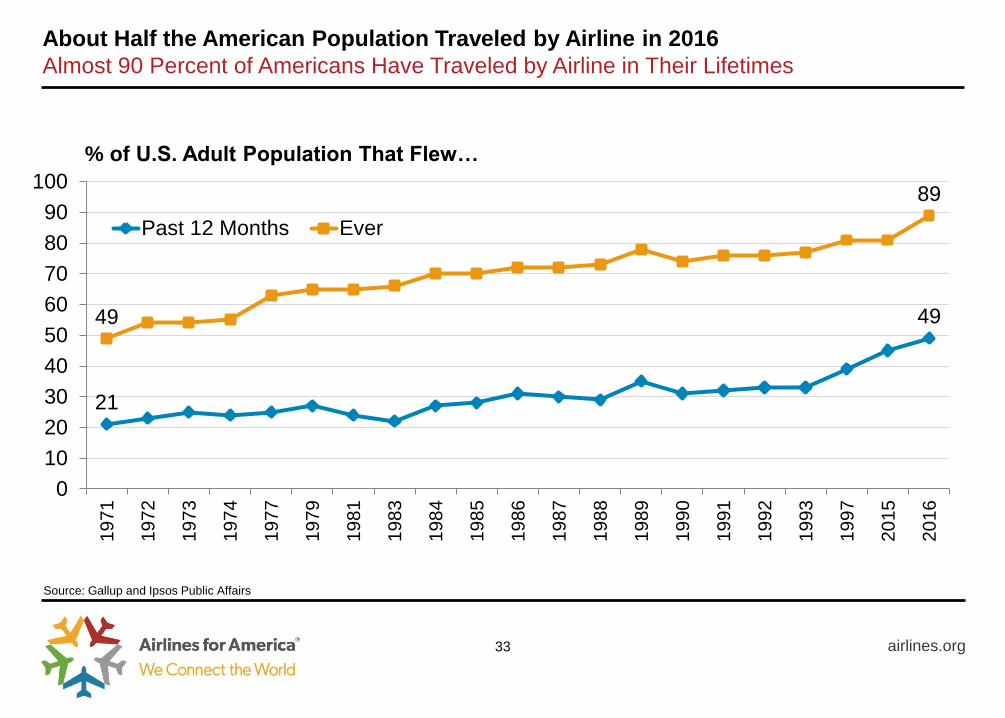
About Half the American Population Traveled by Airline in 2016
Almost 90 Percent of Americans Have Traveled by Airline in Their Lifetimes
airlines.org
21
49 49
89
0
10
20
30
40
50
60
70
80
90
100
1971
1972
1973
1974
1977
1979
1981
1983
1984
1985
1986
1987
1988
1989
1990
1991
1992
1993
1997
2015
2016
Past 12 Months Ever
% of U.S. Adult Population That Flew…
Source: Gallup and Ipsos Public Affairs
33

18%
51%
31%
Personal Non-leisure*
Personal Leisure
Business 1.4 0.7
2.3 1.1
0.8 0.4
4.5 2.2
Per 2016 Flier
Composition of Airline Trips Taken by Primary Purpose in 2016
airlines.org
Half of 2016 Airline Trips Were Taken Primarily for Leisure; 31 Percent for Business
34
* Includes traveling to/from college, family event, job interview, funeral, medical matters
Per American

35%
44%
14%
5%
1%
43%
42%
10%
5%
1%
Very satisfied
Somewhat satisfied
Neutral
Somewhat dissatisfied
Very dissatisfied
2015
2016
airlines.org
85 Percent of 2016 Fliers Reported Being Somewhat or Very Satisfied
Satisfaction Up From 2015; Those Who Were “Very Dissatisfied” Unchanged at 1 Percent
Satisfaction with “Overall Experience With Air Travel” in 2016
35
Source: Ipsos surveys of American adults (December 2015 and January 2017)

2016 Fliers Most Satisfied With Checking In, Followed by Shopping/Booking Flights
Fliers Gave All Six Categories an Average Score Exceeding 3
airlines.org 36
In 2016, on a scale of 1 (lowest) to 5 (highest), how would you
rate your overall satisfaction with each of the following?
Source: Ipsos survey of American adults (January 2017)
3.94
3.90
3.70
3.69
3.55
3.46
Checking in for the flight
Shopping/purchasing ticket
Boarding process
On-time reliability
Awaiting checked baggage
Getting through security
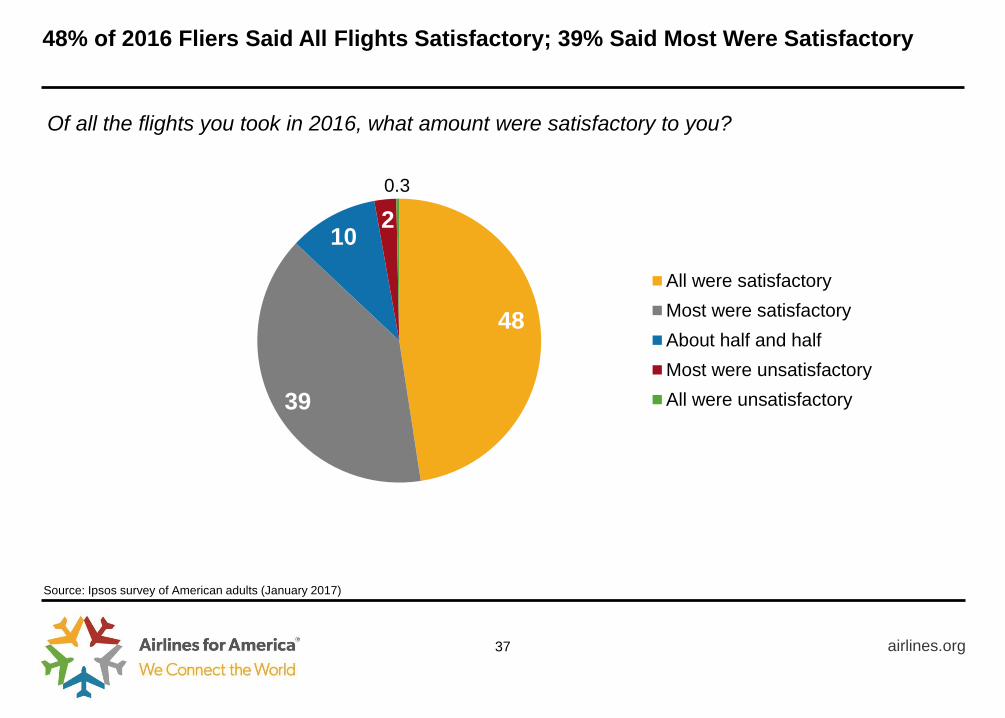
48
39
10 2
0.3
All were satisfactory
Most were satisfactory
About half and half
Most were unsatisfactory
All were unsatisfactory
48% of 2016 Fliers Said All Flights Satisfactory; 39% Said Most Were Satisfactory
airlines.org 37
Source: Ipsos survey of American adults (January 2017)
Of all the flights you took in 2016, what amount were satisfactory to you?

Flier Satisfaction Rises Markedly With Enrollment in Expedited Screening Programs
Airline/Government Collaboration Boosting Participation in DHS Trusted Traveler Programs
airlines.org
Very, 36%
Very, 50%
Very, 68%
Somewhat, 46%
Somewhat, 38%
Somewhat, 24%
Neither
TSA Pre✓®
Global Entry
% of 2016 Fliers Indicating “Very Satisfied” With Overall Air Travel Experience
Sources: Ipsos survey of American adults (January 2017), Transportation Security Administration, Customs and Border Protection
38
Millions of Persons Enrolled in DHS Trusted Traveler Programs (Dec. 31)
0.8
2.0
4.2
3.1
4.0
5.3
2014
2015
2016
TSA Pre✓ Global Entry/NEXUS/SENTRI
92%
88%
82%

Most Americans Will Fly as Much or More in 2017 as They Did in 2016
airlines.org
28%
56%
17%
More Same Fewer
39
Including both business travel and personal travel, do you think you
will take more or fewer airline trips in 2017 than you did in 2016?
Source: Ipsos survey of American adults (January 2017)

2016 Operational and Financial Recap: U.S. Passenger Airlines
airlines.org 40
» In 2016, airlines:
Achieved the seventh consecutive year of consummate safety performance
Posted gains or high-water marks on multiple operational fronts
Carried a record level of traffic and operated a record level of capacity, with the highest two-year
growth in capacity since 2003-2005 contributing to lower average fares and load factors
Recorded a modest reduction in profits, as lower operating revenues (lower fares offset higher traffic)
were met with higher operating expenses (increases in labor/airport/aircraft/other offset lower fuel)
Saw profitability (14% pre-tax margin) continue to lag the U.S. corporate average (16% margin)
» Cash flow generated allowed U.S. airlines to retire expensive debt, acquire new aircraft,
upgrade facilities, expand inflight entertainment options, boost inflight Wi-Fi speeds,
deploy more seats in the marketplace, increase staffing and wages, reward investors
» Airlines continue to add seats at airports large and small, as competition intensified
across the United States and consumers benefited from expanding route maps
» Satisfaction rose from 2015, and market research affirms that participation in expedited
screening programs markedly improves the air travel experience; enrollment rising

www.airlines.org