Embed Size (px)
Citation preview

2016 Illinois Farmland Values
& Lease Trends
David E. Klein, AFM, ALC General Co-Chairman
Gary Schnitkey, Ph.D. Head – Survey Group

2016 Illinois Farmland Values
& Lease Trends
▼ 21st Annual Report
▼ Covers Calendar Year 2015
▼ Lots of Farm Real Estate Transactions
▼ Updates on Rents & Leasing Trends
▼ A Team of Over 70 Professionals
- Professional Farm Managers - Accredited & State Certified Appraisers - Licensed Farmland Brokers
All Sharing Real World Experiences!

Contributing Organizations
Illinois Society of Professional Farm Managers and Rural Appraisers
University of Illinois College of ACES
Illinois Farm & Land Chapter of the REALTORS Land Institute

It Takes a Team of Professionals
Regional Data Group Daniel A. Davis, AFM, ARA
Arch Ag LLC 2 Owl Nest Lane
Columbia, IL 62236 (618) 939-4560
Regional Data Group Bruce Sherrick, Ph.D.
University of Illinois College of ACES
1301 W. Gregory Drive Urbana, IL 61801 (217) 244-2637
Regional Data Group Charles Knudson, ARA, RPRA
1st Farm Credit Services 2005 Jacobssen Drive, Ste. C
Normal, IL 61761 (309) 268-0286
Head – Survey Group Gary Schnitkey, Ph.D.
University of Illinois 300A Mumford Hall
1301 W. Gregory Drive Urbana, IL 61801 (217) 244-9595
General Chair Dale Aupperle, AFM, ARA
Heartland Ag Group, Ltd. 1401 Koester Drive, Ste. 100
Forsyth, IL 62535 (217) 876-7700
Advertising Group Jonathan Norvell, Ph.D., AFM
University of Illinois 506 S. Wright Street
Urbana, IL 61801 (217) 244-6352
Land Values Conference Reid Thompson
Hertz Farm Management 22263 1365 N. Avenue
Princeton, IL 61356 (815) 875-7418
Land Values Conference Luke Worrell, ALC
Worrell Land Services, LLC. 2240 West Morton
Jacksonville, IL 62650 (217) 245-1618
General Co-Chair David Klein, AFM, Soy Capital Ag Services #6 Heartland Dr., Ste. A Bloomington, IL 61704
(309) 665-0961
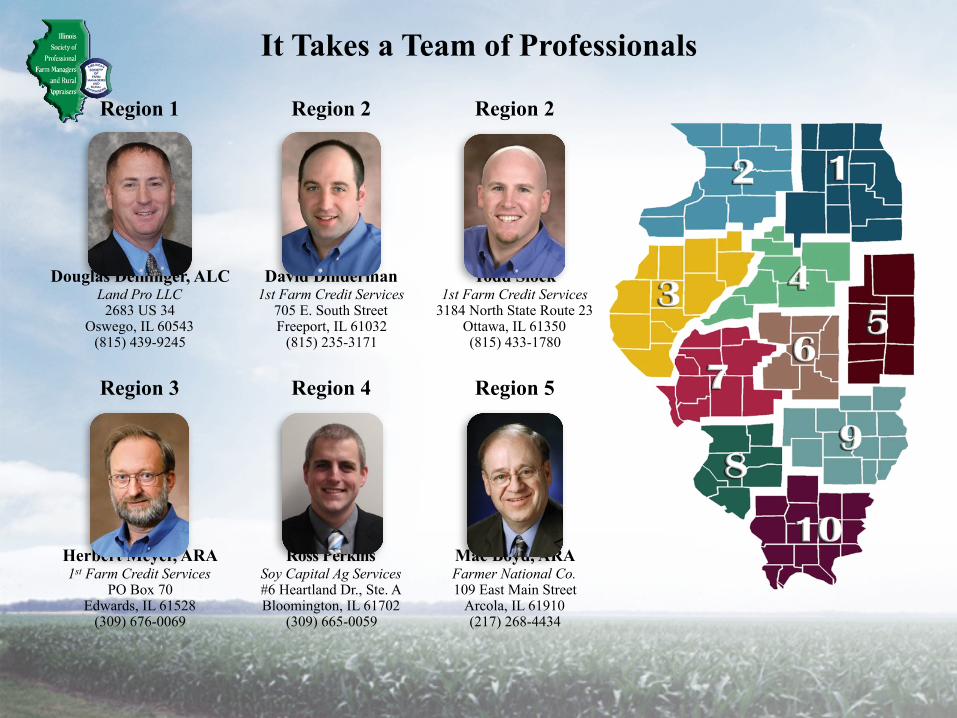
Region 1
Douglas Deininger, ALC Land Pro LLC
2683 US 34 Oswego, IL 60543
(815) 439-9245
Region 2
David Dinderman 1st Farm Credit Services
705 E. South Street Freeport, IL 61032
(815) 235-3171
It Takes a Team of Professionals
Region 2
Todd Slock 1st Farm Credit Services
3184 North State Route 23 Ottawa, IL 61350 (815) 433-1780
Region 3
Herbert Meyer, ARA 1st Farm Credit Services
PO Box 70 Edwards, IL 61528
(309) 676-0069
Region 4
Ross Perkins Soy Capital Ag Services #6 Heartland Dr., Ste. A Bloomington, IL 61702
(309) 665-0059
Region 5
Mac Boyd, ARA Farmer National Co. 109 East Main Street
Arcola, IL 61910 (217) 268-4434

Region 6
Bruce Huber, AFM, ARA First Illinois Ag Group 225 North Water Street
Decatur, IL 62523 (217) 872-6291
It Takes a Team of Professionals
Region 7
Thomas Toohill, AFM Soy Capital Ag Services
3151 Greenhead Drive, Ste. A Springfield, IL 62707
(217) 547-2885
Region 8
Dale Kellermann, AFM First Illinois Ag Group
138 Eagle Drive Suite B O’Fallon, IL 62269
(618) 622-9490
Region 9
David M. Ragan Farm Credit Services of Illinois
1506 E. Lafayette Ave. Effingham, IL 62401
(217) 342-6640
Region 10
Phil Eberle 112 N. Lark Lane
Carbondale, IL 62901 (618) 457-0574

About The 2016 Booklet:▼ Our Fourth Full Color Presentation
(Thanks Carroll Merry)▼ Presented by 10 Regions
- Farmland Sales Data ▪ Excellent Productive Tracts ▪ Good Productive Tracts ▪ Average Productive Tracts ▪ Fair Productive Tracts ▪ Recreational Tracts ▪ Transitional Tracts
-Lease Trends & Rental Rates ▼ Our Sponsors & Advertisers
- A good place to find a professional! ▼ Special Articles
- Drop in Cash Rent Levels Continues - Farmland Price Declines - Interest Rates in Agriculture -

2016 Illinois Farmland Values
& Lease Trends
Understanding Our Farmland Categories Using the Productivity Index from the University of Illinois (Bulletin 811).
Excellent Productivity – 147 to 133Good Productivity – 132 to 117
Average Productivity – 116 to 100Fair Productivity – Less than 100Recreational TractsTransitional Tracts

A Special Report FeatureWe continue to chart the value of each category of land over time in a Region and look at continual compounded annual growth rates using the data provided for several years.
Regional Data Group Bruce Sherrick, Ph.D.
University of Illinois College of ACES
1301 W. Gregory Drive Urbana, IL 61801 (217) 244-2637
Thanks to Dr. Sherrick!!!
Region 6 Land Values Summary Chart: 2001-2015
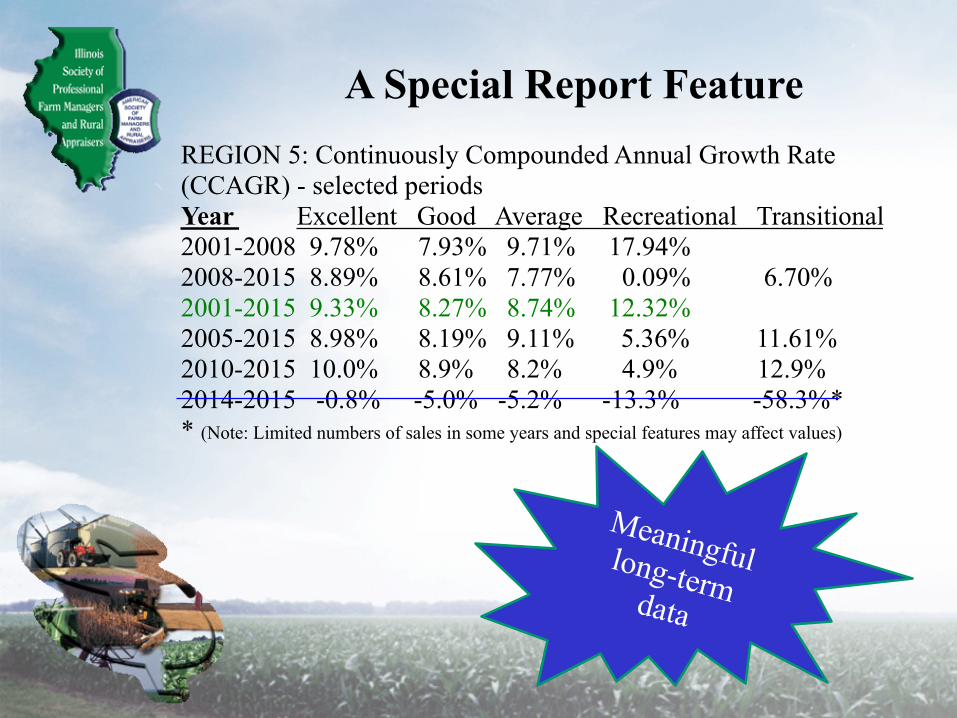
REGION 5: Continuously Compounded Annual Growth Rate (CCAGR) - selected periods Year Excellent Good Average Recreational Transitional 2001-2008 9.78% 7.93% 9.71% 17.94% 2008-2015 8.89% 8.61% 7.77% 0.09% 6.70% 2001-2015 9.33% 8.27% 8.74% 12.32% 2005-2015 8.98% 8.19% 9.11% 5.36% 11.61% 2010-2015 10.0% 8.9% 8.2% 4.9% 12.9% 2014-2015 -0.8% -5.0% -5.2% -13.3% -58.3%* * (Note: Limited numbers of sales in some years and special features may affect values)
A Special Report Feature
Meaningful long-term data

2015 – Results at a Glance
Land Category
Mid Range 2015 Change Comments
Excellent -8% Values pulled back, but remained relatively strong in areas. Pockets of strength still exist. Buyers still willing to pay for high quality soil.
Good -8% Farmers were primary buyers. Buyers were cautious - - looking for deals in this land class. Longer marketing periods noticed on listings.
Average -9% These farms require higher maintenance and management. Buyers were selective. More noticeable price declines. More Auction “No Sales” in this land class than others.
Recreational Steady Volume of sales increased slightly. More support around metropolitan areas. Very rural areas seeing longer marketing periods.
Transitional Lower on Limited
Information
Activity very limited in our metropolitan areas. Market comeback slowly underway in the Chicago area.
Farm profits and soil quality are important! Lower commodity prices affect values.

All Categories of Farmland The Great State of Illinois
These (rounded) figures are the committee averages as reported by each region on the categories shown.
Excellent Good Average Fair Recreational TransitionalRegion 1 $11,900 $8,800 $7,580 $5,400 -- --Region 2 $12,250 $9,250 $7,500 $5,000 $4,000 --Region 3 $12,000 $7,800 $5,500 $4,800 $3,500 --Region 4 $11,500 $9,250 $6,250 -- $4,500 --Region 5 $11,250 $8,500 $6,900 $5,000 $4,250 --Region 6 $12,000 $9,750 $6,825 $5,750 $4,500 $17,500Region 7 $11,750 $7,000 $5,000 $3,250 $3,000 --Region 8 -- $10,650 $9,600 $7,600 $4,000 --Region 9 $11,250 $8,800 $7,000 $5,800 $3,100 $18,000Region 10 -- $7,760 $5,270 $4,100 $2,550 --Average $11,737 $8,756 $6,215 $5,188 $3,711 $17,750
Averages are dangerous - - but they give us a snapshot of each category (for comparison).

2015 Excellent Quality FarmlandMid Range Land Value Comments
Region 1 $11,900 Reluctant sellers unless prices are near record levels. Some new 1031 exchange money again in the market.
Region 2 $12,250 Farmers still the main land buyers. Down roughly 4-5%.
Region 3 $12,000 The strength or weakness of each market is very local, causing a wider range in values generated for top quality land.
Region 4 $11,500 Most sales were smaller parcels, which helped keep values supported. Woodford County is particularly strong.
Region 5 $11,250 Buyers have become selective. Higher highs early in 2015, but dropped off as the year progressed.
Region 6 $12,000 Down 5-6%. Listings took longer to sell (4X) as 2014. Recreational land is higher in this region +15%.
Region 7 $11,750 Mood is bearish, but Class A land is still strong. Fourth great crop in a row for this region.
Region 8 --Region 9 $11,250
Region 10 --$11,737 (average)
The prices shown below are the averages reported by each region.

2015 Good Quality Farmland
Mid Range Land Value Comments
Region 1 $8,800 Largest volume of sales in region. No sale auctions in spring led to more listings in fall.
Region 2 $9,250 Investors seem to favor these because they cost a little less but still rent well. Down less than 2% in this region.
Region 3 $7,800 Location makes a big impact on value. Mid-range didn’t flow as high in this region when prices were better.
Region 4 $9,250 Field shape & land characteristics determine premiums or discounts-widening the price range. Highest prices paid at auctions. Better value tracts haven’t changed much.
Region 5 $8,500 Sought out by investors and farmers when “excellent” land seemed over-priced.
Region 6 $9,750 Larger tracts seemed to bring a premium. Price more stable than expected. Once again – the “value” category.
Region 7 $7,000 Prices fell off rapidly toward year-end. Southern counties where this is the “better land” held up much better.
Region 8 $10,650 “The best soils” in this region. Range widened as compared to 2014.
Region 9 $8,800 Limited number of sales. Difficult to trendline, but down. Oil rights matter in this region – fracking if prices rise?
Region 10 $7,760
The prices shown below are the averages reported by each region.

2015 Average Land
Mid Range Land Value Comments
Region 1 $7,580 Fewer sales of this quality in 2015. Similar quality soils sell higher in the northern counties than the southern counties. Non-tillable, ditches & odd shaped fields led to big discounts.
Region 2 $7,500 Steady values but more “no sales” at auctions. Wide range of sale prices.
Region 3 $5,500 Bidding is slower at auctions. More hesitation in this land class.
Region 4 $6,250 Limited number of sales in region 4. Most in the $40-60/soil p.i. range.
Region 5 $6,900 Limited supply and wide variance in prices with many at or around $7,000/acre.
Region 6 $6,825 Fewer sales in this land class in 2015 versus 2014. Tract sizes were smaller this year as well, which may have helped.
Region 7 $5,000 Had the most downward bias, especially in non-metro areas.
Region 8 $9,600 Most typical soils of this region. Actually saw higher highs. St. Louis metro and livestock provide positive influence .
Region 9 $8,800 Majority of soils. More auction “no-sales”.
Region 10 $7,760 ~Typically 50% of transactions but 35% this year. Sales prices were actually up.
The prices shown below are the averages reported by each region.

2015 Recreational LandMid Range Land Value Comments
Region 1
Region 2 $4,000 Slight increase from 2014. Jo Daviess Co area reflected Chicago area land buyers searching in the Galena area.
Region 3 $3,500 Very slight increase from 2014. Volume up as well. Strip-mine lakes had particular strength.
Region 4 $4,500 Greatest strength near metropolitan areas. Limited opportunities in eastern half of the region helps values.
Region 5 $4,250 Prices remained stable but a wider variation depending on buyer’s motivation and use.
Region 6 $4,500 Some strength, but limited data and percentage tillable can influence final prices.
Region 7 $3,000 Values heavily influenced by hunting and CREP contracts.
Region 8 $4,000 Typically completely or mostly wooded in this region. Prices were steady from 2014.
Region 9 $3,400 Prices have decreased in this region. Most tracts have little additional ag income.
Region 10 $2,550 Prices down 3-9% in different areas. Rec. land makes up ~27% of the land transactions in this region!

Continuously Compounded Annual Growth Rates 2001-2015
2001-2015 Excellent Quality
2008-2015 Excellent Quality
Region 1 7.23% 6.31%
Region 2 10.09% 9.08%Region 3 9.70% 7.46%
Region 4 8.68% 7.19%Region 5 9.33% 8.89%
Region 6 10.01% 7.7%Region 7 9.26%
Good Quality10.39%
Good Quality
Region 8 9.86% 5.88%
Region 9 10.31% 7.18% Region 10 10.32% 7.16%

Continuously Compounded Annual Growth Rates 2001-2015
Highest Land Class CCAGR
Region 1 Average 8.31%
Region 2 Excellent 10.09%
Region 3 Excellent 9.70%
Region 4 Excellent 8.68%Region 5 Excellent 9.33%
Region 6 Exc. & Good 10.0%Region 7 Excellent 9.26%
Region 8 Average 10.53%
Region 9 Recreational 11.24% Region 10 Average 11.30%

Special Interest Stories
Region 2 This area has multiple $14,000/acre sales, still in the Fall of 2014 - -more than any other region. Fair productivity tracts are selling to farmers with excavation equipment and sweat equity to fix up land and make it more farmable.
Region 4 Several Large Tract Sales Occurred in 2015. Many were sold at premiums to institutional type investors relative to the typical farm sold for the same productivity, percentage tillable, improvements, etc.
Region 5 Rockome Gardens was sold for $13,131/acre including the buildings and is being developed into a wildlife drive-through animal park.
Region 8 This area is wondering when the developers will return to building homes in the Metro East area and whether State of Illinois politics/economic challenges has anything to do with this? 116 acre Tract sold between the Mississippi River and the levee for $970/acre. When river is up it is 100 acres, but when it’s really dry, you have more.
Our members across Illinois have unique transactions occurring in their communities. Let’s take a look:

2015 Lease Observations
Region 1 Cash Rents down 10% for second straight year. Largest land lease turnover in tenancy in recent years. This area of the state received ARC payments due to low 2014 yields.
Region 2 Cash Rents flat to down 15% depending on where they started. Fewer crop share leases. Increasing number of variable cash rent leases from higher fixed rents to give landowners some upside potential if the ag economy changes.
Region 3 Cash Rents down 6-11% with lower quality farms dropping faster.
Region 4 Cash Rents down 5-15% depending on where they started. Some highly leveraged farmers not renewing leases and opting to downsize their operations, others looking at this as an opportunity to rent more land.
Region 5 Higher cash rent leases are being renegotiated in most cases. Concerns exist where tenants have not lined up their operating notes, but have signed 2016 leases.
Region 7 Cash Rents are retreating, but some rent auctions have been strong, relative to the general market. Recreational land rental rates are lower also.
Region 8 Still several crop share leases in this area of Illinois. Increasing number of flexible cash rent leases.
Region 10 Rental rates are stagnant as most moved lower in 2015. Several crop share leases still exist. Pasture rents were higher when cattle prices were up, averaging $30-40/acre.
Our membership has offered detailed observations on leasing trends in each region. Here are some highlights:

Here is the good stuff - - First hand observations from across the great state of Illinois!
▼ Net Farm Income – Farmland is what it earns! All of agriculture is watching corn and soybean prices to see which direction our earnings will take in 2016. Crop insurance is an important safety net. In general, the earnings outlook is a diminishing one.
▼ Return on Investment – Our traditional 3.5 percent to 4.0 percent competitive return on farmland investments is diminished by the lower commodity prices. Those returns are now in the 2.50 percent range. Investors find this acceptable in an unstable general economy.

▼ Alternative Investments – As farmland’s performance levels off - - the competition from other financial assets is enhanced. The higher U.S. dollar and potentially rising interest rates signal that the game is changing. Hopefully money does not start leaving agriculture. We are seen as an extremely safe haven investment!
▼ Interest Rates – Interest rates on operating loans and farm mortgages are crucial to profitability. We are all watching the Federal Reserve Bank’s action with regard to higher interest rates for all of us - - and whether our economy will require it with low economic growth rates.
Here is the good stuff - - (continued)

▼ Livestock Industry – Livestock farmers have competed vigorously (in their respective neighborhoods) for additional land purchases with their extra profits, but with expanding herds they are now feeling the pinch too.
▼ Farmland Availability – In general, the supply of farmland was tight most of the year which helped to keep overall land values stable. Yes - - that tract near you never comes up a second time! But – as marketing periods start to lengthen this may impact values.
Here is the good stuff - - (continued)

▼ Agriculture’s Profits – We are starting to burn through the cash generated from the multiple years of agricultural economic prosperity. That cash gets redirected into land purchases and aggressive cash rents. We continue to see this easing lower. Opportunities will exist for efficient managers!
▼ Ethanol’s Future – A lot of our corn usage is dependent on a vibrant ethanol industry moving forward (especially in unstable economies). Farmers and landowners are closely watching the Renewable Fuel Standard, and the politics that could influence it.
Here is the good stuff - - (continued)

▼ Look Around. – With the entire global economy in an economic slowdown, it should be no surprise that agriculture will be hit too. Our farmland pullback, so far, has been minimal by many financial standards and much less volatile!
Here is the good stuff - - (continued)

Uptrend Interruptions
Years 2012 – 2015 Sideways for two years, then a correction - - after rising 80% in value from 2008.
Years 2008 – 2009 Sideways for a year - - after doubling in value from 2001.
Years 1998 – 2001 A 15% correction - - after an eleven year uptrend from 1997 with farmland values rising by 92%
Years 1980 – 1987 A 50% correction - - after farmland values advanced nearly 500% from 1982. This one was a bubble.
In the last four decades the Illinois farmland uptrend was interrupted on four occasions:
In summary – Perhaps history gives us some guidelines for our current thought processes.

A Quick Look Forward
▼ Influencing factors to watch for:- Weather and Yields- Commodity Prices- Interest Rates- Net Farm Income- Value of the Dollar- Alternative Investments- Long Term Inflation?- Ethanol & Biofuels

Land and Lease Survey• Surveys of individuals knowledgeable about the farmland
and farmland rental markets
• Land Survey • Prices and returns decline in 2015.
• Lease Survey • Cash rents projected to decrease in 2016 with
possibility of more decreases for 2017

Farmland PricesLand Quality Jan 1, 2015 Dec 31, 2015 Change
Excellent $12,600 11,600 -8%
Good $10,600 $9,700 -8%
Fair $8,500 $7,700 -9%
Poor $6,500 $6,000 -8%

What will Happen to Farmland Prices in 2016?
Increase more than 5%
Increase 1 to 5%
Stay the same
Decrease 1 to 5%
Decrease more than 5%
Percent0 13 25 38 50
7%
53%
31%
5%
4%
0%
0% 10% 20% 30% 40% 50% 60%
Decrease!more!than!10%
Decrease!between!5!and!10%
Decrease!1!to!5%
Stay!the!same
Increase!1!to!5%
Increase!more!than!5%
Percent
Figure!1.!!Expectations!of!Price!Changes!in!2016.

Odds of a 20% or Greater Price Decline
More than 10% chance
5 to 10% chance
Less than 5% chance
Very small chance
No chance
Percent of Respondents
0% 13% 25% 38% 50%
20142015201630%
32%
31%
Percent!of!Respondents
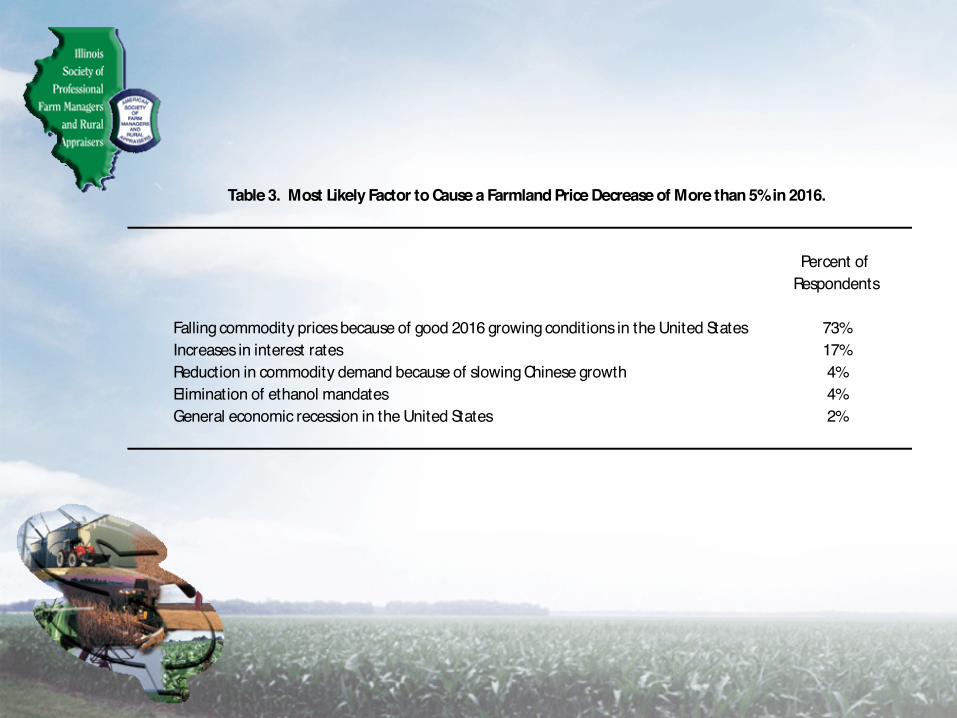
Falling!commodity!prices!because!of!good!2016!growing!conditions!in!the!United!States 73%Increases!in!interest!rates 17%Reduction!in!commodity!demand!because!of!slowing!Chinese!growth 4%Elimination!of!ethanol!mandates 4%General!economic!recession!in!the!United!States 2%
Table!3.!!Most!Likely!Factor!to!Cause!a!Farmland!Price!Decrease!of!More!than!5%!in!2016.

Percent!of!Respondents
Increase!in!commodity!prices!because!of!poor!2016!growing!conditions!in!the!United!States 44%A!2016!drought!causing!low!yields 21%Increases!in!commodity!demand!because!of!slowing!Chinese!growth 8%Poor!crop!yields!in!South!America 7%Good!economic!growth!in!the!United!States 8%High!yield!leading!to!higher!incomes 4%Decreases!in!stock!prices 4%Decreases!in!interest!rates 2%Changes!in!exchange!rates 2%
Table!5.!!Most!Likely!Factor!to!Cause!a!Farmland!Price!Increase!of!More!than!5%!in!2016.

Buyers and Sellers• Buyers: Local farmers 60% (down 6%), Local
investors 15% (up), Institutions 12% (up)
• Sellers: Estate sales 54%, Retired farmers 14%, Individual Investors 12%, Active Farmers 10%
• Reasons for Selling: Settle estates 48%, Received a good price 17%, Rebalance portfolio 13%.

Method of Selling Farmland
Sealed!bid 6%Multi-parcel!auction 14%Public!auction 35%Private!treaty 45%
Table!10.!Method!of!Selling!Farmland,!2015.

Change in Volume, Last Half 2014 to 2015
0 10 20 30 40 50
Substantial! decrease!
Decrease
No!change
Some!increase
Substantial! increase
Percent!of!Respondents
Figure!6.!!Change!in!Volume!of!Farmland!Sold!in!Last!Half!of!2015!Compared!to!Last!Half!of!2014.

Incomes from Alternative Lease Types, 2015 versus 2014
Lease type Excellent Good Average Fair
Traditional crop share 204 180 143 111
Cash rent 263 240 193 145
Custom farming 259 237 195 134
Table 1. Per Acre Farm Incomes that Landlords Receive for Different Lease Types and Land Qualities, 2015.
Land Quality
------------------ $ per acre ---------------------2015

Biggest Decreases in Lease Type Returns involve Crop Participation!
Lease type Excellent Good Average Fair
Traditional crop share -46 -45 -35 -14
Cash rent -37 -10 -7 -5
Custom farming -58 -34 -27 -32
Table 2. 2015 Incomes Minus 2014 Incomes.
Land Quality
------------------ $ per acre ---------------------

2016 Cash Rents, Professional Farm Managers
Land Quality - Category
Excellent Good Average Fair
--Per acre--
High 1/3 $350 $300 $260 $208
Mid 1/3 $325 $283 $247 $190
Low 1/3 $275 $250 $191 $150

65%
10%
25%
0%
0% 10% 20% 30% 40% 50% 60% 70%
No!operators!unwilling!to!pay!cash!rent
One!operating!unwilling!to!pay!cash!rent
Less!than!5%!of!operators!unwilling!to!pay!cash!rent
Over!5%!of!operators!unwilling!to!pay!cash!rent
Number!of!Farm!Managers
Figure!1.!!Farm!Managers!Having!Farm!Operators!Unwilling!to!Pay!2016!Cash!Rent.

Historic Cash Rents, Midpoints

Cash Rent Expectations for 2017

Thank You and Questions