Embed Size (px)
Citation preview
2016 Nationwide Cyber Security Review: Summary Report
Nationwide Cyber Security Review:Summary Report
2016
2016 Nationwide Cyber Security Review: Summary Reportii
Acknowledgments The Multi-State Information Sharing & Analysis Center® (MS-ISAC®) would like to thank everyone who participated in the 2016 Nationwide Cyber Security Review (NCSR). Your continued support in the NCSR helps us work towards our mission of improving the overall cybersecurity posture of the nation’s state, local, tribal and territorial governments.
We would also like to thank and acknowledge the MS-ISAC Metrics Workgroup for their continued support in the NCSR. Their knowledge, expertise and dedication assist in the continued success of the NCSR.
This material is based upon work supported by the U.S. Department of Homeland Security under Grant Award Number, 2010‐PD‐123‐000001, Mod #13.
The views and conclusions contained in this document are those of the authors and should not be interpreted as necessarily representing the official policies, either expressed or implied,of the U.S. Department of Homeland Security.
2016 Nationwide Cyber Security Review: Summary Report
Executive Summary 12016 NCSR Key Findings 1
Methodology 2Question Set 2Nationwide Cyber Security Review Participation by Entity Type 2
SLTT Cybersecurity Landscape 3
NCSR Demographic Takeaways 3
NCSR Maturity Scale 4
Results 5Identify Function 5Protect Function 6Detect Function 7Respond Function 8Recover Function 9
Findings 10Summary Report Highlights 11Appendix II: Detailed Data Analysis Highlights 11
Next Steps 12
Partners 13U.S. Department of Homeland Security 13Multi-State Information Sharing & Analysis Center 13National Association of State Chief Information Officers 13National Association of Counties 13
Appendix I: Acronyms 14
Appendix II: Detailed Data Analysis 14Analysis by Category Averages 14
Identify Function 15Identify Categories 15
Protect Function 17Protect Categories 17
Detect Function 19Detect Categories 19
Respond Function 20Respond Categories 20
Recover Function 22Recover Categories 22
iii
Table of Contents

2016 Nationwide Cyber Security Review: Summary Reportiv
2016 Nationwide Cyber Security Review: Summary Report 1
Executive Summary
In June of 2009, the U.S. Department of Homeland Security (DHS) was directed to develop a cyber-network security assessment to measure state, local, tribal and territorial (SLTT) governments’ gaps and capabilities. The first Nationwide Cyber Security Review (NCSR) was conducted in 2011 by DHS. In 2013, DHS partnered with the Multi-State Information Sharing & Analysis Center (MS-ISAC), the National Association of State Chief Information Officers (NASCIO), and the National Association of Counties (NACo) to develop and conduct the second NCSR. Since 2013, the NCSR has been conducted on an annual basis, and 2016 marks the 5th year the self-assessment has been conducted.
This report provides a point-in-time comparison, based upon respondents’ input, that allows SLTT entities to compare their responses to others within their peer groups. It is important to keep in mind that this report provides a snapshot within the SLTT community.
The results of the 2016 NCSR are based on participation from 464 SLTT entities broken down by 48 states, 122 locals (representing 38 states), 9 tribes, and 285 state agencies. Due to increased participation in 2016, we were able to create a separate peer profile for the tribal community.
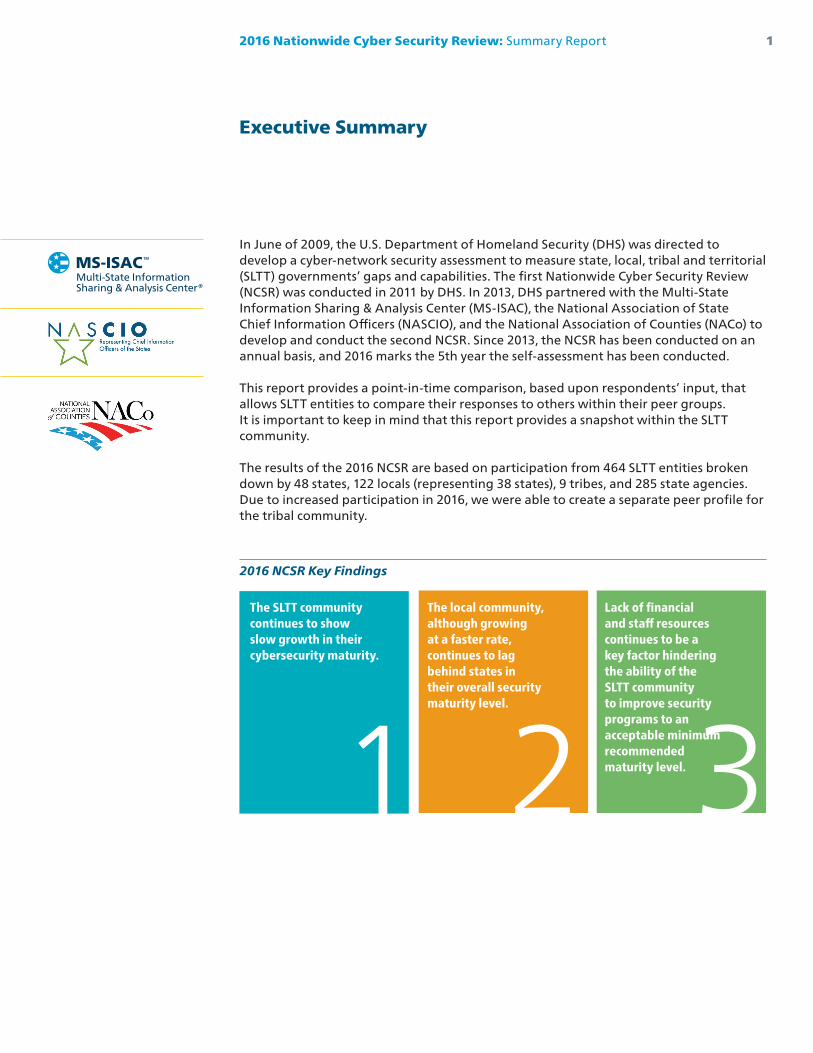
2016 NCSR Key Findings
The SLTT community continues to show slow growth in their cybersecurity maturity.
The local community, although growing at a faster rate, continues to lag behind states in their overall security maturity level.
Lack of financial and staff resources continues to be a key factor hindering the ability of the SLTT community to improve security programs to an acceptable minimum recommended maturity level.1 2 3

2016 Nationwide Cyber Security Review: Summary Report2
Methodology In 2015, the NCSR was redesigned to align with the National Institute of Standards and Technology (NIST) Cybersecurity Framework (CSF). The Framework uses existing standards, guidelines and best practices as guidance for organizations to manage and reduce cybersecurity risk. Through the realignment of the NCSR to the NIST CSF, MS-ISAC and DHS continue to develop a common understanding of the current cybersecurity management practices across SLTT governments.
Question SetThe NCSR question set was built upon the NIST CSF Framework Core, with some minor alterations. The Core consists of a collection of cybersecurity-related activities organized into five main functions: Identify, Protect, Detect, Respond, and Recover. Each of the five functions is subdivided into 22 categories and then further into 98 sub-categories. The NCSR leverages the 98 sub-categories as the questions for the assessment with the addition of questions pertaining to privacy controls. For assessment purposes, the sub-categories provide enough details for organizations to identify actionable steps to improve their cybersecurity maturity and the ability to utilize pre-existing cross-references to best practices, standards and requirements.
Nationwide Cyber Security Review Participation by Entity TypeIn 2016, there was significant growth in the NCSR from the local and tribal governments. With the increase in participation from the tribal governments, we were able to create a separate tribal peer profile.
Figure 1 represents SLTT participation in the NCSR over the years.
Figure 1
300
250
200
150
100
50
0
State State Agency Local Tribal
44 50 48 50 4858
159 164
260
285
60
95
4055
122
9
2011 2013 2014 2015 2016
NCSRParticipation by Entity Type
2016 Nationwide Cyber Security Review: Summary Report 3
SLTT Cybersecurity LandscapeData collected from federally funded MS-ISAC services available to SLTT entities revealed that in 2016 much of the malicious activity observed in the SLTT community matched trends in other sectors. SLTT government computer systems were subject to high levels of malware infections and phishing attacks, and cyber threat actors (CTAs) conducted several distributed denial of service attacks (DDoS). Continuing a trend from previous years, the number of critical vulnerabilities reported continued to grow, further widening the potential attack surface. Nonetheless, the SLTT community continued to improve its security posture through faster vulnerability patching.
NCSR Demographic TakeawaysThe following information was extracted in doing an analysis on the demographic questions from the 2016 NCSR. Local and tribal entities continue to lag behind states in adopting or establishing executive mandates, policies or standards in guiding the implementation of security controls. Most states utilize NIST (800 or the Cybersecurity Framework) and/or the Center for Internet Security Critical Security Controls (CIS Controls) as frameworks to manage their security programs. Both local and tribal entities also reported significant adoption of these frameworks. Many entities, especially within the local community, reported that their security programs are guided by some form of compliance requirements, such as the Health Insurance Portability and Accountability Act (HIPAA), Internal Revenue Service (IRS), etc.
There was a significant year-to-year increase (31% to 56%) in the number of top decision makers at the local level receiving updates regarding risk, controls, and security. However, they lag behind their state counterparts (81%). Tribal entities match the locals in “C-suite” involvement.
The majority of respondents in all communities do very little outsourcing (24% or less) of either IT operations or security operations.
• 92% of locals, 79% of states and 100% of tribes report not outsourcing any of their IT operations.
• 93% of locals, 79% of states and 100% of tribes report not outsourcing any of their security operations.
• There was no significant year-to-year change identified between states and locals in the outsourcing of either IT or security operations.
The types of data supported across all public sector respondents are evenly distributed between Criminal Justice Information System (CJIS), HIPAA, Tax, and Payment Card Industry (PCI).
State and local respondents identified lack of security program funding along with the increasing sophistication of threats as their top two security concerns. For local respondents, a close third and fourth are lack of documented processes and lack of a cybersecurity strategy that seem consistent with their level of adoption of established frameworks. The number one tribal respondents concern, and a quickly emerging problem across the SLTT community, is a lack of security professionals that are available. This will be an increasingly challenging issue when one considers the current existing and projected shortage of cybersecurity professionals in the workforce.
2016 Nationwide Cyber Security Review: Summary Report4
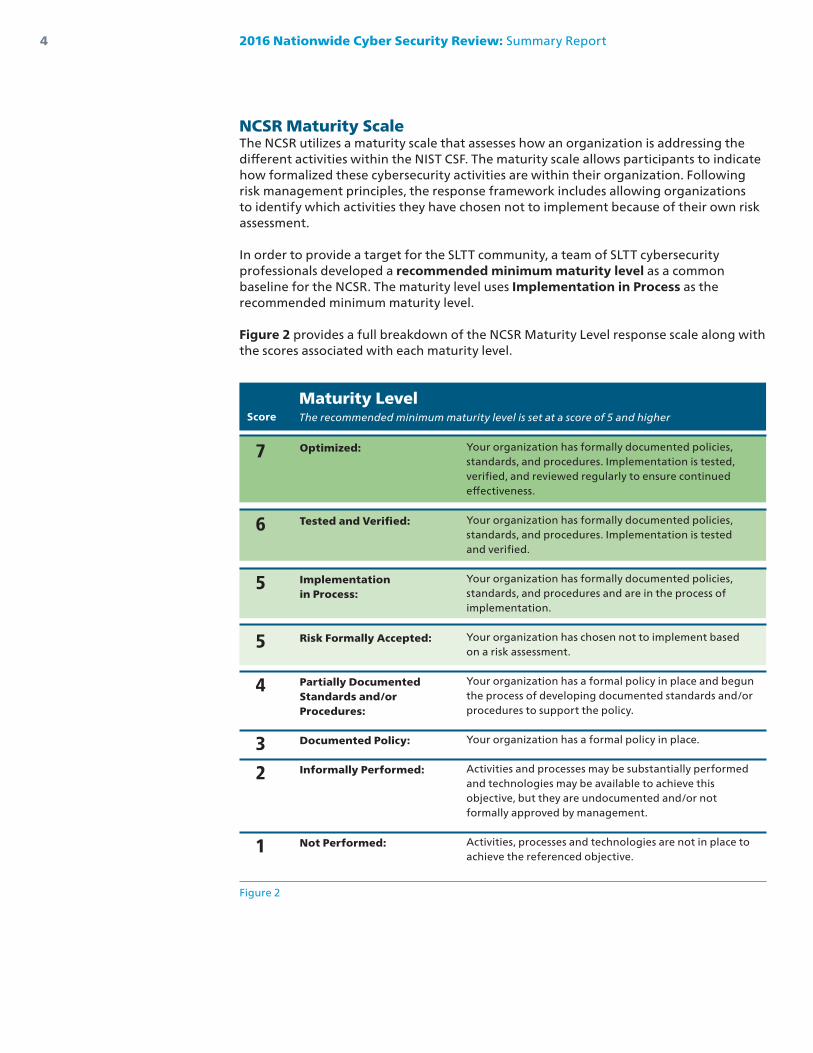
NCSR Maturity Scale The NCSR utilizes a maturity scale that assesses how an organization is addressing the different activities within the NIST CSF. The maturity scale allows participants to indicate how formalized these cybersecurity activities are within their organization. Following risk management principles, the response framework includes allowing organizations to identify which activities they have chosen not to implement because of their own risk assessment.
In order to provide a target for the SLTT community, a team of SLTT cybersecurity professionals developed a recommended minimum maturity level as a common baseline for the NCSR. The maturity level uses Implementation in Process as the recommended minimum maturity level.
Figure 2 provides a full breakdown of the NCSR Maturity Level response scale along with the scores associated with each maturity level.
Your organization has formally documented policies, standards, and procedures. Implementation is tested, verified, and reviewed regularly to ensure continued effectiveness.
Your organization has formally documented policies, standards, and procedures. Implementation is tested and verified.
Your organization has formally documented policies, standards, and procedures and are in the process of implementation.
Your organization has chosen not to implement based on a risk assessment.
Your organization has a formal policy in place and begun the process of developing documented standards and/or procedures to support the policy.
Your organization has a formal policy in place.
Activities and processes may be substantially performed and technologies may be available to achieve this objective, but they are undocumented and/or not formally approved by management.
Activities, processes and technologies are not in place to achieve the referenced objective.
Optimized:
Tested and Verified:
Implementationin Process:
Risk Formally Accepted:
Partially Documented Standards and/or Procedures:
Documented Policy:
Informally Performed:
Not Performed:
Score
Maturity LevelThe recommended minimum maturity level is set at a score of 5 and higher
7
6
5
5
4
3
2
1
Figure 2
2016 Nationwide Cyber Security Review: Summary Report 5
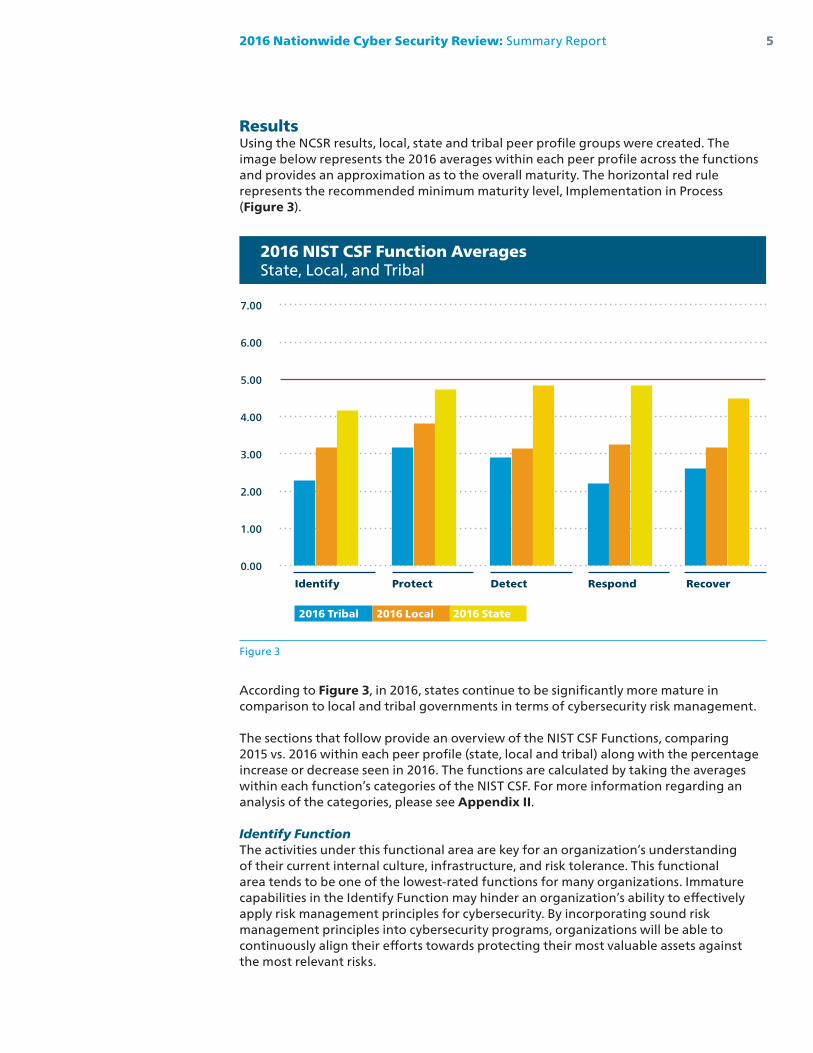
ResultsUsing the NCSR results, local, state and tribal peer profile groups were created. The image below represents the 2016 averages within each peer profile across the functions and provides an approximation as to the overall maturity. The horizontal red rule represents the recommended minimum maturity level, Implementation in Process (Figure 3).
2016 NIST CSF Function AveragesState, Local, and Tribal
7.00
6.00
5.00
4.00
3.00
2.00
1.00
0.00
Identify Protect Detect Respond Recover
2016 Tribal 2016 Local 2016 State
Figure 3
According to Figure 3, in 2016, states continue to be significantly more mature in comparison to local and tribal governments in terms of cybersecurity risk management.
The sections that follow provide an overview of the NIST CSF Functions, comparing 2015 vs. 2016 within each peer profile (state, local and tribal) along with the percentage increase or decrease seen in 2016. The functions are calculated by taking the averages within each function’s categories of the NIST CSF. For more information regarding an analysis of the categories, please see Appendix II.
Identify Function The activities under this functional area are key for an organization’s understanding of their current internal culture, infrastructure, and risk tolerance. This functional area tends to be one of the lowest-rated functions for many organizations. Immature capabilities in the Identify Function may hinder an organization’s ability to effectively apply risk management principles for cybersecurity. By incorporating sound risk management principles into cybersecurity programs, organizations will be able to continuously align their efforts towards protecting their most valuable assets against the most relevant risks.
2016 Nationwide Cyber Security Review: Summary Report6
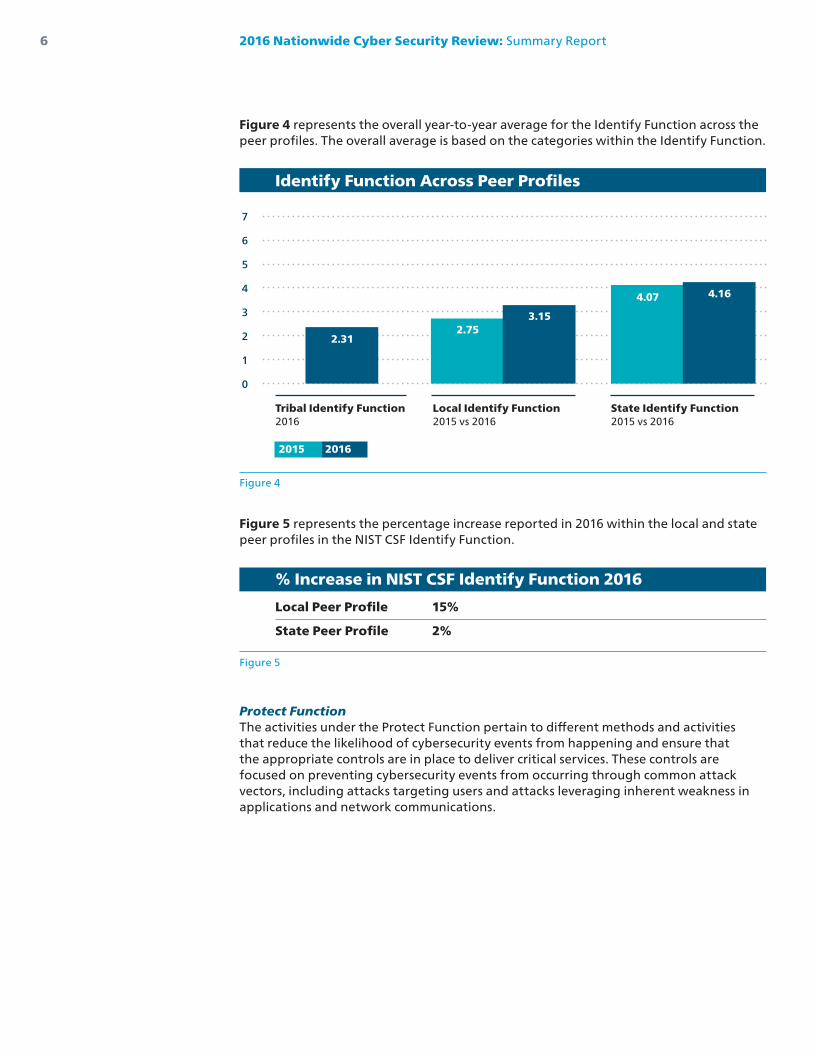
Figure 4 represents the overall year-to-year average for the Identify Function across the peer profiles. The overall average is based on the categories within the Identify Function.
Figure 5 represents the percentage increase reported in 2016 within the local and state peer profiles in the NIST CSF Identify Function.
Protect Function The activities under the Protect Function pertain to different methods and activities that reduce the likelihood of cybersecurity events from happening and ensure that the appropriate controls are in place to deliver critical services. These controls are focused on preventing cybersecurity events from occurring through common attack vectors, including attacks targeting users and attacks leveraging inherent weakness in applications and network communications.
Tribal Identify Function2016
Local Identify Function2015 vs 2016
State Identify Function2015 vs 2016
Identify Function Across Peer Profiles
7
6
5
4
3
2
1
0
2.312.75
3.15
4.07 4.16
2015 2016
Figure 4
% Increase in NIST CSF Identify Function 2016
Local Peer Profile 15%
State Peer Profile 2%
Figure 5
2016 Nationwide Cyber Security Review: Summary Report 7
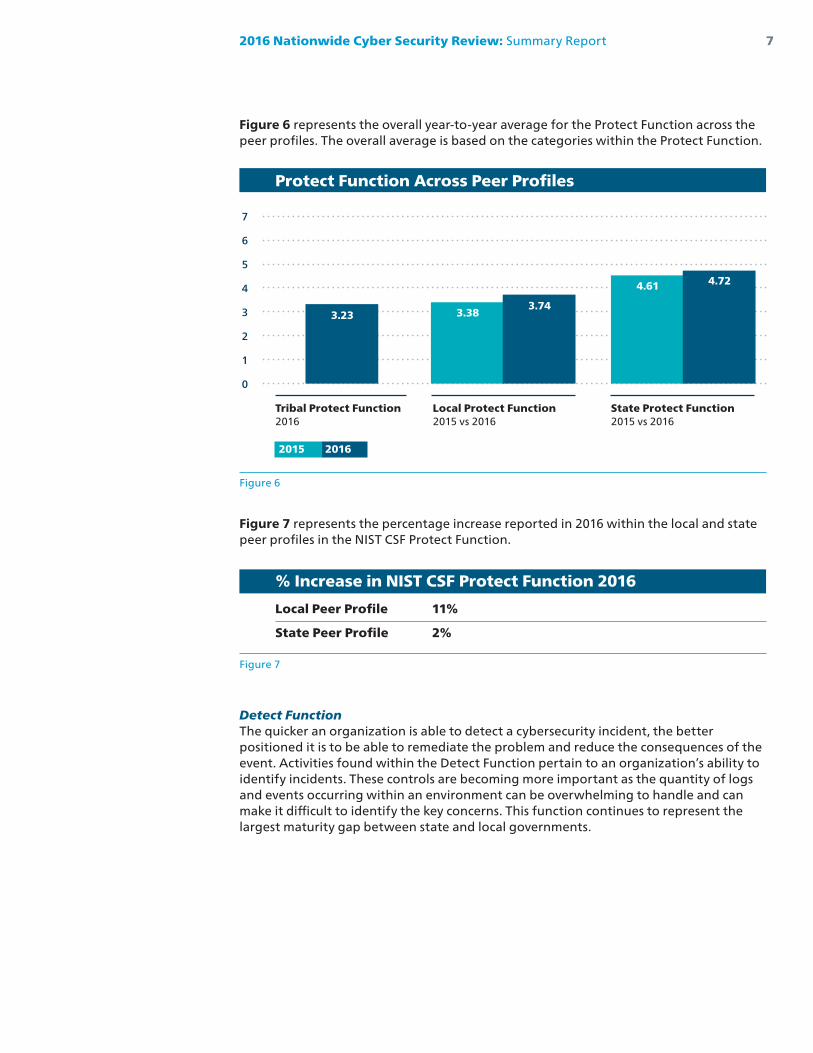
Figure 6 represents the overall year-to-year average for the Protect Function across the peer profiles. The overall average is based on the categories within the Protect Function.
Figure 7 represents the percentage increase reported in 2016 within the local and state peer profiles in the NIST CSF Protect Function.
Detect FunctionThe quicker an organization is able to detect a cybersecurity incident, the better positioned it is to be able to remediate the problem and reduce the consequences of the event. Activities found within the Detect Function pertain to an organization’s ability to identify incidents. These controls are becoming more important as the quantity of logs and events occurring within an environment can be overwhelming to handle and can make it difficult to identify the key concerns. This function continues to represent the largest maturity gap between state and local governments.
Tribal Protect Function2016
Local Protect Function2015 vs 2016
State Protect Function2015 vs 2016
Protect Function Across Peer Profiles
7
6
5
4
3
2
1
0
3.23 3.383.74
4.61 4.72
2015 2016
Figure 6
% Increase in NIST CSF Protect Function 2016
Local Peer Profile 11%
State Peer Profile 2%
Figure 7
2016 Nationwide Cyber Security Review: Summary Report8
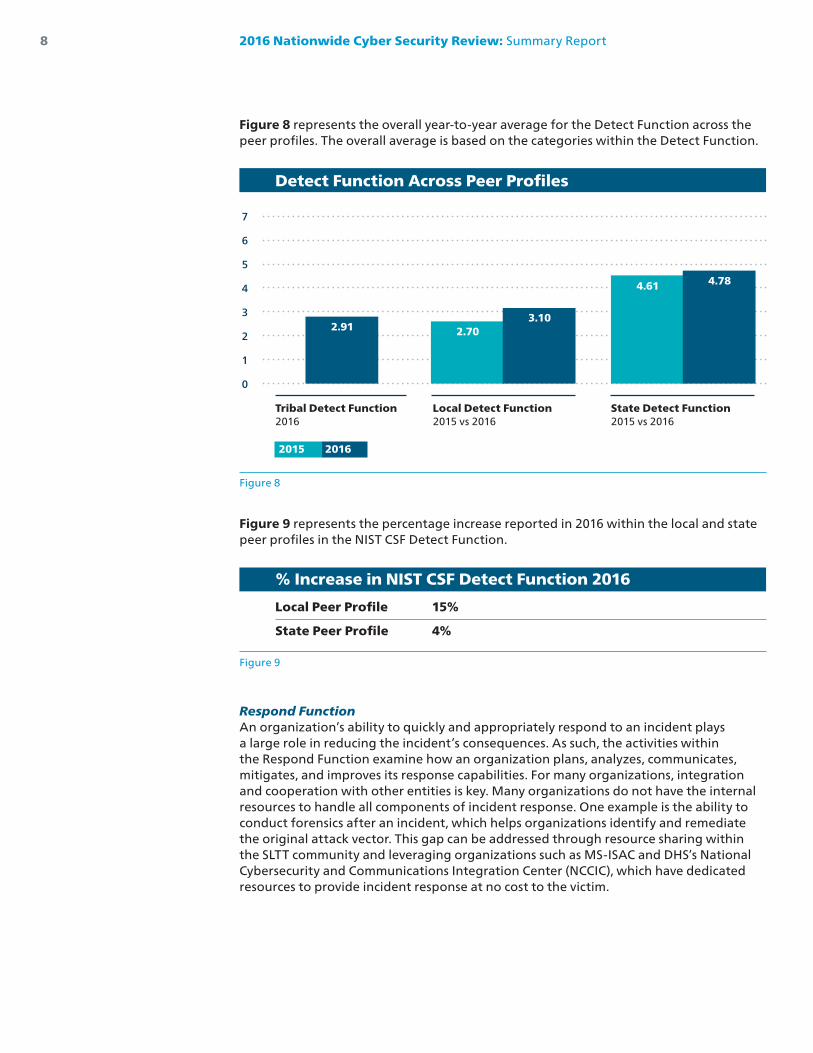
Figure 8 represents the overall year-to-year average for the Detect Function across the peer profiles. The overall average is based on the categories within the Detect Function.
Figure 9 represents the percentage increase reported in 2016 within the local and state peer profiles in the NIST CSF Detect Function.
Respond FunctionAn organization’s ability to quickly and appropriately respond to an incident plays a large role in reducing the incident’s consequences. As such, the activities within the Respond Function examine how an organization plans, analyzes, communicates, mitigates, and improves its response capabilities. For many organizations, integration and cooperation with other entities is key. Many organizations do not have the internal resources to handle all components of incident response. One example is the ability to conduct forensics after an incident, which helps organizations identify and remediate the original attack vector. This gap can be addressed through resource sharing within the SLTT community and leveraging organizations such as MS-ISAC and DHS’s National Cybersecurity and Communications Integration Center (NCCIC), which have dedicated resources to provide incident response at no cost to the victim.
Tribal Detect Function2016
Local Detect Function2015 vs 2016
State Detect Function2015 vs 2016
Detect Function Across Peer Profiles
7
6
5
4
3
2
1
0
2.91 2.703.10
4.61 4.78
2015 2016
Figure 8
% Increase in NIST CSF Detect Function 2016
Local Peer Profile 15%
State Peer Profile 4%
Figure 9
2016 Nationwide Cyber Security Review: Summary Report 9
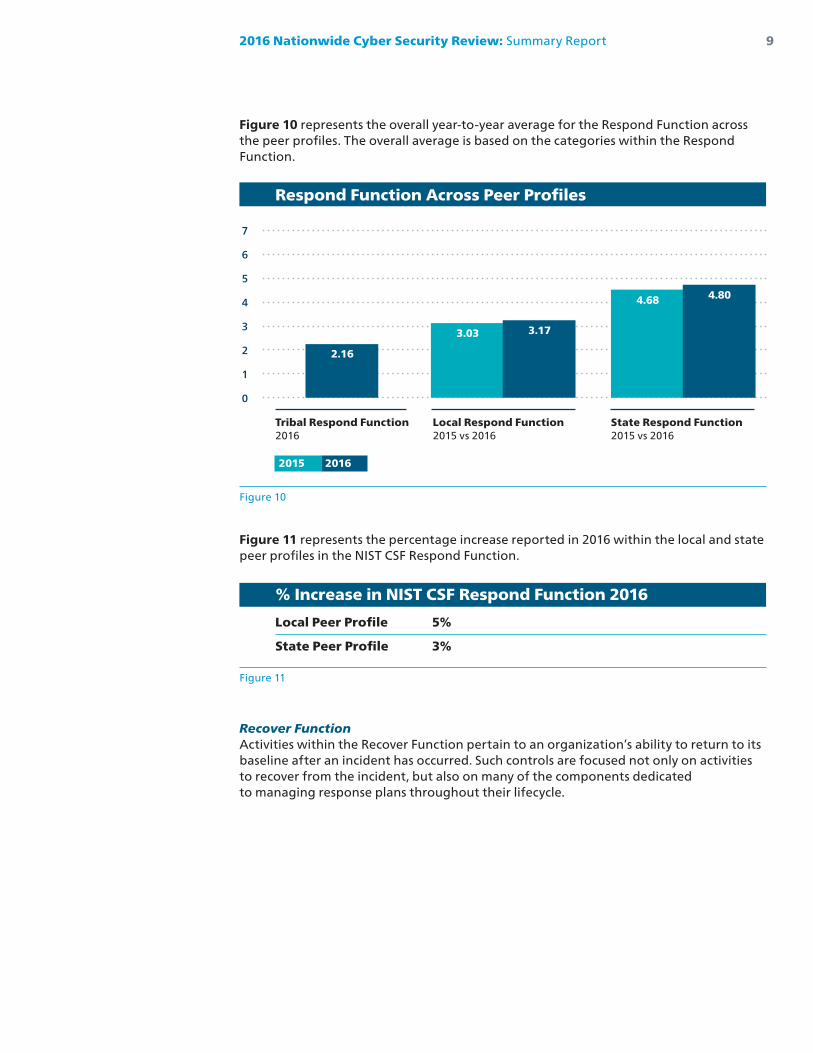
Figure 10 represents the overall year-to-year average for the Respond Function across the peer profiles. The overall average is based on the categories within the Respond Function.
Figure 11 represents the percentage increase reported in 2016 within the local and state peer profiles in the NIST CSF Respond Function.
Recover FunctionActivities within the Recover Function pertain to an organization’s ability to return to its baseline after an incident has occurred. Such controls are focused not only on activities to recover from the incident, but also on many of the components dedicated to managing response plans throughout their lifecycle.
Tribal Respond Function2016
Local Respond Function2015 vs 2016
State Respond Function2015 vs 2016
Respond Function Across Peer Profiles
7
6
5
4
3
2
1
0
2.16
3.03 3.17
4.68 4.80
2015 2016
Figure 10
% Increase in NIST CSF Respond Function 2016
Local Peer Profile 5%
State Peer Profile 3%
Figure 11
2016 Nationwide Cyber Security Review: Summary Report10
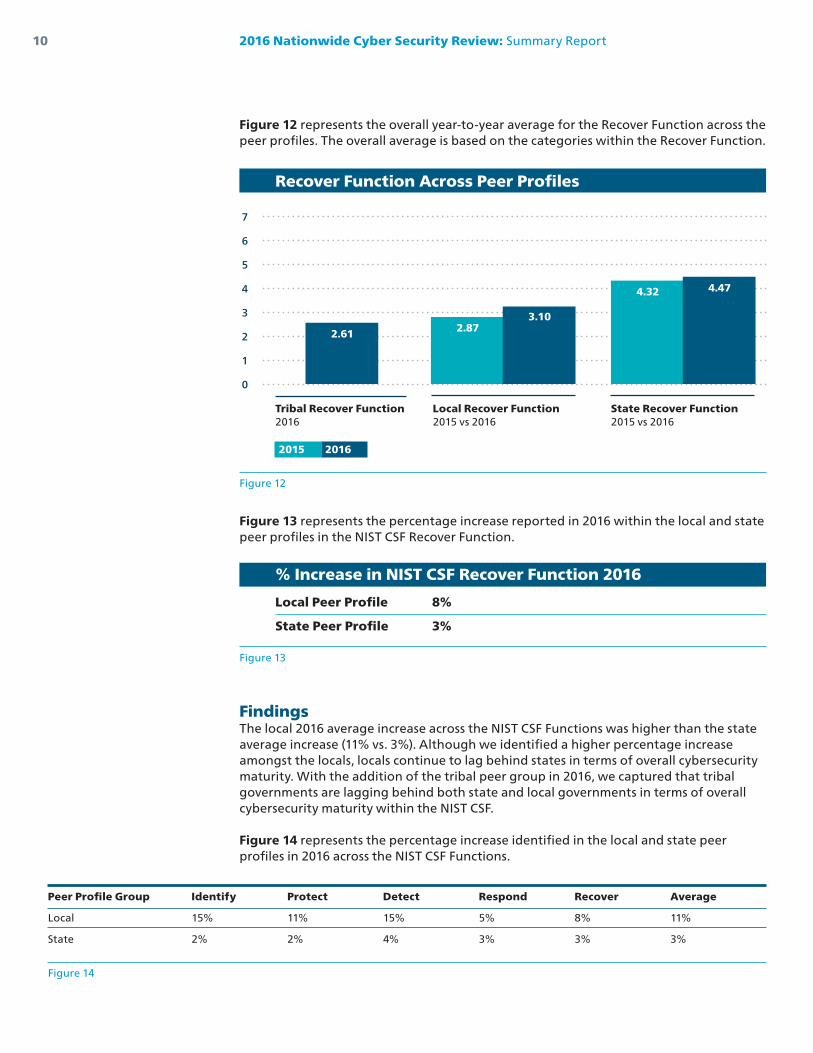
Figure 12 represents the overall year-to-year average for the Recover Function across the peer profiles. The overall average is based on the categories within the Recover Function.
Figure 13 represents the percentage increase reported in 2016 within the local and state peer profiles in the NIST CSF Recover Function.
FindingsThe local 2016 average increase across the NIST CSF Functions was higher than the state average increase (11% vs. 3%). Although we identified a higher percentage increase amongst the locals, locals continue to lag behind states in terms of overall cybersecurity maturity. With the addition of the tribal peer group in 2016, we captured that tribal governments are lagging behind both state and local governments in terms of overall cybersecurity maturity within the NIST CSF.
Figure 14 represents the percentage increase identified in the local and state peer profiles in 2016 across the NIST CSF Functions.
Tribal Recover Function2016
Local Recover Function2015 vs 2016
State Recover Function2015 vs 2016
Recover Function Across Peer Profiles
7
6
5
4
3
2
1
0
2.61 2.873.10
4.32 4.47
2015 2016
Figure 12
% Increase in NIST CSF Recover Function 2016
Local Peer Profile 8%
State Peer Profile 3%
Figure 13
Peer Profile Group Identify Protect Detect Respond Recover Average
Local 15% 11% 15% 5% 8% 11%
State 2% 2% 4% 3% 3% 3%
Figure 14
2016 Nationwide Cyber Security Review: Summary Report
State Recover Function2015 vs 2016
11
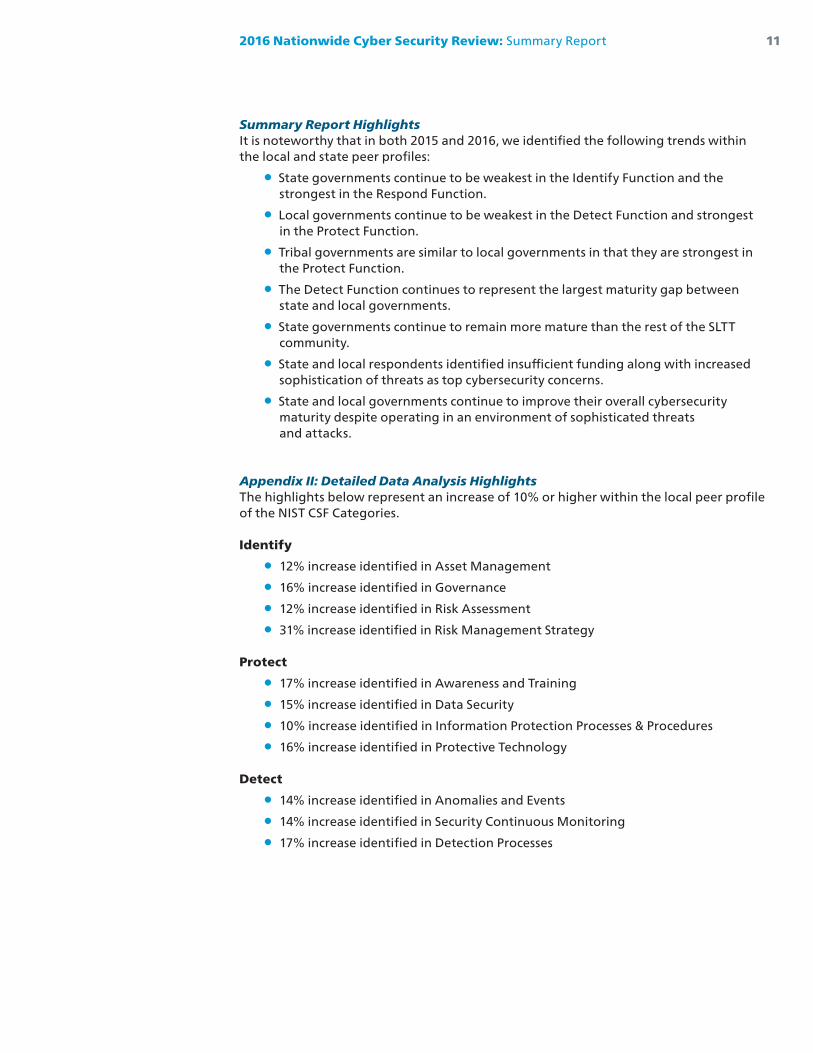
Summary Report HighlightsIt is noteworthy that in both 2015 and 2016, we identified the following trends within the local and state peer profiles:
• State governments continue to be weakest in the Identify Function and the strongest in the Respond Function.
• Local governments continue to be weakest in the Detect Function and strongest in the Protect Function.
• Tribal governments are similar to local governments in that they are strongest in the Protect Function.
• The Detect Function continues to represent the largest maturity gap between state and local governments.
• State governments continue to remain more mature than the rest of the SLTT community.
• State and local respondents identified insufficient funding along with increased sophistication of threats as top cybersecurity concerns.
• State and local governments continue to improve their overall cybersecurity maturity despite operating in an environment of sophisticated threats and attacks.
Appendix II: Detailed Data Analysis HighlightsThe highlights below represent an increase of 10% or higher within the local peer profile of the NIST CSF Categories.
Identify
• 12% increase identified in Asset Management
• 16% increase identified in Governance
• 12% increase identified in Risk Assessment
• 31% increase identified in Risk Management Strategy
Protect
• 17% increase identified in Awareness and Training
• 15% increase identified in Data Security
• 10% increase identified in Information Protection Processes & Procedures
• 16% increase identified in Protective Technology
Detect
• 14% increase identified in Anomalies and Events
• 14% increase identified in Security Continuous Monitoring
• 17% increase identified in Detection Processes
2016 Nationwide Cyber Security Review: Summary Report12
Next StepsThe results of the 2016 NCSR, although a “snapshot” in time, give pause to reflect on the opportunities to improve all public sector security maturities. It reflects the opportunities that states have to help promote local, tribal, and territorial programs. Collaboration between agencies and peer groups will help support improvement of the maturity of all our programs. Certainly, collaboration with our partners such as DHS, NASCIO, NACo and other cybersecurity organizations will help strengthen our public sector programs.
Collaboration is already in progress to identify grants available to the SLTT community that will support cybersecurity programs and best practice recommendations. The NCSR continues to provide a unique view of cybersecurity maturity across the SLTT community. DHS and MS-ISAC will use the results and work with our partners in state, local, tribal and territorial governments in identifying actionable steps for improving the security of our nation’s critical cyber infrastructure.
A detailed data analysis of the 2016 Nationwide Cyber Security Review Summary Report accompanies this report, located in Appendix II. It contains an analysis of the categories found within each function of the NIST CSF along with their definitions.
2016 Nationwide Cyber Security Review: Summary Report 13
PartnersDHS has partnered with the MS-ISAC, the National Association of State Chief Information Officers (NASCIO), and the National Association of Counties (NACo) to develop the Nationwide Cyber Security Review.
U.S. Department of Homeland SecurityDHS is responsible for safeguarding our nation’s critical infrastructure from physical and cyber threats that can affect national security, public safety, and economic prosperity. The National Protection and Programs Directorate leads DHS’ efforts to secure cyberspace and cyber infrastructure. For additional information, please visit www.dhs.gov/cyber.
Multi-State Information Sharing & Analysis CenterGrant-funded by DHS, the Multi-State Information Sharing & Analysis Center (MS-ISAC) is the focal point for cyber threat prevention, protection, response and recovery for the nation’s state, local, tribal and territorial (SLTT) governments. MS-ISAC 24x7 Security Operations Center provides real-time network monitoring, early cyber threat warnings and advisories, vulnerability identification and mitigation and incident response. For more information about the MS-ISAC, please visit https://msisac.cisecurity.org/
National Association of State Chief Information OfficersNASCIO’s mission is to foster government excellence through quality business practices, information management, and technology policy.
Founded in 1969, NASCIO is a nonprofit, 501(c)(3) association representing state chief information officers and information technology executives and managers from the states, territories, and the District of Columbia. The primary state members are senior officials from state government who have executive-level and statewide responsibility for information technology leadership. State officials who are involved in agency level information technology management may participate as associate members. Representatives from federal, municipal, international government, and nonprofit organizations may also participate as members. Private-sector firms join as corporate members and participate in the Corporate Leadership Council. For more information about NASCIO, please visit https://www.nascio.org/
National Association of CountiesThe National Association of Counties (NACo) is the only national organization that represents county governments in the United States.
Founded in 1935, NACo provides essential services to the nation’s 3,069 counties. NACo advances issues with a unified voice before the federal government, improves the public’s understanding of county government, assists counties in finding and sharing innovative solutions through education and research, and provides value-added services to save counties and taxpayers money. For more information about NACo, please visit www.naco.org
2016 Nationwide Cyber Security Review: Summary Report14
Appendix I: Acronyms
CIS Controls Center for Internet Security Critical Security Controls
CJIS Criminal Justice Information System
CTA Cyber Threat Actors
DDoS Distributed Denial of Service
DHS U.S. Department of Homeland Security
HIPAA Health Insurance Portability and Accountability Act
IRS Internal Revenue Service
MS-ISAC Multi-State Information Sharing & Analysis Center
NACo National Association of Counties
NASCIO National Association of State Chief Information Officers
NCCIC National Cybersecurity and Communications Integration Center
NCSR Nationwide Cyber Security Review
NIST National Institute of Standards and Technology
NIST CSF National Institute of Standards and Technology Cybersecurity Framework
PCI Payment Card Industry
SLTT State, Local, Tribal, and Territorial
Appendix II: Detailed Data Analysis
Analysis by Category AveragesThe 2016 Nationwide Cyber Security Review (NCSR) uses the National Institute of Standards and Technology (NIST) Cybersecurity Framework (CSF) sub-categories as its question set. The sections that follow provide a complete overview of the year-to-year comparison of the NIST CSF category averages along with the percentage increase and/or decrease. The function scores are calculated by taking the averages within each of the functions categories while the categories scores are calculated by taking the averages of the sub-categories within each category.
The data is displayed in three different peer profile types: state, local and tribal. Historical 2015 data for the tribal peer profile is not present as 2016 marks the first year there was enough participation from the tribal government to create a separate peer profile group.
Overall, there was an 11% increase seen in the local profile and a 3% increase in the state profile across the NIST CSF functions. Although the local profiles average increase in 2016 across the NIST CSF functions was higher than the state profiles average increase, locals continue to lag behind states in terms of overall maturity.
2016 Nationwide Cyber Security Review: Summary Report 15
Identify FunctionThe activities found within this functional area are key for an organization’s understanding of their current internal culture, infrastructure, and risk tolerance. This functional area tends to be one of the lowest functions rated for many organizations. Immature capabilities in the Identify Function may hinder an organization’s ability to effectively apply risk management principles for cybersecurity. By incorporating sound risk management principles into cybersecurity programs, organizations will be able to continuously align their efforts towards protecting their most valuable assets against the most relevant and pertinent risks.
Identify Categories
• Asset Management: The data, personnel, devices, system, and facilities that enable the organization to achieve business purposes are identified and managed consistent with their relative importance to business objectives and the organization’s risk strategy.
• Business Environment: The organization’s missions, objectives, stakeholders, and activities are understood and prioritized; this information is used to inform cybersecurity roles, responsibilities, and risk management decisions.
• Governance: The policies, procedures, and processes to manage and monitor the organization’s regulatory, legal, risk, environmental, and operational requirements are understood and inform the management of cybersecurity risk.
• Risk Assessment: The organization understands the cybersecurity risks to organizational operations (including mission, functions, image, or reputation), organizational assets, and individuals.
• Risk Management Strategy: The organization’s priorities, constraints, risk tolerances, and assumptions are established and used to support operational risk decisions.
2016 Nationwide Cyber Security Review: Summary Report16
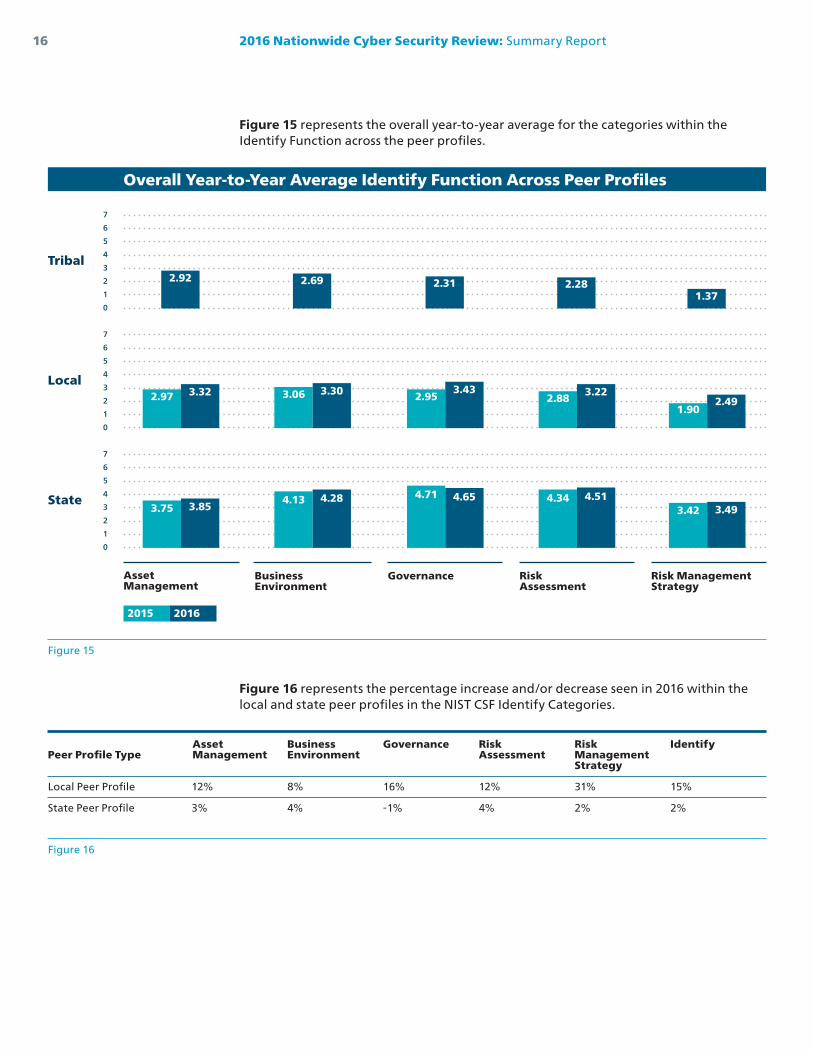
Figure 15 represents the overall year-to-year average for the categories within the Identify Function across the peer profiles.
Figure 16 represents the percentage increase and/or decrease seen in 2016 within the local and state peer profiles in the NIST CSF Identify Categories.
Asset Management
Business Environment
Governance
Overall Year-to-Year Average Identify Function Across Peer Profiles
7
6
5
4
3
2
1
0
7
6
5
4
3
2
1
0
7
6
5
4
3
2
1
0
2015 2016
Figure 15
Tribal
Local
State
Risk Assessment
Risk ManagementStrategy
3.75 3.854.13 4.28
3.42 3.494.71 4.65 4.34 4.51
2.97 3.32 3.06 3.30
1.902.492.95
3.432.88
3.22
2.92 2.691.37
2.31 2.28
Figure 16
AssetManagement
BusinessEnvironment
Governance RiskAssessment
RiskManagementStrategy
IdentifyPeer Profile Type
Local Peer Profile 12% 8% 16% 12% 31% 15%
State Peer Profile 3% 4% -1% 4% 2% 2%
2016 Nationwide Cyber Security Review: Summary Report 17
Protect Function The activities under the Protect Function pertain to different methods and activities that reduce the likelihood of cybersecurity events from happening and ensure that the appropriate controls are in place to deliver critical services. These controls are focused on preventing cybersecurity events from occurring through common attack vectors, including attacks targeting users and attacks leveraging inherent weakness in applications and network communications.
Protect Categories
• Access Control: Access to assets and associated facilities is limited to authorized users, processes, or devices, and to authorized activities and transactions.
• Awareness and Training: The organization’s personnel and partners are provided cybersecurity awareness education and are adequately trained to perform their information security-related duties and responsibilities consistent with related policies, procedures, and agreements.
• Data Security: Information and records (data) are managed consistent with the organization’s risk strategy to protect the confidentiality, integrity and availability of information.
• Information Protection Processes & Procedures: Security policies (that address purpose, scope, roles, responsibilities, management commitment, and coordination among organizational entities), processes, and procedures are maintained and used to manage protection of information systems and assets.
• Maintenance: Maintenance and repairs of industrial control and information system components are performed consistent with policies and procedures.
• Protective Technology: Technical security solutions are managed to ensure the security and resilience of systems and assets, consistent with related policies, procedures, and agreements.
2016 Nationwide Cyber Security Review: Summary Report18
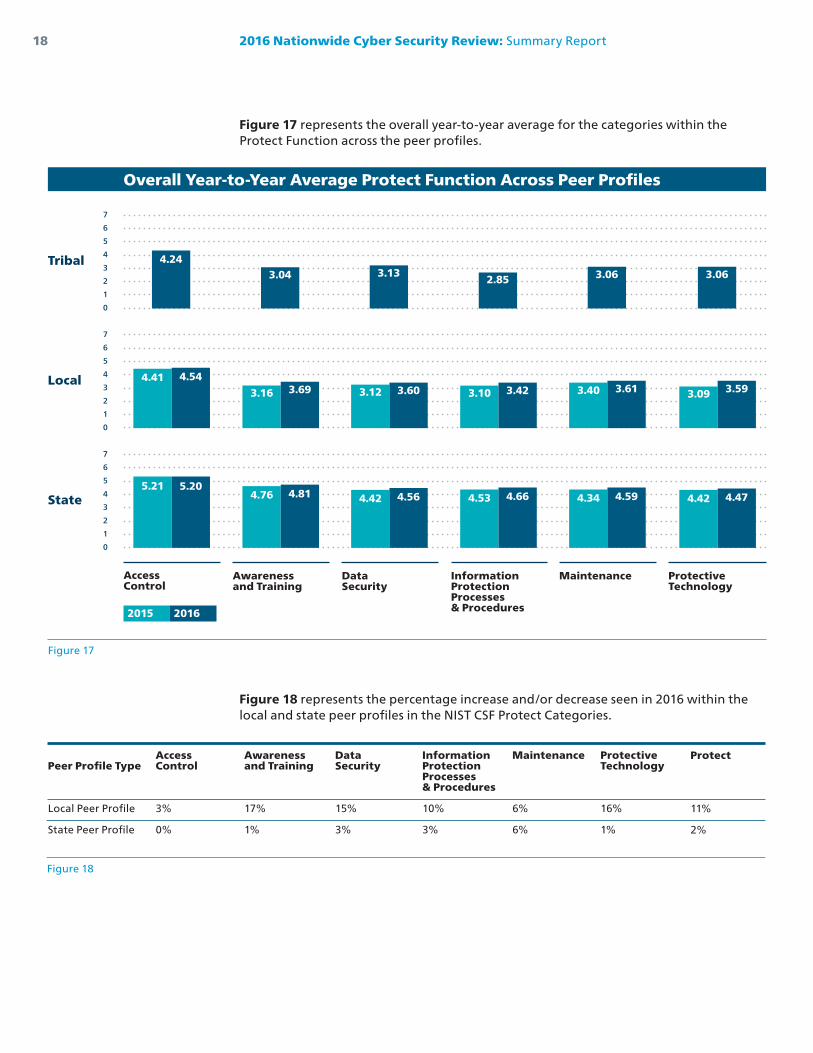
Figure 17 represents the overall year-to-year average for the categories within the Protect Function across the peer profiles.
Figure 18 represents the percentage increase and/or decrease seen in 2016 within the local and state peer profiles in the NIST CSF Protect Categories.
AccessControl
Awareness and Training
DataSecurity
Overall Year-to-Year Average Protect Function Across Peer Profiles
7
6
5
4
3
2
1
0
7
6
5
4
3
2
1
0
7
6
5
4
3
2
1
0
2015 2016
Figure 17
Tribal
Local
State
Information Protection Processes & Procedures
Maintenance
5.21 5.204.76 4.81 4.34 4.594.42 4.56 4.53 4.66
4.41 4.54
3.16 3.69 3.40 3.613.12 3.60 3.10 3.42
4.243.04 3.063.13
2.85
ProtectiveTechnology
4.42 4.47
3.09 3.59
3.06
Figure 18
AccessControl
3%
0%
Peer Profile Type
Local Peer Profile State Peer Profile
Awareness and Training
17%
1%
DataSecurity
15%
3%
Information Protection Processes & Procedures
10%
3%
Maintenance
6%
6%
ProtectiveTechnology
16%
1%
Protect
11%
2%
2016 Nationwide Cyber Security Review: Summary Report 19
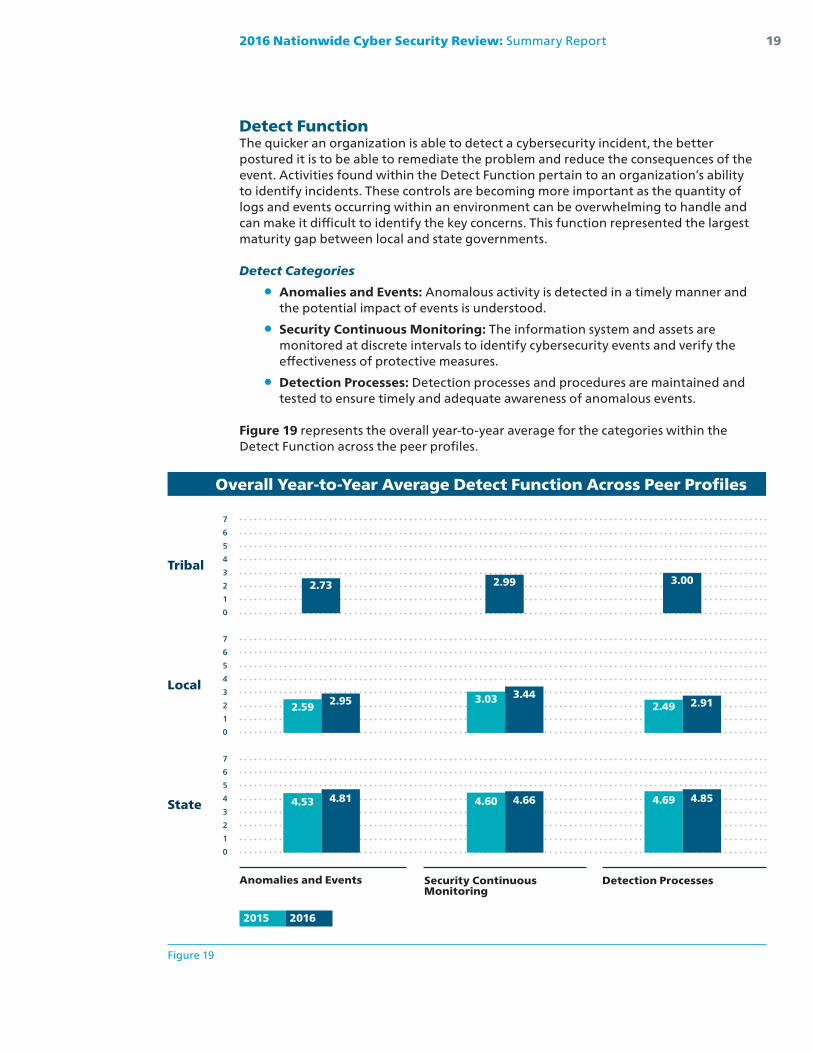
Detect FunctionThe quicker an organization is able to detect a cybersecurity incident, the better postured it is to be able to remediate the problem and reduce the consequences of the event. Activities found within the Detect Function pertain to an organization’s ability to identify incidents. These controls are becoming more important as the quantity of logs and events occurring within an environment can be overwhelming to handle and can make it difficult to identify the key concerns. This function represented the largest maturity gap between local and state governments.
Detect Categories
• Anomalies and Events: Anomalous activity is detected in a timely manner and the potential impact of events is understood.
• Security Continuous Monitoring: The information system and assets are monitored at discrete intervals to identify cybersecurity events and verify the effectiveness of protective measures.
• Detection Processes: Detection processes and procedures are maintained and tested to ensure timely and adequate awareness of anomalous events.
Figure 19 represents the overall year-to-year average for the categories within the Detect Function across the peer profiles.
Anomalies and Events Security Continuous Monitoring
Detection Processes
Overall Year-to-Year Average Detect Function Across Peer Profiles
7
6
5
4
3
2
1
0
7
6
5
4
3
2
1
0
7
6
5
4
3
2
1
0
2015 2016
Figure 19
Tribal
Local
State 4.53 4.81 4.60 4.66 4.69 4.85
2.59 2.95 3.03 3.442.49 2.91
2.73 2.99 3.00
2016 Nationwide Cyber Security Review: Summary Report20
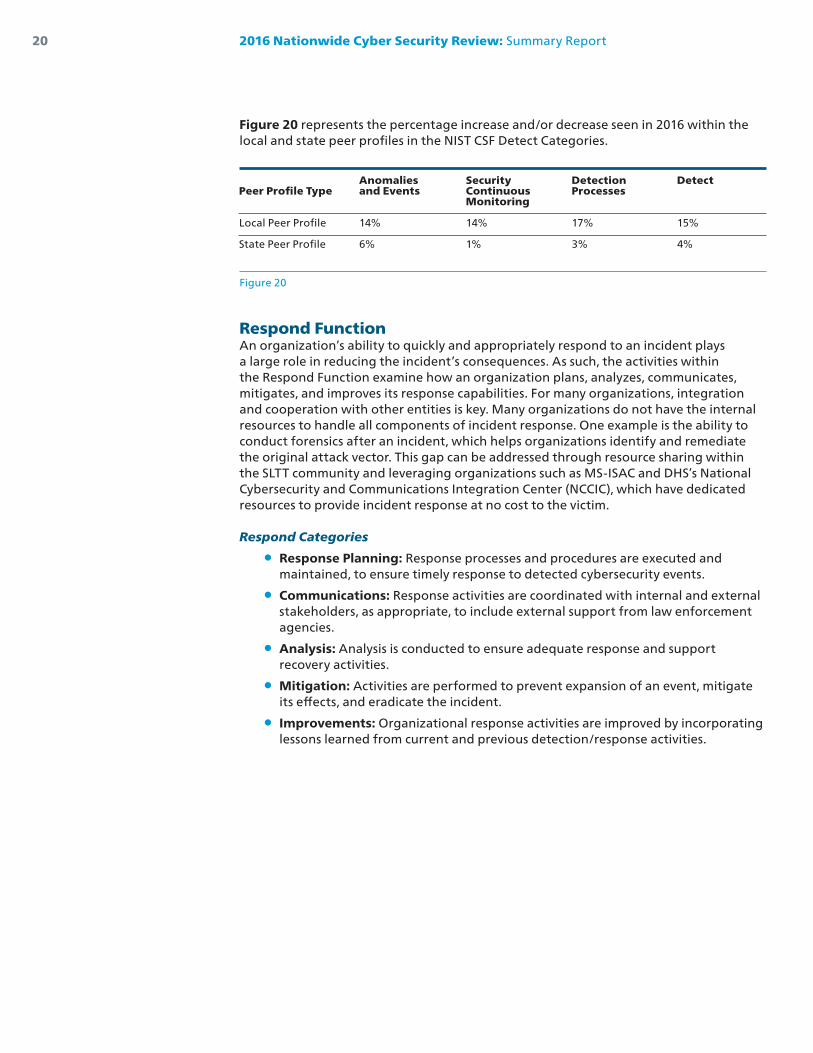
Figure 20 represents the percentage increase and/or decrease seen in 2016 within the local and state peer profiles in the NIST CSF Detect Categories.
Respond FunctionAn organization’s ability to quickly and appropriately respond to an incident plays a large role in reducing the incident’s consequences. As such, the activities within the Respond Function examine how an organization plans, analyzes, communicates, mitigates, and improves its response capabilities. For many organizations, integration and cooperation with other entities is key. Many organizations do not have the internal resources to handle all components of incident response. One example is the ability to conduct forensics after an incident, which helps organizations identify and remediate the original attack vector. This gap can be addressed through resource sharing within the SLTT community and leveraging organizations such as MS-ISAC and DHS’s National Cybersecurity and Communications Integration Center (NCCIC), which have dedicated resources to provide incident response at no cost to the victim.
Respond Categories
• Response Planning: Response processes and procedures are executed and maintained, to ensure timely response to detected cybersecurity events.
• Communications: Response activities are coordinated with internal and external stakeholders, as appropriate, to include external support from law enforcement agencies.
• Analysis: Analysis is conducted to ensure adequate response and support recovery activities.
• Mitigation: Activities are performed to prevent expansion of an event, mitigate its effects, and eradicate the incident.
• Improvements: Organizational response activities are improved by incorporating lessons learned from current and previous detection/response activities.
Security Continuous Monitoring
14%
1%
DetectionProcesses
17%
3%
Detect
15%
4%
Figure 20
Anomaliesand Events
14%
6%
Peer Profile Type
Local Peer Profile State Peer Profile
2016 Nationwide Cyber Security Review: Summary Report 21
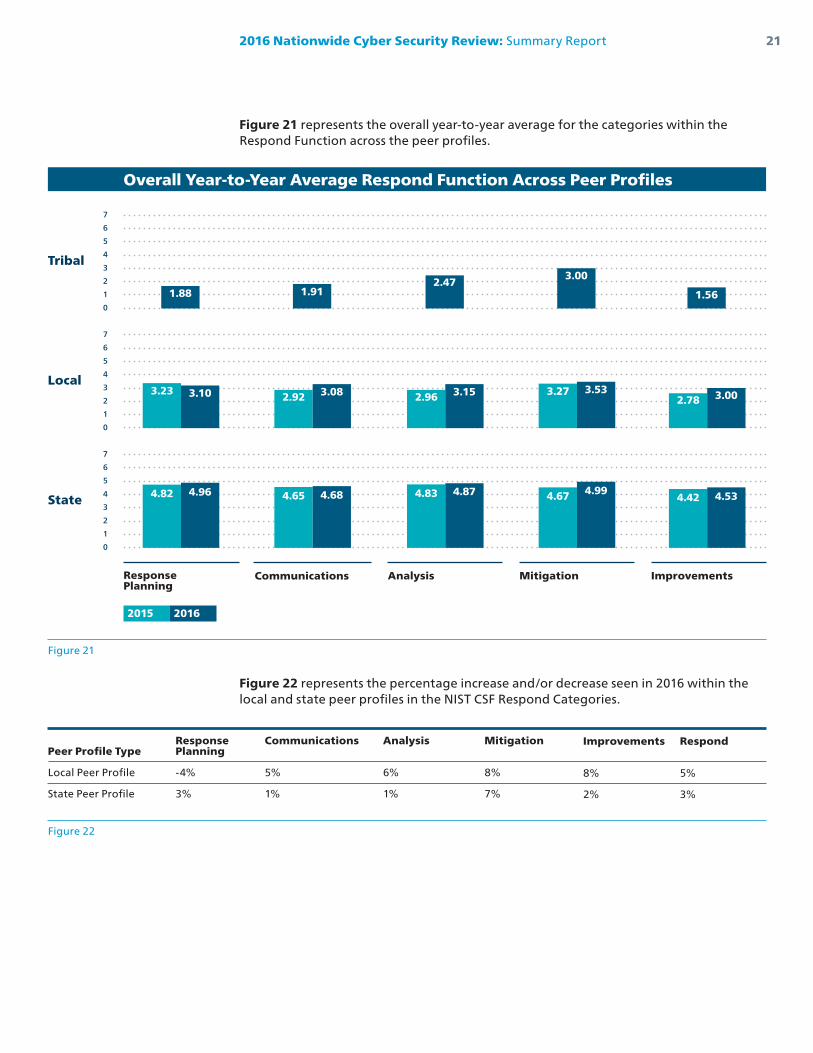
Figure 21 represents the overall year-to-year average for the categories within the Respond Function across the peer profiles.
Figure 22 represents the percentage increase and/or decrease seen in 2016 within the local and state peer profiles in the NIST CSF Respond Categories.
ResponsePlanning
Communications Analysis
Overall Year-to-Year Average Respond Function Across Peer Profiles
7
6
5
4
3
2
1
0
7
6
5
4
3
2
1
0
7
6
5
4
3
2
1
0
2015 2016
Figure 21
Tribal
Local
State
Mitigation Improvements
4.82 4.96 4.65 4.68 4.42 4.534.83 4.87 4.67 4.99
3.23 3.10 2.92 3.082.78 3.002.96 3.15 3.27 3.53
1.88 1.91 1.562.47
3.00
Figure 22
ResponsePlanning
-4%
3%
Peer Profile Type
Local Peer Profile State Peer Profile
Communications
5%
1%
Analysis
6%
1%
Mitigation
8%
7%
Improvements
8%
2%
Respond
5%
3%
2016 Nationwide Cyber Security Review: Summary Report22
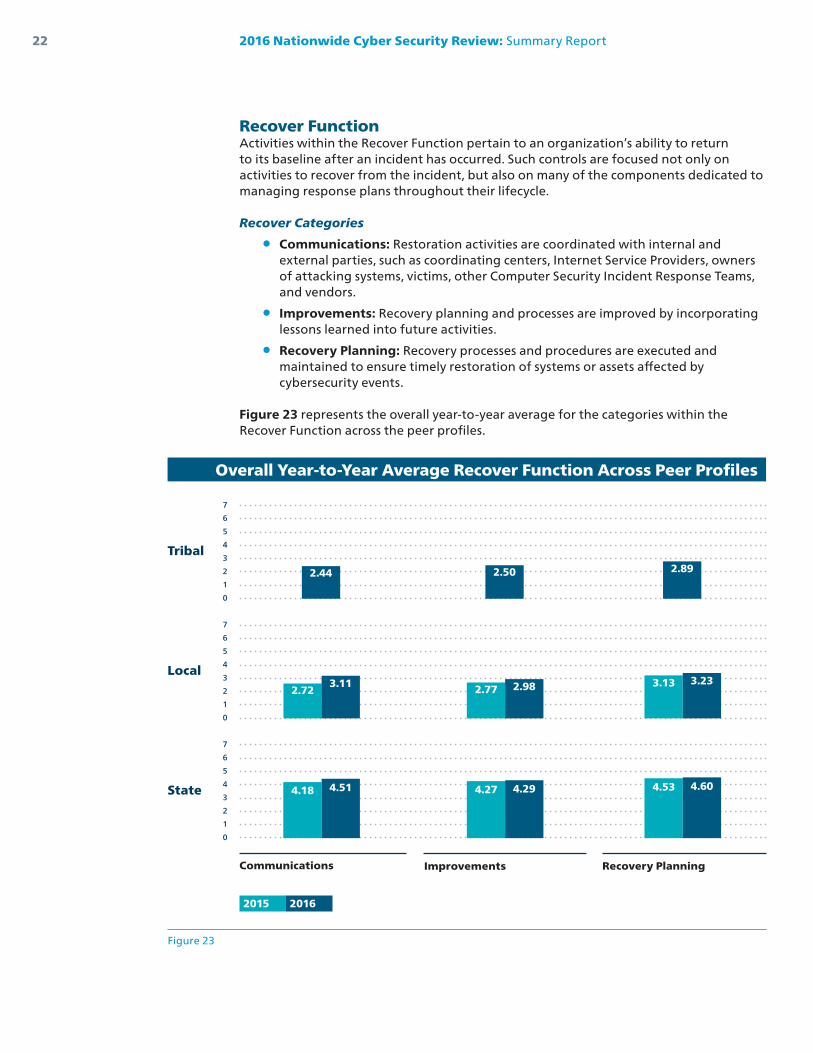
Recover FunctionActivities within the Recover Function pertain to an organization’s ability to return to its baseline after an incident has occurred. Such controls are focused not only on activities to recover from the incident, but also on many of the components dedicated to managing response plans throughout their lifecycle.
Recover Categories
• Communications: Restoration activities are coordinated with internal and external parties, such as coordinating centers, Internet Service Providers, owners of attacking systems, victims, other Computer Security Incident Response Teams, and vendors.
• Improvements: Recovery planning and processes are improved by incorporating lessons learned into future activities.
• Recovery Planning: Recovery processes and procedures are executed and maintained to ensure timely restoration of systems or assets affected by cybersecurity events.
Figure 23 represents the overall year-to-year average for the categories within the Recover Function across the peer profiles.
Communications Improvements Recovery Planning
Overall Year-to-Year Average Recover Function Across Peer Profiles
7
6
5
4
3
2
1
0
7
6
5
4
3
2
1
0
7
6
5
4
3
2
1
0
2015 2016
Figure 23
Tribal
Local
State 4.18 4.51 4.27 4.29 4.53 4.60
2.723.11 2.77 2.98 3.13 3.23
2.44 2.50 2.89
2016 Nationwide Cyber Security Review: Summary Report 23
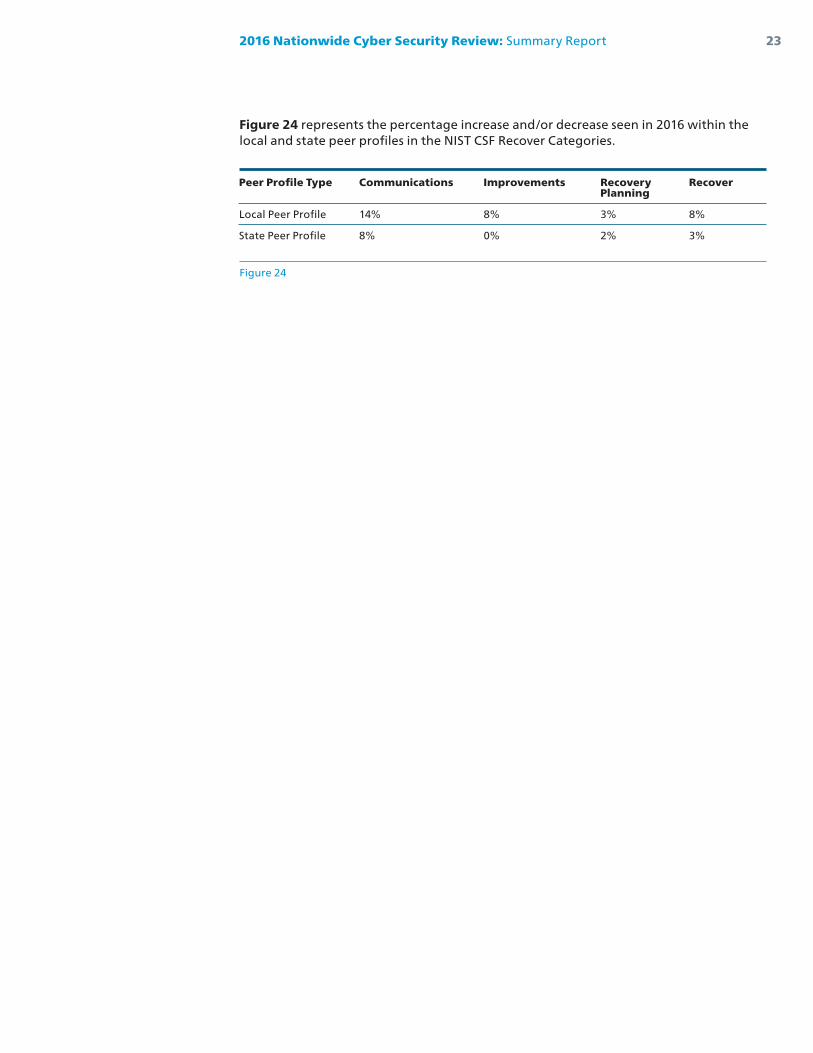
Figure 24 represents the percentage increase and/or decrease seen in 2016 within the local and state peer profiles in the NIST CSF Recover Categories.
Figure 24
Communications
14%
8%
Peer Profile Type
Local Peer Profile State Peer Profile
Improvements
8%
0%
RecoveryPlanning
3%
2%
Recover
8%
3%

2016 Nationwide Cyber Security Review: Summary Report


![Cyber Situational Awareness - Amazon S3 · [14] What matters in transforming an organization’s cyber SA is intelligence, integration, speed, analytics, expertise, and resiliency](https://img.pdfslide.net/doc/110x75/5ec625022dfe7234591e2e8a/cyber-situational-awareness-amazon-s3-14-what-matters-in-transforming-an-organizationas.jpg)