Embed Size (px)
Citation preview


2016Market Review
of Electronic Communications& Postal Services

4
This report was prepared by EETT, presenting statistical data and information regarding
the course of the Electronic Communicationsand Postal Services markets for the year 2016 in Greece
5
Summary 6
Chapter1:ElectronicCommunications 10
1.1. The Greek Electronic Communications market 10
1.2. Electronic Communications market key figures 15
1.2.1. Financial data 15
1.2.2. Fixed communications 21
1.2.3. Mobile communications 30
1.2.4. Comparison between fixed and mobile telephony 43
1.2.5. Broadband 45
1.2.6. Pay TV 53
1.2.7. Bundled offers 53
1.2.8. Premium Rate Services (PRS) and directory services 61
1.2.9. Price Observatory’s comparison of retail prices (Pricescope) 62
1.2.10. Comparison of Greek and European market indicators 67
Chapter2:PostalServices 76
2.1. The course of the postal market 76
2.1.1. Globally 76
2.1.2. In Europe 81
2.1.3. In Greece 88
2.2. Evolution of key figures of the postal services market in Greece 89
2.2.1. Financial data from the published financial statements 89
2.2.2. Postal revenue and volume 91
2.2.3. Employment and infrastructure of postal companies 97
2.3. Competition in the postal market 98
2.3.1. Market shares 98
2.3.2. The Universal Service sector 100
2.3.3 The courier services sector 104
Indexofchartsandtables 112
Table of Contents
MARKET REVIEW 2016
6
(a) Electronic Communications2016 may turn out to be a turning point for the domestic telecommunications market. The adoption and imminent implementation of the vectoring Regulation is expected to lead to a fur-ther multi-benefit increase of investments. The three major telecommunications providers have already announced a 2 billion euros investment plan for the next four years. At the same time, competition among bundled offers was further intensified based on high-speed broadband ac-cess, mobile broadband and Pay TV services. The contribution of the industry’s turnover to Greece’s Gross Domestic Product (GDP) ranged at 2.8% in 2016, almost at the same level as in 2015.
Financial dataThe turnover of the telecommunications in-dustry stabilized at the level of 5 billion euros. Re venues from telecommunications services represented the vast majority of all revenues (~90%), while Pay TV revenues were on rise. The total investment made by the electronic com-munications providers increased spectacularly by 69% (corresponding to 22.6% of the total
industry’s turnover), with approximately 70% being carried out on fixed networks and the re-maining 30% on mobile networks. The focus of these investments was mainly the telecommu-nications infrastructure as well as the research and development (e.g. software, new services etc.). The Earnings Before Interest, Tax, Depre-ciation and Amortization (EBITDA) for the major fixed and mobile operators increased by 2.8% compared to 2015, while their gross profit de-clined further at about 415 million, mainly due to increased depreciation figures.
Fixed communicationsFor the first time in recent years, the number of telephone lines increased marginally compared to 2015 attaining a 44.1% population penetration. Conversely, fixed telephony traffic decreased by 6% mainly due to the shorter duration of national calls to fixed phones and international calls as well. Despite the fact that OTE is still the incum-bent operator with a 56% share of the telephony lines, its traffic share is much lower at about 45%. This is attributed to the fact that the alter-native operators outperformed OTE in increasing their fixed to mobile traffic.
SUMMARY
7
Retail revenues from the provision of telephony and Internet services at a fixed location amount-ed to 1.4 billion euros, marking a marginal in-crease compared to last year, mainly due to Internet services’ revenues, with OTE’s relative share estimated at 61% for 2016. The average monthly revenue from providing te-lephony and Internet services at a fixed location rose to 24.75 euros and the respective revenue from stand-alone telephony services was 18.94 euros.
Mobile communicationsIn 2016, the number of mobile phone connec-tions reached 15.9 million registering a 3.8% increase compared to 2015, while active con-nections decreased marginally at 12.5 million. As regards the share of Mobile Telephony Opera-tors (MTOs) in total number of connections, the shares of COSMOTE and VODAFONE slightly in-creased reaching 45.6% and 35.3% respectively, while on the other hand WIND’s share decreased to 18.7%. In terms of active connections, COS-MOTE’s share is in the range of [45%-55%], fol-lowed by VODAFONE with a range of [25%-35%].The use of mobile phone networks has been characterized mainly by the significant reduction in the duration of international calls (voice mi-nutes) and the significant increase in the use of data services. The volume of voice calls marked a 1% compared to last year, while 62% of these calls where on-net. Mobile phone data services increased further by 48% in 2016 thus reaching 46 billion. However, the mobile retail revenues (post-paid and pre-paid) decreased slightly by 2.5% amounting to 1.6 billion euros. The ave-rage annual revenue per user (post-paid and pre-paid) decreased further to 280 and 53 euros respectively.
BroadbandAt the end of 2016, the fixed broadband lines in-creased by 5.2% reaching 3,616,705. Notably, the fixed broadband penetration in the general popu-lation, having registered an almost double growth rate compared to the European one, reached 32.8% exceeding the European average for the first time. Local-Loop Unbundling (LLU) lines reached 2.09 million. At the same time, 7.5% of the total broadband lines were VDSL lines.
On the contrary and as far as mobile broadband penetration is concerned, Greece had a 49.8% penetration rate and was ranked among the low-est EU member states. However, there is signifi-cant room for improvement, taking into consid-eration both the double-digit increase (10 points)in the 4G population coverage percentage and the doubling of the traffic share via 4G networks (from 14% to 32.6%).
Bundled offersIn 2016, the sales of bundled offers increased further to 3.6 million, 61% of which correspond-ed to a double play package, 35% to a triple play one and 4% to quad play services. Fixed tele-phony with fixed broadband Internet remained the most popular bundled offer (approximately 2.1 million) followed by the triple play bundled offers of fixed telephony-Internet-Pay TV and fixed telephony-Internet-mobile telephony (both roughly at 630 thousand). Nowadays, three out of four subscribers use to buy fixed telephony as part of a bundled offer. Pay TV becomes increas-ingly important, as the television subscriptions exceeded one million, 79% of which were sold at the end of 2016 as part of a bundled offer.
Price ObservatoryAccording to the Price Observatory data reg-istered by the telecommunications operators, the majority of the products pertained to mobile communications (~62%). COSMOTE maintained a balance between basic tariff plans and add-ons(~42-43%), VODAFONE was based primarily on its basic tariff plans (72%) contrary to WIND that seemed to favor mainly its add-ons (46%). COSMOTE and WIND’s tariff plans targeted mainly the residential customers (>80%), while over half of VODAFONE’s tariff plans (55%) were business-oriented. The majority of the post-paid mobile plans (~53%) consisted of a monthly rent-al up to 40 euros (on average about 26 euros) and a call allowance of 1000 minutes (on average 375 minutes).
(b) Postal ServicesDespite the competitive conditions and the con-tinuous fall of letter mail volume, the global po-stal market continued to develop in 2016, mainly thanks to B2C e-commerce growth. The postal
MARKET REVIEW 2016
8
companies that increased the volume of their parcels and express shipments, concentrated on improving the operational efficiency of their delivery networks and focused on developing in-novative solutions for the e-commerce consum-ers. The fast growing cross-border e-commerce market, along with the domestic e-commerce market, remains the main growth factor of the postal market.In 2016, the Greek postal market showed signs of recovery, as regards revenue, while the volume of handled postal items continued to drop. Spe-cifically, revenue increased by 1% year-on-year, reaching 547.3 million euros, derived from the handling of 376.3 million of items, 4.5% less than previous year. The Universal Service Provider’s (USP) revenue share fell to 38% in 2016 from 42% in 2015, while the courier services operators’ share were in-creased to 59%. Although letter mail continued to hold the largest market share, in terms of both volume (89%) and revenue (56%), the share of parcels-small packages increased in 2016, mainly due to e-commerce growth and the e-substitution of letter mail.In 2016, apart from the USP, eleven companies with Individual License operated in the Univer-sal Service Area (USA), handling 10% of the USA postal items. In 2016, 76 new companies entered the courier services sector, thus increasing the total number of companies under General Au-thorization to 509. The postal companies in Greece, including the USP, are now turning to-wards customer-centric technology-based strat-egies and are developing innovative products and services, in an effort to aquire a larger market share.

9
MARKET REVIEW 2016
10
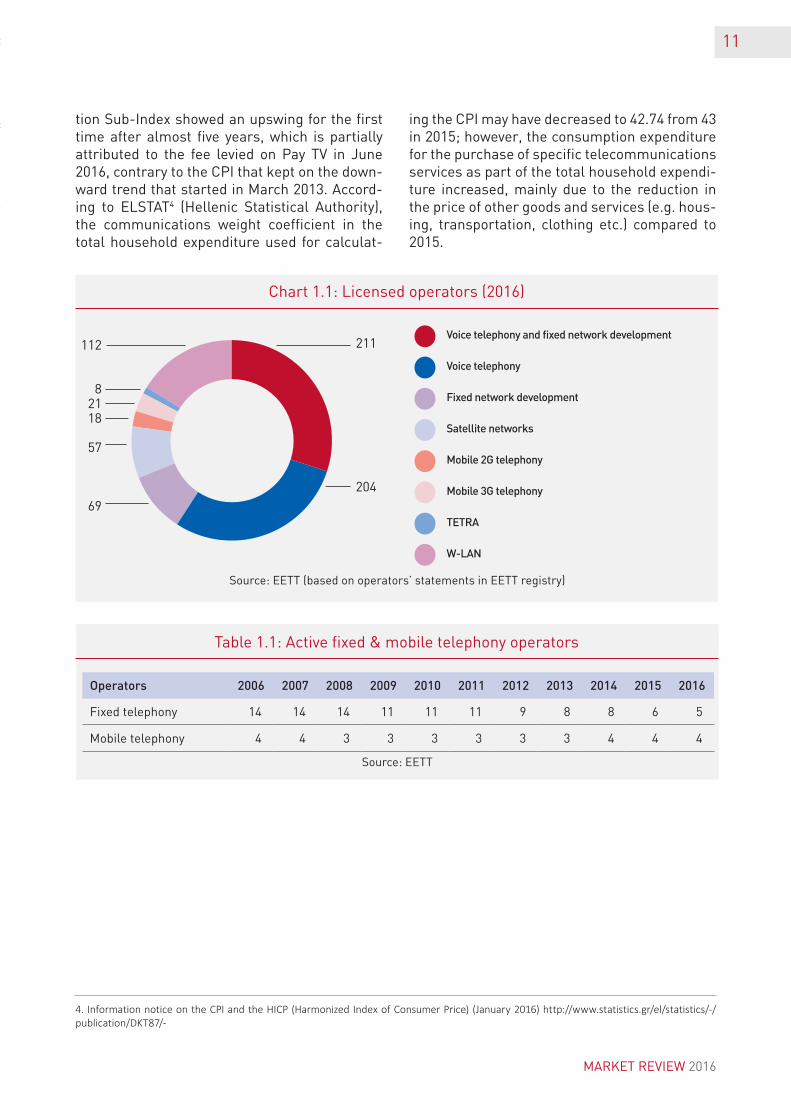
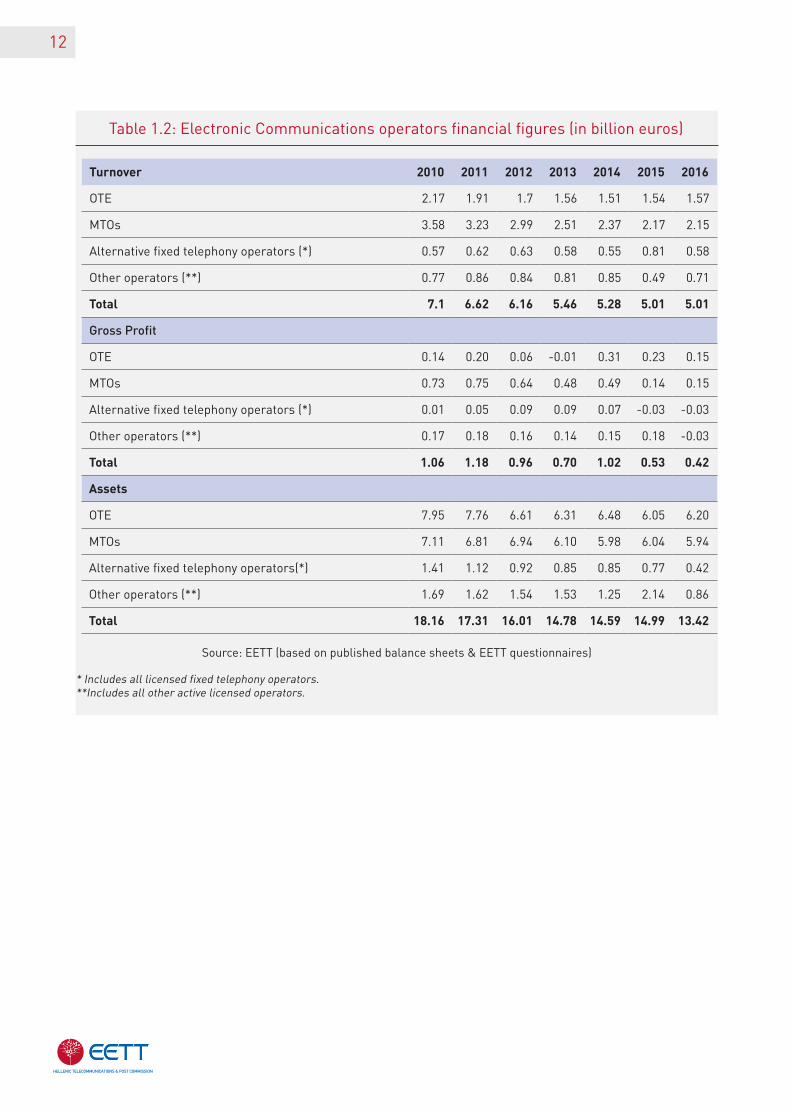
1.1. The Greek Electronic Communi-cations marketIn 2016, the number of licensed providers in the main Electronic Communications market sec-tors increased marginally to 700 against 691 in 2015 (Chart 1.1) the majority of which (69%) ren-dered services in the fields of voice telephony and fixed network development. As of the sec-ond quarter of 2016, there have been six1 mobile and fixed telephony operators in Greece (out of which, five were engaged in fixed telephony and four in mobile telephony) (Table 1.1).The key financial figures of the sector (turno-ver2, gross profit and assets) demonstrated significant changes since the gross profit and assets decreased by 22% and 10% respectively, due to the negative performance of the alterna-tive fixed telephony operators as well as of the
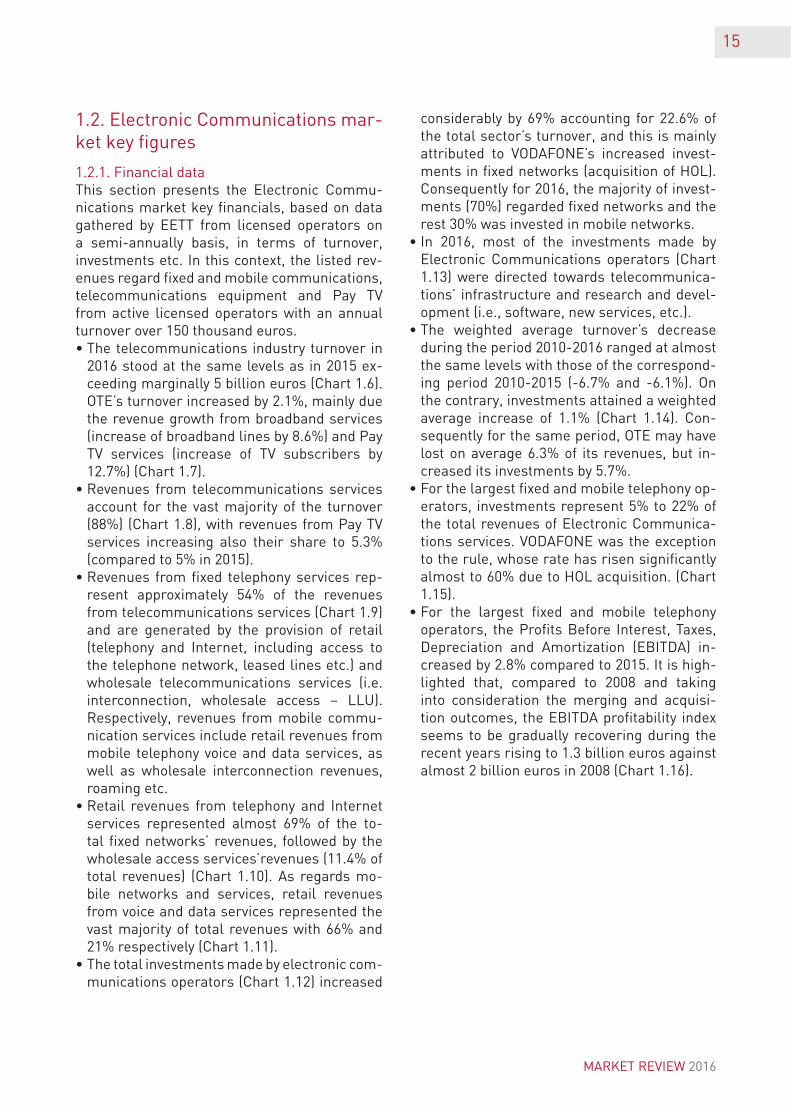
other operators, while turnover increased by 1% (Table 1.2). The contribution of the sector’s turnover in Greece’s Gross Domestic Product (GDP)3 stood at 2.8% in 2016, approximately at the same level as in 2015 (Chart 1.2). It should be mentioned that for the 2006-2016 period, the weighted average GDP reduction was -1.9%, which by itself demonstrates the impact the economic crisis had on the sector.The number of employees in the Electronic Com-munications stood at 16.8 thousand decreased by 3.4% compared to 2015 (approximately 17.4 thousand), mainly due to the reduction of em-ployees in the fixed telephony operators (Chart 1.3). Lastly, the general cost trend for Electronic Communications services is reflected in the Consumer Price Index (CPI) over time, as pre-sented in Charts 1.4 and 1.5. The Communica-
ELECTRONICCOMMUNICATIONS
1. As of 2009 (following the acquisition of TELLAS), WIND is operating both in fixed and mobile telephony and therefore, the company is counted in both categories. The same is true for CYTA as of 2014, (since the latter is also operating as Virtual Mobile Network Operator (VMNO) as well as for VODAFONE following the acquisition of HOL (HELLAS ON LINE) on 01-04-2016. 2. It should be noted that the sector’s turnover has been calculated on the basis of the net revenues from Electronic Communications declared by active, licensed operators and not on the basis of their balance sheets that include revenues from other activities. 3. It should be noted that GDP-related data and components for the period 1995-2004 have been reviewed using 2010 as base year, according to Regulation EU 549/2013 (ESA 2010).
11
tion Sub-Index showed an upswing for the first time after almost five years, which is partially attributed to the fee levied on Pay TV in June 2016, contrary to the CPI that kept on the down-ward trend that started in March 2013. Accord-ing to ELSTAT4 (Hellenic Statistical Authority), the communications weight coefficient in the total household expenditure used for calculat-
ing the CPI may have decreased to 42.74 from 43 in 2015; however, the consumption expenditure for the purchase of specific telecommunications services as part of the total household expendi-ture increased, mainly due to the reduction in the price of other goods and services (e.g. hous-ing, transportation, clothing etc.) compared to 2015.
4. Information notice on the CPI and the HICP (Harmonized Index of Consumer Price) (January 2016) http://www.statistics.gr/el/statistics/-/publication/DKT87/-
Chart 1.1: Licensed operators (2016)
211
204
112
82118
57
69
Voice telephony and fixed network development
Voice telephony
Fixed network development
Satellite networks
Mobile 2G telephony
Mobile 3G telephony
TETRA
W-LAN
Source: EETT (based on operators’ statements in EETT registry)
Table 1.1: Active fixed & mobile telephony operators
Source: EETT
Operators 2006 2007 2008 2009 2010 2011 2012 2013 2014 2015 2016
Fixed telephony 14 14 14 11 11 11 9 8 8 6 5
Mobile telephony 4 4 3 3 3 3 3 3 4 4 4
MARKET REVIEW 2016
12
Table 1.2: Electronic Communications operators financial figures (in billion euros)
Source: EETT (based on published balance sheets & EETT questionnaires)
Turnover 2010 2011 2012 2013 2014 2015 2016
OTE 2.17 1.91 1.7 1.56 1.51 1.54 1.57
MTOs 3.58 3.23 2.99 2.51 2.37 2.17 2.15
Alternative fixed telephony operators (*) 0.57 0.62 0.63 0.58 0.55 0.81 0.58
Other operators (**) 0.77 0.86 0.84 0.81 0.85 0.49 0.71
Total 7.1 6.62 6.16 5.46 5.28 5.01 5.01
Gross Profit
OTE 0.14 0.20 0.06 -0.01 0.31 0.23 0.15
MTOs 0.73 0.75 0.64 0.48 0.49 0.14 0.15
Alternative fixed telephony operators (*) 0.01 0.05 0.09 0.09 0.07 -0.03 -0.03
Other operators (**) 0.17 0.18 0.16 0.14 0.15 0.18 -0.03
Total 1.06 1.18 0.96 0.70 1.02 0.53 0.42
Assets
OTE 7.95 7.76 6.61 6.31 6.48 6.05 6.20
MTOs 7.11 6.81 6.94 6.10 5.98 6.04 5.94
Alternative fixed telephony operators(*) 1.41 1.12 0.92 0.85 0.85 0.77 0.42
Other operators (**) 1.69 1.62 1.54 1.53 1.25 2.14 0.86
Total 18.16 17.31 16.01 14.78 14.59 14.99 13.42
* Includes all licensed fixed telephony operators.**Includes all other active licensed operators.
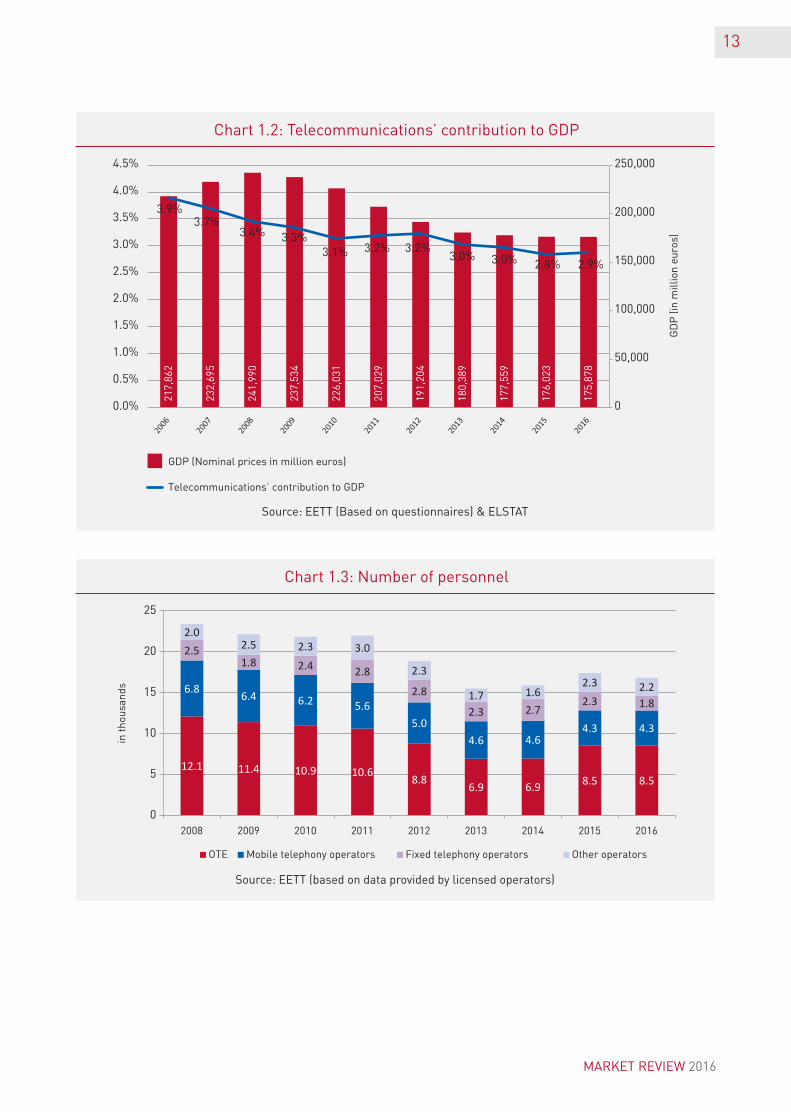
Chart 1.2: Telecommunications’ contribution to GDP
Chart 1.3: Number of personnel
13
Source: EETT (Based on questionnaires) & ELSTAT
Source: EETT (based on data provided by licensed operators)
217,
862
232,
695
241,
990
237,
534
226,
031
207,
029
191,
204
180,
389
177,
559
176,
023
175,
878
3.9%3.7%
3.4% 3.3%3.1% 3.2% 3.2%
3.0% 3.0% 2.8% 2.9%
0
50,000
100,000
150,000
200,000
250,000
0.0%
0.5%
1.0%
1.5%
2.0%
2.5%
3.0%
3.5%
4.0%
4.5%
GD
P (i
n m
illio
n eu
ros)
GDP (Nominal prices in million euros)
Telecommunications’ contribution to GDP
12.1 11.4 10.9 10.6 8.86.9 6.9 8.5 8.5
6.8 6.4 6.2 5.65.0
4.6 4.64.3 4.3
2.51.8 2.4 2.8
2.8
2.3 2.72.3 1.8
2.02.5 2.3 3.0
2.3
1.7 1.62.3 2.2
0
5
10
15
20
25
2008 2009 2010 2011 2012 2013 2014 2015 2016
in t
hous
ands
Mobile telephony operators Fixed telephony operators Other operators
MARKET REVIEW 2016
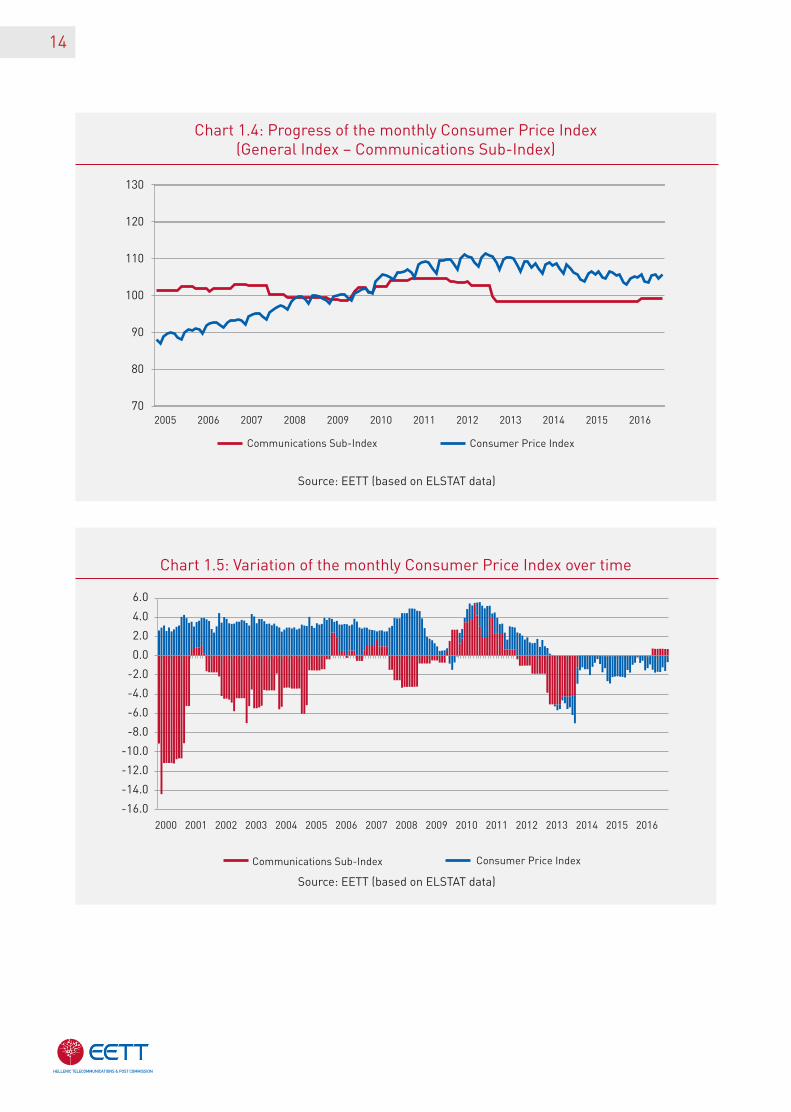
Chart 1.4: Progress of the monthly Consumer Price Index(General Index – Communications Sub-Index)
Chart 1.5: Variation of the monthly Consumer Price Index over time
14
Source: EETT (based on ELSTAT data)
Source: EETT (based on ELSTAT data)
70
80
90
100
110
120
130
2005 2006 2007 2008 2009 2010 2011 2012 2013 2014 2015 2016
Consumer Price Index
Consumer Price Index
-16.0
-14.0
-12.0
-10.0
-8.0
-6.0
-4.0
-2.0
0.0
2.0
4.0
6.0
2000 2001 2002 2003 2004 2005 2006 2007 2008 2009 2010 2011 2012 2013 2014 2015 2016
Communications Sub-Index
Communications Sub-Index
15
1.2. Electronic Communications mar-ket key figures
1.2.1. Financial dataThis section presents the Electronic Commu-nications market key financials, based on data gathered by EETT from licensed operators on a semi-annually basis, in terms of turnover, investments etc. In this context, the listed rev-enues regard fixed and mobile communications, telecommunications equipment and Pay TV from active licensed operators with an annual turnover over 150 thousand euros. • The telecommunications industry turnover in
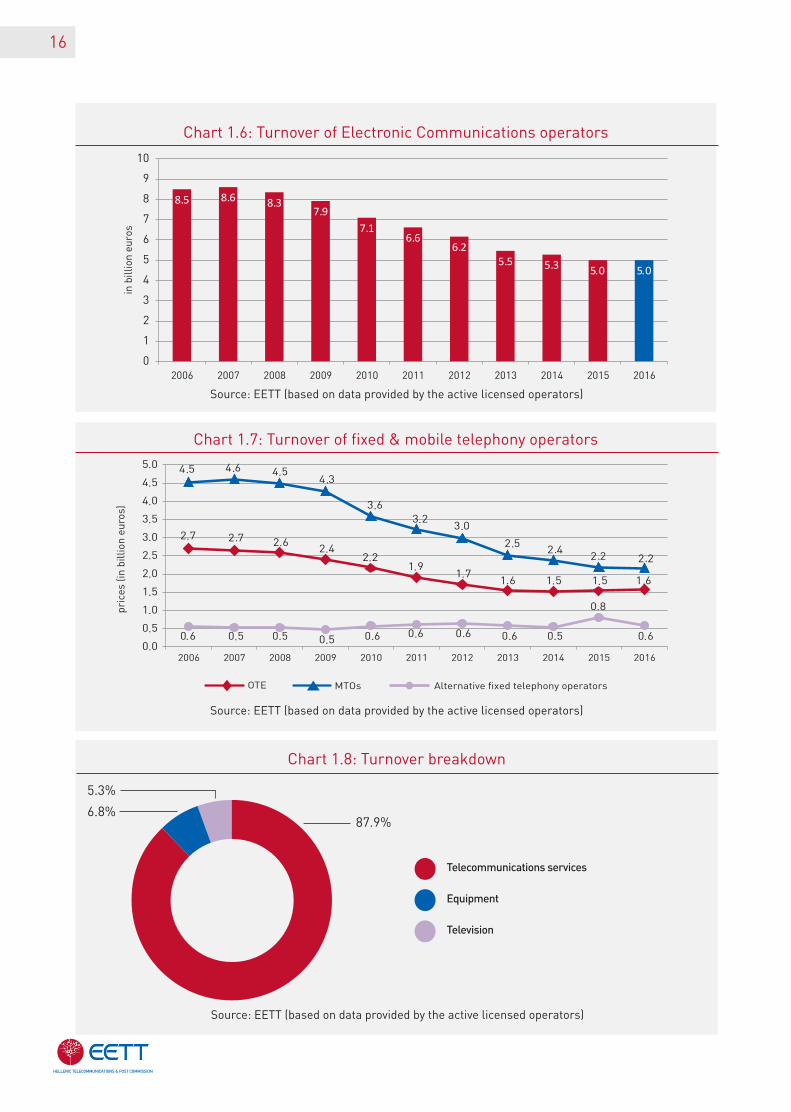
2016 stood at the same levels as in 2015 ex-ceeding marginally 5 billion euros (Chart 1.6). OTE’s turnover increased by 2.1%, mainly due the revenue growth from broadband services (increase of broadband lines by 8.6%) and Pay TV services (increase of TV subscribers by 12.7%) (Chart 1.7).
• Revenues from telecommunications services account for the vast majority of the turnover (88%) (Chart 1.8), with revenues from Pay TV services increasing also their share to 5.3% (compared to 5% in 2015).
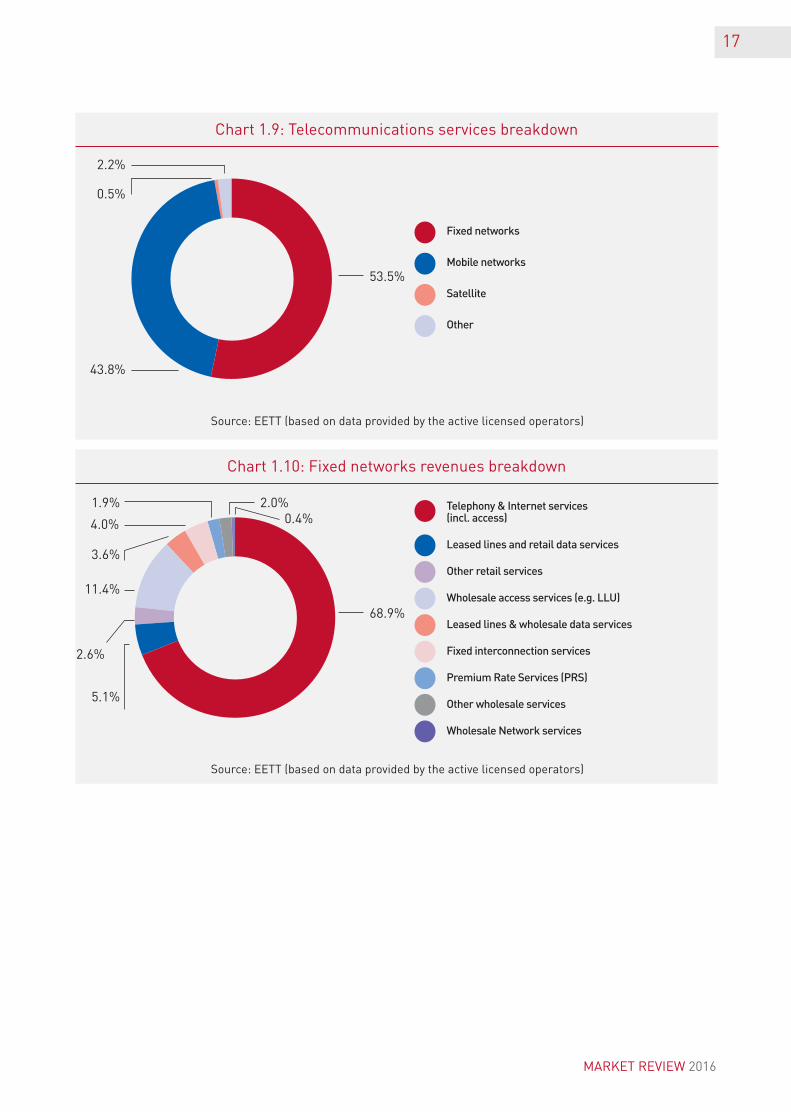
• Revenues from fixed telephony services rep-resent approximately 54% of the revenues from telecommunications services (Chart 1.9) and are generated by the provision of retail (telephony and Internet, including access to the telephone network, leased lines etc.) and wholesale telecommunications services (i.e. interconnection, wholesale access – LLU). Respectively, revenues from mobile commu-nication services include retail revenues from mobile telephony voice and data services, as well as wholesale interconnection revenues, roaming etc.
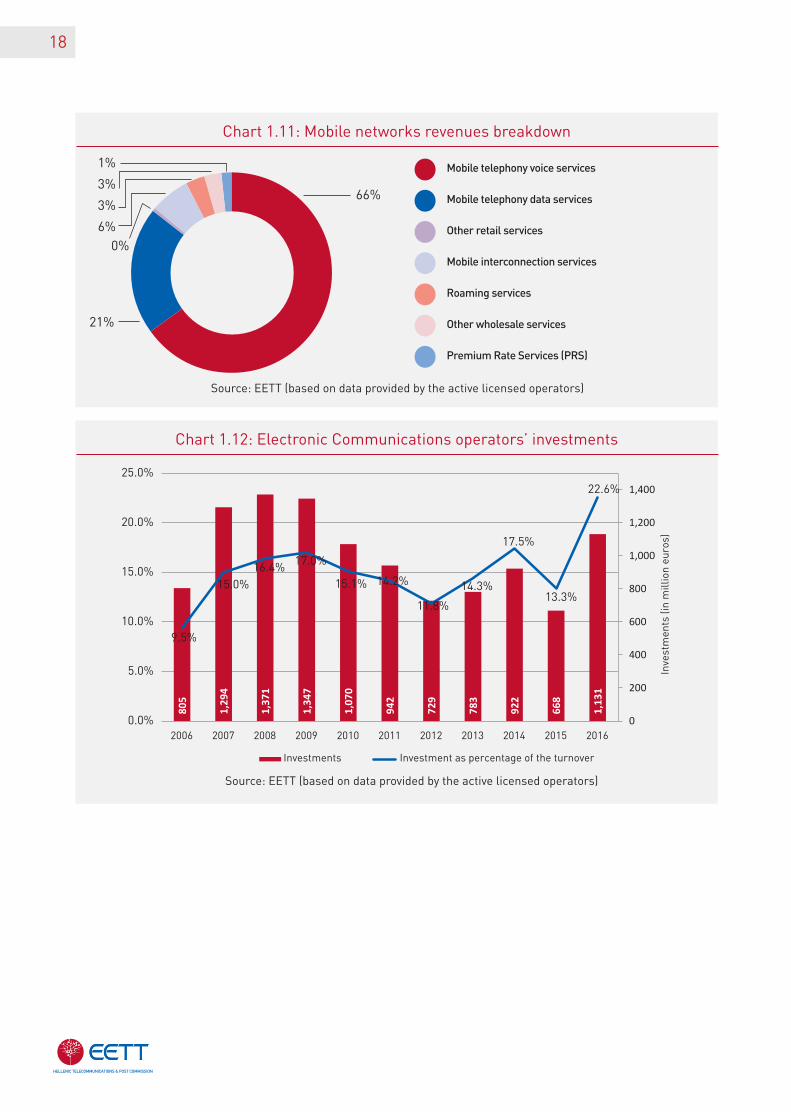
• Retail revenues from telephony and Internet services represented almost 69% of the to-tal fixed networks’ revenues, followed by the wholesale access services’revenues (11.4% of total revenues) (Chart 1.10). As regards mo-bile networks and services, retail revenues from voice and data services represented the vast majority of total revenues with 66% and 21% respectively (Chart 1.11).
• The total investments made by electronic com-munications operators (Chart 1.12) increased
considerably by 69% accounting for 22.6% of the total sector’s turnover, and this is mainly attributed to VODAFONE’s increased invest-ments in fixed networks (acquisition of HOL). Consequently for 2016, the majority of invest-ments (70%) regarded fixed networks and the rest 30% was invested in mobile networks.
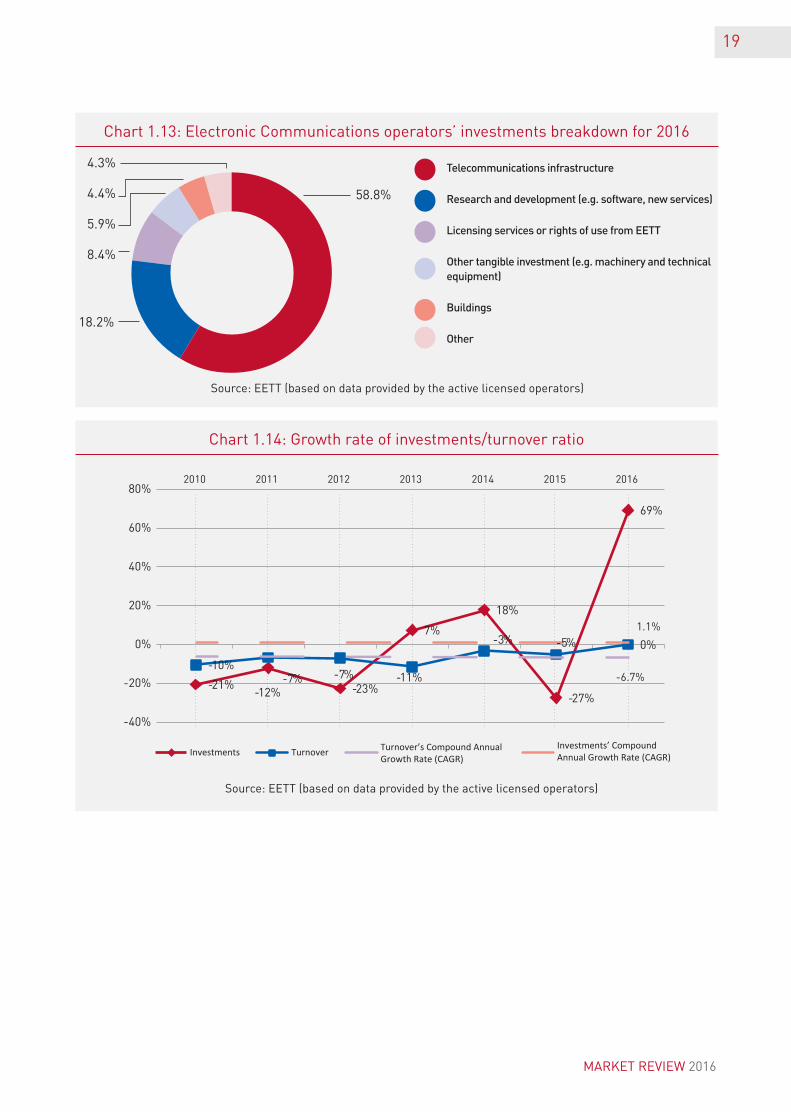
• In 2016, most of the investments made by Electronic Communications operators (Chart 1.13) were directed towards telecommunica-tions’ infrastructure and research and devel-opment (i.e., software, new services, etc.).
• The weighted average turnover’s decrease during the period 2010-2016 ranged at almost the same levels with those of the correspond-ing period 2010-2015 (-6.7% and -6.1%). On the contrary, investments attained a weighted average increase of 1.1% (Chart 1.14). Con-sequently for the same period, OTE may have lost on average 6.3% of its revenues, but in-creased its investments by 5.7%.
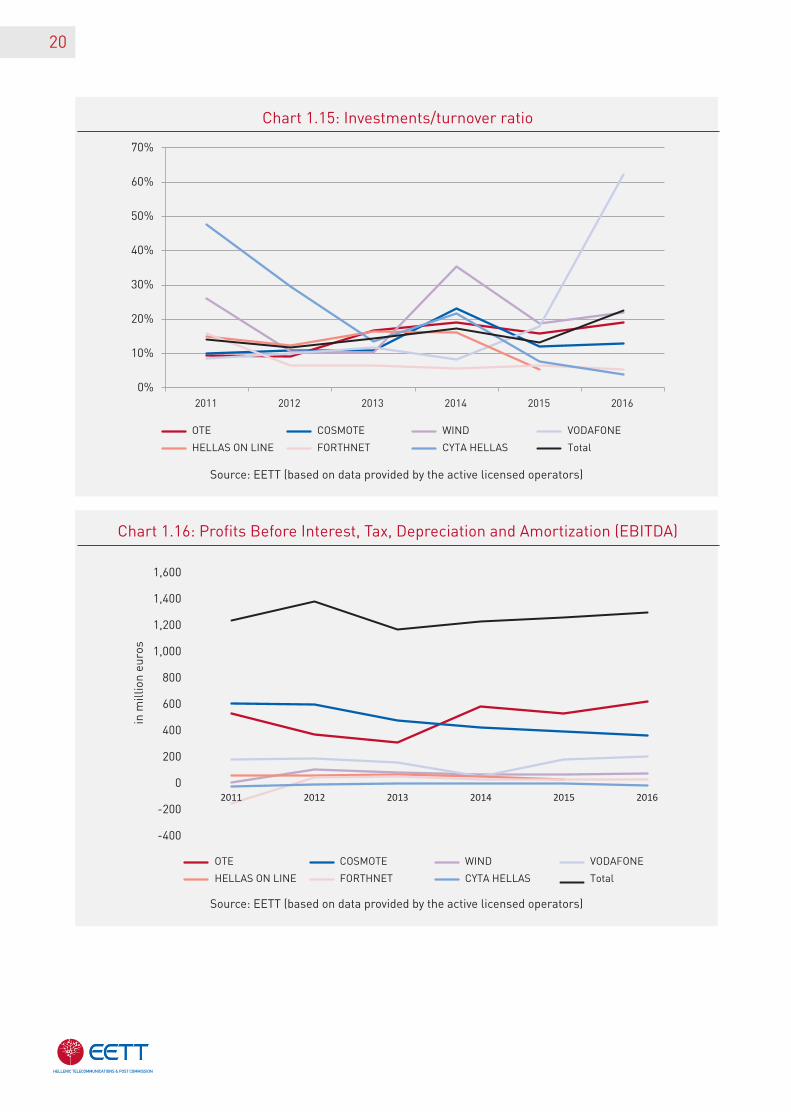
• For the largest fixed and mobile telephony op-erators, investments represent 5% to 22% of the total revenues of Electronic Communica-tions services. VODAFONE was the exception to the rule, whose rate has risen significantly almost to 60% due to HOL acquisition. (Chart 1.15).
• For the largest fixed and mobile telephony operators, the Profits Before Interest, Taxes, Depreciation and Amortization (EBITDA) in-creased by 2.8% compared to 2015. It is high-lighted that, compared to 2008 and taking into consideration the merging and acquisi-tion outcomes, the EBITDA profitability index seems to be gradually recovering during the recent years rising to 1.3 billion euros against almost 2 billion euros in 2008 (Chart 1.16).
MARKET REVIEW 2016
16
Chart 1.6: Turnover of Electronic Communications operators
Chart 1.7: Turnover of fixed & mobile telephony operators
Source: EETT (based on data provided by the active licensed operators)
Source: EETT (based on data provided by the active licensed operators)
Chart 1.8: Turnover breakdown
87.9%
5.3%
6.8%
Telecommunications services
Equipment
Television
Source: EETT (based on data provided by the active licensed operators)
8.5 8.6 8.37.9
7.16.6
6.25.5 5.3
0
1
2
3
4
5
6
7
8
9
10
2006 2007 2008 2009 2010 2011 2012 2013 2014 2015 2016
in b
illio
n eu
ros
MTOs Alternative fixed telephony operators
pric
es (i
n bi
llio
n eu
ros)
17
Chart 1.9: Telecommunications services breakdown
Chart 1.10: Fixed networks revenues breakdown
53.5%
68.9%
2.6%
4.0%
2.0%0.4%
2.2%
0.5%
43.8%
1.9%
3.6%
11.4%
5.1%
Fixed networks
Mobile networks
Satellite
Other
Telephony & Internet services (incl. access)
Leased lines and retail data services
Other retail services
Wholesale access services (e.g. LLU)
Leased lines & wholesale data services
Fixed interconnection services
Premium Rate Services (PRS)
Other wholesale services
Wholesale Network services
Source: EETT (based on data provided by the active licensed operators)
Source: EETT (based on data provided by the active licensed operators)
MARKET REVIEW 2016
18
Chart 1.11: Mobile networks revenues breakdown
Chart 1.12: Electronic Communications operators’ investments
66%
1%
3%
3%
6%0%
21%
Mobile telephony voice services
Mobile telephony data services
Other retail services
Mobile interconnection services
Roaming services
Other wholesale services
Premium Rate Services (PRS)
Source: EETT (based on data provided by the active licensed operators)
Source: EETT (based on data provided by the active licensed operators)
805
1,29
4
1,37
1
1,34
7
1,07
0
942
729
783
922
668
1,13
1
9.5%
15.0%16.4% 17.0%
15.1% 14.2%
11.8%
14.3%
17.5%
13.3%
22.6%
0
200
400
600
800
1,000
1,200
1,400
0.0%
5.0%
10.0%
15.0%
20.0%
25.0%
2006 2007 2008 2009 2010 2011 2012 2013 2014 2015 2016
Inve
stm
ents
(in
mill
ion
euro
s)
Investments Investment as percentage of the turnover
19
Chart 1.13: Electronic Communications operators’ investments breakdown for 2016
Chart 1.14: Growth rate of investments/turnover ratio
58.8%
4.3%
4.4%
5.9%
8.4%
18.2%
Telecommunications infrastructure
Research and development (e.g. software, new services)
Licensing services or rights of use from EETT
Other tangible investment (e.g. machinery and technical equipment)
Buildings
Other
Source: EETT (based on data provided by the active licensed operators)
Source: EETT (based on data provided by the active licensed operators)
-21%-12% -23%
7%
18%
-27%
69%
-10%-7% -7% -11%
-3% -5% 0%
-40%
-20%
0%
20%
40%
60%
80%2010 2011 2012 2013 2014 2015 2016
Investments Turnover Turnover’s Compound AnnualGrowth Rate (CAGR)
Investments’ CompoundAnnual Growth Rate (CAGR)
MARKET REVIEW 2016
1.1%
-6.7%
20
Chart 1.15: Investments/turnover ratio
Chart 1.16: Profits Before Interest, Tax, Depreciation and Amortization (EBITDA)
Source: EETT (based on data provided by the active licensed operators)
Source: EETT (based on data provided by the active licensed operators)
0%
10%
20%
30%
40%
50%
60%
70%
2011 2012 2013 2014 2015 2016
OTE COSMOTE WIND VODAFONE
HELLAS ON LINE FORTHNET CYTA HELLAS Total
OTE COSMOTE WIND VODAFONE
HELLAS ON LINE FORTHNET CYTA HELLAS Total
-400
-200
0
200
400
600
800
1,000
1,200
1,400
1,600
2011 2012 2013 2014 2015 2016
in m
illio
n eu
ros
21
Chart 1.17: Progress of telephone lines
Source: EETT (based on data provided by the active licensed operators)
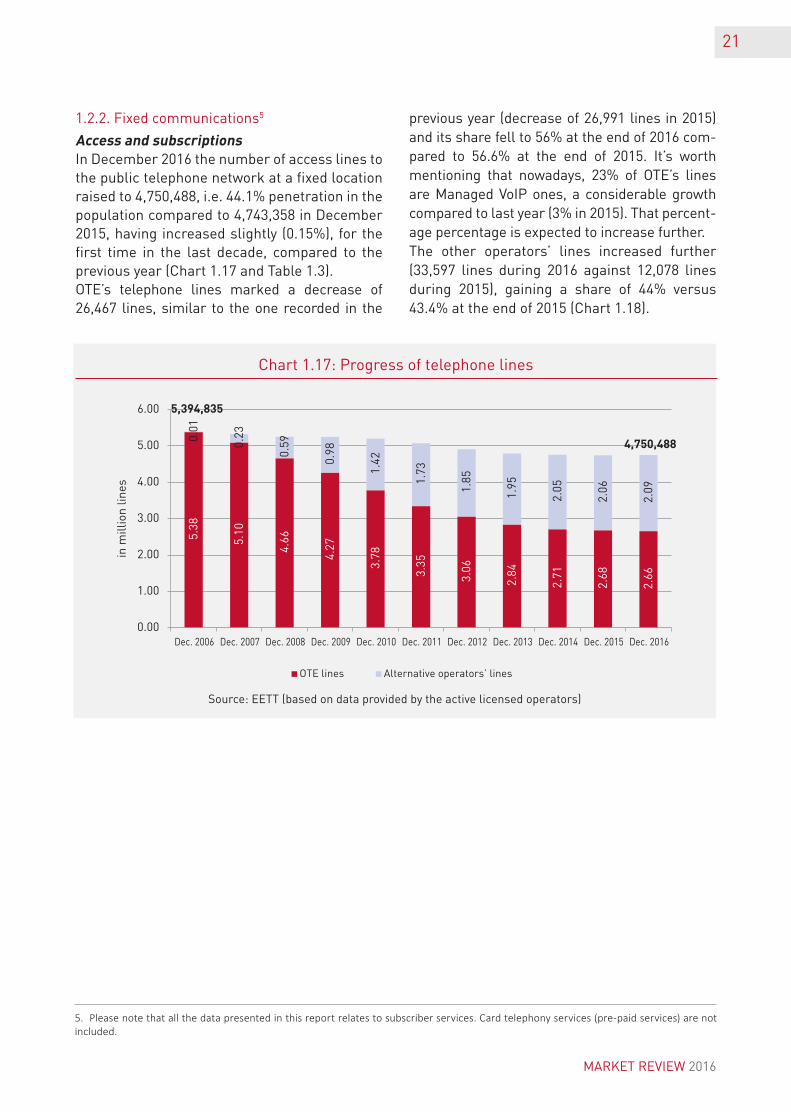
1.2.2. Fixed communications5
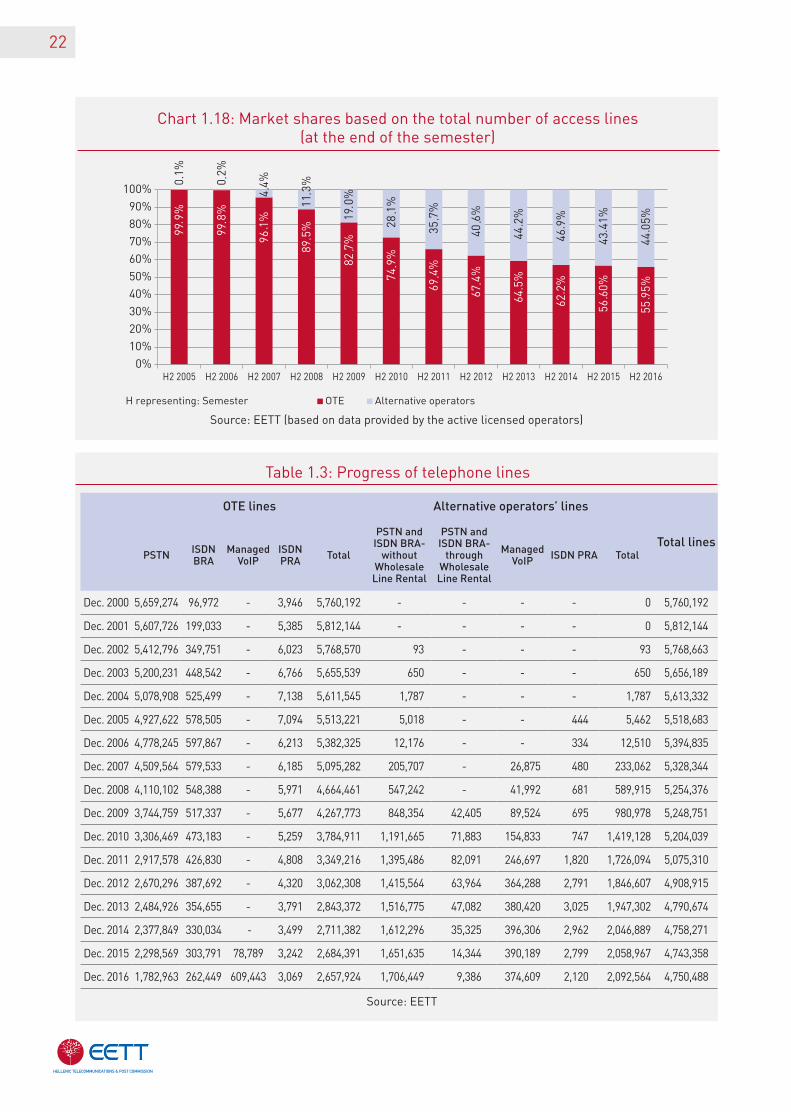
AccessandsubscriptionsIn December 2016 the number of access lines to the public telephone network at a fixed location raised to 4,750,488, i.e. 44.1% penetration in the population compared to 4,743,358 in December 2015, having increased slightly (0.15%), for the first time in the last decade, compared to the previous year (Chart 1.17 and Table 1.3). OTE’s telephone lines marked a decrease of 26,467 lines, similar to the one recorded in the
previous year (decrease of 26,991 lines in 2015) and its share fell to 56% at the end of 2016 com-pared to 56.6% at the end of 2015. It’s worth mentioning that nowadays, 23% of OTE’s lines are Managed VoIP ones, a considerable growth compared to last year (3% in 2015). That percent-age percentage is expected to increase further. The other operators’ lines increased further (33,597 lines during 2016 against 12,078 lines during 2015), gaining a share of 44% versus 43.4% at the end of 2015 (Chart 1.18).
5. Please note that all the data presented in this report relates to subscriber services. Card telephony services (pre-paid services) are not included.
5.38
5.10
4.66
4.27
3.78
3.35
3.06
2.84
2.71
2.68
2.66
0.01
0.23
0.59
0.98
1.42
1.73
1.85
1.95
2.05
2.06
2.09
0.00
1.00
2.00
3.00
4.00
5.00
6.00
Dec. 2006 Dec. 2007 Dec. 2008 Dec. 2009 Dec. 2010 Dec. 2011 Dec. 2012 Dec. 2013 Dec. 2014 Dec. 2015 Dec. 2016
in m
illio
n lin
es
OTE lines Alternative operators’ lines
4,750,488
5,394,835
MARKET REVIEW 2016
22
Chart 1.18: Market shares based on the total number of access lines (at the end of the semester)
Table 1.3: Progress of telephone lines
Source: EETT (based on data provided by the active licensed operators)
Source: EETT
OTE lines Alternative operators’ lines
Total linesPSTN ISDN
BRAManaged
VoIPISDN PRA Total
PSTN and ISDN BRA-
without Wholesale Line Rental
PSTN and ISDN BRA-
through Wholesale Line Rental
Managed VoIP ISDN PRA Total
Dec. 2000 5,659,274 96,972 - 3,946 5,760,192 - - - - 0 5,760,192
Dec. 2001 5,607,726 199,033 - 5,385 5,812,144 - - - - 0 5,812,144
Dec. 2002 5,412,796 349,751 - 6,023 5,768,570 93 - - - 93 5,768,663
Dec. 2003 5,200,231 448,542 - 6,766 5,655,539 650 - - - 650 5,656,189
Dec. 2004 5,078,908 525,499 - 7,138 5,611,545 1,787 - - - 1,787 5,613,332
Dec. 2005 4,927,622 578,505 - 7,094 5,513,221 5,018 - - 444 5,462 5,518,683
Dec. 2006 4,778,245 597,867 - 6,213 5,382,325 12,176 - - 334 12,510 5,394,835
Dec. 2007 4,509,564 579,533 - 6,185 5,095,282 205,707 - 26,875 480 233,062 5,328,344
Dec. 2008 4,110,102 548,388 - 5,971 4,664,461 547,242 - 41,992 681 589,915 5,254,376
Dec. 2009 3,744,759 517,337 - 5,677 4,267,773 848,354 42,405 89,524 695 980,978 5,248,751
Dec. 2010 3,306,469 473,183 - 5,259 3,784,911 1,191,665 71,883 154,833 747 1,419,128 5,204,039
Dec. 2011 2,917,578 426,830 - 4,808 3,349,216 1,395,486 82,091 246,697 1,820 1,726,094 5,075,310
Dec. 2012 2,670,296 387,692 - 4,320 3,062,308 1,415,564 63,964 364,288 2,791 1,846,607 4,908,915
Dec. 2013 2,484,926 354,655 - 3,791 2,843,372 1,516,775 47,082 380,420 3,025 1,947,302 4,790,674
Dec. 2014 2,377,849 330,034 - 3,499 2,711,382 1,612,296 35,325 396,306 2,962 2,046,889 4,758,271
Dec. 2015 2,298,569 303,791 78,789 3,242 2,684,391 1,651,635 14,344 390,189 2,799 2,058,967 4,743,358
Dec. 2016 1,782,963 262,449 609,443 3,069 2,657,924 1,706,449 9,386 374,609 2,120 2,092,564 4,750,488
H representing: Semester Alternative operators
23
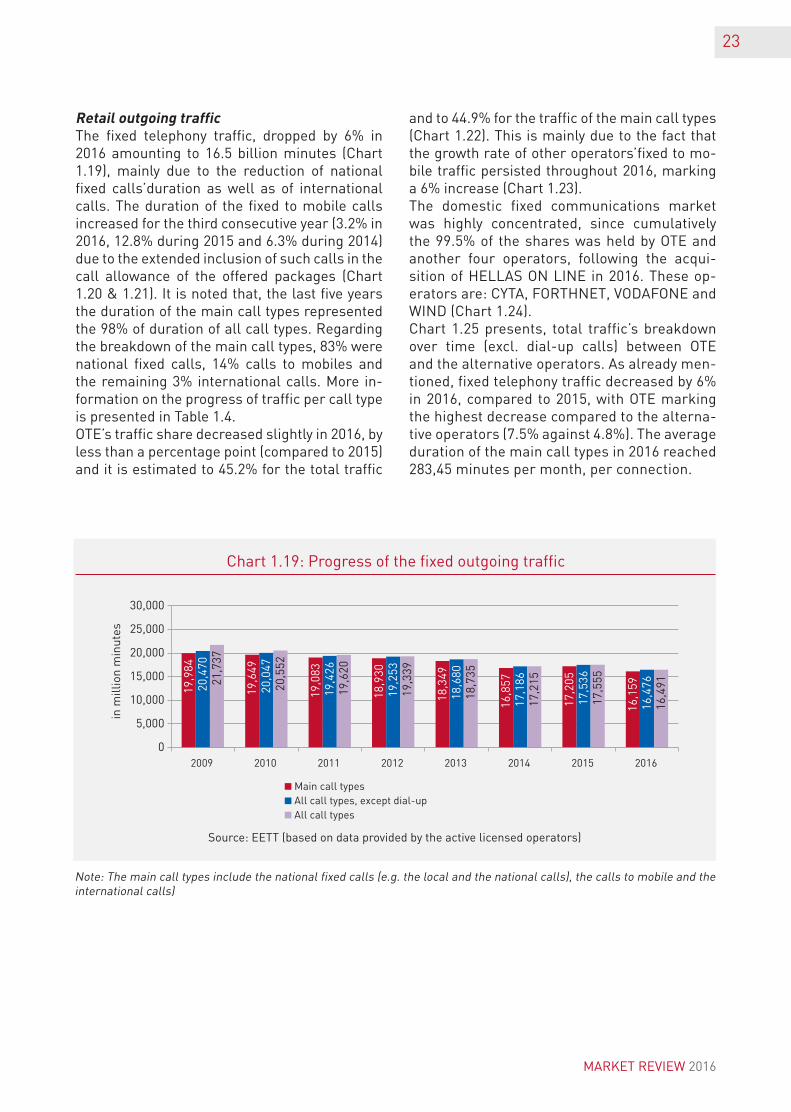
Chart 1.19: Progress of the fixed outgoing traffic
Source: EETT (based on data provided by the active licensed operators)
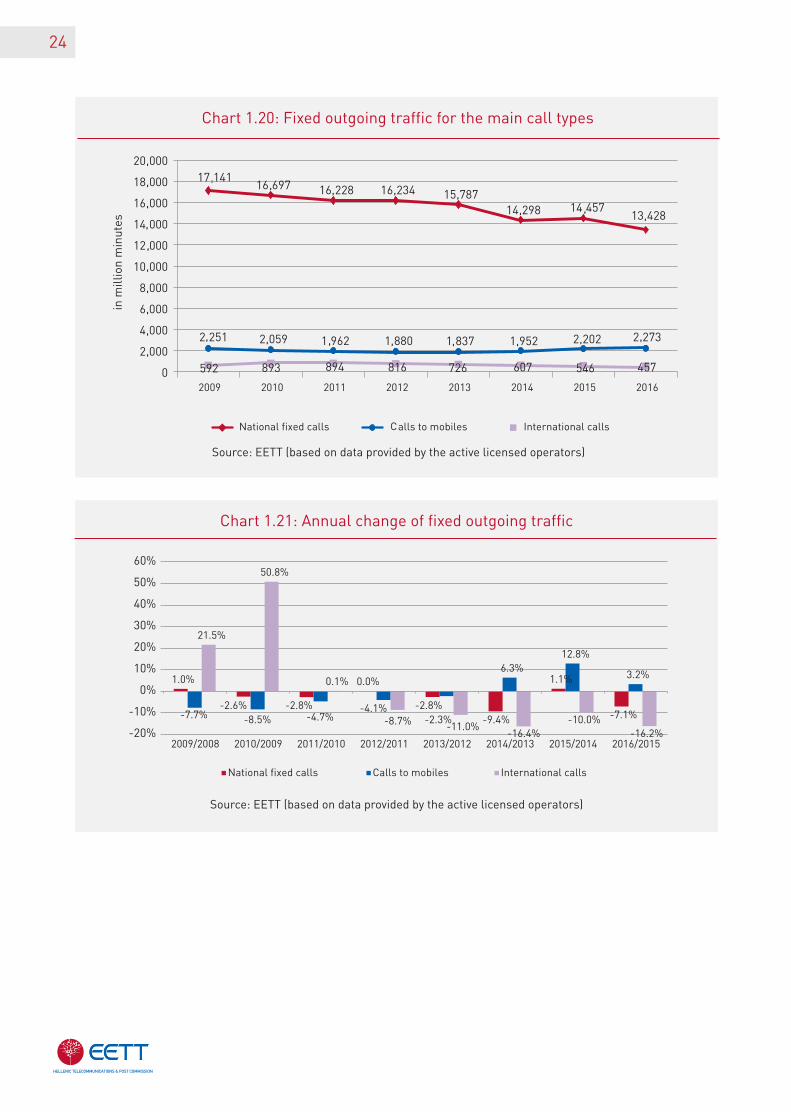
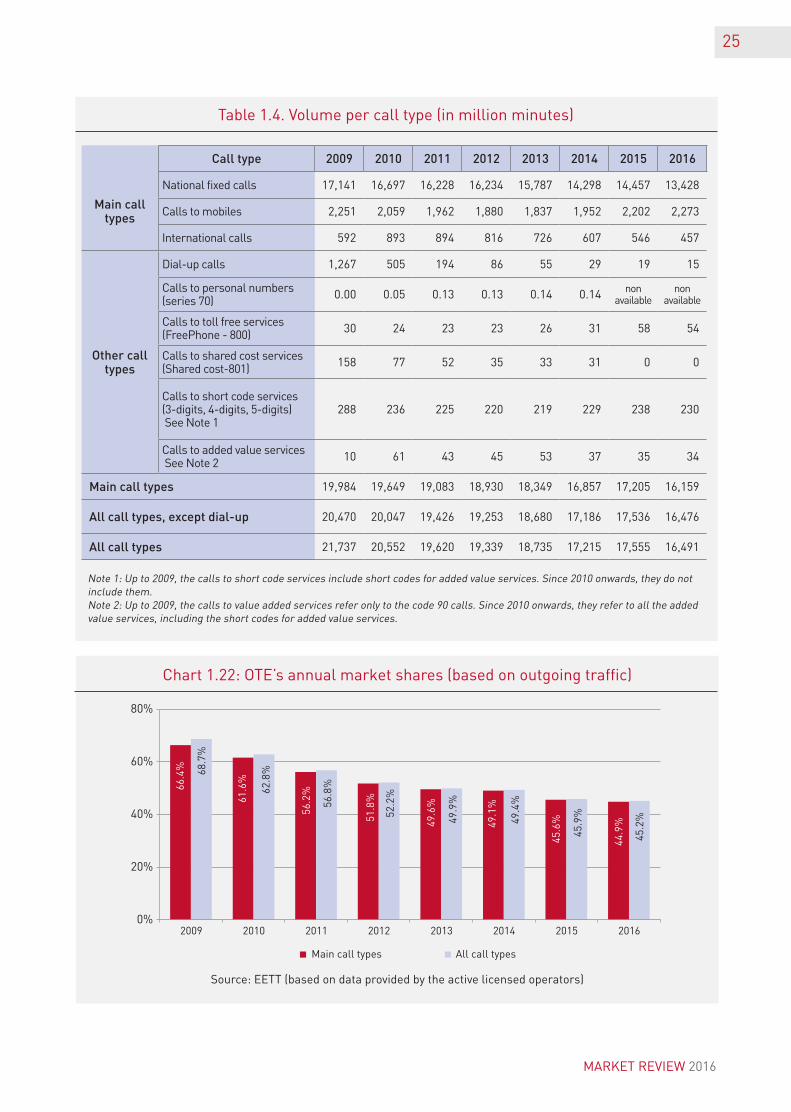
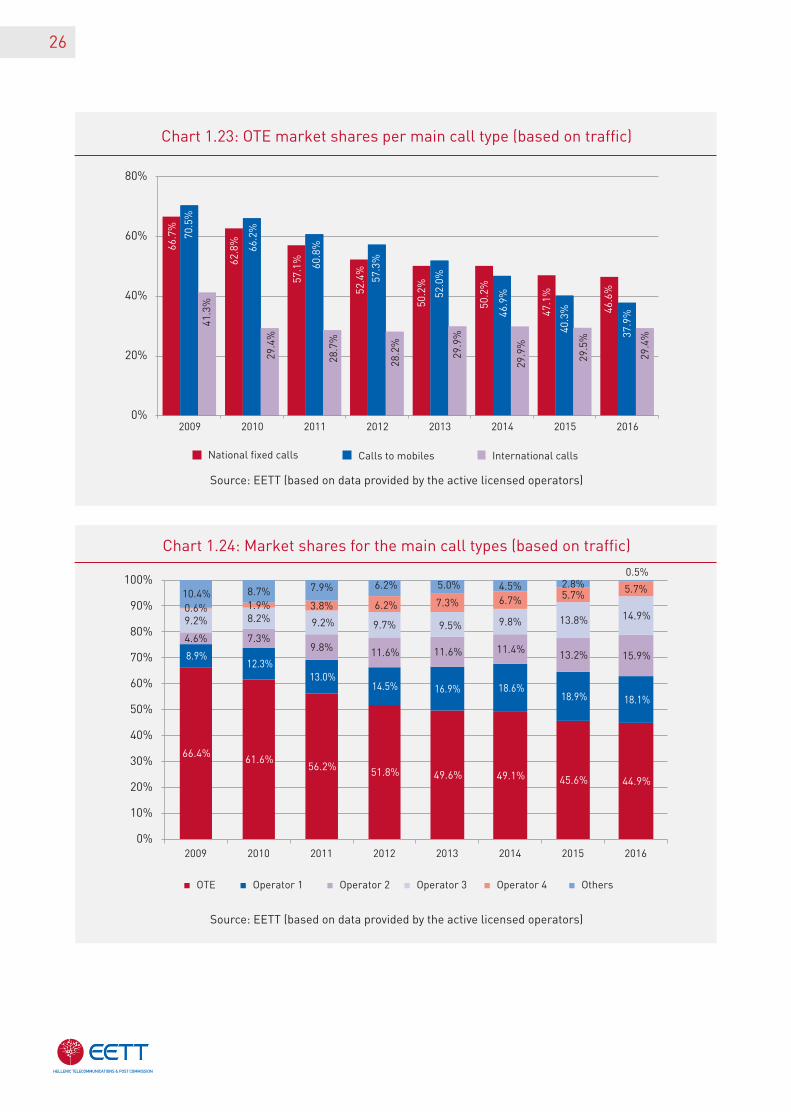
RetailoutgoingtrafficThe fixed telephony traffic, dropped by 6% in 2016 amounting to 16.5 billion minutes (Chart 1.19), mainly due to the reduction of national fixed calls’duration as well as of international calls. The duration of the fixed to mobile calls increased for the third consecutive year (3.2% in 2016, 12.8% during 2015 and 6.3% during 2014) due to the extended inclusion of such calls in the call allowance of the offered packages (Chart 1.20 & 1.21). It is noted that, the last five years the duration of the main call types represented the 98% of duration of all call types. Regarding the breakdown of the main call types, 83% were national fixed calls, 14% calls to mobiles and the remaining 3% international calls. More in-formation on the progress of traffic per call type is presented in Table 1.4.OTE’s traffic share decreased slightly in 2016, by less than a percentage point (compared to 2015) and it is estimated to 45.2% for the total traffic
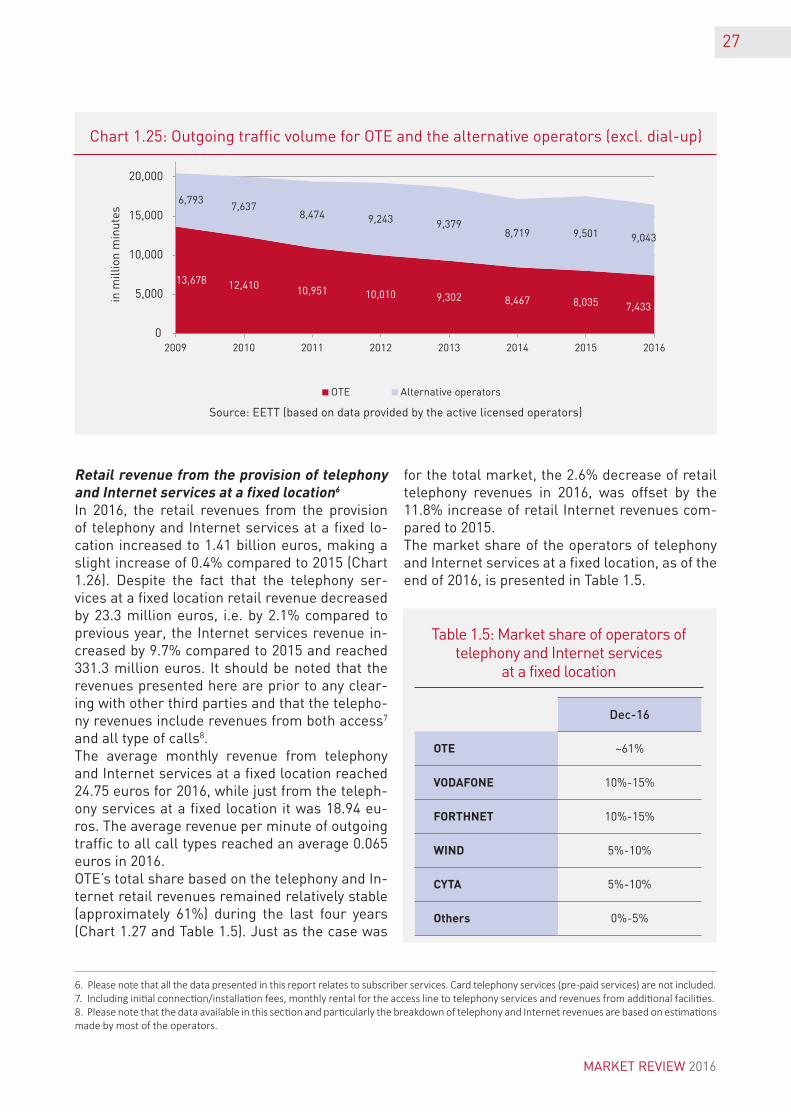
and to 44.9% for the traffic of the main call types (Chart 1.22). This is mainly due to the fact that the growth rate of other operators’fixed to mo-bile traffic persisted throughout 2016, marking a 6% increase (Chart 1.23).The domestic fixed communications market was highly concentrated, since cumulatively the 99.5% of the shares was held by OTE and ano ther four operators, following the acqui-sition of HELLAS ON LINE in 2016. These op-erators are: CYTA, FORTHNET, VODAFONE and WIND (Chart 1.24). Chart 1.25 presents, total traffic’s breakdown over time (excl. dial-up calls) between OTE and the alternative operators. As already men-tioned, fixed telephony traffic decreased by 6% in 2016, compared to 2015, with OTE marking the highest decrease compared to the alterna-tive operators (7.5% against 4.8%). The average duration of the main call types in 2016 reached 283,45 minutes per month, per connection.
Note: The main call types include the national fixed calls (e.g. the local and the national calls), the calls to mobile and the international calls)
19,9
84
19,6
49
19,0
83
18,9
30
18,3
49
16,8
57
17,2
05
16,1
5920,4
70
20,0
47
19,4
26
19,2
53
18,6
80
17,1
86
17,5
36
16,4
7621,7
37
20,5
52
19,6
20
19,3
39
18,7
35
17,2
15
17,5
55
16,4
91
0
5,000
10,000
15,000
20,000
25,000
30,000
2009 2010 2011 2012 2013 2014 2015 2016
Main call typesAll call types, except dial-upAll call types
in m
illio
n m
inut
es
MARKET REVIEW 2016
24
Chart 1.20: Fixed outgoing traffic for the main call types
Source: EETT (based on data provided by the active licensed operators)
Source: EETT (based on data provided by the active licensed operators)
Chart 1.21: Annual change of fixed outgoing traffic
National fixed calls Calls to mobiles International calls
in m
illio
n m
inut
es
25
Source: EETT (based on data provided by the active licensed operators)
Chart 1.22: OTE’s annual market shares (based on outgoing traffic)
Table 1.4. Volume per call type (in million minutes)
Call type 2009 2010 2011 2012 2013 2014 2015 2016
Main call types
National fixed calls 17,141 16,697 16,228 16,234 15,787 14,298 14,457 13,428
Calls to mobiles 2,251 2,059 1,962 1,880 1,837 1,952 2,202 2,273
International calls 592 893 894 816 726 607 546 457
Other call types
Dial-up calls 1,267 505 194 86 55 29 19 15
Calls to personal numbers (series 70) 0.00 0.05 0.13 0.13 0.14 0.14 non
availablenon
available
Calls to toll free services (FreePhone - 800) 30 24 23 23 26 31 58 54
Calls to shared cost services (Shared cost-801) 158 77 52 35 33 31 0 0
Calls to short code services (3-digits, 4-digits, 5-digits) See Note 1
288 236 225 220 219 229 238 230
Calls to added value services See Note 2 10 61 43 45 53 37 35 34
Main call types 19,984 19,649 19,083 18,930 18,349 16,857 17,205 16,159
All call types, except dial-up 20,470 20,047 19,426 19,253 18,680 17,186 17,536 16,476
All call types 21,737 20,552 19,620 19,339 18,735 17,215 17,555 16,491
Note 1: Up to 2009, the calls to short code services include short codes for added value services. Since 2010 onwards, they do not include them.Note 2: Up to 2009, the calls to value added services refer only to the code 90 calls. Since 2010 onwards, they refer to all the added value services, including the short codes for added value services.
66.4
%
61.6
%
56.2
%
51.8
%
49.6
%
49.1
%
45.6
%
44.9
%
68.7
%
62.8
%
56.8
%
52.2
%
49.9
%
49.4
%
45.9
%
45.2
%
0%
20%
40%
60%
80%
2009 2010 2011 2012 2013 2014 2015 2016
Main call types All call types
MARKET REVIEW 2016
Source: EETT (based on data provided by the active licensed operators)
International calls
Source: EETT (based on data provided by the active licensed operators)
Chart 1.23: OTE market shares per main call type (based on traffic)
Chart 1.24: Market shares for the main call types (based on traffic)
26
66.7
%
62.8
%
57.1
%
52.4
%
50.2
%
50.2
%
47.1
%
46.6
%
70.5
%
66.2
%
60.8
%
57.3
%
52.0
%
46.9
%
40.3
%
37.9
%
41.3
%
29.4
%
28.7
%
28.2
%
29.9
%
29.9
%
29.5
%
29.4
%
0%
20%
40%
60%
80%
2009 2010 2011 2012 2013 2014 2015 2016
National fixed calls
66.4% 61.6%56.2% 51.8% 49.6% 49.1% 45.6% 44.9%
8.9%12.3%
13.0%14.5% 16.9% 18.6%
18.9% 18.1%
4.6% 7.3%9.8% 11.6% 11.6% 11.4% 13.2% 15.9%
9.2% 8.2% 9.2% 9.7% 9.5% 9.8% 13.8% 14.9%0.6% 1.9% 3.8% 6.2% 7.3% 6.7% 5.7% 5.7%10.4% 8.7% 7.9% 6.2% 5.0% 4.5% 2.8%
0.5%
0%
10%
20%
30%
40%
50%
60%
70%
80%
90%
100%
2009 2010 2011 2012 2013 2014 2015 2016
Operator 1 Operator 2 Operator 3 Operator 4 Others
Source: EETT (based on data provided by the active licensed operators)
Chart 1.25: Outgoing traffic volume for OTE and the alternative operators (excl. dial-up)
27
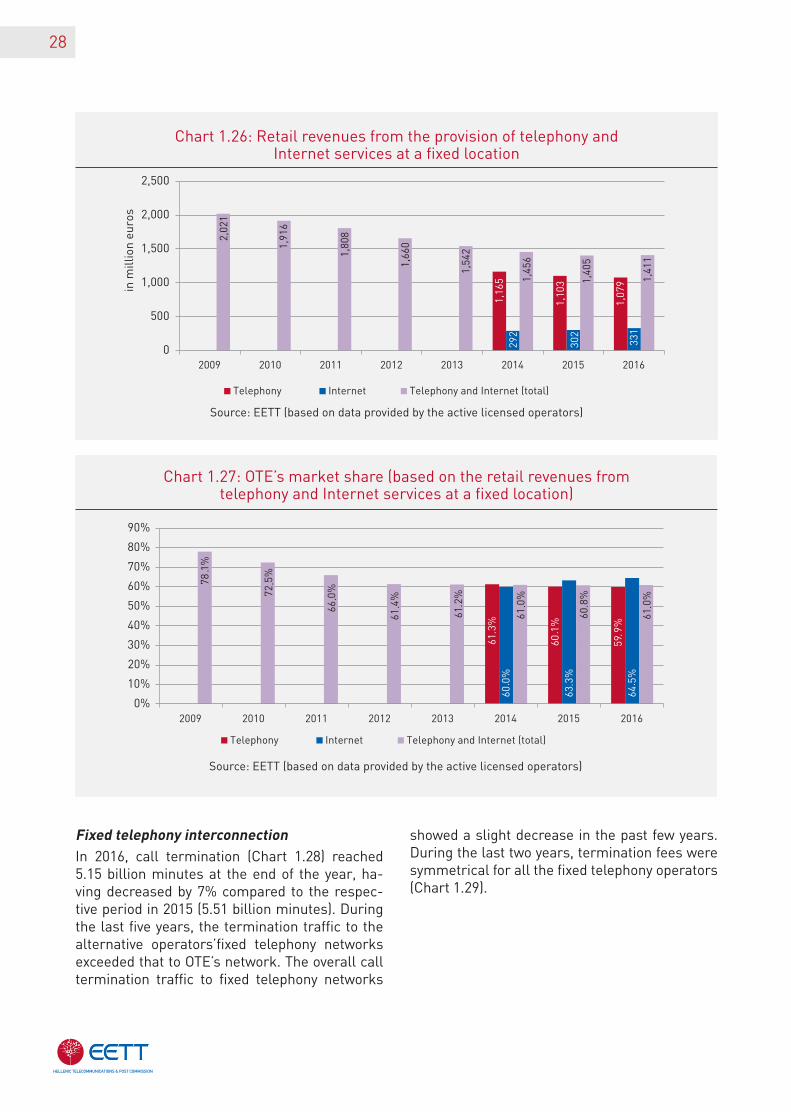
RetailrevenuefromtheprovisionoftelephonyandInternetservicesatafixedlocatioη6In 2016, the retail revenues from the provision of telephony and Internet services at a fixed lo-cation increased to 1.41 billion euros, making a slight increase of 0.4% compared to 2015 (Chart 1.26). Despite the fact that the telephony ser-vices at a fixed location retail revenue decreased by 23.3 million euros, i.e. by 2.1% compared to previous year, the Internet services revenue in-creased by 9.7% compared to 2015 and reached 331.3 million euros. It should be noted that the revenues presented here are prior to any clear-ing with other third parties and that the telepho-ny revenues include revenues from both access7
and all type of calls8. The average monthly revenue from telephony and Internet services at a fixed location reached 24.75 euros for 2016, while just from the teleph-ony services at a fixed location it was 18.94 eu-ros. The average revenue per minute of outgoing traffic to all call types reached an average 0.065 euros in 2016.OTE’s total share based on the telephony and In-ternet retail revenues remained relatively stable (approximately 61%) during the last four years (Chart 1.27 and Table 1.5). Just as the case was
for the total market, the 2.6% decrease of retail telephony revenues in 2016, was offset by the 11.8% increase of retail Internet revenues com-pared to 2015. The market share of the operators of telephony and Internet services at a fixed location, as of the end of 2016, is presented in Table 1.5.
6. Please note that all the data presented in this report relates to subscriber services. Card telephony services (pre-paid services) are not included. 7. Including initial connection/installation fees, monthly rental for the access line to telephony services and revenues from additional facilities.8. Please note that the data available in this section and particularly the breakdown of telephony and Internet revenues are based on estimations made by most of the operators.
Dec-16
OTE ~61%
VODAFONE 10%-15%
FORTHNET 10%-15%
WIND 5%-10%
CYTA 5%-10%
Others 0%-5%
Table 1.5: Market share of operators of telephony and Internet services
at a fixed location
13,678 12,410 10,951 10,010 9,302 8,467 8,035 7,433
6,7937,637
8,474 9,243 9,3798,719 9,501 9,043
0
5,000
10,000
15,000
20,000
2009 2010 2011 2012 2013 2014 2015 2016
in m
illio
n m
inut
es
Alternative operators
MARKET REVIEW 2016
28
Source: EETT (based on data provided by the active licensed operators)
Source: EETT (based on data provided by the active licensed operators)
Chart 1.26: Retail revenues from the provision of telephony and Internet services at a fixed location
Chart 1.27: OTE’s market share (based on the retail revenues from telephony and Internet services at a fixed location)
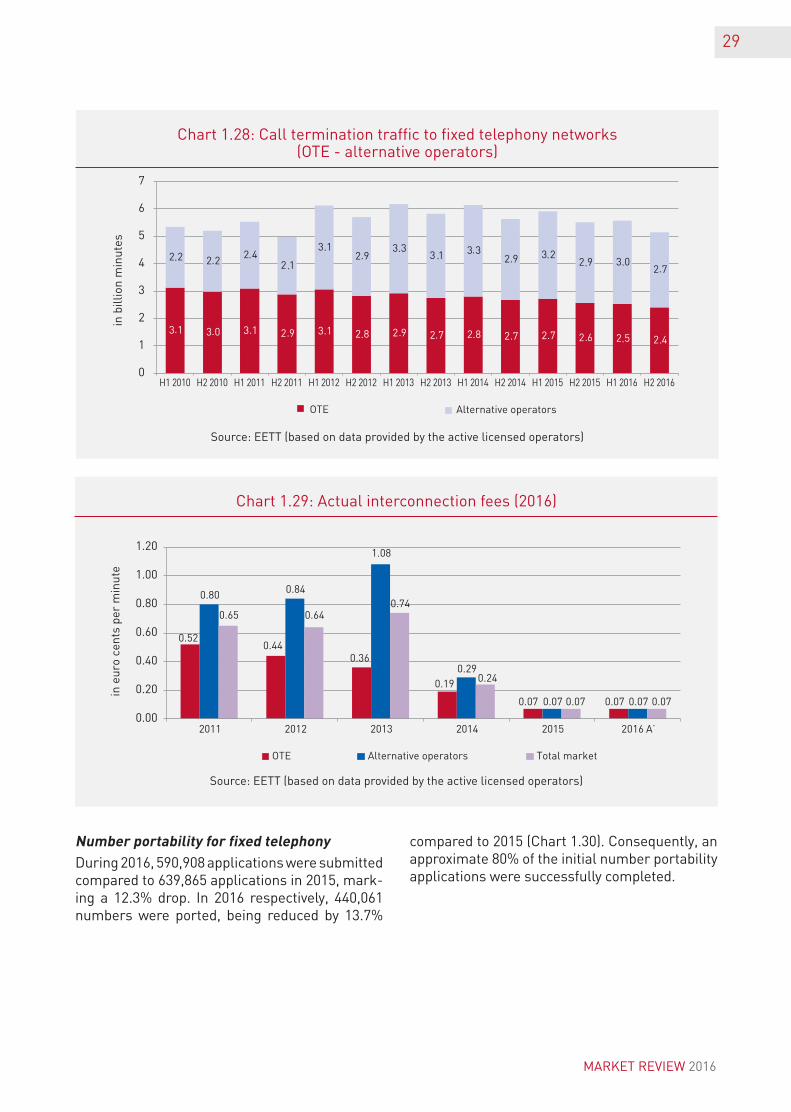
FixedtelephonyinterconnectionIn 2016, call termination (Chart 1.28) reached 5.15 billion minutes at the end of the year, ha-ving decreased by 7% compared to the respec-tive period in 2015 (5.51 billion minutes). During the last five years, the termination traffic to the alternative operators’fixed telephony networks exceeded that to OTE’s network. The overall call termination traffic to fixed telephony networks
showed a slight decrease in the past few years. During the last two years, termination fees were symmetrical for all the fixed telephony operators (Chart 1.29).
1,16
5
1,10
3
1,07
9
292
302
331
2,02
1
1,91
6
1,80
8
1,66
0
1,54
2
1,45
6
1,40
5
1,41
1
0
500
1,000
1,500
2,000
2,500
2009 2010 2011 2012 2013 2014 2015 2016
in m
illio
n eu
ros
Telephony Internet Telephony and Internet (total)
Telephony Internet Telephony and Internet (total)
29
Source: EETT (based on data provided by the active licensed operators)
Source: EETT (based on data provided by the active licensed operators)
Chart 1.29: Actual interconnection fees (2016)
Chart 1.28: Call termination traffic to fixed telephony networks(OTE - alternative operators)
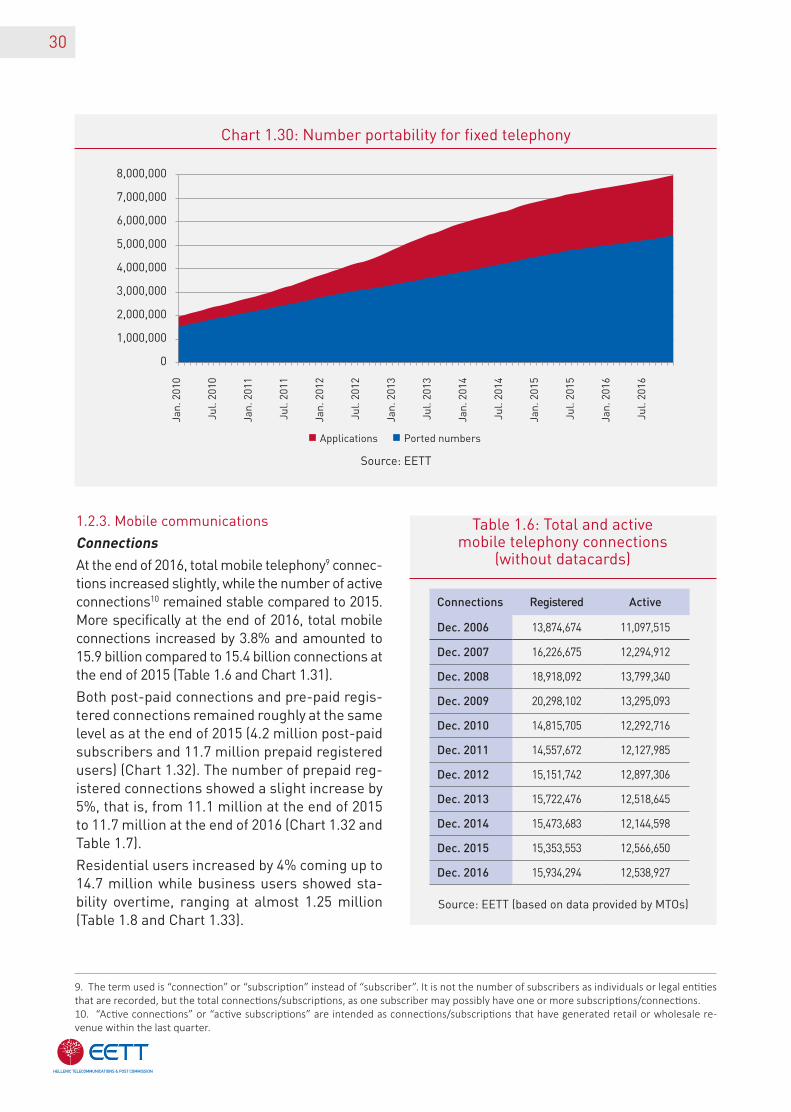
NumberportabilityforfixedtelephonyDuring 2016, 590,908 applications were submitted compared to 639,865 applications in 2015, mark-ing a 12.3% drop. In 2016 respectively, 440,061 numbers were ported, being reduced by 13.7%
compared to 2015 (Chart 1.30). Consequently, an approximate 80% of the initial number portability applications were successfully completed.
Alternative operators
in b
illio
n m
inut
es
0.520.44
0.36
0.19
0.07 0.07
0.80 0.84
1.08
0.29
0.07 0.07
0.65 0.640.74
0.24
0.07 0.07
0.00
0.20
0.40
0.60
0.80
1.00
1.20
2011 2012 2013 2014 2015
in e
uro
cent
s pe
r m
inut
e
Alternative operators Total market
MARKET REVIEW 2016
30
Source: EETT (based on data provided by MTOs)
1.2.3. Mobile communications
Connections
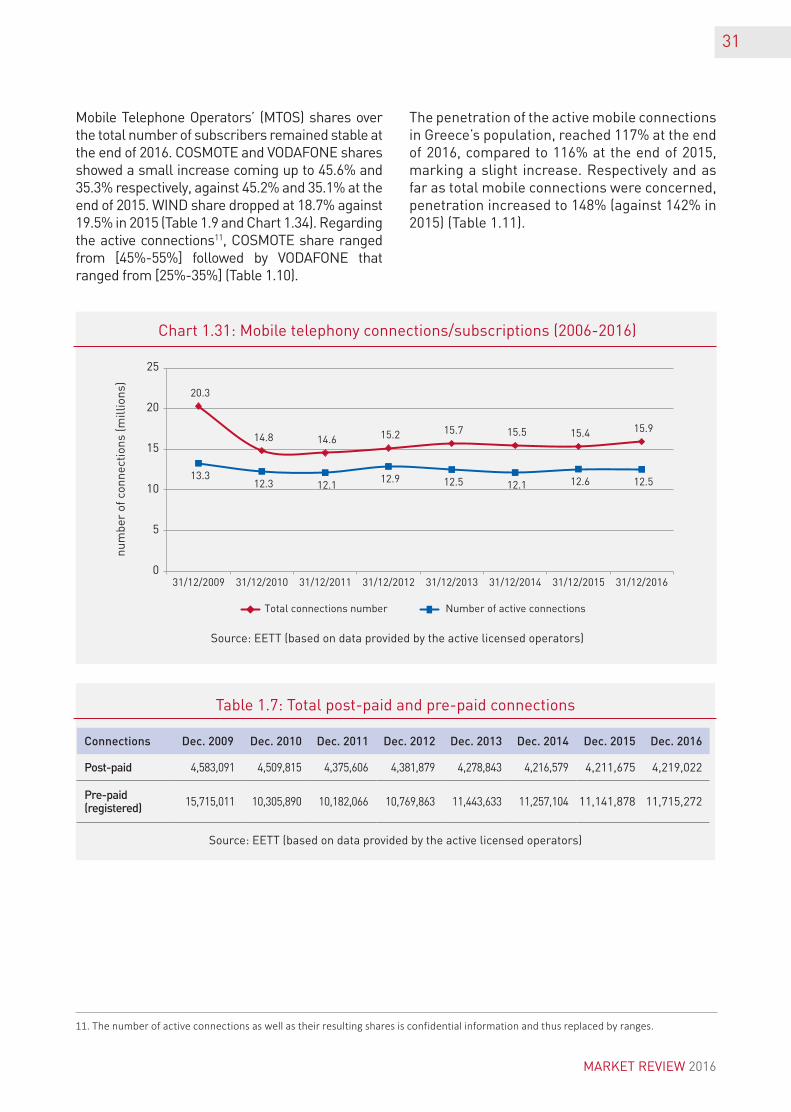
At the end of 2016, total mobile telephony9 connec-tions increased slightly, while the number of active connections10 remained stable compared to 2015. More specifically at the end of 2016, total mobile connections increased by 3.8% and amounted to 15.9 billion compared to 15.4 billion connections at the end of 2015 (Table 1.6 and Chart 1.31).
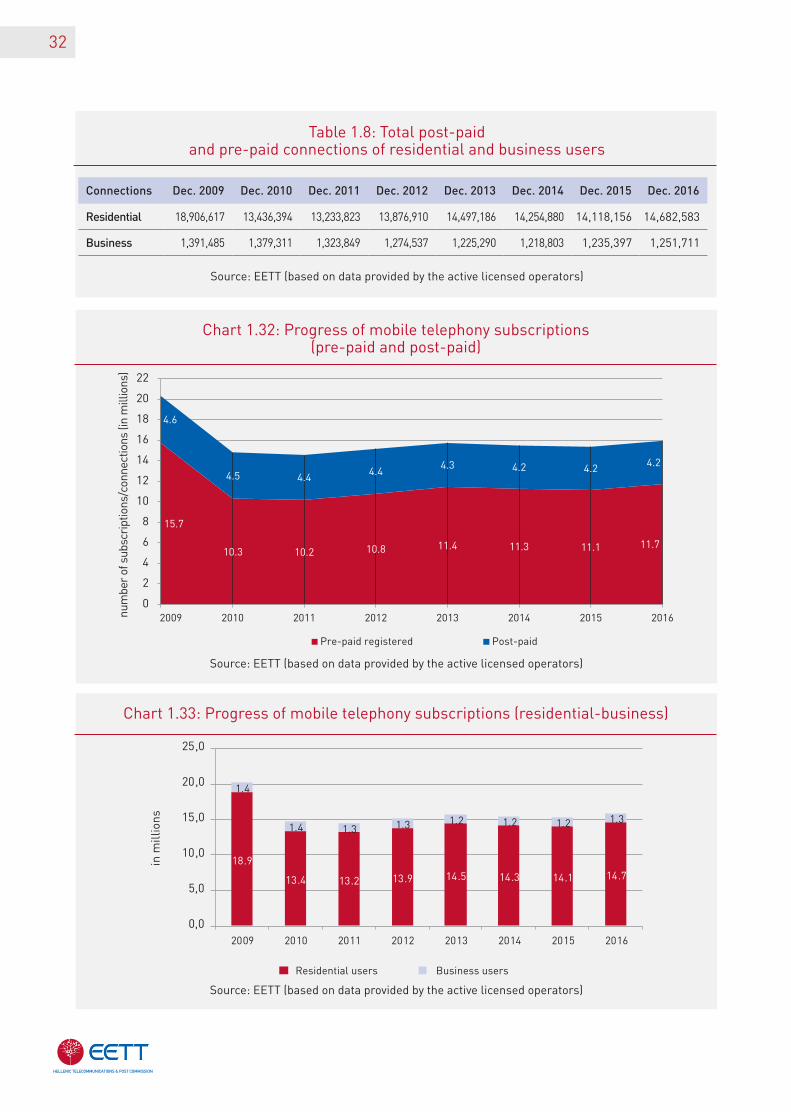
Both post-paid connections and pre-paid regis-tered connections remained roughly at the same level as at the end of 2015 (4.2 million post-paid subscribers and 11.7 million prepaid registered users) (Chart 1.32). The number of prepaid reg-istered connections showed a slight increase by 5%, that is, from 11.1 million at the end of 2015 to 11.7 million at the end of 2016 (Chart 1.32 and Table 1.7).
Residential users increased by 4% coming up to 14.7 million while business users showed sta-bility overtime, ranging at almost 1.25 million (Table 1.8 and Chart 1.33).
9. The term used is “connection” or “subscription” instead of “subscriber”. It is not the number of subscribers as individuals or legal entities that are recorded, but the total connections/subscriptions, as one subscriber may possibly have one or more subscriptions/connections.10. “Active connections” or “active subscriptions” are intended as connections/subscriptions that have generated retail or wholesale re-venue within the last quarter.
Connections Registered Active
Dec. 2006 13,874,674 11,097,515
Dec. 2007 16,226,675 12,294,912
Dec. 2008 18,918,092 13,799,340
Dec. 2009 20,298,102 13,295,093
Dec. 2010 14,815,705 12,292,716
Dec. 2011 14,557,672 12,127,985
Dec. 2012 15,151,742 12,897,306
Dec. 2013 15,722,476 12,518,645
Dec. 2014 15,473,683 12,144,598
Dec. 2015 15,353,553 12,566,650
Dec. 2016 15,934,294 12,538,927
Table 1.6: Total and active mobile telephony connections
(without datacards)
Source: EETT
Chart 1.30: Number portability for fixed telephony
0
1,000,000
2,000,000
3,000,000
4,000,000
5,000,000
6,000,000
7,000,000
8,000,000Ja
n. 2
010
Jul.
2010
Jan.
201
1
Jul.
2011
Jan.
201
2
Jul.
2012
Jan.
201
3
Jul.
2013
Jan.
201
4
Jul.
2014
Jan.
201
5
Jul.
2015
Jan.
201
6
Jul.
2016
Applications Ported numbers
31
Source: EETT (based on data provided by the active licensed operators)
num
ber
of c
onne
ctio
ns (m
illio
ns)
Chart 1.31: Mobile telephony connections/subscriptions (2006-2016)
11. The number of active connections as well as their resulting shares is confidential information and thus replaced by ranges.
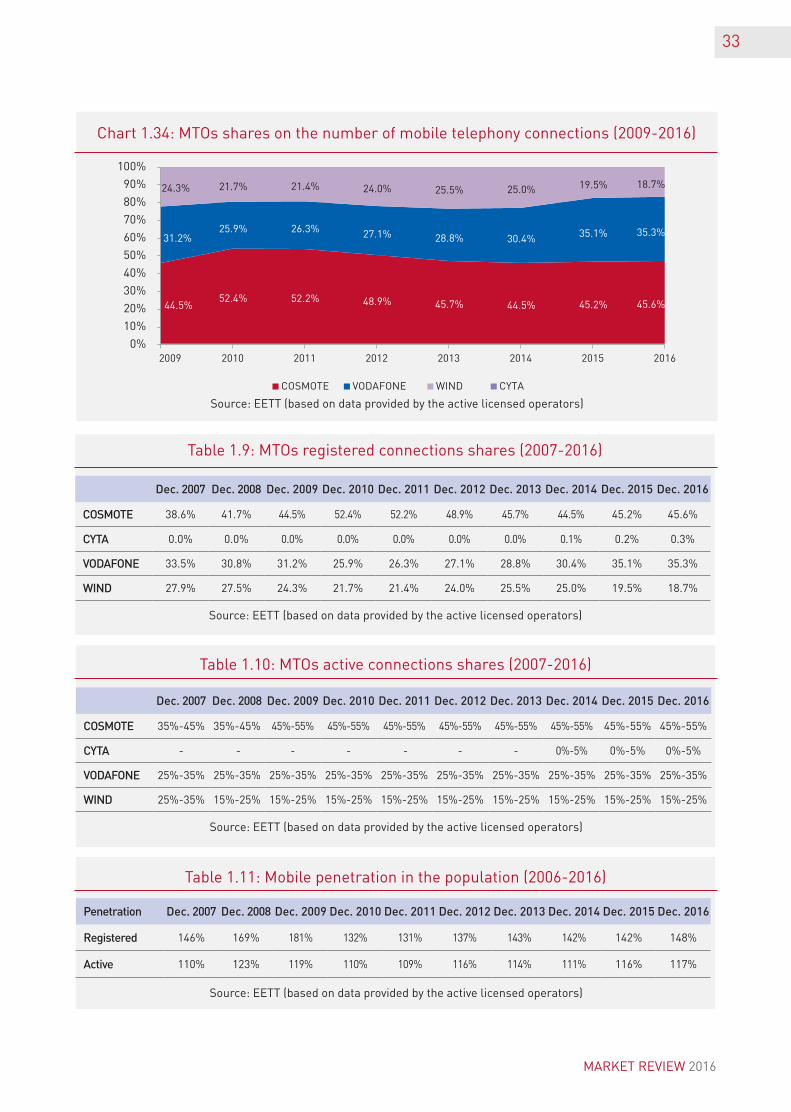
Mobile Telephone Operators’ (MTOS) shares over the total number of subscribers remained stable at the end of 2016. COSMOTE and VODAFONE shares showed a small increase coming up to 45.6% and 35.3% respectively, against 45.2% and 35.1% at the end of 2015. WIND share dropped at 18.7% against 19.5% in 2015 (Table 1.9 and Chart 1.34). Regarding the active connections11, COSMOTE share ranged from [45%-55%] followed by VODAFONE that ranged from [25%-35%] (Table 1.10).
The penetration of the active mobile connections in Greece’s population, reached 117% at the end of 2016, compared to 116% at the end of 2015, marking a slight increase. Respectively and as far as total mobile connections were concerned, penetration increased to 148% (against 142% in 2015) (Table 1.11).
Source: EETT (based on data provided by the active licensed operators)
Connections Dec. 2009 Dec. 2010 Dec. 2011 Dec. 2012 Dec. 2013 Dec. 2014 Dec. 2015 Dec. 2016
Post-paid 4,583,091 4,509,815 4,375,606 4,381,879 4,278,843 4,216,579 4,211,675 4,219,022
Pre-paid (registered) 15,715,011 10,305,890 10,182,066 10,769,863 11,443,633 11,257,104 11,141,878 11,715,272
Table 1.7: Total post-paid and pre-paid connections
20.3
14.8 14.6 15.2 15.7 15.5 15.4 15.9
13.312.3 12.1
12.9 12.5 12.1 12.6 12.5
0
5
10
15
20
25
31/12/2009 31/12/2010 31/12/2011 31/12/2012 31/12/2013 31/12/2014 31/12/2015 31/12/2016
Total connections number Number of active connections
MARKET REVIEW 2016
32
Source: EETT (based on data provided by the active licensed operators)
num
ber
of s
ubsc
ript
ions
/con
nect
ions
(in
mill
ions
)
Source: EETT (based on data provided by the active licensed operators)
Chart 1.32: Progress of mobile telephony subscriptions(pre-paid and post-paid)
Chart 1.33: Progress of mobile telephony subscriptions (residential-business)
Source: EETT (based on data provided by the active licensed operators)
Connections Dec. 2009 Dec. 2010 Dec. 2011 Dec. 2012 Dec. 2013 Dec. 2014 Dec. 2015 Dec. 2016
Residential 18,906,617 13,436,394 13,233,823 13,876,910 14,497,186 14,254,880 14,118,156 14,682,583
Business 1,391,485 1,379,311 1,323,849 1,274,537 1,225,290 1,218,803 1,235,397 1,251,711
Table 1.8: Total post-paid and pre-paid connections of residential and business users
in m
illio
ns
18.9
13.4 13.2 13.9 14.5 14.3 14.1 14.7
1.4
1.4 1.3 1.3 1.2 1.2 1.2 1.3
2009 2010 2011 2012 2013 2014 2015 2016
Residential users Business users
0,0
5,0
10,0
15,0
20,0
25,0
15.7
10.3 10.2 10.8 11.4 11.3 11.1 11.7
4.6
4.5 4.44.4
4.3 4.2 4.2 4.2
0
2
4
6
8
10
12
14
16
18
20
22
2009 2010 2011 2012 2013 2014 2015 2016
Pre-paid registered Post-paid
33
Source: EETT (based on data provided by the active licensed operators)
Chart 1.34: MTOs shares on the number of mobile telephony connections (2009-2016)
Dec. 2007 Dec. 2008 Dec. 2009 Dec. 2010 Dec. 2011 Dec. 2012 Dec. 2013 Dec. 2014 Dec. 2015 Dec. 2016
COSMOTE 38.6% 41.7% 44.5% 52.4% 52.2% 48.9% 45.7% 44.5% 45.2% 45.6%
CYTA 0.0% 0.0% 0.0% 0.0% 0.0% 0.0% 0.0% 0.1% 0.2% 0.3%
VODAFONE 33.5% 30.8% 31.2% 25.9% 26.3% 27.1% 28.8% 30.4% 35.1% 35.3%
WIND 27.9% 27.5% 24.3% 21.7% 21.4% 24.0% 25.5% 25.0% 19.5% 18.7%
Dec. 2007 Dec. 2008 Dec. 2009 Dec. 2010 Dec. 2011 Dec. 2012 Dec. 2013 Dec. 2014 Dec. 2015 Dec. 2016
COSMOTE 35%-45% 35%-45% 45%-55% 45%-55% 45%-55% 45%-55% 45%-55% 45%-55% 45%-55% 45%-55%
CYTA - - - - - - - 0%-5% 0%-5% 0%-5%
VODAFONE 25%-35% 25%-35% 25%-35% 25%-35% 25%-35% 25%-35% 25%-35% 25%-35% 25%-35% 25%-35%
WIND 25%-35% 15%-25% 15%-25% 15%-25% 15%-25% 15%-25% 15%-25% 15%-25% 15%-25% 15%-25%
Penetration Dec. 2007 Dec. 2008 Dec. 2009 Dec. 2010 Dec. 2011 Dec. 2012 Dec. 2013 Dec. 2014 Dec. 2015 Dec. 2016
Registered 146% 169% 181% 132% 131% 137% 143% 142% 142% 148%
Active 110% 123% 119% 110% 109% 116% 114% 111% 116% 117%
Table 1.9: MTOs registered connections shares (2007-2016)
Table 1.10: MTOs active connections shares (2007-2016)
Table 1.11: Mobile penetration in the population (2006-2016)
Source: EETT (based on data provided by the active licensed operators)
Source: EETT (based on data provided by the active licensed operators)
Source: EETT (based on data provided by the active licensed operators)
44.5%52.4% 52.2% 48.9% 45.7% 44.5% 45.2% 45.6%
31.2%25.9% 26.3% 27.1% 28.8% 30.4% 35.1% 35.3%
24.3% 21.7% 21.4% 24.0% 25.5% 25.0% 19.5% 18.7%
0%
10%
20%
30%
40%
50%
60%
70%
80%
90%
100%
2009 2010 2011 2012 2013 2014 2015 2016
COSMOTE VODAFONE WIND CYTA
MARKET REVIEW 2016
34
Source: EETT (based on data provided by the active licensed operators)
Chart 1.35: Voice calls originating from mobile phone
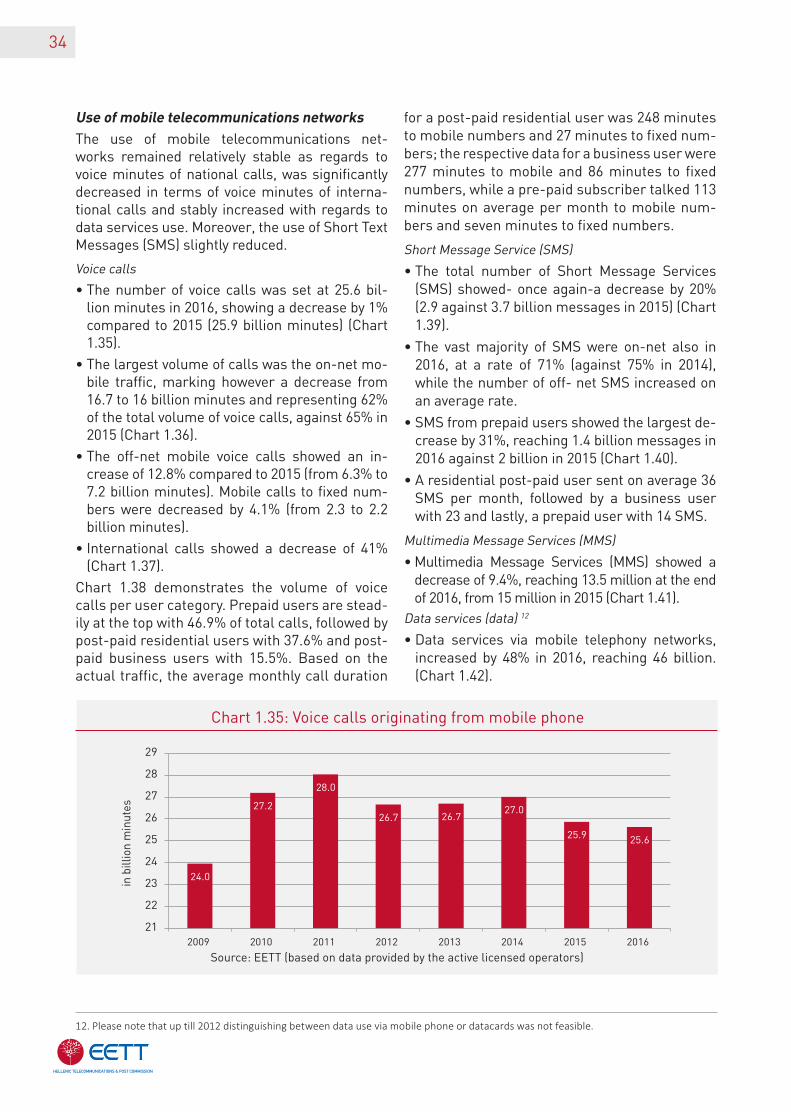
UseofmobiletelecommunicationsnetworksThe use of mobile telecommunications net-works remained relatively stable as regards to voice mi nutes of national calls, was significantly decreased in terms of voice minutes of interna-tional calls and stably increased with regards to data services use. Moreover, the use of Short Text Messages (SMS) slightly reduced.
Voice calls
• The number of voice calls was set at 25.6 bil-lion minutes in 2016, showing a decrease by 1% compared to 2015 (25.9 billion minutes) (Chart 1.35).
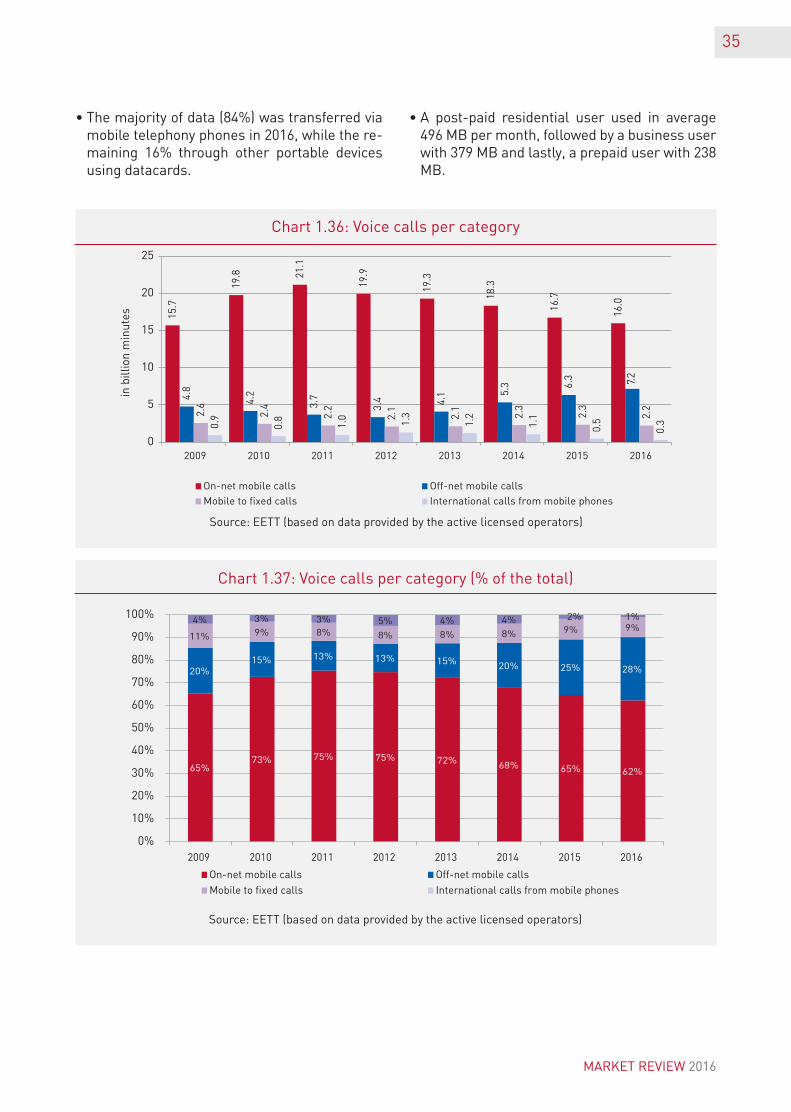
• The largest volume of calls was the on-net mo-bile traffic, marking however a decrease from 16.7 to 16 billion minutes and representing 62% of the total volume of voice calls, against 65% in 2015 (Chart 1.36).
• The off-net mobile voice calls showed an in-crease of 12.8% compared to 2015 (from 6.3% to 7.2 billion minutes). Mobile calls to fixed num-bers were decreased by 4.1% (from 2.3 to 2.2 billion minutes).
• International calls showed a decrease of 41% (Chart 1.37).
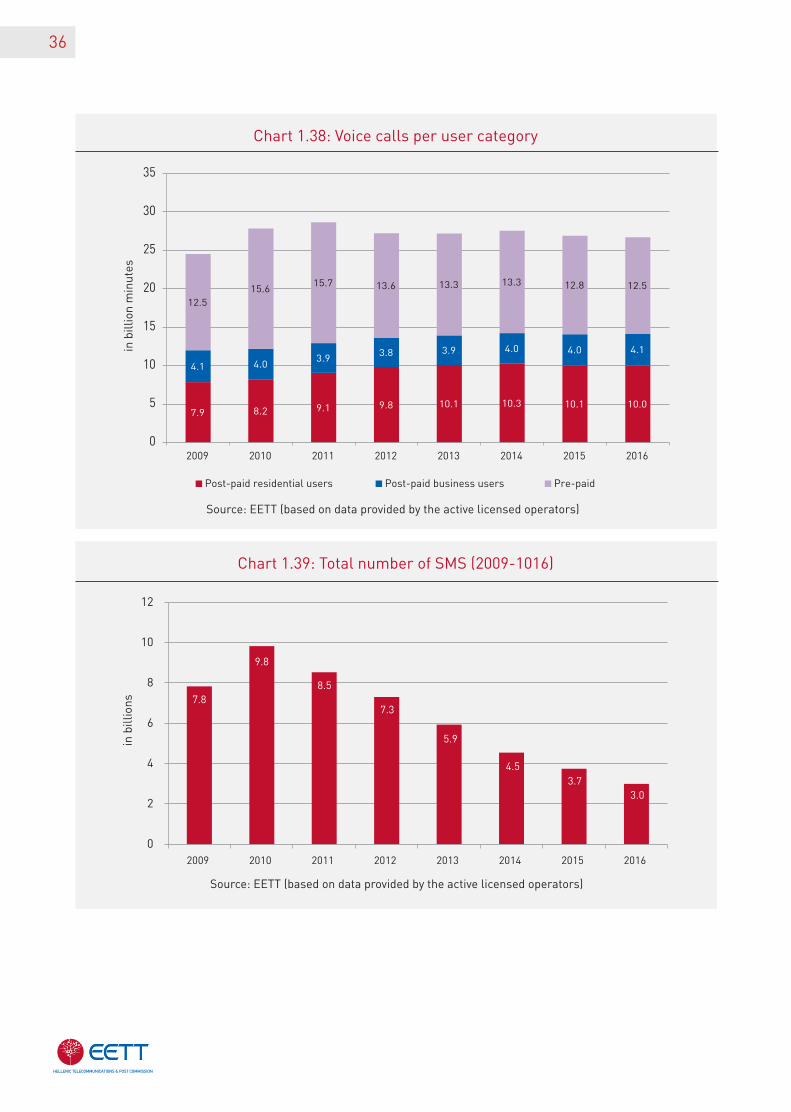
Chart 1.38 demonstrates the volume of voice calls per user category. Prepaid users are stead-ily at the top with 46.9% of total calls, followed by post-paid residential users with 37.6% and post-paid business users with 15.5%. Based on the actual traffic, the average monthly call duration
for a post-paid residential user was 248 minutes to mobile numbers and 27 minutes to fixed num-bers; the respective data for a business user were 277 minutes to mobile and 86 minutes to fixed numbers, while a pre-paid subscriber talked 113 minutes on average per month to mobile num-bers and seven minutes to fixed numbers.
Short Message Service (SMS)
• The total number of Short Message Services (SMS) showed- once again-a decrease by 20% (2.9 against 3.7 billion messages in 2015) (Chart 1.39).
• The vast majority of SMS were on-net also in 2016, at a rate of 71% (against 75% in 2014), while the number of off- net SMS increased on an average rate.
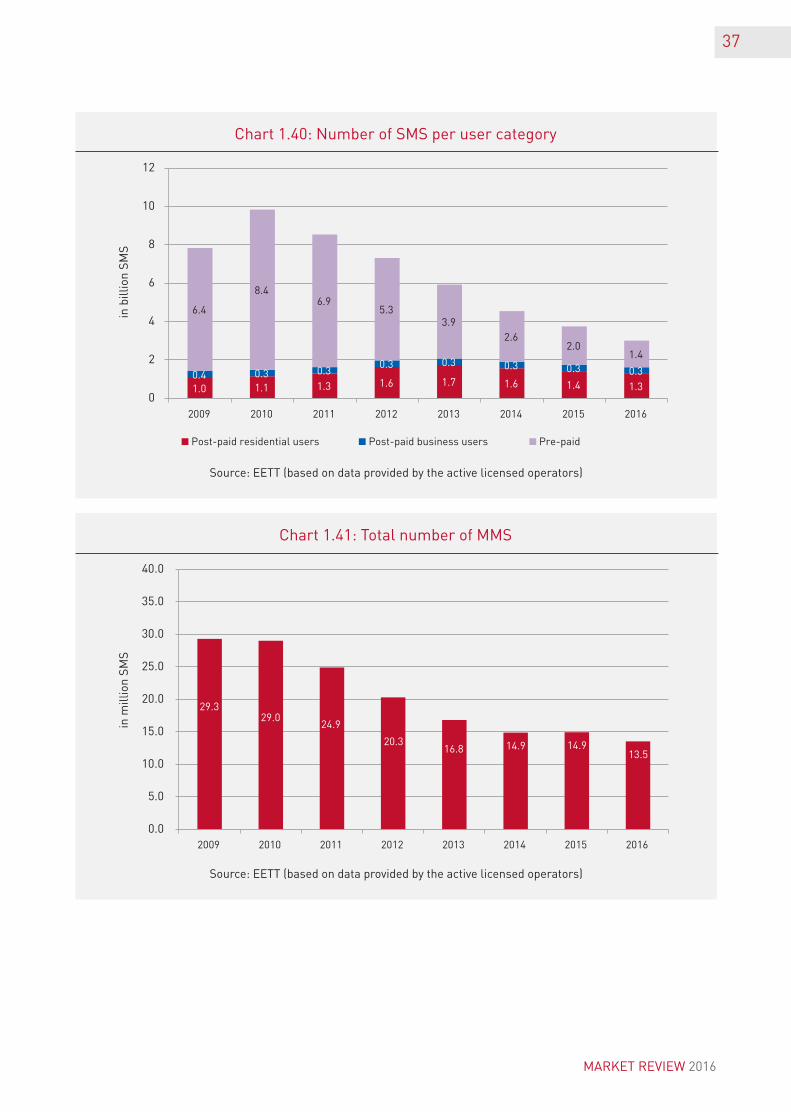
• SMS from prepaid users showed the largest de-crease by 31%, reaching 1.4 billion messages in 2016 against 2 billion in 2015 (Chart 1.40).
• A residential post-paid user sent on average 36 SMS per month, followed by a business user with 23 and lastly, a prepaid user with 14 SMS.
Multimedia Message Services (MMS)
• Multimedia Message Services (MMS) showed a decrease of 9.4%, reaching 13.5 million at the end of 2016, from 15 million in 2015 (Chart 1.41).
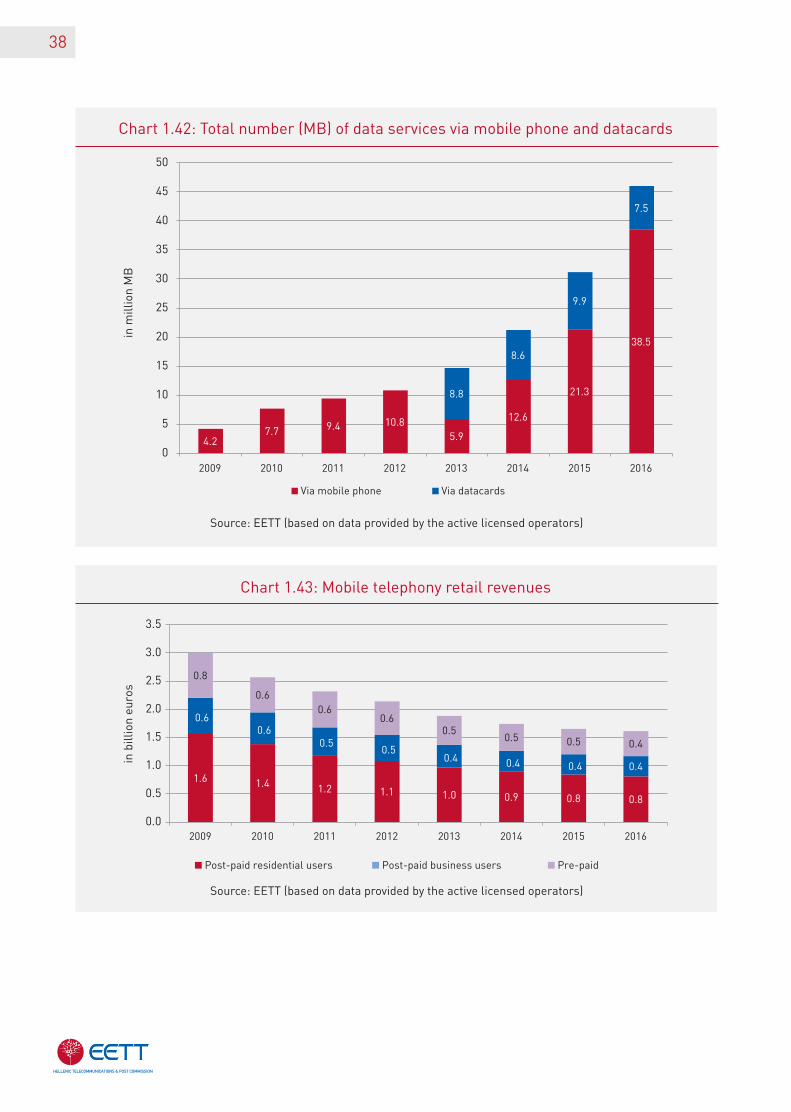
Data services (data) 12
• Data services via mobile telephony networks, increased by 48% in 2016, reaching 46 billion. (Chart 1.42).
12. Please note that up till 2012 distinguishing between data use via mobile phone or datacards was not feasible.
24.0
27.2
28.0
26.7 26.727.0
25.9 25.6
21
22
23
24
25
26
27
28
29
2009 2010 2011 2012 2013 2014 2015 2016
in b
illio
n m
inut
es
35
Source: EETT (based on data provided by the active licensed operators)
Source: EETT (based on data provided by the active licensed operators)
Chart 1.36: Voice calls per category
Chart 1.37: Voice calls per category (% of the total)
• The majority of data (84%) was transferred via mobile telephony phones in 2016, while the re-maining 16% through other portable devices using datacards.
• A post-paid residential user used in average 496 MB per month, followed by a business user with 379 MB and lastly, a prepaid user with 238 MB.
in b
illio
n m
inut
es 15.7
19.8 21
.1
19.9
19.3
18.3
16.7
16.0
4.8
4.2
3.7
3.4 4.
1 5.3 6.
3
2.6
2.4
2.2
2.1
2.1
2.3
2.3
2.2
0.9
0.8
1.0 1.3
1.2
1.1
0.5
0.3
0
5
10
15
20
25
2009 2010 2011 2012 2013 2014 2015 2016
On-net mobile calls Off-net mobile calls
Mobile to fixed calls International calls from mobile phones
On-net mobile calls Off-net mobile calls
Mobile to fixed calls International calls from mobile phones
65%73% 75% 75% 72% 68% 65% 62%
20%15% 13% 13% 15% 20% 25% 28%
11% 9% 8% 8% 8% 8% 9% 9%4% 3% 3% 5% 4% 4% 2% 1%
0%
10%
20%
30%
40%
50%
60%
70%
80%
90%
100%
2009 2010 2011 2012 2013 2014 2015 2016
MARKET REVIEW 2016
7.2
36
Source: EETT (based on data provided by the active licensed operators)
Source: EETT (based on data provided by the active licensed operators)
Chart 1.38: Voice calls per user category
Chart 1.39: Total number of SMS (2009-1016)
in b
illio
n m
inut
es
7.9 8.2 9.1 9.8 10.1 10.3 10.1 10.0
4.1 4.03.9 3.8 3.9 4.0 4.0 4.1
12.515.6
15.7 13.6 13.3 13.3 12.8 12.5
0
5
10
15
20
25
30
35
2009 2010 2011 2012 2013 2014 2015 2016
Post-paid residential users Post-paid business users Pre-paid
in b
illio
ns 7.8
9.8
8.5
7.3
5.9
4.53.7
3.0
0
2
4
6
8
10
12
2009 2010 2011 2012 2013 2014 2015 2016
37
Source: EETT (based on data provided by the active licensed operators)
Source: EETT (based on data provided by the active licensed operators)
in m
illio
n S
MS
in b
illio
n S
MS
Chart 1.40: Number of SMS per user category
Chart 1.41: Total number of MMS
1.0 1.1 1.3 1.6 1.7 1.6 1.4 1.30.4 0.3 0.3
0.3 0.3 0.3 0.3 0.3
6.4
8.46.9
5.33.9
2.62.0
1.4
0
2
4
6
8
10
12
2009 2010 2011 2012 2013 2014 2015 2016
Post-paid residential users Post-paid business users Pre-paid
29.329.0
24.9
20.316.8 14.9 14.9
13.5
0.0
5.0
10.0
15.0
20.0
25.0
30.0
35.0
40.0
2009 2010 2011 2012 2013 2014 2015 2016
MARKET REVIEW 2016
38
Source: EETT (based on data provided by the active licensed operators)
Source: EETT (based on data provided by the active licensed operators)
Chart 1.42: Total number (MB) of data services via mobile phone and datacards
Chart 1.43: Mobile telephony retail revenues
4.27.7 9.4 10.8
5.9
12.6
21.3
38.5
8.8
8.6
9.9
7.5
0
5
10
15
20
25
30
35
40
45
50
2009 2010 2011 2012 2013 2014 2015 2016
Via mobile phone Via datacards
in b
illio
n eu
ros
1.6 1.4 1.2 1.1 1.0 0.9 0.8 0.8
0.60.6
0.50.5
0.4 0.4 0.4 0.4
0.8
0.60.6
0.60.5
0.5 0.5 0.4
0.0
0.5
1.0
1.5
2.0
2.5
3.0
3.5
2009 2010 2011 2012 2013 2014 2015 2016
Post-paid residential users Post-paid business users Pre-paid
in m
illio
n M
B
39
13. Revenues from the sale of handsets, wholesale or other services are not included. 14. Retail revenues as well as their resulting shares is confidential information and thus replaced by ranges.
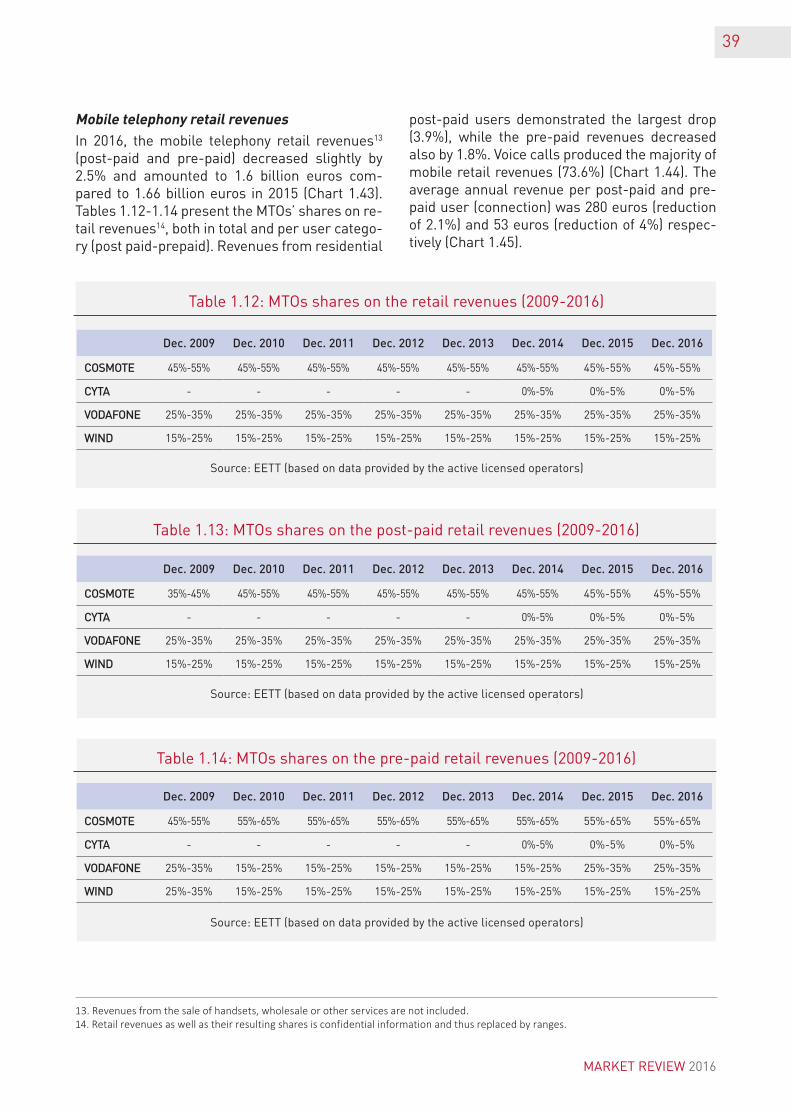
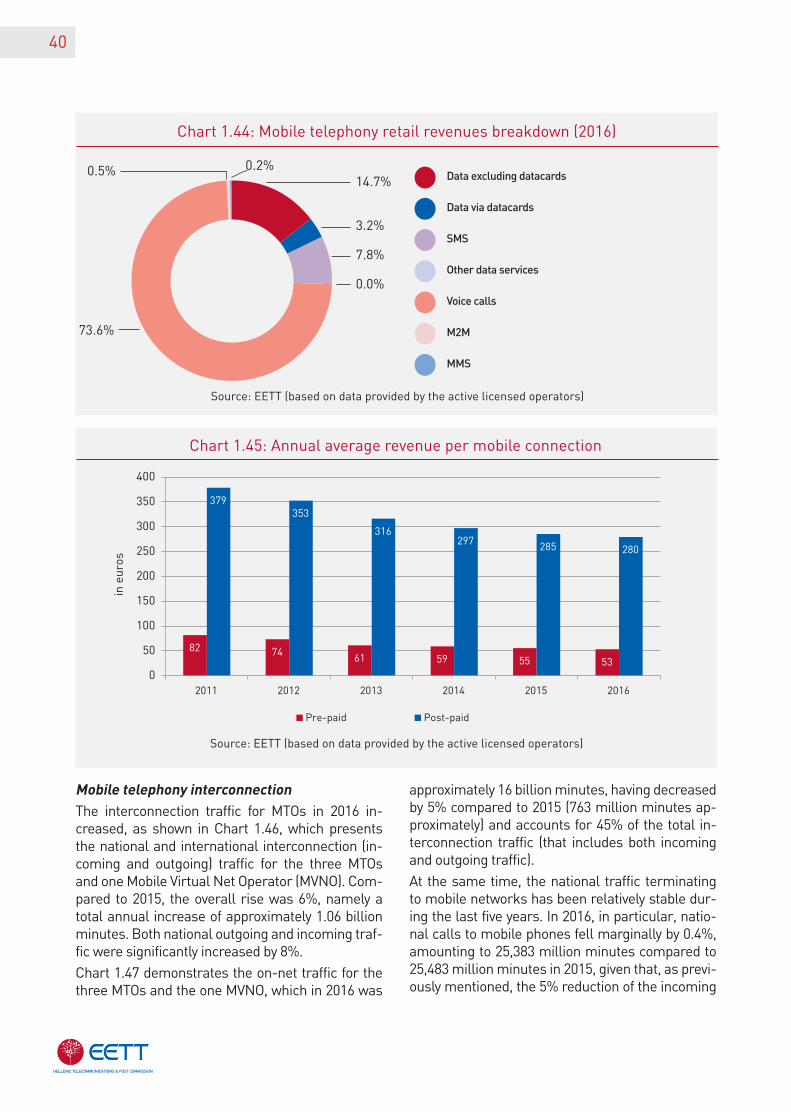
MobiletelephonyretailrevenuesIn 2016, the mobile telephony retail revenues13 (post-paid and pre-paid) decreased slightly by 2.5% and amounted to 1.6 billion euros com-pared to 1.66 billion euros in 2015 (Chart 1.43). Tables 1.12-1.14 present the MTOs’ shares on re-tail revenues14, both in total and per user catego-ry (post paid-prepaid). Revenues from residential
post-paid users demonstrated the largest drop (3.9%), while the pre-paid revenues decreased also by 1.8%. Voice calls produced the majority of mobile retail revenues (73.6%) (Chart 1.44). The average annual revenue per post-paid and pre-paid user (connection) was 280 euros (reduction of 2.1%) and 53 euros (reduction of 4%) respec-tively (Chart 1.45).
Dec. 2009 Dec. 2010 Dec. 2011 Dec. 2012 Dec. 2013 Dec. 2014 Dec. 2015 Dec. 2016
COSMOTE 45%-55% 45%-55% 45%-55% 45%-55% 45%-55% 45%-55% 45%-55% 45%-55%
CYTA - - - - - 0%-5% 0%-5% 0%-5%
VODAFONE 25%-35% 25%-35% 25%-35% 25%-35% 25%-35% 25%-35% 25%-35% 25%-35%
WIND 15%-25% 15%-25% 15%-25% 15%-25% 15%-25% 15%-25% 15%-25% 15%-25%
Dec. 2009 Dec. 2010 Dec. 2011 Dec. 2012 Dec. 2013 Dec. 2014 Dec. 2015 Dec. 2016
COSMOTE 35%-45% 45%-55% 45%-55% 45%-55% 45%-55% 45%-55% 45%-55% 45%-55%
CYTA - - - - - 0%-5% 0%-5% 0%-5%
VODAFONE 25%-35% 25%-35% 25%-35% 25%-35% 25%-35% 25%-35% 25%-35% 25%-35%
WIND 15%-25% 15%-25% 15%-25% 15%-25% 15%-25% 15%-25% 15%-25% 15%-25%
Dec. 2009 Dec. 2010 Dec. 2011 Dec. 2012 Dec. 2013 Dec. 2014 Dec. 2015 Dec. 2016
COSMOTE 45%-55% 55%-65% 55%-65% 55%-65% 55%-65% 55%-65% 55%-65% 55%-65%
CYTA - - - - - 0%-5% 0%-5% 0%-5%
VODAFONE 25%-35% 15%-25% 15%-25% 15%-25% 15%-25% 15%-25% 25%-35% 25%-35%
WIND 25%-35% 15%-25% 15%-25% 15%-25% 15%-25% 15%-25% 15%-25% 15%-25%
Table 1.12: MTOs shares on the retail revenues (2009-2016)
Table 1.13: MTOs shares on the post-paid retail revenues (2009-2016)
Table 1.14: MTOs shares on the pre-paid retail revenues (2009-2016)
Source: EETT (based on data provided by the active licensed operators)
Source: EETT (based on data provided by the active licensed operators)
Source: EETT (based on data provided by the active licensed operators)
MARKET REVIEW 2016
40
Chart 1.44: Mobile telephony retail revenues breakdown (2016)
14.7%
3.2%
7.8%
0.0%
0.5% 0.2%
73.6%
Data excluding datacards
Data via datacards
SMS
Other data services
Voice calls
M2M
MMS
Source: EETT (based on data provided by the active licensed operators)
Source: EETT (based on data provided by the active licensed operators)
Chart 1.45: Annual average revenue per mobile connection
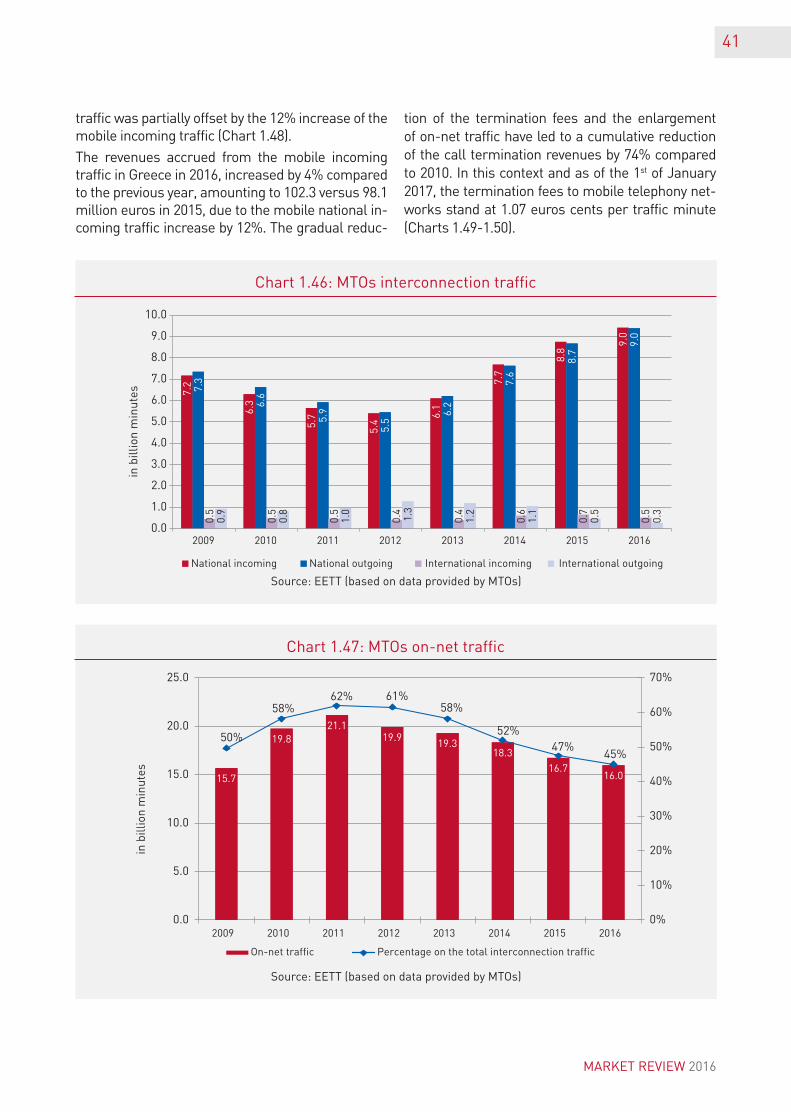
MobiletelephonyinterconnectionThe interconnection traffic for MTOs in 2016 in-creased, as shown in Chart 1.46, which presents the national and international interconnection (in-coming and outgoing) traffic for the three MTOs and one Mobile Virtual Net Operator (MVNO). Com-pared to 2015, the overall rise was 6%, namely a total annual increase of approximately 1.06 billion minutes. Both national outgoing and incoming traf-fic were significantly increased by 8%.
Chart 1.47 demonstrates the on-net traffic for the three MTOs and the one MVNO, which in 2016 was
approximately 16 billion minutes, having decreased by 5% compared to 2015 (763 million minutes ap-proximately) and accounts for 45% of the total in-terconnection traffic (that includes both incoming and outgoing traffic).
At the same time, the national traffic terminating to mobile networks has been relatively stable dur-ing the last five years. In 2016, in particular, natio-nal calls to mobile phones fell marginally by 0.4%, amounting to 25,383 million minutes compared to 25,483 million minutes in 2015, given that, as previ-ously mentioned, the 5% reduction of the incoming
82 74 61 59 55 53
379353
316297 285 280
0
50
100
150
200
250
300
350
400
2011 2012 2013 2014 2015 2016
in e
uros
Pre-paid Post-paid
41
Source: EETT (based on data provided by MTOs)
Source: EETT (based on data provided by MTOs)
Chart 1.46: MTOs interconnection traffic
Chart 1.47: MTOs on-net traffic
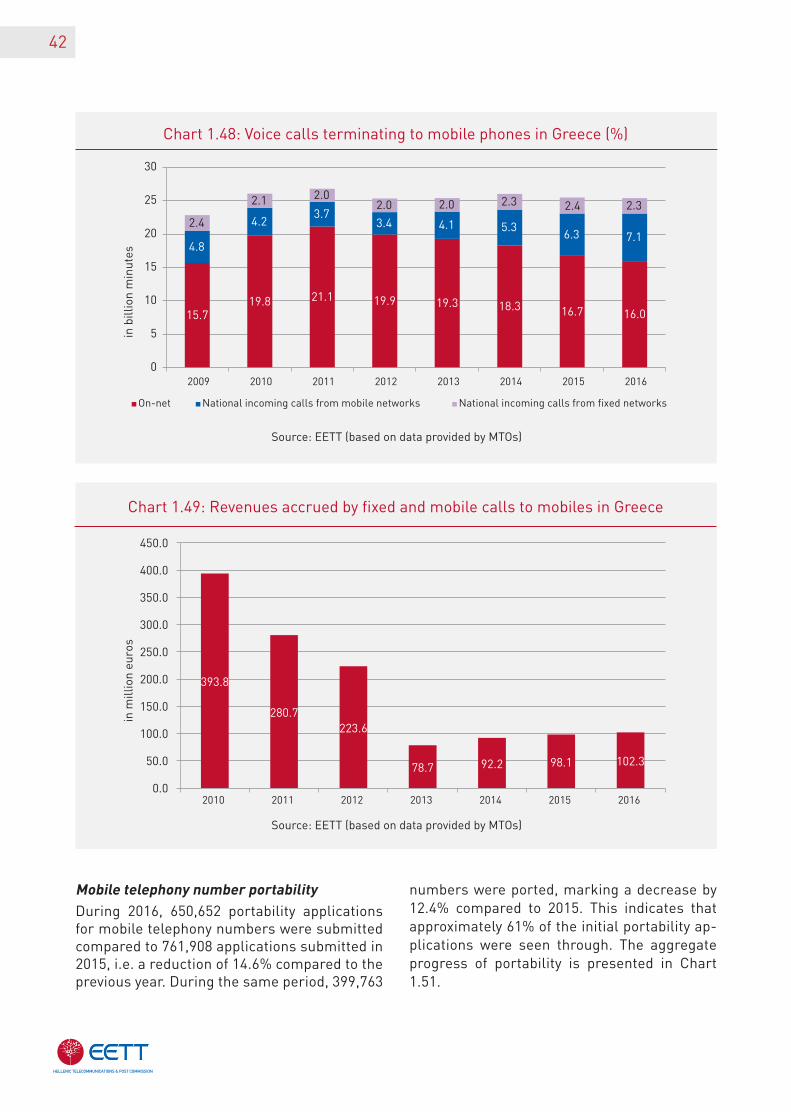
traffic was partially offset by the 12% increase of the mobile incoming traffic (Chart 1.48).
The revenues accrued from the mobile incoming traffic in Greece in 2016, increased by 4% compared to the previous year, amounting to 102.3 versus 98.1 million euros in 2015, due to the mobile national in-coming traffic increase by 12%. The gradual reduc-
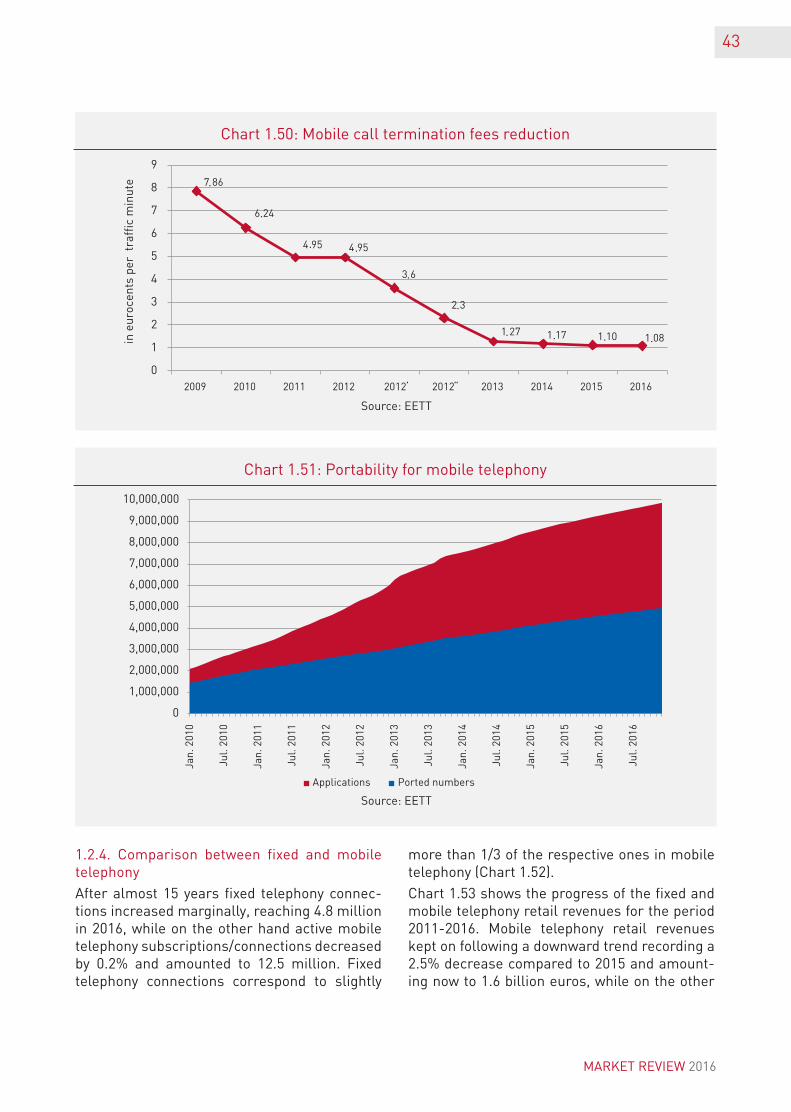
tion of the termination fees and the enlargement of on-net traffic have led to a cumulative reduction of the call termination revenues by 74% compared to 2010. In this context and as of the 1st of January 2017, the termination fees to mobile telephony net-works stand at 1.07 euros cents per traffic minute (Charts 1.49-1.50).
in b
illio
n m
inut
es 7.2
6.3
5.7
5.4
6.1
7.7
8.8
9.0
7.3
6.6
5.9
5.5
6.2
7.6
8.7
9.0
0.5
0.5
0.5
0.4
0.4
0.6
0.7
0.5
0.9
0.8
1.0
1.3
1.2
1.1
0.5
0.3
0.0
1.0
2.0
3.0
4.0
5.0
6.0
7.0
8.0
9.0
10.0
2009 2010 2011 2012 2013 2014 2015 2016
National incoming National outgoing International incoming International outgoing
in b
illio
n m
inut
es 15.7
19.821.1
19.919.3
18.3
16.716.0
50%
58%62% 61%
58%
52%47%
45%
0%
10%
20%
30%
40%
50%
60%
70%
0.0
5.0
10.0
15.0
20.0
25.0
2009 2010 2011 2012 2013 2014 2015 2016
On-net traffic Percentage on the total interconnection traffic
MARKET REVIEW 2016
42
Source: EETT (based on data provided by MTOs)
Source: EETT (based on data provided by MTOs)
Chart 1.48: Voice calls terminating to mobile phones in Greece (%)
Chart 1.49: Revenues accrued by fixed and mobile calls to mobiles in Greece
MobiletelephonynumberportabilityDuring 2016, 650,652 portability applications for mobile telephony numbers were submitted compared to 761,908 applications submitted in 2015, i.e. a reduction of 14.6% compared to the previous year. During the same period, 399,763
numbers were ported, marking a decrease by 12.4% compared to 2015. This indicates that approximately 61% of the initial portability ap-plications were seen through. The aggregate progress of portability is presented in Chart 1.51.
in b
illio
n m
inut
es
15.719.8 21.1 19.9 19.3 18.3 16.7 16.0
4.8
4.23.7
3.4 4.1 5.36.3 7.1
2.4
2.1 2.02.0 2.0 2.3 2.4 2.3
0
5
10
15
20
25
30
2009 2010 2011 2012 2013 2014 2015 2016
On-net National incoming calls from mobile networks National incoming calls from fixed networks
in m
illio
n eu
ros
393.8
280.7223.6
78.7 92.2 98.1 102.3
0.0
50.0
100.0
150.0
200.0
250.0
300.0
350.0
400.0
450.0
2010 2011 2012 2013 2014 2015 2016
43
Source: EETT
‘ ‘‘
Source: EETT
Chart 1.50: Mobile call termination fees reduction
Chart 1.51: Portability for mobile telephony
1.2.4. Comparison between fixed and mobile telephony
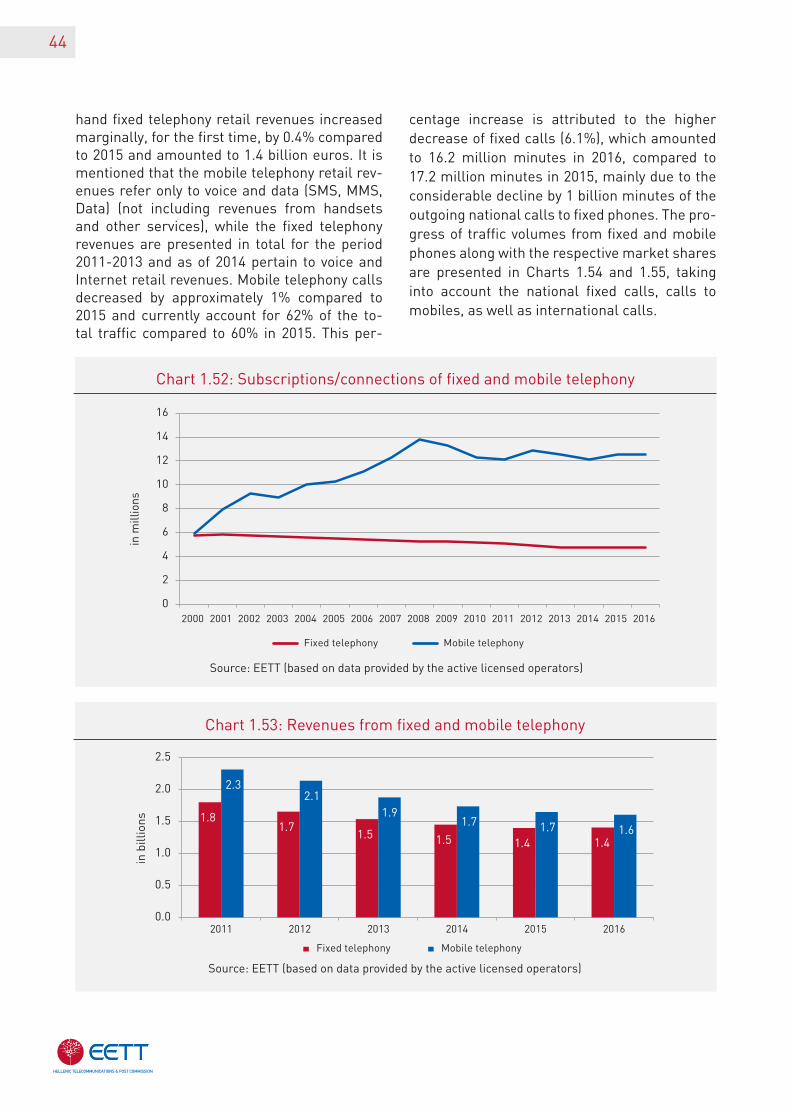
After almost 15 years fixed telephony connec-tions increased marginally, reaching 4.8 million in 2016, while on the other hand active mobile telephony subscriptions/connections decreased by 0.2% and amounted to 12.5 million. Fixed telephony connections correspond to slightly
more than 1/3 of the respective ones in mobile telephony (Chart 1.52).
Chart 1.53 shows the progress of the fixed and mobile telephony retail revenues for the period 2011-2016. Mobile telephony retail revenues kept on following a downward trend recording a 2.5% decrease compared to 2015 and amount-ing now to 1.6 billion euros, while on the other
in e
uroc
ents
per
tra
ffic
min
ute
0
1,000,000
2,000,000
3,000,000
4,000,000
5,000,000
6,000,000
7,000,000
8,000,000
9,000,000
10,000,000
Applications Ported numbers
Jan.
201
0
Jul.
2010
Jan.
201
1
Jul.
2011
Jan.
201
2
Jul.
2012
Jan.
201
3
Jul.
2013
Jan.
201
4
Jul.
2014
Jan.
201
5
Jul.
2015
Jan.
201
6
Jul.
2016
MARKET REVIEW 2016
44
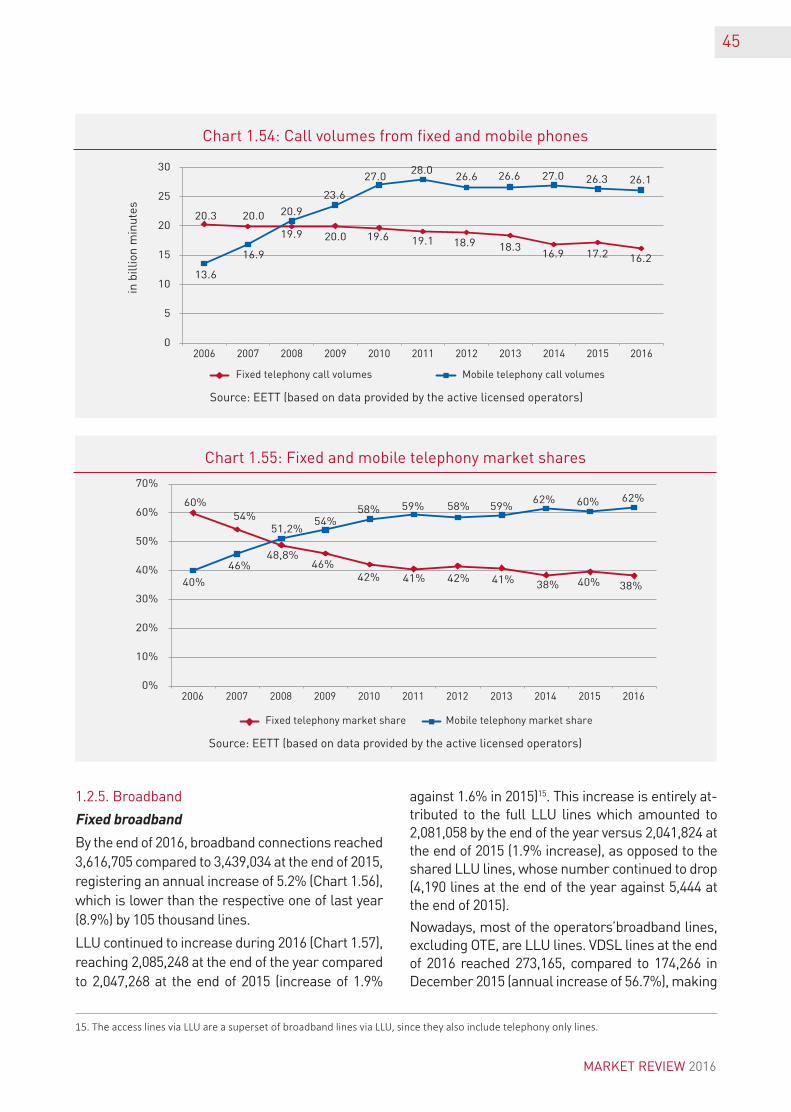
hand fixed telephony retail revenues increased marginally, for the first time, by 0.4% compared to 2015 and amounted to 1.4 billion euros. It is mentioned that the mobile telephony retail rev-enues refer only to voice and data (SMS, MMS, Data) (not including revenues from handsets and other services), while the fixed telephony revenues are presented in total for the period 2011-2013 and as of 2014 pertain to voice and Internet retail revenues. Mobile telephony calls decreased by approximately 1% compared to 2015 and currently account for 62% of the to-tal traffic compared to 60% in 2015. This per-
centage increase is attributed to the higher decrease of fixed calls (6.1%), which amounted to 16.2 million minutes in 2016, compared to 17.2 million minutes in 2015, mainly due to the considerable decline by 1 billion minutes of the outgoing national calls to fixed phones. The pro-gress of traffic volumes from fixed and mobile phones along with the respective market shares are presented in Charts 1.54 and 1.55, taking into account the national fixed calls, calls to mobiles, as well as international calls.
Source: EETT (based on data provided by the active licensed operators)
Source: EETT (based on data provided by the active licensed operators)
Chart 1.52: Subscriptions/connections of fixed and mobile telephony
Chart 1.53: Revenues from fixed and mobile telephony
in m
illio
ns
0
2
4
6
8
10
12
14
16
2000 2001 2002 2003 2004 2005 2006 2007 2008 2009 2010 2011 2012 2013 2014 2015 2016
Fixed telephony Mobile telephony
in b
illio
ns 1.81.7
1.5 1.5 1.4 1.4
2.32.1
1.91.7 1.7 1.6
0.0
0.5
1.0
1.5
2.0
2.5
2011 2012 2013 2014 2015 2016
Fixed telephony Mobile telephony
45
Source: EETT (based on data provided by the active licensed operators)
Source: EETT (based on data provided by the active licensed operators)
Chart 1.54: Call volumes from fixed and mobile phones
Chart 1.55: Fixed and mobile telephony market shares
1.2.5. Broadband
Fixedbroadband
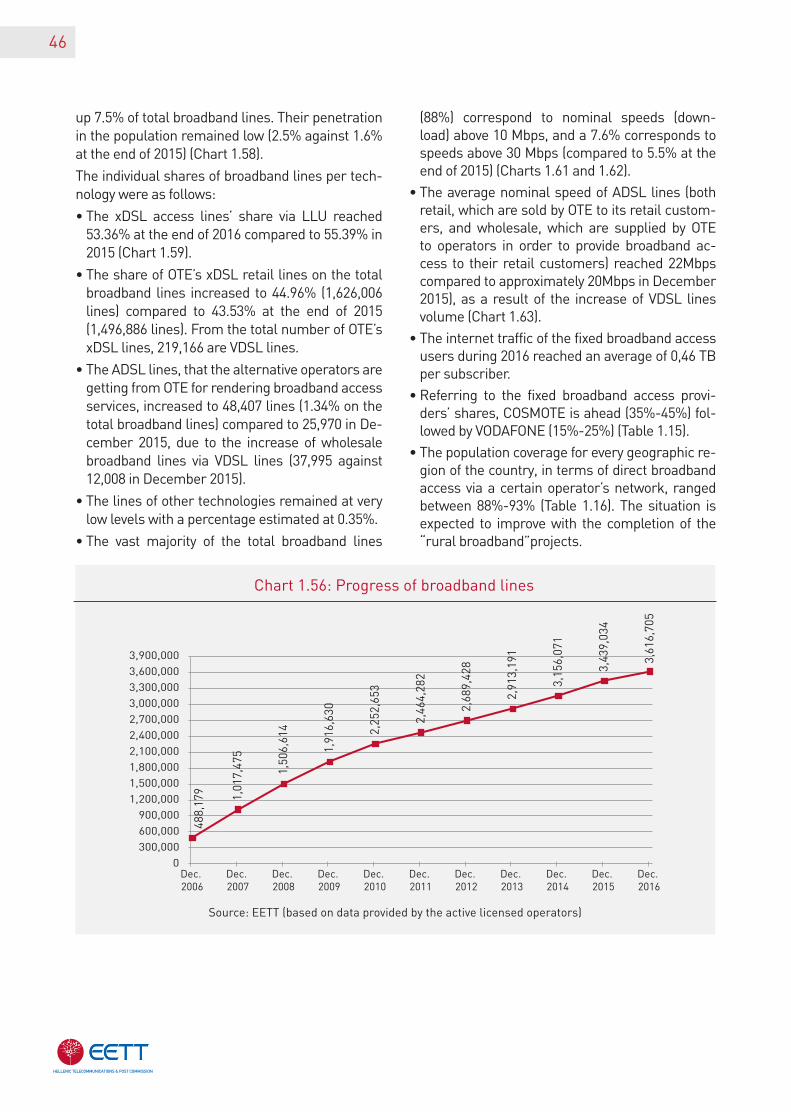
By the end of 2016, broadband connections reached 3,616,705 compared to 3,439,034 at the end of 2015, registering an annual increase of 5.2% (Chart 1.56), which is lower than the respective one of last year (8.9%) by 105 thousand lines.
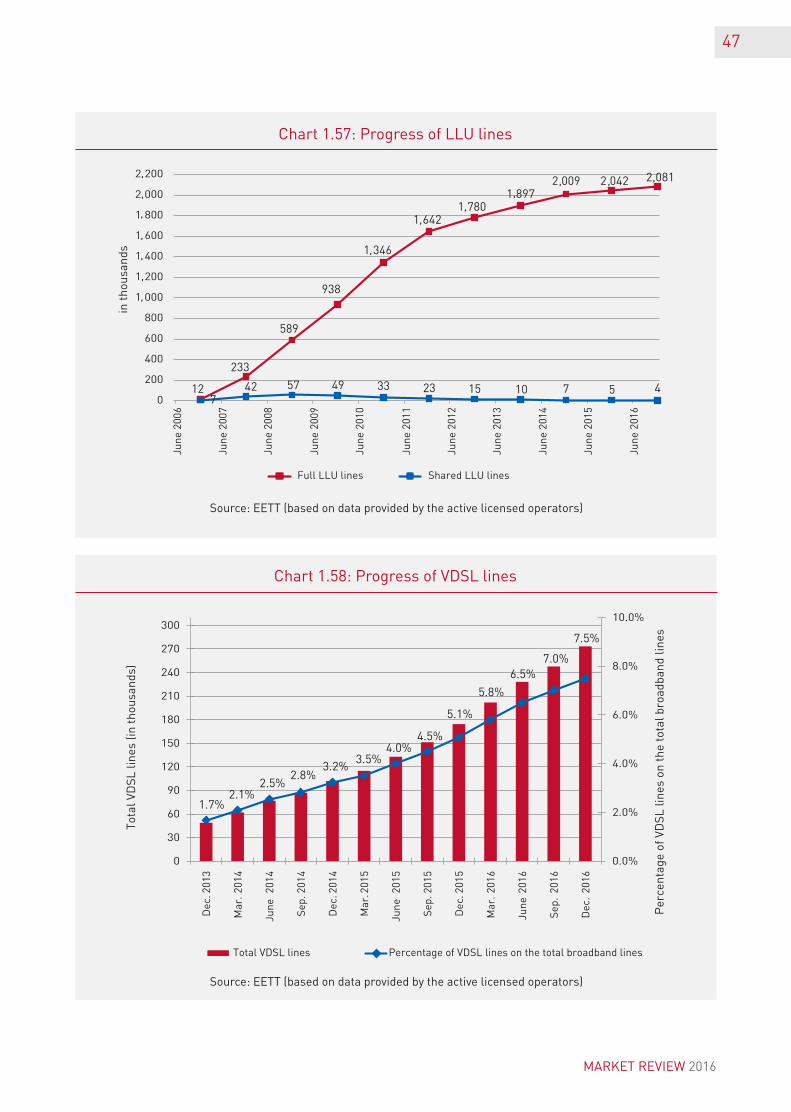
LLU continued to increase during 2016 (Chart 1.57), reaching 2,085,248 at the end of the year compared to 2,047,268 at the end of 2015 (increase of 1.9%
against 1.6% in 2015)15. This increase is entirely at-tributed to the full LLU lines which amounted to 2,081,058 by the end of the year versus 2,041,824 at the end of 2015 (1.9% increase), as opposed to the shared LLU lines, whose number continued to drop (4,190 lines at the end of the year against 5,444 at the end of 2015).
Nowadays, most of the operators’broadband lines, excluding OTE, are LLU lines. VDSL lines at the end of 2016 reached 273,165, compared to 174,266 in December 2015 (annual increase of 56.7%), making
15. The access lines via LLU are a superset of broadband lines via LLU, since they also include telephony only lines.
in b
illio
n m
inut
es 20.3 20.0
19.9 20.0 19.6 19.1 18.9 18.316.9 17.2 16.2
13.6
16.9
20.9
23.6
27.028.0
26.6 26.6 27.0 26.3 26.1
0
5
10
15
20
25
30
2006 2007 2008 2009 2010 2011 2012 2013 2014 2015 2016
Fixed telephony call volumes Mobile telephony call volumes
MARKET REVIEW 2016
46
up 7.5% of total broadband lines. Their penetration in the population remained low (2.5% against 1.6% at the end of 2015) (Chart 1.58).
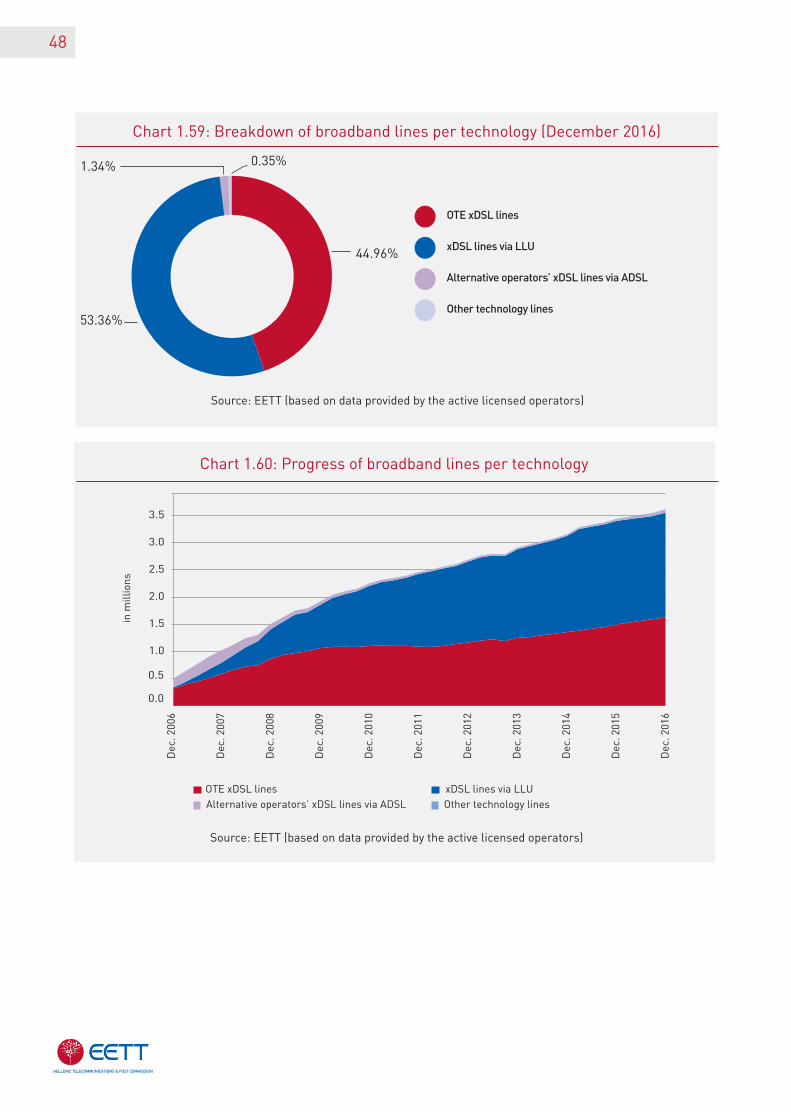
The individual shares of broadband lines per tech-nology were as follows:
• The xDSL access lines’ share via LLU reached 53.36% at the end of 2016 compared to 55.39% in 2015 (Chart 1.59).
• The share of OTE’s xDSL retail lines on the total broadband lines increased to 44.96% (1,626,006 lines) compared to 43.53% at the end of 2015 (1,496,886 lines). From the total number of OTE’s xDSL lines, 219,166 are VDSL lines.
• The ADSL lines, that the alternative operators are getting from OTE for rendering broadband access services, increased to 48,407 lines (1.34% on the total broadband lines) compared to 25,970 in De-cember 2015, due to the increase of wholesale broadband lines via VDSL lines (37,995 against 12,008 in December 2015).
• The lines of other technologies remained at very low levels with a percentage estimated at 0.35%.
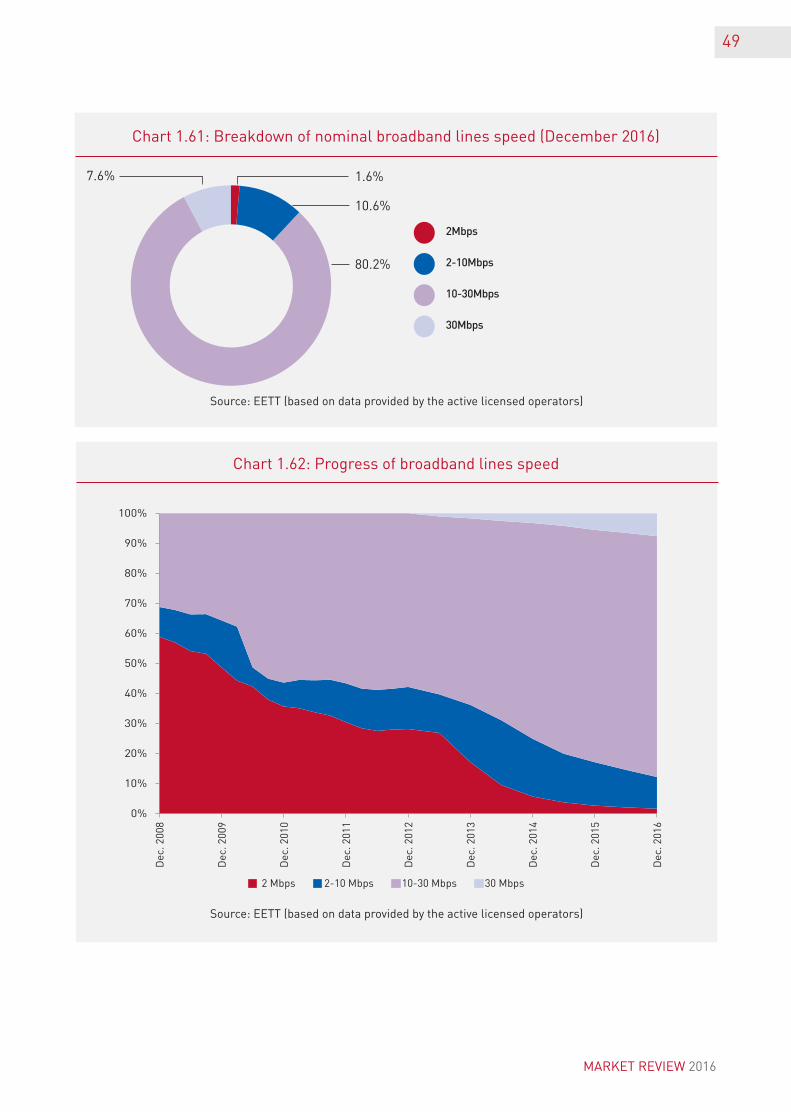
• The vast majority of the total broadband lines
(88%) correspond to nominal speeds (down-load) above 10 Mbps, and a 7.6% corresponds to speeds above 30 Mbps (compared to 5.5% at the end of 2015) (Charts 1.61 and 1.62).
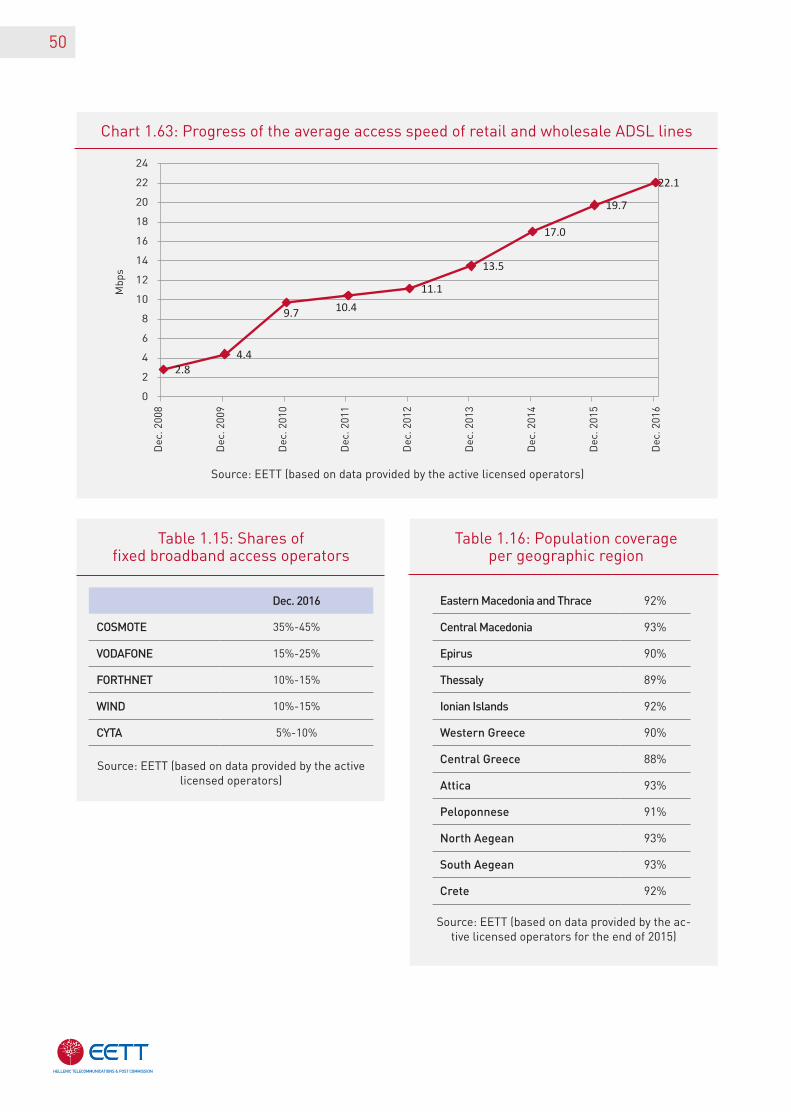
• The average nominal speed of ADSL lines (both retail, which are sold by OTE to its retail custom-ers, and wholesale, which are supplied by OTE to operators in order to provide broadband ac-cess to their retail customers) reached 22Mbps compared to approximately 20Mbps in December 2015), as a result of the increase of VDSL lines volume (Chart 1.63).
• The internet traffic of the fixed broadband access users during 2016 reached an average of 0,46 TB per subscriber.
• Referring to the fixed broadband access provi-ders’ shares, COSMOTE is ahead (35%-45%) fol-lowed by VODAFONE (15%-25%) (Table 1.15).
• The population coverage for every geographic re-gion of the country, in terms of direct broadband access via a certain operator’s network, ranged between 88%-93% (Table 1.16). The situation is expected to improve with the completion of the “rural broadband”projects.
Source: EETT (based on data provided by the active licensed operators)
Chart 1.56: Progress of broadband lines
488,
179 1,01
7,47
5
1,50
6,61
4
1,91
6,63
0
2,25
2,65
3
2,46
4,28
2
2,68
9,42
8
2,91
3,19
1
3,15
6,07
1
3,43
9,03
4
3,61
6,70
5
0
300,000
600,000
900,000
1,200,000
1,500,000
1,800,000
2,100,000
2,400,000
2,700,000
3,000,000
3,300,000
3,600,000
3,900,000
Dec. 2006
Dec. 2007
Dec. 2008
Dec. 2009
Dec. 2010
Dec. 2011
Dec. 2012
Dec. 2013
Dec. 2014
Dec. 2015
Dec. 2016
47
Source: EETT (based on data provided by the active licensed operators)
Source: EETT (based on data provided by the active licensed operators)
Chart 1.57: Progress of LLU lines
Chart 1.58: Progress of VDSL lines
MARKET REVIEW 2016
June
200
6
June
200
7
June
200
8
June
200
9
June
201
0
June
201
1
June
201
2
June
201
3
June
201
4
June
201
5
June
201
6
in t
hous
ands
Full LLU lines Shared LLU lines
1.7%2.1%
2.5%2.8%
3.2%3.5%
4.0%4.5%
5.1%
5.8%
6.5%7.0%
7.5%
0.0%
2.0%
4.0%
6.0%
8.0%
10.0%
0
30
60
90
120
150
180
210
240
270
300
Dec
.201
3
Mar
.20
14
June
2014
Sep
.201
4
Dec
.201
4
Mar
.201
5
June
2015
Sep
.201
5
Dec
.201
5
Mar
.20
16
June
2016
Sep
.20
16
Dec
.20
16
Per
cent
age
of V
DS
L lin
es o
n th
e to
tal b
road
band
line
s
Tota
l VD
SL
lines
(in
thou
sand
s)
Total VDSL lines Percentage of VDSL lines on the total broadband lines
48
Chart 1.59: Breakdown of broadband lines per technology (December 2016)
44.96%
1.34% 0.35%
53.36%
OTE xDSL lines
xDSL lines via LLU
Alternative operators’ xDSL lines via ADSL
Other technology lines
Source: EETT (based on data provided by the active licensed operators)
Source: EETT (based on data provided by the active licensed operators)
Chart 1.60: Progress of broadband lines per technology
1.0
1.5
2.0
2.5
3.0
3.5
Dec
. 200
6
Dec
. 200
7
Dec
. 200
8
Dec
. 200
9
Dec
. 201
0
Dec
. 201
1
Dec
. 201
2
Dec
. 201
3
Dec
. 201
4
Dec
. 201
5
Dec
. 201
6
in m
illio
ns
OTE xDSL lines xDSL lines via LLUAlternative operators’ xDSL lines via ADSL Other technology lines
0.0
0.5
49
Chart 1.61: Breakdown of nominal broadband lines speed (December 2016)
1.6%
10.6%
80.2%
7.6%
2Mbps
2-10Mbps
10-30Mbps
30Mbps
Source: EETT (based on data provided by the active licensed operators)
Source: EETT (based on data provided by the active licensed operators)
Chart 1.62: Progress of broadband lines speed
0%
10%
20%
30%
40%
50%
60%
70%
80%
90%
100%
Dec
. 200
8
Dec
. 200
9
Dec
. 201
0
Dec
. 201
1
Dec
. 201
2
Dec
. 201
3
Dec
. 201
4
Dec
. 201
5
Dec
. 201
6
2 Mbps 2-10 Mbps 10-30 Mbps 30 Mbps
MARKET REVIEW 2016
50
Source: EETT (based on data provided by the active licensed operators)
Source: EETT (based on data provided by the active licensed operators)
Source: EETT (based on data provided by the ac-tive licensed operators for the end of 2015)
Chart 1.63: Progress of the average access speed of retail and wholesale ADSL lines
Table 1.15: Shares of fixed broadband access operators
Table 1.16: Population coverage per geographic region
Dec. 2016
COSMOTE 35%-45%
VODAFONE 15%-25%
FORTHNET 10%-15%
WIND 10%-15%
CYTA 5%-10%
Eastern Macedonia and Thrace 92%
Central Macedonia 93%
Epirus 90%
Thessaly 89%
Ionian Islands 92%
Western Greece 90%
Central Greece 88%
Attica 93%
Peloponnese 91%
North Aegean 93%
South Aegean 93%
Crete 92%
Dec
. 200
8
Dec
. 200
9
Dec
. 201
0
Dec
. 201
1
Dec
. 201
2
Dec
. 201
3
Dec
. 201
4
Dec
. 201
5
Dec
. 201
6
2.84.4
9.7 10.411.1
13.5
17.0
19.7
22.1
0
2
4
6
8
10
12
14
16
18
20
22
24
Mbp
s
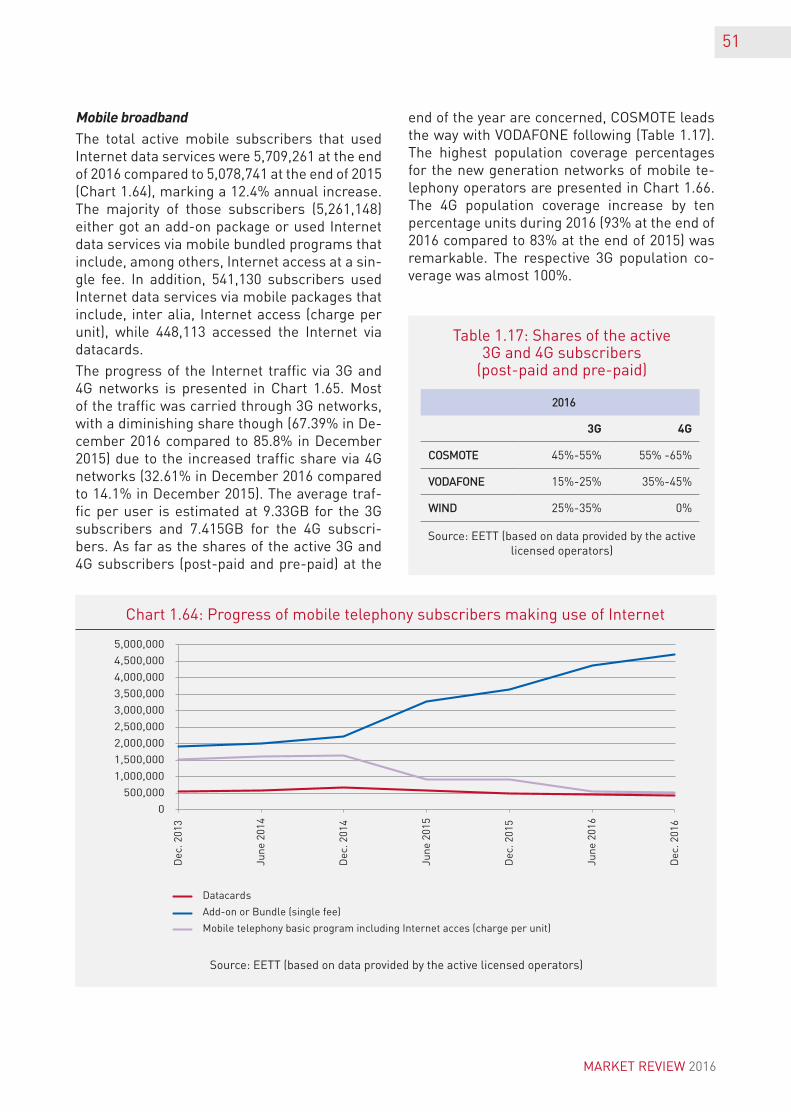
MobilebroadbandThe total active mobile subscribers that used Internet data services were 5,709,261 at the end of 2016 compared to 5,078,741 at the end of 2015 (Chart 1.64), marking a 12.4% annual increase. The majority of those subscribers (5,261,148) either got an add-on package or used Internet data services via mobile bundled programs that include, among others, Internet access at a sin-gle fee. In addition, 541,130 subscribers used Internet data services via mobile packages that include, inter alia, Internet access (charge per unit), while 448,113 accessed the Internet via datacards.
The progress of the Internet traffic via 3G and 4G networks is presented in Chart 1.65. Most of the traffic was carried through 3G networks, with a diminishing share though (67.39% in De-cember 2016 compared to 85.8% in December 2015) due to the increased traffic share via 4G networks (32.61% in December 2016 compared to 14.1% in December 2015). The average traf-fic per user is estimated at 9.33GB for the 3G subscribers and 7.415GB for the 4G subscri-bers. As far as the shares of the active 3G and 4G subscribers (post-paid and pre-paid) at the
end of the year are concerned, COSMOTE leads the way with VODAFONE following (Table 1.17). The highest population coverage percentages for the new generation networks of mobile te-lephony operators are presented in Chart 1.66. The 4G population coverage increase by ten percentage units during 2016 (93% at the end of 2016 compared to 83% at the end of 2015) was remarkable. The respective 3G population co-verage was almost 100%.
51
Source: EETT (based on data provided by the active licensed operators)
Source: EETT (based on data provided by the active licensed operators)
Chart 1.64: Progress of mobile telephony subscribers making use of Internet
Table 1.17: Shares of the active 3G and 4G subscribers
(post-paid and pre-paid)
2016
3G 4G
COSMOTE 45%-55% 55% -65%
VODAFONE 15%-25% 35%-45%
WIND 25%-35% 0%
MARKET REVIEW 2016
0
500,000
1,000,000
1,500,000
2,000,000
2,500,000
3,000,000
3,500,000
4,000,000
4,500,000
5,000,000
Dec
. 201
3
June
201
4
Dec
. 201
4
June
201
5
Dec
. 201
5
June
201
6
Dec
. 201
6
Datacards
Add-on or Bundle (single fee)
Mobile telephony basic program including Internet acces (charge per unit)
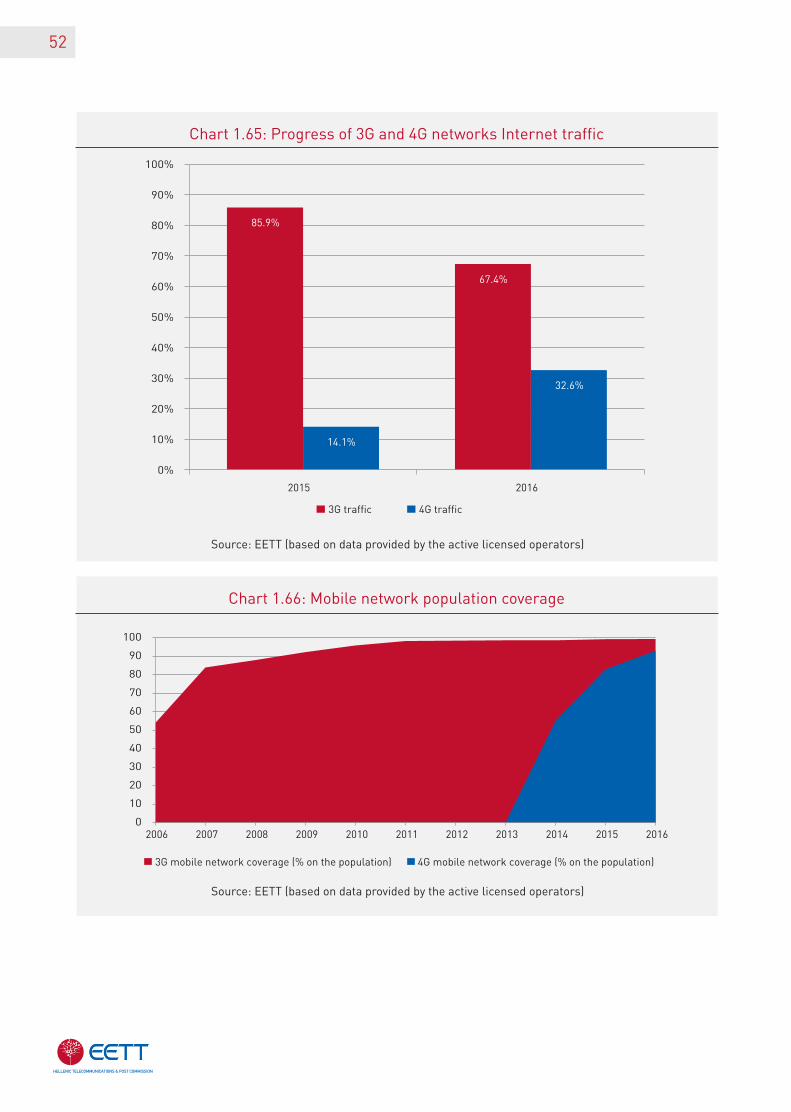
52
Source: EETT (based on data provided by the active licensed operators)
Source: EETT (based on data provided by the active licensed operators)
Chart 1.65: Progress of 3G and 4G networks Internet traffic
Chart 1.66: Mobile network population coverage
85.9%
67.4%
14.1%
32.6%
0%
10%
20%
30%
40%
50%
60%
70%
80%
90%
100%
2015 2016
3G traffic 4G traffic
0
10
20
30
40
50
60
70
80
90
100
2006 2007 2008 2009 2010 2011 2012 2013 2014 2015 2016
3G mobile network coverage (% on the population) 4G mobile network coverage (% on the population)
53
1.2.6. Pay TV
Pay TV users (IPTV and satellite) increased by 2.1% exceeding one million (Chart 1.67) with the respective shares shown in Table 1.18.
1.2.7. Bundled offers
Bundled offers (bundles16) are available in the Greek market mainly by the companies OTE-COSMOTE, VODAFONE-HOL17, WIND, CYTA and FORTHNET-FORTHNET MEDIA. The combina-tion “Fixed telephony” and “Fixed broadband In-ternet” were mainly provided by the companies OTE, VODAFONE-HOL, WIND, CYTA and FORTH-NET, television services were provided by OTE, FORTHNET-FORTHNET MEDIA, VODAFONE-HOL and CYTA, while bundled offers with mo-bile services were provided by OTE-COSMOTE, VODAFONE-HOL, WIND and CYTA18.
It is pointed out that, fixed telephony, fixed broadband Internet and Pay TV are services
mainly addressed to the household in case of residential bundled offers (or to the company in case of business ones), while the mobile post-paid connections, that may be part of the bun-dles, refer mainly to personalized/personal ser-vices.
The basic conclusions for 2016 (end of the year) are the following:
• Bundled offers reached 3,572,789 increased by 205 thousand compared to 2015, while on the other hand and for the same period un-bundled fixed telephony subscriptions de-creased by almost 193 thousand (Chart 1.68).
• Double play offers were the most popular ones, since throughout the years six out of ten bundled offers were such. Triple play offers play a decisive role accounting for 35.3% of the total, while quad play subscriptions, that amount to 138 thousand and make up 4% of the total, are gradually becoming more impor-tant (Chart 1.69).
• The most popular bundled offer was the fixed telephony and fixed broadband Internet double play, with approximately 2.1 million subscrip-tions followed by the triple play combinations of (a) fixed telephony, Pay TV and Internet and (b) fixed telephony, Internet, mobile service(s) (approximately equal at 630 thousand), and then by the quad play combination (Chart 1.70).
• In 2016, double play subscribers of fixed te-lephony and fixed broadband Internet in-creased by 196 thousand compared to 2015, while the ones that bought fixed telephony as an unbundled service decreased by 193 thou-sand during the same time. (Chart 1.71)
Source: EETT (based on data provided by the active licensed operators)
Table 1.18: Shares of Pay TV operatorsbased on subscribers
2015 2016
FORTHNET/NOVA 45%-55% 35%-45%
OTE 45%-55% 45%-55%
VODAFONE - 5%-10%
CYTA 0%-5% 0%-5%
HOL 0%-5% -
16. Please note that “bundled offers” are commercial offers by one or more operators for the provision of two or more of the following four services: “Fixed telephony”, “Fixed broadband Internet”, “Pay TV” and “Mobile service”. It is further clarified that: a) The term “Pay TV” refers exclusively to the provision of TV services via broadband and satellite connection. Mobile TV is not included.b) The term “mobile service” refers to mobile telephony or/and mobile broadband Internet, without distinguishing between computer-based and handset-based access. Only the two aforementioned mobile communication services are taken into account but as a single service (whether the operator provides one or both of them).(c) Bundled offers may be either (a) pure bundles or (b) tied and tying service bundles or (c) mixed bundles, in which the operator or operators offer some kind of incentive to customers to entice them to select the bundled (combined) purchase of these services, usually under some kind of “permanent favourable terms” (i.e. favourable terms applicable for the entire duration of the bundled offer). These terms are not applicable when the customer purchases the services separately (not in bundled/combined form). 17. It is noted that HOL was acquired by VODAFONE on 01-04-2016.18. It should be mentioned that based on the definition used for bundled offers, one or more operators (either individual companies or/and companies-members of the same group) may provide such offers. In addition, given that such an offer includes by definition at least one service rendered at a fixed location, all the calculations of the current paragraph (unless otherwise stated), are based on the number of fixed subscriptions. So, a fixed telephony and broadband Internet subscription that is bundled with three SIM mobile cards is counted as one bundled offer.
MARKET REVIEW 2016
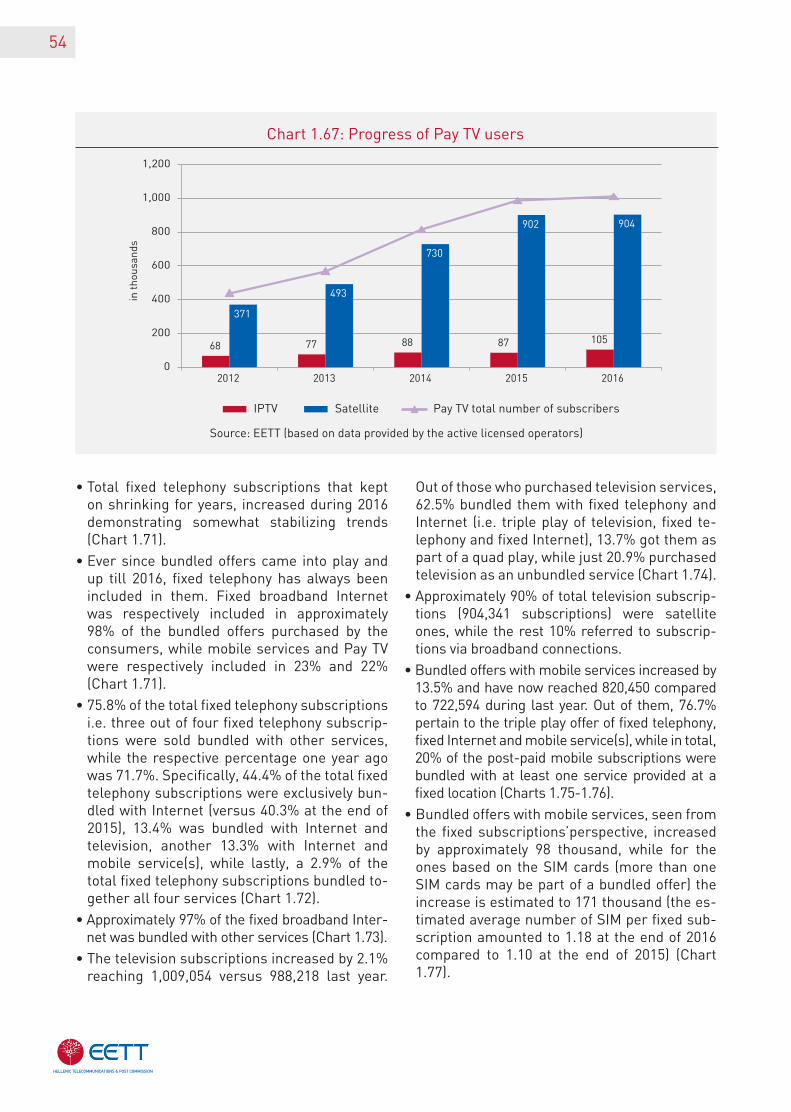
54
Source: EETT (based on data provided by the active licensed operators)
Chart 1.67: Progress of Pay TV users
• Total fixed telephony subscriptions that kept on shrinking for years, increased during 2016 demonstrating somewhat stabilizing trends (Chart 1.71).
• Ever since bundled offers came into play and up till 2016, fixed telephony has always been included in them. Fixed broadband Internet was respectively included in approximately 98% of the bundled offers purchased by the consumers, while mobile services and Pay TV were respectively included in 23% and 22% (Chart 1.71).
• 75.8% of the total fixed telephony subscriptions i.e. three out of four fixed telephony subscrip-tions were sold bundled with other services, while the respective percentage one year ago was 71.7%. Specifically, 44.4% of the total fixed telephony subscriptions were exclusively bun-dled with Internet (versus 40.3% at the end of 2015), 13.4% was bundled with Internet and television, another 13.3% with Internet and mobile service(s), while lastly, a 2.9% of the total fixed telephony subscriptions bundled to-gether all four services (Chart 1.72).
• Approximately 97% of the fixed broadband Inter-net was bundled with other services (Chart 1.73).
• The television subscriptions increased by 2.1% reaching 1,009,054 versus 988,218 last year.
Out of those who purchased television services, 62.5% bundled them with fixed telephony and Internet (i.e. triple play of television, fixed te-lephony and fixed Internet), 13.7% got them as part of a quad play, while just 20.9% purchased television as an unbundled service (Chart 1.74).
• Approximately 90% of total television subscrip-tions (904,341 subscriptions) were satellite ones, while the rest 10% referred to subscrip-tions via broadband connections.
• Bundled offers with mobile services increased by 13.5% and have now reached 820,450 compared to 722,594 during last year. Out of them, 76.7% pertain to the triple play offer of fixed telephony, fixed Internet and mobile service(s), while in total, 20% of the post-paid mobile subscriptions were bundled with at least one service provided at a fixed location (Charts 1.75-1.76).
• Bundled offers with mobile services, seen from the fixed subscriptions’perspective, increased by approximately 98 thousand, while for the ones based on the SIM cards (more than one SIM cards may be part of a bundled offer) the increase is estimated to 171 thousand (the es-timated average number of SIM per fixed sub-scription amounted to 1.18 at the end of 2016 compared to 1.10 at the end of 2015) (Chart 1.77).
68 77 88 87 105
371
493
730
902 904
0
200
400
600
800
1,000
1,200
2012 2013 2014 2015 2016
in t
hous
ands
IPTV Satellite Pay TV total number of subscribers
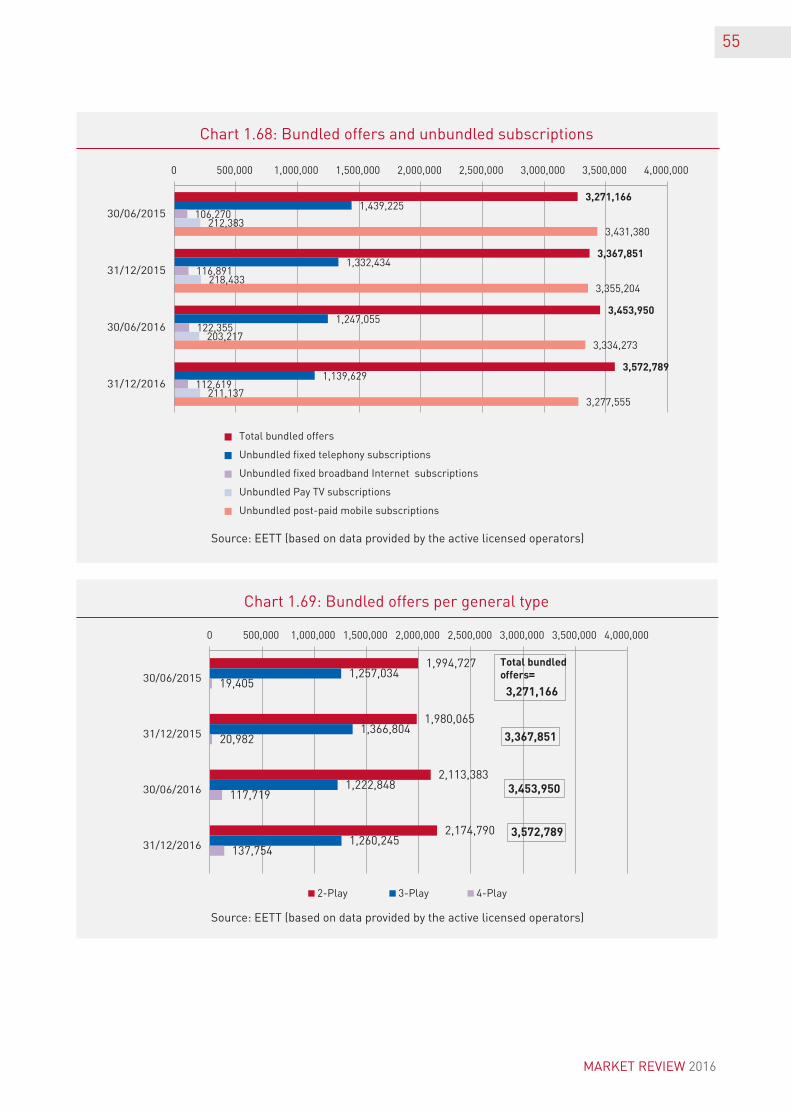
55
Source: EETT (based on data provided by the active licensed operators)
Chart 1.68: Bundled offers and unbundled subscriptions
3,271,166
3,367,851
3,453,950
3,572,789
1,439,225
1,332,434
1,247,055
1,139,629
106,270
116,891
122,355
112,619
212,383
218,433
203,217
211,137
3,431,380
3,355,204
3,334,273
3,277,555
0 500,000 1,000,000 1,500,000 2,000,000 2,500,000 3,000,000 3,500,000 4,000,000
30/06/2015
31/12/2015
30/06/2016
31/12/2016
Total bundled offers
Unbundled fixed telephony subscriptions
Unbundled fixed broadband Internet subscriptions
Unbundled Pay TV subscriptions
Unbundled post-paid mobile subscriptions
MARKET REVIEW 2016
Source: EETT (based on data provided by the active licensed operators)
Chart 1.69: Bundled offers per general type
1,994,727
1,980,065
2,113,383
2,174,790
1,257,034
1,366,804
1,222,848
1,260,245
19,405
20,982
117,719
137,754
=3,271,166
3,367,851
3,453,950
3,572,789
0 500,000 1,000,000 1,500,000 2,000,000 2,500,000 3,000,000 3,500,000 4,000,000
30/06/2015
31/12/2015
30/06/2016
31/12/2016
2-Play 3-Play 4-Play
Totalbundledoffers
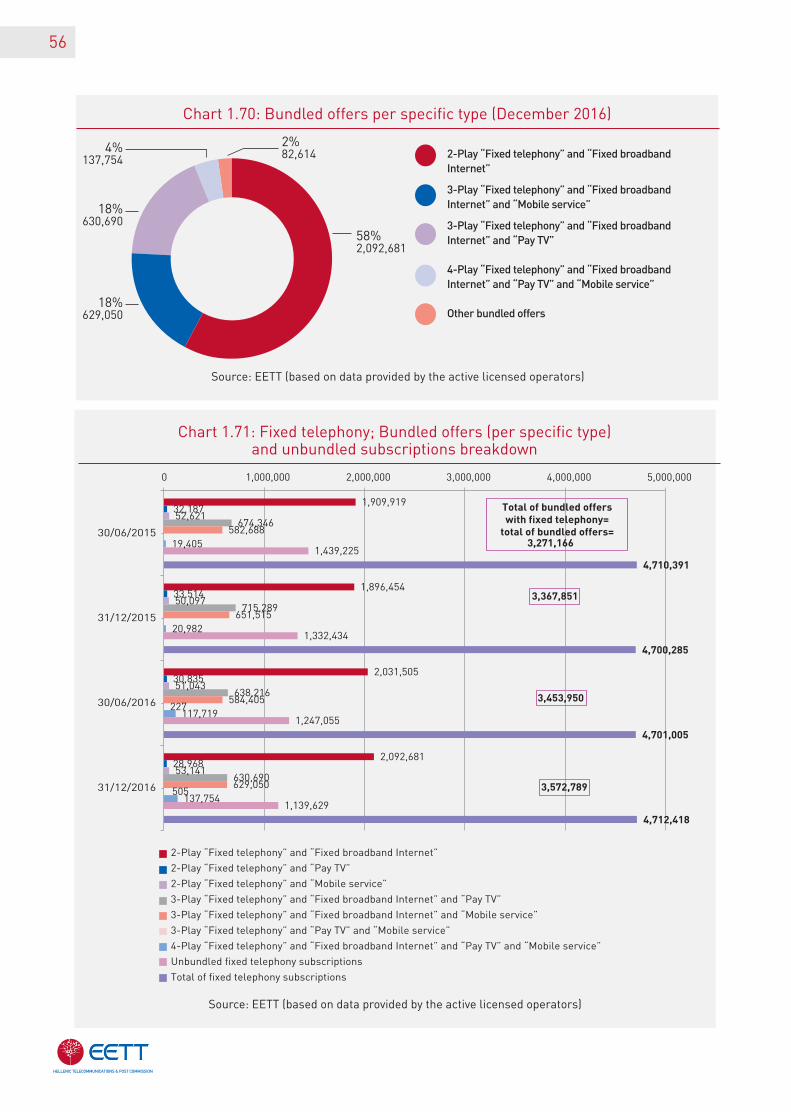
56
Chart 1.71: Fixed telephony; Bundled offers (per specific type)and unbundled subscriptions breakdown
Source: EETT (based on data provided by the active licensed operators)
Chart 1.70: Bundled offers per specific type (December 2016)
58%2,092,681
4%137,754
2%82,614
18%629,050
18%630,690
2-Play “Fixed telephony” and “Fixed broadband Internet”
3-Play “Fixed telephony” and “Fixed broadband Internet” and “Mobile service”
3-Play “Fixed telephony” and “Fixed broadband Internet” and “Pay TV”
4-Play “Fixed telephony” and “Fixed broadband Internet” and “Pay TV” and “Mobile service”
Other bundled offers
Source: EETT (based on data provided by the active licensed operators)
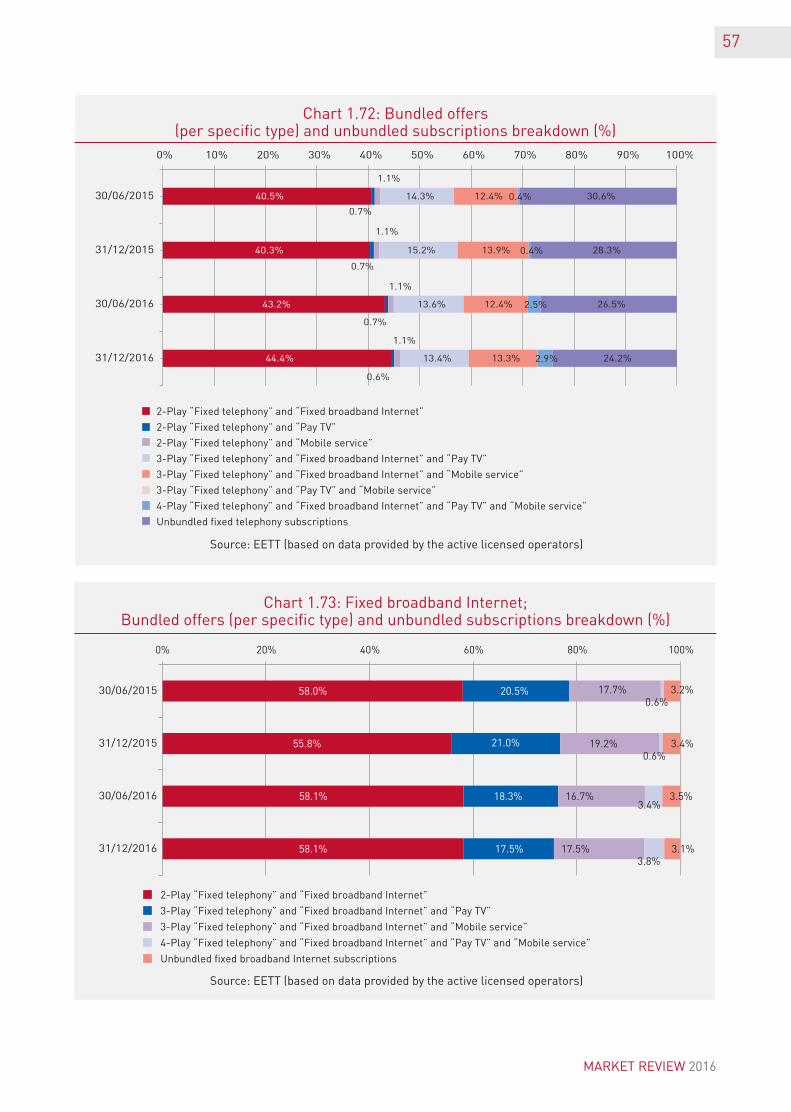
57
MARKET REVIEW 2016
Source: EETT (based on data provided by the active licensed operators)
Source: EETT (based on data provided by the active licensed operators)
Chart 1.72: Bundled offers (per specific type) and unbundled subscriptions breakdown (%)
Chart 1.73: Fixed broadband Internet; Bundled offers (per specific type) and unbundled subscriptions breakdown (%)
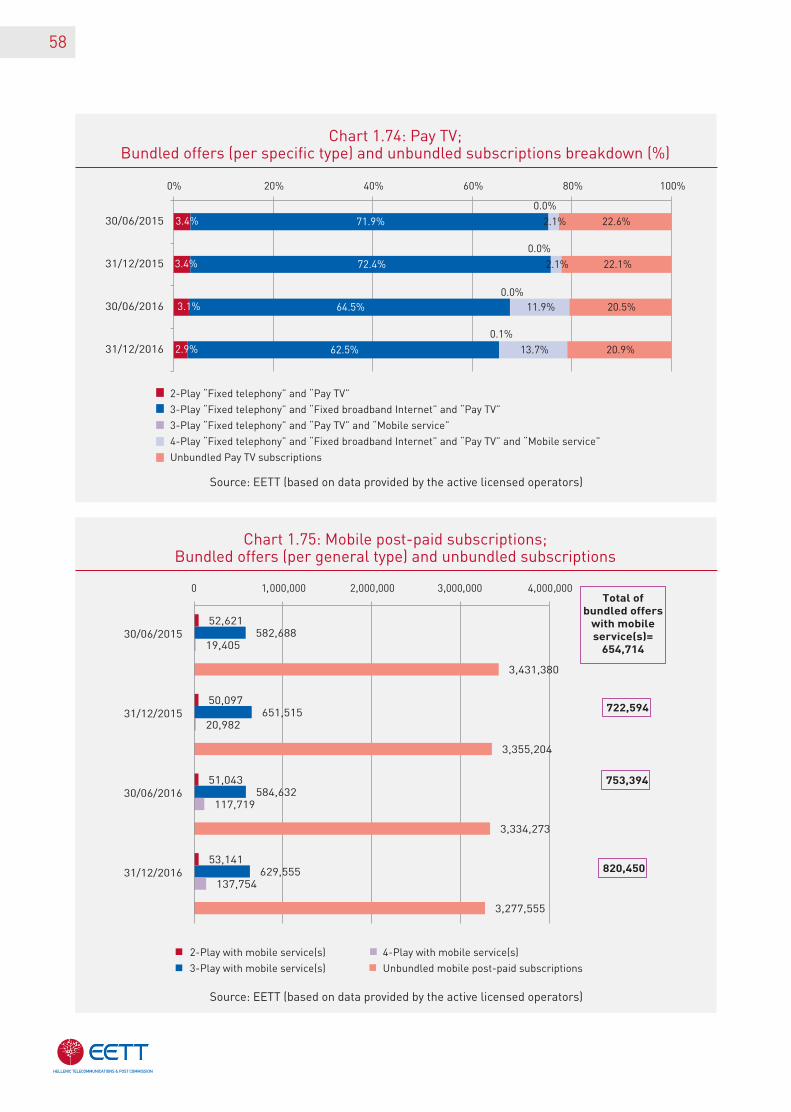
58
Source: EETT (based on data provided by the active licensed operators)
Source: EETT (based on data provided by the active licensed operators)
Chart 1.74: Pay TV; Bundled offers (per specific type) and unbundled subscriptions breakdown (%)
Chart 1.75: Mobile post-paid subscriptions; Bundled offers (per general type) and unbundled subscriptions
3.4%
3.4%
3.1%
2.9%
71.9%
72.4%
64.5%
62.5%
0.0%
0.0%
0.0%
0.1%
2.1%
2.1%
11.9%
13.7%
22.6%
22.1%
20.5%
20.9%
0% 20% 40% 60% 80% 100%
30/06/2015
31/12/2015
30/06/2016
31/12/2016
2-Play “Fixed telephony” and “Pay TV”
3-Play “Fixed telephony” and “Fixed broadband Internet” and “Pay TV”
3-Play “Fixed telephony” and “Pay TV” and “Mobile service”
4-Play “Fixed telephony” and “Fixed broadband Internet” and “Pay TV” and “Mobile service”
Unbundled Pay TV subscriptions
52,621
50,097
51,043
53,141
582,688
651,515
584,632
629,555
19,405
20,982
117,719
137,754
722,594
753,394
820,450
3,431,380
3,355,204
3,334,273
3,277,555
30/06/2015
31/12/2015
30/06/2016
31/12/2016
2-Play with mobile service(s)
3-Play with mobile service(s)
4-Play with mobile service(s)
Unbundled mobile post-paid subscriptions
Totalofbundledofferswithmobileservice(s)=654,714
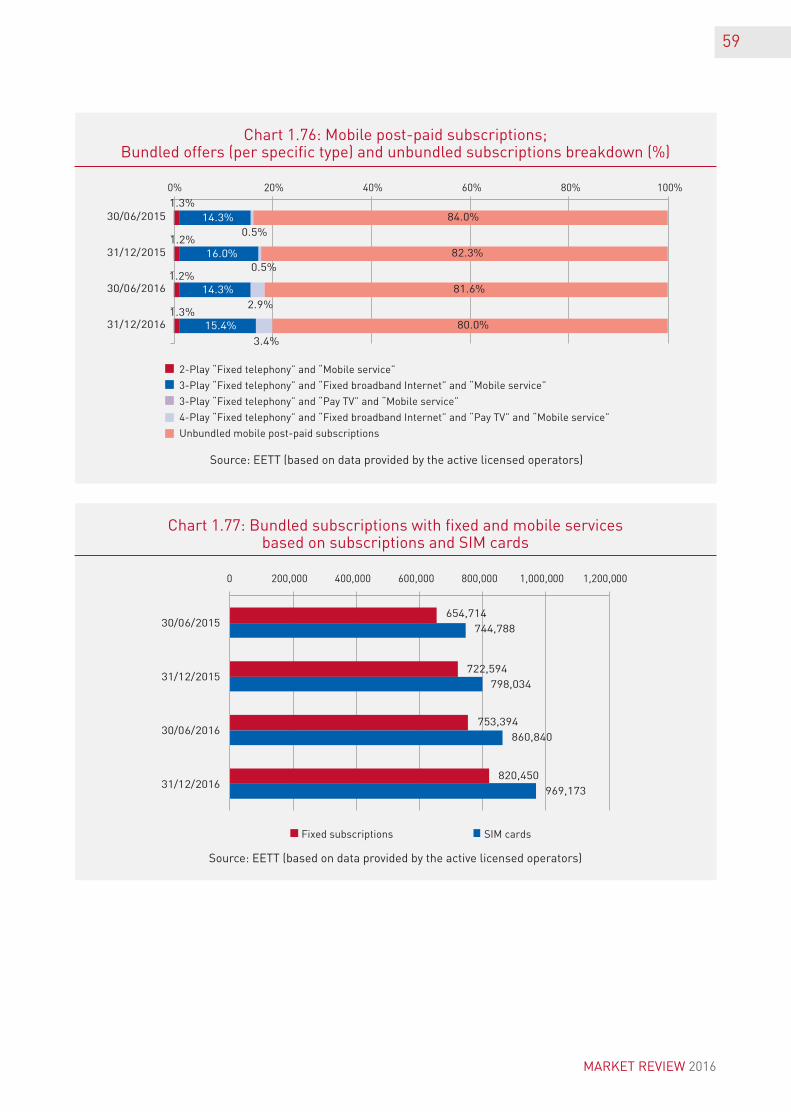
59
MARKET REVIEW 2016
Source: EETT (based on data provided by the active licensed operators)
Source: EETT (based on data provided by the active licensed operators)
Chart 1.76: Mobile post-paid subscriptions; Bundled offers (per specific type) and unbundled subscriptions breakdown (%)
Chart 1.77: Bundled subscriptions with fixed and mobile services based on subscriptions and SIM cards
1.3%
1.2%
1.2%
1.3%
14.3%
16.0%
14.3%
15.4%
0.5%
0.5%
2.9%
3.4%
84.0%
82.3%
81.6%
80.0%
30/06/2015
31/12/2015
30/06/2016
31/12/2016
2-Play “Fixed telephony” and “Mobile service”
3-Play “Fixed telephony” and “Fixed broadband Internet” and “Mobile service”
3-Play “Fixed telephony” and “Pay TV” and “Mobile service”
4-Play “Fixed telephony” and “Fixed broadband Internet” and “Pay TV” and “Mobile service”
Unbundled mobile post-paid subscriptions
654,714
722,594
753,394
820,450
744,788
798,034
860,840
969,173
0 200,000 400,000 600,000 800,000 1,000,000 1,200,000
30/06/2015
31/12/2015
30/06/2016
31/12/2016
Fixed subscriptions SIM cards
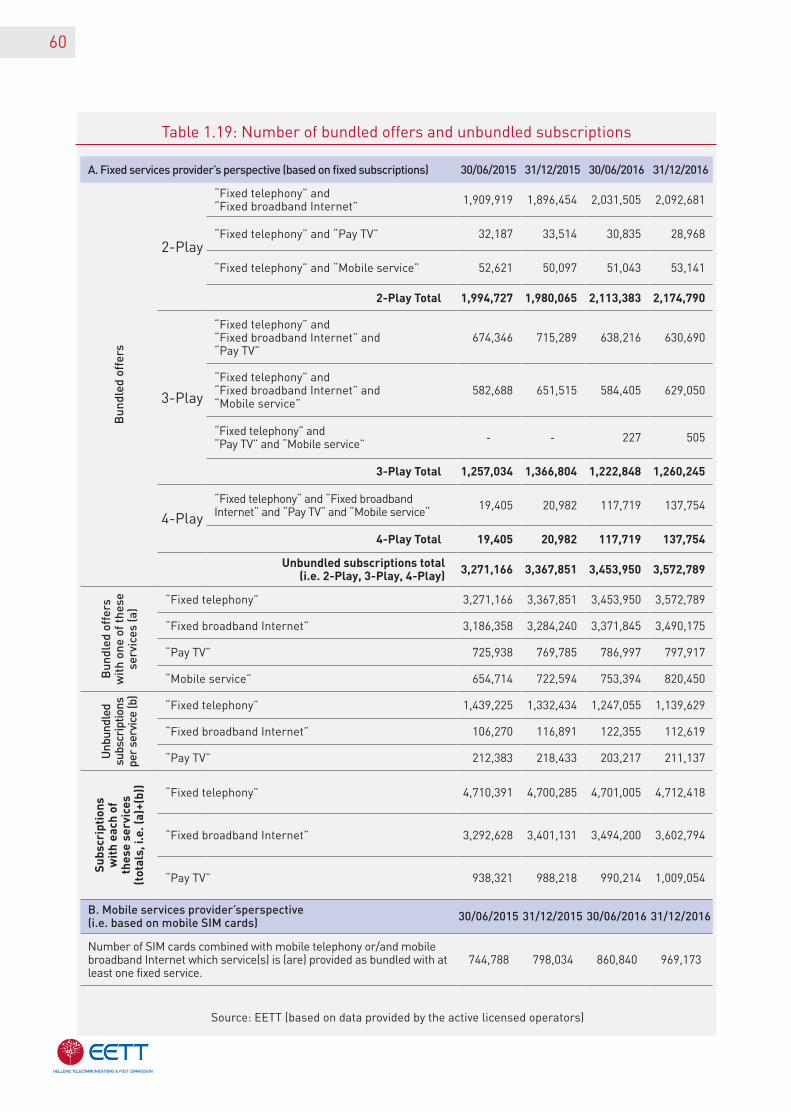
60
A. Fixed services provider’s perspective (based on fixed subscriptions) 30/06/2015 31/12/2015 30/06/2016 31/12/2016
Bun
dled
off
ers
2-Play
“Fixed telephony” and “Fixed broadband Internet” 1,909,919 1,896,454 2,031,505 2,092,681
“Fixed telephony” and “Pay TV” 32,187 33,514 30,835 28,968
“Fixed telephony” and “Mobile service” 52,621 50,097 51,043 53,141
2-PlayTotal 1,994,727 1,980,065 2,113,383 2,174,790
3-Play
“Fixed telephony” and “Fixed broadband Internet” and “Pay TV”
674,346 715,289 638,216 630,690
“Fixed telephony” and “Fixed broadband Internet” and “Mobile service”
582,688 651,515 584,405 629,050
“Fixed telephony” and “Pay TV” and “Mobile service” - - 227 505
3-PlayTotal 1,257,034 1,366,804 1,222,848 1,260,245
4-Play“Fixed telephony“ and “Fixed broadband Internet“ and “Pay TV“ and “Mobile service“ 19,405 20,982 117,719 137,754
4-PlayTotal 19,405 20,982 117,719 137,754
Unbundledsubscriptionstotal(i.e.2-Play,3-Play,4-Play) 3,271,166 3,367,851 3,453,950 3,572,789
Bun
dled
off
ers
wit
h on
e of
the
se
serv
ices
(a)
“Fixed telephony” 3,271,166 3,367,851 3,453,950 3,572,789
“Fixed broadband Internet” 3,186,358 3,284,240 3,371,845 3,490,175
“Pay TV” 725,938 769,785 786,997 797,917
“Mobile service” 654,714 722,594 753,394 820,450
Unb
undl
ed
subs
crip
tions
pe
r se
rvic
e (b
)
“Fixed telephony” 1,439,225 1,332,434 1,247,055 1,139,629
“Fixed broadband Internet” 106,270 116,891 122,355 112,619
“Pay TV” 212,383 218,433 203,217 211,137
Sub
scriptions
witheachof
theseservices
(totals,i.e.(a
)+(b)) “Fixed telephony” 4,710,391 4,700,285 4,701,005 4,712,418
“Fixed broadband Internet” 3,292,628 3,401,131 3,494,200 3,602,794
“Pay TV” 938,321 988,218 990,214 1,009,054
B. Mobile services provider’sperspective (i.e. based on mobile SIM cards) 30/06/2015 31/12/2015 30/06/2016 31/12/2016
Number of SIM cards combined with mobile telephony or/and mobile broadband Internet which service(s) is (are) provided as bundled with at least one fixed service.
744,788 798,034 860,840 969,173
Table 1.19: Number of bundled offers and unbundled subscriptions
Source: EETT (based on data provided by the active licensed operators)
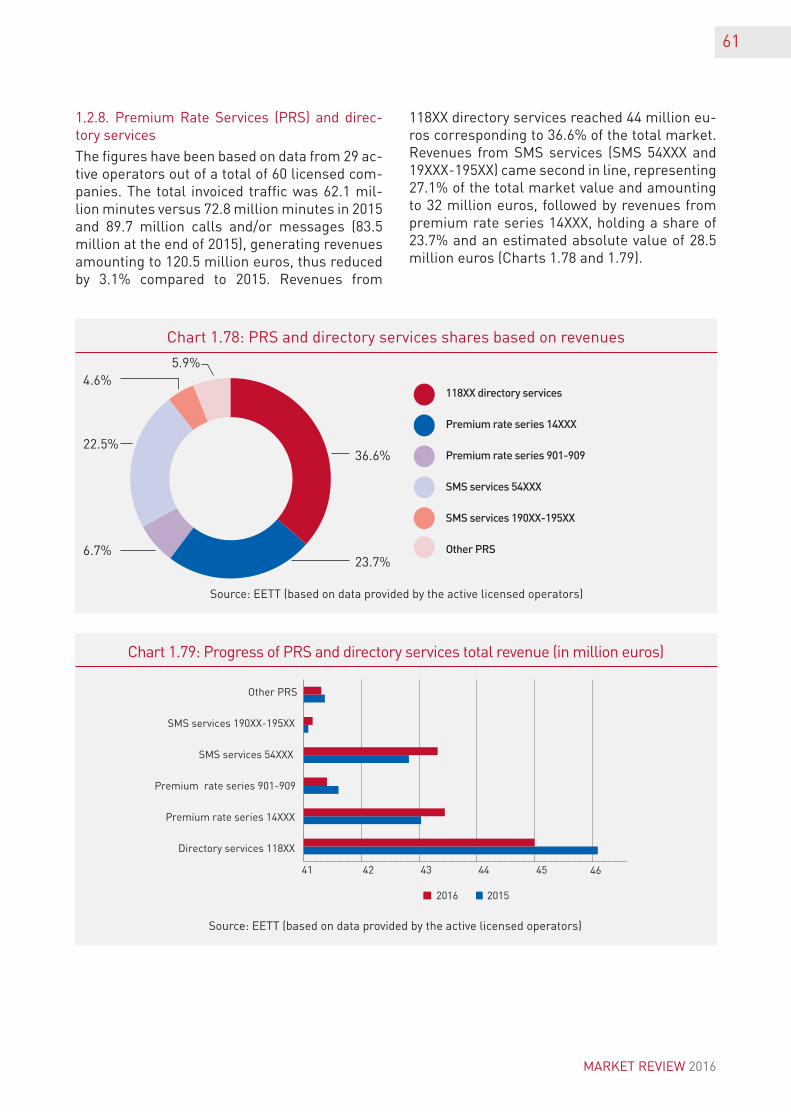
61
MARKET REVIEW 2016
1.2.8. Premium Rate Services (PRS) and direc-tory services
The figures have been based on data from 29 ac-tive operators out of a total of 60 licensed com-panies. The total invoiced traffic was 62.1 mil-lion minutes versus 72.8 million minutes in 2015 and 89.7 million calls and/or messages (83.5 million at the end of 2015), generating revenues amounting to 120.5 million euros, thus reduced by 3.1% compared to 2015. Revenues from
118XX directory services reached 44 million eu-ros corresponding to 36.6% of the total market. Revenues from SMS services (SMS 54XXX and 19XXX-195XX) came second in line, representing 27.1% of the total market value and amounting to 32 million euros, followed by revenues from premium rate series 14XXX, holding a share of 23.7% and an estimated absolute value of 28.5 million euros (Charts 1.78 and 1.79).
Chart 1.78: PRS and directory services shares based on revenues
Chart 1.79: Progress of PRS and directory services total revenue (in million euros)
36.6%
23.7%
5.9%4.6%
22.5%
6.7%
118XX directory services
Premium rate series 14XXX
Premium rate series 901-909
SMS services 54XXX
SMS services 190XX-195XX
Other PRS
Source: EETT (based on data provided by the active licensed operators)
Source: EETT (based on data provided by the active licensed operators)
4641 42 43 44 45
2016 2015
Other PRS
SMS services 190XX-195XX
SMS services 54XXX
Premium rate series 901-909
Premium rate series 14XXX
Directory services 118XX
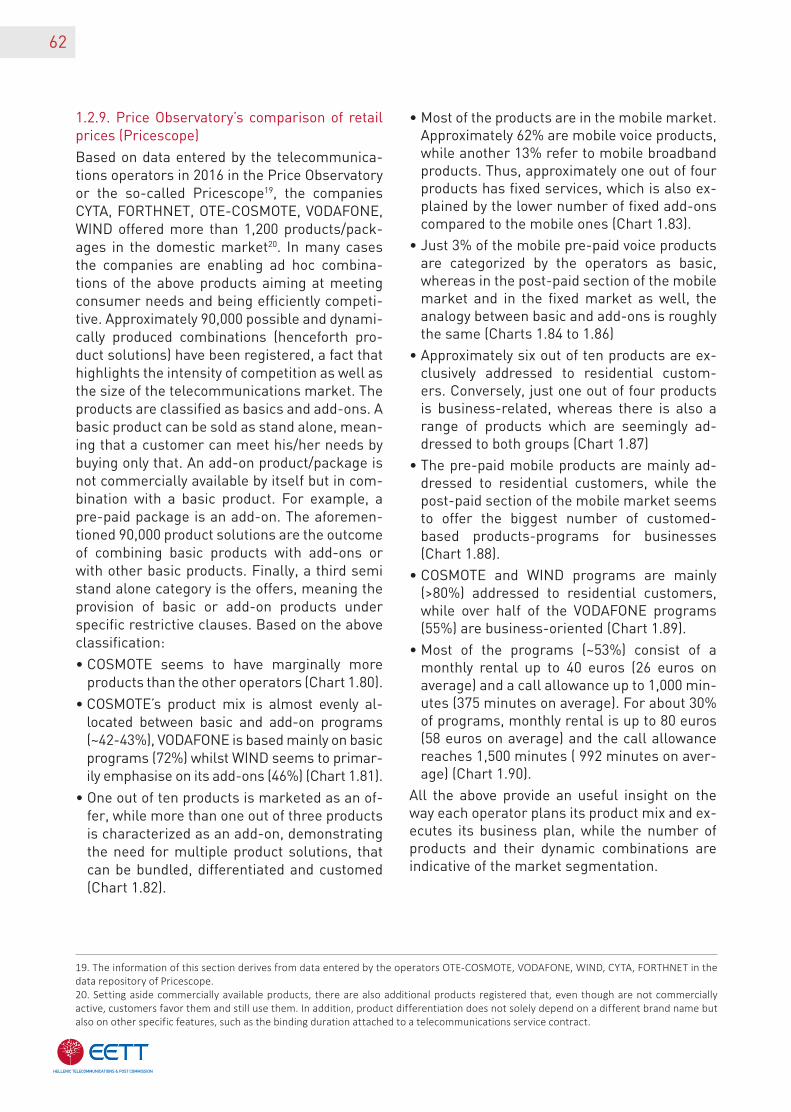
62
1.2.9. Price Observatory’s comparison of retail prices (Pricescope)
Based on data entered by the telecommunica-tions operators in 2016 in the Price Observatory or the so-called Pricescope19, the companies CYTA, FORTHNET, OTE-COSMOTE, VODAFONE, WIND offered more than 1,200 products/pack-ages in the domestic market20. In many cases the companies are enabling ad hoc combina-tions of the above products aiming at meeting consumer needs and being efficiently competi-tive. Approximately 90,000 possible and dynami-cally produced combinations (henceforth pro-duct solutions) have been registered, a fact that highlights the intensity of competition as well as the size of the telecommunications market. The products are classified as basics and add-ons. A basic product can be sold as stand alone, mean-ing that a customer can meet his/her needs by buying only that. An add-on product/package is not commercially available by itself but in com-bination with a basic product. For example, a pre-paid package is an add-on. The aforemen-tioned 90,000 product solutions are the outcome of combining basic products with add-ons or with other basic products. Finally, a third semi stand alone category is the offers, meaning the provision of basic or add-on products under specific restrictive clauses. Based on the above classification:
• COSMOTE seems to have marginally more products than the other operators (Chart 1.80).
• COSMOTE’s product mix is almost evenly al-located between basic and add-on programs (~42-43%), VODAFONE is based mainly on basic programs (72%) whilst WIND seems to primar-ily emphasise on its add-ons (46%) (Chart 1.81).
• One out of ten products is marketed as an of-fer, while more than one out of three products is characterized as an add-on, demonstrating the need for multiple product solutions, that can be bundled, differentiated and customed (Chart 1.82).
• Most of the products are in the mobile market. Approximately 62% are mobile voice products, while another 13% refer to mobile broadband products. Thus, approximately one out of four products has fixed services, which is also ex-plained by the lower number of fixed add-ons compared to the mobile ones (Chart 1.83).
• Just 3% of the mobile pre-paid voice products are categorized by the operators as basic, whereas in the post-paid section of the mobile market and in the fixed market as well, the analogy between basic and add-ons is roughly the same (Charts 1.84 to 1.86)
• Approximately six out of ten products are ex-clusively addressed to residential custom-ers. Conversely, just one out of four products is business-related, whereas there is also a range of products which are seemingly ad-dressed to both groups (Chart 1.87)
• The pre-paid mobile products are mainly ad-dressed to residential customers, while the post-paid section of the mobile market seems to offer the biggest number of customed-based products-programs for businesses (Chart 1.88).
• COSMOTE and WIND programs are mainly (>80%) addressed to residential customers, while over half of the VODAFONE programs (55%) are business-oriented (Chart 1.89).
• Most of the programs (~53%) consist of a monthly rental up to 40 euros (26 euros on ave rage) and a call allowance up to 1,000 min-utes (375 minutes on average). For about 30% of programs, monthly rental is up to 80 euros (58 euros on average) and the call allowance reaches 1,500 minutes ( 992 minutes on aver-age) (Chart 1.90).
All the above provide an useful insight on the way each operator plans its product mix and ex-ecutes its business plan, while the number of products and their dynamic combinations are indicative of the market segmentation.
19. The information of this section derives from data entered by the operators OTE-COSMOTE, VODAFONE, WIND, CYTA, FORTHNET in the data repository of Pricescope. 20. Setting aside commercially available products, there are also additional products registered that, even though are not commercially active, customers favor them and still use them. In addition, product differentiation does not solely depend on a different brand name but also on other specific features, such as the binding duration attached to a telecommunications service contract.
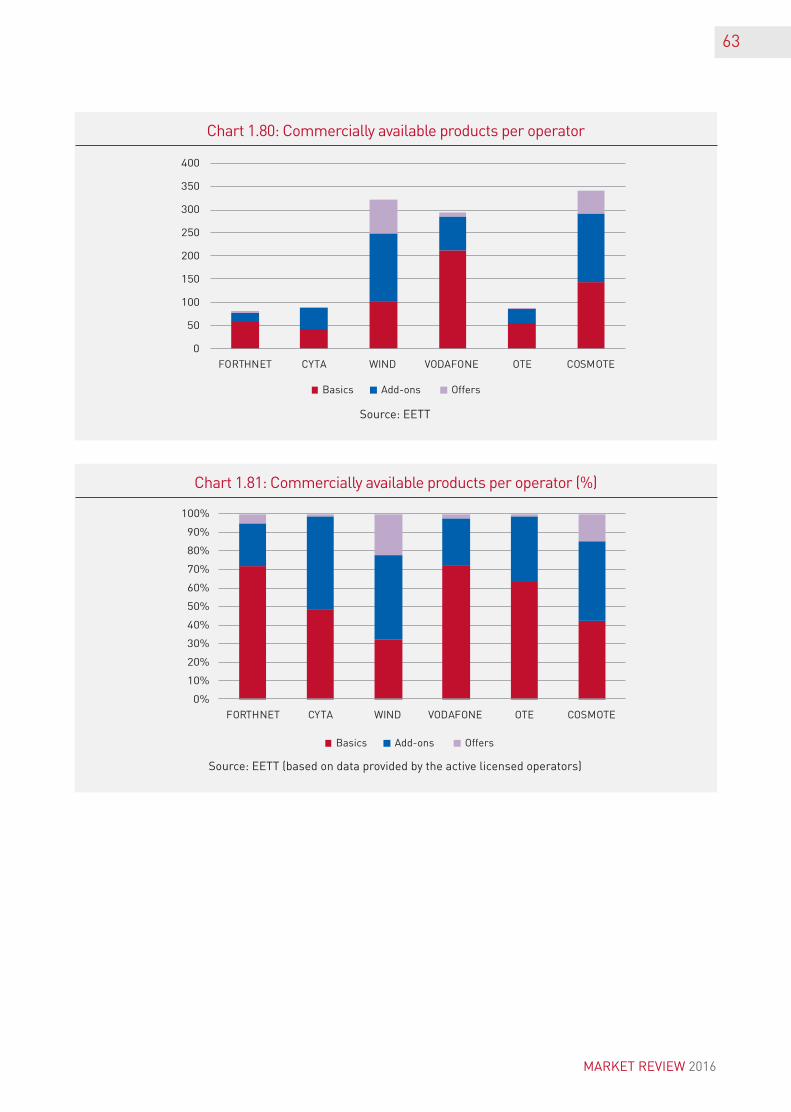
63
MARKET REVIEW 2016
Chart 1.80: Commercially available products per operator
Chart 1.81: Commercially available products per operator (%)
Source: EETT
Source: EETT (based on data provided by the active licensed operators)
0
50
100
150
200
250
300
350
400
COSMOTEOTEVODAFONEWINDCYTAFORTHNET
Basics Add-ons Offers
Basics Add-ons Offers
0%
10%
20%
30%
40%
50%
60%
70%
80%
90%
100%
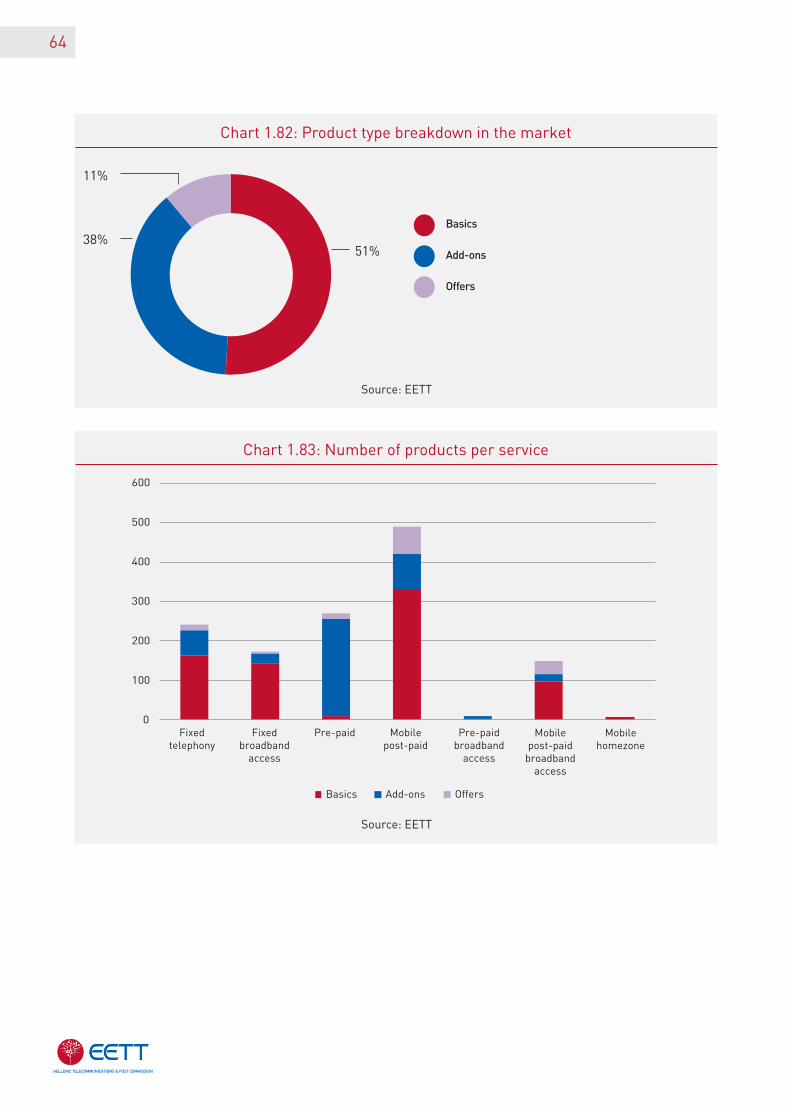
64
Chart 1.82: Product type breakdown in the market
Chart 1.83: Number of products per service
51%
11%
38%Basics
Add-ons
Offers
Source: EETT
Source: EETT
Basics Add-ons Offers
0
100
200
300
400
500
600
Fixedtelephony
Fixedbroadband
access
Mobilepost-paid
Pre-paidbroadband
access
Pre-paid Mobile post-paid
broadband access
Mobile homezone
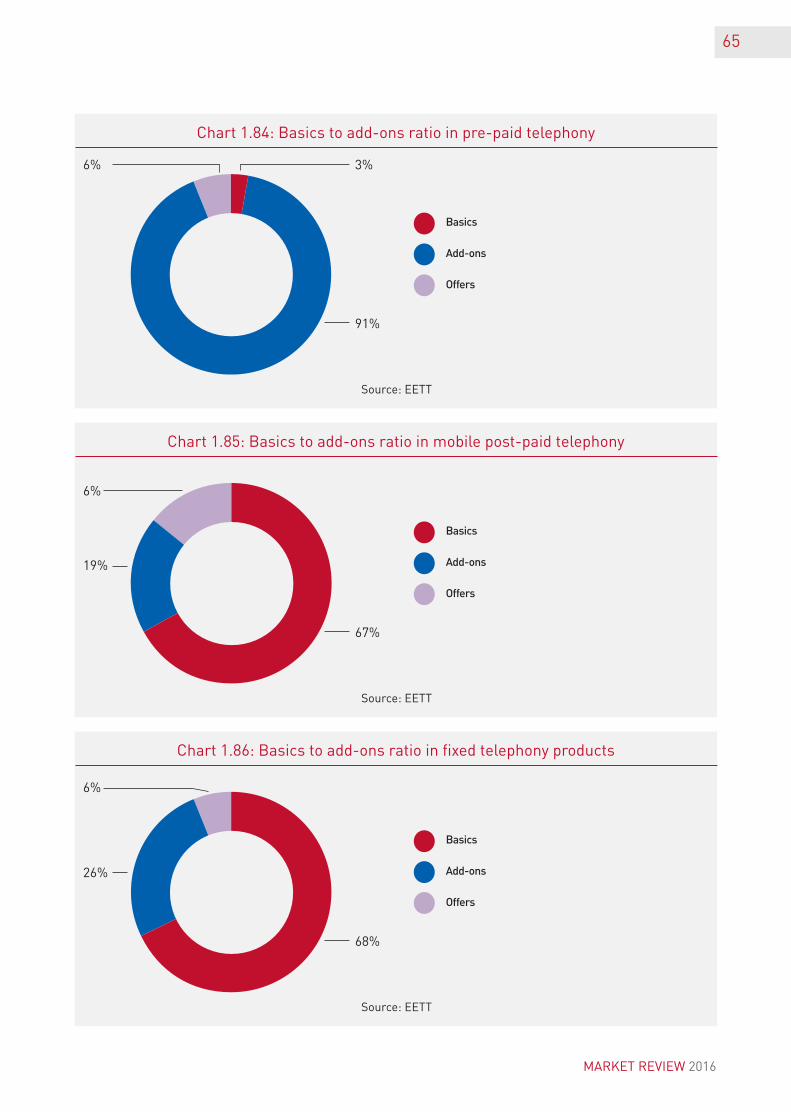
65
MARKET REVIEW 2016
Chart 1.84: Basics to add-ons ratio in pre-paid telephony
Chart 1.85: Basics to add-ons ratio in mobile post-paid telephony
Chart 1.86: Basics to add-ons ratio in fixed telephony products
3%
91%
67%
68%
6%
6%
19%
6%
26%
Basics
Add-ons
Offers
Basics
Add-ons
Offers
Basics
Add-ons
Offers
Source: EETT
Source: EETT
Source: EETT
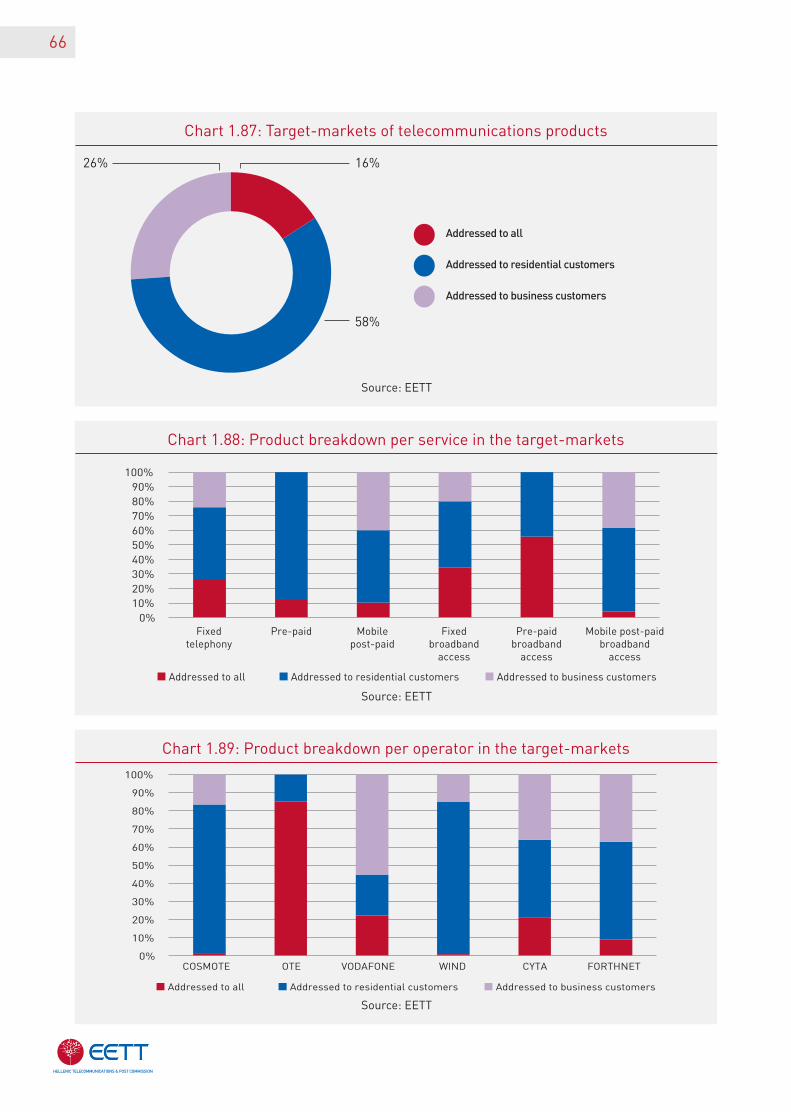
66
Chart 1.87: Target-markets of telecommunications products
Chart 1.88: Product breakdown per service in the target-markets
Chart 1.89: Product breakdown per operator in the target-markets
16%
58%
26%
Addressed to all
Addressed to residential customers
Addressed to business customers
Source: EETT
Source: EETT
Source: EETT
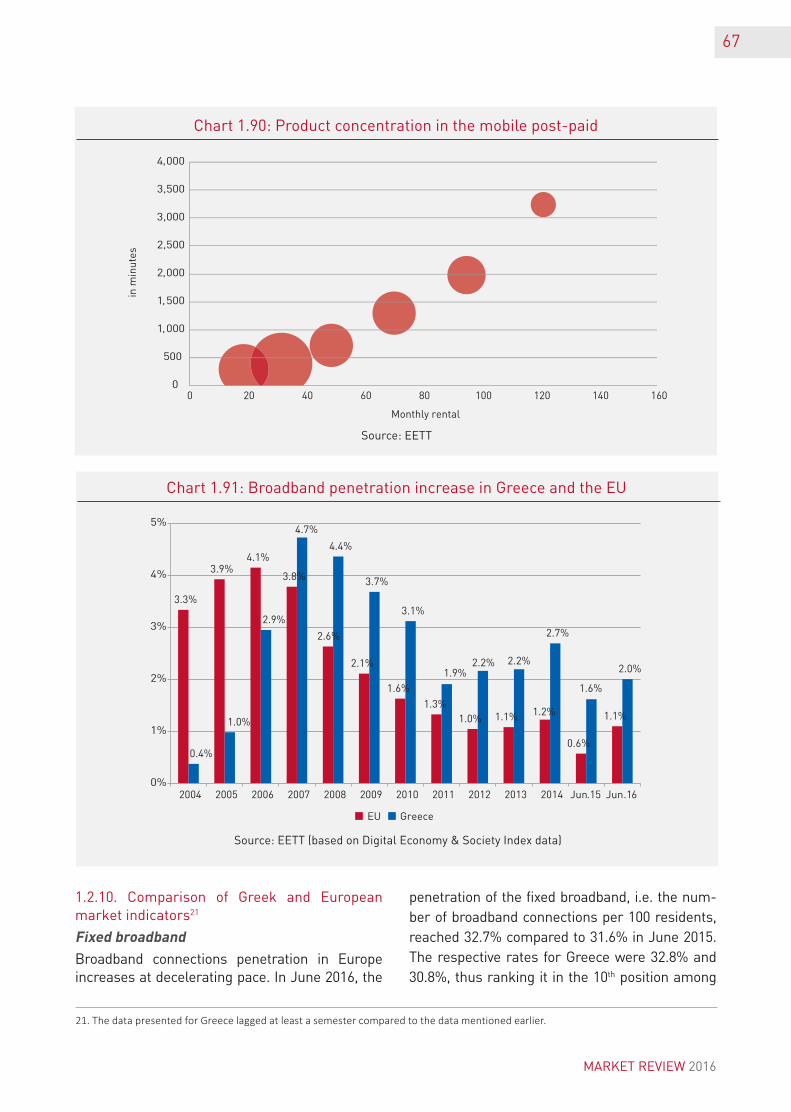
67
MARKET REVIEW 2016
Chart 1.90: Product concentration in the mobile post-paid
Chart 1.91: Broadband penetration increase in Greece and the EU
Source: EETT
Source: EETT (based on Digital Economy & Society Index data)
1.2.10. Comparison of Greek and European market indicators21
Fixedbroadband
Broadband connections penetration in Europe increases at decelerating pace. In June 2016, the
penetration of the fixed broadband, i.e. the num-ber of broadband connections per 100 residents, reached 32.7% compared to 31.6% in June 2015. The respective rates for Greece were 32.8% and 30.8%, thus ranking it in the 10th position among
21. The data presented for Greece lagged at least a semester compared to the data mentioned earlier.
Monthly rental
in m
inut
es
3.3%
3.9%4.1%
3.8%
2.6%
2.1%
1.6%
1.3%1.0% 1.1% 1.2%
0.6%
1.1%
0.4%
1.0%
2.9%
4.7%
4.4%
3.7%
3.1%
1.9%2.2% 2.2%
2.7%
1.6%
2.0%
0%
1%
2%
3%
4%
5%
2004 2005 2006 2007 2008 2009 2010 2011 2012 2013 2014 Jun.15 Jun.16
EU Greece
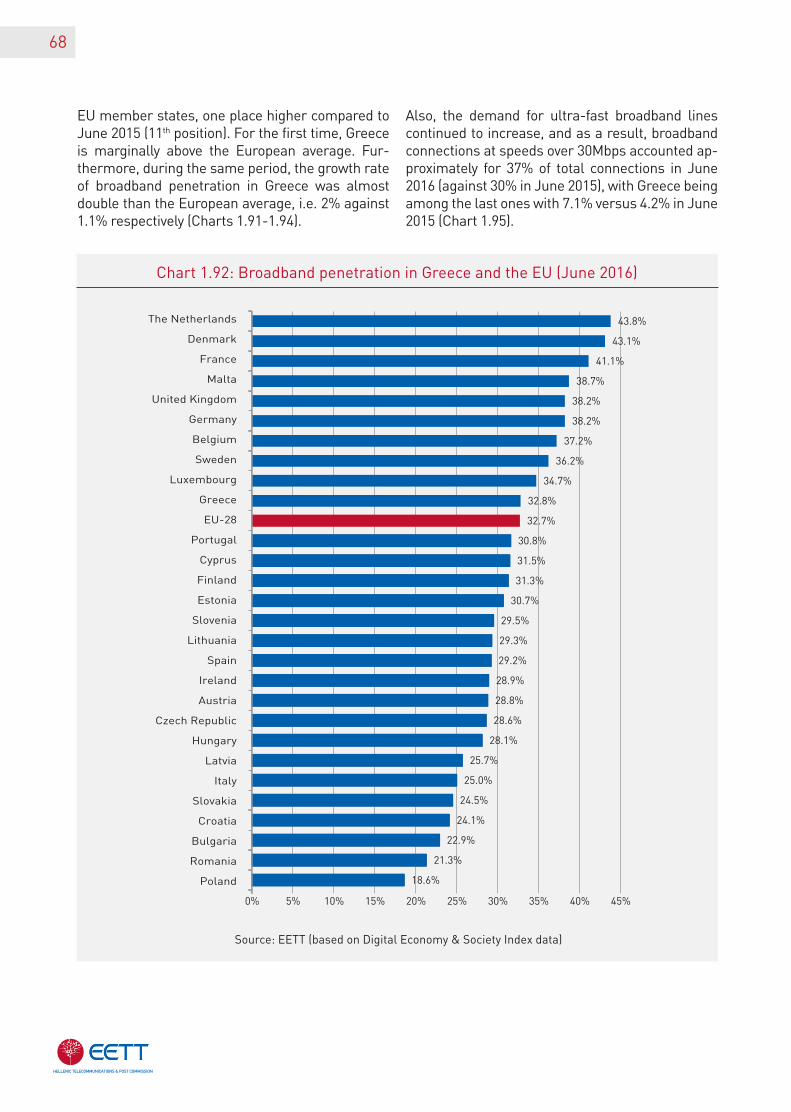
68
Chart 1.92: Broadband penetration in Greece and the EU (June 2016)
Source: EETT (based on Digital Economy & Society Index data)
EU member states, one place higher compared to June 2015 (11th position). For the first time, Greece is marginally above the European average. Fur-thermore, during the same period, the growth rate of broadband penetration in Greece was almost double than the European average, i.e. 2% against 1.1% respectively (Charts 1.91-1.94).
Also, the demand for ultra-fast broadband lines continued to increase, and as a result, broadband connections at speeds over 30Mbps accounted ap-proximately for 37% of total connections in June 2016 (against 30% in June 2015), with Greece being among the last ones with 7.1% versus 4.2% in June 2015 (Chart 1.95).
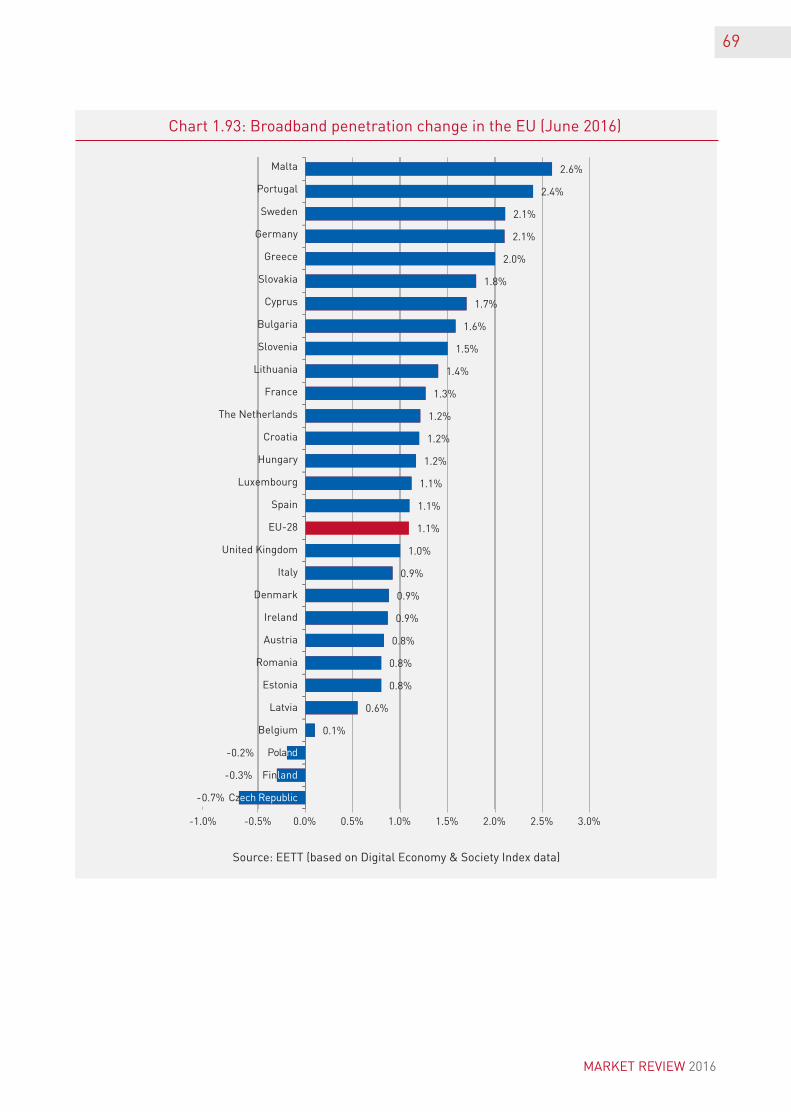
69
MARKET REVIEW 2016
Chart 1.93: Broadband penetration change in the EU (June 2016)
Source: EETT (based on Digital Economy & Society Index data)
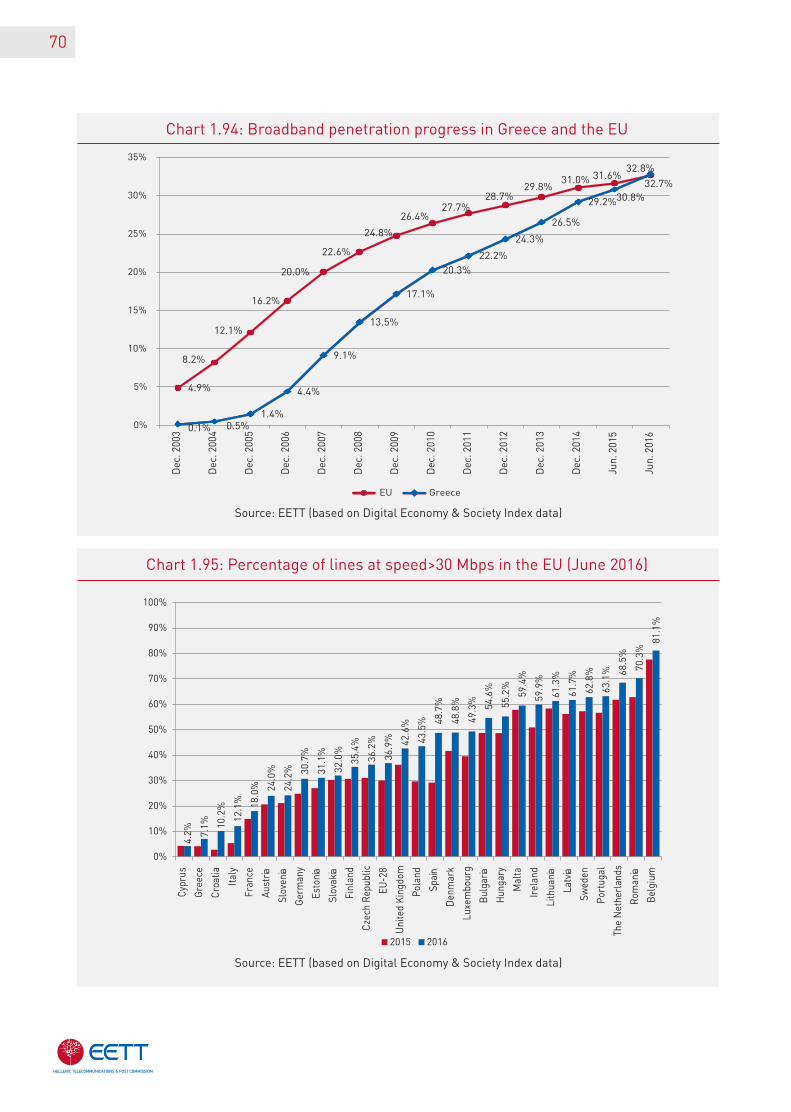
70
Chart 1.94: Broadband penetration progress in Greece and the EU
Chart 1.95: Percentage of lines at speed>30 Mbps in the EU (June 2016)
Source: EETT (based on Digital Economy & Society Index data)
Source: EETT (based on Digital Economy & Society Index data)
4.9%
8.2%
12.1%
16.2%
20.0%
22.6%
24.8%
26.4%27.7%
28.7%29.8%
31.0% 31.6%32.7%
0.1% 0.5%1.4%
4.4%
9.1%
13.5%
17.1%
20.3%22.2%
24.3%
26.5%
29.2%30.8%
32.8%
Greece
Dec
. 200
3
Dec
. 200
4
Dec
. 200
5
Dec
. 200
6
Dec
. 200
7
Dec
. 200
8
Dec
. 200
9
Dec
. 201
0
Dec
. 201
1
Dec
. 201
2
Dec
. 201
3
Dec
. 201
4
Jun.
201
5
Jun.
201
6
4.2% 7.
1% 10.2
%
12.1
% 18.0
% 24.0
%
24.2
% 30.7
%
31.1
%
32.0
%
35.4
%
36.2
%
36.9
% 42.6
%
43.5
% 48.7
%
48.8
%
49.3
% 54.6
%
55.2
%
59.4
%
59.9
%
61.3
%
61.7
%
62.8
%
63.1
% 68.5
%
70.3
%
81.1
%
0%
10%
20%
30%
40%
50%
60%
70%
80%
90%
100%
2015 2016
Cypr
us
Gre
ece
Croa
tia
Italy
Fran
ce
Aust
ria
Slov
enia
Ger
man
y
Esto
nia
Slov
akia
Finl
and
Czec
h R
epub
lic
EU-2
8
Uni
ted
Kin
gdom
Pola
nd
Spai
n
Den
mar
k
Luxe
mbo
urg
Bul
garia
Hun
gary
Mal
ta
Irel
and
Lith
uania
Latv
ia
Swed
en
Port
ugal
The
Net
herl
ands
Rom
ania
Bel
gium
0%
5%
10%
15%
20%
25%
30%
35%
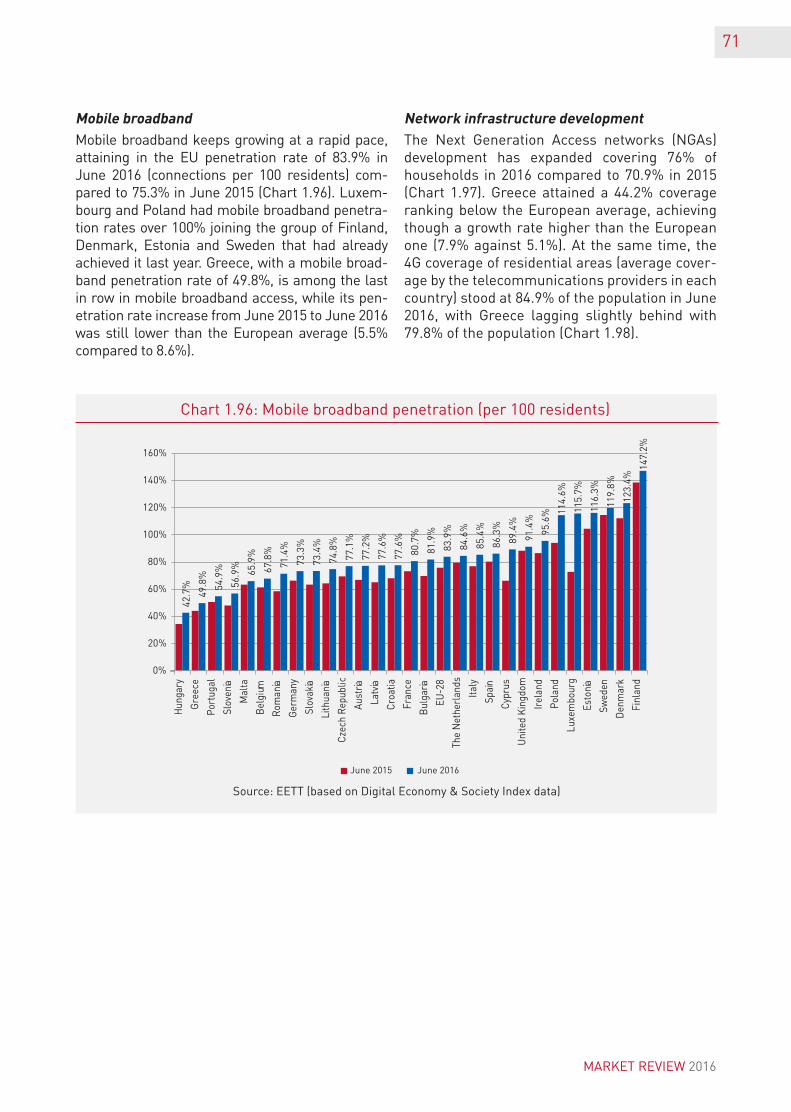
71
MARKET REVIEW 2016
MobilebroadbandMobile broadband keeps growing at a rapid pace, attaining in the EU penetration rate of 83.9% in June 2016 (connections per 100 residents) com-pared to 75.3% in June 2015 (Chart 1.96). Luxem-bourg and Poland had mobile broadband penetra-tion rates over 100% joining the group of Finland, Denmark, Estonia and Sweden that had already achieved it last year. Greece, with a mobile broad-band penetration rate of 49.8%, is among the last in row in mobile broadband access, while its pen-etration rate increase from June 2015 to June 2016 was still lower than the European average (5.5% compared to 8.6%).
NetworkinfrastructuredevelopmentThe Next Generation Access networks (NGAs) development has expanded covering 76% of households in 2016 compared to 70.9% in 2015 (Chart 1.97). Greece attained a 44.2% coverage ranking below the European average, achieving though a growth rate higher than the European one (7.9% against 5.1%). At the same time, the 4G coverage of residential areas (average cover-age by the telecommunications providers in each country) stood at 84.9% of the population in June 2016, with Greece lagging slightly behind with 79.8% of the population (Chart 1.98).
Chart 1.96: Mobile broadband penetration (per 100 residents)
Source: EETT (based on Digital Economy & Society Index data)
June 2015 June 2016
Hun
gary
Gre
ece
Port
ugal
Slov
enia
Mal
ta
Bel
gium
Rom
ania
Ger
man
y
Slov
akia
Lith
uania
Czec
h R
epub
lic
Aust
ria
Latv
ia
Croa
tia
Fran
ce
Bul
garia
EU-2
8
The
Net
herl
ands
Italy
Spai
n
Cypr
us
Uni
ted
Kin
gdom
Irel
and
Pola
nd
Luxe
mbo
urg
Esto
nia
Swed
en
Den
mar
k
Finl
and
42.7
%
49.8
%
54.9
%
56.9
%
65.9
%
67.8
%
71.4
%
73.3
%
73.4
%
74.8
%
77.1
%
77.2
%
77.6
%
77.6
%
80.7
%
81.9
%
83.9
%
84.6
%
85.4
%
86.3
%
89.4
%
91.4
%
95.6
% 114.
6%
115.
7%
116.
3%
119.
8%
123.
4%
147.
2%
0%
20%
40%
60%
80%
100%
120%
140%
160%
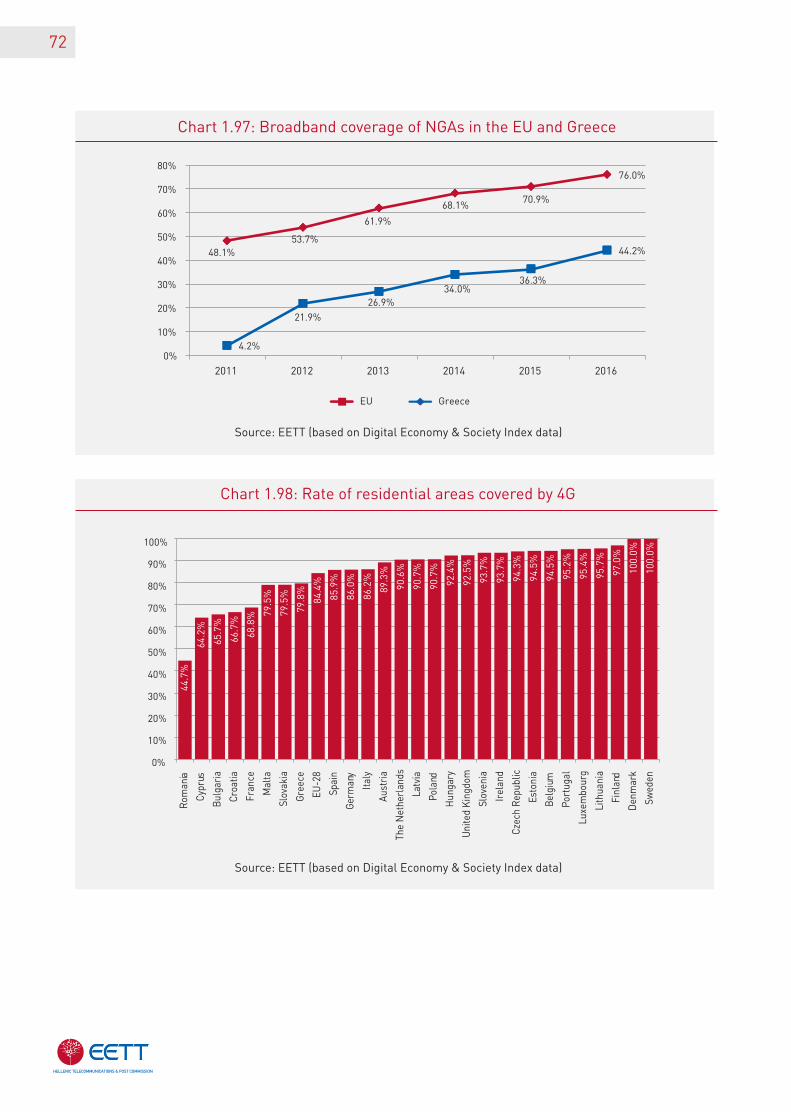
72
Chart 1.97: Broadband coverage of NGAs in the EU and Greece
Chart 1.98: Rate of residential areas covered by 4G
Source: EETT (based on Digital Economy & Society Index data)
Source: EETT (based on Digital Economy & Society Index data)
48.1%53.7%
61.9%
68.1%70.9%
76.0%
4.2%
21.9%
26.9%34.0%
36.3%
44.2%
2011 2012 2013 2014 2015 2016
Greece
44.7
%
64.2
%
65.7
%
66.7
%
68.8
% 79.5
%
79.5
%
79.8
%
84.4
%
85.9
%
86.0
%
86.2
%
89.3
%
90.6
%
90.7
%
90.7
%
92.4
%
92.5
%
93.7
%
93.7
%
94.3
%
94.5
%
94.5
%
95.2
%
95.4
%
95.7
%
97.0
%
100.
0%
100.
0%
Rom
ania
Cypr
us
Bulg
aria
Croa
tia
Fran
ce
Mal
ta
Slov
akia
Gree
ce
EU-2
8
Spai
n
Germ
any
Italy
Aust
ria
The
Net
herl
ands
Latv
ia
Pola
nd
Hun
gary
Uni
ted
Kin
gdom
Slov
enia
Irel
and
Czec
h R
epub
lic
Esto
nia
Belg
ium
Port
ugal
Luxe
mbo
urg
Lith
uani
a
Finl
and
Den
mar
k
Swed
en
0%
10%
20%
30%
40%
50%
60%
70%
80%
0%
10%
20%
30%
40%
50%
60%
70%
80%
90%
100%
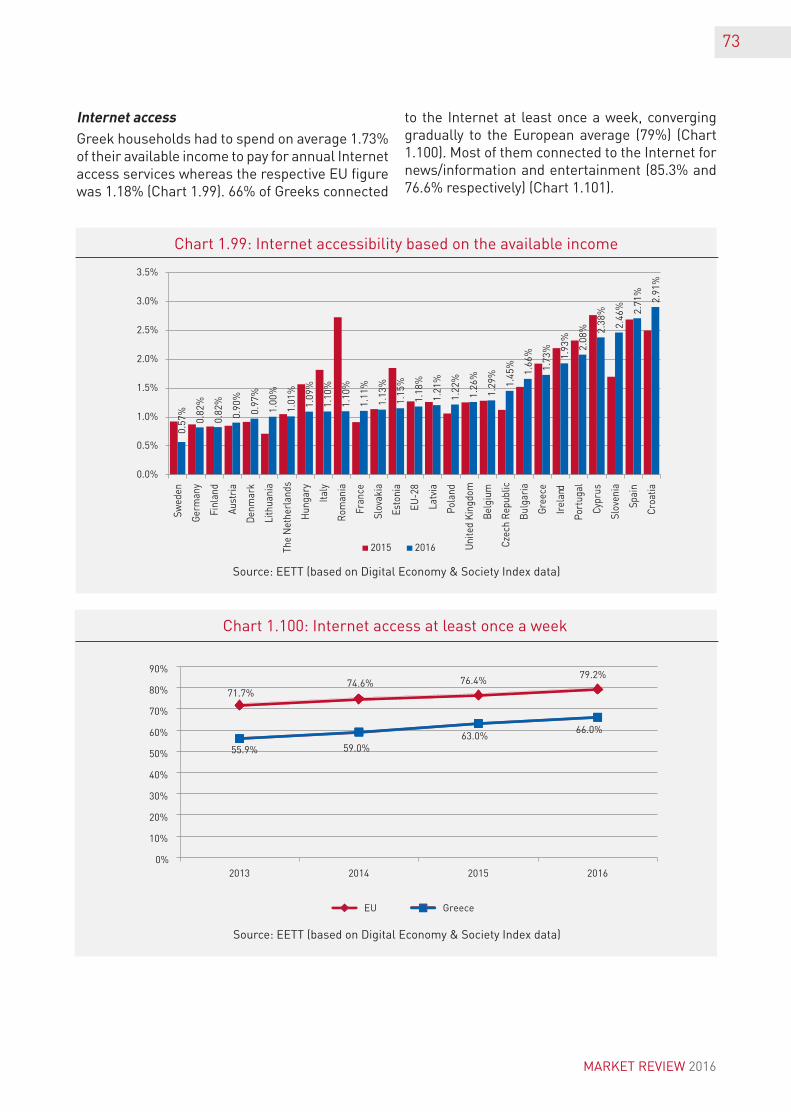
73
MARKET REVIEW 2016
Chart 1.99: Internet accessibility based on the available income
Chart 1.100: Internet access at least once a week
Source: EETT (based on Digital Economy & Society Index data)
Source: EETT (based on Digital Economy & Society Index data)
InternetaccessGreek households had to spend on average 1.73% of their available income to pay for annual Internet access services whereas the respective EU figure was 1.18% (Chart 1.99). 66% of Greeks connected
to the Internet at least once a week, converging gradually to the European average (79%) (Chart 1.100). Most of them connected to the Internet for news/information and entertainment (85.3% and 76.6% respectively) (Chart 1.101).
0.57
%
0.82
%
0.82
%
0.90
%
0.97
%
1.00
%
1.01
%
1.09
%
1.10
%
1.10
%
1.11
%
1.13
%
1.15
%
1.18
%
1.21
%
1.22
%
1.26
%
1.29
%
1.45
%
1.66
%
1.73
%
1.93
%
2.08
% 2.38
%
2.46
% 2.71
%
2.91
%
0.0%
0.5%
1.0%
1.5%
2.0%
2.5%
3.0%
3.5%
2015 2016
Swed
en
Germ
any
Finl
and
Aust
ria
Den
mar
k
Lith
uani
a
The
Net
herl
ands
Hun
gary
Italy
Rom
ania
Fran
ce
Slov
akia
Esto
nia
EU-2
8
Latv
ia
Pola
nd
Uni
ted
Kin
gdom
Belg
ium
Czec
h R
epub
lic
Bul
gari
a
Gree
ce
Irel
and
Port
ugal
Cypr
us
Slov
enia
Spai
n
Croa
tia
71.7%74.6% 76.4%
79.2%
55.9% 59.0%63.0%
66.0%
2013 2014 2015 2016
EU Greece
0%
10%
20%
30%
40%
50%
60%
70%
80%
90%
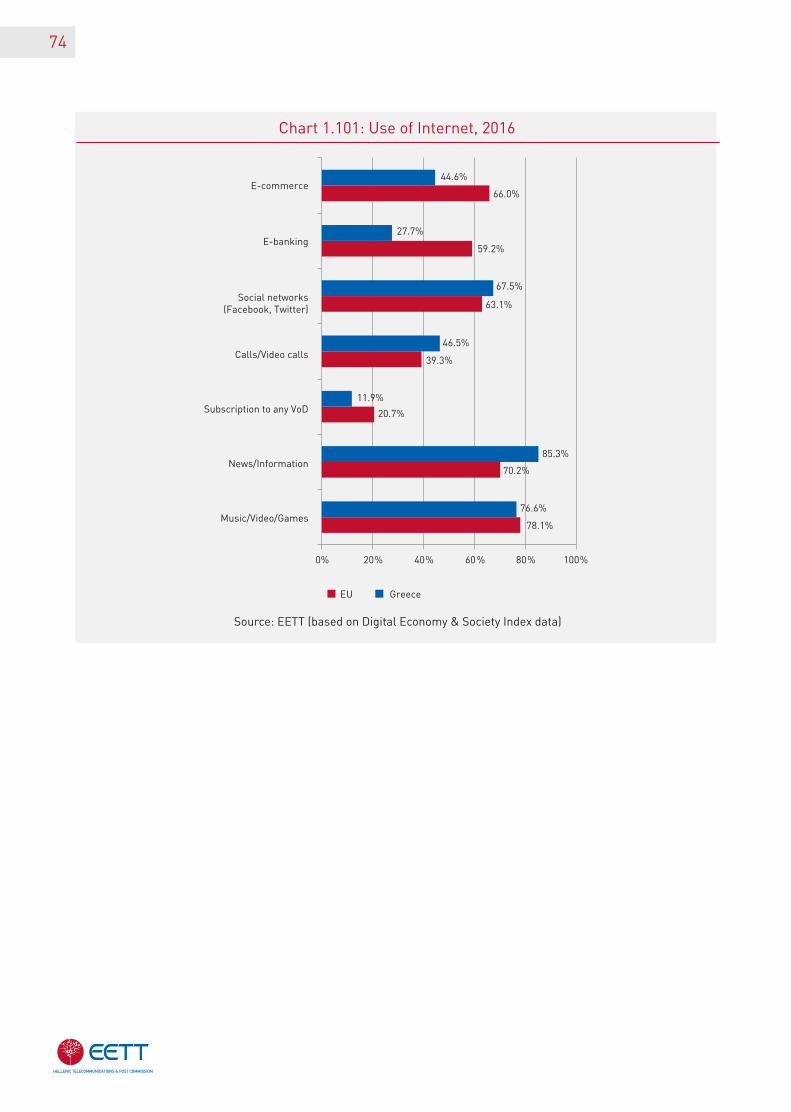
74
Chart 1.101: Use of Internet, 2016
Source: EETT (based on Digital Economy & Society Index data)
44.6%
66.0%
27.7%
59.2%
67.5%
63.1%
46.5%
39.3%
85.3%
20.7%
EU Greece
E-commerce
E-banking
Social networks (Facebook, Twitter)
Calls/Video calls
Subscription to any VoD
News/Information
Music/Video/Games
11.9%
70.2%
76.6%
78.1%

75
MARKET REVIEW 2016
76
2.1. The course of the postal market
2.1.1. Globally
Key financial figuresThe global postal market continued to grow in 2016 despite the competitive conditions and the continuous decline of letter mail volume. The postal companies increased the volumes of their parcels and express shipments, espe-cially regarding B2C e-commerce items, and further diversified their activities, in order to support the increase of their revenues. In 2016, many postal companies concentrated on the improvement of the operational efficiency of their delivery networks, e.g. with investments in the automation of their sorting centers, and focused on the development of innovative so-lutions for e-commerce consumers, especially for the cross-border markets.According to preliminary results for 201622, the global postal market continued to show growth trend. The market’s revenue increased by 1.5% compared to 2015. Despite the decline of letter mail volume, the sector’s revenue increased by 0.5%, while the revenue of the parcels and ex-
press services sector increased by 2.8%, thanks to the ongoing growth of e-commerce. Despite the positive trend, the postal market grew at a slower pace in 2016 compared to the previous years. While the volume of letter mail shipments decreased in most markets, the letter mail sec-tor remained profitable on average, as the postal companies further improved their postal opera-tions and increased their efficiency. The postal companies also continued to expand their parcels delivery networks in order to take advantage of the e-commerce growth and to improve their cus-tomers’ service. In 2016, international operations remained an important revenue source for many postal businesses, both in the sector of letter mail and in the sector of parcels.In 2015, the global postal market revenue reached 424.4 billion euros, with an average growth rate of 2.8% and an average EBIT margin of 4.4%. Despite the trend of diversification of activities by the po-stal companies, the letter post sector represented the 37.7% of the global market revenue in 2015 (from 48.5% in 2010), while the parcels, express services and financial services sector represented 45%. International operations of postal companies
POSTALSERVICES
22. IPC “2016 Key Findings, Global Postal Industry Report”, December 2016.
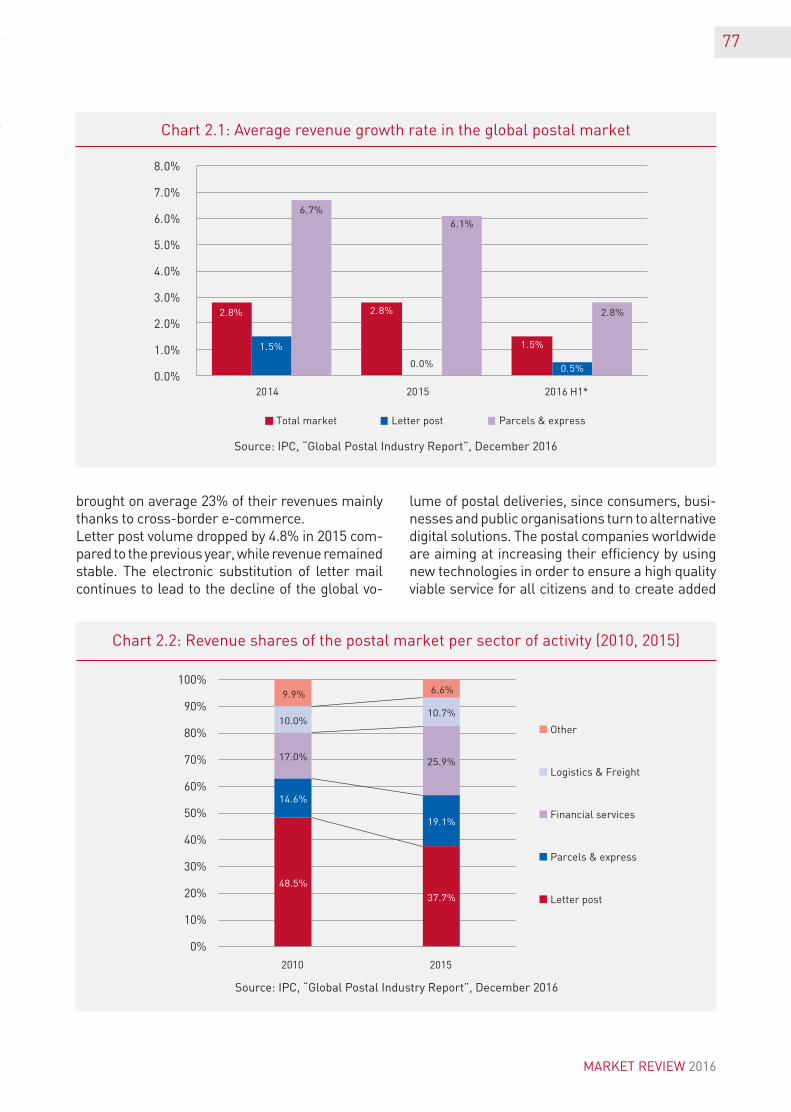
77
Chart 2.1: Average revenue growth rate in the global postal market
Chart 2.2: Revenue shares of the postal market per sector of activity (2010, 2015)
Source: IPC, “Global Postal Industry Report”, December 2016
Source: IPC, “Global Postal Industry Report”, December 2016
brought on average 23% of their revenues mainly thanks to cross-border e-commerce.Letter post volume dropped by 4.8% in 2015 com-pared to the previous year, while revenue remained stable. The electronic substitution of letter mail continues to lead to the decline of the global vo-
lume of postal deliveries, since consumers, busi-nesses and public organisations turn to alternative digital solutions. The postal companies worldwide are aiming at increasing their efficiency by using new technologies in order to ensure a high quality viable service for all citizens and to create added
2.8% 2.8%
1.5%1.5%
0.0% 0.5%
6.7%6.1%
2.8%
0.0%
1.0%
2.0%
3.0%
4.0%
5.0%
6.0%
7.0%
8.0%
2014 2015 2016 H1*
Total market Letter post Parcels & express
48.5%
37.7%
14.6%
19.1%
17.0% 25.9%
10.0%10.7%
9.9% 6.6%
0%
10%
20%
30%
40%
50%
60%
70%
80%
90%
100%
2010 2015
Other
Logistics & Freight
Financial services
Parcels & express
Letter post
MARKET REVIEW 2016
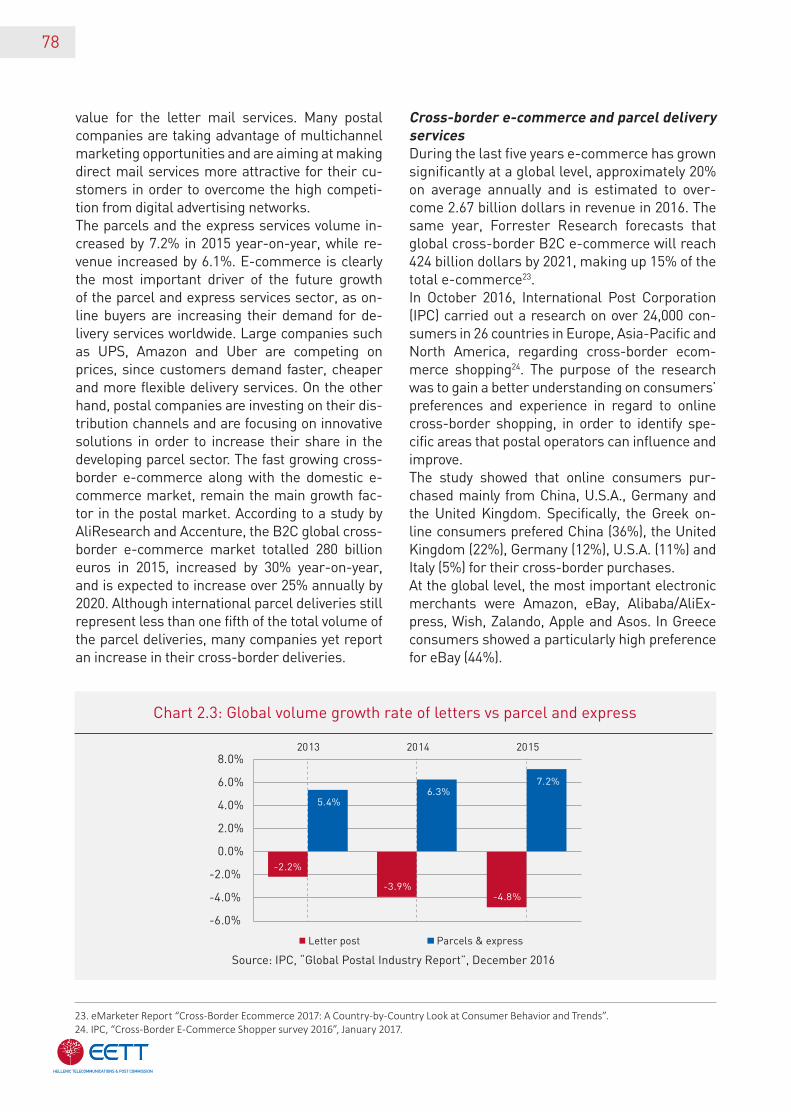
Chart 2.3: Global volume growth rate of letters vs parcel and express
78
Source: IPC, “Global Postal Industry Report”, December 2016
value for the letter mail services. Many postal companies are taking advantage of multichannel marketing opportunities and are aiming at ma king direct mail services more attractive for their cu-stomers in order to overcome the high competi-tion from digital advertising networks.The parcels and the express services volume in-creased by 7.2% in 2015 year-on-year, while re-venue increased by 6.1%. E-commerce is clearly the most important driver of the future growth of the parcel and express services sector, as on-line buyers are increasing their demand for de-livery services worldwide. Large companies such as UPS, Amazon and Uber are competing on prices, since customers demand faster, cheaper and more flexible delivery services. On the other hand, postal companies are investing on their dis-tribution channels and are focusing on innovative solutions in order to increase their share in the developing parcel sector. The fast growing cross-border e-commerce along with the domestic e-commerce market, remain the main growth fac-tor in the postal market. According to a study by AliResearch and Accenture, the B2C global cross-border e-commerce market totalled 280 billion euros in 2015, increased by 30% year-on-year, and is expected to increase over 25% annually by 2020. Although international parcel deliveries still represent less than one fifth of the total volume of the parcel deliveries, many companies yet report an increase in their cross-border deliveries.
Cross-border e-commerce and parcel delivery servicesDuring the last five years e-commerce has grown significantly at a global level, approximately 20% on average annually and is estimated to over-come 2.67 billion dollars in revenue in 2016. The same year, Forrester Research forecasts that global cross-border B2C e-commerce will reach 424 billion dollars by 2021, making up 15% of the total e-commerce23.In October 2016, International Post Corporation (IPC) carried out a research on over 24,000 con-sumers in 26 countries in Europe, Asia-Pacific and North America, regarding cross-border ecom-merce shopping24. The purpose of the research was to gain a better understanding on consumers’ preferences and experience in regard to online cross-border shopping, in order to identify spe-cific areas that postal operators can influence and improve. The study showed that online consumers pur-chased mainly from China, U.S.A., Germany and the United Kingdom. Specifically, the Greek on-line consumers prefered China (36%), the United Kingdom (22%), Germany (12%), U.S.A. (11%) and Italy (5%) for their cross-border purchases.At the global level, the most important electronic merchants were Amazon, eBay, Alibaba/AliEx-press, Wish, Zalando, Apple and Asos. In Greece consumers showed a particularly high preference for eBay (44%).
23. eMarketer Report “Cross-Border Ecommerce 2017: A Country-by-Country Look at Consumer Behavior and Trends”.24. IPC, “Cross-Border E-Commerce Shopper survey 2016”, January 2017.
-2.2%
-3.9%-4.8%
5.4%6.3%
7.2%
-6.0%
-4.0%
-2.0%
0.0%
2.0%
4.0%
6.0%
8.0%2013 2014 2015
Letter post Parcels & express
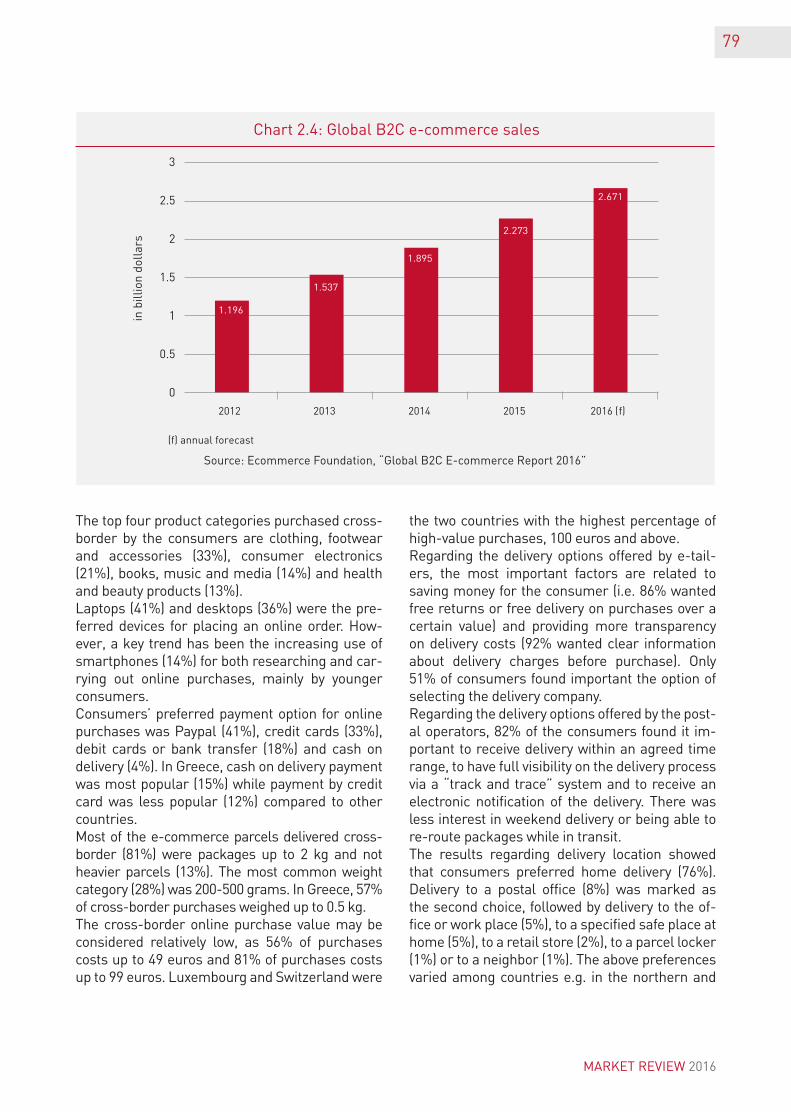
Chart 2.4: Global B2C e-commerce sales
79
Source: Ecommerce Foundation, “Global B2C E-commerce Report 2016”
The top four product categories purchased cross-border by the consumers are clothing, footwear and accessories (33%), consumer electronics (21%), books, music and media (14%) and health and beauty products (13%).Laptops (41%) and desktops (36%) were the pre-ferred devices for placing an online order. How-ever, a key trend has been the increasing use of smartphones (14%) for both researching and car-rying out online purchases, mainly by younger consumers. Consumers’ preferred payment option for online purchases was Paypal (41%), credit cards (33%), debit cards or bank transfer (18%) and cash on delivery (4%). In Greece, cash on delivery payment was most popular (15%) while payment by credit card was less popular (12%) compared to other countries. Most of the e-commerce parcels delivered cross-border (81%) were packages up to 2 kg and not heavier parcels (13%). The most common weight category (28%) was 200-500 grams. In Greece, 57% of cross-border purchases weighed up to 0.5 kg.The cross-border online purchase value may be considered relatively low, as 56% of purchases costs up to 49 euros and 81% of purchases costs up to 99 euros. Luxembourg and Switzerland were
the two countries with the highest percentage of high-value purchases, 100 euros and above. Regarding the delivery options offered by e-tail-ers, the most important factors are related to saving money for the consumer (i.e. 86% wanted free returns or free delivery on purchases over a certain value) and providing more transparency on delivery costs (92% wanted clear information about delivery charges before purchase). Only 51% of consumers found important the option of selecting the delivery company. Regarding the delivery options offered by the post-al operators, 82% of the consumers found it im-portant to receive delivery within an agreed time range, to have full visibility on the delivery process via a “track and trace” system and to receive an electronic notification of the delivery. There was less interest in weekend delivery or being able to re-route packages while in transit. The results regarding delivery location showed that consumers preferred home delivery (76%). Delivery to a postal office (8%) was marked as the second choice, followed by delivery to the of-fice or work place (5%), to a specified safe place at home (5%), to a retail store (2%), to a parcel locker (1%) or to a neighbor (1%). The above preferences varied among countries e.g. in the northern and
in b
illio
n do
llar
s
1.196
1.537
1.895
2.273
2.671
2012 2013 2014 2015 2016 (f)
(f) annual forecast
0
0.5
1
1.5
2
2.5
3
MARKET REVIEW 2016
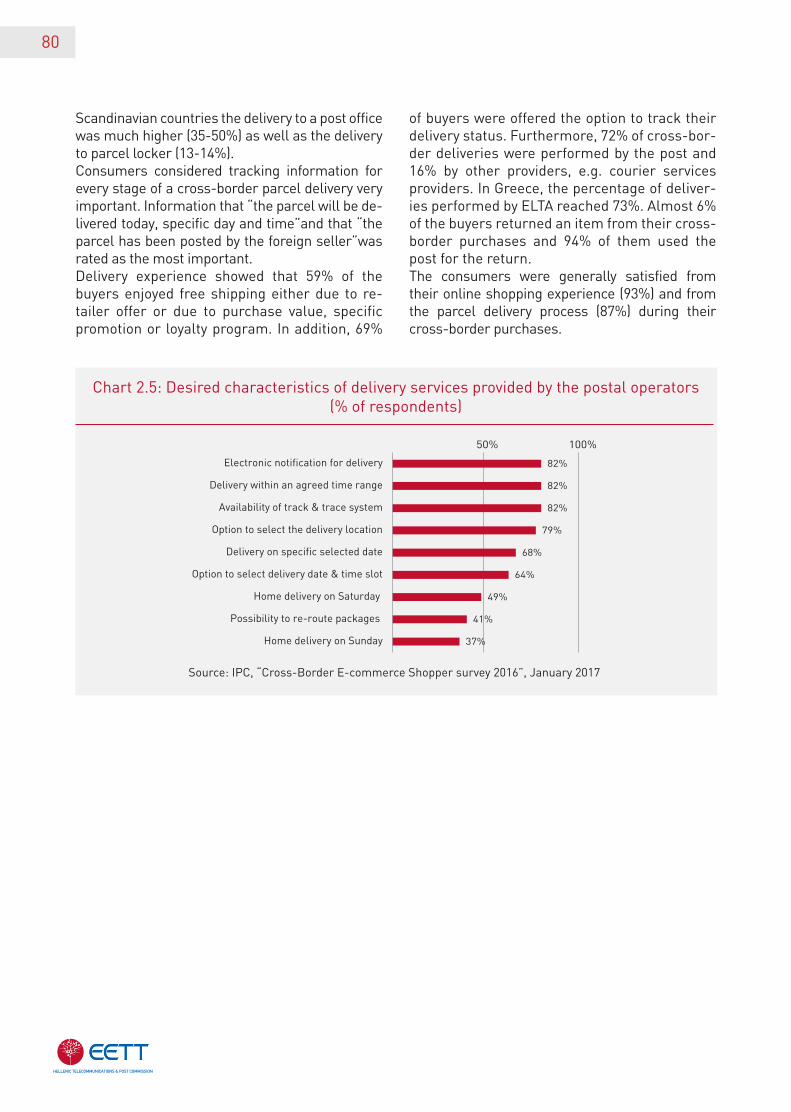
80
Scandinavian countries the delivery to a post office was much higher (35-50%) as well as the delivery to parcel locker (13-14%). Consumers considered tracking information for every stage of a cross-border parcel delivery very important. Information that “the parcel will be de-livered today, specific day and time”and that “the parcel has been posted by the foreign seller”was rated as the most important.Delivery experience showed that 59% of the buyers enjoyed free shipping either due to re-tailer offer or due to purchase value, specific promotion or loyalty program. In addition, 69%
of buyers were offered the option to track their delivery status. Furthermore, 72% of cross-bor-der deliveries were performed by the post and 16% by other providers, e.g. courier services providers. In Greece, the percentage of deliver-ies performed by ELTA reached 73%. Almost 6% of the buyers returned an item from their cross-border purchases and 94% of them used the post for the return. The consumers were generally satisfied from their online shopping experience (93%) and from the parcel delivery process (87%) during their cross-border purchases.
Chart 2.5: Desired characteristics of delivery services provided by the postal operators(% of respondents)
Source: IPC, “Cross-Border E-commerce Shopper survey 2016”, January 2017
37%
41%
49%
64%
68%
79%
82%
82%
82%
50% 100%
Home delivery on Sunday
Possibility to re-route packages
Home delivery on Saturday
Option to select delivery date & time slot
Delivery on specific selected date
Option to select the delivery location
Availability of track & trace system
Delivery within an agreed time range
Electronic notification for delivery
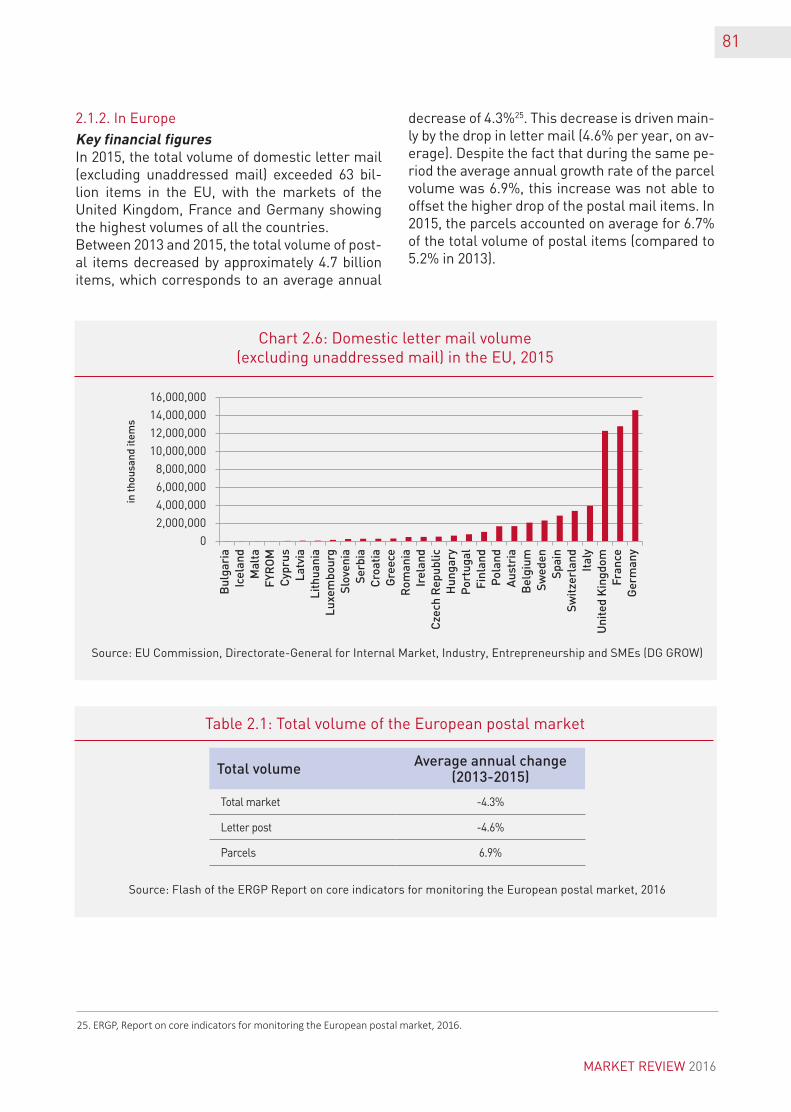
81
2.1.2. In Europe
Key financial figuresIn 2015, the total volume of domestic letter mail (excluding unaddressed mail) exceeded 63 bil-lion items in the EU, with the markets of the United Kingdom, France and Germany showing the highest volumes of all the countries. Between 2013 and 2015, the total volume of post-al items decreased by approximately 4.7 billion items, which corresponds to an average annual
decrease of 4.3%25. This decrease is driven main-ly by the drop in letter mail (4.6% per year, on av-erage). Despite the fact that during the same pe-riod the average annual growth rate of the parcel volume was 6.9%, this increase was not able to offset the higher drop of the postal mail items. In 2015, the parcels accounted on average for 6.7% of the total volume of postal items (compared to 5.2% in 2013).
Chart 2.6: Domestic letter mail volume(excluding unaddressed mail) in the EU, 2015
Source: EU Commission, Directorate-General for Internal Market, Industry, Entrepreneurship and SMEs (DG GROW)
Table 2.1: Total volume of the European postal market
Source: Flash of the ERGP Report on core indicators for monitoring the European postal market, 2016
25. ERGP, Report on core indicators for monitoring the European postal market, 2016.
Total volume Average annual change (2013-2015)
Total market -4.3%
Letter post -4.6%
Parcels 6.9%
Bul
gari
aIc
elan
dM
alta
FYR
OM
Cyp
rus
Latv
iaLi
thua
nia
Luxe
mbo
urg
Slo
veni
aS
erbi
aC
roat
iaG
reec
eR
oman
iaIr
elan
dC
zech
Rep
ublic
Hun
gary
Por
tuga
lFi
nlan
dP
olan
dA
ustr
iaB
elgi
umS
wed
enS
pain
Sw
itze
rlan
dIt
aly
Uni
ted
Kin
gdom
Fran
ceG
erm
any
in th
ousa
nd it
ems
0
2,000,000
4,000,000
6,000,000
8,000,000
10,000,000
12,000,000
14,000,000
16,000,000
MARKET REVIEW 2016
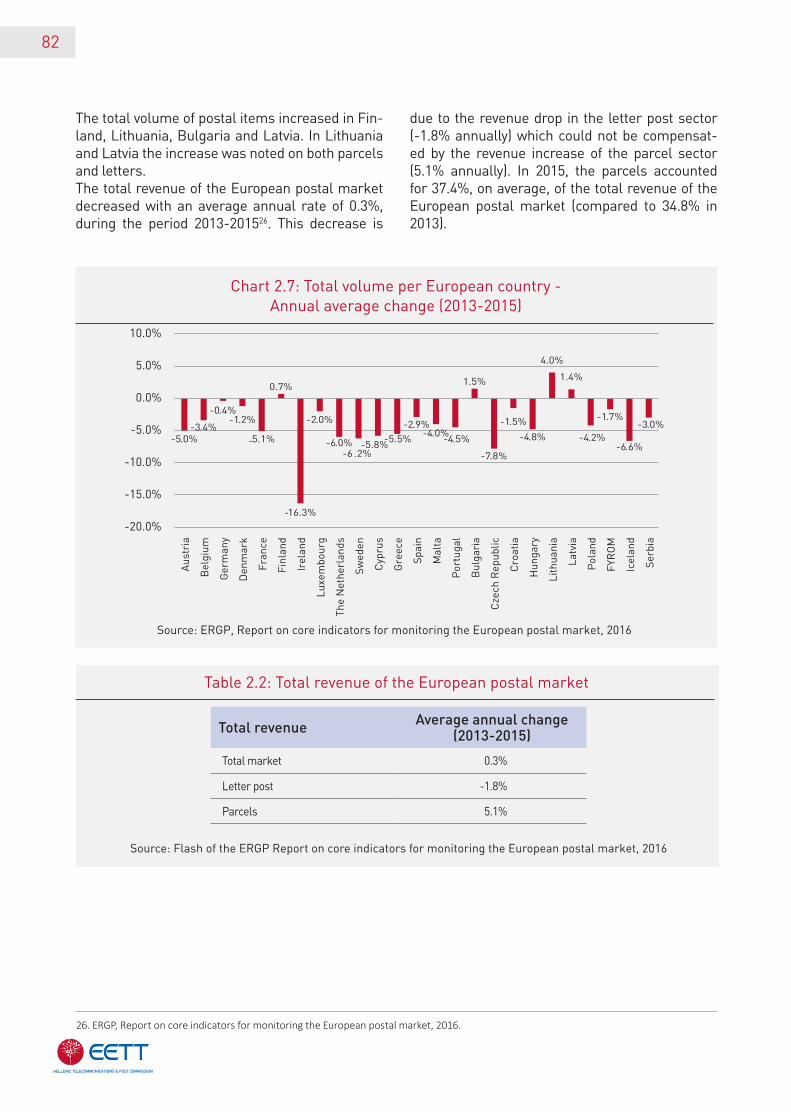
82
The total volume of postal items increased in Fin-land, Lithuania, Bulgaria and Latvia. In Lithuania and Latvia the increase was noted on both parcels and letters.The total revenue of the European postal market decreased with an average annual rate of 0.3%, during the period 2013-201526. This decrease is
due to the revenue drop in the letter post sector (-1.8% annually) which could not be compensat-ed by the revenue increase of the parcel sector (5.1% annually). In 2015, the parcels accounted for 37.4%, on average, of the total revenue of the European postal market (compared to 34.8% in 2013).
Chart 2.7: Total volume per European country -Annual average change (2013-2015)
Source: ERGP, Report on core indicators for monitoring the European postal market, 2016
26. ERGP, Report on core indicators for monitoring the European postal market, 2016.
Table 2.2: Total revenue of the European postal market
Source: Flash of the ERGP Report on core indicators for monitoring the European postal market, 2016
Total revenue Average annual change (2013-2015)
Total market 0.3%
Letter post -1.8%
Parcels 5.1%
-5.0%-3.4%
-0.4%-1.2%
-5.1%
0.7%
-16.3%
-2.0%
-6.0%-6 .2%
-5.8%-5.5%
-2.9%-4.0%
-4.5%
1.5%
-7.8%
-1.5%
-4.8%
4.0%
1.4%
-4.2%
-1.7%
-6.6%
-3.0%
-20.0%
-15.0%
-10.0%
-5.0%
0.0%
5.0%
10.0%
Aus
tria
Bel
gium
Ger
man
y
Den
mar
k
Fran
ce
Finl
and
Irel
and
Luxe
mbo
urg
The
Net
herl
ands
Sw
eden
Cyp
rus
Gre
ece
Spa
in
Mal
ta
Por
tuga
l
Bul
gari
a
Cze
ch R
epub
lic
Cro
atia
Hun
gary
Lith
uani
a
Latv
ia
Pol
and
FYR
OM
Icel
and
Ser
bia
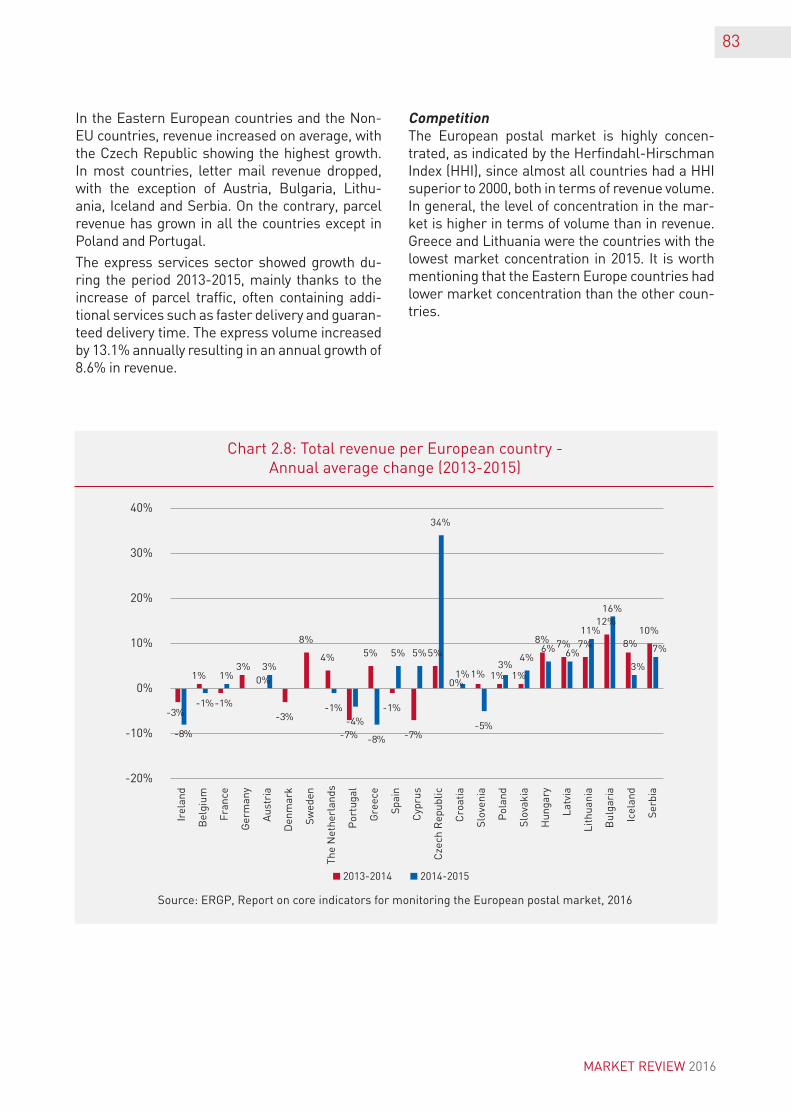
83
In the Eastern European countries and the Non-EU countries, revenue increased on average, with the Czech Republic showing the highest growth. In most countries, letter mail revenue dropped, with the exception of Austria, Bulgaria, Lithu-ania, Iceland and Serbia. On the contrary, parcel revenue has grown in all the countries except in Poland and Portugal.
The express services sector showed growth du-ring the period 2013-2015, mainly thanks to the increase of parcel traffic, often containing addi-tional services such as faster delivery and guaran-teed delivery time. The express volume increased by 13.1% annually resulting in an annual growth of 8.6% in revenue.
CompetitionThe European postal market is highly concen-trated, as indicated by the Herfindahl-Hirschman Index (HHI), since almost all countries had a HHI superior to 2000, both in terms of revenue volume. In general, the level of concentration in the mar-ket is higher in terms of volume than in revenue. Greece and Lithuania were the countries with the lowest market concentration in 2015. It is worth mentio ning that the Eastern Europe countries had lower market concentration than the other coun-tries.
Chart 2.8: Total revenue per European country -Annual average change (2013-2015)
Source: ERGP, Report on core indicators for monitoring the European postal market, 2016
-3%
1%
-1%
3%0%
-3%
8%
4%
-7%
5%
-1%
-7%
5%
0%1% 1% 1%
8% 7% 7%
12%
8%10%
-8%
-1%
1%3%
-1%-4%
-8%
5% 5%
34%
1%
-5%
3%4%
6% 6%
11%
16%
3%
7%
-20%
-10%
0%
10%
20%
30%
40%
2013-2014 2014-2015
Irel
and
Bel
gium
Fran
ce
Ger
man
y
Aus
tria
Den
mar
k
Sw
eden
The
Net
herl
ands
Por
tuga
l
Gre
ece
Spa
in
Cyp
rus
Cze
ch R
epub
lic
Cro
atia
Slo
veni
a
Pol
and
Slo
vaki
a
Hun
gary
Latv
ia
Lith
uani
a
Bul
gari
a
Icel
and
Ser
bia
MARKET REVIEW 2016
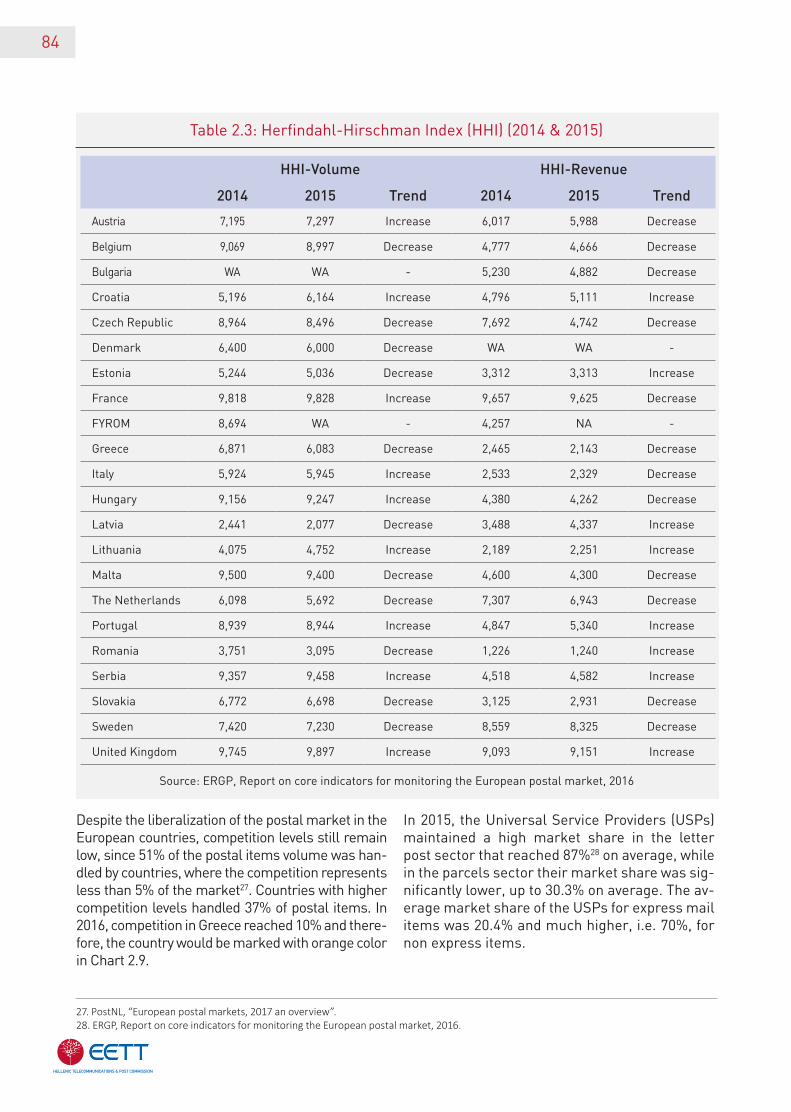
84
Table 2.3: Herfindahl-Hirschman Index (ΗΗΙ) (2014 & 2015)
Source: ERGP, Report on core indicators for monitoring the European postal market, 2016
HHI-Volume HHI-Revenue
2014 2015 Trend 2014 2015 Trend
Austria 7,195 7,297 Increase 6,017 5,988 Decrease
Belgium 9,069 8,997 Decrease 4,777 4,666 Decrease
Bulgaria WA WA - 5,230 4,882 Decrease
Croatia 5,196 6,164 Increase 4,796 5,111 Increase
Czech Republic 8,964 8,496 Decrease 7,692 4,742 Decrease
Denmark 6,400 6,000 Decrease WA WA -
Estonia 5,244 5,036 Decrease 3,312 3,313 Increase
France 9,818 9,828 Increase 9,657 9,625 Decrease
FYROM 8,694 WA - 4,257 ΝΑ -
Greece 6,871 6,083 Decrease 2,465 2,143 Decrease
Italy 5,924 5,945 Increase 2,533 2,329 Decrease
Hungary 9,156 9,247 Increase 4,380 4,262 Decrease
Latvia 2,441 2,077 Decrease 3,488 4,337 Increase
Lithuania 4,075 4,752 Increase 2,189 2,251 Increase
Malta 9,500 9,400 Decrease 4,600 4,300 Decrease
The Netherlands 6,098 5,692 Decrease 7,307 6,943 Decrease
Portugal 8,939 8,944 Increase 4,847 5,340 Increase
Romania 3,751 3,095 Decrease 1,226 1,240 Increase
Serbia 9,357 9,458 Increase 4,518 4,582 Increase
Slovakia 6,772 6,698 Decrease 3,125 2,931 Decrease
Sweden 7,420 7,230 Decrease 8,559 8,325 Decrease
United Kingdom 9,745 9,897 Increase 9,093 9,151 Increase
Despite the liberalization of the postal market in the European countries, competition levels still remain low, since 51% of the postal items volume was han-dled by countries, where the competition represents less than 5% of the market27. Countries with higher competition levels handled 37% of postal items. In 2016, competition in Greece reached 10% and there-fore, the country would be marked with orange color in Chart 2.9.
In 2015, the Universal Service Providers (USPs) maintained a high market share in the letter post sector that reached 87%28 on average, while in the parcels sector their market share was sig-nificantly lower, up to 30.3% on average. The av-erage market share of the USPs for express mail items was 20.4% and much higher, i.e. 70%, for non express items.
27. PostNL, “European postal markets, 2017 an overview”.28. ERGP, Report on core indicators for monitoring the European postal market, 2016.
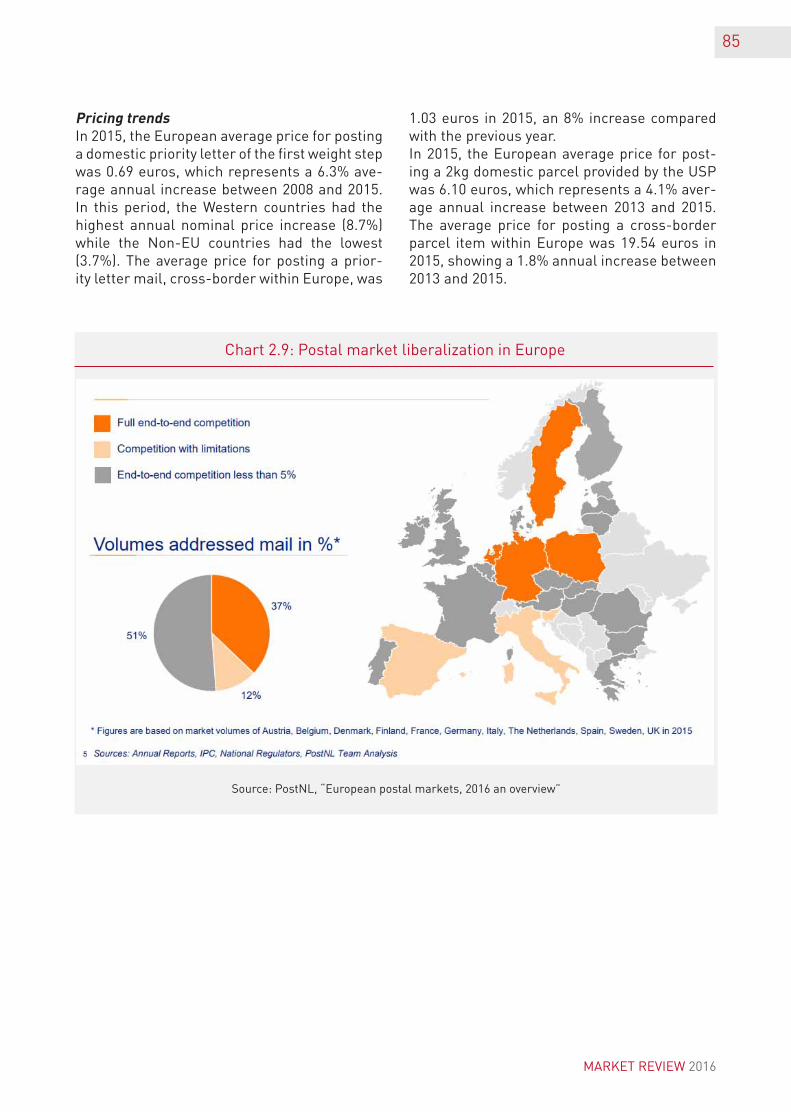
85
Pricing trendsIn 2015, the European average price for posting a domestic priority letter of the first weight step was 0.69 euros, which represents a 6.3% ave-rage annual increase between 2008 and 2015. In this period, the Western countries had the highest annual nominal price increase (8.7%) while the Non-EU countries had the lowest (3.7%). The average price for posting a prior-ity letter mail, cross-border within Europe, was
1.03 euros in 2015, an 8% increase compared with the previous year.In 2015, the European average price for post-ing a 2kg domestic parcel provided by the USP was 6.10 euros, which represents a 4.1% aver-age annual increase between 2013 and 2015. The average price for posting a cross-border parcel item within Europe was 19.54 euros in 2015, showing a 1.8% annual increase between 2013 and 2015.
Chart 2.9: Postal market liberalization in Europe
Source: PostNL, “European postal markets, 2016 an overview”
MARKET REVIEW 2016
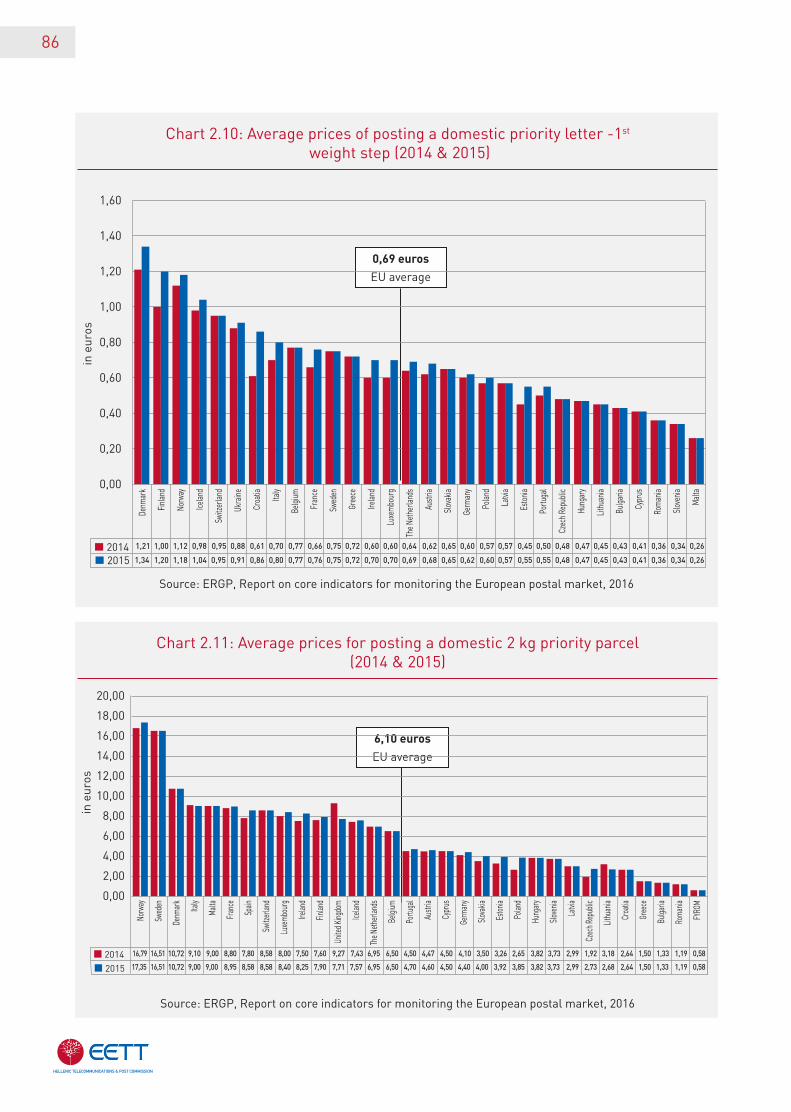
86
Chart 2.10: Average prices of posting a domestic priority letter -1st
weight step (2014 & 2015)
Chart 2.11: Average prices for posting a domestic 2 kg priority parcel (2014 & 2015)
Source: ERGP, Report on core indicators for monitoring the European postal market, 2016
Source: ERGP, Report on core indicators for monitoring the European postal market, 2016
0,69 euros
EU average
6,10 euros
EU average
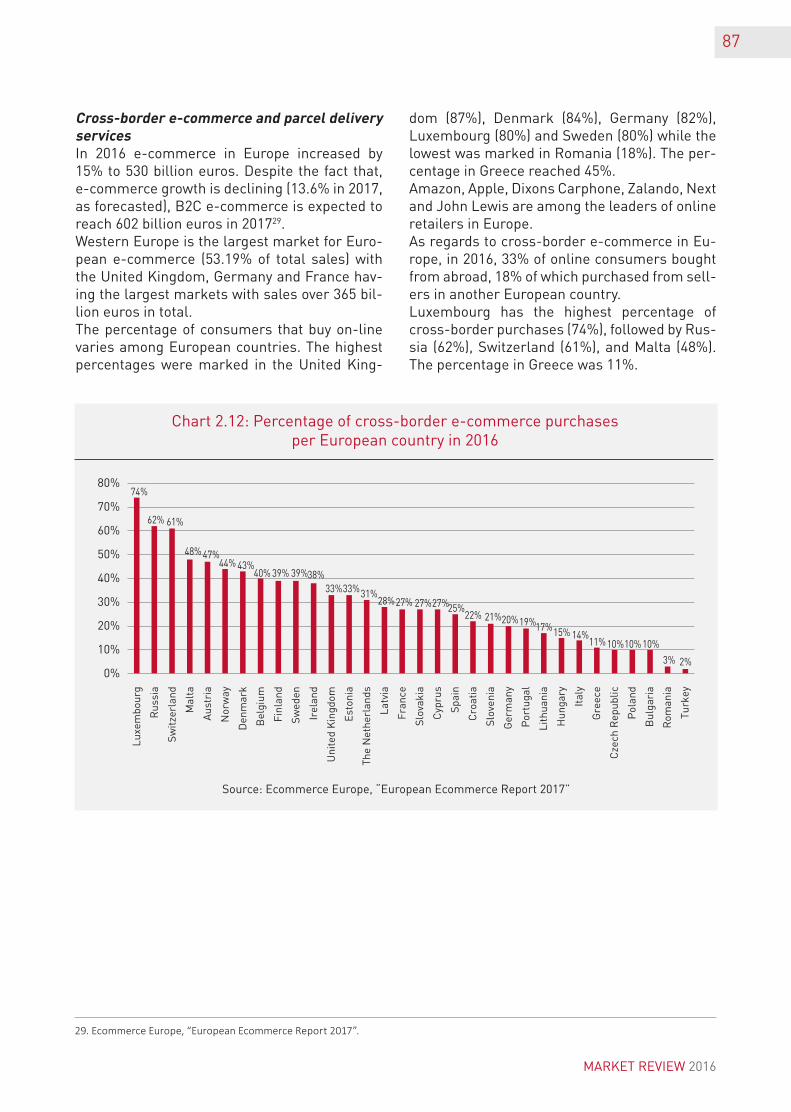
87
Cross-border e-commerce and parcel delivery servicesIn 2016 e-commerce in Europe increased by 15% to 530 billion euros. Despite the fact that, e-commerce growth is declining (13.6% in 2017, as forecasted), B2C e-commerce is expected to reach 602 billion euros in 201729.Western Europe is the largest market for Euro-pean e-commerce (53.19% of total sales) with the United Kingdom, Germany and France hav-ing the largest markets with sales over 365 bil-lion euros in total. The percentage of consumers that buy on-line varies among European countries. The highest percentages were marked in the United King-
dom (87%), Denmark (84%), Germany (82%), Luxembourg (80%) and Sweden (80%) while the lowest was marked in Romania (18%). The per-centage in Greece reached 45%. Amazon, Apple, Dixons Carphone, Zalando, Next and John Lewis are among the leaders of online retailers in Europe. As regards to cross-border e-commerce in Eu-rope, in 2016, 33% of online consumers bought from abroad, 18% of which purchased from sell-ers in another European country. Luxembourg has the highest percentage of cross-border purchases (74%), followed by Rus-sia (62%), Switzerland (61%), and Malta (48%). The percentage in Greece was 11%.
29. Ecommerce Europe, “European Ecommerce Report 2017”.
Chart 2.12: Percentage of cross-border e-commerce purchases per European country in 2016
Source: Ecommerce Europe, “European Ecommerce Report 2017”
74%
62% 61%
48% 47%44% 43%
40% 39% 39%38%33%33%31%
28%27% 27%27%25%22% 21%20%19%17%15% 14%
11%10%10%10%
3% 2%0%
10%
20%
30%
40%
50%
60%
70%
80%
Luxe
mbo
urg
Rus
sia
Sw
itze
rlan
d
Mal
ta
Aus
tria
Nor
way
Den
mar
k
Bel
gium
Finl
and
Sw
eden
Irel
and
Uni
ted
Kin
gdom
Est
onia
The
Net
herl
ands
Latv
ia
Fran
ce
Slo
vaki
a
Cyp
rus
Spa
in
Cro
atia
Slo
veni
a
Ger
man
y
Por
tuga
l
Lith
uani
a
Hun
gary
Ital
y
Gre
ece
Cze
ch R
epub
lic
Pol
and
Bul
gari
a
Rom
ania
Turk
ey
MARKET REVIEW 2016
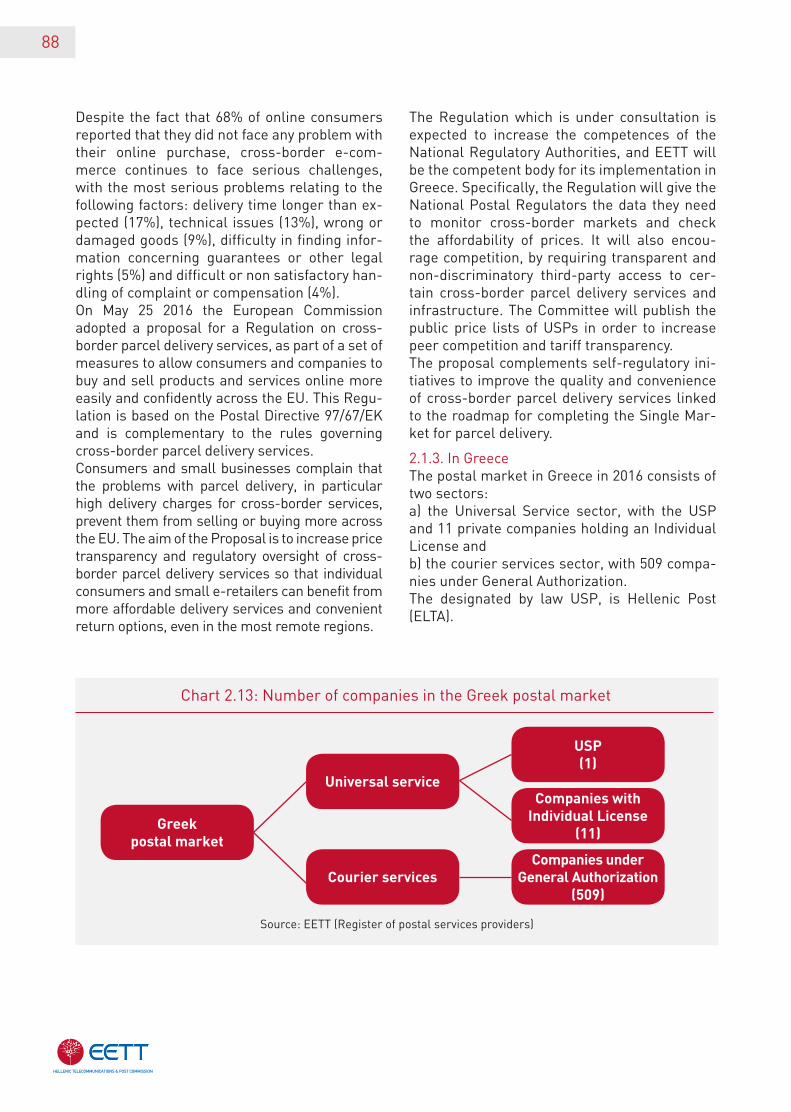
88
Despite the fact that 68% of online consumers reported that they did not face any problem with their online purchase, cross-border e-com-merce continues to face serious challenges, with the most serious problems relating to the following factors: delivery time longer than ex-pected (17%), technical issues (13%), wrong or damaged goods (9%), difficulty in finding infor-mation concerning guarantees or other legal rights (5%) and difficult or non satisfactory han-dling of complaint or compensation (4%). On May 25 2016 the European Commission adopted a proposal for a Regulation on cross-border parcel delivery services, as part of a set of measures to allow consumers and companies to buy and sell products and services online more easily and confidently across the EU. This Regu-lation is based on the Postal Directive 97/67/EK and is complementary to the rules governing cross-border parcel delivery services. Consumers and small businesses complain that the problems with parcel delivery, in particular high delivery charges for cross-border services, prevent them from selling or buying more across the EU. The aim of the Proposal is to increase price transparency and regulatory oversight of cross-border parcel delivery services so that individual consumers and small e-retailers can benefit from more affordable delivery services and convenient return options, even in the most remote regions.
The Regulation which is under consultation is expected to increase the competences of the National Regulatory Authorities, and EETT will be the competent body for its implementation in Greece. Specifically, the Regulation will give the National Postal Regulators the data they need to monitor cross-border markets and check the affordability of prices. It will also encou-rage competition, by requiring transparent and non-discriminatory third-party access to cer-tain cross-border parcel delivery services and infrastructure. The Committee will publish the public price lists of USPs in order to increase peer competition and tariff transparency.The proposal complements self-regulatory ini-tiatives to improve the quality and convenience of cross-border parcel delivery services linked to the roadmap for completing the Single Mar-ket for parcel delivery.
2.1.3. In GreeceThe postal market in Greece in 2016 consists of two sectors: a) the Universal Service sector, with the USP and 11 private companies holding an Individual License and b) the courier services sector, with 509 compa-nies under General Authorization.The designated by law USP, is Hellenic Post (ELTA).
Chart 2.13: Number of companies in the Greek postal market
Source: EETT (Register of postal services providers)
Greek postal market
Universal service
USP(1)
Companies with Individual License
(11)
Companies under General Authorization
(509)Courier services
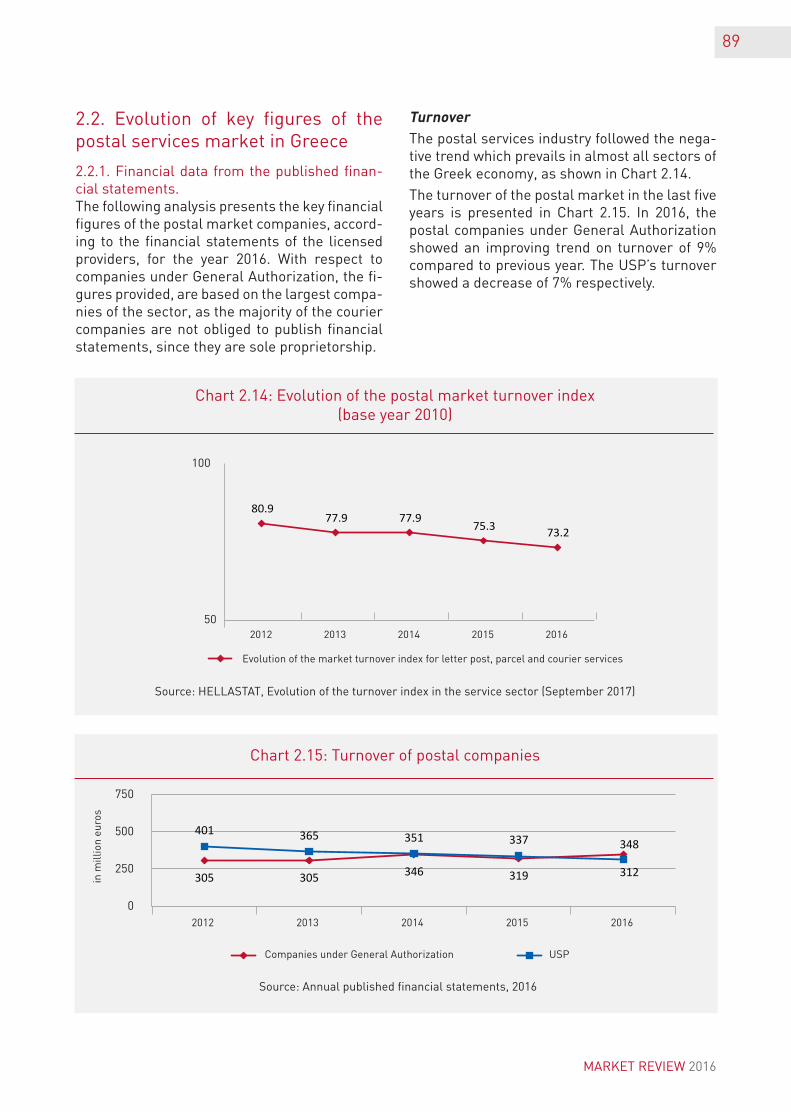
89
2.2. Evolution of key figures of the postal services market in Greece
2.2.1. Financial data from the published finan-cial statements.The following analysis presents the key financial figures of the postal market companies, accord-ing to the financial statements of the licensed providers, for the year 2016. With respect to companies under General Authorization, the fi-gures provided, are based on the largest compa-nies of the sector, as the majority of the courier companies are not obliged to publish financial statements, since they are sole proprietorship.
Turnover The postal services industry followed the nega-tive trend which prevails in almost all sectors of the Greek economy, as shown in Chart 2.14.
The turnover of the postal market in the last five years is presented in Chart 2.15. In 2016, the postal companies under General Authorization showed an improving trend on turnover of 9% compared to previous year. The USP’s turnover showed a decrease of 7% respectively.
Chart 2.14: Evolution of the postal market turnover index (base year 2010)
Chart 2.15: Turnover of postal companies
Source: HELLASTAT, Evolution of the turnover index in the service sector (September 2017)
Evolution of the market turnover index for letter post, parcel and courier services
Companies under General Authorization USP
Source: Annual published financial statements, 2016
305 305 346 319
348401 365 351 337
312
0
250
500
750
2012 2013 2014 2015 2016
MARKET REVIEW 2016
80.977.9 77.9
75.3 73.2
50
100
2012 2013 2014 2015 2016
in m
illio
n eu
ros
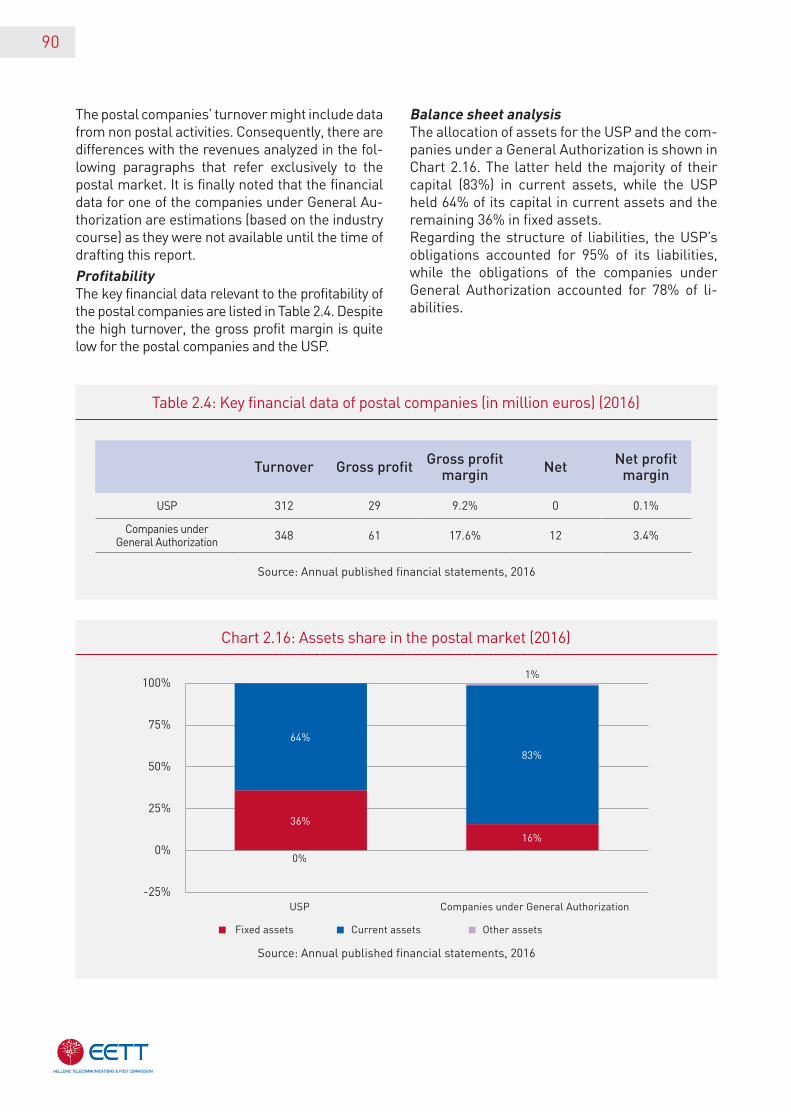
90
Source: Annual published financial statements, 2016
Source: Annual published financial statements, 2016
Other assetsCurrent assets Fixed assets
USP Companies under General Authorization
Table 2.4: Key financial data of postal companies (in million euros) (2016)
Chart 2.16: Assets share in the postal market (2016)
The postal companies’ turnover might include data from non postal activities. Consequently, there are differences with the revenues analyzed in the fol-lowing paragraphs that refer exclusively to the postal market. It is finally noted that the financial data for one of the companies under General Au-thorization are estimations (based on the industry course) as they were not available until the time of drafting this report.
ProfitabilityThe key financial data relevant to the profitability of the postal companies are listed in Table 2.4. Despite the high turnover, the gross profit margin is quite low for the postal companies and the USP.
Balance sheet analysisThe allocation of assets for the USP and the com-panies under a General Authorization is shown in Chart 2.16. The latter held the majority of their capital (83%) in current assets, while the USP held 64% of its capital in current assets and the remaining 36% in fixed assets.Regarding the structure of liabilities, the USP’s obligations accounted for 95% of its liabilities, while the obligations of the companies under General Authorization accounted for 78% of li-abilities.
Turnover Gross profit Gross profit margin Net Net profit
margin
USP 312 29 9.2% 0 0.1%
Companies under General Authorization 348 61 17.6% 12 3.4%
36%
16%
64%
83%
1%
-25%
0%
25%
50%
75%
100%
0%
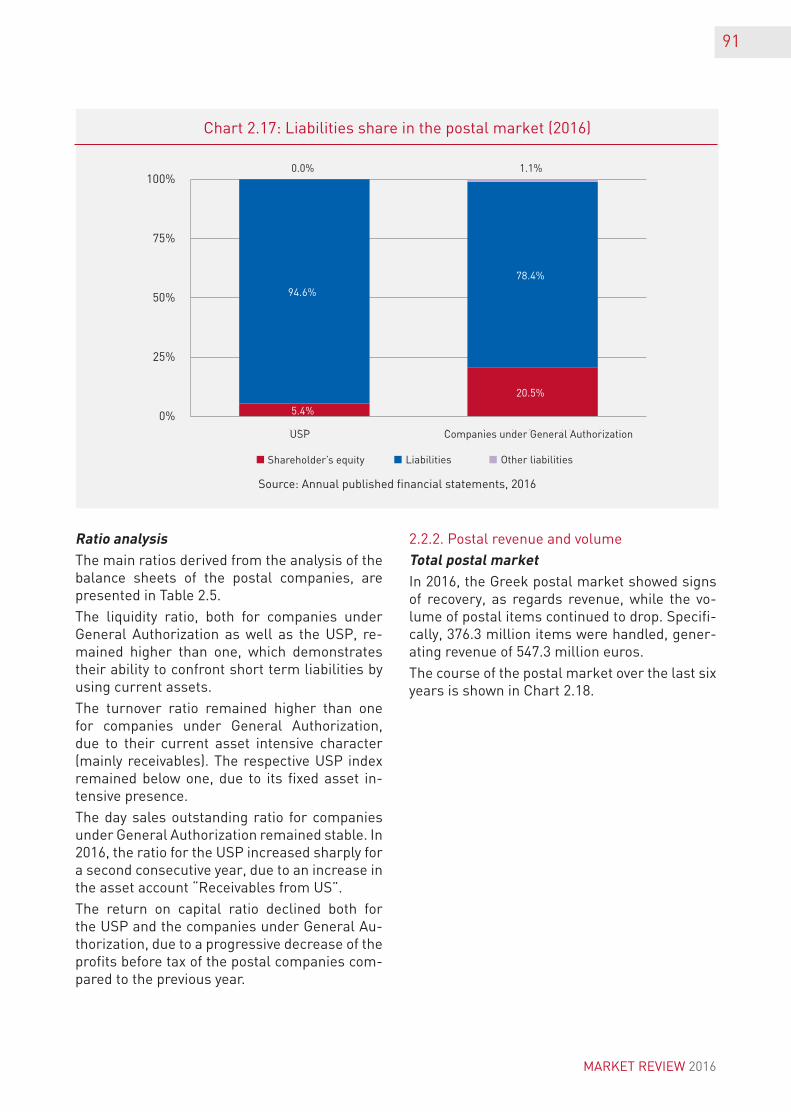
91
Source: Annual published financial statements, 2016
Chart 2.17: Liabilities share in the postal market (2016)
Ratio analysisThe main ratios derived from the analysis of the balance sheets of the postal companies, are presented in Table 2.5.
The liquidity ratio, both for companies under General Authorization as well as the USP, re-mained higher than one, which demonstrates their ability to confront short term liabilities by using current assets.
The turnover ratio remained higher than one for companies under General Authorization, due to their current asset intensive character (mainly receivables). The respective USP index remained below one, due to its fixed asset in-tensive presence.
The day sales outstanding ratio for companies under General Authorization remained stable. In 2016, the ratio for the USP increased sharply for a second consecutive year, due to an increase in the asset account “Receivables from US”.
The return on capital ratio declined both for the USP and the companies under General Au-thorization, due to a progressive decrease of the profits before tax of the postal companies com-pared to the previous year.
2.2.2. Postal revenue and volume
Total postal marketIn 2016, the Greek postal market showed signs of recovery, as regards revenue, while the vo-lume of postal items continued to drop. Specifi-cally, 376.3 million items were handled, gener-ating revenue of 547.3 million euros.
The course of the postal market over the last six years is shown in Chart 2.18.
5.4%
20.5%
94.6%
78.4%
0.0% 1.1%
0%
25%
50%
75%
100%
USP Companiesunder General Authorization
Shareholder’s Equity Liabilities Other liabilities
MARKET REVIEW 2016
USP Companies under General Authorization
Shareholder’s equity
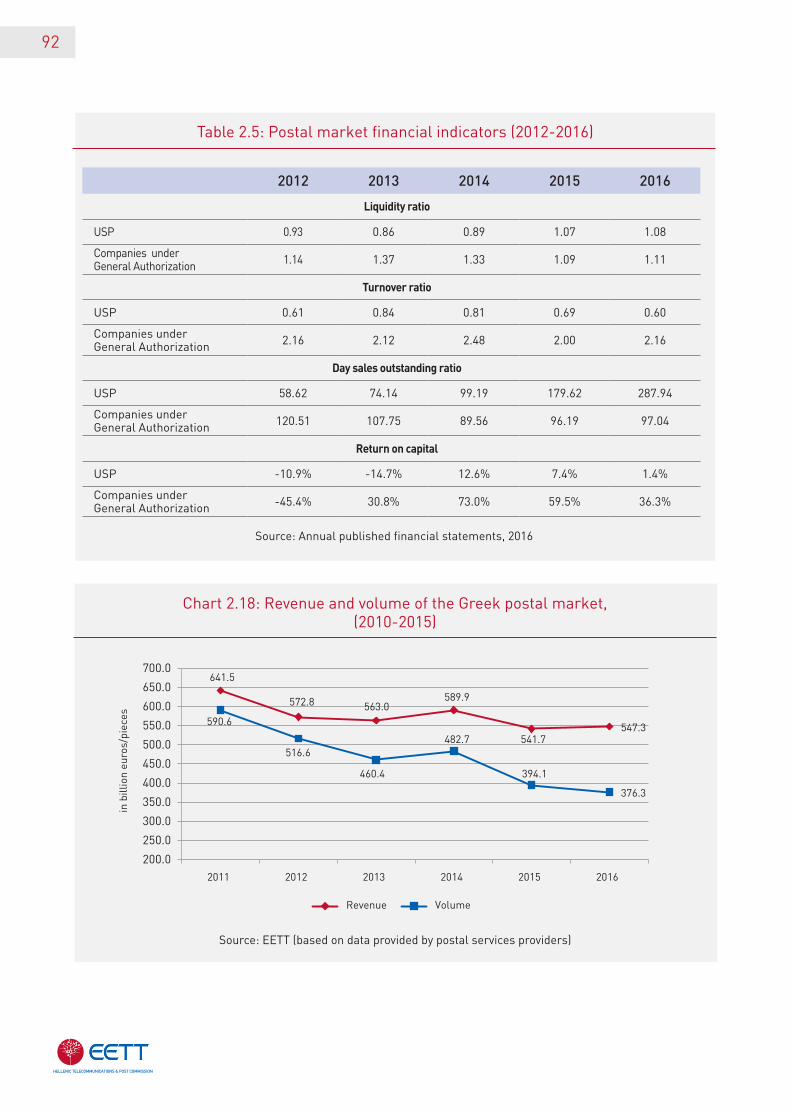
Source: EETT (based on data provided by postal services providers)
Chart 2.18: Revenue and volume of the Greek postal market, (2010-2015)
92
Source: Annual published financial statements, 2016
Table 2.5: Postal market financial indicators (2012-2016)
2012 2013 2014 2015 2016
Liquidity ratio
USP 0.93 0.86 0.89 1.07 1.08
Companies under General Authorization 1.14 1.37 1.33 1.09 1.11
Turnover ratio
USP 0.61 0.84 0.81 0.69 0.60
Companies under General Authorization 2.16 2.12 2.48 2.00 2.16
Day sales outstanding ratio
USP 58.62 74.14 99.19 179.62 287.94
Companies under General Authorization 120.51 107.75 89.56 96.19 97.04
Return on capital
USP -10.9% -14.7% 12.6% 7.4% 1.4%
Companies under General Authorization -45.4% 30.8% 73.0% 59.5% 36.3%
in b
illio
n eu
ros/
piec
es
641.5
572.8 563.0589.9
541.7547.3590.6
516.6
460.4
482.7
394.1
376.3
200.0
250.0
300.0
350.0
400.0
450.0
500.0
550.0
600.0
650.0
700.0
2011 2012 2013 2014 2015 2016
Revenue Volume
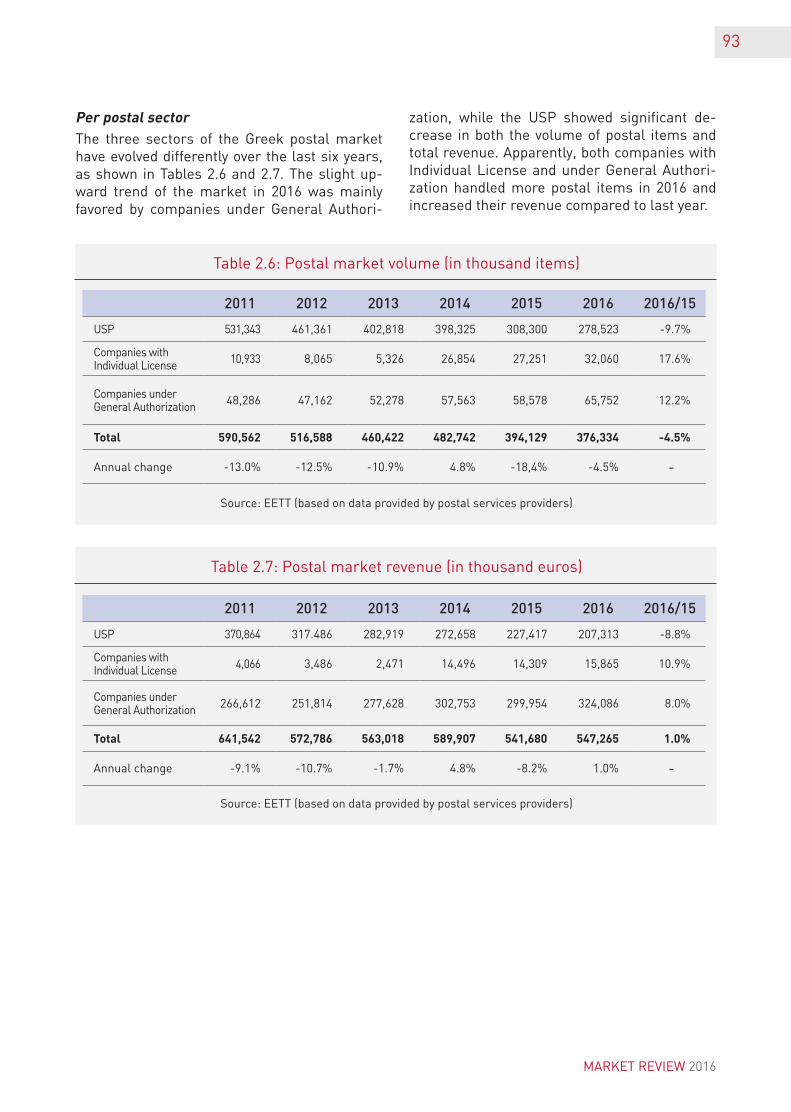
93
Per postal sectorThe three sectors of the Greek postal market have evolved differently over the last six years, as shown in Tables 2.6 and 2.7. The slight up-ward trend of the market in 2016 was mainly favored by companies under General Authori-
zation, while the USP showed significant de-crease in both the volume of postal items and total revenue. Apparently, both companies with Individual License and under General Authori-zation handled more postal items in 2016 and increased their revenue compared to last year.
Source: EETT (based on data provided by postal services providers)
Source: EETT (based on data provided by postal services providers)
Table 2.6: Postal market volume (in thousand items)
Table 2.7: Postal market revenue (in thousand euros)
2011 2012 2013 2014 2015 2016 2016/15
USP 531,343 461,361 402,818 398,325 308,300 278,523 -9.7%
Companies with Individual License 10,933 8,065 5,326 26,854 27,251 32,060 17.6%
Companies under General Authorization 48,286 47,162 52,278 57,563 58,578 65,752 12.2%
Total 590,562 516,588 460,422 482,742 394,129 376,334 -4.5%
Annual change -13.0% -12.5% -10.9% 4.8% -18,4% -4.5% -
2011 2012 2013 2014 2015 2016 2016/15
USP 370,864 317.486 282,919 272,658 227,417 207,313 -8.8%
Companies with Individual License 4,066 3,486 2,471 14,496 14,309 15,865 10.9%
Companies under General Authorization 266,612 251,814 277,628 302,753 299,954 324,086 8.0%
Total 641,542 572,786 563,018 589,907 541,680 547,265 1.0%
Annual change -9.1% -10.7% -1.7% 4.8% -8.2% 1.0% -
MARKET REVIEW 2016
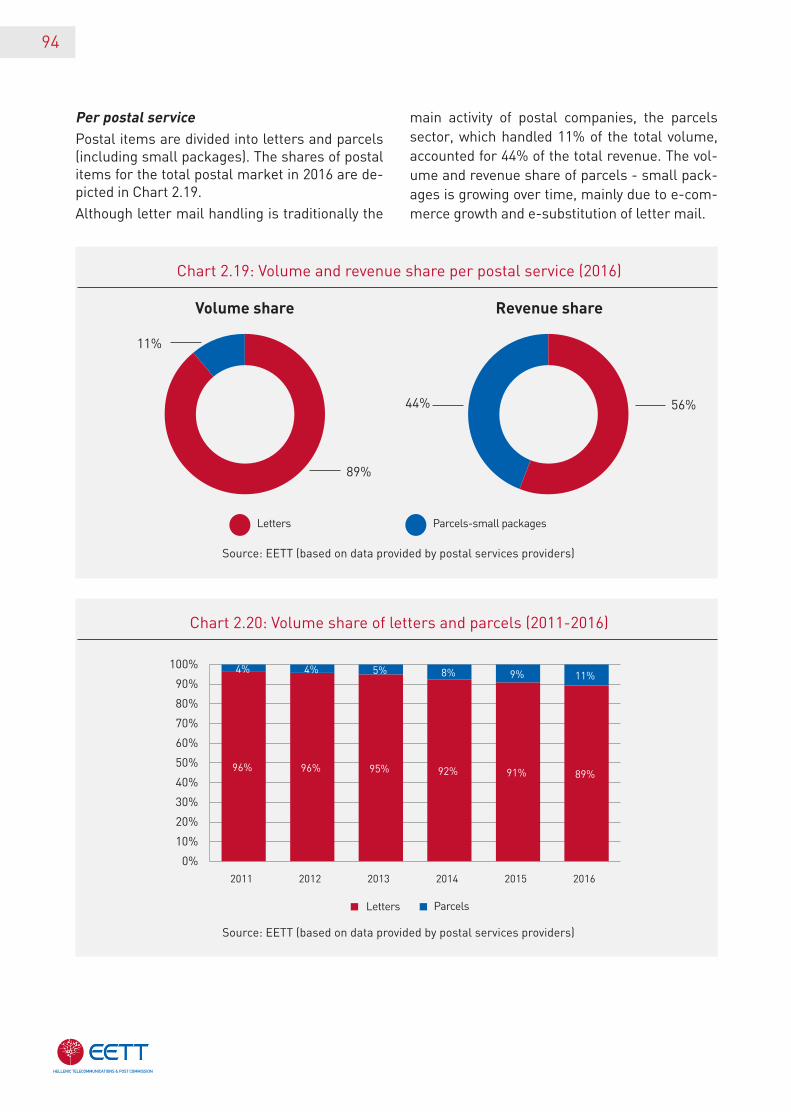
94
Per postal servicePostal items are divided into letters and parcels (including small packages). The shares of postal items for the total postal market in 2016 are de-picted in Chart 2.19.
Although letter mail handling is traditionally the
main activity of postal companies, the parcels sector, which handled 11% of the total volume, accounted for 44% of the total revenue. The vol-ume and revenue share of parcels - small pack-ages is growing over time, mainly due to e-com-merce growth and e-substitution of letter mail.
Source: EETT (based on data provided by postal services providers)
Source: EETT (based on data provided by postal services providers)
Chart 2.19: Volume and revenue share per postal service (2016)
Chart 2.20: Volume share of letters and parcels (2011-2016)
Volume share Revenue share
11%
44%
89%
56%
Letters
Letters
Parcels-small packages
Parcels
96% 96% 95% 92% 91% 89%
4% 4% 5% 8% 9% 11%
0%
10%
20%
30%
40%
50%
60%
70%
80%
90%
100%
2011 2012 2013 2014 2015 2016
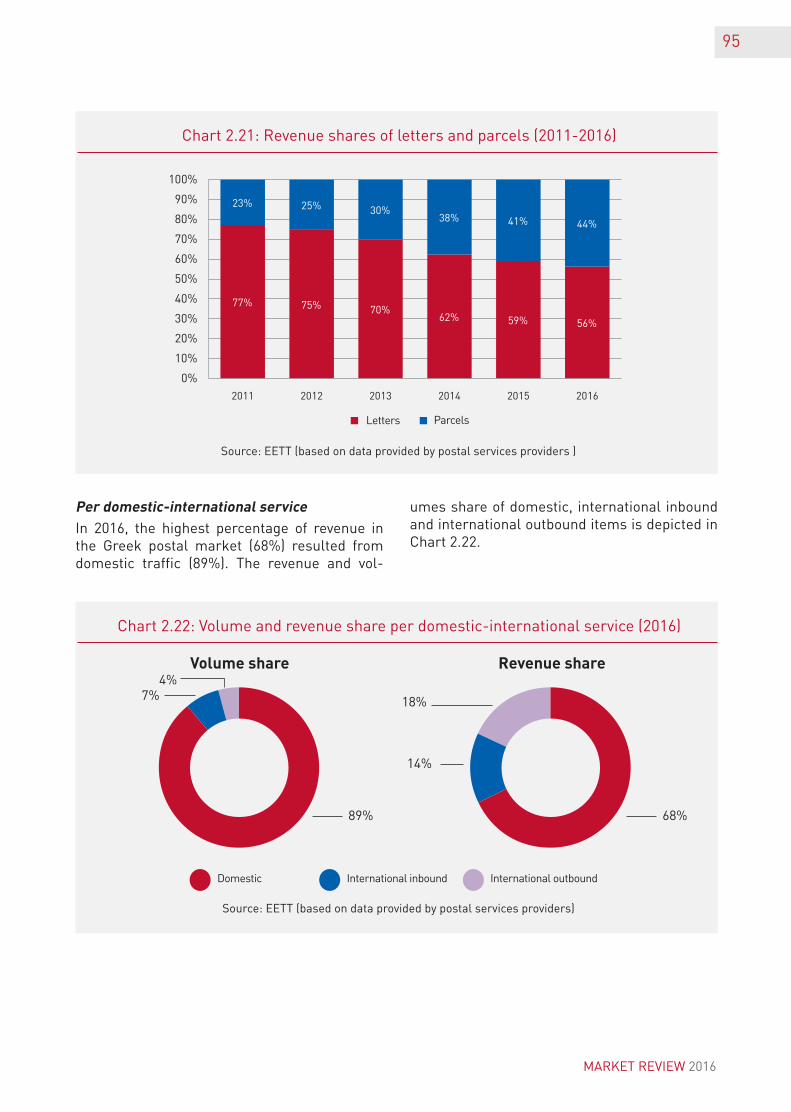
95
Source: EETT (based on data provided by postal services providers)
Source: EETT (based on data provided by postal services providers )
Chart 2.22: Volume and revenue share per domestic-international service (2016)
Chart 2.21: Revenue shares of letters and parcels (2011-2016)
Domestic International inbound International outbound
77% 75% 70%62% 59% 56%
23% 25% 30%38% 41% 44%
0%
10%
20%
30%
40%
50%
60%
70%
80%
90%
100%
2011 2012 2013 2014 2015 2016
Per domestic-international service In 2016, the highest percentage of revenue in the Greek postal market (68%) resulted from domestic traffic (89%). The revenue and vol-
umes share of domestic, international inbound and international outbound items is depicted in Chart 2.22.
Revenue share
14%
18%
68%
Volume share
7%4%
89%
Letters Parcels
MARKET REVIEW 2016
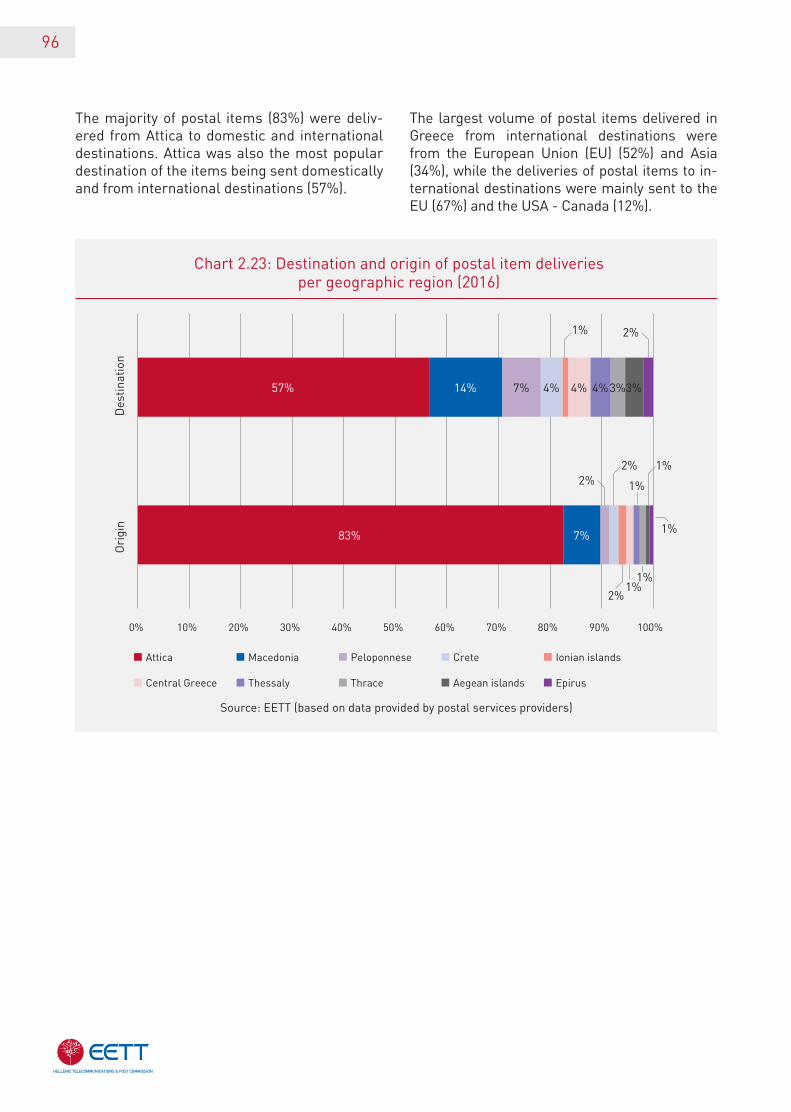
96
The majority of postal items (83%) were deliv-ered from Attica to domestic and international destinations. Attica was also the most popular destination of the items being sent domestically and from international destinations (57%).
The largest volume of postal items delivered in Greece from international destinations were from the European Union (EU) (52%) and Asia (34%), while the deliveries of postal items to in-ternational destinations were mainly sent to the EU (67%) and the USA - Canada (12%).
Source: EETT (based on data provided by postal services providers)
Chart 2.23: Destination and origin of postal item deliveriesper geographic region (2016)
83%
57%
7%
14% 7%
2%
4%
2%
1%
1%
4%
1%
4%
1%
3%
1%
3%
1%
2%
Ori
gin
Des
tina
tion
Attica Macedonia Peloponnese Crete Ionian islands
Central Greece Thessaly Thrace Aegean islands Epirus
2%
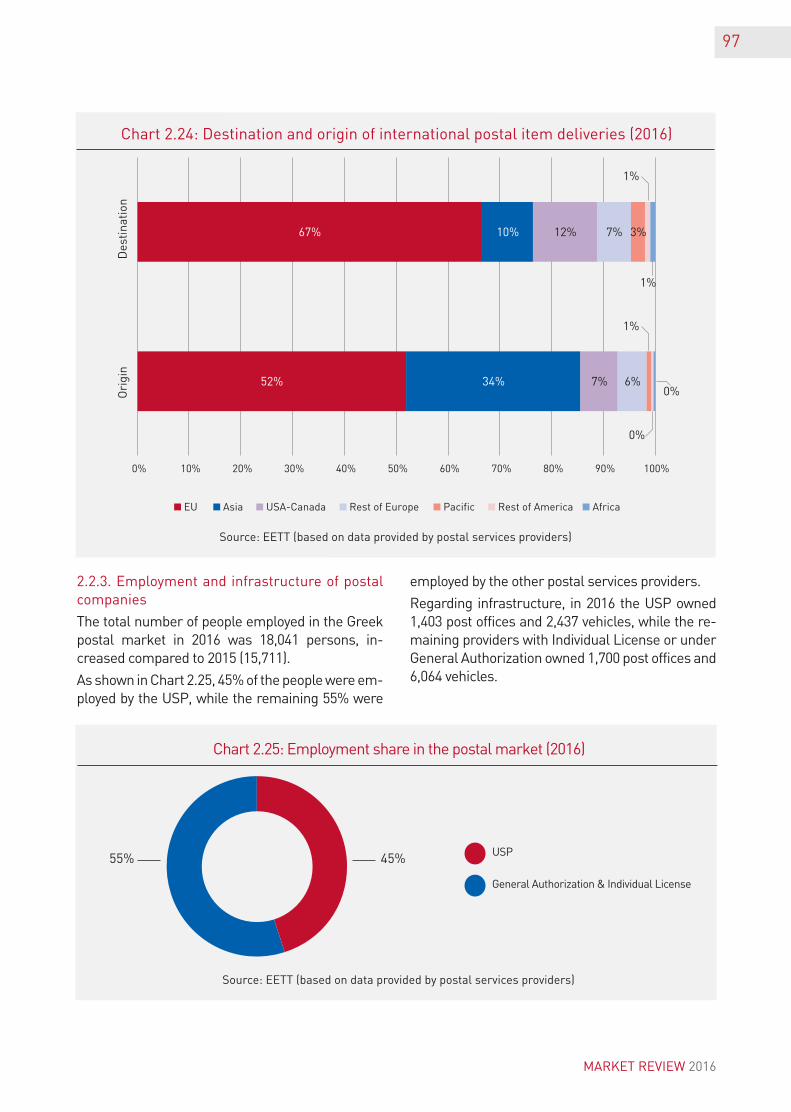
97
Source: EETT (based on data provided by postal services providers)
Chart 2.24: Destination and origin of international postal item deliveries (2016)
2.2.3. Employment and infrastructure of postal companies
The total number of people employed in the Greek postal market in 2016 was 18,041 persons, in-creased compared to 2015 (15,711).
As shown in Chart 2.25, 45% of the people were em-ployed by the USP, while the remaining 55% were
employed by the other postal services providers.
Regarding infrastructure, in 2016 the USP owned 1,403 post offices and 2,437 vehicles, while the re-maining providers with Individual License or under General Authorization owned 1,700 post offices and 6,064 vehicles.
Source: EETT (based on data provided by postal services providers)
Chart 2.25: Employment share in the postal market (2016)
45%55% USP
General Authorization & Individual License
Ori
gin
Des
tina
tion
52%
67%
34%
10%
7%
12%
6%
7% 3%
0%
1%
1%
0%
1%
0% 10% 20% 30% 40% 50% 60% 70% 80% 90% 100%
EU Asia USA-Canada Rest of Europe Pacific Rest of America Africa
MARKET REVIEW 2016
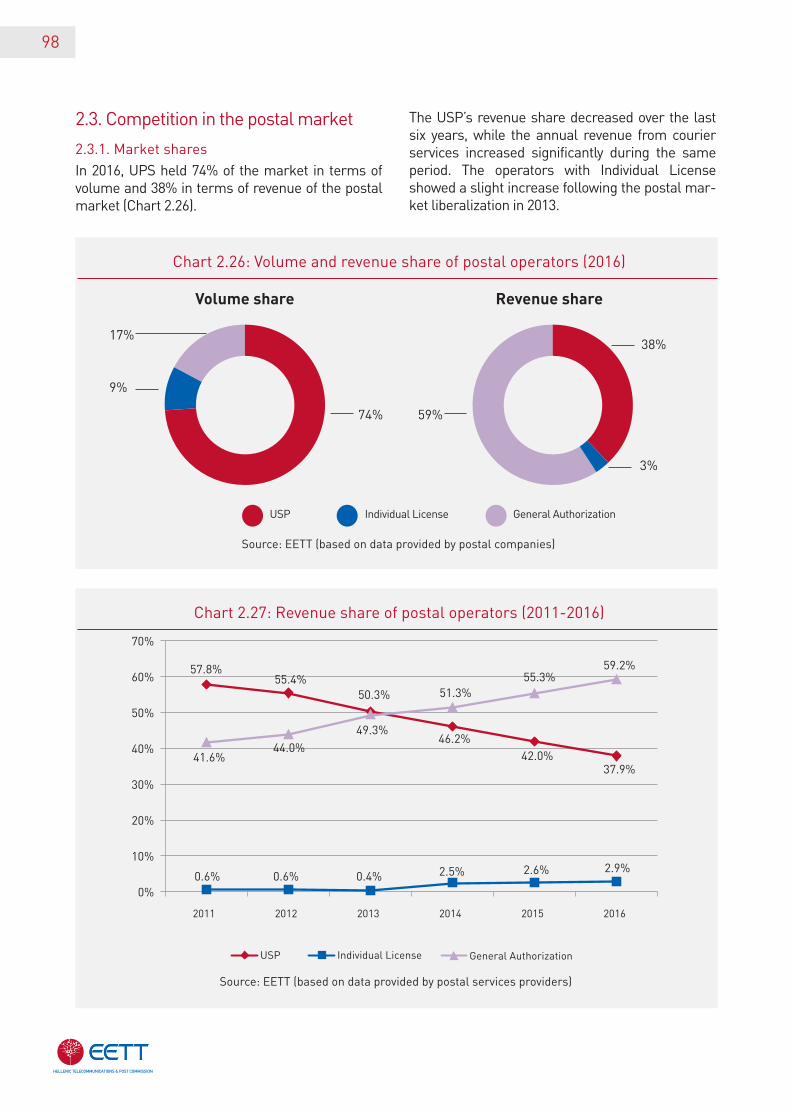
98
2.3. Competition in the postal market
2.3.1. Market shares
In 2016, UPS held 74% of the market in terms of volume and 38% in terms of revenue of the postal market (Chart 2.26).
The USP’s revenue share decreased over the last six years, while the annual revenue from courier services increased significantly during the same period. The operators with Individual License showed a slight increase following the postal mar-ket liberalization in 2013.
Source: EETT (based on data provided by postal companies)
Source: EETT (based on data provided by postal services providers)
Chart 2.26: Volume and revenue share of postal operators (2016)
Chart 2.27: Revenue share of postal operators (2011-2016)
Volume share Revenue share
9%
17%
59%74%
38%
3%
USP Individual License General Authorization
57.8%55.4%
50.3%
46.2%42.0%
37.9%
0.6% 0.6% 0.4% 2.5% 2.6% 2.9%
41.6%44.0%
49.3%
51.3%55.3%
59.2%
0%
10%
20%
30%
40%
50%
60%
70%
2011 2012 2013 2014 2015 2016
USP Individual License General Authorization
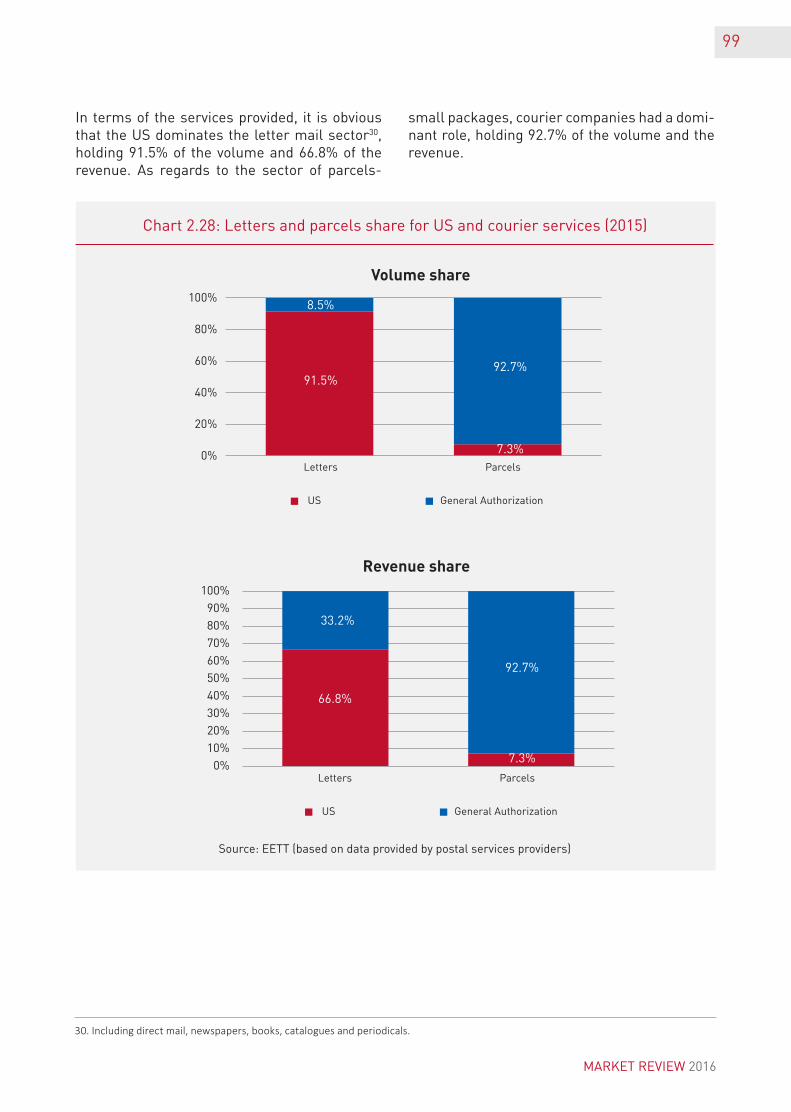
99
In terms of the services provided, it is obvious that the US dominates the letter mail sector30, holding 91.5% of the volume and 66.8% of the revenue. As regards to the sector of parcels-
small packages, courier companies had a domi-nant role, holding 92.7% of the volume and the revenue.
30. Including direct mail, newspapers, books, catalogues and periodicals.
Source: EETT (based on data provided by postal services providers)
US
Letters Parcels
General Authorization
Chart 2.28: Letters and parcels share for US and courier services (2015)
0%
20%
40%
60%
80%
100%
0%
10%
20%
30%
40%
50%
60%
70%
80%
90%
100%
8.5%
91.5%
33.2%
66.8%
92.7%
7.3%
92.7%
7.3%
US
Letters Parcels
General Authorization
Revenue share
Volume share
MARKET REVIEW 2016
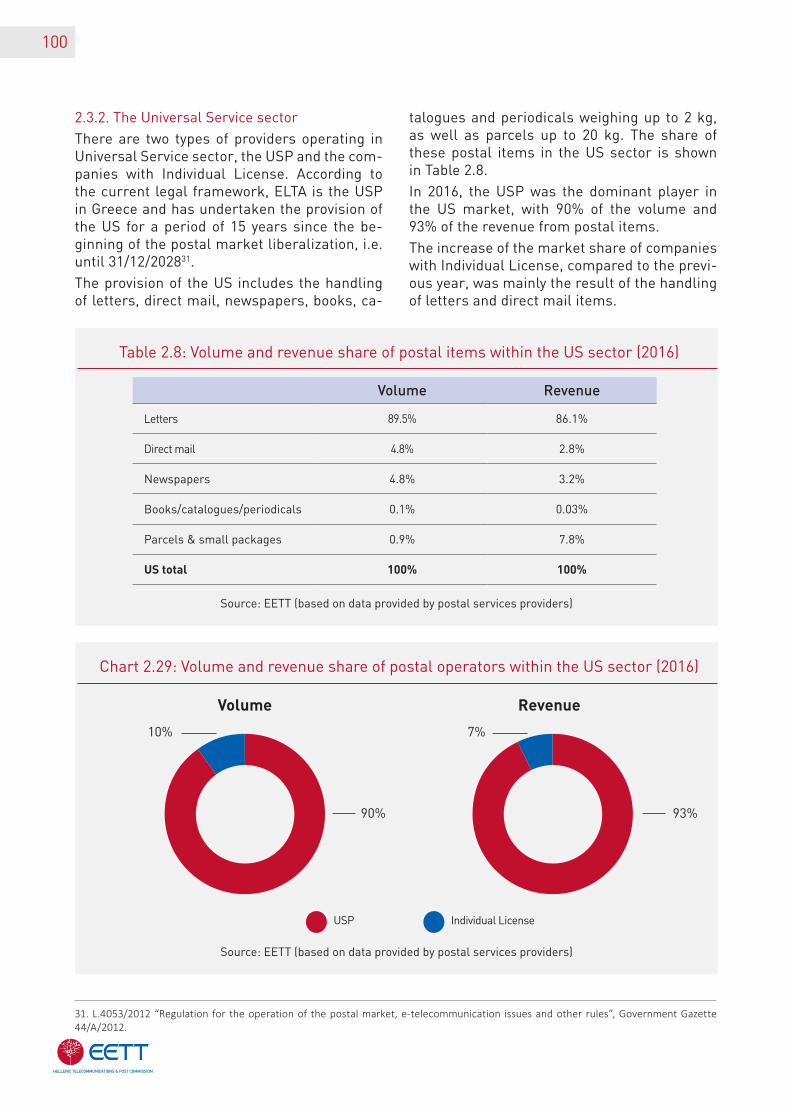
100
2.3.2. The Universal Service sector
There are two types of providers operating in Universal Service sector, the USP and the com-panies with Individual License. According to the current legal framework, ELTA is the USP in Greece and has undertaken the provision of the US for a period of 15 years since the be-ginning of the postal market liberalization, i.e. until 31/12/202831.
The provision of the US includes the handling of letters, direct mail, newspapers, books, ca-
talogues and periodicals weighing up to 2 kg, as well as parcels up to 20 kg. The share of these postal items in the US sector is shown in Table 2.8.
In 2016, the USP was the dominant player in the US market, with 90% of the volume and 93% of the revenue from postal items.
The increase of the market share of companies with Individual License, compared to the previ-ous year, was mainly the result of the handling of letters and direct mail items.
31. L.4053/2012 “Regulation for the operation of the postal market, e-telecommunication issues and other rules”, Government Gazette 44/A/2012.
Source: EETT (based on data provided by postal services providers)
Source: EETT (based on data provided by postal services providers)
Table 2.8: Volume and revenue share of postal items within the US sector (2016)
Chart 2.29: Volume and revenue share of postal operators within the US sector (2016)
Volume Revenue
Letters 89.5% 86.1%
Direct mail 4.8% 2.8%
Newspapers 4.8% 3.2%
Books/catalogues/periodicals 0.1% 0.03%
Parcels & small packages 0.9% 7.8%
US total 100% 100%
Volume Revenue
10%
90% 93%
7%
USP Individual License
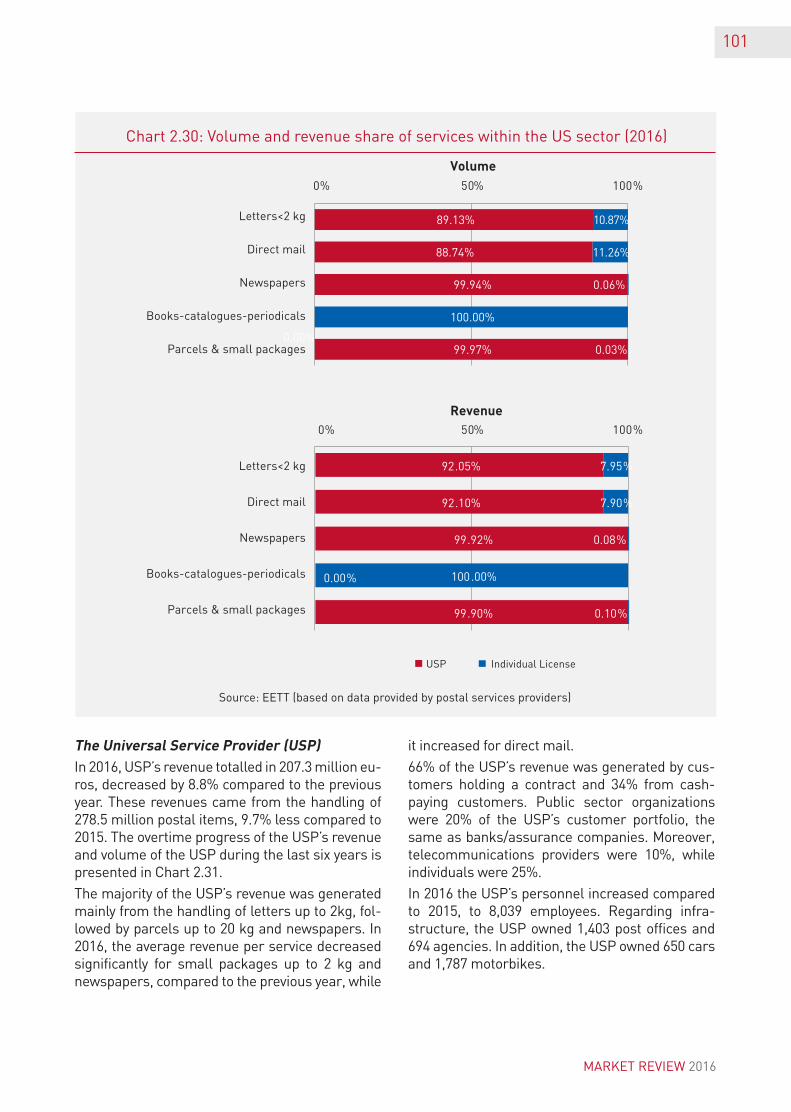
101
Source: EETT (based on data provided by postal services providers)
Chart 2.30: Volume and revenue share of services within the US sector (2016)
0,00%
The Universal Service Provider (USP)In 2016, USP’s revenue totalled in 207.3 million eu-ros, decreased by 8.8% compared to the previous year. These revenues came from the handling of 278.5 million postal items, 9.7% less compared to 2015. The overtime progress of the USP’s revenue and volume of the USP during the last six years is presented in Chart 2.31.
The majority of the USP’s revenue was generated mainly from the handling of letters up to 2kg, fol-lowed by parcels up to 20 kg and newspapers. In 2016, the average revenue per service decreased significantly for small packages up to 2 kg and newspapers, compared to the previous year, while
it increased for direct mail.
66% of the USP’s revenue was generated by cus-tomers holding a contract and 34% from cash-paying customers. Public sector organizations were 20% of the USP’s customer portfolio, the same as banks/assurance companies. Moreover, telecommunications providers were 10%, while individuals were 25%.
In 2016 the USP’s personnel increased compared to 2015, to 8,039 employees. Regarding infra-structure, the USP owned 1,403 post offices and 694 agencies. In addition, the USP owned 650 cars and 1,787 motorbikes.
MARKET REVIEW 2016
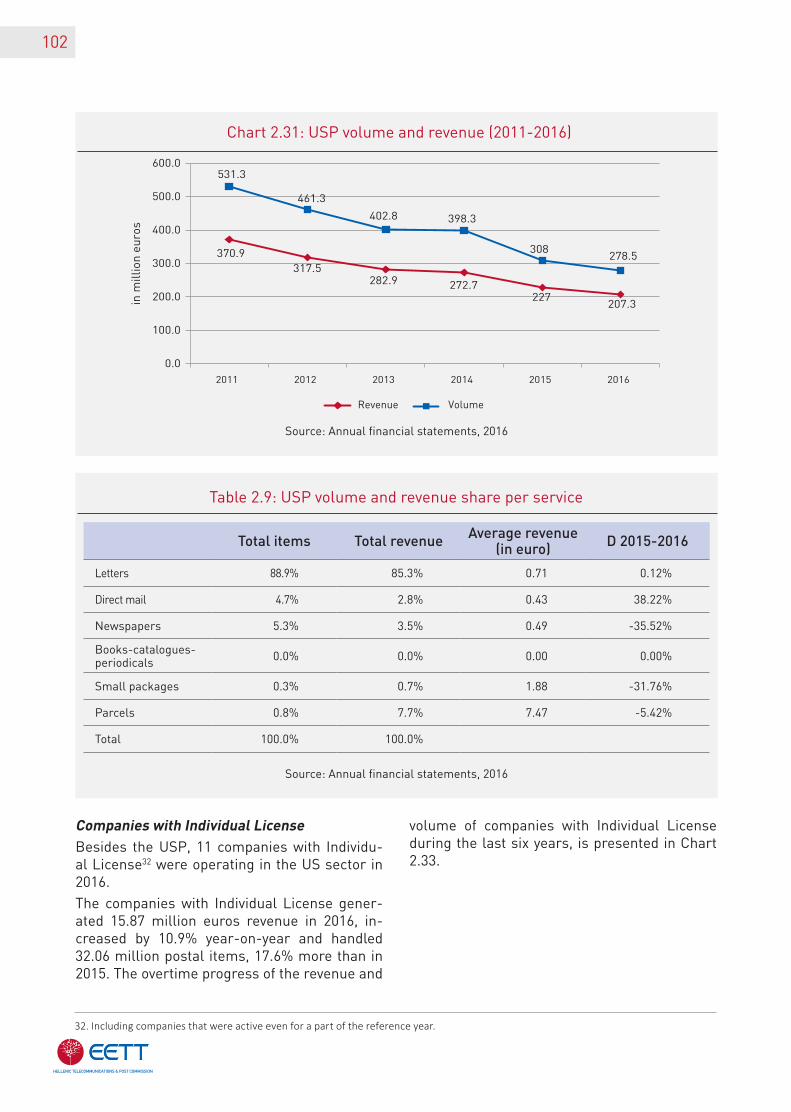
102
Source: Annual financial statements, 2016
Chart 2.31: USP volume and revenue (2011-2016)
Source: Annual financial statements, 2016
Table 2.9: USP volume and revenue share per service
Total items Total revenue Average revenue (in euro) D 2015-2016
Letters 88.9% 85.3% 0.71 0.12%
Direct mail 4.7% 2.8% 0.43 38.22%
Newspapers 5.3% 3.5% 0.49 -35.52%
Books-catalogues- periodicals 0.0% 0.0% 0.00 0.00%
Small packages 0.3% 0.7% 1.88 -31.76%
Parcels 0.8% 7.7% 7.47 -5.42%
Total 100.0% 100.0%
Companies with Individual License Besides the USP, 11 companies with Individu-al License32 were operating in the US sector in 2016.
The companies with Individual License gener-ated 15.87 million euros revenue in 2016, in-creased by 10.9% year-on-year and handled 32.06 million postal items, 17.6% more than in 2015. The overtime progress of the revenue and
volume of companies with Individual License during the last six years, is presented in Chart 2.33.
32. Including companies that were active even for a part of the reference year.
in m
illio
n eu
ros
370.9317.5
282.9 272.7227
207.3
531.3
461.3
402.8 398.3
308278.5
0.0
100.0
200.0
300.0
400.0
500.0
600.0
2011 2012 2013 2014 2015 2016
Revenue Volume
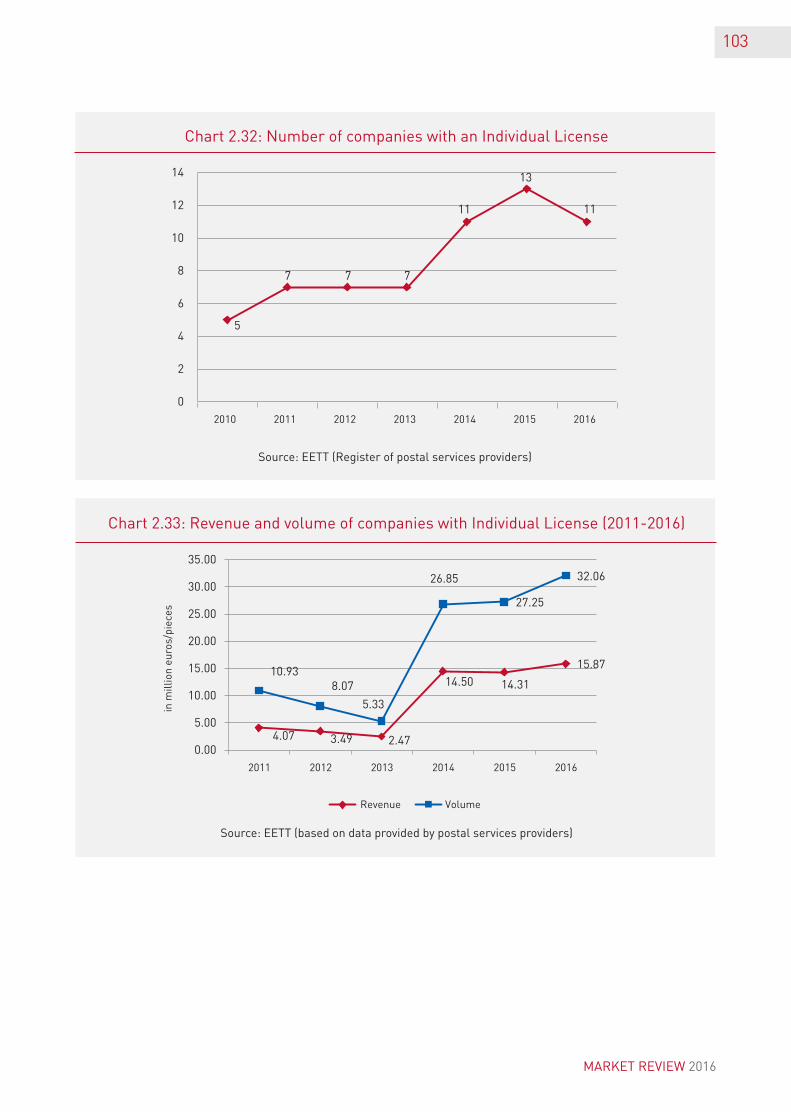
103
Source: EETT (Register of postal services providers)
Chart 2.32: Number of companies with an Individual License
5
7
11
13
11
0
2
4
6
8
10
12
14
2010 2011 2012 2013 2014 2015 2016
77
Source: EETT (based on data provided by postal services providers)
in m
illio
n eu
ros/
piec
es
Chart 2.33: Revenue and volume of companies with Individual License (2011-2016)
4.07 3.49 2.47
14.50 14.31
15.8710.93
8.07
5.33
26.85
27.25
32.06
0.00
5.00
10.00
15.00
20.00
25.00
30.00
35.00
2011 2012 2013
Revenue Volume
2014 2015 2016
MARKET REVIEW 2016
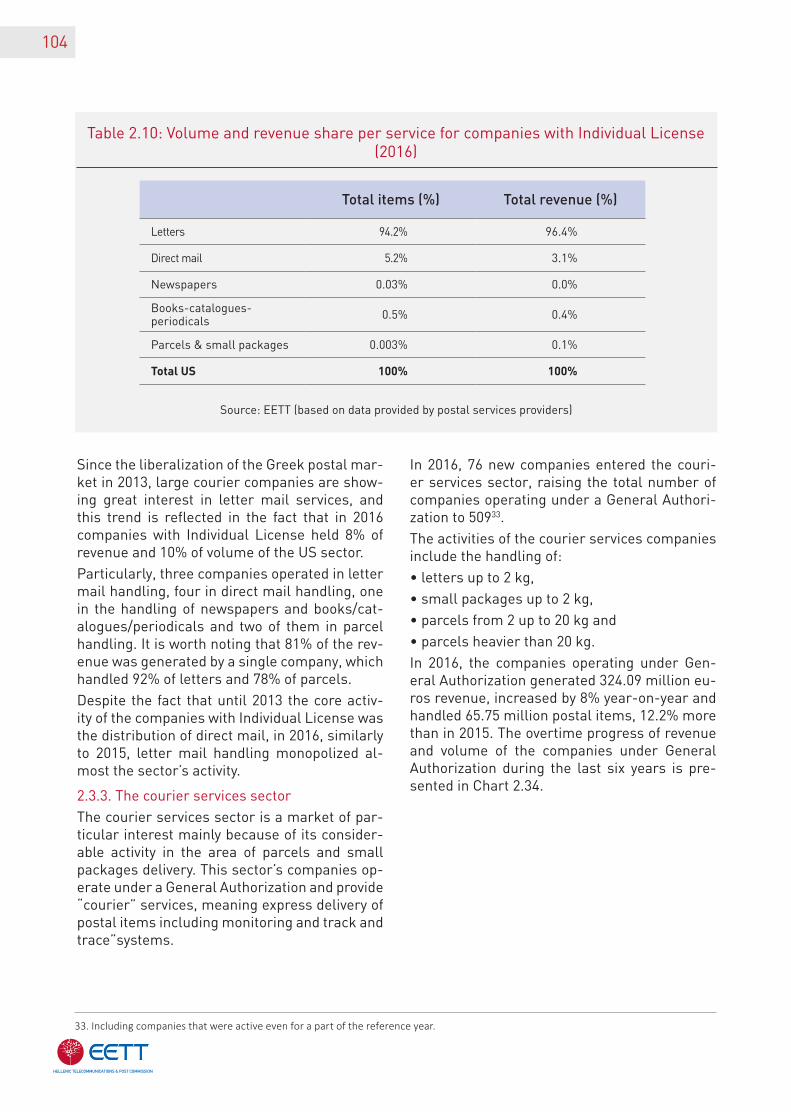
104
Source: EETT (based on data provided by postal services providers)
Table 2.10: Volume and revenue share per service for companies with Individual License (2016)
Total items (%) Total revenue (%)
Letters 94.2% 96.4%
Direct mail 5.2% 3.1%
Newspapers 0.03% 0.0%
Books-catalogues-periodicals 0.5% 0.4%
Parcels & small packages 0.003% 0.1%
Total US 100% 100%
Since the liberalization of the Greek postal mar-ket in 2013, large courier companies are show-ing great interest in letter mail services, and this trend is reflected in the fact that in 2016 companies with Individual License held 8% of revenue and 10% of volume of the US sector.
Particularly, three companies operated in letter mail handling, four in direct mail handling, one in the handling of newspapers and books/cat-alogues/periodicals and two of them in parcel handling. It is worth noting that 81% of the rev-enue was generated by a single company, which handled 92% of letters and 78% of parcels.
Despite the fact that until 2013 the core activ-ity of the companies with Individual License was the distribution of direct mail, in 2016, similarly to 2015, letter mail handling monopolized al-most the sector’s activity.
2.3.3. The courier services sector
The courier services sector is a market of par-ticular interest mainly because of its consider-able activity in the area of parcels and small packages delivery. This sector’s companies op-erate under a General Authorization and provide “courier” services, meaning express delivery of postal items including monitoring and track and trace”systems.
In 2016, 76 new companies entered the couri-er services sector, raising the total number of companies operating under a General Authori-zation to 50933.
The activities of the courier services companies include the handling of:
• letters up to 2 kg,
• small packages up to 2 kg,
• parcels from 2 up to 20 kg and
• parcels heavier than 20 kg.
In 2016, the companies operating under Gen-eral Authorization generated 324.09 million eu-ros revenue, increased by 8% year-on-year and handled 65.75 million postal items, 12.2% more than in 2015. The overtime progress of revenue and volume of the companies under General Authorization during the last six years is pre-sented in Chart 2.34.
33. Including companies that were active even for a part of the reference year.
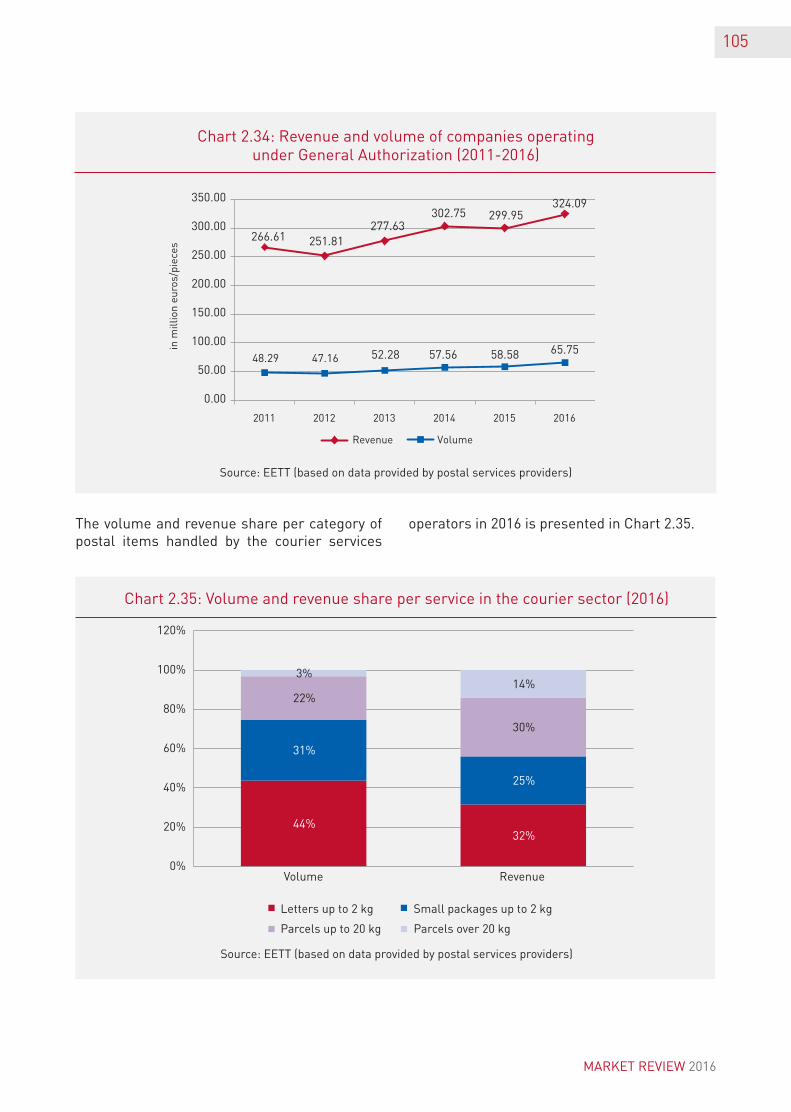
105
Source: EETT (based on data provided by postal services providers)
Chart 2.34: Revenue and volume of companies operating under General Authorization (2011-2016)
The volume and revenue share per category of postal items handled by the courier services
operators in 2016 is presented in Chart 2.35.
Source: EETT (based on data provided by postal services providers)
Volume
Letters up to 2 kg
Parcels up to 20 kg
Small packages up to 2 kg
Parcels over 20 kg
Revenue
Chart 2.35: Volume and revenue share per service in the courier sector (2016)
44%32%
31%
25%
22%
30%
3%14%
0%
20%
40%
60%
80%
100%
120%
in m
illio
n eu
ros/
piec
es
266.61 251.81277.63
302.75 299.95324.09
52.28 57.56 58.58 65.75
0.00
50.00
100.00
150.00
200.00
250.00
300.00
350.00
2011 2012 2013 2014 2015 2016
48.29 47.16
Revenue Volume
MARKET REVIEW 2016
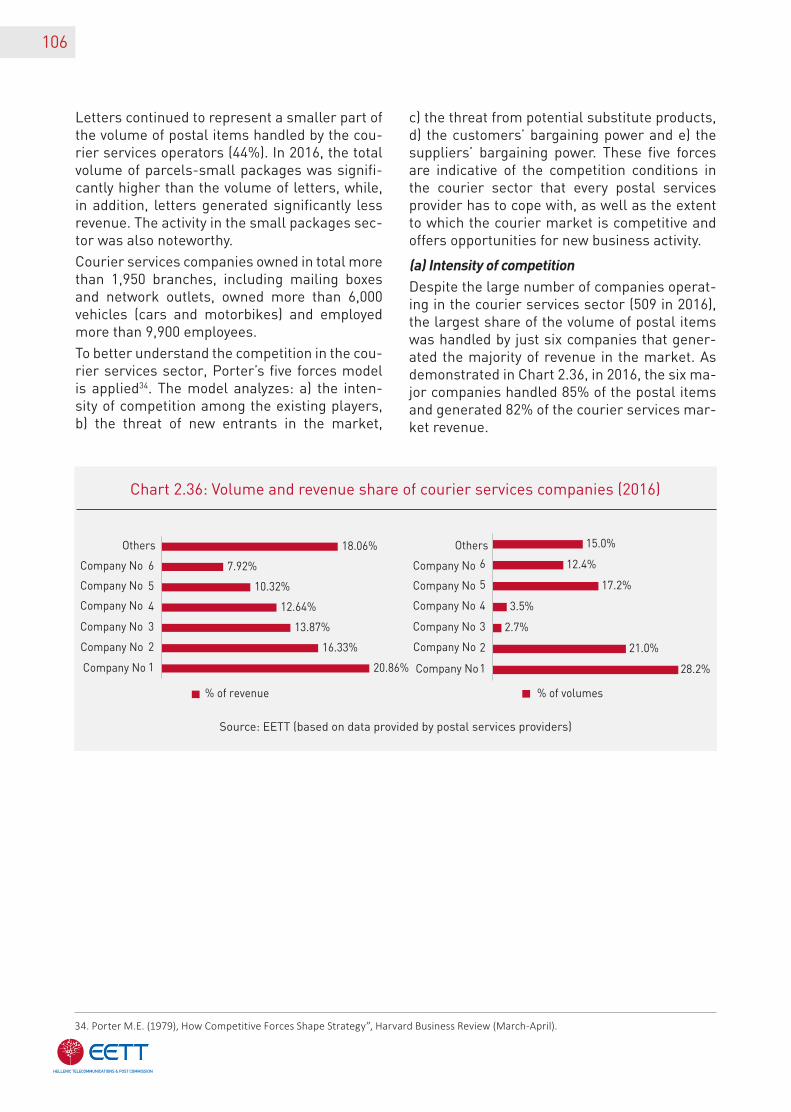
106
Letters continued to represent a smaller part of the volume of postal items handled by the cou-rier services operators (44%). In 2016, the total volume of parcels-small packages was signifi-cantly higher than the volume of letters, while, in addition, letters generated significantly less revenue. The activity in the small packages sec-tor was also noteworthy.
Courier services companies owned in total more than 1,950 branches, including mailing boxes and network outlets, owned more than 6,000 vehicles (cars and motorbikes) and employed more than 9,900 employees.
To better understand the competition in the cou-rier services sector, Porter’s five forces model is applied34. The model analyzes: a) the inten-sity of competition among the existing players, b) the threat of new entrants in the market,
c) the threat from potential substitute products, d) the customers’ bargaining power and e) the suppliers’ bargaining power. These five forces are indicative of the competition conditions in the courier sector that every postal services provider has to cope with, as well as the extent to which the courier market is competitive and offers opportunities for new business activity.
(a) Intensity of competitionDespite the large number of companies operat-ing in the courier services sector (509 in 2016), the largest share of the volume of postal items was handled by just six companies that gener-ated the majority of revenue in the market. As demonstrated in Chart 2.36, in 2016, the six ma-jor companies handled 85% of the postal items and generated 82% of the courier services mar-ket revenue.
34. Porter M.E. (1979), How Competitive Forces Shape Strategy”, Harvard Business Review (March-April).
Source: EETT (based on data provided by postal services providers)
Chart 2.36: Volume and revenue share of courier services companies (2016)
20.86%
16.33%
13.87%
12.64%
10.32%
7.92%
18.06%
1
2
3
4
5
Company No
Company No
Company No
Company No
Company No
Company No
6
2.7%
3.5%
28.2%
21.0%
17.2%
12.4%
15.0%
1
2
3
4
5
6
Others
Company No
Company No
Company No
Company No
Company No
Company No
Others
% of revenue % of volumes
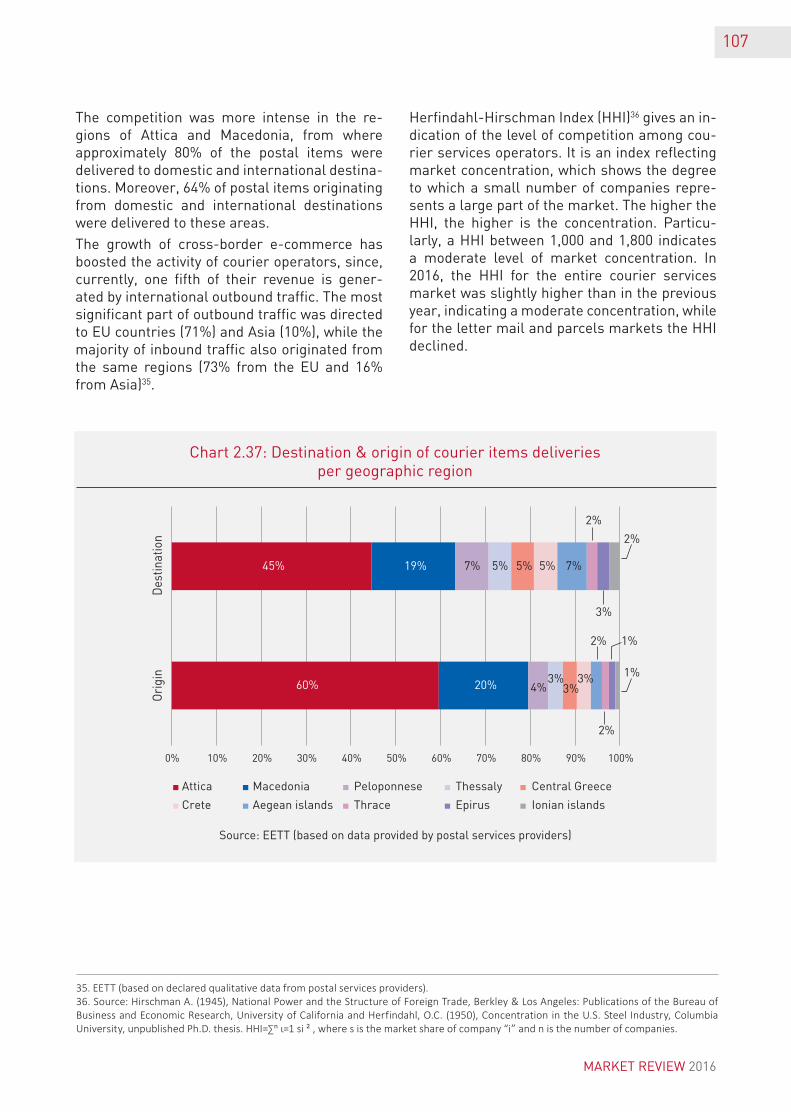
107
35. EETT (based on declared qualitative data from postal services providers).36. Source: Hirschman A. (1945), National Power and the Structure of Foreign Trade, Berkley & Los Angeles: Publications of the Bureau of Business and Economic Research, University of California and Herfindahl, O.C. (1950), Concentration in the U.S. Steel Industry, Columbia University, unpublished Ph.D. thesis. ΗΗΙ=∑ⁿ ι=1 si ² , where s is the market share of company “i” and n is the number of companies.
Source: EETT (based on data provided by postal services providers)
Chart 2.37: Destination & origin of courier items deliveriesper geographic region
The competition was more intense in the re-gions of Attica and Macedonia, from where approximately 80% of the postal items were deli vered to domestic and international destina-tions. Moreover, 64% of postal items originating from domestic and international destinations were delivered to these areas.
The growth of cross-border e-commerce has boosted the activity of courier operators, since, currently, one fifth of their revenue is gener-ated by international outbound traffic. The most significant part of outbound traffic was directed to EU countries (71%) and Asia (10%), while the majority of inbound traffic also originated from the same regions (73% from the EU and 16% from Asia)35.
Herfindahl-Hirschman Index (HHΙ)36 gives an in-dication of the level of competition among cou-rier services operators. It is an index reflecting market concentration, which shows the degree to which a small number of companies repre-sents a large part of the market. The higher the HHI, the higher is the concentration. Particu-larly, a HHI between 1,000 and 1,800 indicates a moderate level of market concentration. In 2016, the HHI for the entire courier services market was slightly higher than in the previous year, indicating a moderate concentration, while for the letter mail and parcels markets the HHI declined.
MARKET REVIEW 2016
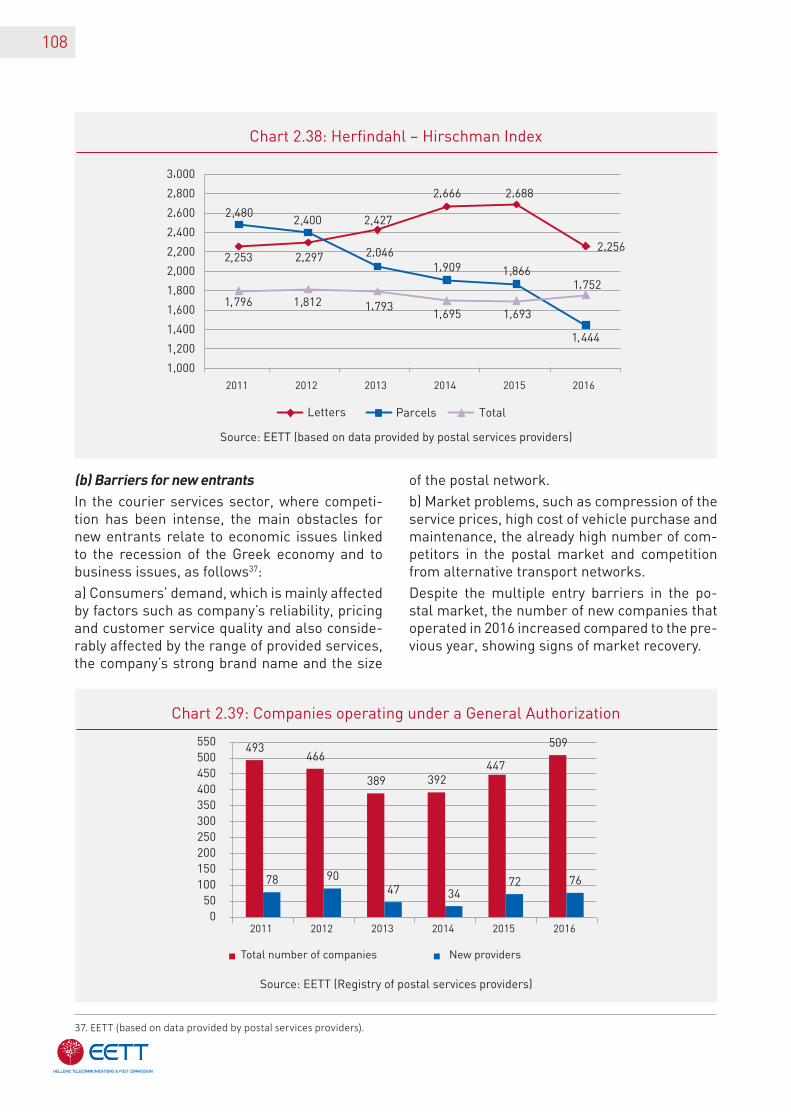
108
Source: EETT (based on data provided by postal services providers)
Source: EETT (Registry of postal services providers)
Chart 2.38: Herfindahl – Hirschman Index
Chart 2.39: Companies operating under a General Authorization
(b) Barriers for new entrantsIn the courier services sector, where competi-tion has been intense, the main obstacles for new entrants relate to economic issues linked to the recession of the Greek economy and to business issues, as follows37:
a) Consumers’ demand, which is mainly affected by factors such as company’s reliability, pricing and customer service quality and also conside-rably affected by the range of provided services, the company’s strong brand name and the size
of the postal network.
b) Market problems, such as compression of the service prices, high cost of vehicle purchase and maintenance, the already high number of com-petitors in the postal market and competition from alternative transport networks.
Despite the multiple entry barriers in the po-stal market, the number of new companies that operated in 2016 increased compared to the pre-vious year, showing signs of market recovery.
37. EETT (based on data provided by postal services providers).
493466
389 392447
509
78 9047 34
72 76
050
100150200250300350400450500550
2011 2012 2013 2014 2015 2016
Total number of companies New providers
Letters Parcels Total
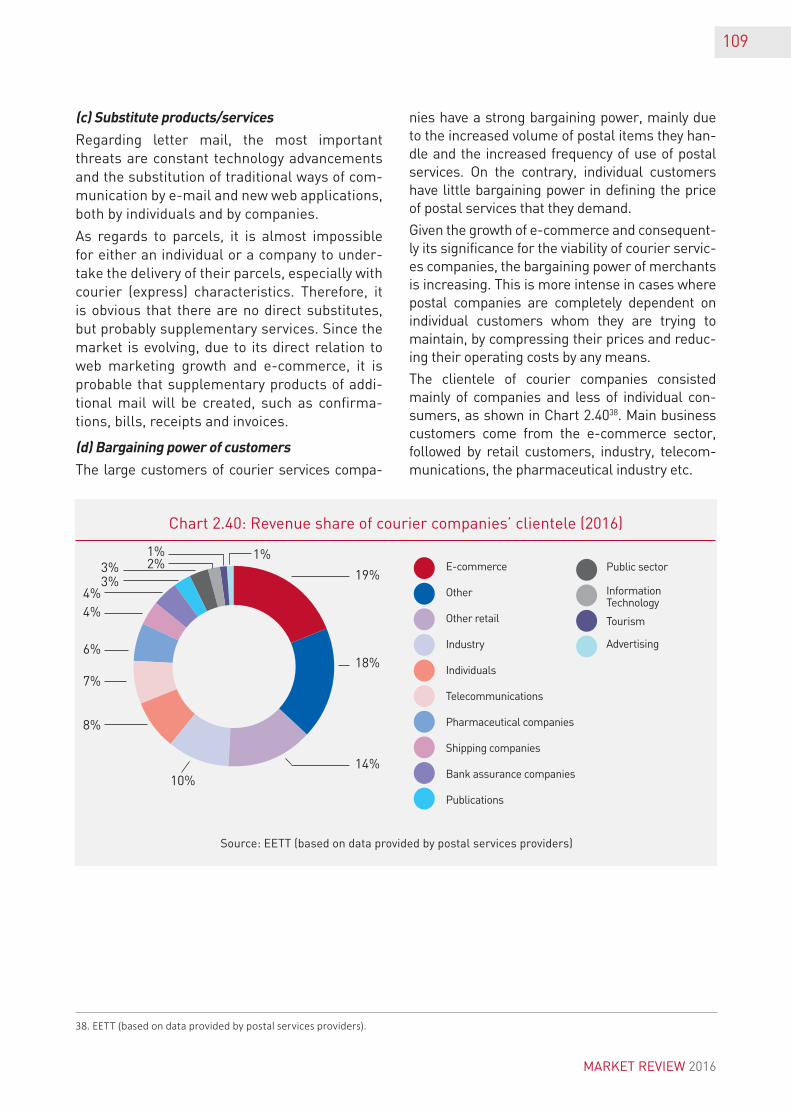
109
(c) Substitute products/services
Regarding letter mail, the most important threats are constant technology advancements and the substitution of traditional ways of com-munication by e-mail and new web applications, both by individuals and by companies.
As regards to parcels, it is almost impossible for either an individual or a company to under-take the delivery of their parcels, especially with courier (express) characteristics. Therefore, it is obvious that there are no direct substitutes, but probably supplementary services. Since the market is evolving, due to its direct relation to web marketing growth and e-commerce, it is probable that supplementary products of addi-tional mail will be created, such as confirma-tions, bills, receipts and invoices.
(d) Bargaining power of customers
The large customers of courier services compa-
nies have a strong bargaining power, mainly due to the increased volume of postal items they han-dle and the increased frequency of use of postal services. On the contrary, individual customers have little bargaining power in defining the price of postal services that they demand.
Given the growth of e-commerce and consequent-ly its significance for the viability of courier servic-es companies, the bargaining power of merchants is increasing. This is more intense in cases where postal companies are completely dependent on individual customers whom they are trying to maintain, by compressing their prices and reduc-ing their operating costs by any means.
The clientele of courier companies consisted mainly of companies and less of individual con-sumers, as shown in Chart 2.4038. Main business customers come from the e-commerce sector, followed by retail customers, industry, telecom-munications, the pharmaceutical industry etc.
38. EETT (based on data provided by postal services providers).
Chart 2.40: Revenue share of courier companies’ clientele (2016)
19%
18%
14%10%
3%3%
1%1%2%
4%4%
6%
7%
8%
E-commerce
Other
Other retail
Industry
Individuals
Telecommunications
Pharmaceutical companies
Shipping companies
Bank assurance companies
Publications
Source: EETT (based on data provided by postal services providers)
Public sector
Information Technology
Tourism
Advertising
MARKET REVIEW 2016
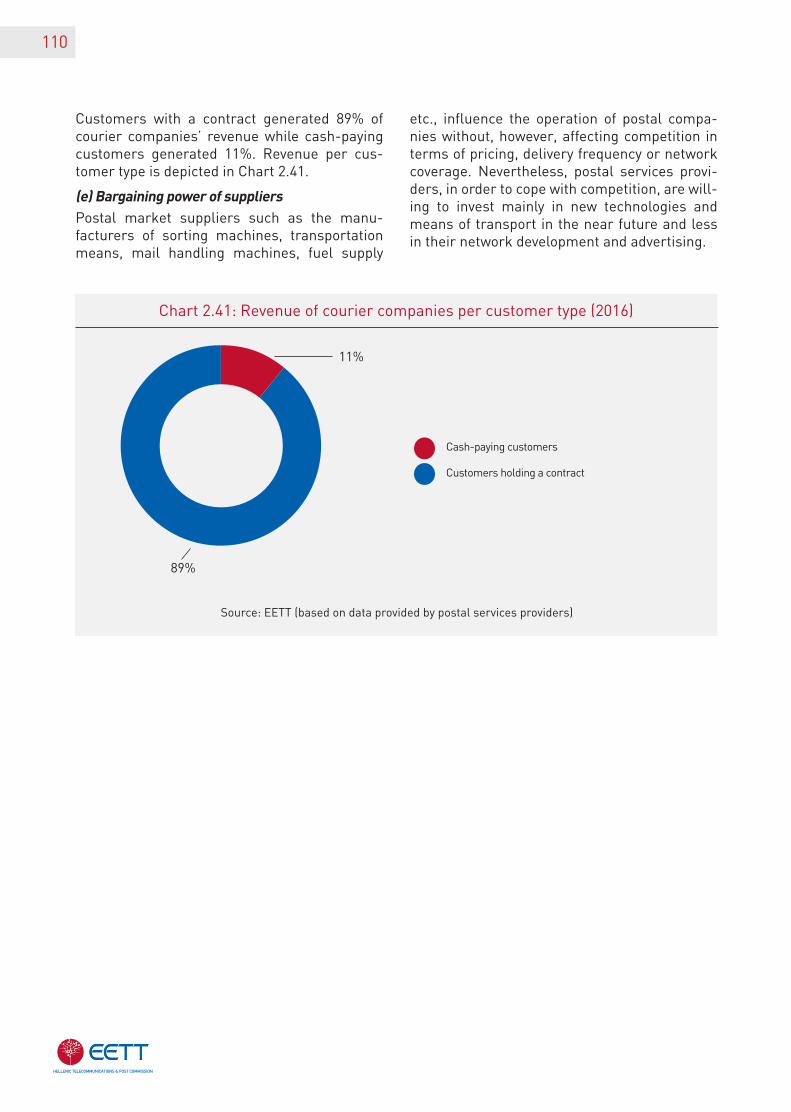
110
Customers with a contract generated 89% of courier companies’ revenue while cash-paying customers generated 11%. Revenue per cus-tomer type is depicted in Chart 2.41.
(e) Bargaining power of suppliersPostal market suppliers such as the manu-facturers of sorting machines, transportation means, mail handling machines, fuel supply
etc., influence the operation of postal compa-nies without, however, affecting competition in terms of pricing, delivery frequency or network coverage. Nevertheless, postal services provi-ders, in order to cope with competition, are will-ing to invest mainly in new technologies and means of transport in the near future and less in their network development and advertising.
Chart 2.41: Revenue of courier companies per customer type (2016)
89%
11%
Cash-paying customers
Customers holding a contract
Source: EETT (based on data provided by postal services providers)

111
MARKET REVIEW 2016
INDEX OF CHARTS & TABLES
112
Chart 1.1: Licensed operators (2016) 11
Chart 1.2: Telecommunications’ contribution to GDP 13
Chart 1.3: Number of personnel 13
Chart 1.4: Progress of the monthly Consumer Price Index (General Index – Communications Sub-Index) 14
Chart 1.5: Variation of the monthly Consumer Price Index over time 14
Chart 1.6: Turnover of Electronic Communications’ operators 16
Chart 1.7: Turnover of fixed & mobile telephony operators 16
Chart 1.8: Turnover breakdown 16
Chart 1.9: Telecommunications services breakdown 17
Chart 1.10: Fixed networks revenues breakdown 17
Chart 1.11: Mobile networks revenues breakdown 18
Chart 1.12: Electronic Communications operators’ investments 18
Chart 1.13: Electronic Communications operators’ investments breakdown for 2016 19
Chart 1.14: Growth rate of Investments/turnover ratio 19
Chart 1.15: Investments/turnover ratio 20
Chart 1.16: Profits Before Interest, Tax, Depreciation and Amortization (EBITDA) 20
Chart 1.17: Progress of telephone lines 21
Charts
113
Chart 1.18: Market shares based on the total number of access lines (at the end of the semester) 22
Chart 1.19: Progress of the fixed outgoing traffic 23
Chart 1.20: Fixed outgoing traffic for the main call types 24
Chart 1.21: Annual change of fixed outgoing traffic 24
Chart 1.22: OTE’s annual market shares (based on outgoing traffic) 25
Chart 1.23: OTE market shares per main call type (based on traffic) 26
Chart 1.24: Market shares for the main call types (based on traffic) 26
Chart 1.25: Outgoing traffic volume for OTE and the alternative operators (excl. dial-up) 27
Chart 1.26: Retail revenues from the provision of telephony and Internet services at a fixed location 28
Chart 1.27: OTE’s market share (based on the retail revenues from telephony and Internet services at a fixed location) 28
Chart 1.28: Call termination traffic to fixed telephony networks (OTE - alternative operators) 29
Chart 1.29: Actual interconnection fees (2016) 29
Chart 1.30: Number portability for fixed telephony 30
Chart 1.31: Mobile telephony connections/subscriptions (2009-2016) 31
Chart 1.32: Progress of mobile telephony subscriptions (pre-paid and post-paid) 32
Chart 1.33: Progress of mobile telephony subscriptions (residential-business) 32
Chart 1.34: MTOs shares on the number of mobile telephony connections (2009-2016) 33
Chart 1.35: Voice calls originating from mobile phone 34
Chart 1.36: Voice calls per category 35
Chart 1.37: Voice calls per category (% of the total) 35
Chart 1.38: Voice calls per user category 36
Chart 1.39: Total number of SMS (2009-1016) 36
Chart 1.40: Number of SMS per user category 37
Chart 1.41: Total number of MMS 37
Chart 1.42: Total number (MB) of data services via mobile phone and datacards 38
Chart 1.43: Mobile telephony retail revenues 38
Chart 1.44: Mobile telephony retail revenues breakdown (2016) 40
Chart 1.45: Annual average revenue per mobile connection 40
Chart 1.46: MTOs interconnection traffic 41
Chart 1.47: MTOs on-net traffic 41
Chart 1.48: Voice calls terminating to mobile phones in Greece (%) 42
Chart 1.49: Revenues accrued by fixed and mobile calls to mobiles in Greece 42
Chart 1.50: Mobile call termination fees reduction 43
Chart 1.51: Portability for mobile telephony 43
Chart 1.52: Subscriptions/connections of fixed and mobile telephony 44
MARKET REVIEW 2016
114
Chart 1.53: Revenues from fixed and mobile telephony 44
Chart 1.54: Call volumes from fixed and mobile phones 45
Chart 1.55: Fixed and mobile telephony market shares 45
Chart 1.56: Progress of broadband lines 46
Chart 1.57: Progress of LLU lines 47
Chart 1.58: Progress of VDSL lines 47
Chart 1.59: Breakdown of broadband lines per technology (December 2016) 48
Chart 1.60: Progress of broadband lines per technology 48
Chart 1.61: Breakdown of nominal broadband lines speed (December 2016) 49
Chart 1.62: Progress of broadband lines speed 49
Chart 1.63: Progress of the average access speed of retail and wholesale ADSL lines 50
Chart 1.64: Progress of mobile telephony subscribers making use of Internet 51
Chart 1.65: Progress of 3G and 4G networks Internet traffic 52
Chart 1.66: Mobile network population coverage 52
Chart 1.67: Progress of Pay TV users 54
Chart 1.68: Bundled offers and unbundled subscriptions 55
Chart 1.69: Bundled offers per general type 55
Chart 1.70: Bundled offers per specific type (December 2016) 56
Chart 1.71: Fixed telephony: Bundled offers (per specific type) and unbundled subscriptions breakdown 56
Chart 1.72: Bundled offers (per specific type) and unbundled subscriptions breakdown (%) 57
Chart 1.73: Fixed broadband Internet; Bundled offers (per specific type) and unbundled subscriptions breakdown (%) 57
Chart 1.74: Pay TV; Bundled offers (per specific type) and unbundled subscriptions breakdown (%) 58
Chart 1.75: Mobile post-paid subscriptions bundled offers (per general type) and unbundled subscriptions 58
Chart 1.76: Mobile post-paid subscriptions bundled offers (per specific type) and unbundled subscriptions breakdown (%) 59
Chart 1.77: Bundled subscriptions with fixed and mobile services based on subscriptions and SIM cards 59
Chart 1.78: PRS and directory services shares based on revenues 61
Chart 1.79: Progress of PRS and directory services total revenue (in million euros) 61
Chart 1.80: Commercially available products per operator 63
Chart 1.81: Commercially available products per operator (%) 63
Chart 1.82: Product type breakdown in the market 64
Chart 1.83: Number of products per service 64
Chart 1.84: Basics to add-ons ratio in pre-paid telephony 65
Chart 1.85: Basics to add-ons ratio in mobile post-paid telephony 65
Chart 1.86: Basics to add-ons ratio in fixed telephony products 65
Chart 1.87: Target-markets of telecommunications products 66
115
Chart 1.88: Product breakdown per service in the target-markets 66
Chart 1.89: Product breakdown per operator in the target-markets 66
Chart 1.90: Product concentration in the mobile post-paid 67
Chart 1.91: Broadband penetration increase in Greece and the EU 67
Chart 1.92: Broadband penetration in Greece and the EU (June 2016) 68
Chart 1.93: Broadband penetration change in the EU (June 2016) 69
Chart 1.94: Broadband penetration progress in Greece and the EU 70
Chart 1.95: Percentage of lines at speed>30 Mbps in the EU (June 2016) 70
Chart 1.96: Mobile broadband penetration (per 100 residents) 71
Chart 1.97: Broadband coverage of NGAs in the EU and Greece 72
Chart 1.98: Rate of residential areas covered by 4G 72
Chart 1.99: Internet accessibility based on the available income 73
Chart 1.100: Internet access at least once a week 73
Chart 1.101: Use of Internet, 2016 74
Chart 2.1: Average revenue growth rate in the global postal market 77
Chart 2.2: Revenue shares of the postal market per sector of activity (2010, 2015) 77
Chart 2.3: Global volume growth rate of letters vs parcel and express 78
Chart 2.4: Global B2C e-commerce sales 79
Chart 2.5: Desired characteristics of delivery services provided by the postal operators (% of respondents) 80
Chart 2.6: Domestic letter mail volume (excluding unaddressed mail) in the EU, 2015 81
Chart 2.7: Total volume per European country -Annual average change (2013-2015) 82
Chart 2.8: Total revenue per European country - Annual average change (2013-2015) 83
Chart 2.9: Postal market liberalization in Europe 85
Chart 2.10: Average prices of posting a domestic priority letter -1st weight step (2014 & 2015) 86
Chart 2.11: Average prices for posting a domestic 2 kg priority parcel (2014 & 2015) 86
Chart 2.12: Percentage of cross-border e-commerce purchases per European country in 2016 87
Chart 2.13: Number of companies in the Greek postal market 88
Chart 2.14: Evolution of the postal market turnover index (base year 2010) 89
Chart 2.15: Turnover of postal companies 89
Chart 2.16: Assets share in the postal market (2016) 90
Chart 2.17: Liabilities share in the postal market (2016) 91
Chart 2.18: Revenue and volume of the Greek postal market, (2010-2015) 92
Chart 2.19: Volume and revenue share per postal service (2016) 94
Chart 2.20: Volume share of letters and parcels (2011-2016) 94
Chart 2.21: Revenue shares of letters and parcels (2011-2016) 95
MARKET REVIEW 2016
116
Chart 2.22: Volume and revenue share per domestic-international service (2016) 95
Chart 2.23: Destination and origin of postal item deliveries per geographic region (2016) 96
Chart 2.24: Destination and origin of international postal item deliveries (2016) 97
Chart 2.25: Employment share in the postal market (2016) 97
Chart 2.26: Volume and revenue share of postal operators (2016) 98
Chart 2.27: Revenue share of postal operators (2011-2016) 98
Chart 2.28: Letters and parcels share for US and courier services (2015) 99
Chart 2.29: Volume and revenue share of postal operators within the US sector (2016) 100
Chart 2.30: Volume and revenue share of services within the US sector (2016) 101
Chart 2.31: USP volume and revenue, (2011-2016) 102
Chart 2.32: Number of companies with an Individual License 103
Chart 2.33: Revenue and volume of companies with Individual License (2011-2016) 103
Chart 2.34: Revenue and volume of companies operating under General Authorization (2011-2016) 105
Chart 2.35: Volume and revenue share per service in the courier sector (2016) 105
Chart 2.36: Volume and revenue share of courier services companies (2016) 106
Chart 2.37: Destination & origin of courier items deliveries per geographic region 107
Chart 2.38: Herfindahl – Hirschman Index 108
Chart 2.39: Companies operating under a General Authorization 108
Chart 2.40 Revenue share of courier companies’ clientele (2016) 109
Chart 2.41: Revenue of courier companies per customer type (2016) 110
117
Tables
Table 1.1: Active fixed & mobile telephony operators 11
Table 1.2: Electronic Communications operators financial figures (in billion euros) 12
Table 1.3: Progress of telephone lines 22
Table 1.4: Volume per call type (in million minutes) 25
Table 1.5: Market share of operators of telephony and Internet services at a fixed location 27
Table 1.6: Total and active mobile telephony connections (without datacards) 30
Table 1.7: Total post-paid and pre-paid connections 31
Table 1.8: Total post-paid and pre-paid connections of residential and business users 32
Table 1.9: MTOs registered connections shares (2007-2016) 33
Table 1.10: MTOs active connections shares (2007-2016) 33
Table 1.11: Mobile penetration in the population (2006-2016) 33
Table 1.12: MTOs shares on the retail revenues (2009-2016) 39
Table 1.13: MTOs shares on the post-paid retail revenues (2009-2016) 39
Table 1.14: MTOs shares on the pre-paid retail revenues (2009-2016) 39
Table 1.15: Shares of fixed broadband access operators 50
Table 1.16: Population coverage per geographic region 50
Table 1.17: Shares of the active 3G and 4G subscribers (post-paid and pre-paid) 51
Table 1.18: Shares of Pay TV operators based on subscribers 53
Table 1.19: Number of bundled offers and unbundled subscriptions 60
Table 2.1: Total volume of the European postal market 81
Table 2.2: Total revenue of the European postal market 82
Table 2.3: Herfindahl-Hirschman Index (ΗΗΙ) (2014 & 2015) 84
Table 2.4: Key financial data of postal companies (in million euros) (2016) 90
Table 2.5: Postal market financial indicators (2012-2016) 92
Table 2.6: Postal market volume (in thousand items) 93
Table 2.7: Postal market revenue (in thousand euros) 93
Table 2.8: Volume and revenue share of postal items within the US sector (2016) 100
Table 2.9: USP volume and revenue share per service 102
Table 2.10: Volume and revenue share per service for companies with Individual License (2016) 104
MARKET REVIEW 2016