Embed Size (px)
Citation preview
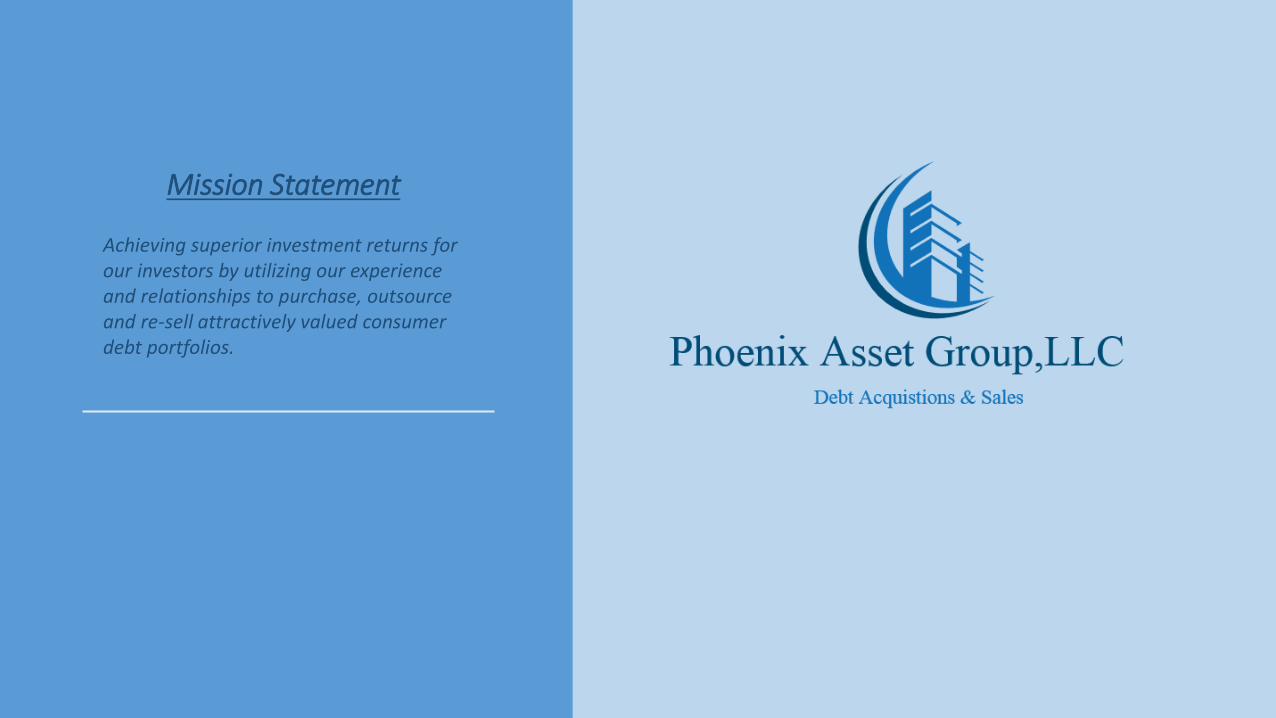
Mission Statement
Achieving superior investment returns for our investors by utilizing our experience and relationships to purchase, outsource and re-sell attractively valued consumer debt portfolios.
Company Overview
• Key managing partners are currently purchasing large national pools of consumer debt direct or joint venturing with the largest debt buyers in the country.
• Key management possess over 70 collective years of purchasing, outsourcing and re-selling charged-off consumer debt.
• Strong track record of purchasing and selling over $2 billion in consumer distressed debt transactions.
• Significant network of strategic collection agencies, attorney networks and operating partner relationships.
• History of unique, innovative and value-added knowledge of charged-off consumer debt portfolios that are generating superior returns for our investors.
• Currently Phoenix is averaging 18 month rate of returns of 149% - 171%. Capital returns within 12 months.
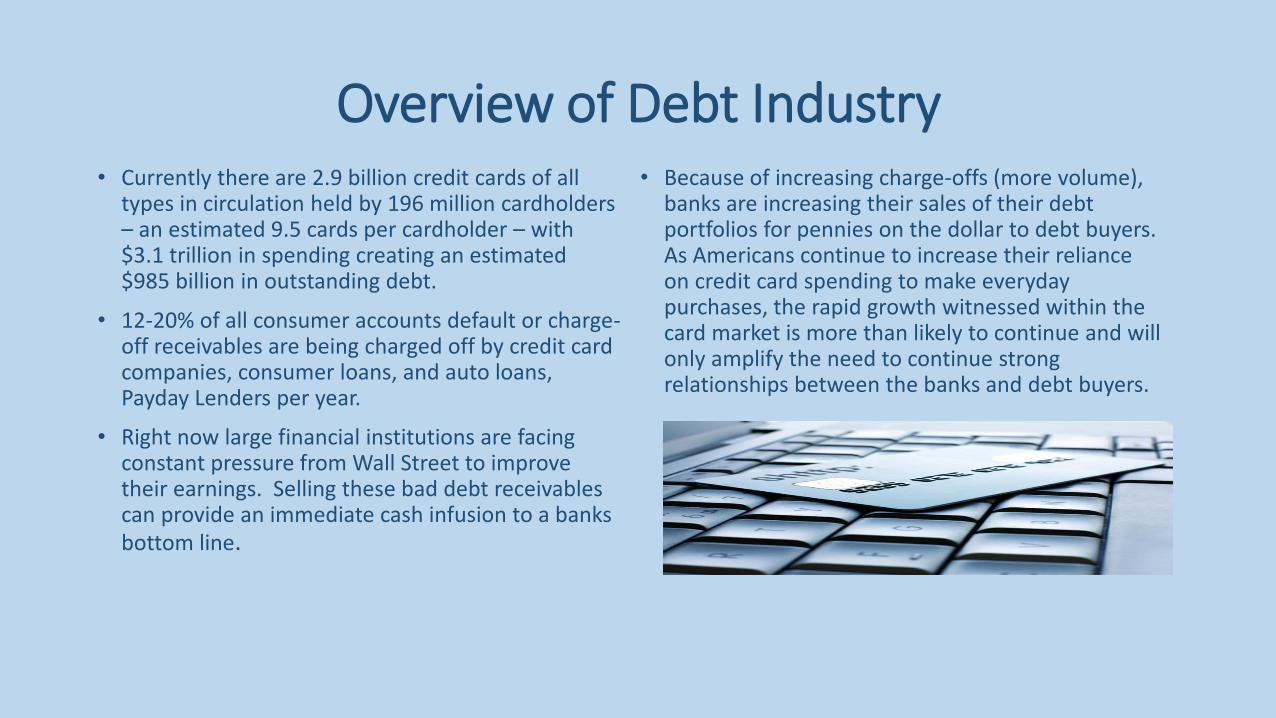
Overview of Debt Industry• Currently there are 2.9 billion credit cards of all
types in circulation held by 196 million cardholders – an estimated 9.5 cards per cardholder – with $3.1 trillion in spending creating an estimated $985 billion in outstanding debt.
• 12-20% of all consumer accounts default or charge-off receivables are being charged off by credit card companies, consumer loans, and auto loans, Payday Lenders per year.
• Right now large financial institutions are facing constant pressure from Wall Street to improve their earnings. Selling these bad debt receivables can provide an immediate cash infusion to a banks bottom line.
• Because of increasing charge-offs (more volume), banks are increasing their sales of their debt portfolios for pennies on the dollar to debt buyers. As Americans continue to increase their reliance on credit card spending to make everyday purchases, the rapid growth witnessed within the card market is more than likely to continue and will only amplify the need to continue strong relationships between the banks and debt buyers.
Why Invest with Phoenix• Phoenix’s management team has a combined 70
years of experience in the debt buying industry, purchasing over 1 Billion in charged-off consumer debt.
• Phoenix has developed a proprietary due diligence process determining the best purchase rate, recovery rate and recovery time on each portfolio.
• Phoenix purchases from direct creditors and/or partnering with other debt buyers, negotiating the lowest purchase price for each portfolio, generating the highest returns for our Investors.
• Phoenix has established a network of Attorneys and Third Party Collection Agencies across the nation. Each company has been through a thorough due diligence process to include copies of licensing documents and bonds, appropriate E&O Insurance, FDCPA compliance, history of recovery rates, and references.
• Phoenix has built relationships with other debt buyers and attorney groups who will purchase the remaining uncollected debt portfolios on a National, Regional, or State specific level at a reduced purchase price.
• Currently Monthly ROI’s are averaging 5-10% .
Investment Opportunity
• Investment amounts range from $20,000 to $1,000,000.
• Portfolio time frame from 12–18 months.
• Capital return on investment within 6-12 months.
• After agency receives their fee, net fees are split 80% to Investor – 20% to Phoenix.
• Continued cash flow for additional 6-12 months.
• ROI’s average monthly between 5-10% per investment.
• Investor receives bi-monthly collection reports.
• Investors ROI is paid monthly.
Investment Strategy
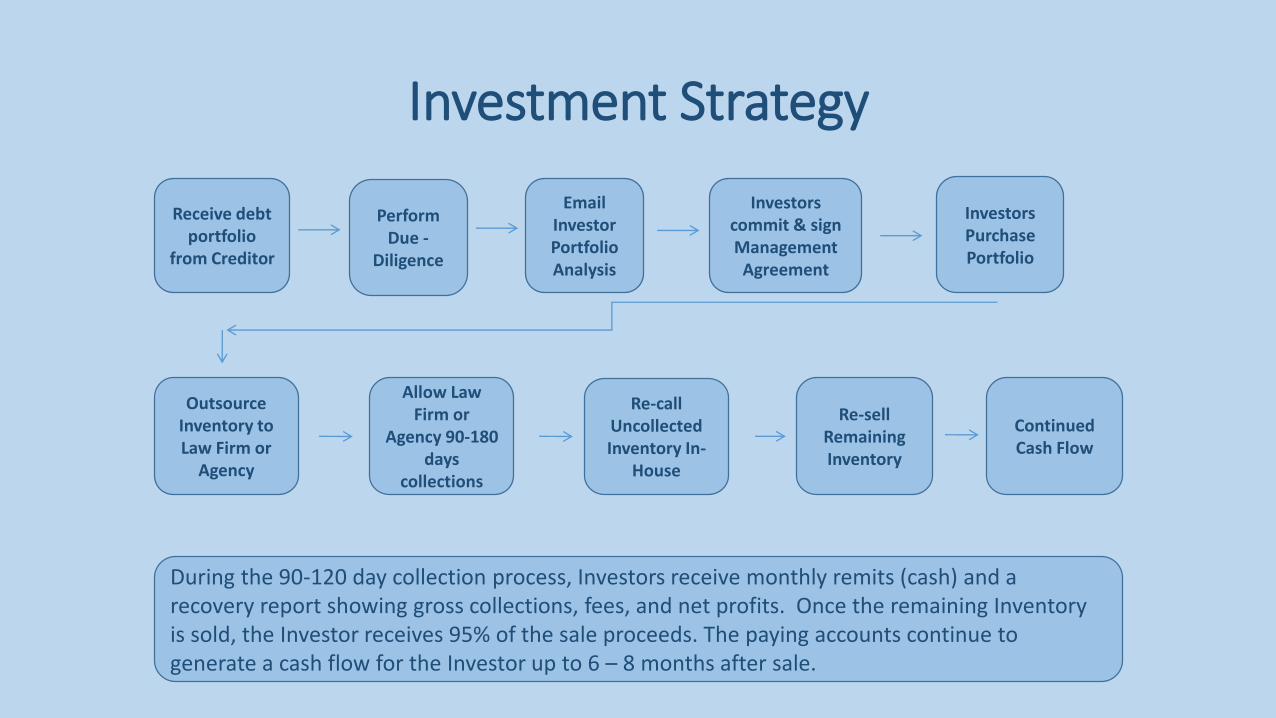
Receive debt portfolio
from Creditor
Perform Due -
Diligence
Email Investor PortfolioAnalysis
InvestorsPurchase Portfolio
Investors commit & sign Management
Agreement
Outsource Inventory to Law Firm or
Agency
Allow Law Firm or
Agency 90-180 days
collections
Re-callUncollected Inventory In-
House
Re-sell Remaining Inventory
During the 90-120 day collection process, Investors receive monthly remits (cash) and a recovery report showing gross collections, fees, and net profits. Once the remaining Inventory is sold, the Investor receives 95% of the sale proceeds. The paying accounts continue to generate a cash flow for the Investor up to 6 – 8 months after sale.
Continued Cash Flow
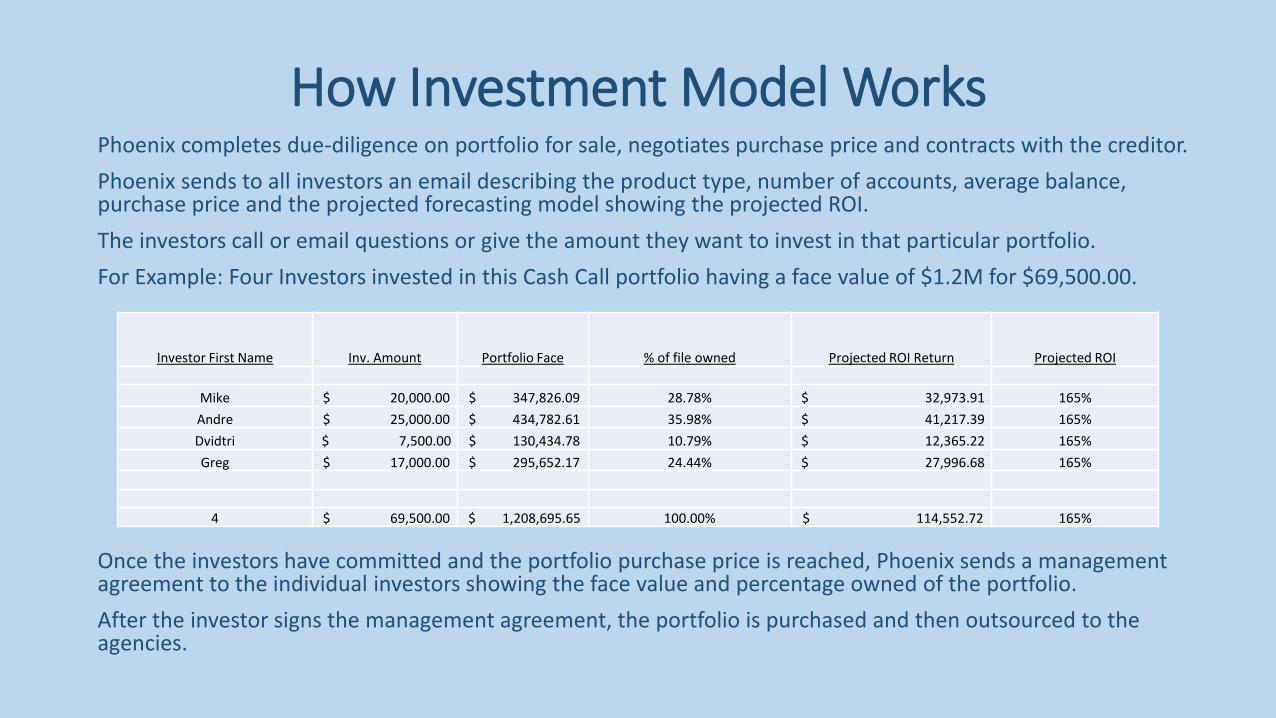
How Investment Model WorksPhoenix completes due-diligence on portfolio for sale, negotiates purchase price and contracts with the creditor.
Phoenix sends to all investors an email describing the product type, number of accounts, average balance, purchase price and the projected forecasting model showing the projected ROI.
The investors call or email questions or give the amount they want to invest in that particular portfolio.
For Example: Four Investors invested in this Cash Call portfolio having a face value of $1.2M for $69,500.00.
Once the investors have committed and the portfolio purchase price is reached, Phoenix sends a management agreement to the individual investors showing the face value and percentage owned of the portfolio.
After the investor signs the management agreement, the portfolio is purchased and then outsourced to the agencies.
Investor First Name Inv. Amount Portfolio Face % of file owned Projected ROI Return Projected ROI
Mike $ 20,000.00 $ 347,826.09 28.78% $ 32,973.91 165%
Andre $ 25,000.00 $ 434,782.61 35.98% $ 41,217.39 165%
Dvidtri $ 7,500.00 $ 130,434.78 10.79% $ 12,365.22 165%
Greg $ 17,000.00 $ 295,652.17 24.44% $ 27,996.68 165%
4 $ 69,500.00 $ 1,208,695.65 100.00% $ 114,552.72 165%
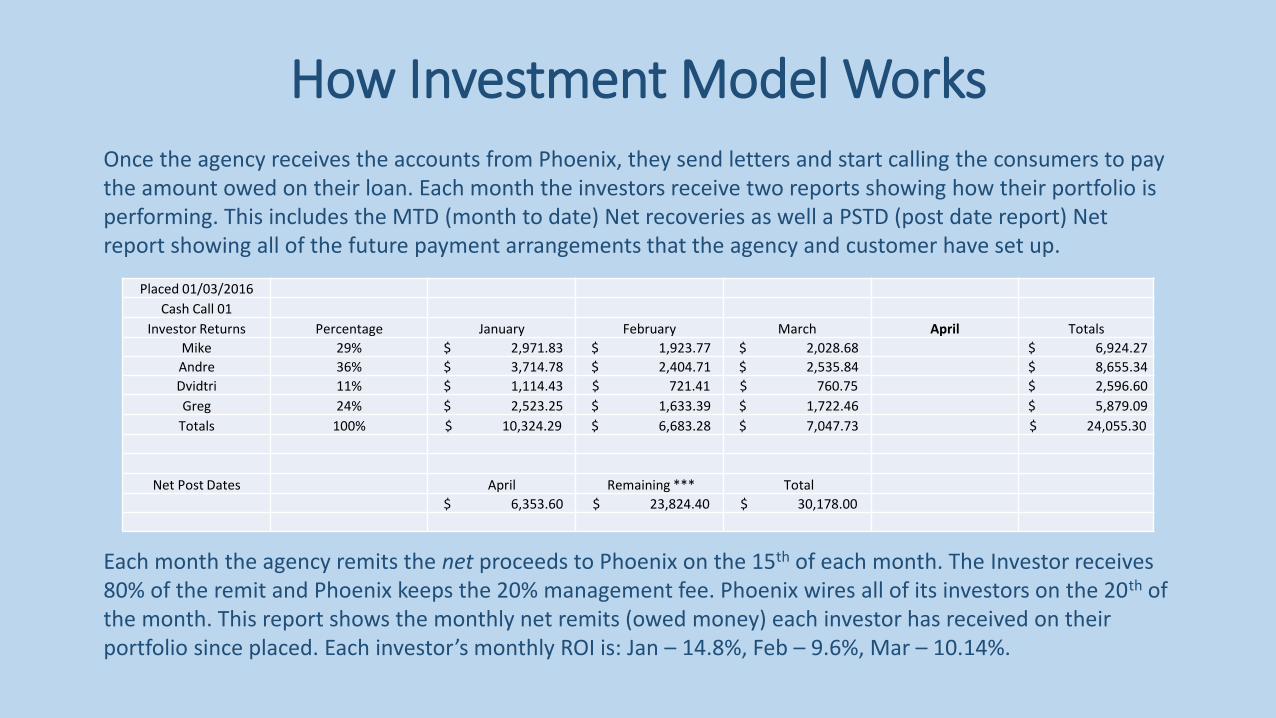
How Investment Model WorksOnce the agency receives the accounts from Phoenix, they send letters and start calling the consumers to pay the amount owed on their loan. Each month the investors receive two reports showing how their portfolio is performing. This includes the MTD (month to date) Net recoveries as well a PSTD (post date report) Net report showing all of the future payment arrangements that the agency and customer have set up.
Each month the agency remits the net proceeds to Phoenix on the 15th of each month. The Investor receives 80% of the remit and Phoenix keeps the 20% management fee. Phoenix wires all of its investors on the 20th of the month. This report shows the monthly net remits (owed money) each investor has received on their portfolio since placed. Each investor’s monthly ROI is: Jan – 14.8%, Feb – 9.6%, Mar – 10.14%.
Placed 01/03/2016
Cash Call 01
Investor Returns Percentage January February March April Totals
Mike 29% $ 2,971.83 $ 1,923.77 $ 2,028.68 $ 6,924.27
Andre 36% $ 3,714.78 $ 2,404.71 $ 2,535.84 $ 8,655.34
Dvidtri 11% $ 1,114.43 $ 721.41 $ 760.75 $ 2,596.60
Greg 24% $ 2,523.25 $ 1,633.39 $ 1,722.46 $ 5,879.09
Totals 100% $ 10,324.29 $ 6,683.28 $ 7,047.73 $ 24,055.30
Net Post Dates April Remaining *** Total
$ 6,353.60 $ 23,824.40 $ 30,178.00
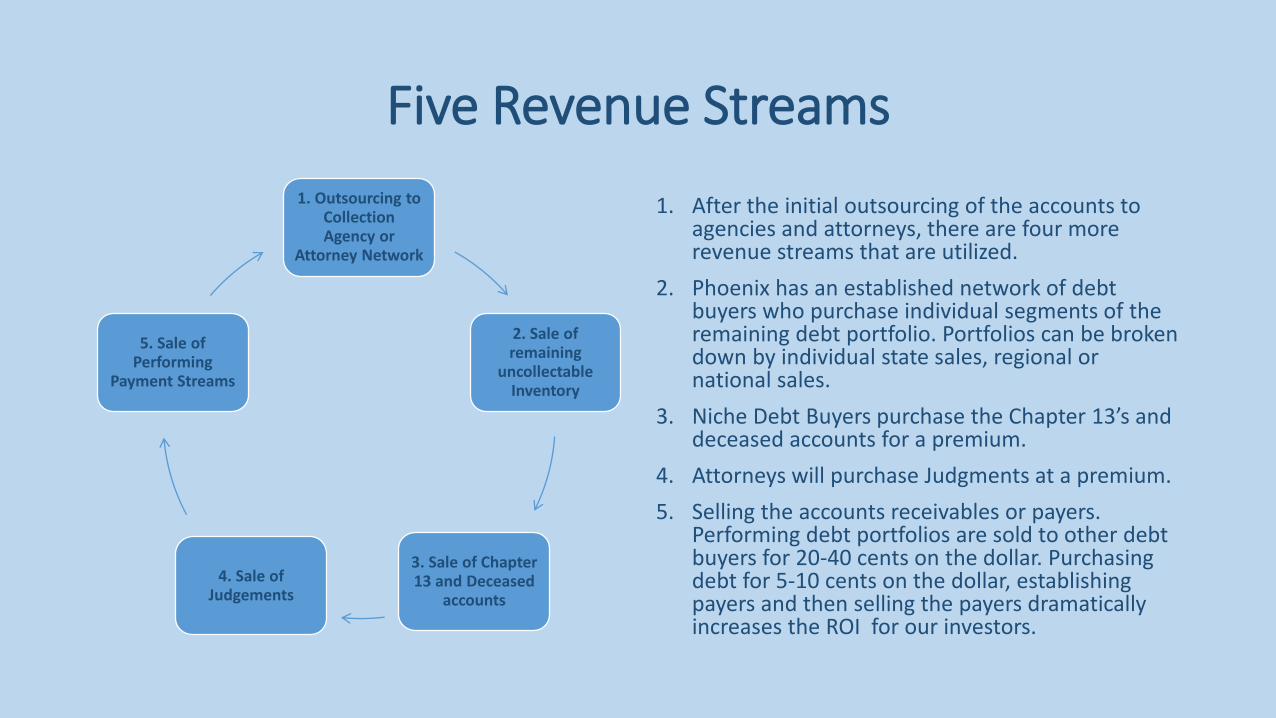
Five Revenue Streams
1. After the initial outsourcing of the accounts to agencies and attorneys, there are four more revenue streams that are utilized.
2. Phoenix has an established network of debt buyers who purchase individual segments of the remaining debt portfolio. Portfolios can be broken down by individual state sales, regional or national sales.
3. Niche Debt Buyers purchase the Chapter 13’s and deceased accounts for a premium.
4. Attorneys will purchase Judgments at a premium.
5. Selling the accounts receivables or payers. Performing debt portfolios are sold to other debt buyers for 20-40 cents on the dollar. Purchasing debt for 5-10 cents on the dollar, establishing payers and then selling the payers dramatically increases the ROI for our investors.
1. Outsourcing to Collection Agency or
Attorney Network
2. Sale of remaining
uncollectable Inventory
3. Sale of Chapter 13 and Deceased
accounts
4. Sale of Judgements
5. Sale of Performing
Payment Streams
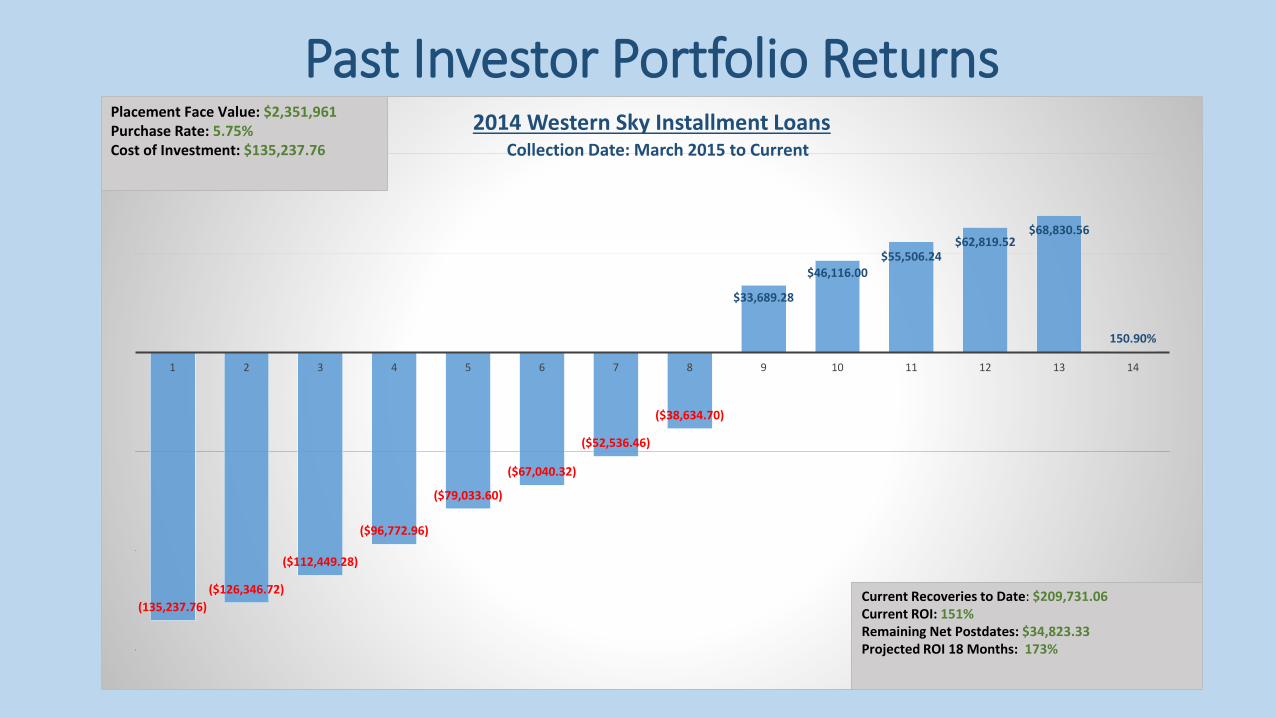
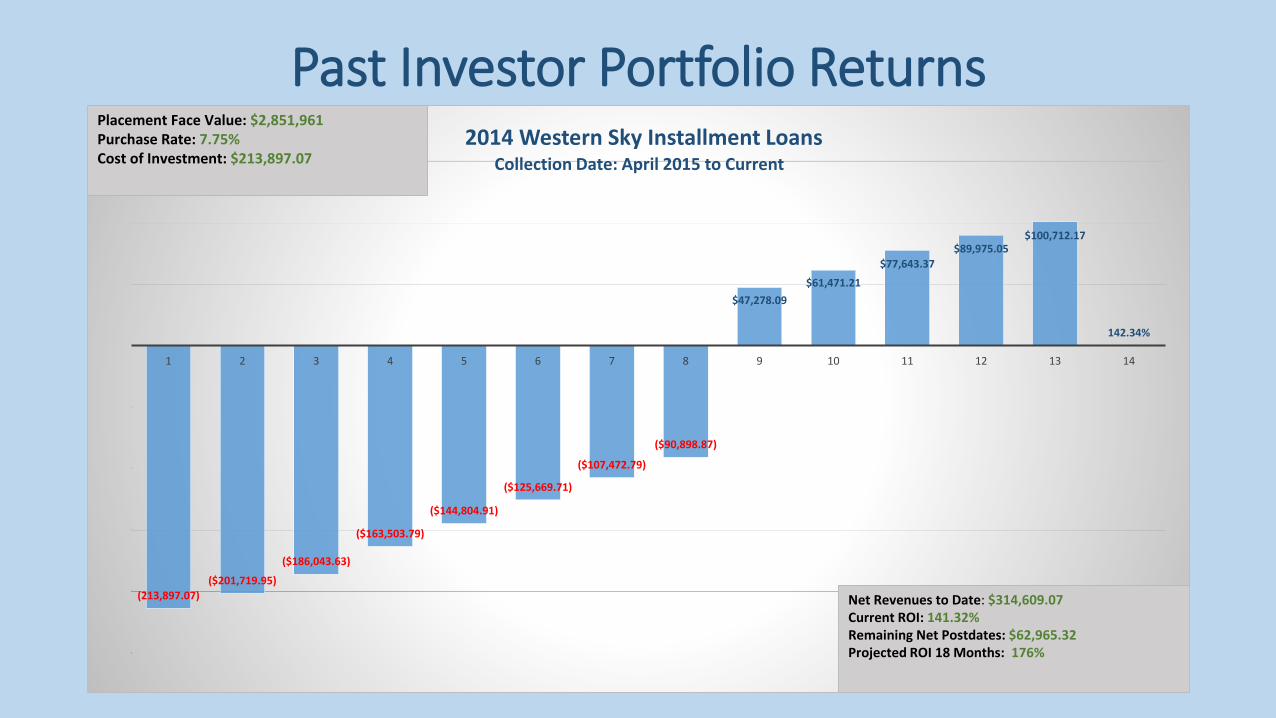
Past Investor Portfolio Returns
(135,237.76)
($126,346.72)
($112,449.28)
($96,772.96)
($79,033.60)
($67,040.32)
($52,536.46)
($38,634.70)
$33,689.28
$46,116.00 $55,506.24
$62,819.52 $68,830.56
150.90%
1 2 3 4 5 6 7 8 9 10 11 12 13 14
Collection Date: March 2015 to Current
2014 Western Sky Installment LoansPlacement Face Value: $2,351,961 Purchase Rate: 5.75% Cost of Investment: $135,237.76
Current Recoveries to Date: $209,731.06Current ROI: 151%Remaining Net Postdates: $34,823.33Projected ROI 18 Months: 173%
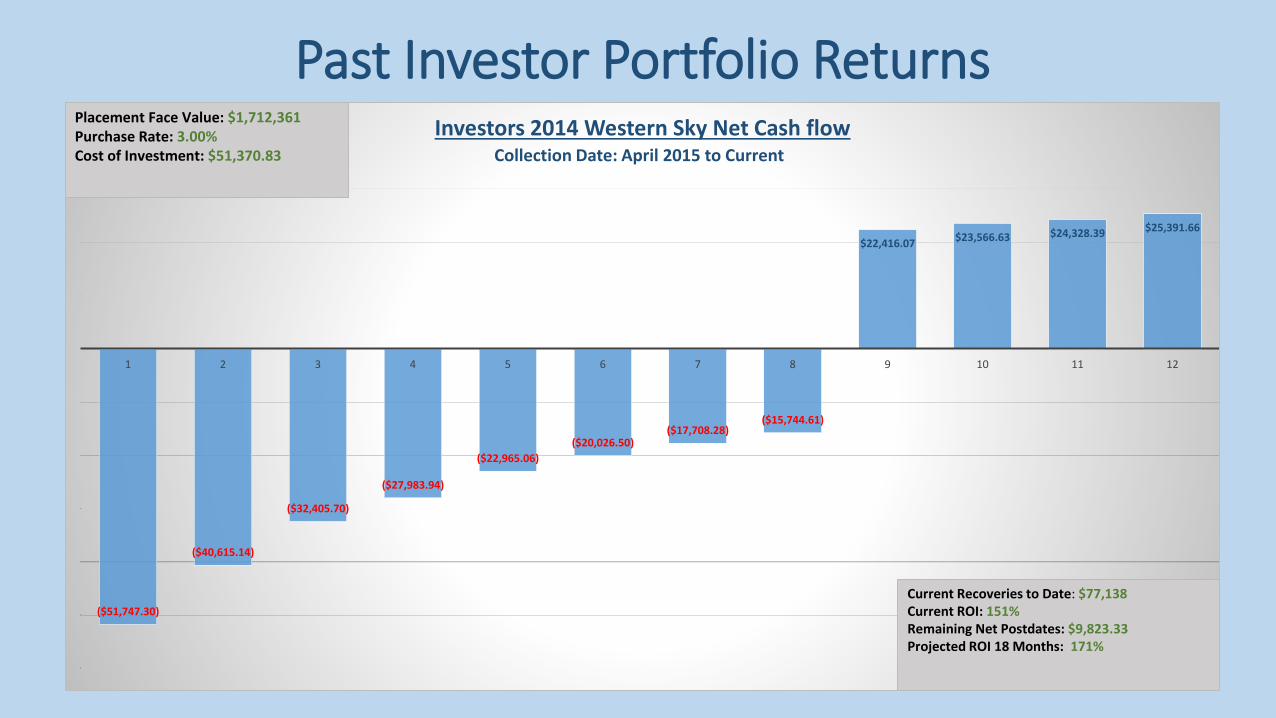
Past Investor Portfolio Returns
($51,747.30)
($40,615.14)
($32,405.70)
($27,983.94)
($22,965.06)
($20,026.50)($17,708.28)
($15,744.61)
$22,416.07$23,566.63 $24,328.39 $25,391.66
1 2 3 4 5 6 7 8 9 10 11 12
Investors 2014 Western Sky Net Cash flowPlacement Face Value: $1,712,361 Purchase Rate: 3.00% Cost of Investment: $51,370.83
Current Recoveries to Date: $77,138Current ROI: 151%Remaining Net Postdates: $9,823.33Projected ROI 18 Months: 171%
Collection Date: April 2015 to Current
Past Investor Portfolio Returns
(213,897.07)
($201,719.95)
($186,043.63)
($163,503.79)
($144,804.91)
($125,669.71)
($107,472.79)
($90,898.87)
$47,278.09
$61,471.21
$77,643.37
$89,975.05 $100,712.17
142.34%
1 2 3 4 5 6 7 8 9 10 11 12 13 14
Collection Date: April 2015 to Current
2014 Western Sky Installment Loans Placement Face Value: $2,851,961 Purchase Rate: 7.75% Cost of Investment: $213,897.07
Net Revenues to Date: $314,609.07Current ROI: 141.32%Remaining Net Postdates: $62,965.32Projected ROI 18 Months: 176%
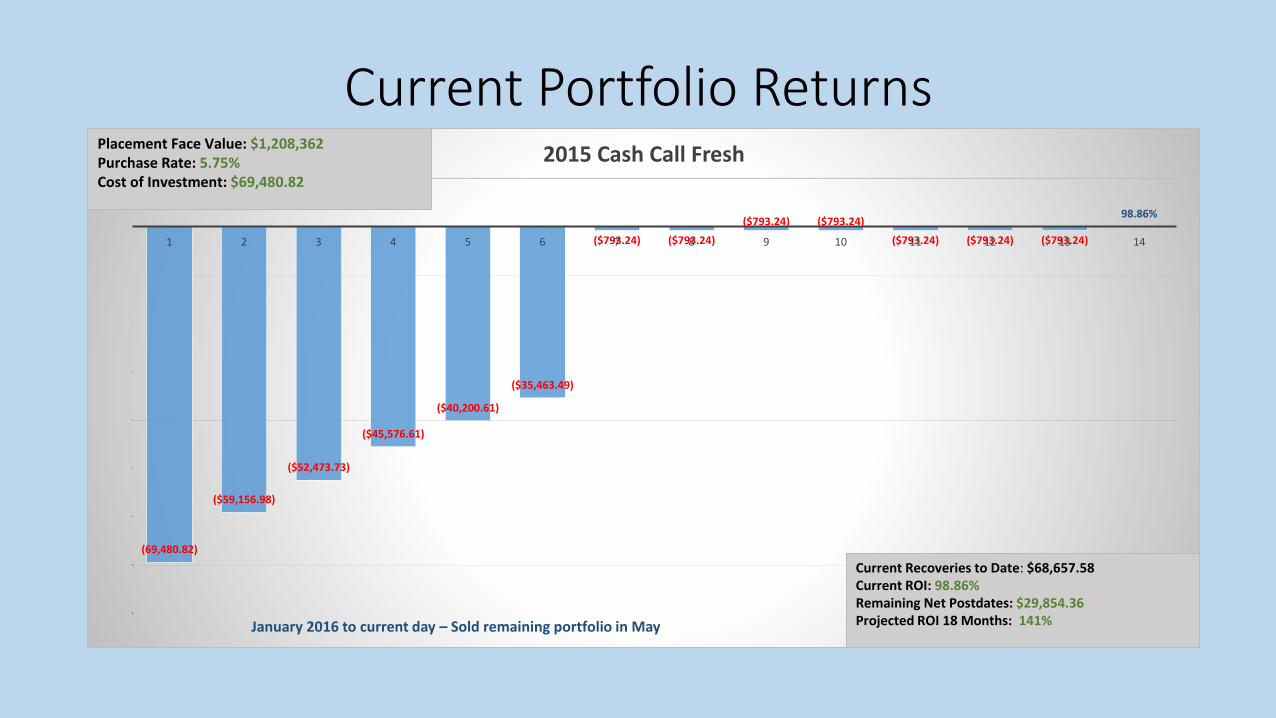
Current Portfolio Returns
(69,480.82)
($59,156.98)
($52,473.73)
($45,576.61)
($40,200.61)
($35,463.49)
($793.24) ($793.24)
($793.24) ($793.24)
($793.24) ($793.24) ($793.24)
98.86%
1 2 3 4 5 6 7 8 9 10 11 12 13 14
January 2016 to current day – Sold remaining portfolio in May
2015 Cash Call FreshPlacement Face Value: $1,208,362Purchase Rate: 5.75% Cost of Investment: $69,480.82
Current Recoveries to Date: $68,657.58Current ROI: 98.86%Remaining Net Postdates: $29,854.36Projected ROI 18 Months: 141%
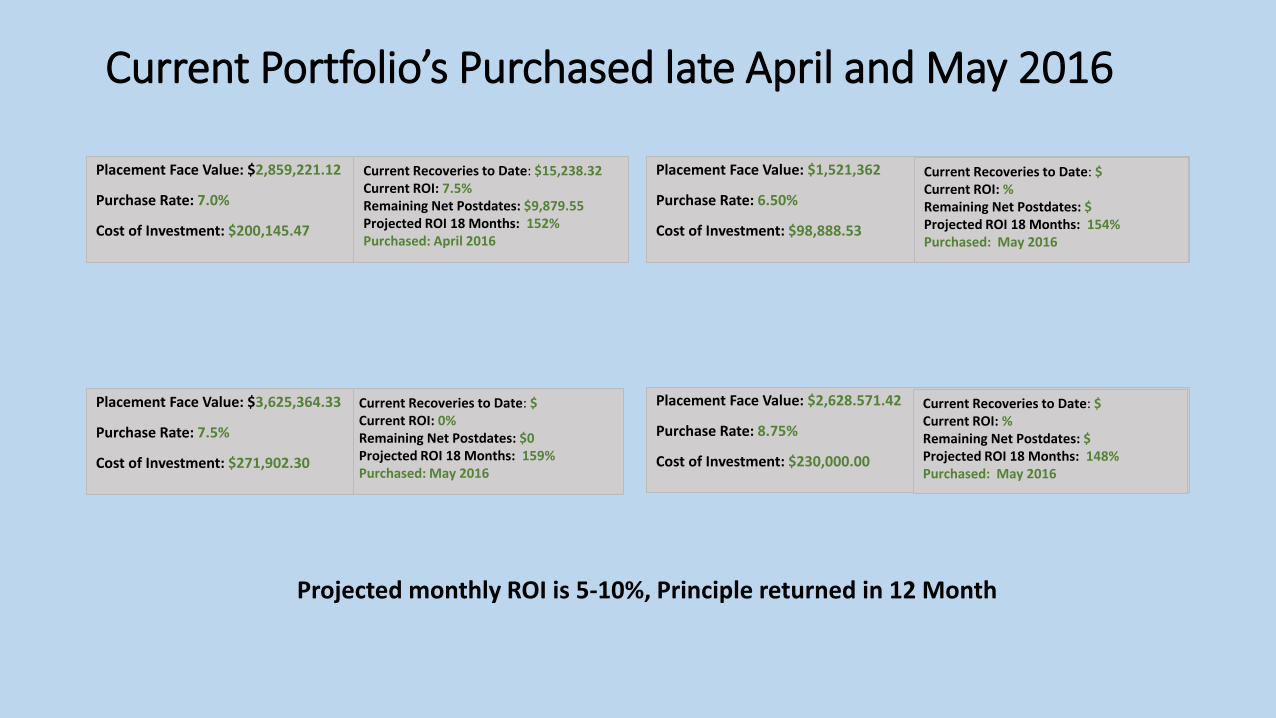
Placement Face Value: $2,859,221.12
Purchase Rate: 7.0%
Cost of Investment: $200,145.47
Current Recoveries to Date: $15,238.32Current ROI: 7.5%Remaining Net Postdates: $9,879.55Projected ROI 18 Months: 152%Purchased: April 2016
Placement Face Value: $1,521,362
Purchase Rate: 6.50%
Cost of Investment: $98,888.53
Current Recoveries to Date: $Current ROI: %Remaining Net Postdates: $Projected ROI 18 Months: 154%Purchased: May 2016
Current Portfolio’s Purchased late April and May 2016
Current Recoveries to Date: $Current ROI: 0%Remaining Net Postdates: $0Projected ROI 18 Months: 159%Purchased: May 2016
Placement Face Value: $2,628.571.42
Purchase Rate: 8.75%
Cost of Investment: $230,000.00
Current Recoveries to Date: $Current ROI: %Remaining Net Postdates: $Projected ROI 18 Months: 148%Purchased: May 2016
Placement Face Value: $3,625,364.33
Purchase Rate: 7.5%
Cost of Investment: $271,902.30
Projected monthly ROI is 5-10%, Principle returned in 12 Month
Having pioneers in the industry, particularly in understanding how to make money in distressed debt portfolio’s, allows a strong advantage for Phoenix Asset Group, LLC. Phoenix Asset Group has developed a team of managers with strong, complementary backgrounds.
Phoenix Asset Group understands and follows strict guidelines for each portfolio reviewed. Our due-diligence and transaction process are the key components in mitigating risk.
Phoenix Asset Group has established five unique revenue streams per portfolio to achieve superior investment returns for our investors. ALL portfolios are insured for fraud and corruption by the agency via E/O policy and Remit Bond. (25 Years in the industry and have only filed a claim twice.)
Phoenix Asset Group sends investor three reports a month: Monthly Projection; MTD report and Remit Report. Transparency is the key to our success. References are available upon request.
For more information please contact via email [email protected] or call 952-994-3215.
Conclusion