Embed Size (px)
Citation preview


Table of Contents
Section 1
Introduction 21.1 The NAB Group's Capital Adequacy Methodologies 21.2 APS 330 Disclosure Governance 21.3 Regulatory Reform 3
Section 2
Scope of Application 4
Section 3
Risk Governance and Management 5
Section 4
Capital 7Capital Adequacy 7
Table 4.1A: Risk-Weighted Assets 9Table 4.1B: Capital Ratios 10
Capital Structure 11Table 4.2A: Regulatory Capital Structure - Summary 11
Section 5
Credit Risk 12General Disclosure 12
Table 5.1A: Credit Risk Exposures Summary 14Table 5.1B: Total and Average Credit Risk Exposures 16Table 5.1C: Exposures by Geography 18Table 5.1D: Exposures by Industry 19Table 5.1E: Exposures by Maturity 21Table 5.1F: Provisions by Asset Class 22Table 5.1G (i): Loss Experience 24Table 5.1G (ii): Accuracy of Risk Estimates – PD and EaD 25Table 5.1G (iii): Accuracy of Risk Estimates – LGD 26Table 5.1H: Provisions by Industry 27Table 5.1I: Provisions by Geography 28Table 5.1J: Movement in Provisions 29
Standardised and Supervisory Slotting Portfolios 30Table 5.2A: Standardised Exposures by Risk Weight 30Table 5.2B: Standardised Exposures by Risk Grade 31Table 5.2C: Supervisory Slotting by Risk Weight 32
Internal Ratings Based Portfolios 33Table 5.3A: Non-Retail Exposure by Risk Grade 36Table 5.3B: Retail Exposure by Risk Grade 38
Credit Risk Mitigation 40Table 5.4A: Mitigation by Eligible Collateral 41Table 5.4B: Mitigation by Guarantees and Credit Derivatives 42
Counterparty Credit Risk 43Table 5.5A (i): Net Derivatives Credit Exposure 44Table 5.5A (ii): Distribution of Current Credit Exposure 44Table 5.5B: Credit Derivative Transactions 44
Section 6
Securitisation 45Third Party Securitisation 46
Table 6.1A: Total Securitisation Exposures 48Table 6.1B: Type of Exposure 49Table 6.1C: Recent Third Party Securitisation Activity 49Table 6.1D: Exposures by Risk Weight 50Table 6.1E: Exposures Deducted from Capital 53
Level 2 Group Owned Securitised Assets 54Table 6.2A: Assets Securitised by the Level 2 Group 55
Pillar 3 report
2016

Table 6.2B: Recent Securitisation Activity 56Disclosure 6.2C: Securitisation Subject to Early Amortisation 56Disclosure 6.2D: Forthcoming Securitisation Activity by the Level 2 Group 56Disclosure 6.2E: Credit Risk Mitigation and Guarantors 56
Section 7
Market Risk 57Market Risk 59
Table 7.1A: Standard Method Risk-Weighted Assets 59Table 7.1B: Total Risk-Weighted Assets 59Table 7.1C: Internal Model Approach VaR 59Table 7.1D: Internal Model Approach Stressed VaR 60Table 7.1E: Back-testing Results 61
Section 8
Operational Risk 62Table 8A: Total Risk-Weighted Assets 63
Section 9
Balance Sheet and Liquidity Risk 64Funding and Liquidity Risk 65Interest Rate Risk in the Banking Book 66
Table 9.2A: Interest Rate Risk in the Banking Book 67Table 9.2B: Total Risk-Weighted Assets 67
Equities Banking Book Position 68Table 9.3A: Equities Banking Book Position 69Table 9.3B: Gains and Losses on Equity Investments 69Disclosure 9.3C: Equity Investments Subject to Grandfathering Provision 69
Foreign Exchange Risk in the Banking Book 70
Section 10
Leverage Ratio Disclosures 71Leverage Ratio Disclosure Template 71Summary Comparison of Accounting Assets vs Leverage Ratio Exposure Measure 72
Section 11
Liquidity Coverage Ratio 73Liquidity Coverage Ratio Template 74
Section 12
Detailed Capital Disclosures 75Common Disclosure Template – Regulatory Capital 75Level 2 Regulatory Balance Sheet 78Reconciliation between the Common Disclosure Template and Level 2 Regulatory Balance Sheet 80Material Entities Excluded from Level 2 Regulatory Balance Sheet 80
Table 12.4A: Insurance and Fund Management Entities 80Table 12.4B: Securitisation Entities 80
Countercyclical Capital Buffer 81Table 12.5A: Countercyclical Capital Buffer – Private Sector Credit Exposures 81
Section 13
Remuneration 8213.1 Remuneration Governance 8213.2 Remuneration Processes 8213.3 Remuneration and Risk 8413.4 Linking Performance and Remuneration 8513.5 Adjusting Remuneration for Longer-Term Performance 8613.6 Forms of Variable Remuneration 8613.7 Quantitative Remuneration Disclosures 87Table 13.7A: Total Value of Remuneration Awards 87Table 13.7B: Deferred Remuneration 87Table 13.7C: Other Remuneration 8713.8 London Branch Remuneration Disclosures 88
Pillar 3 report
2016

Table 13.8A: Aggregate Remuneration of Material Risk Takers by Operating Segment 88Table 13.8B: Total Value of Remuneration Awards 88Table 13.8C: Deferred Remuneration 88Table 13.8D: Other Remuneration 88Table 13.8E: Remuneration by Band 89
Section 14
Glossary 90
Section 15
Reference to APS 330 Tables 94
Pillar 3 report
2016

Pillar 3 report
2016This page has been left blank intentionally.
1
Introduction
Section 1
Introduction
National Australia Bank Limited (ABN 12 004 044 937)(NAB) applies the Basel framework as a cornerstone of theNAB Group’s risk management framework and capitalstrategy, and recognises that it is critical for achieving theNAB Group’s strategic agenda.
In Australia, the Australian Prudential Regulation Authority(APRA) has regulatory responsibility for the implementationof the Basel Accord through the release of prudentialstandards.
This Pillar 3 Report is designed to provide the NABGroup’s stakeholders with detailed information about theapproach the NAB Group takes to manage risk and todetermine capital adequacy, having regard to the operatingenvironment. The report also addresses the requirementsof APRA’s Prudential Standard APS 330: Public Disclosure(APS 330).
All figures in this report are in Australian dollars (AUD)unless otherwise noted. Disclosures in this report arebased on the APRA Basel III standards that have appliedsince 1 January 2013, except for market risk Risk-Weighted Assets (RWA), which are calculated on a Basel2.5 basis for each period presented.
Capital Ratio Summary
The NAB Group’s Common Equity Tier 1 (CET1) Capitalratio of 9.77% at 30 September 2016 is consistent with theNAB Group’s objective of maintaining a strong capitalposition.
As at30 Sep 16 31 Mar 16
Capital ratios % %Common Equity Tier 1 capital ratio 9.77 9.69Tier 1 12.19 11.77Total 14.14 13.25
The NAB Group maintains a strong capital, funding andliquidity position, in line with its ongoing commitment tomaintain balance sheet strength.
Over the six months ended 30 September 2016, the NABGroup has accessed a diverse range of funding and capitaloptions across various senior, subordinated and secureddebt markets, as well as the domestic retail hybrid market.
The NAB Group remains vigilant in its evaluation of theeconomic and regulatory environment, with the objective ofensuring that the NAB Group’s balance sheet remainsstrong to enable it to respond to changing market andregulatory conditions.
On 30 September, MLC Limited was deconsolidated fromthe NAB Group as a result of the sale of 80% of the NABGroup's interest in it to Nippon Life Insurance Company.The transaction increased the Group’s CET1 ratio byapproximately 45 basis points.
1.1 The NAB Group's Capital AdequacyMethodologies
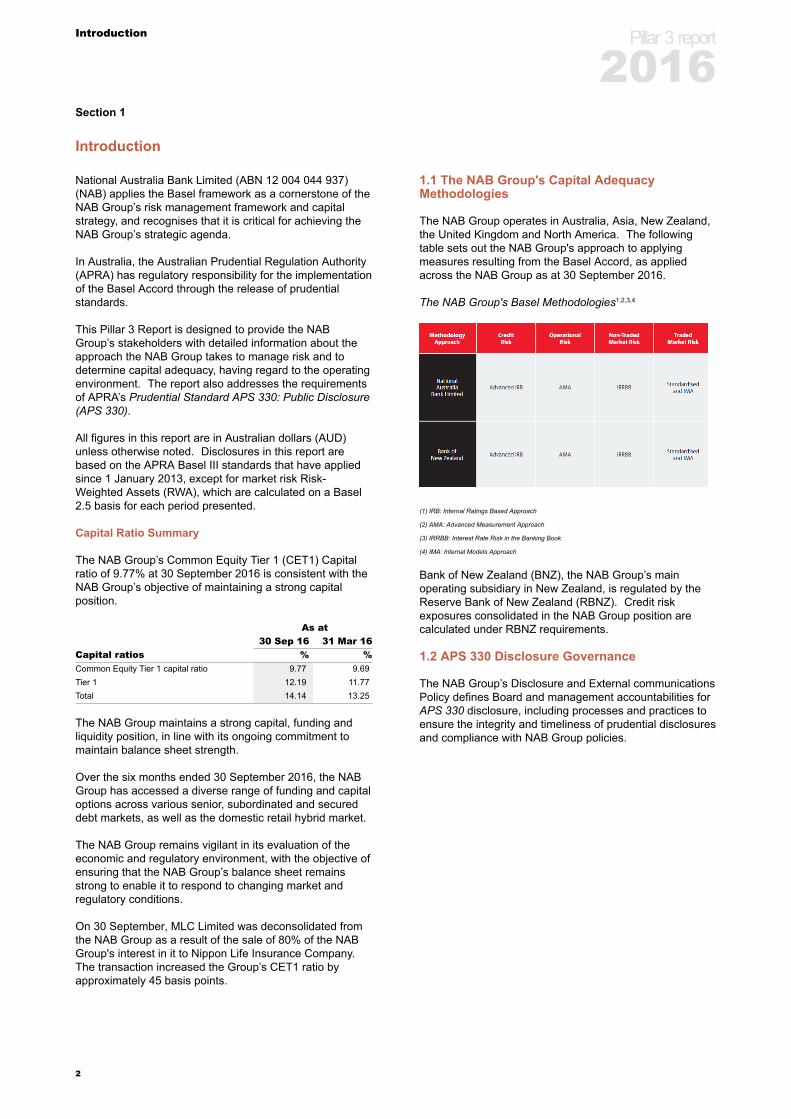
The NAB Group operates in Australia, Asia, New Zealand,the United Kingdom and North America. The followingtable sets out the NAB Group's approach to applyingmeasures resulting from the Basel Accord, as appliedacross the NAB Group as at 30 September 2016.
The NAB Group's Basel Methodologies1,2,3,4
(1) IRB: Internal Ratings Based Approach
(2) AMA: Advanced Measurement Approach
(3) IRRBB: Interest Rate Risk in the Banking Book
(4) IMA: Internal Models Approach
Bank of New Zealand (BNZ), the NAB Group’s mainoperating subsidiary in New Zealand, is regulated by theReserve Bank of New Zealand (RBNZ). Credit riskexposures consolidated in the NAB Group position arecalculated under RBNZ requirements.
1.2 APS 330 Disclosure Governance
The NAB Group’s Disclosure and External communicationsPolicy defines Board and management accountabilities forAPS 330 disclosure, including processes and practices toensure the integrity and timeliness of prudential disclosuresand compliance with NAB Group policies.
Pillar 3 report
2016
2

Introduction
1.3 Regulatory Reform
The NAB Group remains focused on areas of regulatorychange. Key reforms that may affect its capital andfunding include:
Basel III:
• The September 2016 Leverage Ratio is disclosed onpages 71 to 72 of this Report. The minimum LeverageRatio is yet to be determined by APRA.
• In January 2016, the Basel Committee on BankingSupervision (BCBS) released a revised market riskframework, which is due to come into effectinternationally on 1 January 2019, with regulatoryreporting to commence by 31 December 2019. TheCredit Valuation Adjustment (CVA) framework iscurrently in consultation.
• In September 2016, APRA released an additionaldiscussion paper on the Net Stable Funding Ratio(NSFR). A required NSFR of at least 100% is proposedon both a Level 1 and 2 basis from 1 January 2018.
Federal Government’s Financial System Inquiry (Inquiry):
• In July 2016, APRA released an update to its 2015study comparing the capital position of the Australianmajor banks against their international peers.
• In line with previous statements by APRA, from 1 July2016 risk weights applicable to mortgage loansincreased.
Total Loss-absorbing Capacity (TLAC)
• The Financial Stability Board (FSB) issued the TLACstandard in November 2015 for global systemicallyimportant banks (G-SIBs). In line with therecommendations in the Inquiry, APRA could implementa loss absorbing capacity framework in accordance withemerging international practice. At this stage, APRAhas not yet issued guidance on how TLAC might beimplemented.
Revised BCBS standards:
• Themes driving the BCBS's revision of standardsinclude improving transparency, consistency andcredibility of internal ratings based (IRB) models. Draftproposals include revisions to the standardisedapproaches for calculating regulatory capital for creditrisk and operational risk, revisions to IRB approachesfor credit risk and the introduction of a capital floorframework. Final Basel Standards are expected bycalendar year end, with APRA's response expectedsometime thereafter.
• In April 2016, the BCBS released the revised interestrate risk in the banking book (IRRBB) framework, whichis due to come into effect internationally by 2018.
Other regulatory changes• The Group is progressing with a transition to a revised
Level 2 Group structure following clarification of the ADILevel 2 Group definition by APRA. In the interim period,CET1 capital reflects the transition arrangementsgranted by APRA on the removal of capital benefitsarising from debt issued directly by National WealthManagement Holdings Limited (NWMH).
• APRA's consultation on the revisions to PrudentialStandard APS 120: Securitisation. This brings togetherproposals to simplify securitisation for originating ADIsand the updated BCBS securitisation framework.
• APRA's standards on the non-capital components of thesupervision of conglomerate groups (Level 3framework) will be effective from 1 July 2017. Level 3capital requirements are expected to be determinedfollowing the finalisation of other domestic andinternational policy initiatives, with APRA advisingimplementation will be no earlier than 2019. APRA’squantitative impact analysis suggests no additionalcapital will be required as a result of the implementation.
Pillar 3 report
2016
3
Scope of Application
Section 2
Scope of Application
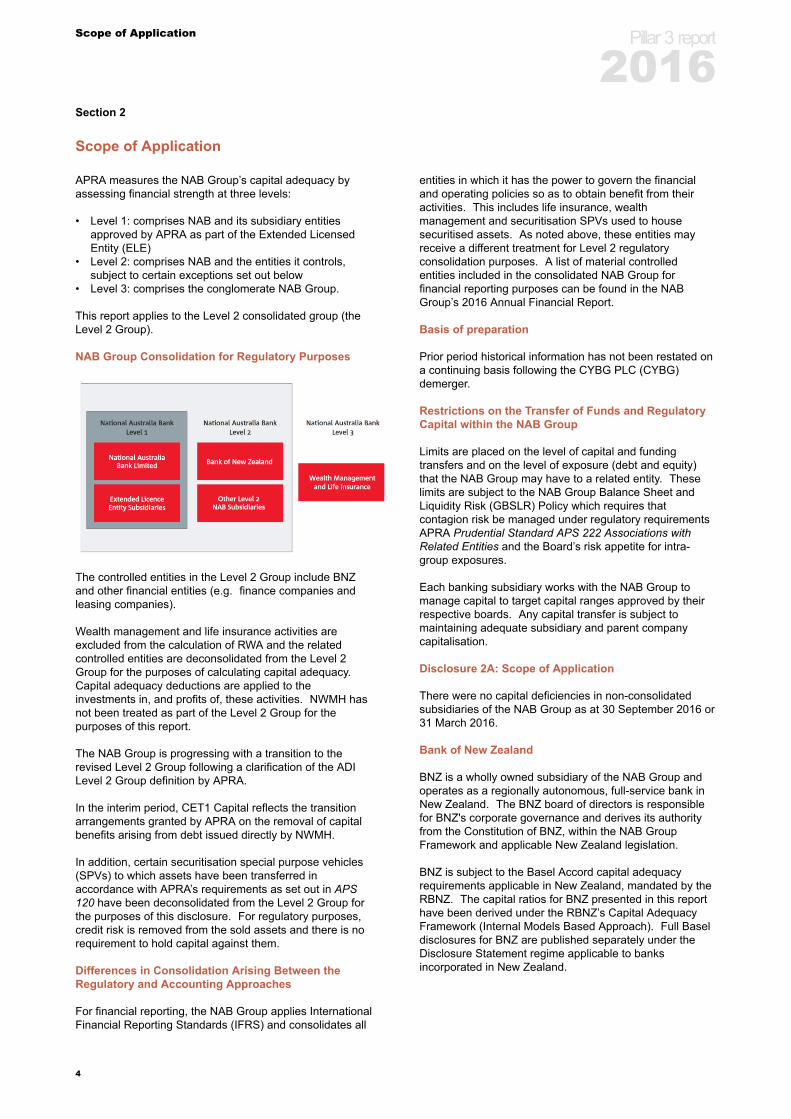
APRA measures the NAB Group’s capital adequacy byassessing financial strength at three levels:
• Level 1: comprises NAB and its subsidiary entitiesapproved by APRA as part of the Extended LicensedEntity (ELE)
• Level 2: comprises NAB and the entities it controls,subject to certain exceptions set out below
• Level 3: comprises the conglomerate NAB Group.
This report applies to the Level 2 consolidated group (theLevel 2 Group).
NAB Group Consolidation for Regulatory Purposes
The controlled entities in the Level 2 Group include BNZand other financial entities (e.g. finance companies andleasing companies).
Wealth management and life insurance activities areexcluded from the calculation of RWA and the relatedcontrolled entities are deconsolidated from the Level 2Group for the purposes of calculating capital adequacy.Capital adequacy deductions are applied to theinvestments in, and profits of, these activities. NWMH hasnot been treated as part of the Level 2 Group for thepurposes of this report.
The NAB Group is progressing with a transition to therevised Level 2 Group following a clarification of the ADILevel 2 Group definition by APRA.
In the interim period, CET1 Capital reflects the transitionarrangements granted by APRA on the removal of capitalbenefits arising from debt issued directly by NWMH.
In addition, certain securitisation special purpose vehicles(SPVs) to which assets have been transferred inaccordance with APRA’s requirements as set out in APS120 have been deconsolidated from the Level 2 Group forthe purposes of this disclosure. For regulatory purposes,credit risk is removed from the sold assets and there is norequirement to hold capital against them.
Differences in Consolidation Arising Between theRegulatory and Accounting Approaches
For financial reporting, the NAB Group applies InternationalFinancial Reporting Standards (IFRS) and consolidates all
entities in which it has the power to govern the financialand operating policies so as to obtain benefit from theiractivities. This includes life insurance, wealthmanagement and securitisation SPVs used to housesecuritised assets. As noted above, these entities mayreceive a different treatment for Level 2 regulatoryconsolidation purposes. A list of material controlledentities included in the consolidated NAB Group forfinancial reporting purposes can be found in the NABGroup’s 2016 Annual Financial Report.
Basis of preparation
Prior period historical information has not been restated ona continuing basis following the CYBG PLC (CYBG)demerger.
Restrictions on the Transfer of Funds and RegulatoryCapital within the NAB Group
Limits are placed on the level of capital and fundingtransfers and on the level of exposure (debt and equity)that the NAB Group may have to a related entity. Theselimits are subject to the NAB Group Balance Sheet andLiquidity Risk (GBSLR) Policy which requires thatcontagion risk be managed under regulatory requirementsAPRA Prudential Standard APS 222 Associations withRelated Entities and the Board’s risk appetite for intra-group exposures.
Each banking subsidiary works with the NAB Group tomanage capital to target capital ranges approved by theirrespective boards. Any capital transfer is subject tomaintaining adequate subsidiary and parent companycapitalisation.
Disclosure 2A: Scope of Application
There were no capital deficiencies in non-consolidatedsubsidiaries of the NAB Group as at 30 September 2016 or31 March 2016.
Bank of New Zealand
BNZ is a wholly owned subsidiary of the NAB Group andoperates as a regionally autonomous, full-service bank inNew Zealand. The BNZ board of directors is responsiblefor BNZ's corporate governance and derives its authorityfrom the Constitution of BNZ, within the NAB GroupFramework and applicable New Zealand legislation.
BNZ is subject to the Basel Accord capital adequacyrequirements applicable in New Zealand, mandated by theRBNZ. The capital ratios for BNZ presented in this reporthave been derived under the RBNZ’s Capital AdequacyFramework (Internal Models Based Approach). Full Baseldisclosures for BNZ are published separately under theDisclosure Statement regime applicable to banksincorporated in New Zealand.
Pillar 3 report
2016
4
Risk Governance and Management
Section 3
Risk Governance and Management
The corporate governance framework (the structure ofwhich is set out below) applies across both APRA and non-APRA regulated entities, and provides guidance foreffective decision making on how authority is exercised inall areas of the NAB Group through:
• strategic and operational planning• risk management and compliance• financial management and external reporting• succession planning and culture.
The NAB Group’s corporate governance framework issupported by the Delegated Authority Framework andRemuneration Framework.
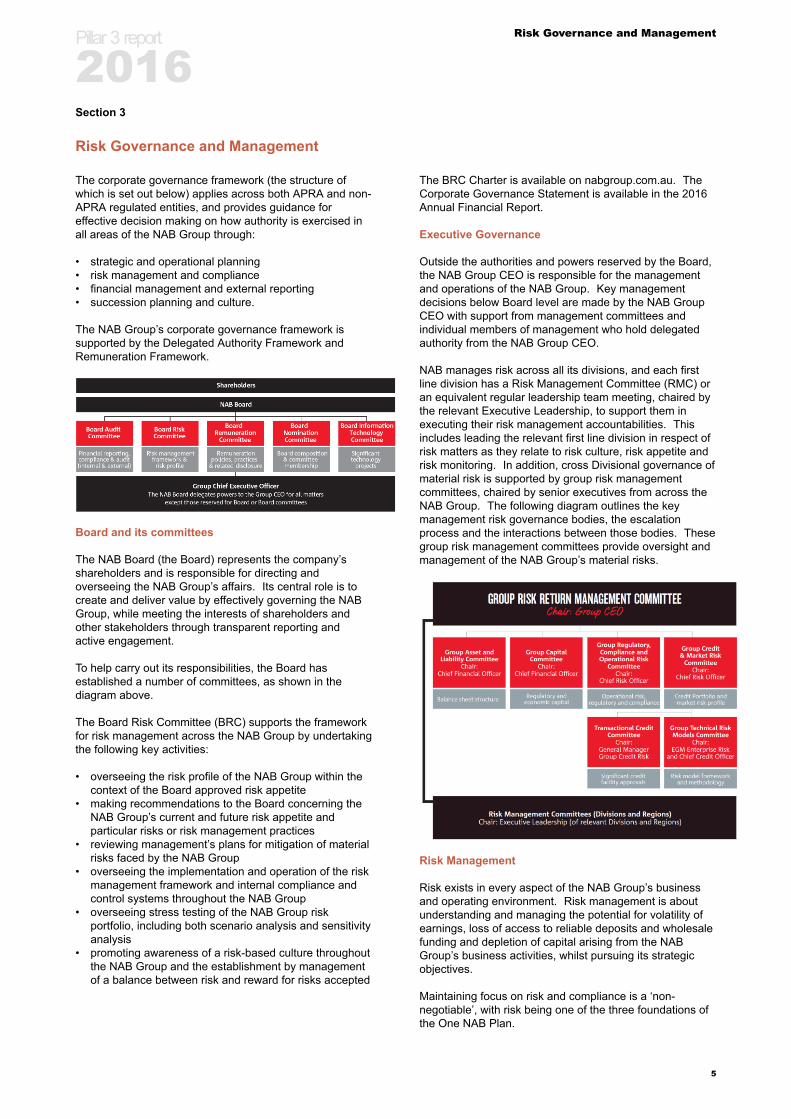
Board and its committees
The NAB Board (the Board) represents the company’sshareholders and is responsible for directing andoverseeing the NAB Group’s affairs. Its central role is tocreate and deliver value by effectively governing the NABGroup, while meeting the interests of shareholders andother stakeholders through transparent reporting andactive engagement.
To help carry out its responsibilities, the Board hasestablished a number of committees, as shown in thediagram above.
The Board Risk Committee (BRC) supports the frameworkfor risk management across the NAB Group by undertakingthe following key activities:
• overseeing the risk profile of the NAB Group within thecontext of the Board approved risk appetite
• making recommendations to the Board concerning theNAB Group’s current and future risk appetite andparticular risks or risk management practices
• reviewing management’s plans for mitigation of materialrisks faced by the NAB Group
• overseeing the implementation and operation of the riskmanagement framework and internal compliance andcontrol systems throughout the NAB Group
• overseeing stress testing of the NAB Group riskportfolio, including both scenario analysis and sensitivityanalysis
• promoting awareness of a risk-based culture throughoutthe NAB Group and the establishment by managementof a balance between risk and reward for risks accepted
The BRC Charter is available on nabgroup.com.au. TheCorporate Governance Statement is available in the 2016Annual Financial Report.
Executive Governance
Outside the authorities and powers reserved by the Board,the NAB Group CEO is responsible for the managementand operations of the NAB Group. Key managementdecisions below Board level are made by the NAB GroupCEO with support from management committees andindividual members of management who hold delegatedauthority from the NAB Group CEO.
NAB manages risk across all its divisions, and each firstline division has a Risk Management Committee (RMC) oran equivalent regular leadership team meeting, chaired bythe relevant Executive Leadership, to support them inexecuting their risk management accountabilities. Thisincludes leading the relevant first line division in respect ofrisk matters as they relate to risk culture, risk appetite andrisk monitoring. In addition, cross Divisional governance ofmaterial risk is supported by group risk managementcommittees, chaired by senior executives from across theNAB Group. The following diagram outlines the keymanagement risk governance bodies, the escalationprocess and the interactions between those bodies. Thesegroup risk management committees provide oversight andmanagement of the NAB Group’s material risks.
Risk Management
Risk exists in every aspect of the NAB Group’s businessand operating environment. Risk management is aboutunderstanding and managing the potential for volatility ofearnings, loss of access to reliable deposits and wholesalefunding and depletion of capital arising from the NABGroup’s business activities, whilst pursuing its strategicobjectives.
Maintaining focus on risk and compliance is a ‘non-negotiable’, with risk being one of the three foundations ofthe One NAB Plan.
Pillar 3 report
2016
5

Risk Governance and Management
The NAB Group’s objectives are achieved through theformation and execution of the NAB Group’s strategy,which is defined and agreed to by the Board. Formulatingthe strategy requires the NAB Group to consider andrespond to various internal and external uncertainties. Theannual strategic planning process establishes the strategicobjectives and risk appetite, translating these intodirections and specific performance targets for the NABGroup, Divisions and Performance Units (PUs). Stresstesting and scenario analysis is used to support formulationof our risk appetite (including the determination of our riskcapacity), and limits for capital management, funding andliquidity. The key outputs of the strategic planning processinclude the:
• Group Strategic Plan• Group Financial Plan• Group Risk Appetite Statement (RAS) and Legal Entity
RAS• Group Capital Management Strategy (CMS) and
Internal Capital Adequacy Assessment Process(ICAAP)
• Group Funding Strategy
Together, these documents constitute the NAB Group’sBusiness Plan.
The NAB Group’s Risk Management Framework (RMF)articulates the NAB Group’s approach to managing risk. Itis the totality of systems, structures, policies, processesand people that manage all material internal and externalsources of identified material risks facing the NAB Group.
The NAB Group’s approach to risk management is basedon a Three Lines of Defence model, which provides thefoundation for effective risk management. The overarchingprinciple of this model is that risk management capabilitymust be embedded within the business to be effective.
Accountabilities for risk management activities across eachLine of Defence is articulated in the Risk ManagementAccountability Model, which is applicable across all entitiesof the NAB Group.
Further details of risks associated with the NAB Group areset out in in the NAB 2016 Annual Financial Report.
Pillar 3 report
2016
6
Capital
Section 4
Capital
4.1 Capital Adequacy
Capital Objectives
The NAB Group assesses capital adequacy to support itsoverarching capital management objectives:
• a credit rating in the AA range• meeting regulatory capital requirements• meeting internal economic capital requirements• maintaining flexibility to deal with unexpected events• efficiency in the amount and type of capital• effective deployment of capital
Risk Identification and Measurement
The process of assessing capital adequacy begins with theidentification of all the material risks of the NAB Groupwithin the NAB Group Risk Inventory (GRI). The GRIincludes consistent definitions and the approach tomeasurement, including for capital adequacy purposes.
The NAB Group measures all material risks and whereappropriate, generates a capital adequacy requirement. Inmanaging the business, the NAB Group considers bothregulatory and economic capital requirements.
Regulatory Capital Economic Capital
Purpose
Regulatory view of thecapital required to be heldto protect against risksassociated with businessactivities.
Management’s view of thecapital required to be heldto support the specific riskcharacteristics of thebusiness and its portfolio.
CalculationDriven by RWA which iscalculated under regulatoryrequirements.
Internal risk-based models.
Risk types
Credit risk, market risk,operational risk and interestrate risk in the bankingbook.
As per regulatory capitalrequirements, plus othermaterial risks, includingbusiness/strategic risk.
Capital Planning
Along with the Risk Appetite Statement, the CMS is anintegral part of the NAB Group’s strategic planning processwhich considers how the NAB Group will meet its capitalrequirements over a three-year plan period. The CMScovers the NAB Group’s:
• capital outlook, including capital forecast• risks and potential upsides to the forecast• capital initiatives over the plan period• dividend outlook and sustainability• profits test obligations• other strategic initiatives.
In addition to a base case, the planning process alsoconsiders stressed scenarios and sensitivities to ensurethe NAB Group maintains capital adequacy in thesesituations and adjusts plans if these stress tests highlight aneed to. Within certain risk categories, the NAB Groupperforms regular sensitivity and stress tests across
material models and businesses to test the veracity ofassumptions and to determine the sensitivity of key riskmeasures (including capital) to management actions andpotential changes in the external environment. The NABGroup then develops plans to mitigate risks in the event ofa stressed scenario.
The Board sets capital targets above the internal risk-based assessment of capital. Target ranges are set byreference to factors such as the NAB Group’s RiskAppetite Statement, market, regulatory and rating agenciesexpectations. The NAB Group’s CET1 Capital ratiooperating target is between 8.75% and 9.25% and isregularly reviewed in the contest of the external economicand regulatory outlook with the objective of maintainingbalance sheet strength.The NAB Group is at a comfortablebuffer to the Board target as at 30 September 2016.
APRA advises the NAB Group of its Prudential CapitalRequirements (PCR) which represent the minimum ratiosof regulatory capital to total RWA. The PCRs are notpublicly disclosed.
The NAB Group’s capital position is monitored on amonthly basis and reported to management and Boardcommittees.
Embedding Capital Requirements in BusinessDecisions
Capital requirements are taken into consideration in:
• product and facility pricing decisions• business development, including acquisitions• strategy and strategic planning• performance measurement and management, including
short and long-term incentive determination• setting of risk appetite and risk limits, including large
exposure limits, industry limits and country limits.
Additional Tier 1 Capital InitiativesOn 7 July 2016 NAB issued $1,499 million of CapitalNotes, which will mandatorily convert into Ordinary Shareson 8 July 2024 (subject to the mandatory conversionconditions being satisfied).
Two Additional Tier 1 instruments were called during thehalf year to September 2016:
• Perpetual Capital Notes of US$600 million, originallyissued on 24 September 2009.
• EUR National Capital Instruments (NCI) of €400 million,originally issued on 29 September 2006.
In line with the CYBG Demerger Scheme Booklet, on22 September 2016 the Group’s holding of CYBGAdditional Tier 1 instruments were sold for a total value of£419 million.
Pillar 3 report
2016
7

Capital
Tier 2 Capital InitiativesThe Group’s Tier 2 Capital initiatives over the half yearto September 2016 include the issuance of the followingSubordinated Notes:
• 17 May 2016, HK$1,137 million due 2026.• 19 May 2016, SG$450 million due 2028.• 16 September 2016, JPY10 billion due 2026.• 21 September 2016, $800 million due 2026.
For these transactions, the Subordinated Notes convertinto fully paid ordinary shares of NAB where APRAdetermines this to be necessary on the grounds that NABwould otherwise become non-viable.
In line with the CYBG Demerger Scheme Booklet, on22 September 2016 the Group’s holding of CYBG Tier 2instruments were sold for a total value of £460 million.
Governance, Reporting and Oversight
A number of risks related to the management of the NABGroup’s capital position which, if not appropriatelymanaged, could lead to the NAB Group not holdingsufficient capital and reserves to achieve its strategicaspirations, cover the risks to which it is exposed andprotect against unexpected losses.
The annual Internal Capital Adequacy AssessmentProcess (ICAAP) describes the NAB Group’s frameworkfor assessing its capital adequacy. Key features include:
• understanding risks and ensuring they are appropriatelymitigated
• capital management• use of capital in the business• risk appetite and planning process• capital adequacy assessment on a current and forward
looking basis, including the impact of stress andscenario testing.
The NAB Group’s ICAAP document, CMS, Risk AppetiteStatement and Strategic Plan cover the governance,reporting and oversight of the NAB Group’s capitaladequacy. These documents and plans are reviewed andendorsed by key management committees, including theGroup Capital Committee (GCC), the Group Asset andLiability Committee (GALCO) and the GRRMC, and areultimately approved by the Board.
The ICAAP is also supported by the NAB’s Group CapitalPolicy which defines the framework for the management,monitoring and governance of the NAB Group’s capitalposition. The framework is built around the Board’sguiding principles, including preserving the NAB Group’scredit rating, maintaining capital adequacy and an efficientcapital mix.
Group Treasury is responsible for managing capital risk.The NAB Group and subsidiary Treasuries each preparean annual Capital Management Strategy (incorporatingcapital targets) and execute the Board-approved strategiesoutlined in the CMS.
GBSLR is responsible for capital oversight and isindependent of Group Treasury. GBSLR maintains a riskframework for effective oversight, supports stress testing ofthe NAB Group’s capital position, supports capital planning
and forecasting, and monitors capital activities to ensurecompliance with the requirements of the NAB Group’scapital framework.
Pillar 3 report
2016
8
Capital
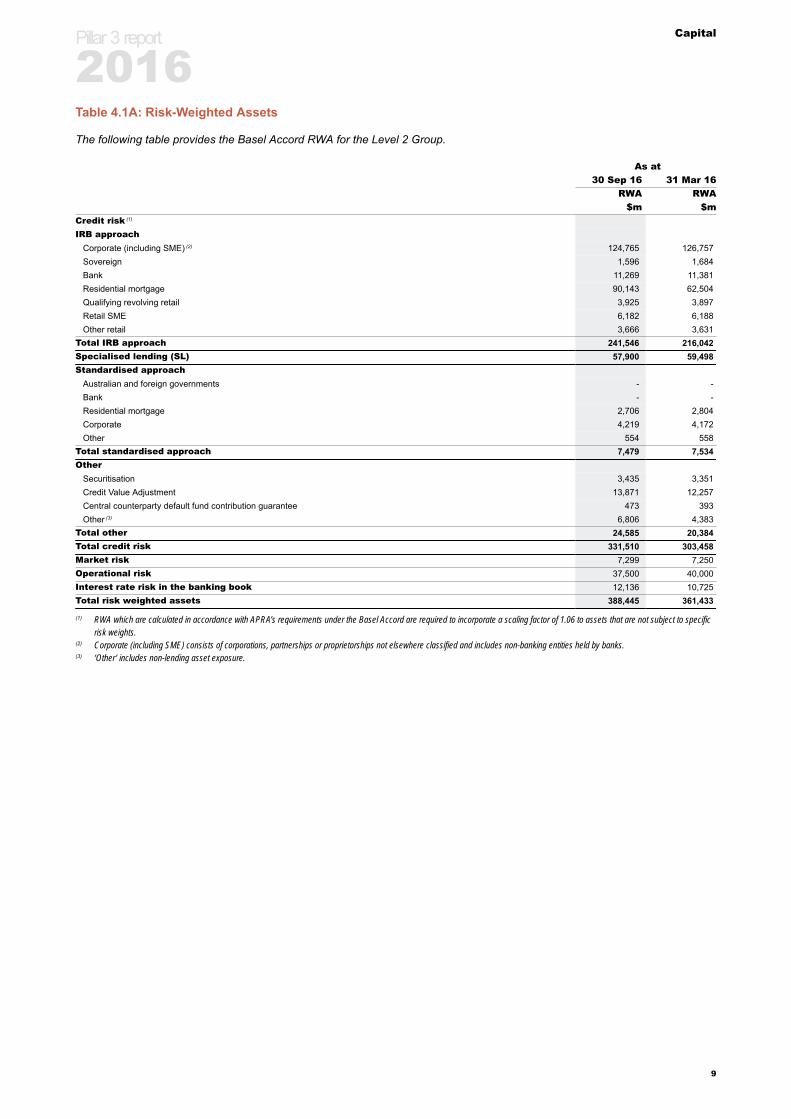
Table 4.1A: Risk-Weighted Assets
The following table provides the Basel Accord RWA for the Level 2 Group.
As at30 Sep 16 31 Mar 16
RWA RWA$m $m
Credit risk (1)
IRB approachCorporate (including SME) (2) 124,765 126,757Sovereign 1,596 1,684Bank 11,269 11,381Residential mortgage 90,143 62,504Qualifying revolving retail 3,925 3,897Retail SME 6,182 6,188Other retail 3,666 3,631
Total IRB approach 241,546 216,042Specialised lending (SL) 57,900 59,498Standardised approach
Australian and foreign governments - -Bank - -Residential mortgage 2,706 2,804Corporate 4,219 4,172Other 554 558
Total standardised approach 7,479 7,534Other
Securitisation 3,435 3,351Credit Value Adjustment 13,871 12,257Central counterparty default fund contribution guarantee 473 393Other (3) 6,806 4,383
Total other 24,585 20,384Total credit risk 331,510 303,458Market risk 7,299 7,250Operational risk 37,500 40,000Interest rate risk in the banking book 12,136 10,725Total risk weighted assets 388,445 361,433
(1) RWA which are calculated in accordance with APRA’s requirements under the Basel Accord are required to incorporate a scaling factor of 1.06 to assets that are not subject to specificrisk weights.
(2) Corporate (including SME) consists of corporations, partnerships or proprietorships not elsewhere classified and includes non-banking entities held by banks.(3) ‘Other’ includes non-lending asset exposure.
Pillar 3 report
2016
9
Capital
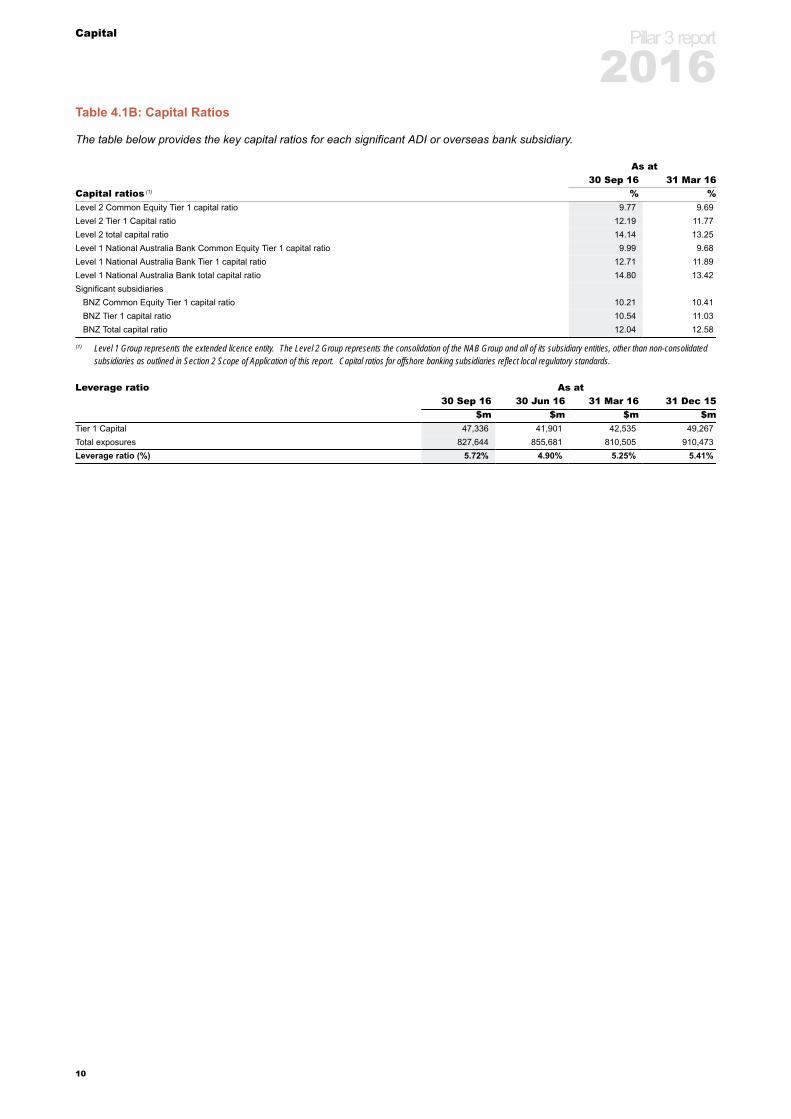
Table 4.1B: Capital Ratios
The table below provides the key capital ratios for each significant ADI or overseas bank subsidiary.
As at30 Sep 16 31 Mar 16
Capital ratios (1) % %Level 2 Common Equity Tier 1 capital ratio 9.77 9.69Level 2 Tier 1 Capital ratio 12.19 11.77Level 2 total capital ratio 14.14 13.25Level 1 National Australia Bank Common Equity Tier 1 capital ratio 9.99 9.68Level 1 National Australia Bank Tier 1 capital ratio 12.71 11.89Level 1 National Australia Bank total capital ratio 14.80 13.42Significant subsidiaries
BNZ Common Equity Tier 1 capital ratio 10.21 10.41BNZ Tier 1 capital ratio 10.54 11.03BNZ Total capital ratio 12.04 12.58
(1) Level 1 Group represents the extended licence entity. The Level 2 Group represents the consolidation of the NAB Group and all of its subsidiary entities, other than non-consolidatedsubsidiaries as outlined in Section 2 Scope of Application of this report. Capital ratios for offshore banking subsidiaries reflect local regulatory standards.
Leverage ratio As at30 Sep 16 30 Jun 16 31 Mar 16 31 Dec 15
$m $m $m $mTier 1 Capital 47,336 41,901 42,535 49,267Total exposures 827,644 855,681 810,505 910,473Leverage ratio (%) 5.72% 4.90% 5.25% 5.41%
Pillar 3 report
2016
10
Capital
4.2 Capital Structure
The NAB Group’s capital structure comprises of various forms of capital. CET1 Capital comprises of paid-up ordinary sharecapital, retained earnings plus certain other items recognised as capital. The ratio of such capital to risk-weighted assets iscalled the CET1 Capital Ratio. Additional Tier 1 Capital comprises certain securities with required loss absorbingcharacteristics. Together, CET1 Capital and Additional Tier 1 Capital make up Tier 1 Capital and the ratio of such capital toRWA is called the Tier 1 Capital ratio.
CET1 Capital contains the highest quality and most loss absorbent components of capital, followed by Additional Tier 1 Capitaland then Tier 2 Capital. Tier 2 Capital mainly consists of subordinated instruments.
Further details of Additional Tier 1 and Tier 2 securities are disclosed in the Capital Instruments section of the NAB Group’swebsite at: http://capital.nab.com.au/disclaimer-area/capital-instruments.phps.
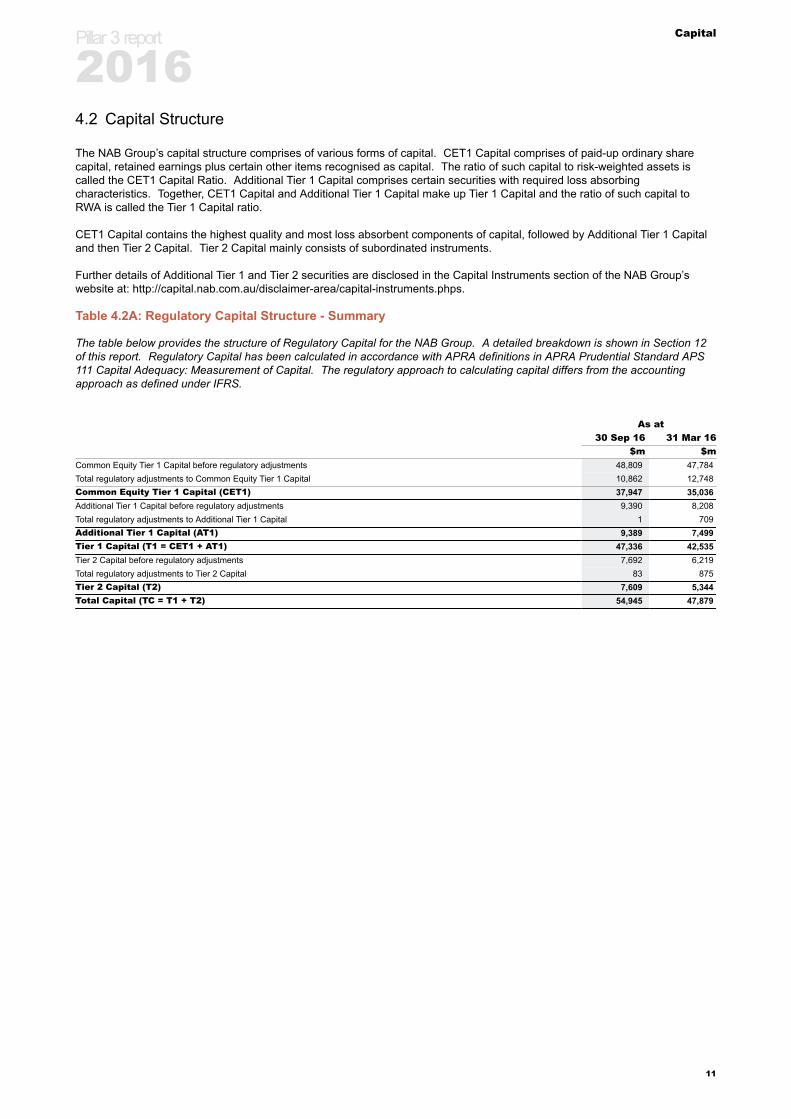
Table 4.2A: Regulatory Capital Structure - Summary
The table below provides the structure of Regulatory Capital for the NAB Group. A detailed breakdown is shown in Section 12of this report. Regulatory Capital has been calculated in accordance with APRA definitions in APRA Prudential Standard APS111 Capital Adequacy: Measurement of Capital. The regulatory approach to calculating capital differs from the accountingapproach as defined under IFRS.
As at30 Sep 16 31 Mar 16
$m $mCommon Equity Tier 1 Capital before regulatory adjustments 48,809 47,784Total regulatory adjustments to Common Equity Tier 1 Capital 10,862 12,748Common Equity Tier 1 Capital (CET1) 37,947 35,036Additional Tier 1 Capital before regulatory adjustments 9,390 8,208Total regulatory adjustments to Additional Tier 1 Capital 1 709Additional Tier 1 Capital (AT1) 9,389 7,499Tier 1 Capital (T1 = CET1 + AT1) 47,336 42,535Tier 2 Capital before regulatory adjustments 7,692 6,219Total regulatory adjustments to Tier 2 Capital 83 875Tier 2 Capital (T2) 7,609 5,344Total Capital (TC = T1 + T2) 54,945 47,879
Pillar 3 report
2016
11
Credit Risk
Section 5
Credit Risk
5.1 General Disclosure
Credit is any transaction that creates an actual or potentialobligation for a counterparty to pay the NAB Group.
Credit risk is the potential that a customer and/orcounterparty will fail to meet their obligations to the NABGroup under agreed terms.
The NAB Group’s approach to credit risk management isdesigned to:
• inform future direction and broader strategic priorities• achieve effective credit risk management through
maintaining exposure to credit risk within acceptableparameters while maximising the NAB Group’srisk-adjusted rate of return and ensuring alignment torisk appetite
• be embedded in every aspect of the NAB Group’s day-to-day business.
Structure and Organisation
The Board delegates credit decision-making authority tothe BRC and then through the organisation via the NABGroup CEO and NAB Group Chief Risk Officer (CRO), whoset the Delegated Commitment Authority (DCA). The DCAis cascaded via the NAB Group Chief Credit Officer to theTransactional Credit Committee (TCC) and the NABGroup’s business units.
The GRRMC and its subcommittees oversee the NABGroup’s credit risk appetite, principles, policies, modelsand systems for the management of credit risk across theNAB Group.
Business unit risk management committees areresponsible for implementing these disciplines at abusiness unit level.
Either the BRC or its delegates set limits on the amount ofrisk accepted concerning one counterparty or group ofcounterparties, and geographic and industry segments.These limits are consistent with the NAB Group’s riskappetite. Such risks are monitored on a regular basis andare subject to annual or more frequent reviews.
Management
Exposure to credit risk is managed by regularly analysingthe ability of counterparties and potential counterparties tomeet interest and capital repayment obligations, and bychanging lending limits and lending conditions whereappropriate.
Group Credit Policy applies globally and encompasses theNAB Group’s:
• credit risk appetite and principles• credit underwriting standards• approach to ensure compliance with regulatory
standards.
Senior management and line management within eachbusiness unit have primary responsibility to ensure theirrespective areas follow the NAB Group’s credit policies,processes and standards.
The Credit Risk functions at the NAB Group and businessunit levels are charged with implementing a sound riskframework to maintain appropriate asset quality across theNAB Group in line with credit risk appetite, credit riskunderwriting standards and policy.
Group Credit Risk plays a key role in managing riskappetite, portfolio measurement, assisting businesses withportfolio management, and measuring compliance withstrategic targets and limits. Group Credit Risk also:
• owns and is accountable for the credit risk policies andsystems, concentration limits, large counterparty creditapprovals and the management of largeunderperforming loans
• ensures that such policies and systems comply with thevarious regulatory and prudential requirements
• owns and monitors the performance of Group-widemodels and methodology.
A key assurance area across non-retail banking activities isthe Asset Quality Assurance function. This function isresponsible and accountable for the independent reviewand reporting of asset quality, lending process standardsand credit policy compliance across transaction-managedlending portfolios. The function operates independentlyfrom the credit approval process and reports its findings tothe respective business units and risk managementcommittees highlighting adverse trends and requiredremedial action.
Retail lending teams undertake independent reviews andreport these results to senior management in therespective business and risk management committees.
Measurement
Later sections of this report detail the credit riskmeasurement approaches.
Monitoring and Reporting
The NAB Group has a comprehensive process forreporting credit and asset quality.
The NAB Group and business unit CROs receive regularreports covering credit risk, credit quality, assetconcentrations, asset quality, ESG risk, material exposuresand defaults and assurance outcomes for both businessand retail credit. These reports incorporate key credit riskmeasures including economic capital and detailed analysisof concentration risk, TCC approvals and updates ondefaulted counterparties. Key reports are provided to theinternal committees and the BRC.
Pillar 3 report
2016
12

Credit Risk
On a monthly basis, the NAB Group and business unitCredit Risk Committees receive a detailed analysis ofasset quality measures. Periodically, the business unit andGroup Credit Risk functions provide the BRC and theGRRMC with portfolio and industry reviews, as well as theoutcome of portfolio stress testing.
Definitions of Default and Impairment
Default occurs when a loan obligation is 90 days or morepast due, or when it is considered unlikely that the creditobligation to the NAB Group will be paid in full withoutrecourse to actions, such as realisation of security.
A facility is classified as impaired when the ultimate abilityto collect principal and interest and other amounts(including legal, enforcement and realisation costs) in atimely manner is compromised.
Impaired facilities consist of:
• retail loans (excluding unsecured portfolio-managedfacilities) which are contractually 90 days or more pastdue with security insufficient to cover principal andarrears of interest revenue
• unsecured portfolio-managed facilities which are 180days past due (if not written off)
• non-retail loans that are contractually 90 days or morepast due and/or sufficient doubt exists about the abilityto collect principal and interest in a timely manner
• off-balance sheet credit exposures where currentcircumstances indicate that losses may be incurred.
Creation of Specific Provisions, Collective Provisionsand the General Reserve for Credit Losses
Specific provisions
Specific provisions are raised for impaired facilities forwhich a loss is expected and represent the estimatedshortfall between the face value of the asset and theestimated future cashflows, including the estimatedrealisable value of securities after costs.
Collective provisions
Collective provisions are raised for facilities that areperforming or facilities in default but for which no loss isexpected. This process involves grouping financial assetswith similar credit risk characteristics and collectivelyassessing them for expected loss in accordance with therequirements of IFRS.
The assessment of collective provisions for retail assetsrelies on the portfolio delinquency profile and historical lossexperience while the non-retail assessment relies on therisk characteristics of credit rating models.
Collective provisions also incorporate an estimate of theexpected loss using management's forward lookingassessment of macroeconomic and industry specificfactors. This process includes the NAB Group'sjudgements and reasonable estimates in line with therequirements of IFRS.
The NAB Group’s collective provision is disclosed in theNAB 2016 Annual Financial Report.
Effective 1 October 2014, the NAB Group early adoptedthe requirements of AASB 9 ‘Financial Instruments’. Thetransitional impacts of this adoption are highlighted in Note1 to the NAB Group’s 2015 Annual Financial Report.
Provisions for facilities in default but for which no loss isexpected are reported as additional regulatory specificprovisions within this report.
General reserve for credit losses
APRA Prudential Standard APS 220 Credit Qualityrequires a reserve to be held to cover credit lossesestimated but not certain to arise in the future over the fulllife of all individual facilities. The general reserve for creditlosses (GRCL) represents an appropriation of retainedprofits to non-distributable reserves.
The GRCL is calculated as a collective provision fordoubtful debts, excluding securitisation and provisions ondefault-no-loss assets. The difference between the GRCLand accounting collective provisions is covered with anadditional top up, created through a deduction fromretained earnings to reflect losses expected as a result offuture events that are not recognised in the NAB Group’scollective provision for accounting purposes.
Write-offs
When an asset is considered uncollectible, it is written offagainst the related provision. Such assets are written offafter all the necessary recovery procedures have beencompleted and the amount of the loss has beendetermined. Subsequent recoveries of amounts written offreduce the amount of the expense in the incomestatement.
Pillar 3 report
2016
13
Credit Risk
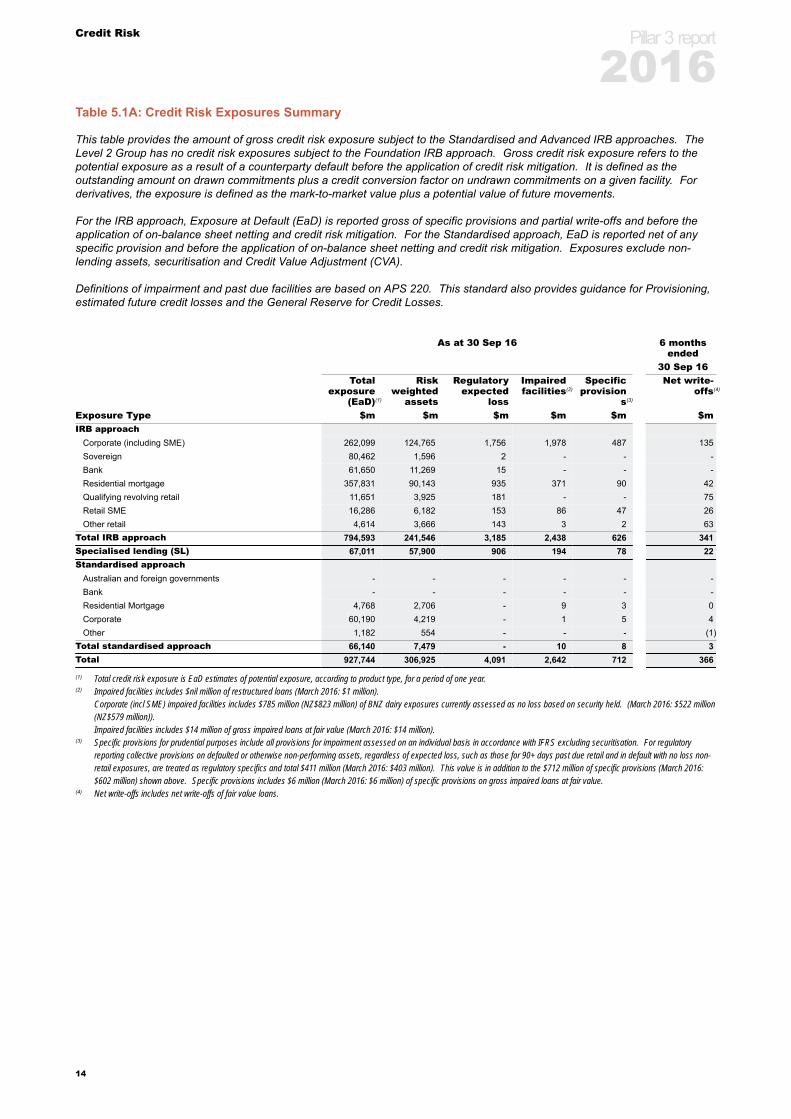
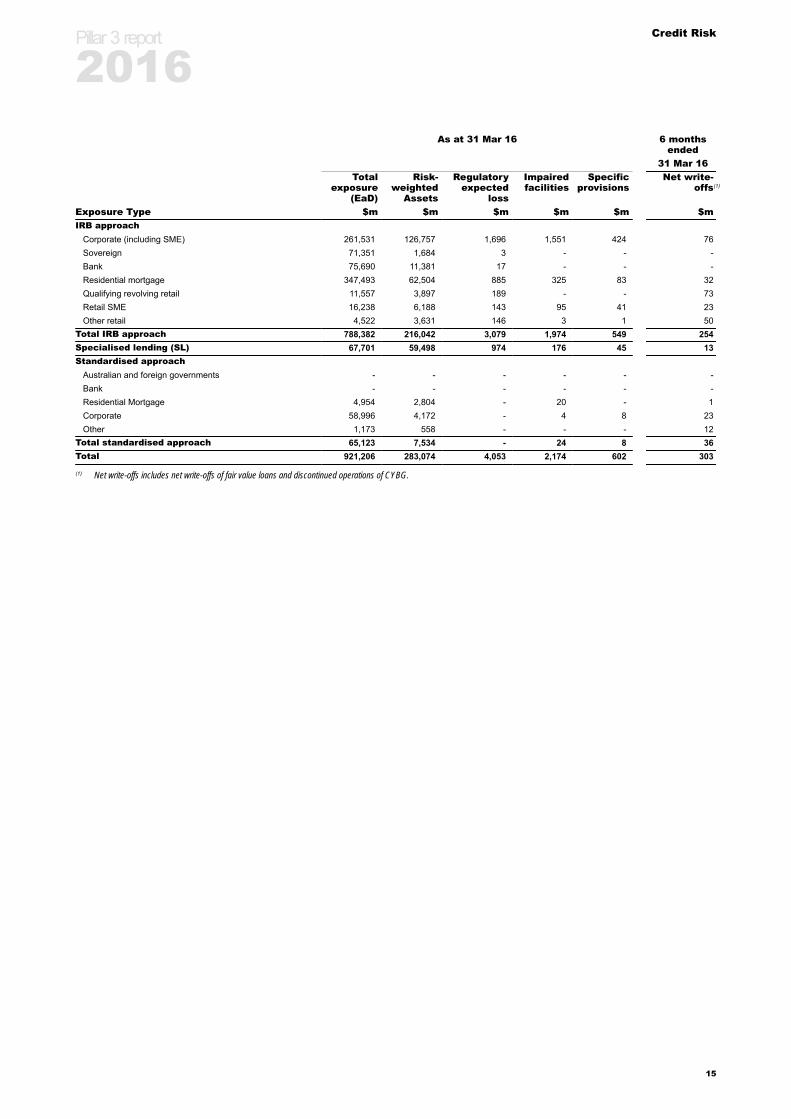
Table 5.1A: Credit Risk Exposures Summary
This table provides the amount of gross credit risk exposure subject to the Standardised and Advanced IRB approaches. TheLevel 2 Group has no credit risk exposures subject to the Foundation IRB approach. Gross credit risk exposure refers to thepotential exposure as a result of a counterparty default before the application of credit risk mitigation. It is defined as theoutstanding amount on drawn commitments plus a credit conversion factor on undrawn commitments on a given facility. Forderivatives, the exposure is defined as the mark-to-market value plus a potential value of future movements.
For the IRB approach, Exposure at Default (EaD) is reported gross of specific provisions and partial write-offs and before theapplication of on-balance sheet netting and credit risk mitigation. For the Standardised approach, EaD is reported net of anyspecific provision and before the application of on-balance sheet netting and credit risk mitigation. Exposures exclude non-lending assets, securitisation and Credit Value Adjustment (CVA).
Definitions of impairment and past due facilities are based on APS 220. This standard also provides guidance for Provisioning,estimated future credit losses and the General Reserve for Credit Losses.
As at 30 Sep 16 6 monthsended
30 Sep 16Total
exposure(EaD)(1)
Riskweighted
assets
Regulatoryexpected
loss
Impairedfacilities(2)
Specificprovision
s(3)
Net write-offs(4)
Exposure Type $m $m $m $m $m $mIRB approach
Corporate (including SME) 262,099 124,765 1,756 1,978 487 135Sovereign 80,462 1,596 2 - - -Bank 61,650 11,269 15 - - -Residential mortgage 357,831 90,143 935 371 90 42Qualifying revolving retail 11,651 3,925 181 - - 75Retail SME 16,286 6,182 153 86 47 26Other retail 4,614 3,666 143 3 2 63
Total IRB approach 794,593 241,546 3,185 2,438 626 341Specialised lending (SL) 67,011 57,900 906 194 78 22Standardised approach
Australian and foreign governments - - - - - -Bank - - - - - -Residential Mortgage 4,768 2,706 - 9 3 0Corporate 60,190 4,219 - 1 5 4Other 1,182 554 - - - (1)
Total standardised approach 66,140 7,479 - 10 8 3Total 927,744 306,925 4,091 2,642 712 366
(1) Total credit risk exposure is EaD estimates of potential exposure, according to product type, for a period of one year.(2) Impaired facilities includes $nil million of restructured loans (March 2016: $1 million).
Corporate (incl SME) impaired facilities includes $785 million (NZ$823 million) of BNZ dairy exposures currently assessed as no loss based on security held. (March 2016: $522 million(NZ$579 million)).Impaired facilities includes $14 million of gross impaired loans at fair value (March 2016: $14 million).
(3) Specific provisions for prudential purposes include all provisions for impairment assessed on an individual basis in accordance with IFRS excluding securitisation. For regulatoryreporting collective provisions on defaulted or otherwise non-performing assets, regardless of expected loss, such as those for 90+ days past due retail and in default with no loss non-retail exposures, are treated as regulatory specifics and total $411 million (March 2016: $403 million). This value is in addition to the $712 million of specific provisions (March 2016:$602 million) shown above. Specific provisions includes $6 million (March 2016: $6 million) of specific provisions on gross impaired loans at fair value.
(4) Net write-offs includes net write-offs of fair value loans.
Pillar 3 report
2016
14
Credit Risk
As at 31 Mar 16 6 monthsended
31 Mar 16Total
exposure(EaD)
Risk-weighted
Assets
Regulatoryexpected
loss
Impairedfacilities
Specificprovisions
Net write-offs(1)
Exposure Type $m $m $m $m $m $mIRB approach
Corporate (including SME) 261,531 126,757 1,696 1,551 424 76Sovereign 71,351 1,684 3 - - -Bank 75,690 11,381 17 - - -Residential mortgage 347,493 62,504 885 325 83 32Qualifying revolving retail 11,557 3,897 189 - - 73Retail SME 16,238 6,188 143 95 41 23Other retail 4,522 3,631 146 3 1 50
Total IRB approach 788,382 216,042 3,079 1,974 549 254Specialised lending (SL) 67,701 59,498 974 176 45 13Standardised approach
Australian and foreign governments - - - - - -Bank - - - - - -Residential Mortgage 4,954 2,804 - 20 - 1Corporate 58,996 4,172 - 4 8 23Other 1,173 558 - - - 12
Total standardised approach 65,123 7,534 - 24 8 36Total 921,206 283,074 4,053 2,174 602 303
(1) Net write-offs includes net write-offs of fair value loans and discontinued operations of CYBG.
Pillar 3 report
2016
15
Credit Risk
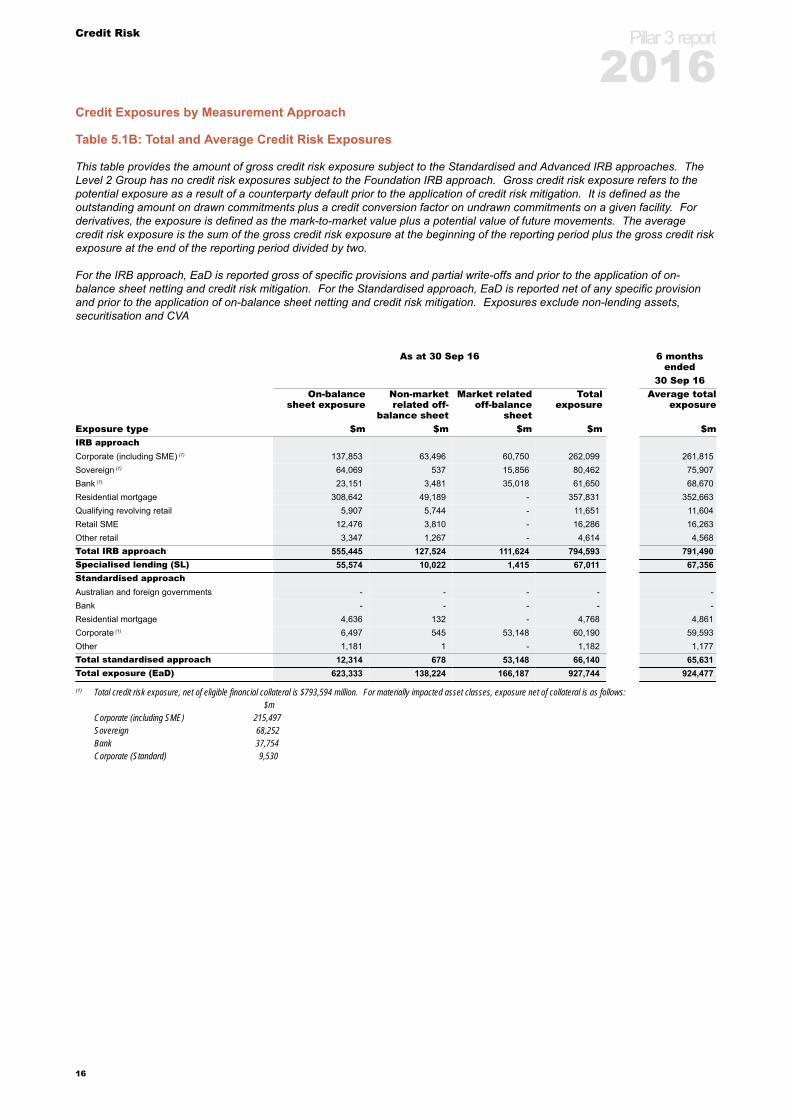
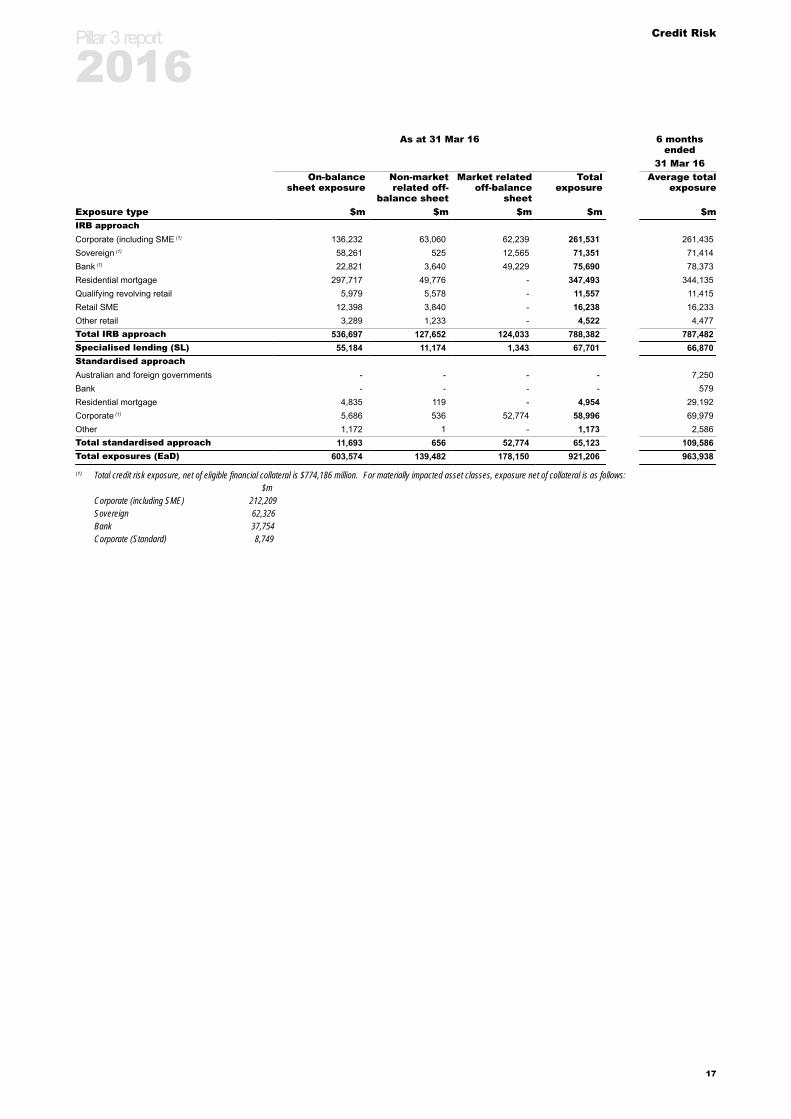
Credit Exposures by Measurement Approach
Table 5.1B: Total and Average Credit Risk Exposures
This table provides the amount of gross credit risk exposure subject to the Standardised and Advanced IRB approaches. TheLevel 2 Group has no credit risk exposures subject to the Foundation IRB approach. Gross credit risk exposure refers to thepotential exposure as a result of a counterparty default prior to the application of credit risk mitigation. It is defined as theoutstanding amount on drawn commitments plus a credit conversion factor on undrawn commitments on a given facility. Forderivatives, the exposure is defined as the mark-to-market value plus a potential value of future movements. The averagecredit risk exposure is the sum of the gross credit risk exposure at the beginning of the reporting period plus the gross credit riskexposure at the end of the reporting period divided by two.
For the IRB approach, EaD is reported gross of specific provisions and partial write-offs and prior to the application of on-balance sheet netting and credit risk mitigation. For the Standardised approach, EaD is reported net of any specific provisionand prior to the application of on-balance sheet netting and credit risk mitigation. Exposures exclude non-lending assets,securitisation and CVA
As at 30 Sep 16 6 monthsended
30 Sep 16On-balance
sheet exposureNon-marketrelated off-
balance sheet
Market relatedoff-balance
sheet
Totalexposure
Average totalexposure
Exposure type $m $m $m $m $mIRB approachCorporate (including SME) (1) 137,853 63,496 60,750 262,099 261,815Sovereign (1) 64,069 537 15,856 80,462 75,907Bank (1) 23,151 3,481 35,018 61,650 68,670Residential mortgage 308,642 49,189 - 357,831 352,663Qualifying revolving retail 5,907 5,744 - 11,651 11,604Retail SME 12,476 3,810 - 16,286 16,263Other retail 3,347 1,267 - 4,614 4,568Total IRB approach 555,445 127,524 111,624 794,593 791,490Specialised lending (SL) 55,574 10,022 1,415 67,011 67,356Standardised approachAustralian and foreign governments - - - - -Bank - - - - -Residential mortgage 4,636 132 - 4,768 4,861Corporate (1) 6,497 545 53,148 60,190 59,593Other 1,181 1 - 1,182 1,177Total standardised approach 12,314 678 53,148 66,140 65,631Total exposure (EaD) 623,333 138,224 166,187 927,744 924,477
(1) Total credit risk exposure, net of eligible financial collateral is $793,594 million. For materially impacted asset classes, exposure net of collateral is as follows: $mCorporate (including SME) 215,497Sovereign 68,252Bank 37,754Corporate (Standard) 9,530
Pillar 3 report
2016
16
Credit Risk
As at 31 Mar 16 6 monthsended
31 Mar 16On-balance
sheet exposureNon-marketrelated off-
balance sheet
Market relatedoff-balance
sheet
Totalexposure
Average totalexposure
Exposure type $m $m $m $m $mIRB approachCorporate (including SME (1) 136,232 63,060 62,239 261,531 261,435Sovereign (1) 58,261 525 12,565 71,351 71,414Bank (1) 22,821 3,640 49,229 75,690 78,373Residential mortgage 297,717 49,776 - 347,493 344,135Qualifying revolving retail 5,979 5,578 - 11,557 11,415Retail SME 12,398 3,840 - 16,238 16,233Other retail 3,289 1,233 - 4,522 4,477Total IRB approach 536,697 127,652 124,033 788,382 787,482Specialised lending (SL) 55,184 11,174 1,343 67,701 66,870Standardised approachAustralian and foreign governments - - - - 7,250Bank - - - - 579Residential mortgage 4,835 119 - 4,954 29,192Corporate (1) 5,686 536 52,774 58,996 69,979Other 1,172 1 - 1,173 2,586Total standardised approach 11,693 656 52,774 65,123 109,586Total exposures (EaD) 603,574 139,482 178,150 921,206 963,938
(1) Total credit risk exposure, net of eligible financial collateral is $774,186 million. For materially impacted asset classes, exposure net of collateral is as follows: $mCorporate (including SME) 212,209Sovereign 62,326Bank 37,754Corporate (Standard) 8,749
Pillar 3 report
2016
17
Credit Risk
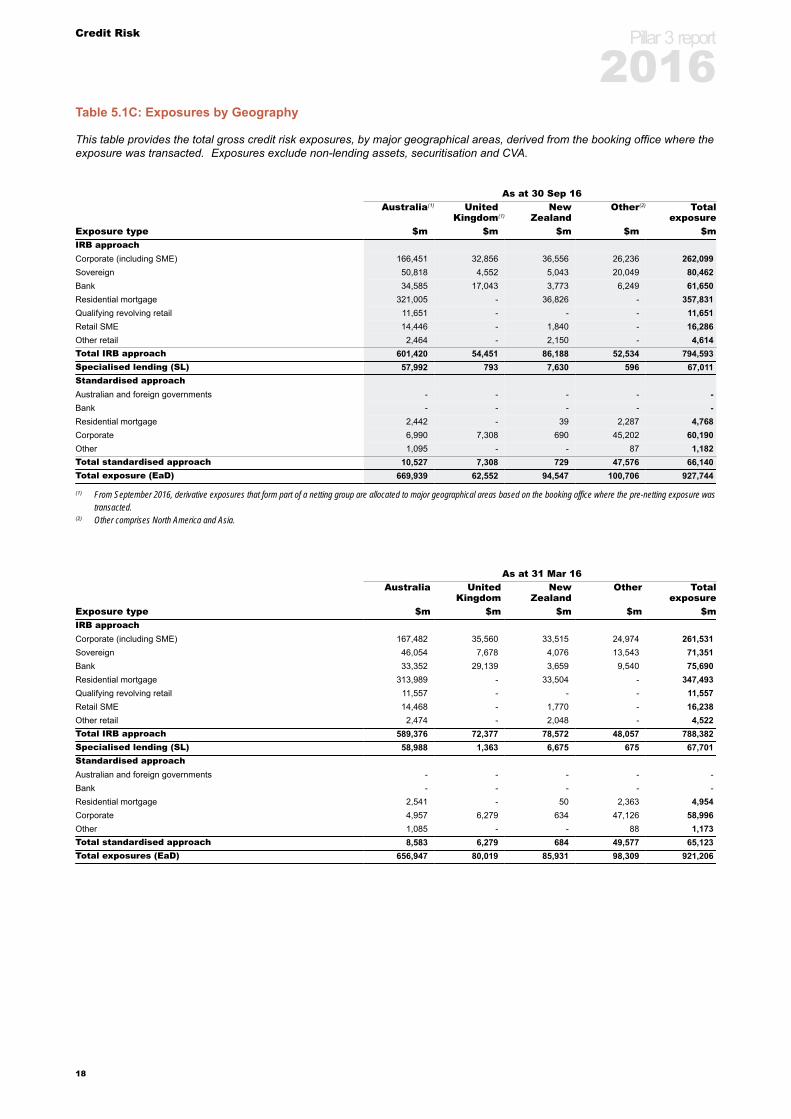
Table 5.1C: Exposures by Geography
This table provides the total gross credit risk exposures, by major geographical areas, derived from the booking office where theexposure was transacted. Exposures exclude non-lending assets, securitisation and CVA.
As at 30 Sep 16Australia(1) United
Kingdom(1)New
ZealandOther(2) Total
exposureExposure type $m $m $m $m $mIRB approachCorporate (including SME) 166,451 32,856 36,556 26,236 262,099Sovereign 50,818 4,552 5,043 20,049 80,462Bank 34,585 17,043 3,773 6,249 61,650Residential mortgage 321,005 - 36,826 - 357,831Qualifying revolving retail 11,651 - - - 11,651Retail SME 14,446 - 1,840 - 16,286Other retail 2,464 - 2,150 - 4,614Total IRB approach 601,420 54,451 86,188 52,534 794,593Specialised lending (SL) 57,992 793 7,630 596 67,011Standardised approachAustralian and foreign governments - - - - -Bank - - - - -Residential mortgage 2,442 - 39 2,287 4,768Corporate 6,990 7,308 690 45,202 60,190Other 1,095 - - 87 1,182Total standardised approach 10,527 7,308 729 47,576 66,140Total exposure (EaD) 669,939 62,552 94,547 100,706 927,744
(1) From September 2016, derivative exposures that form part of a netting group are allocated to major geographical areas based on the booking office where the pre-netting exposure wastransacted.
(2) Other comprises North America and Asia.
As at 31 Mar 16Australia United
KingdomNew
ZealandOther Total
exposureExposure type $m $m $m $m $mIRB approachCorporate (including SME) 167,482 35,560 33,515 24,974 261,531Sovereign 46,054 7,678 4,076 13,543 71,351Bank 33,352 29,139 3,659 9,540 75,690Residential mortgage 313,989 - 33,504 - 347,493Qualifying revolving retail 11,557 - - - 11,557Retail SME 14,468 - 1,770 - 16,238Other retail 2,474 - 2,048 - 4,522Total IRB approach 589,376 72,377 78,572 48,057 788,382Specialised lending (SL) 58,988 1,363 6,675 675 67,701Standardised approachAustralian and foreign governments - - - - -Bank - - - - -Residential mortgage 2,541 - 50 2,363 4,954Corporate 4,957 6,279 634 47,126 58,996Other 1,085 - - 88 1,173Total standardised approach 8,583 6,279 684 49,577 65,123Total exposures (EaD) 656,947 80,019 85,931 98,309 921,206
Pillar 3 report
2016
18
Credit Risk
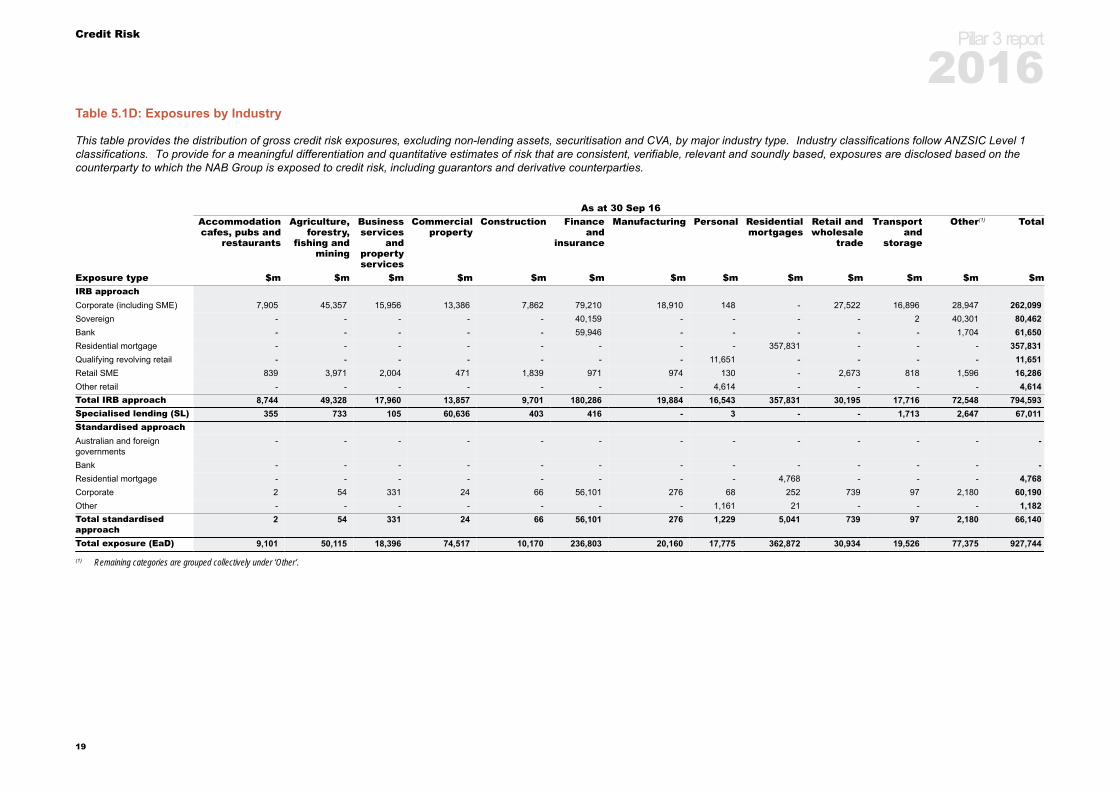
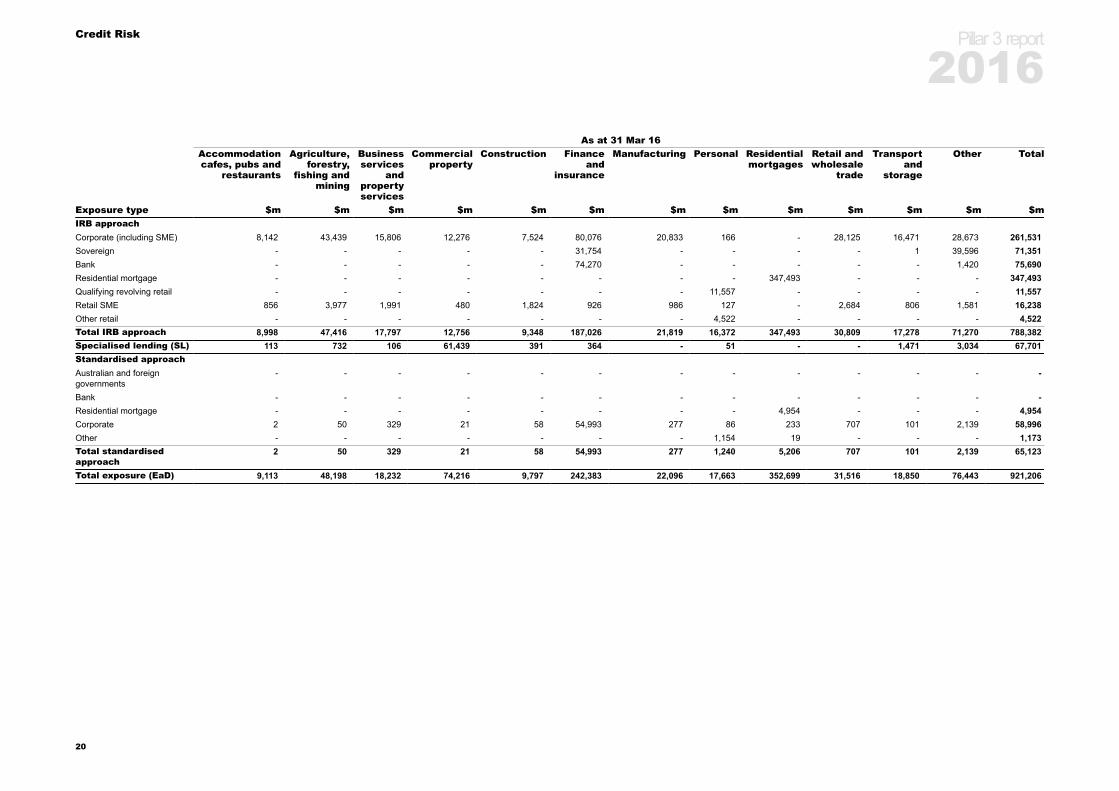
Table 5.1D: Exposures by Industry
This table provides the distribution of gross credit risk exposures, excluding non-lending assets, securitisation and CVA, by major industry type. Industry classifications follow ANZSIC Level 1classifications. To provide for a meaningful differentiation and quantitative estimates of risk that are consistent, verifiable, relevant and soundly based, exposures are disclosed based on thecounterparty to which the NAB Group is exposed to credit risk, including guarantors and derivative counterparties.
As at 30 Sep 16Accommodationcafes, pubs and
restaurants
Agriculture,forestry,
fishing andmining
Businessservices
andpropertyservices
Commercialproperty
Construction Financeand
insurance
Manufacturing Personal Residentialmortgages
Retail andwholesale
trade
Transportand
storage
Other(1) Total
Exposure type $m $m $m $m $m $m $m $m $m $m $m $m $mIRB approachCorporate (including SME) 7,905 45,357 15,956 13,386 7,862 79,210 18,910 148 - 27,522 16,896 28,947 262,099Sovereign - - - - - 40,159 - - - - 2 40,301 80,462Bank - - - - - 59,946 - - - - - 1,704 61,650Residential mortgage - - - - - - - - 357,831 - - - 357,831Qualifying revolving retail - - - - - - - 11,651 - - - - 11,651Retail SME 839 3,971 2,004 471 1,839 971 974 130 - 2,673 818 1,596 16,286Other retail - - - - - - - 4,614 - - - - 4,614Total IRB approach 8,744 49,328 17,960 13,857 9,701 180,286 19,884 16,543 357,831 30,195 17,716 72,548 794,593Specialised lending (SL) 355 733 105 60,636 403 416 - 3 - - 1,713 2,647 67,011Standardised approachAustralian and foreigngovernments
- - - - - - - - - - - - -
Bank - - - - - - - - - - - - -Residential mortgage - - - - - - - - 4,768 - - - 4,768Corporate 2 54 331 24 66 56,101 276 68 252 739 97 2,180 60,190Other - - - - - - - 1,161 21 - - - 1,182Total standardisedapproach
2 54 331 24 66 56,101 276 1,229 5,041 739 97 2,180 66,140
Total exposure (EaD) 9,101 50,115 18,396 74,517 10,170 236,803 20,160 17,775 362,872 30,934 19,526 77,375 927,744
(1) Remaining categories are grouped collectively under ‘Other’.
Pillar 3 report
2016
19
Credit Risk
As at 31 Mar 16Accommodationcafes, pubs and
restaurants
Agriculture,forestry,
fishing andmining
Businessservices
andpropertyservices
Commercialproperty
Construction Financeand
insurance
Manufacturing Personal Residentialmortgages
Retail andwholesale
trade
Transportand
storage
Other Total
Exposure type $m $m $m $m $m $m $m $m $m $m $m $m $mIRB approachCorporate (including SME) 8,142 43,439 15,806 12,276 7,524 80,076 20,833 166 - 28,125 16,471 28,673 261,531Sovereign - - - - - 31,754 - - - - 1 39,596 71,351Bank - - - - - 74,270 - - - - - 1,420 75,690Residential mortgage - - - - - - - - 347,493 - - - 347,493Qualifying revolving retail - - - - - - - 11,557 - - - - 11,557Retail SME 856 3,977 1,991 480 1,824 926 986 127 - 2,684 806 1,581 16,238Other retail - - - - - - - 4,522 - - - - 4,522Total IRB approach 8,998 47,416 17,797 12,756 9,348 187,026 21,819 16,372 347,493 30,809 17,278 71,270 788,382Specialised lending (SL) 113 732 106 61,439 391 364 - 51 - - 1,471 3,034 67,701Standardised approachAustralian and foreigngovernments
- - - - - - - - - - - - -
Bank - - - - - - - - - - - - -Residential mortgage - - - - - - - - 4,954 - - - 4,954Corporate 2 50 329 21 58 54,993 277 86 233 707 101 2,139 58,996Other - - - - - - - 1,154 19 - - - 1,173Total standardisedapproach
2 50 329 21 58 54,993 277 1,240 5,206 707 101 2,139 65,123
Total exposure (EaD) 9,113 48,198 18,232 74,216 9,797 242,383 22,096 17,663 352,699 31,516 18,850 76,443 921,206
Pillar 3 report
2016
20
Credit Risk
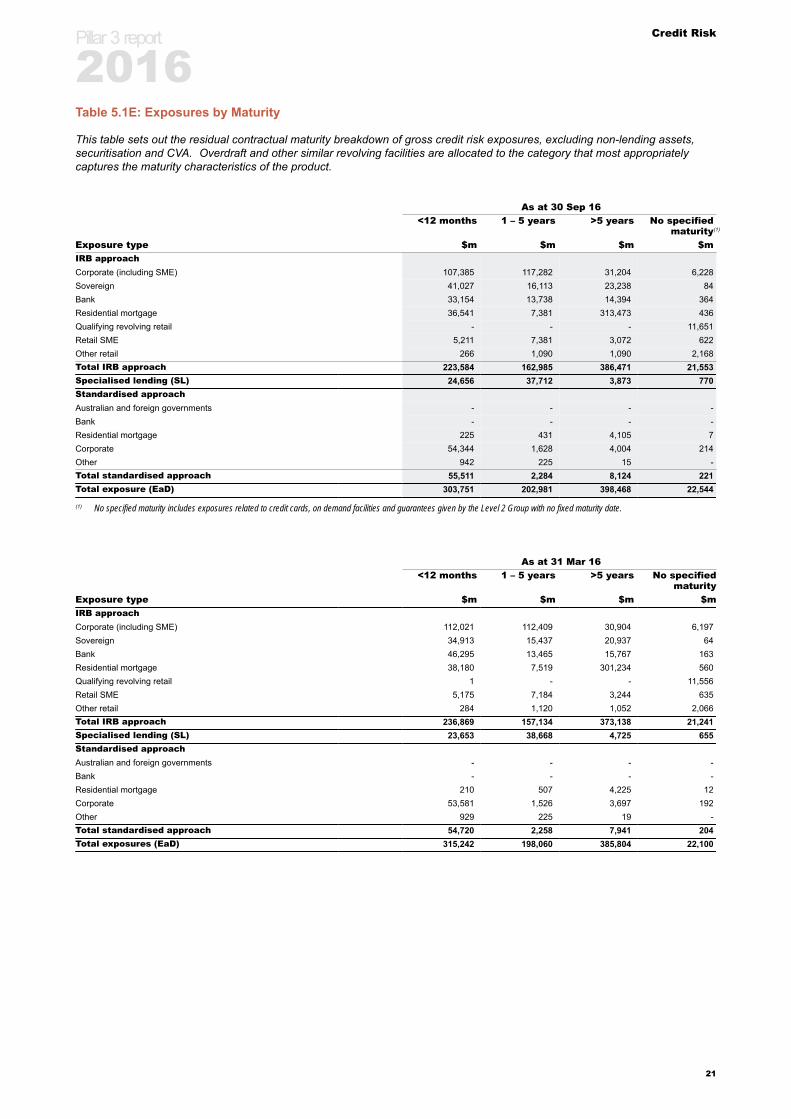
Table 5.1E: Exposures by Maturity
This table sets out the residual contractual maturity breakdown of gross credit risk exposures, excluding non-lending assets,securitisation and CVA. Overdraft and other similar revolving facilities are allocated to the category that most appropriatelycaptures the maturity characteristics of the product.
As at 30 Sep 16<12 months 1 – 5 years >5 years No specified
maturity(1)
Exposure type $m $m $m $mIRB approachCorporate (including SME) 107,385 117,282 31,204 6,228Sovereign 41,027 16,113 23,238 84Bank 33,154 13,738 14,394 364Residential mortgage 36,541 7,381 313,473 436Qualifying revolving retail - - - 11,651Retail SME 5,211 7,381 3,072 622Other retail 266 1,090 1,090 2,168Total IRB approach 223,584 162,985 386,471 21,553Specialised lending (SL) 24,656 37,712 3,873 770Standardised approachAustralian and foreign governments - - - -Bank - - - -Residential mortgage 225 431 4,105 7Corporate 54,344 1,628 4,004 214Other 942 225 15 -Total standardised approach 55,511 2,284 8,124 221Total exposure (EaD) 303,751 202,981 398,468 22,544
(1) No specified maturity includes exposures related to credit cards, on demand facilities and guarantees given by the Level 2 Group with no fixed maturity date.
As at 31 Mar 16<12 months 1 – 5 years >5 years No specified
maturityExposure type $m $m $m $mIRB approachCorporate (including SME) 112,021 112,409 30,904 6,197Sovereign 34,913 15,437 20,937 64Bank 46,295 13,465 15,767 163Residential mortgage 38,180 7,519 301,234 560Qualifying revolving retail 1 - - 11,556Retail SME 5,175 7,184 3,244 635Other retail 284 1,120 1,052 2,066Total IRB approach 236,869 157,134 373,138 21,241Specialised lending (SL) 23,653 38,668 4,725 655Standardised approachAustralian and foreign governments - - - -Bank - - - -Residential mortgage 210 507 4,225 12Corporate 53,581 1,526 3,697 192Other 929 225 19 -Total standardised approach 54,720 2,258 7,941 204Total exposures (EaD) 315,242 198,060 385,804 22,100
Pillar 3 report
2016
21
Credit Risk
Credit Provisions and Losses
Table 5.1F: Provisions by Asset Class
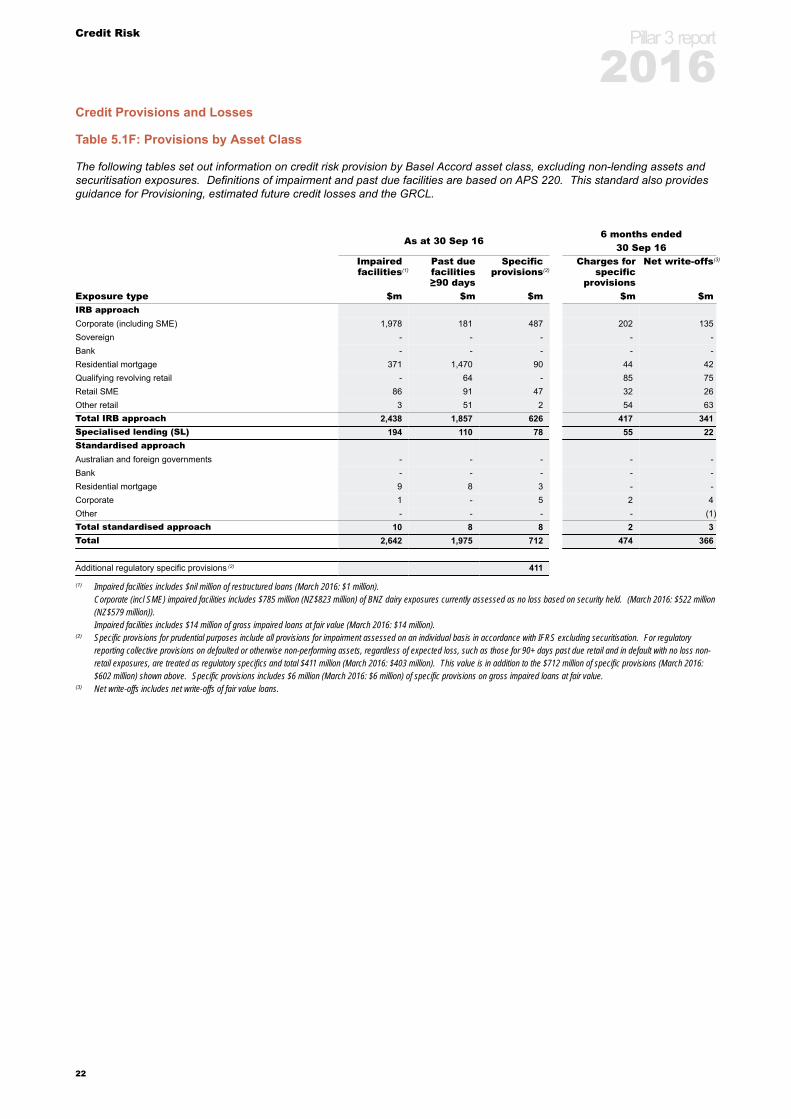
The following tables set out information on credit risk provision by Basel Accord asset class, excluding non-lending assets andsecuritisation exposures. Definitions of impairment and past due facilities are based on APS 220. This standard also providesguidance for Provisioning, estimated future credit losses and the GRCL.
As at 30 Sep 166 months ended
30 Sep 16Impairedfacilities(1)
Past duefacilities≥90 days
Specificprovisions(2)
Charges forspecific
provisions
Net write-offs(3)
Exposure type $m $m $m $m $mIRB approachCorporate (including SME) 1,978 181 487 202 135Sovereign - - - - -Bank - - - - -Residential mortgage 371 1,470 90 44 42Qualifying revolving retail - 64 - 85 75Retail SME 86 91 47 32 26Other retail 3 51 2 54 63Total IRB approach 2,438 1,857 626 417 341Specialised lending (SL) 194 110 78 55 22Standardised approachAustralian and foreign governments - - - - -Bank - - - - -Residential mortgage 9 8 3 - -Corporate 1 - 5 2 4Other - - - - (1)Total standardised approach 10 8 8 2 3Total 2,642 1,975 712 474 366
Additional regulatory specific provisions (2) 411
(1) Impaired facilities includes $nil million of restructured loans (March 2016: $1 million).Corporate (incl SME) impaired facilities includes $785 million (NZ$823 million) of BNZ dairy exposures currently assessed as no loss based on security held. (March 2016: $522 million(NZ$579 million)).Impaired facilities includes $14 million of gross impaired loans at fair value (March 2016: $14 million).
(2) Specific provisions for prudential purposes include all provisions for impairment assessed on an individual basis in accordance with IFRS excluding securitisation. For regulatoryreporting collective provisions on defaulted or otherwise non-performing assets, regardless of expected loss, such as those for 90+ days past due retail and in default with no loss non-retail exposures, are treated as regulatory specifics and total $411 million (March 2016: $403 million). This value is in addition to the $712 million of specific provisions (March 2016:$602 million) shown above. Specific provisions includes $6 million (March 2016: $6 million) of specific provisions on gross impaired loans at fair value.
(3) Net write-offs includes net write-offs of fair value loans.
Pillar 3 report
2016
22
Credit Risk
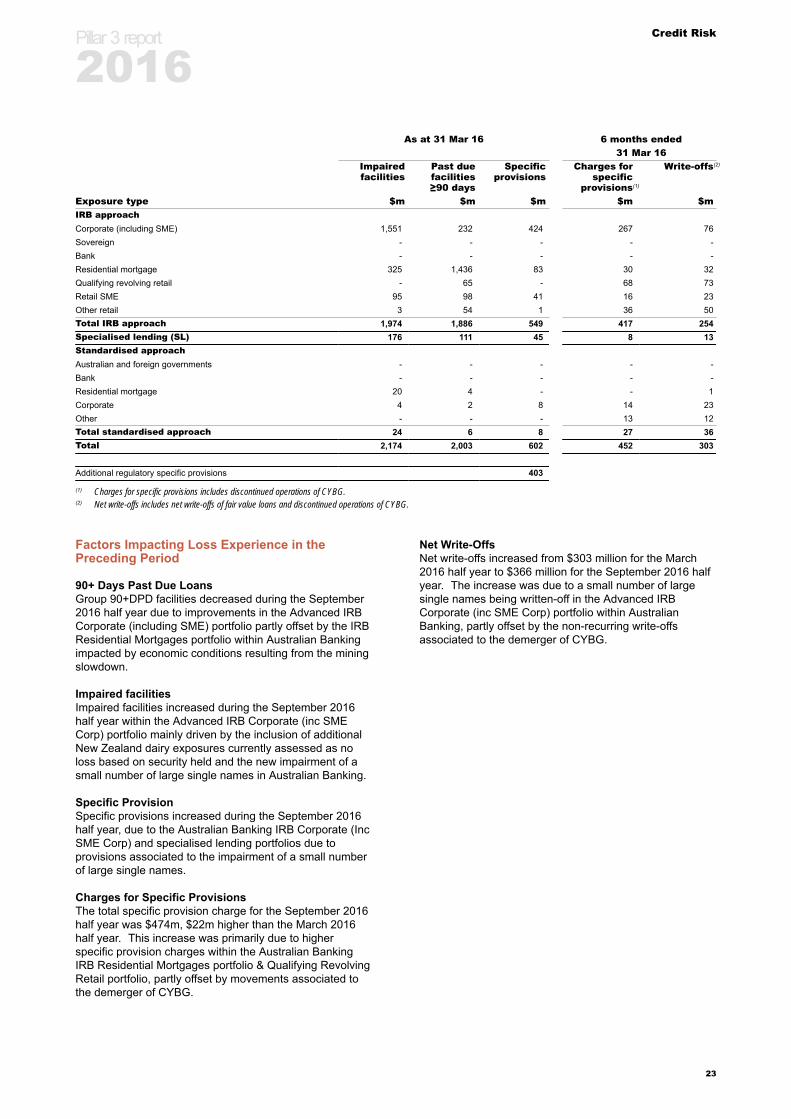
As at 31 Mar 16 6 months ended31 Mar 16
Impairedfacilities
Past duefacilities≥90 days
Specificprovisions
Charges forspecific
provisions(1)
Write-offs(2)
Exposure type $m $m $m $m $mIRB approachCorporate (including SME) 1,551 232 424 267 76Sovereign - - - - -Bank - - - - -Residential mortgage 325 1,436 83 30 32Qualifying revolving retail - 65 - 68 73Retail SME 95 98 41 16 23Other retail 3 54 1 36 50Total IRB approach 1,974 1,886 549 417 254Specialised lending (SL) 176 111 45 8 13Standardised approachAustralian and foreign governments - - - - -Bank - - - - -Residential mortgage 20 4 - - 1Corporate 4 2 8 14 23Other - - - 13 12Total standardised approach 24 6 8 27 36Total 2,174 2,003 602 452 303
Additional regulatory specific provisions 403
(1) Charges for specific provisions includes discontinued operations of CYBG.(2) Net write-offs includes net write-offs of fair value loans and discontinued operations of CYBG.
Factors Impacting Loss Experience in thePreceding Period
90+ Days Past Due LoansGroup 90+DPD facilities decreased during the September2016 half year due to improvements in the Advanced IRBCorporate (including SME) portfolio partly offset by the IRBResidential Mortgages portfolio within Australian Bankingimpacted by economic conditions resulting from the miningslowdown.
Impaired facilitiesImpaired facilities increased during the September 2016half year within the Advanced IRB Corporate (inc SMECorp) portfolio mainly driven by the inclusion of additionalNew Zealand dairy exposures currently assessed as noloss based on security held and the new impairment of asmall number of large single names in Australian Banking.
Specific ProvisionSpecific provisions increased during the September 2016half year, due to the Australian Banking IRB Corporate (IncSME Corp) and specialised lending portfolios due toprovisions associated to the impairment of a small numberof large single names.
Charges for Specific ProvisionsThe total specific provision charge for the September 2016half year was $474m, $22m higher than the March 2016half year. This increase was primarily due to higherspecific provision charges within the Australian BankingIRB Residential Mortgages portfolio & Qualifying RevolvingRetail portfolio, partly offset by movements associated tothe demerger of CYBG.
Net Write-OffsNet write-offs increased from $303 million for the March2016 half year to $366 million for the September 2016 halfyear. The increase was due to a small number of largesingle names being written-off in the Advanced IRBCorporate (inc SME Corp) portfolio within AustralianBanking, partly offset by the non-recurring write-offsassociated to the demerger of CYBG.
Pillar 3 report
2016
23
Credit Risk
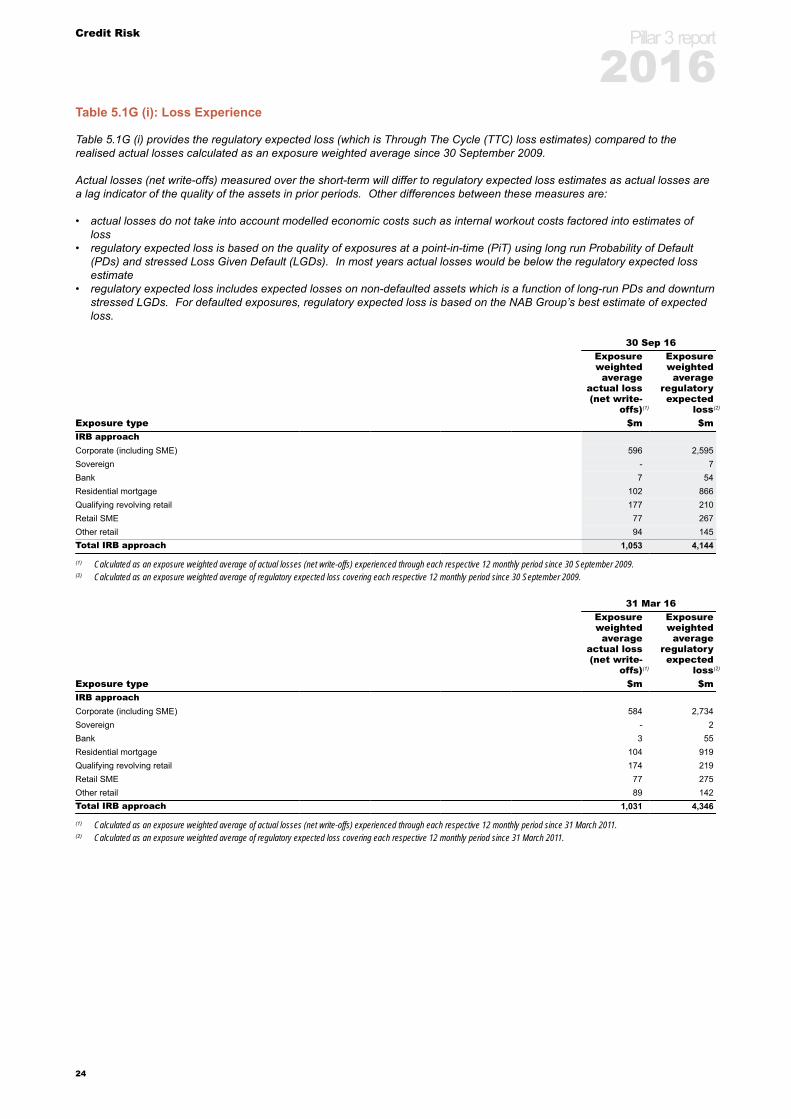
Table 5.1G (i): Loss Experience
Table 5.1G (i) provides the regulatory expected loss (which is Through The Cycle (TTC) loss estimates) compared to therealised actual losses calculated as an exposure weighted average since 30 September 2009.
Actual losses (net write-offs) measured over the short-term will differ to regulatory expected loss estimates as actual losses area lag indicator of the quality of the assets in prior periods. Other differences between these measures are:
• actual losses do not take into account modelled economic costs such as internal workout costs factored into estimates ofloss
• regulatory expected loss is based on the quality of exposures at a point-in-time (PiT) using long run Probability of Default(PDs) and stressed Loss Given Default (LGDs). In most years actual losses would be below the regulatory expected lossestimate
• regulatory expected loss includes expected losses on non-defaulted assets which is a function of long-run PDs and downturnstressed LGDs. For defaulted exposures, regulatory expected loss is based on the NAB Group’s best estimate of expectedloss.
30 Sep 16Exposureweightedaverage
actual loss(net write-
offs)(1)
Exposureweightedaverage
regulatoryexpected
loss(2)
Exposure type $m $mIRB approachCorporate (including SME) 596 2,595Sovereign - 7Bank 7 54Residential mortgage 102 866Qualifying revolving retail 177 210Retail SME 77 267Other retail 94 145Total IRB approach 1,053 4,144
(1) Calculated as an exposure weighted average of actual losses (net write-offs) experienced through each respective 12 monthly period since 30 September 2009.(2) Calculated as an exposure weighted average of regulatory expected loss covering each respective 12 monthly period since 30 September 2009.
31 Mar 16Exposureweightedaverage
actual loss(net write-
offs)(1)
Exposureweightedaverage
regulatoryexpected
loss(2)
Exposure type $m $mIRB approachCorporate (including SME) 584 2,734Sovereign - 2Bank 3 55Residential mortgage 104 919Qualifying revolving retail 174 219Retail SME 77 275Other retail 89 142Total IRB approach 1,031 4,346
(1) Calculated as an exposure weighted average of actual losses (net write-offs) experienced through each respective 12 monthly period since 31 March 2011.(2) Calculated as an exposure weighted average of regulatory expected loss covering each respective 12 monthly period since 31 March 2011.
Pillar 3 report
2016
24
Credit Risk
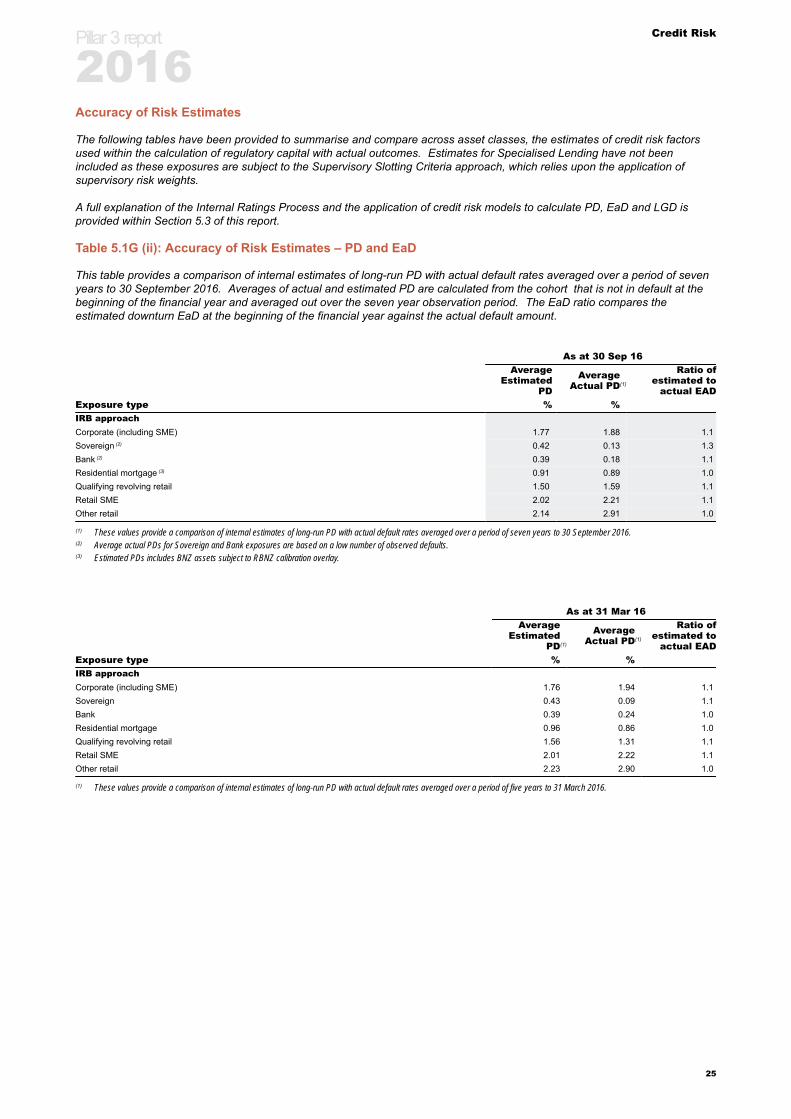
Accuracy of Risk Estimates
The following tables have been provided to summarise and compare across asset classes, the estimates of credit risk factorsused within the calculation of regulatory capital with actual outcomes. Estimates for Specialised Lending have not beenincluded as these exposures are subject to the Supervisory Slotting Criteria approach, which relies upon the application ofsupervisory risk weights.
A full explanation of the Internal Ratings Process and the application of credit risk models to calculate PD, EaD and LGD isprovided within Section 5.3 of this report.
Table 5.1G (ii): Accuracy of Risk Estimates – PD and EaD
This table provides a comparison of internal estimates of long-run PD with actual default rates averaged over a period of sevenyears to 30 September 2016. Averages of actual and estimated PD are calculated from the cohort that is not in default at thebeginning of the financial year and averaged out over the seven year observation period. The EaD ratio compares theestimated downturn EaD at the beginning of the financial year against the actual default amount.
As at 30 Sep 16Average
EstimatedPD
AverageActual PD(1)
Ratio ofestimated to
actual EADExposure type % %IRB approachCorporate (including SME) 1.77 1.88 1.1Sovereign (2) 0.42 0.13 1.3Bank (2) 0.39 0.18 1.1Residential mortgage (3) 0.91 0.89 1.0Qualifying revolving retail 1.50 1.59 1.1Retail SME 2.02 2.21 1.1Other retail 2.14 2.91 1.0
(1) These values provide a comparison of internal estimates of long-run PD with actual default rates averaged over a period of seven years to 30 September 2016.(2) Average actual PDs for Sovereign and Bank exposures are based on a low number of observed defaults.(3) Estimated PDs includes BNZ assets subject to RBNZ calibration overlay.
As at 31 Mar 16Average
EstimatedPD(1)
AverageActual PD(1)
Ratio ofestimated to
actual EADExposure type % %IRB approachCorporate (including SME) 1.76 1.94 1.1Sovereign 0.43 0.09 1.1Bank 0.39 0.24 1.0Residential mortgage 0.96 0.86 1.0Qualifying revolving retail 1.56 1.31 1.1Retail SME 2.01 2.22 1.1Other retail 2.23 2.90 1.0
(1) These values provide a comparison of internal estimates of long-run PD with actual default rates averaged over a period of five years to 31 March 2016.
Pillar 3 report
2016
25
Credit Risk
Table 5.1G (iii): Accuracy of Risk Estimates – LGD
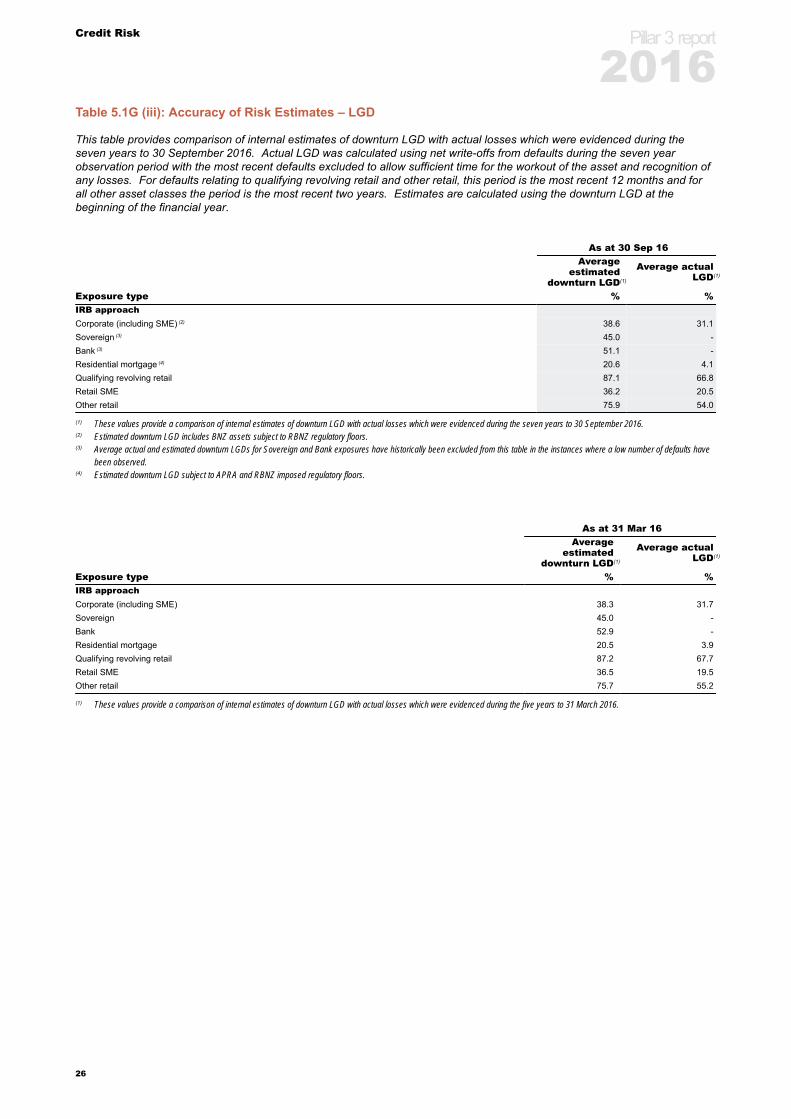
This table provides comparison of internal estimates of downturn LGD with actual losses which were evidenced during theseven years to 30 September 2016. Actual LGD was calculated using net write-offs from defaults during the seven yearobservation period with the most recent defaults excluded to allow sufficient time for the workout of the asset and recognition ofany losses. For defaults relating to qualifying revolving retail and other retail, this period is the most recent 12 months and forall other asset classes the period is the most recent two years. Estimates are calculated using the downturn LGD at thebeginning of the financial year.
As at 30 Sep 16Average
estimateddownturn LGD(1)
Average actualLGD(1)
Exposure type % %IRB approachCorporate (including SME) (2) 38.6 31.1Sovereign (3) 45.0 -Bank (3) 51.1 -Residential mortgage (4) 20.6 4.1Qualifying revolving retail 87.1 66.8Retail SME 36.2 20.5Other retail 75.9 54.0
(1) These values provide a comparison of internal estimates of downturn LGD with actual losses which were evidenced during the seven years to 30 September 2016.(2) Estimated downturn LGD includes BNZ assets subject to RBNZ regulatory floors.(3) Average actual and estimated downturn LGDs for Sovereign and Bank exposures have historically been excluded from this table in the instances where a low number of defaults have
been observed.(4) Estimated downturn LGD subject to APRA and RBNZ imposed regulatory floors.
As at 31 Mar 16Average
estimateddownturn LGD(1)
Average actualLGD(1)
Exposure type % %IRB approachCorporate (including SME) 38.3 31.7Sovereign 45.0 -Bank 52.9 -Residential mortgage 20.5 3.9Qualifying revolving retail 87.2 67.7Retail SME 36.5 19.5Other retail 75.7 55.2
(1) These values provide a comparison of internal estimates of downturn LGD with actual losses which were evidenced during the five years to 31 March 2016.
Pillar 3 report
2016
26
Credit Risk
Table 5.1H: Provisions by Industry
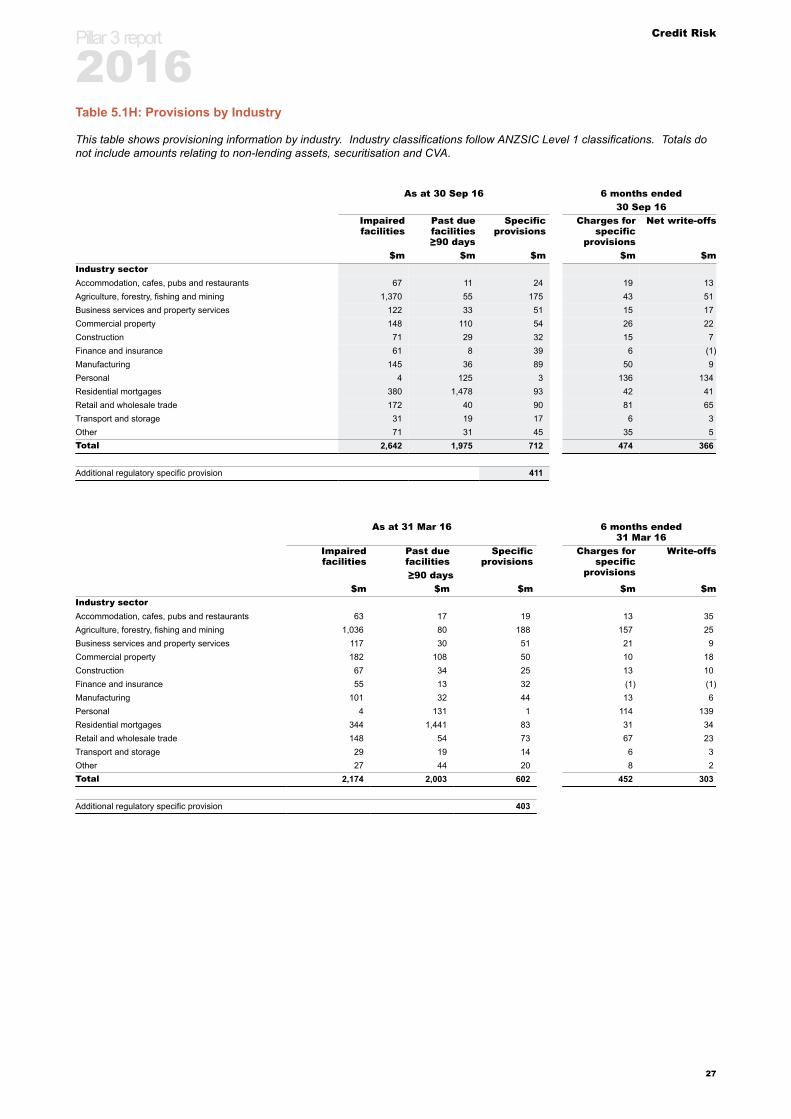
This table shows provisioning information by industry. Industry classifications follow ANZSIC Level 1 classifications. Totals donot include amounts relating to non-lending assets, securitisation and CVA.
As at 30 Sep 16 6 months ended30 Sep 16
Impairedfacilities
Past duefacilities≥90 days
Specificprovisions
Charges forspecific
provisions
Net write-offs
$m $m $m $m $mIndustry sectorAccommodation, cafes, pubs and restaurants 67 11 24 19 13Agriculture, forestry, fishing and mining 1,370 55 175 43 51Business services and property services 122 33 51 15 17Commercial property 148 110 54 26 22Construction 71 29 32 15 7Finance and insurance 61 8 39 6 (1)Manufacturing 145 36 89 50 9Personal 4 125 3 136 134Residential mortgages 380 1,478 93 42 41Retail and wholesale trade 172 40 90 81 65Transport and storage 31 19 17 6 3Other 71 31 45 35 5Total 2,642 1,975 712 474 366
Additional regulatory specific provision 411
As at 31 Mar 16 6 months ended31 Mar 16
Impairedfacilities
Past duefacilities
Specificprovisions
Charges forspecific
provisions
Write-offs
≥90 days$m $m $m $m $m
Industry sectorAccommodation, cafes, pubs and restaurants 63 17 19 13 35Agriculture, forestry, fishing and mining 1,036 80 188 157 25Business services and property services 117 30 51 21 9Commercial property 182 108 50 10 18Construction 67 34 25 13 10Finance and insurance 55 13 32 (1) (1)Manufacturing 101 32 44 13 6Personal 4 131 1 114 139Residential mortgages 344 1,441 83 31 34Retail and wholesale trade 148 54 73 67 23Transport and storage 29 19 14 6 3Other 27 44 20 8 2Total 2,174 2,003 602 452 303
Additional regulatory specific provision 403
Pillar 3 report
2016
27
Credit Risk
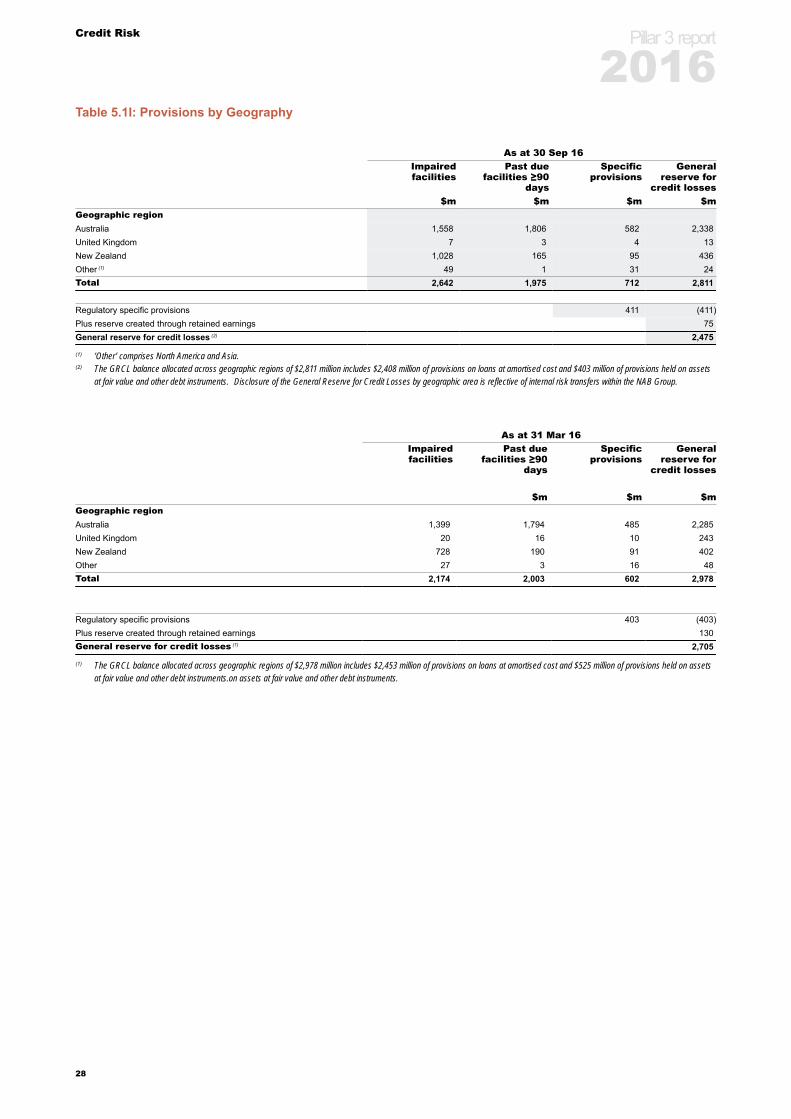
Table 5.1I: Provisions by Geography
As at 30 Sep 16Impairedfacilities
Past duefacilities ≥90
days
Specificprovisions
Generalreserve for
credit losses$m $m $m $m
Geographic regionAustralia 1,558 1,806 582 2,338United Kingdom 7 3 4 13New Zealand 1,028 165 95 436Other (1) 49 1 31 24Total 2,642 1,975 712 2,811
Regulatory specific provisions 411 (411)Plus reserve created through retained earnings 75General reserve for credit losses (2) 2,475
(1) ‘Other’ comprises North America and Asia.(2) The GRCL balance allocated across geographic regions of $2,811 million includes $2,408 million of provisions on loans at amortised cost and $403 million of provisions held on assets
at fair value and other debt instruments. Disclosure of the General Reserve for Credit Losses by geographic area is reflective of internal risk transfers within the NAB Group.
As at 31 Mar 16Impairedfacilities
Past duefacilities ≥90
days
Specificprovisions
Generalreserve for
credit losses
$m $m $mGeographic regionAustralia 1,399 1,794 485 2,285United Kingdom 20 16 10 243New Zealand 728 190 91 402Other 27 3 16 48Total 2,174 2,003 602 2,978
Regulatory specific provisions 403 (403)Plus reserve created through retained earnings 130General reserve for credit losses (1) 2,705
(1) The GRCL balance allocated across geographic regions of $2,978 million includes $2,453 million of provisions on loans at amortised cost and $525 million of provisions held on assetsat fair value and other debt instruments.on assets at fair value and other debt instruments.
Pillar 3 report
2016
28
Credit Risk
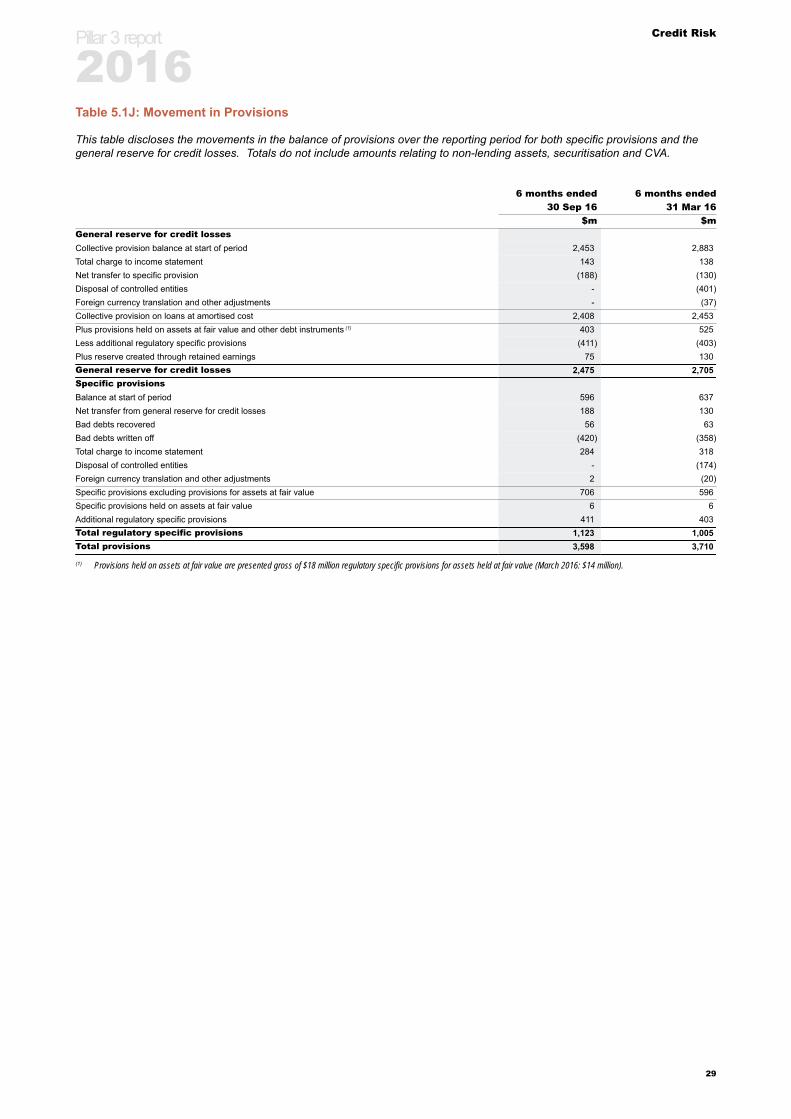
Table 5.1J: Movement in Provisions
This table discloses the movements in the balance of provisions over the reporting period for both specific provisions and thegeneral reserve for credit losses. Totals do not include amounts relating to non-lending assets, securitisation and CVA.
6 months ended 6 months ended30 Sep 16 31 Mar 16
$m $mGeneral reserve for credit lossesCollective provision balance at start of period 2,453 2,883Total charge to income statement 143 138Net transfer to specific provision (188) (130)Disposal of controlled entities - (401)Foreign currency translation and other adjustments - (37)Collective provision on loans at amortised cost 2,408 2,453Plus provisions held on assets at fair value and other debt instruments (1) 403 525Less additional regulatory specific provisions (411) (403)Plus reserve created through retained earnings 75 130General reserve for credit losses 2,475 2,705Specific provisionsBalance at start of period 596 637Net transfer from general reserve for credit losses 188 130Bad debts recovered 56 63Bad debts written off (420) (358)Total charge to income statement 284 318Disposal of controlled entities - (174)Foreign currency translation and other adjustments 2 (20)Specific provisions excluding provisions for assets at fair value 706 596Specific provisions held on assets at fair value 6 6Additional regulatory specific provisions 411 403Total regulatory specific provisions 1,123 1,005Total provisions 3,598 3,710
(1) Provisions held on assets at fair value are presented gross of $18 million regulatory specific provisions for assets held at fair value (March 2016: $14 million).
Pillar 3 report
2016
29
Credit Risk
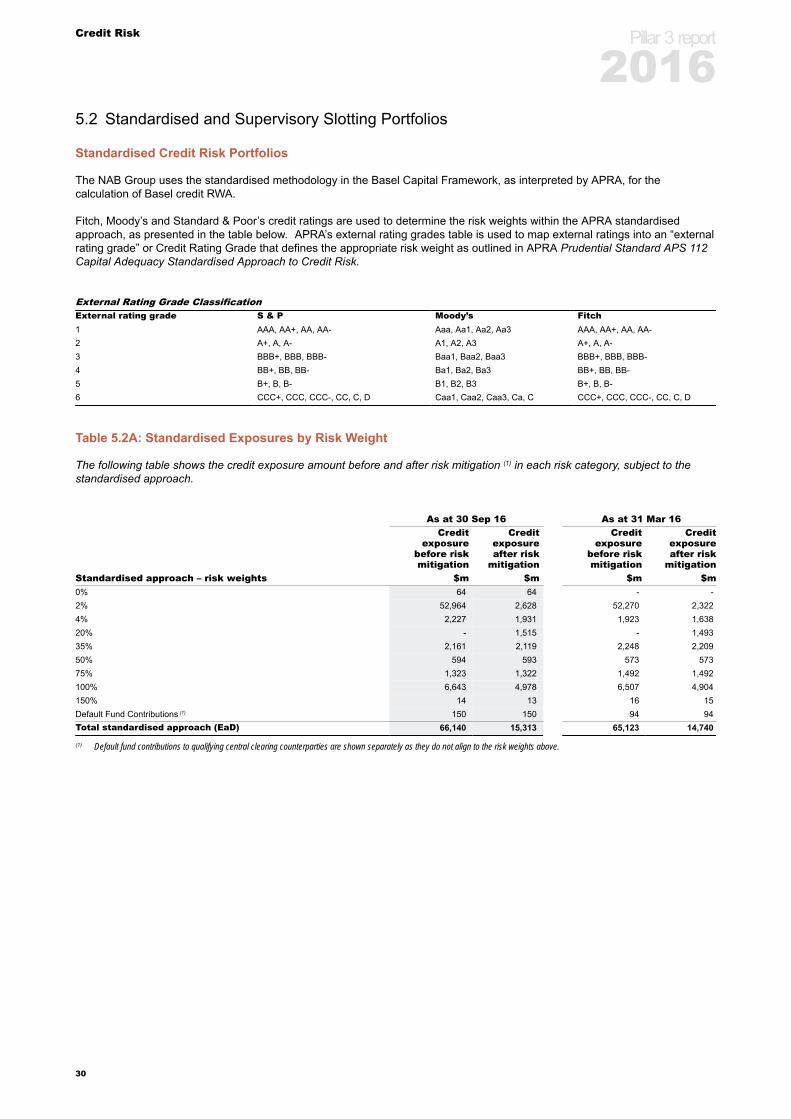
5.2 Standardised and Supervisory Slotting Portfolios
Standardised Credit Risk Portfolios
The NAB Group uses the standardised methodology in the Basel Capital Framework, as interpreted by APRA, for thecalculation of Basel credit RWA.
Fitch, Moody’s and Standard & Poor’s credit ratings are used to determine the risk weights within the APRA standardisedapproach, as presented in the table below. APRA’s external rating grades table is used to map external ratings into an “externalrating grade” or Credit Rating Grade that defines the appropriate risk weight as outlined in APRA Prudential Standard APS 112Capital Adequacy Standardised Approach to Credit Risk.
External Rating Grade ClassificationExternal rating grade S & P Moody’s Fitch1 AAA, AA+, AA, AA- Aaa, Aa1, Aa2, Aa3 AAA, AA+, AA, AA-2 A+, A, A- A1, A2, A3 A+, A, A-3 BBB+, BBB, BBB- Baa1, Baa2, Baa3 BBB+, BBB, BBB-4 BB+, BB, BB- Ba1, Ba2, Ba3 BB+, BB, BB-5 B+, B, B- B1, B2, B3 B+, B, B-6 CCC+, CCC, CCC-, CC, C, D Caa1, Caa2, Caa3, Ca, C CCC+, CCC, CCC-, CC, C, D
Table 5.2A: Standardised Exposures by Risk Weight
The following table shows the credit exposure amount before and after risk mitigation (1) in each risk category, subject to thestandardised approach.
As at 30 Sep 16 As at 31 Mar 16Credit
exposurebefore riskmitigation
Creditexposureafter risk
mitigation
Creditexposure
before riskmitigation
Creditexposureafter risk
mitigationStandardised approach – risk weights $m $m $m $m0% 64 64 - -2% 52,964 2,628 52,270 2,3224% 2,227 1,931 1,923 1,63820% - 1,515 - 1,49335% 2,161 2,119 2,248 2,20950% 594 593 573 57375% 1,323 1,322 1,492 1,492100% 6,643 4,978 6,507 4,904150% 14 13 16 15Default Fund Contributions (1) 150 150 94 94Total standardised approach (EaD) 66,140 15,313 65,123 14,740
(1) Default fund contributions to qualifying central clearing counterparties are shown separately as they do not align to the risk weights above.
Pillar 3 report
2016
30
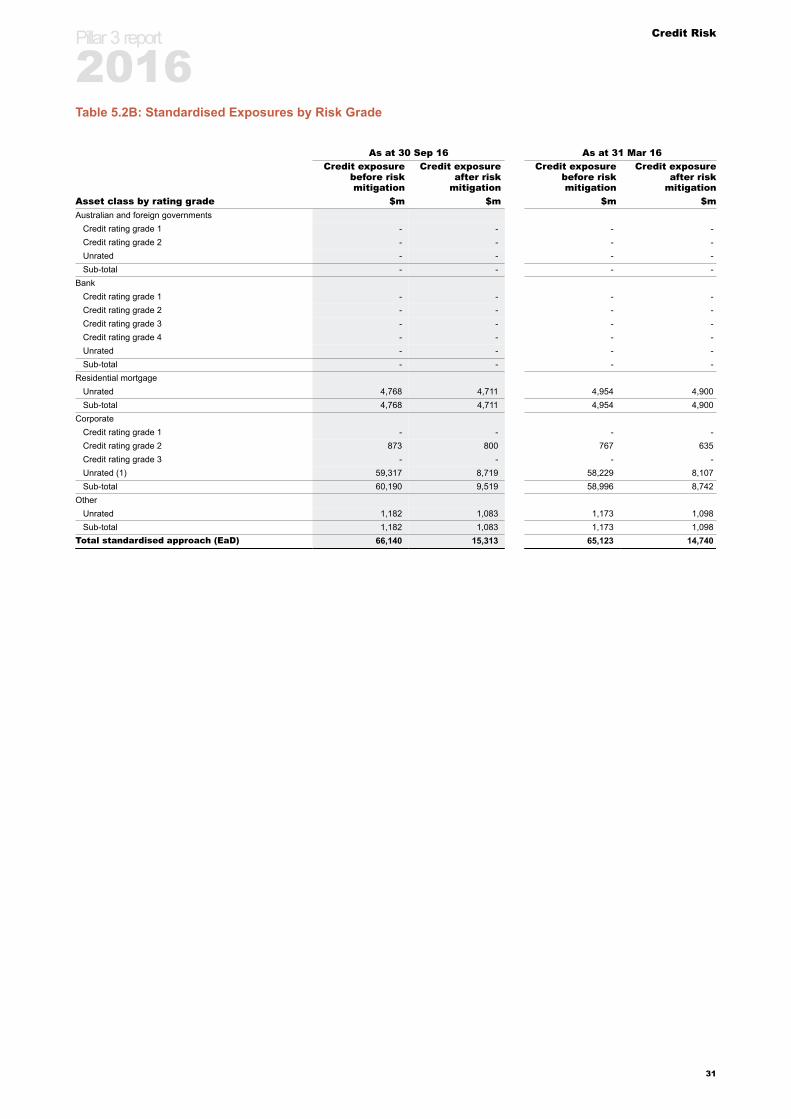
Credit Risk
Table 5.2B: Standardised Exposures by Risk Grade
As at 30 Sep 16 As at 31 Mar 16Credit exposure
before riskmitigation
Credit exposureafter risk
mitigation
Credit exposurebefore riskmitigation
Credit exposureafter risk
mitigationAsset class by rating grade $m $m $m $mAustralian and foreign governments
Credit rating grade 1 - - - -Credit rating grade 2 - - - -Unrated - - - -Sub-total - - - -
BankCredit rating grade 1 - - - -Credit rating grade 2 - - - -Credit rating grade 3 - - - -Credit rating grade 4 - - - -Unrated - - - -Sub-total - - - -
Residential mortgageUnrated 4,768 4,711 4,954 4,900Sub-total 4,768 4,711 4,954 4,900
CorporateCredit rating grade 1 - - - -Credit rating grade 2 873 800 767 635Credit rating grade 3 - - - -Unrated (1) 59,317 8,719 58,229 8,107Sub-total 60,190 9,519 58,996 8,742
OtherUnrated 1,182 1,083 1,173 1,098Sub-total 1,182 1,083 1,173 1,098
Total standardised approach (EaD) 66,140 15,313 65,123 14,740
Pillar 3 report
2016
31
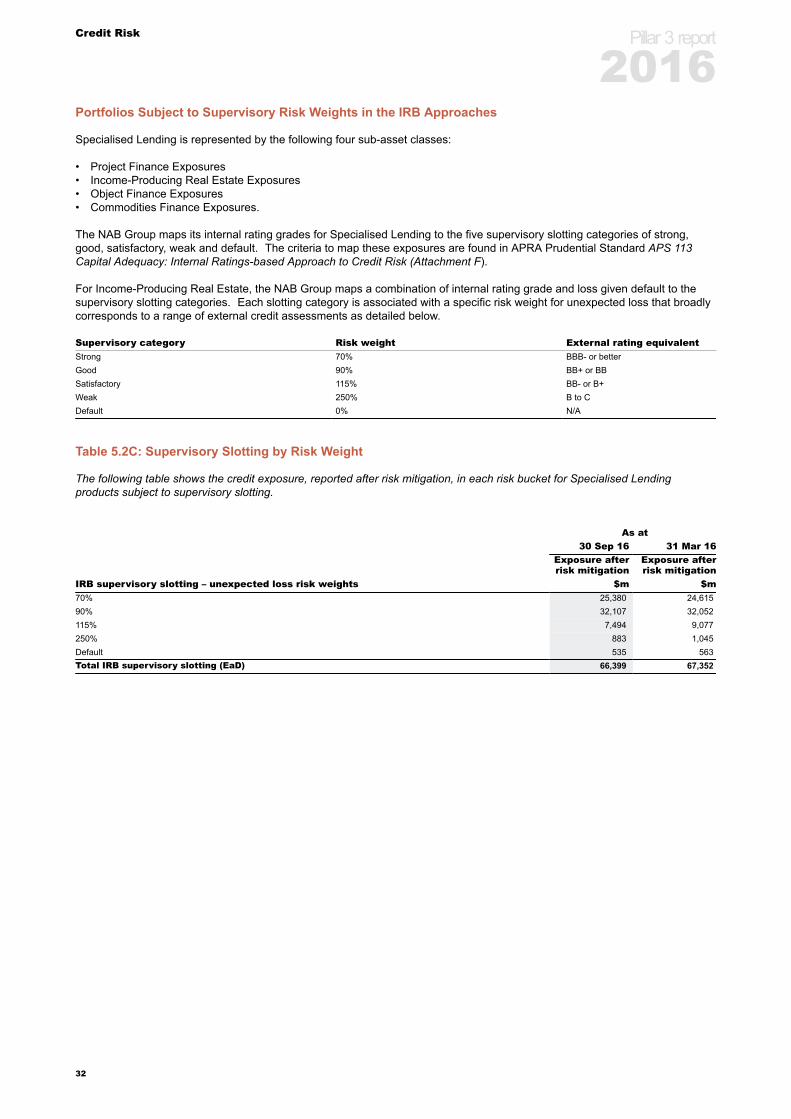
Credit Risk
Portfolios Subject to Supervisory Risk Weights in the IRB Approaches
Specialised Lending is represented by the following four sub-asset classes:
• Project Finance Exposures• Income-Producing Real Estate Exposures• Object Finance Exposures• Commodities Finance Exposures.
The NAB Group maps its internal rating grades for Specialised Lending to the five supervisory slotting categories of strong,good, satisfactory, weak and default. The criteria to map these exposures are found in APRA Prudential Standard APS 113Capital Adequacy: Internal Ratings-based Approach to Credit Risk (Attachment F).
For Income-Producing Real Estate, the NAB Group maps a combination of internal rating grade and loss given default to thesupervisory slotting categories. Each slotting category is associated with a specific risk weight for unexpected loss that broadlycorresponds to a range of external credit assessments as detailed below.
Supervisory category Risk weight External rating equivalentStrong 70% BBB- or betterGood 90% BB+ or BBSatisfactory 115% BB- or B+Weak 250% B to CDefault 0% N/A
Table 5.2C: Supervisory Slotting by Risk Weight
The following table shows the credit exposure, reported after risk mitigation, in each risk bucket for Specialised Lendingproducts subject to supervisory slotting.
As at30 Sep 16 31 Mar 16
Exposure afterrisk mitigation
Exposure afterrisk mitigation
IRB supervisory slotting – unexpected loss risk weights $m $m70% 25,380 24,61590% 32,107 32,052115% 7,494 9,077250% 883 1,045Default 535 563Total IRB supervisory slotting (EaD) 66,399 67,352
Pillar 3 report
2016
32
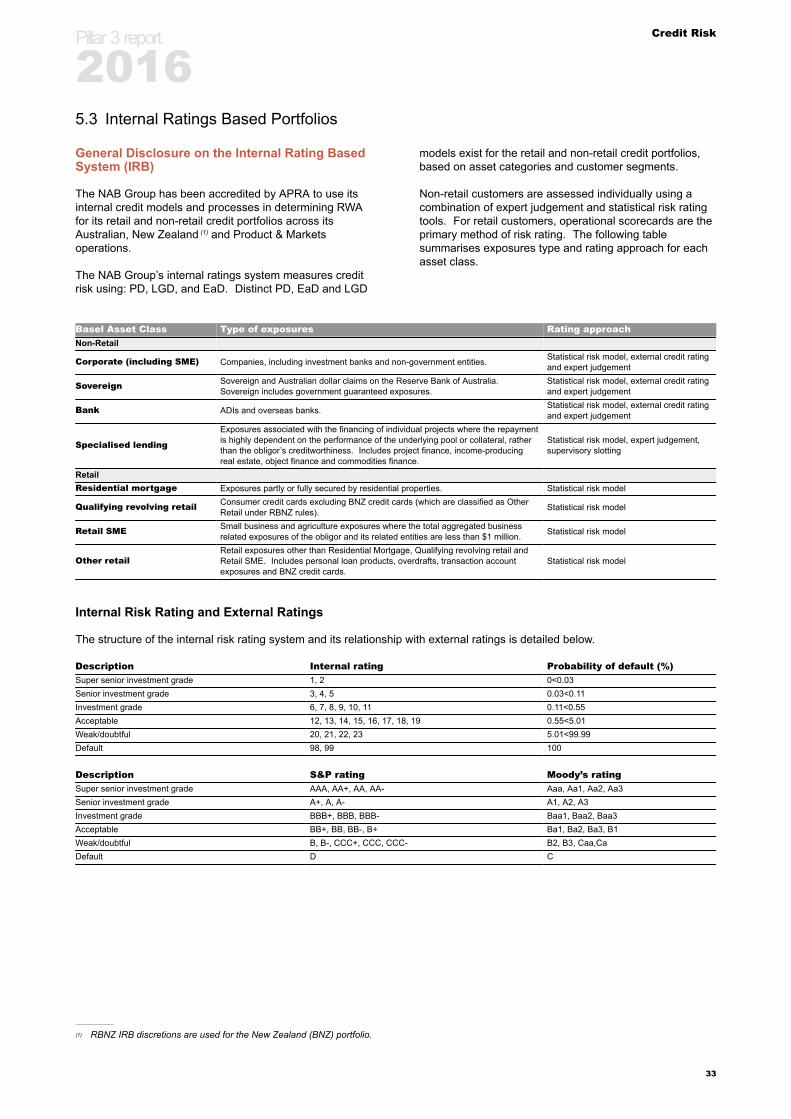
Credit Risk
5.3 Internal Ratings Based Portfolios
General Disclosure on the Internal Rating BasedSystem (IRB)
The NAB Group has been accredited by APRA to use itsinternal credit models and processes in determining RWAfor its retail and non-retail credit portfolios across itsAustralian, New Zealand (1) and Product & Marketsoperations.
The NAB Group’s internal ratings system measures creditrisk using: PD, LGD, and EaD. Distinct PD, EaD and LGD
models exist for the retail and non-retail credit portfolios,based on asset categories and customer segments.
Non-retail customers are assessed individually using acombination of expert judgement and statistical risk ratingtools. For retail customers, operational scorecards are theprimary method of risk rating. The following tablesummarises exposures type and rating approach for eachasset class.
Basel Asset Class Type of exposures Rating approachNon-Retail
Corporate (including SME) Companies, including investment banks and non-government entities. Statistical risk model, external credit ratingand expert judgement
Sovereign Sovereign and Australian dollar claims on the Reserve Bank of Australia.Sovereign includes government guaranteed exposures.
Statistical risk model, external credit ratingand expert judgement
Bank ADIs and overseas banks. Statistical risk model, external credit ratingand expert judgement
Specialised lending
Exposures associated with the financing of individual projects where the repaymentis highly dependent on the performance of the underlying pool or collateral, ratherthan the obligor’s creditworthiness. Includes project finance, income-producingreal estate, object finance and commodities finance.
Statistical risk model, expert judgement,supervisory slotting
RetailResidential mortgage Exposures partly or fully secured by residential properties. Statistical risk model
Qualifying revolving retail Consumer credit cards excluding BNZ credit cards (which are classified as OtherRetail under RBNZ rules). Statistical risk model
Retail SME Small business and agriculture exposures where the total aggregated businessrelated exposures of the obligor and its related entities are less than $1 million. Statistical risk model
Other retailRetail exposures other than Residential Mortgage, Qualifying revolving retail andRetail SME. Includes personal loan products, overdrafts, transaction accountexposures and BNZ credit cards.
Statistical risk model
Internal Risk Rating and External Ratings
The structure of the internal risk rating system and its relationship with external ratings is detailed below.
Description Internal rating Probability of default (%)Super senior investment grade 1, 2 0<0.03Senior investment grade 3, 4, 5 0.03<0.11Investment grade 6, 7, 8, 9, 10, 11 0.11<0.55Acceptable 12, 13, 14, 15, 16, 17, 18, 19 0.55<5.01Weak/doubtful 20, 21, 22, 23 5.01<99.99Default 98, 99 100
Description S&P rating Moody’s ratingSuper senior investment grade AAA, AA+, AA, AA- Aaa, Aa1, Aa2, Aa3Senior investment grade A+, A, A- A1, A2, A3Investment grade BBB+, BBB, BBB- Baa1, Baa2, Baa3Acceptable BB+, BB, BB-, B+ Ba1, Ba2, Ba3, B1Weak/doubtful B, B-, CCC+, CCC, CCC- B2, B3, Caa,CaDefault D C
(1) RBNZ IRB discretions are used for the New Zealand (BNZ) portfolio.
Pillar 3 report
2016
33

Credit Risk
Internal Ratings Process Overview
Probability of Default
PD measures the likelihood that an obligor will defaultwithin a 12 month period. The NAB Group uses two typesof PD estimates:
• PiT, which estimates the likelihood of default in the next12 months taking account of the current economicconditions. PiT PDs are used for management of theportfolio and the collective provision calculation.
• TTC, which estimates the likelihood of default through afull credit cycle. TTC PDs are used for regulatory andeconomic capital calculation.
The NAB Group has a common masterscale across allcounterparties (non-retail and retail) for PD.
Loss Given Default
LGD measures the portion of the exposure owed to theNAB Group that would be lost in the event of the customerdefaulting. LGD is calculated by using a set of estimatedparameters including Loss Given Realisation (LGR), post-default path rates and the bank value of collateral.
The NAB Group applies stresses to the model factors toobtain downturn LGD estimates using internal data,external reference data and benchmarks, and by applyingexpert judgement.
Exposure at Default
EaD is calculated according to the facility type. The NABGroup’s EaD models predict the dollar amount that isoutstanding if the obligor defaults. This amount includesprincipal, fees and interest owed at the time of default.
The NAB Group applies stresses to the model factors toobtain downturn EaD estimates using internal data,benchmark studies and expert judgement.
Use of PD, LGD and EaD
PD, LGD and EaD estimates are used for variousregulatory and internal Credit Risk calculations, such asRegulatory Expected Loss, RWA, economic capital andprovisioning.
Credit Rating System Control
In addition to monthly performance reporting, credit modelsare reviewed at least annually in accordance with the NABGroup’s Model Risk Policy. Regular independent reviewsare also conducted.
The outcomes of the model validation process, includingproposed actions, are presented to the authorised RiskCommittees for review and endorsement of any actions forimplementation.
Non-Retail Credit - Internal Ratings Process
Non-Retail – PD Models
The NAB Group has a number of PD models thatdifferentiate by industry or segment, counterparty size and
incorporate regional variances. The rating model used isdependent on:
• industry, based on ANZSIC classification• financial information available• qualitative information• exposure and product.
The quantitative (financial) factors consist of financial ratiosand indicators (e.g. profitability, leverage and debt servicecoverage). The qualitative (non-financial) factors arebased on qualitative data using the expert judgement of thelender and credit officer (e.g. management ability andindustry outlook).
While factors predictive of default have broad similaritiesacross segments (e.g. debt service capability andmanagement quality) and are inherently correlated, themodelling process establishes those factors that are mostrobustly predictive for each segment, along with theirrelative weightings. External benchmarking is used forcertain segments that have insufficient internal data, asmall population and/or low defaults. This is the case forexternally rated banks and sovereigns, where externalrating agency data is used. The resulting rating is updatedat least annually.
Non-Retail – EaD Models
EaD is calculated according to the facility type.
EaD = Balance + Credit Conversion Factor x UndrawnLimit
Conversion factors are used for estimating off-balancesheet exposures into an equivalent on-balance sheetamount, based on internal data.
Non-Retail – LGD Models
LGD for the non-retail portfolio is calculated by using a setof estimated parameters including post default pathrelativities, secured and unsecured loss experience as wellas bank value of collateral. LGD is segmented bycustomer type, customer size and nature of facility.
As the market value of the collateral and unsecuredrecoveries is affected by credit cycle changes, the impactof a credit cycle downturn on LGD has been incorporated.
The NAB Group also uses the following factors for non-retail credit LGD models:
• relevant external benchmarks• secured and unsecured recovery rates• time value of money• principal and interest write-offs.
Where limited internal default data exists, data issupplemented by external benchmarks, market data andexpert judgement.
Pillar 3 report
2016
34

Credit Risk
Retail Credit - Internal Ratings Process
Retail Credit – PD Models
Retail PD models are developed using the following:
• application data and scorecards, including externalcredit bureau data
• customer and account level behavioural data (forexample delinquency or limit utilisation) as well asbehaviour scorecards that are updated monthly.
Each account is “scored” to assign a PD. This processallows groups of accounts with similar scores to be pooledtogether and mapped to the PD masterscale.
Appropriate long run adjustments have been made to themodels to account for performance over an economiccycle.
Retail Credit – EaD Models
Retail EaD models use a combination of Credit ConversionFactors (CCFs) similar to those used innon-retail, and scaling factors.
CCFs have been developed mainly for revolving creditproducts, such as credit cards and overdrafts and estimatethe amount of unutilised credit a customer may draw in thelead up to default.
Scaling factors have been applied mainly to term lendingproducts, where the customer has less availability ofunutilised credit from which to draw in the lead up todefault.
Retail Credit – LGD Models
Key account variables, such as months exposure held andbalance, are identified and modelled to provide an estimateof the probability that a loan that has defaulted wouldreturn to full performance (i.e. cure).
For accounts that do not cure and are written off, internalrecovery data is used to assess the ultimate loss (i.e.initial loss less recoveries achieved plus costs of recovery).
Adjustments based on external data and expert judgementare made to the LGD to account for a downturn in theeconomic cycle, and are applied by varying the cure andrecovery rates.
In Australia, the only credit risk mitigation measure appliesto the residential mortgage portfolio, where LendersMortgage Insurance (LMI) is generally required forborrowing above 80% Loan to Value Ratio at origination.For loans secured by residential property, APRA hasmandated the use of a supervisory floor of 20% for RWApurposes.
Note: LMI does not currently influence the retail LGDmetrics used.
Pillar 3 report
2016
35
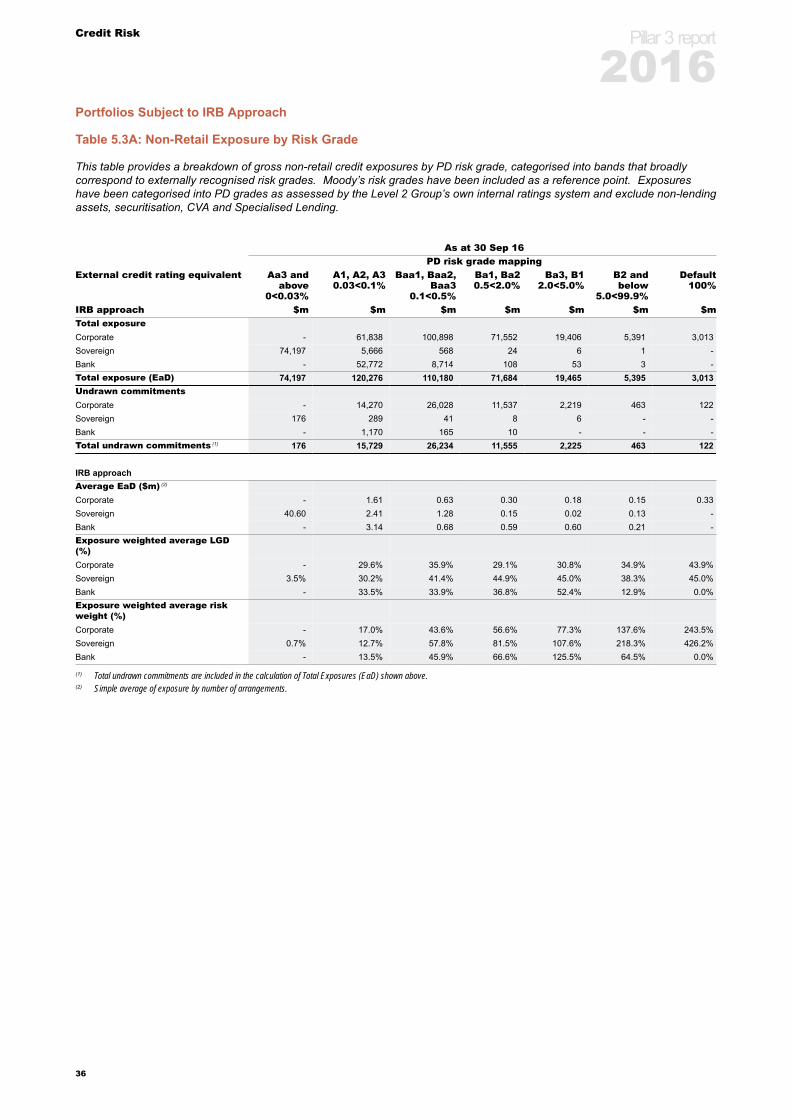
Credit Risk
Portfolios Subject to IRB Approach
Table 5.3A: Non-Retail Exposure by Risk Grade
This table provides a breakdown of gross non-retail credit exposures by PD risk grade, categorised into bands that broadlycorrespond to externally recognised risk grades. Moody’s risk grades have been included as a reference point. Exposureshave been categorised into PD grades as assessed by the Level 2 Group’s own internal ratings system and exclude non-lendingassets, securitisation, CVA and Specialised Lending.
As at 30 Sep 16PD risk grade mapping
External credit rating equivalent Aa3 andabove
0<0.03%
A1, A2, A30.03<0.1%
Baa1, Baa2,Baa3
0.1<0.5%
Ba1, Ba20.5<2.0%
Ba3, B12.0<5.0%
B2 andbelow
5.0<99.9%
Default100%
IRB approach $m $m $m $m $m $m $mTotal exposureCorporate - 61,838 100,898 71,552 19,406 5,391 3,013Sovereign 74,197 5,666 568 24 6 1 -Bank - 52,772 8,714 108 53 3 -Total exposure (EaD) 74,197 120,276 110,180 71,684 19,465 5,395 3,013Undrawn commitmentsCorporate - 14,270 26,028 11,537 2,219 463 122Sovereign 176 289 41 8 6 - -Bank - 1,170 165 10 - - -Total undrawn commitments (1) 176 15,729 26,234 11,555 2,225 463 122
IRB approachAverage EaD ($m) (2)
Corporate - 1.61 0.63 0.30 0.18 0.15 0.33Sovereign 40.60 2.41 1.28 0.15 0.02 0.13 -Bank - 3.14 0.68 0.59 0.60 0.21 -Exposure weighted average LGD(%)Corporate - 29.6% 35.9% 29.1% 30.8% 34.9% 43.9%Sovereign 3.5% 30.2% 41.4% 44.9% 45.0% 38.3% 45.0%Bank - 33.5% 33.9% 36.8% 52.4% 12.9% 0.0%Exposure weighted average riskweight (%)Corporate - 17.0% 43.6% 56.6% 77.3% 137.6% 243.5%Sovereign 0.7% 12.7% 57.8% 81.5% 107.6% 218.3% 426.2%Bank - 13.5% 45.9% 66.6% 125.5% 64.5% 0.0%
(1) Total undrawn commitments are included in the calculation of Total Exposures (EaD) shown above.(2) Simple average of exposure by number of arrangements.
Pillar 3 report
2016
36
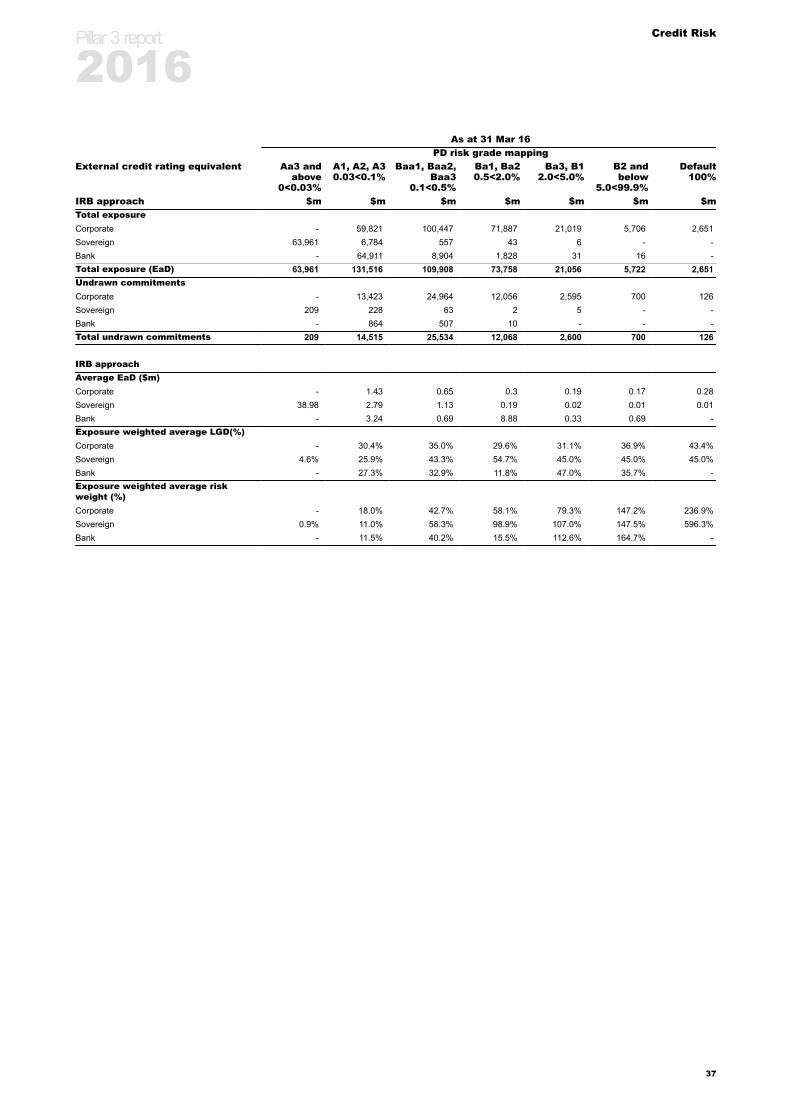
Credit Risk
As at 31 Mar 16PD risk grade mapping
External credit rating equivalent Aa3 andabove
0<0.03%
A1, A2, A30.03<0.1%
Baa1, Baa2,Baa3
0.1<0.5%
Ba1, Ba20.5<2.0%
Ba3, B12.0<5.0%
B2 andbelow
5.0<99.9%
Default100%
IRB approach $m $m $m $m $m $m $mTotal exposureCorporate - 59,821 100,447 71,887 21,019 5,706 2,651Sovereign 63,961 6,784 557 43 6 - -Bank - 64,911 8,904 1,828 31 16 -Total exposure (EaD) 63,961 131,516 109,908 73,758 21,056 5,722 2,651Undrawn commitmentsCorporate - 13,423 24,964 12,056 2,595 700 126Sovereign 209 228 63 2 5 - -Bank - 864 507 10 - - -Total undrawn commitments 209 14,515 25,534 12,068 2,600 700 126
IRB approachAverage EaD ($m)Corporate - 1.43 0.65 0.3 0.19 0.17 0.28Sovereign 38.98 2.79 1.13 0.19 0.02 0.01 0.01Bank - 3.24 0.69 8.88 0.33 0.69 -Exposure weighted average LGD(%)Corporate - 30.4% 35.0% 29.6% 31.1% 36.9% 43.4%Sovereign 4.6% 25.9% 43.3% 54.7% 45.0% 45.0% 45.0%Bank - 27.3% 32.9% 11.8% 47.0% 35.7% -Exposure weighted average riskweight (%)Corporate - 18.0% 42.7% 58.1% 79.3% 147.2% 236.9%Sovereign 0.9% 11.0% 58.3% 98.9% 107.0% 147.5% 596.3%Bank - 11.5% 40.2% 15.5% 112.6% 164.7% -
Pillar 3 report
2016
37
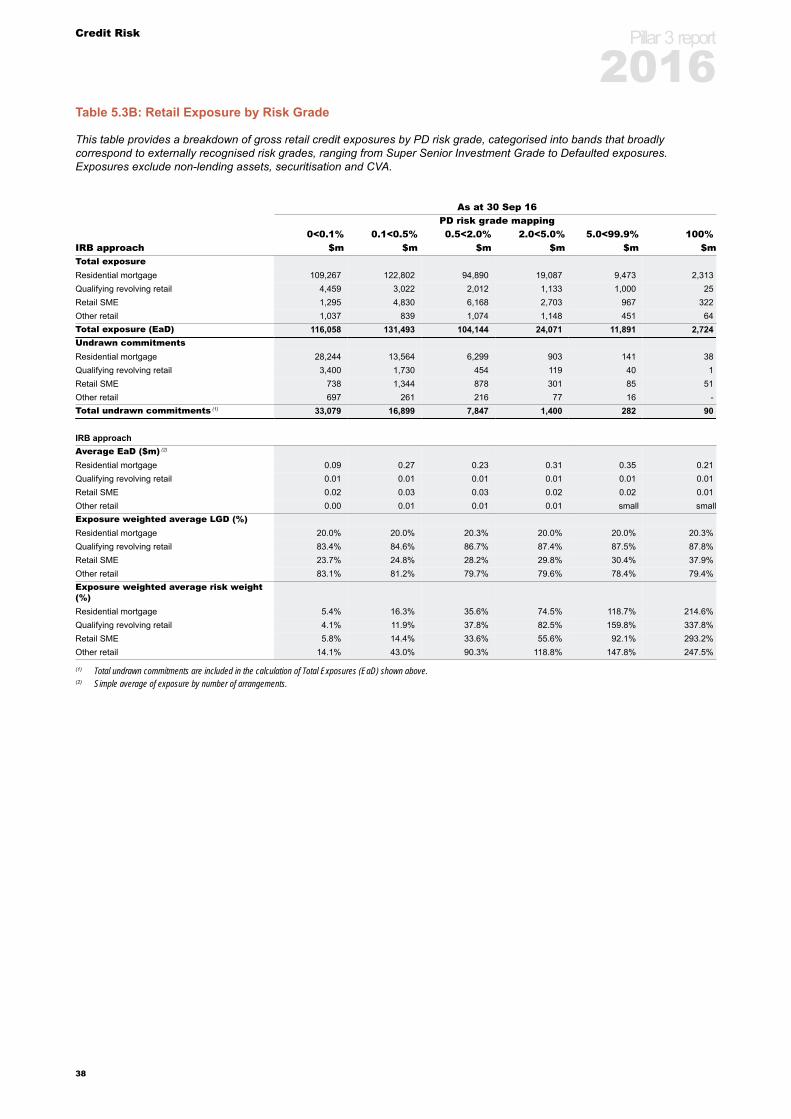
Credit Risk
Table 5.3B: Retail Exposure by Risk Grade
This table provides a breakdown of gross retail credit exposures by PD risk grade, categorised into bands that broadlycorrespond to externally recognised risk grades, ranging from Super Senior Investment Grade to Defaulted exposures.Exposures exclude non-lending assets, securitisation and CVA.
As at 30 Sep 16PD risk grade mapping
0<0.1% 0.1<0.5% 0.5<2.0% 2.0<5.0% 5.0<99.9% 100%IRB approach $m $m $m $m $m $mTotal exposureResidential mortgage 109,267 122,802 94,890 19,087 9,473 2,313Qualifying revolving retail 4,459 3,022 2,012 1,133 1,000 25Retail SME 1,295 4,830 6,168 2,703 967 322Other retail 1,037 839 1,074 1,148 451 64Total exposure (EaD) 116,058 131,493 104,144 24,071 11,891 2,724Undrawn commitmentsResidential mortgage 28,244 13,564 6,299 903 141 38Qualifying revolving retail 3,400 1,730 454 119 40 1Retail SME 738 1,344 878 301 85 51Other retail 697 261 216 77 16 -Total undrawn commitments (1) 33,079 16,899 7,847 1,400 282 90
IRB approachAverage EaD ($m) (2)
Residential mortgage 0.09 0.27 0.23 0.31 0.35 0.21Qualifying revolving retail 0.01 0.01 0.01 0.01 0.01 0.01Retail SME 0.02 0.03 0.03 0.02 0.02 0.01Other retail 0.00 0.01 0.01 0.01 small smallExposure weighted average LGD (%)Residential mortgage 20.0% 20.0% 20.3% 20.0% 20.0% 20.3%Qualifying revolving retail 83.4% 84.6% 86.7% 87.4% 87.5% 87.8%Retail SME 23.7% 24.8% 28.2% 29.8% 30.4% 37.9%Other retail 83.1% 81.2% 79.7% 79.6% 78.4% 79.4%Exposure weighted average risk weight(%)Residential mortgage 5.4% 16.3% 35.6% 74.5% 118.7% 214.6%Qualifying revolving retail 4.1% 11.9% 37.8% 82.5% 159.8% 337.8%Retail SME 5.8% 14.4% 33.6% 55.6% 92.1% 293.2%Other retail 14.1% 43.0% 90.3% 118.8% 147.8% 247.5%
(1) Total undrawn commitments are included in the calculation of Total Exposures (EaD) shown above.(2) Simple average of exposure by number of arrangements.
Pillar 3 report
2016
38
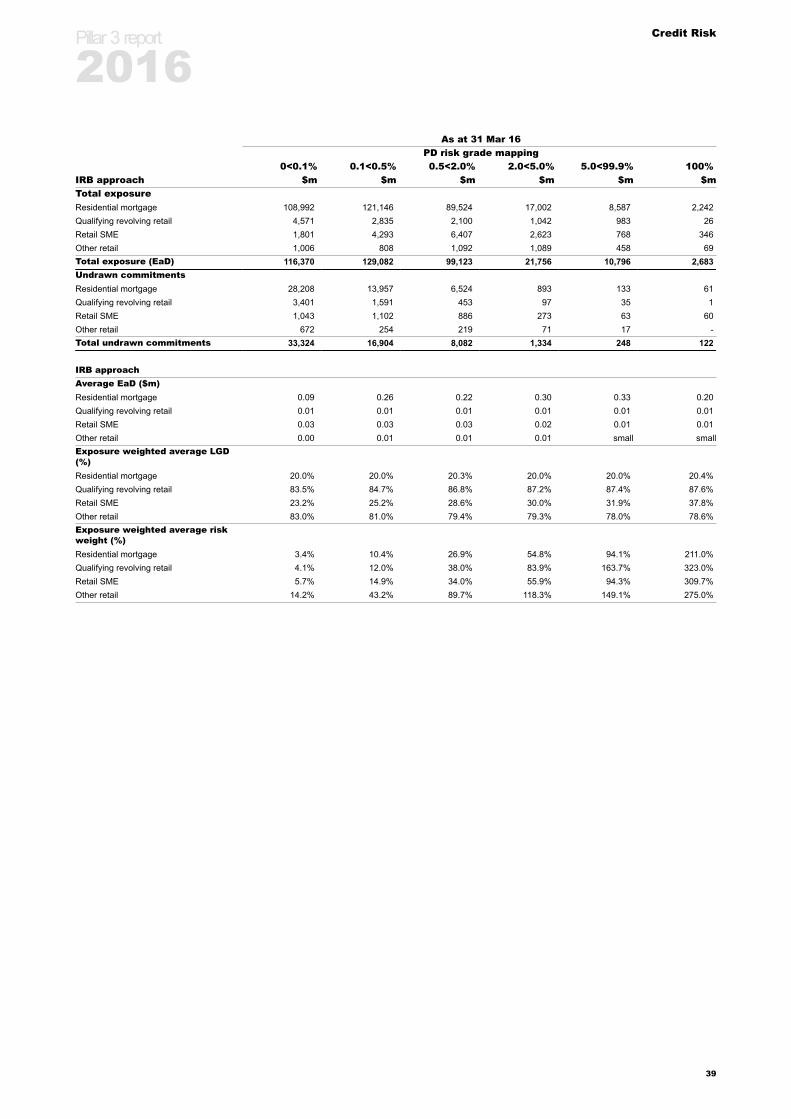
Credit Risk
As at 31 Mar 16PD risk grade mapping
0<0.1% 0.1<0.5% 0.5<2.0% 2.0<5.0% 5.0<99.9% 100%IRB approach $m $m $m $m $m $mTotal exposureResidential mortgage 108,992 121,146 89,524 17,002 8,587 2,242Qualifying revolving retail 4,571 2,835 2,100 1,042 983 26Retail SME 1,801 4,293 6,407 2,623 768 346Other retail 1,006 808 1,092 1,089 458 69Total exposure (EaD) 116,370 129,082 99,123 21,756 10,796 2,683Undrawn commitmentsResidential mortgage 28,208 13,957 6,524 893 133 61Qualifying revolving retail 3,401 1,591 453 97 35 1Retail SME 1,043 1,102 886 273 63 60Other retail 672 254 219 71 17 -Total undrawn commitments 33,324 16,904 8,082 1,334 248 122
IRB approachAverage EaD ($m)Residential mortgage 0.09 0.26 0.22 0.30 0.33 0.20Qualifying revolving retail 0.01 0.01 0.01 0.01 0.01 0.01Retail SME 0.03 0.03 0.03 0.02 0.01 0.01Other retail 0.00 0.01 0.01 0.01 small smallExposure weighted average LGD(%)Residential mortgage 20.0% 20.0% 20.3% 20.0% 20.0% 20.4%Qualifying revolving retail 83.5% 84.7% 86.8% 87.2% 87.4% 87.6%Retail SME 23.2% 25.2% 28.6% 30.0% 31.9% 37.8%Other retail 83.0% 81.0% 79.4% 79.3% 78.0% 78.6%Exposure weighted average riskweight (%)Residential mortgage 3.4% 10.4% 26.9% 54.8% 94.1% 211.0%Qualifying revolving retail 4.1% 12.0% 38.0% 83.9% 163.7% 323.0%Retail SME 5.7% 14.9% 34.0% 55.9% 94.3% 309.7%Other retail 14.2% 43.2% 89.7% 118.3% 149.1% 275.0%
Pillar 3 report
2016
39

Credit Risk
5.4 Credit Risk Mitigation
The NAB Group employs a range of techniques to reducerisk in its credit portfolio.
Credit risk mitigation commences with an objective creditevaluation of the counterparty. This includes anassessment of the counterparty’s character, industry,business model and capacity to meet its commitmentswithout distress. Other methods to mitigate credit risksinclude a prudent approach to facility structure, collateral,lending covenants, terms and conditions.
Collateral ManagementCollateral provides a secondary source of repayment forfunds being advanced, in the event that counterpartycannot meet its contractual repayment obligations.
Collateral commonly includes:
• fixed and floating charges over business assets• residential, commercial and rural property• cash deposits• fixed income products• listed shares, bonds or securities• guarantees, letters of credit and pledges.
To ensure that collateral held is sufficiently liquid, legallyvalid, enforceable and regularly valued, credit risk policyprovides a framework to:
• establish the amount and quality of collateral required tosupport an exposure
• determine acceptable valuation type and revaluationrequirements for each collateral class
• record market value and ‘bank value’ (a conservativeassessment of value in the event the collateral isrealised).
Guarantees from financially sound parties are sometimesrequired to support funds advanced to a counterparty;which can reduce the risk of default on their obligations.Where allowed in credit risk policy, guarantors that are riskrated may enhance the counterparty customer rating.
Credit HedgingCredit hedging is utilised in the banking book to avoidcounterparty concentrations against protection sellers andachieve portfolio diversification.
Credit risk to individual hedge counterparties is mitigatedthrough careful selection of investment grade equivalentcounterparties and use of collateral agreements to managenet exposures.
Credit Exposure NettingCredit Exposure Netting may be adopted to calculatecounterparty credit exposures on a net basis. Thisrecognises that the change in value for different productsover time is not perfectly correlated; transactions withpositive value when netted may offset those with negativevalue.
Credit Exposure Netting is subject to execution ofsupporting legal documentation. A credit exposuremeasurement and reporting system manages the nettingpools in accordance with that documentation.
Portfolio ManagementGroup Credit Risk, together with Business Unit Riskfunctions, manage the overall risk of the corporate,sovereign and bank credit portfolios. Where credit risksare identified, a variety of techniques are used to mitigatethe risk, including credit derivatives and, on occasion, thesale of loan assets (in consultation with the counterparties).
Internal reporting systems are utilised to record all:
• approved derivative, money market, credit line and/orcredit trading facility limits
• credit exposure arising from securities sales andpurchases, money market lines, commodities, trade,derivative and foreign exchange transactions
• country risk exposures for country economic capital limitpurposes.
Limits may be established at a facility, product group orindividual product level, based on the level of financialsophistication exhibited by the counterparty. A specialistadministration unit operating independently fromrelationship managers, dealers and credit approvers recordand maintain the limits.
Pillar 3 report
2016
40
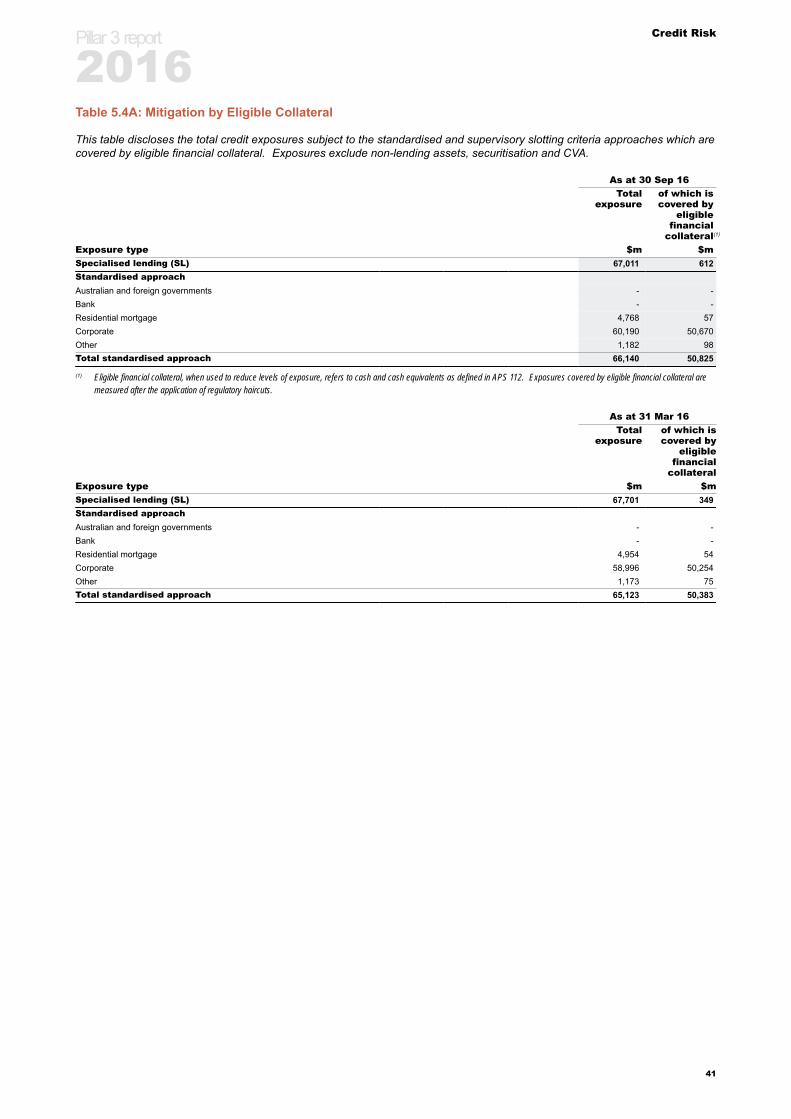
Credit Risk
Table 5.4A: Mitigation by Eligible Collateral
This table discloses the total credit exposures subject to the standardised and supervisory slotting criteria approaches which arecovered by eligible financial collateral. Exposures exclude non-lending assets, securitisation and CVA.
As at 30 Sep 16Total
exposureof which iscovered by
eligiblefinancial
collateral(1)
Exposure type $m $mSpecialised lending (SL) 67,011 612Standardised approachAustralian and foreign governments - -Bank - -Residential mortgage 4,768 57Corporate 60,190 50,670Other 1,182 98Total standardised approach 66,140 50,825
(1) Eligible financial collateral, when used to reduce levels of exposure, refers to cash and cash equivalents as defined in APS 112. Exposures covered by eligible financial collateral aremeasured after the application of regulatory haircuts.
As at 31 Mar 16Total
exposureof which iscovered by
eligiblefinancial
collateralExposure type $m $mSpecialised lending (SL) 67,701 349Standardised approachAustralian and foreign governments - -Bank - -Residential mortgage 4,954 54Corporate 58,996 50,254Other 1,173 75Total standardised approach 65,123 50,383
Pillar 3 report
2016
41
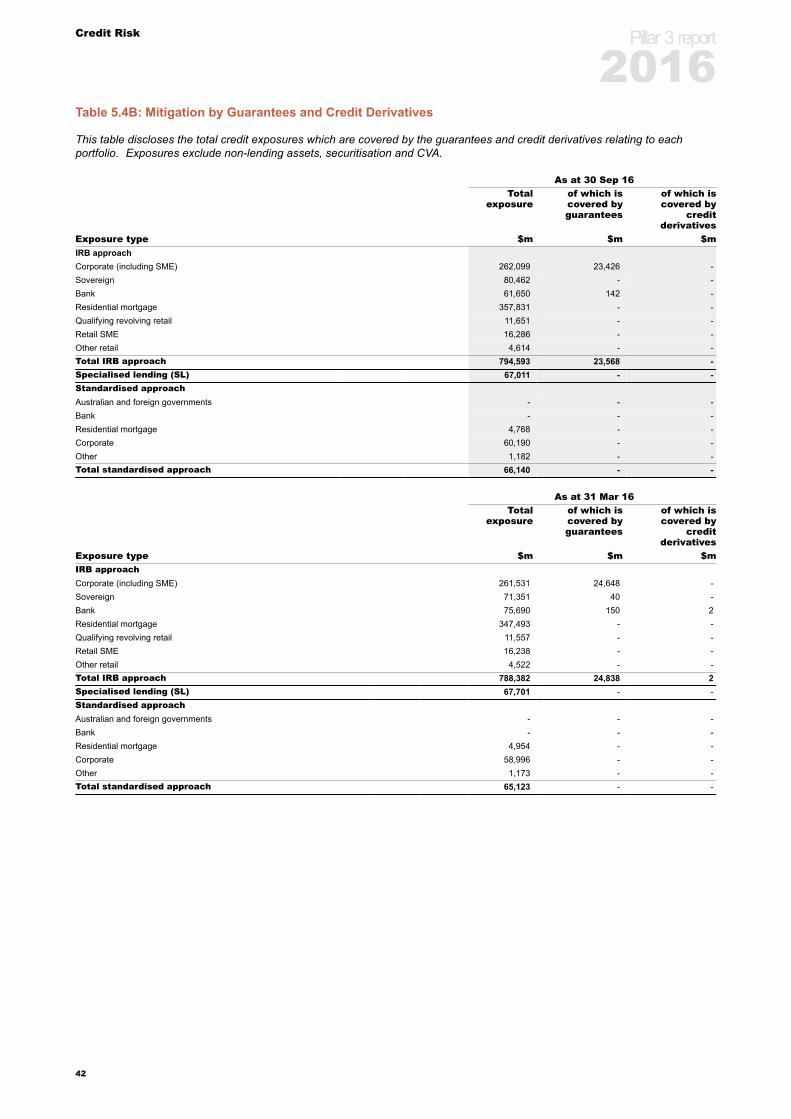
Credit Risk
Table 5.4B: Mitigation by Guarantees and Credit Derivatives
This table discloses the total credit exposures which are covered by the guarantees and credit derivatives relating to eachportfolio. Exposures exclude non-lending assets, securitisation and CVA.
As at 30 Sep 16Total
exposureof which iscovered byguarantees
of which iscovered by
creditderivatives
Exposure type $m $m $mIRB approachCorporate (including SME) 262,099 23,426 -Sovereign 80,462 - -Bank 61,650 142 -Residential mortgage 357,831 - -Qualifying revolving retail 11,651 - -Retail SME 16,286 - -Other retail 4,614 - -Total IRB approach 794,593 23,568 -Specialised lending (SL) 67,011 - -Standardised approachAustralian and foreign governments - - -Bank - - -Residential mortgage 4,768 - -Corporate 60,190 - -Other 1,182 - -Total standardised approach 66,140 - -
As at 31 Mar 16Total
exposureof which iscovered byguarantees
of which iscovered by
creditderivatives
Exposure type $m $m $mIRB approachCorporate (including SME) 261,531 24,648 -Sovereign 71,351 40 -Bank 75,690 150 2Residential mortgage 347,493 - -Qualifying revolving retail 11,557 - -Retail SME 16,238 - -Other retail 4,522 - -Total IRB approach 788,382 24,838 2Specialised lending (SL) 67,701 - -Standardised approachAustralian and foreign governments - - -Bank - - -Residential mortgage 4,954 - -Corporate 58,996 - -Other 1,173 - -Total standardised approach 65,123 - -
Pillar 3 report
2016
42

Credit Risk
5.5 Counterparty Credit Risk
This section describes the NAB Group’s approach tomanaging credit risk concerning market-relatedinstruments. Counterparty Credit Risk (CCR) is the riskthat a counterparty to a transaction may default before thefinal settlement of the transaction’s cash flows. Aneconomic loss would occur if a transaction with a defaultingcounterparty has a positive economic value to the NABGroup.
Credit Limits
Credit limits for derivatives are approved and assigned byan appropriately authorised DCA based on the sameprinciples (i.e. amount, tenor, probability of default, lossgiven default and product type), and internal credit policiesused for approving bank loans.
Credit exposures for each transaction are measured as thecurrent mark-to-market value and the Potential CreditExposure (PCE) which is an estimate of the futurereplacement cost.
Credit risk economic capital is then allocated to individualcounterparty exposures based on their relative riskcontribution to Unexpected Loss (UL).
Limit excesses, whether they are active or passive, aresubject to formal approval by a DCA.
Collateral
Counterparty credit exposures may be collateralised by anapproved list of eligible collateral via market standardmaster agreements (ISDA and credit support annex).Eligible collateral may be subject to haircuts depending onasset type. Counterparties may also be subject to postingadditional collateral before transacting.
Bank systems are in place to support daily marking-to-market of net exposures and margin requirements,marking-to-market of collateral value and reconciliation ofcollateral receipt and holdings against collateral due.
Wrong Way Risk
Wrong way risk occurs when exposure to counterparty isadversely correlated with the credit quality of thatcounterparty. Credit exposures and potential losses mayincrease under these circumstances as a result of marketconditions. The NAB Group manages these risks throughthe effective implementation of a number of risk policies,including, but not limited to: single large exposure policy;credit concentration risk policies; aggregation policy;collateralisation policy; and various product restrictions.
Downgrade Impact
As at 30 September 2016, with respect to counterpartyderivatives, the NAB Group would need to post anestimated amount of $4.7 million of collateral in the eventof a one notch downgrade to the NAB Group's credit rating,and $65.9 million in the event of a two notch downgrade.
Group Treasury, on behalf of the NAB Group, plan for andmanage the impact on transactions that would be affectedby a downgrade clause.
Pillar 3 report
2016
43
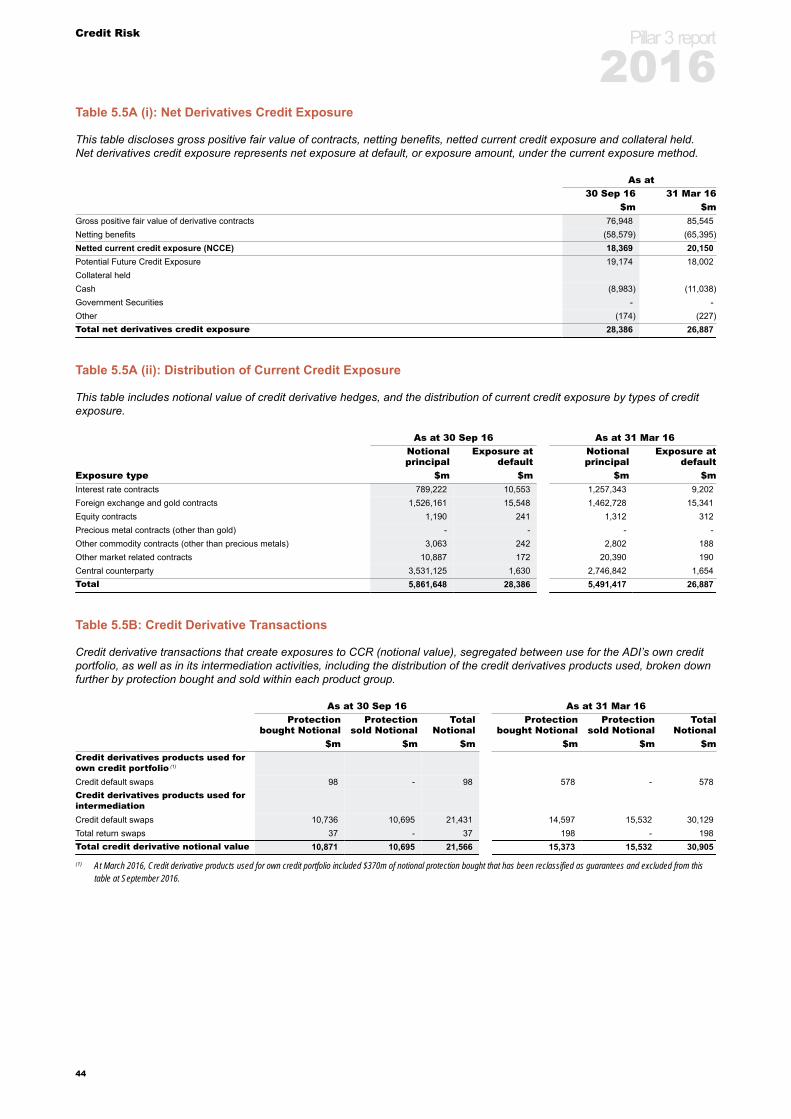
Credit Risk
Table 5.5A (i): Net Derivatives Credit Exposure
This table discloses gross positive fair value of contracts, netting benefits, netted current credit exposure and collateral held.Net derivatives credit exposure represents net exposure at default, or exposure amount, under the current exposure method.
As at30 Sep 16 31 Mar 16
$m $mGross positive fair value of derivative contracts 76,948 85,545Netting benefits (58,579) (65,395)Netted current credit exposure (NCCE) 18,369 20,150Potential Future Credit Exposure 19,174 18,002Collateral heldCash (8,983) (11,038)Government Securities - -Other (174) (227)Total net derivatives credit exposure 28,386 26,887
Table 5.5A (ii): Distribution of Current Credit Exposure
This table includes notional value of credit derivative hedges, and the distribution of current credit exposure by types of creditexposure.
As at 30 Sep 16 As at 31 Mar 16Notionalprincipal
Exposure atdefault
Notionalprincipal
Exposure atdefault
Exposure type $m $m $m $mInterest rate contracts 789,222 10,553 1,257,343 9,202Foreign exchange and gold contracts 1,526,161 15,548 1,462,728 15,341Equity contracts 1,190 241 1,312 312Precious metal contracts (other than gold) - - - -Other commodity contracts (other than precious metals) 3,063 242 2,802 188Other market related contracts 10,887 172 20,390 190Central counterparty 3,531,125 1,630 2,746,842 1,654Total 5,861,648 28,386 5,491,417 26,887
Table 5.5B: Credit Derivative Transactions
Credit derivative transactions that create exposures to CCR (notional value), segregated between use for the ADI’s own creditportfolio, as well as in its intermediation activities, including the distribution of the credit derivatives products used, broken downfurther by protection bought and sold within each product group.
As at 30 Sep 16 As at 31 Mar 16Protection
bought NotionalProtection
sold NotionalTotal
NotionalProtection
bought NotionalProtection
sold NotionalTotal
Notional$m $m $m $m $m $m
Credit derivatives products used forown credit portfolio (1)
Credit default swaps 98 - 98 578 - 578Credit derivatives products used forintermediationCredit default swaps 10,736 10,695 21,431 14,597 15,532 30,129Total return swaps 37 - 37 198 - 198Total credit derivative notional value 10,871 10,695 21,566 15,373 15,532 30,905
(1) At March 2016, Credit derivative products used for own credit portfolio included $370m of notional protection bought that has been reclassified as guarantees and excluded from thistable at September 2016.
Pillar 3 report
2016
44

Securitisation
Section 6
Securitisation
Introduction
Securitisation is a structure where the cash flow from apool of assets is used to service obligations to at least twodifferent tranches or classes of creditors (typically holdersof debt securities), with each class or tranche reflecting adifferent degree of credit risk (i.e. one class of creditors isentitled to receive payments from the pool before anotherclass of creditors). An exception to this is a warehouseSPV which is a securitisation even if it does not have atleast two different tranches of creditors or securities. TheLevel 2 Group engages in securitisation activities for twoprimary purposes:
• securitisation activities for business purposes, includingarranging and managing securitisations for third parties(clients). These activities are undertaken primarilythrough securitisation SPVs that provide funding forsingle or multiple transactions
• securitisation of its own assets for funding, liquidity(including contingent liquidity) purposes, primarily forrisk and capital management reasons.
The Level 2 Group has discontinued all securities arbitrageactivities (i.e. the funding of purchased assets via AssetBacked Paper Conduits).
The Level 2 Group’s securitisation exposures are generallycategorised according to the requirements of APS 330.Key definitions are provided below.
SPV• SPV is an entity set up solely for the purpose of
securitisation, usually a trust or a company• the Level 2 Group does not sponsor any SPVs used to
securitise third party exposures which are currentlyissuing securities.
Origination• originating ADI: the Level 2 Group is an "Originating
ADI" if it originally sold the asset to the SPV (directly orindirectly), manages the SPV or provides anon-derivative facility to an Asset Backed CommercialPaper (ABCP) Program
• non-originating ADI facilities: any facility provided by theLevel 2 Group in which the Level 2 Group is not anOriginating ADI
• originated assets: these refer to assets that wereoriginally written by the Level 2 Group and transferred tothe SPV, or in the case of indirect origination, writtendirectly by the SPV at the direction of the Level 2 Group
• traditional securitisations: securitisations in which thepool of assets is assigned to an SPV, usually by a sale
• synthetic securitisations: securitisations in which the riskof the pool of assets is transferred to an SPV through aderivative, usually a credit default swap.
The Level 2 Group's assessment and management ofsecuritisation risk is governed by APS 120.
Pillar 3 report
2016
45
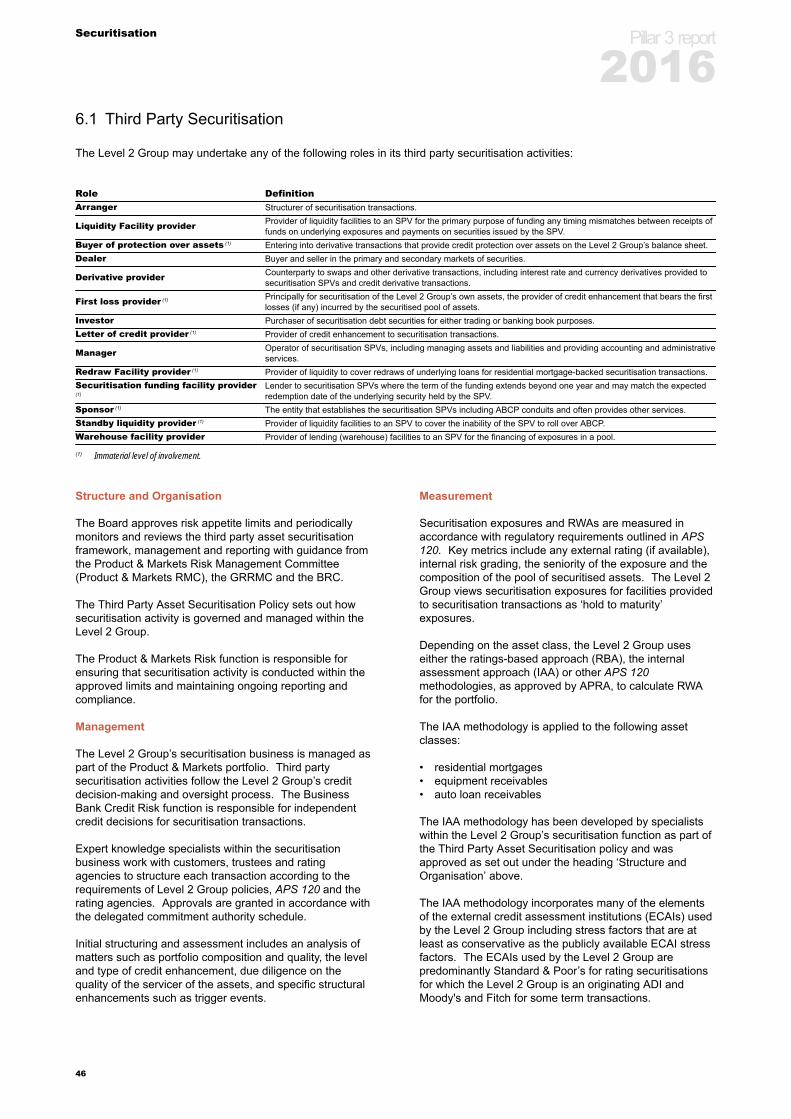
Securitisation
6.1 Third Party Securitisation
The Level 2 Group may undertake any of the following roles in its third party securitisation activities:
Role DefinitionArranger Structurer of securitisation transactions.
Liquidity Facility provider Provider of liquidity facilities to an SPV for the primary purpose of funding any timing mismatches between receipts offunds on underlying exposures and payments on securities issued by the SPV.
Buyer of protection over assets (1) Entering into derivative transactions that provide credit protection over assets on the Level 2 Group’s balance sheet.Dealer Buyer and seller in the primary and secondary markets of securities.
Derivative provider Counterparty to swaps and other derivative transactions, including interest rate and currency derivatives provided tosecuritisation SPVs and credit derivative transactions.
First loss provider (1) Principally for securitisation of the Level 2 Group’s own assets, the provider of credit enhancement that bears the firstlosses (if any) incurred by the securitised pool of assets.
Investor Purchaser of securitisation debt securities for either trading or banking book purposes.Letter of credit provider (1) Provider of credit enhancement to securitisation transactions.
Manager Operator of securitisation SPVs, including managing assets and liabilities and providing accounting and administrativeservices.
Redraw Facility provider (1) Provider of liquidity to cover redraws of underlying loans for residential mortgage-backed securitisation transactions.Securitisation funding facility provider(1)
Lender to securitisation SPVs where the term of the funding extends beyond one year and may match the expectedredemption date of the underlying security held by the SPV.
Sponsor (1) The entity that establishes the securitisation SPVs including ABCP conduits and often provides other services.Standby liquidity provider (1) Provider of liquidity facilities to an SPV to cover the inability of the SPV to roll over ABCP.Warehouse facility provider Provider of lending (warehouse) facilities to an SPV for the financing of exposures in a pool.
(1) Immaterial level of involvement.
Structure and Organisation
The Board approves risk appetite limits and periodicallymonitors and reviews the third party asset securitisationframework, management and reporting with guidance fromthe Product & Markets Risk Management Committee(Product & Markets RMC), the GRRMC and the BRC.
The Third Party Asset Securitisation Policy sets out howsecuritisation activity is governed and managed within theLevel 2 Group.
The Product & Markets Risk function is responsible forensuring that securitisation activity is conducted within theapproved limits and maintaining ongoing reporting andcompliance.
Management
The Level 2 Group’s securitisation business is managed aspart of the Product & Markets portfolio. Third partysecuritisation activities follow the Level 2 Group’s creditdecision-making and oversight process. The BusinessBank Credit Risk function is responsible for independentcredit decisions for securitisation transactions.
Expert knowledge specialists within the securitisationbusiness work with customers, trustees and ratingagencies to structure each transaction according to therequirements of Level 2 Group policies, APS 120 and therating agencies. Approvals are granted in accordance withthe delegated commitment authority schedule.
Initial structuring and assessment includes an analysis ofmatters such as portfolio composition and quality, the leveland type of credit enhancement, due diligence on thequality of the servicer of the assets, and specific structuralenhancements such as trigger events.
Measurement
Securitisation exposures and RWAs are measured inaccordance with regulatory requirements outlined in APS120. Key metrics include any external rating (if available),internal risk grading, the seniority of the exposure and thecomposition of the pool of securitised assets. The Level 2Group views securitisation exposures for facilities providedto securitisation transactions as ‘hold to maturity’exposures.
Depending on the asset class, the Level 2 Group useseither the ratings-based approach (RBA), the internalassessment approach (IAA) or other APS 120methodologies, as approved by APRA, to calculate RWAfor the portfolio.
The IAA methodology is applied to the following assetclasses:
• residential mortgages• equipment receivables• auto loan receivables
The IAA methodology has been developed by specialistswithin the Level 2 Group’s securitisation function as part ofthe Third Party Asset Securitisation policy and wasapproved as set out under the heading ‘Structure andOrganisation’ above.
The IAA methodology incorporates many of the elementsof the external credit assessment institutions (ECAIs) usedby the Level 2 Group including stress factors that are atleast as conservative as the publicly available ECAI stressfactors. The ECAIs used by the Level 2 Group arepredominantly Standard & Poor’s for rating securitisationsfor which the Level 2 Group is an originating ADI andMoody's and Fitch for some term transactions.
Pillar 3 report
2016
46

Securitisation
In addition to providing the basis for assessing theregulatory capital under APS 120 for the relevant assetclasses, the IAA is used in the Level 2 Group’s internal riskmanagement process.
The IAA approval also includes an additional risk weightingapproach for unrated securitisation facilities to “non-IAA”asset classes that applies the higher (most conservative)risk weight of: (i) APS 120 or APS 112 standardised riskweights, or (ii) APS 120 IAA risk weights based on theLevel 2 Group’s internal assessments. The outcome isthat for a majority of the non-IAA asset classes thestandardised risk weights apply.
The IAA model for each asset class is based on an assetclass specific IAA methodology. The models used arelocked-down to ensure a consistency of approach andminimise the risk of manual over-rides occurring. Themethodology and model (where applicable) for each assetclass are considered on a semi-annual basis to ensurethey reflect the NAB Group’s desired risk appetite andallow for changes in market conditions. Certain assetclasses have a specific actuarial tool developed that allowsfor systematic assessment of credit risk across differentpools of financial receivables.
IAA model outputs are used in the credit decision makingprocess for a given exposure according to the NABGroup’s DCA matrix. Under the NAB Group’s RiskManagement Accountability Model, the business hasprimary responsibility to manage risks originating in thebusiness. This includes ensuring that the methodologiesand models used remain appropriate and are updated asrequired. Secondary responsibility lies with Credit Riskwho must ensure that the business uses the modelconsistently and that outcomes across differenttransactions are consistent. Internal auditors ensure thatthe approval process for the model and methodology areadequate.
Monitoring and Reporting
Finance functions perform regular measurement andreporting of securitisation and resecuritisation exposures,including revenue, capital, asset and facility limits andexceptions. Key elements of these reports are provided tothe various risk committees.
Specialist securitisation areas monitor the quality of thepools of assets underlying securitisation or resecuritisationexposures and model the effect on the exposures.Material changes in credit quality of the assets or theexposures are reported to the risk function and, if required,to the relevant risk committees.
Accounting Treatment
The payments on facilities provided to securitisation SPVsare contractually linked to the payments received on a poolof other instruments within the SPV. The facility providedis often pooled into tranches by the SPV based on acontractual cash waterfall repayment arrangement.
To measure the facility at amortised cost, the tranche whichthe facility is part of must give rise to cash flows that are‘solely payments of principal and interest’. The underlyingpool of instruments in the SPV must also contain one or
more instruments that have contractually cash flows thatcomprise ‘solely payments of principal and interest’.
If the facility meets the criteria to be measured at amortisedcost, interest income is recognised in the income statementusing the effective interest method. Fees received whichare directly attributable to the origination of the financialinstrument are recognised as part of the effective interestmethod otherwise the fees are recognised on an accrualsbasis.
Most of these facilities fund NAB-sponsored securitisationSPVs which are consolidated by the Level 2 Group. Onconsolidation, the facilities are eliminated and theunderlying liabilities and assets are brought onto the Level2 Group’s balance sheet.
Securitisation exposures held in trading book, where thefacility provided to the SPV is not held to collect ‘solelypayments of principal and interest’, but are traded, arerecorded at fair value. Unrealised profit or losses inrespect of the fair value adjustments are recognisedimmediately in to the profit and loss account.
Securitisation exposures held in banking book, where thefacility provided to the SPV is to hold to collect ‘solelypayment of principal and interest’ and sell the exposurewhere an opportunity arises, are recorded at fair value andunrealised profit or losses in respect of the fair valueadjustments are recognised in other comprehensiveincome.
Securitisation warehouse facilities provided to third partySPVs are accounted for at amortised cost, net of anyprovision for impairment, provided they meet thecontractually linked guidance above.
Derivatives such as interest rate swaps, basis swaps orcross-currency swaps with third party SPVs are recordedat fair value and unrealised profit or losses in respect of thefair value adjustments are recognised immediately in to theprofit and loss account.
In general, there is no difference in accounting treatmentbetween securitisation and resecuritisation exposures.
Securitisation Risks
Risks arising from securitisation activities include credit,liquidity, market and operational risks. Interest rate riskand securities price risk are managed as part of the marketand non-traded market risk processes. In some casesrisks are assumed by acquiring securities or entering intofacilities. In other cases risks are transferred through thesecuritisation of Level 2 Group assets. The Level 2 Groupengages in credit risk mitigation on a case-by-case basis.
The Level 2 Group has certain exposures which areclassed as resecuritisation exposures. The Level 2 Groupdoes not specifically target resecuritisation exposures forinvestment.
Pillar 3 report
2016
47
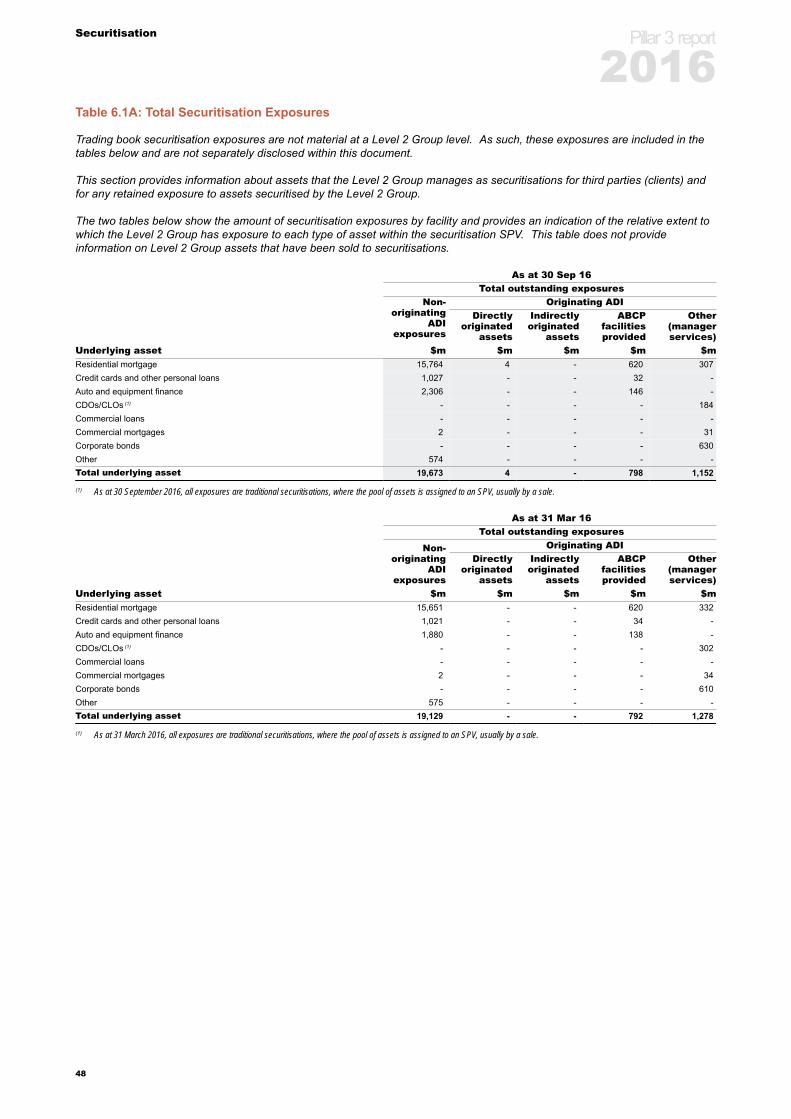
Securitisation
Table 6.1A: Total Securitisation Exposures
Trading book securitisation exposures are not material at a Level 2 Group level. As such, these exposures are included in thetables below and are not separately disclosed within this document.
This section provides information about assets that the Level 2 Group manages as securitisations for third parties (clients) andfor any retained exposure to assets securitised by the Level 2 Group.
The two tables below show the amount of securitisation exposures by facility and provides an indication of the relative extent towhich the Level 2 Group has exposure to each type of asset within the securitisation SPV. This table does not provideinformation on Level 2 Group assets that have been sold to securitisations.
As at 30 Sep 16Total outstanding exposures
Non-originating
ADIexposures
Originating ADIDirectly
originatedassets
Indirectlyoriginated
assets
ABCPfacilitiesprovided
Other(managerservices)
Underlying asset $m $m $m $m $mResidential mortgage 15,764 4 - 620 307Credit cards and other personal loans 1,027 - - 32 -Auto and equipment finance 2,306 - - 146 -CDOs/CLOs (1) - - - - 184Commercial loans - - - - -Commercial mortgages 2 - - - 31Corporate bonds - - - - 630Other 574 - - - -Total underlying asset 19,673 4 - 798 1,152
(1) As at 30 September 2016, all exposures are traditional securitisations, where the pool of assets is assigned to an SPV, usually by a sale.
As at 31 Mar 16Total outstanding exposures
Non-originating
ADIexposures
Originating ADIDirectly
originatedassets
Indirectlyoriginated
assets
ABCPfacilitiesprovided
Other(managerservices)
Underlying asset $m $m $m $m $mResidential mortgage 15,651 - - 620 332Credit cards and other personal loans 1,021 - - 34 -Auto and equipment finance 1,880 - - 138 -CDOs/CLOs (1) - - - - 302Commercial loans - - - - -Commercial mortgages 2 - - - 34Corporate bonds - - - - 610Other 575 - - - -Total underlying asset 19,129 - - 792 1,278
(1) As at 31 March 2016, all exposures are traditional securitisations, where the pool of assets is assigned to an SPV, usually by a sale.
Pillar 3 report
2016
48
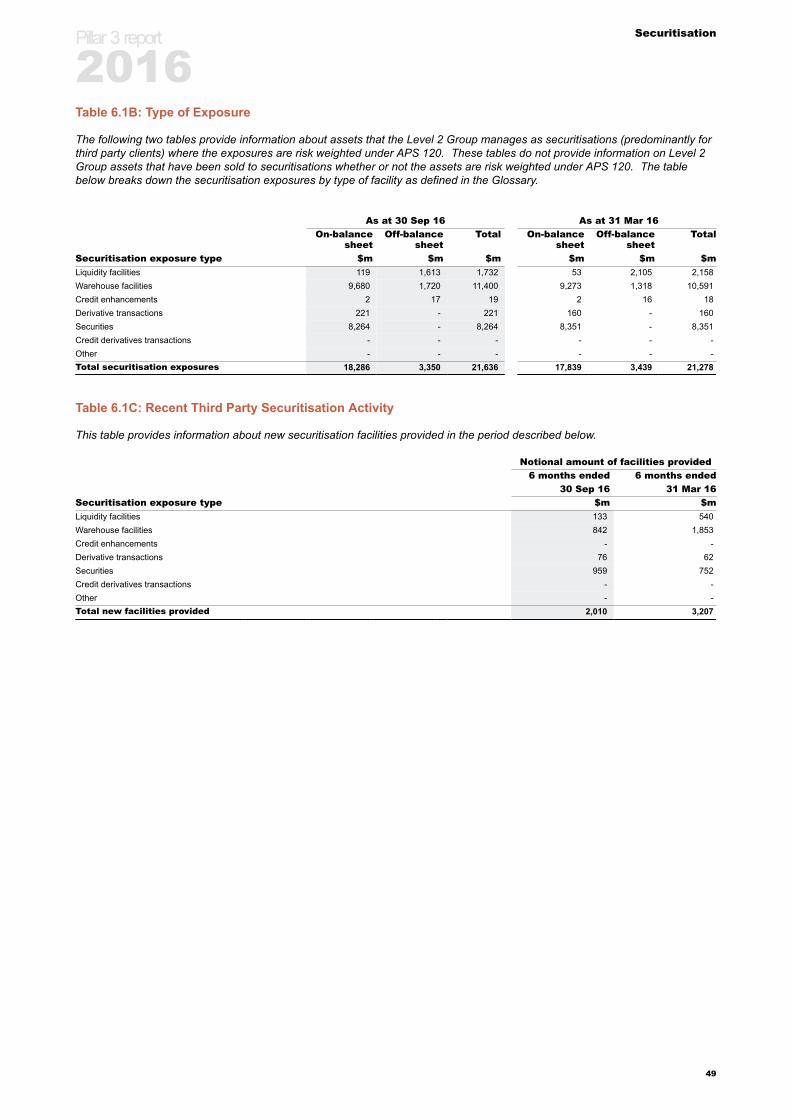
Securitisation
Table 6.1B: Type of Exposure
The following two tables provide information about assets that the Level 2 Group manages as securitisations (predominantly forthird party clients) where the exposures are risk weighted under APS 120. These tables do not provide information on Level 2Group assets that have been sold to securitisations whether or not the assets are risk weighted under APS 120. The tablebelow breaks down the securitisation exposures by type of facility as defined in the Glossary.
As at 30 Sep 16 As at 31 Mar 16On-balance
sheetOff-balance
sheetTotal On-balance
sheetOff-balance
sheetTotal
Securitisation exposure type $m $m $m $m $m $mLiquidity facilities 119 1,613 1,732 53 2,105 2,158Warehouse facilities 9,680 1,720 11,400 9,273 1,318 10,591Credit enhancements 2 17 19 2 16 18Derivative transactions 221 - 221 160 - 160Securities 8,264 - 8,264 8,351 - 8,351Credit derivatives transactions - - - - - -Other - - - - - -Total securitisation exposures 18,286 3,350 21,636 17,839 3,439 21,278
Table 6.1C: Recent Third Party Securitisation Activity
This table provides information about new securitisation facilities provided in the period described below.
Notional amount of facilities provided6 months ended 6 months ended
30 Sep 16 31 Mar 16Securitisation exposure type $m $mLiquidity facilities 133 540Warehouse facilities 842 1,853Credit enhancements - -Derivative transactions 76 62Securities 959 752Credit derivatives transactions - -Other - -Total new facilities provided 2,010 3,207
Pillar 3 report
2016
49
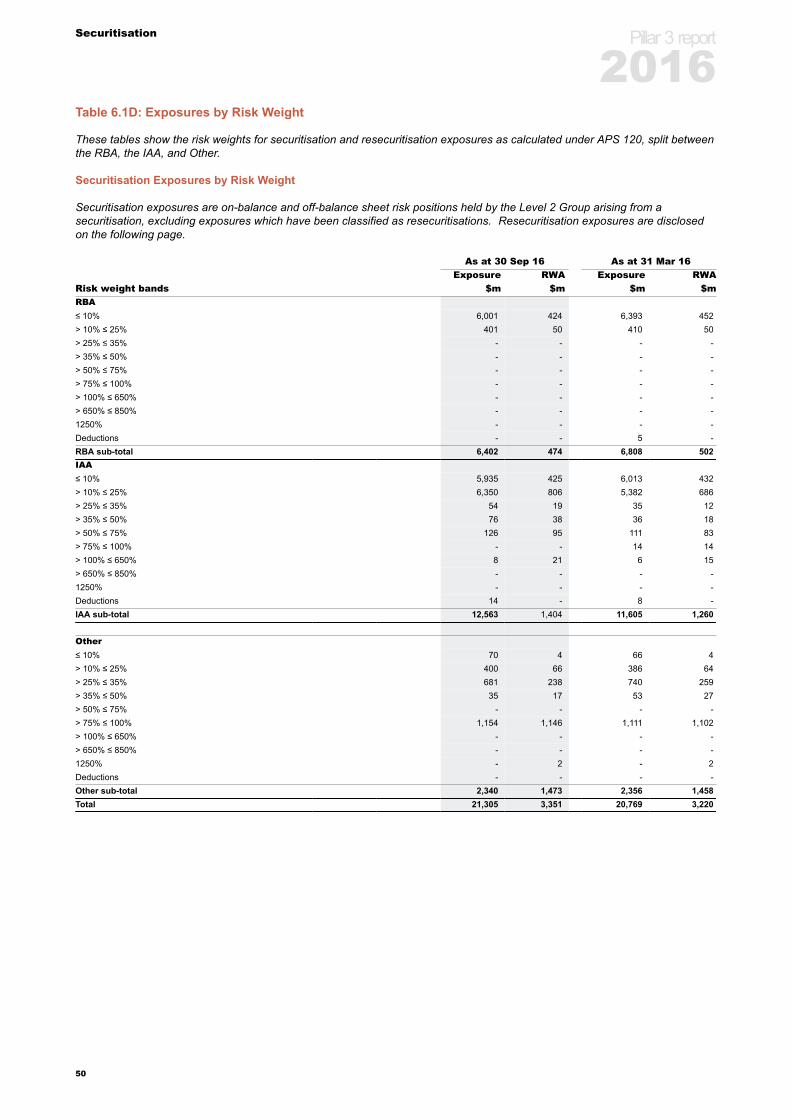
Securitisation
Table 6.1D: Exposures by Risk Weight
These tables show the risk weights for securitisation and resecuritisation exposures as calculated under APS 120, split betweenthe RBA, the IAA, and Other.
Securitisation Exposures by Risk Weight
Securitisation exposures are on-balance and off-balance sheet risk positions held by the Level 2 Group arising from asecuritisation, excluding exposures which have been classified as resecuritisations. Resecuritisation exposures are disclosedon the following page.
As at 30 Sep 16 As at 31 Mar 16Exposure RWA Exposure RWA
Risk weight bands $m $m $m $mRBA≤ 10% 6,001 424 6,393 452> 10% ≤ 25% 401 50 410 50> 25% ≤ 35% - - - -> 35% ≤ 50% - - - -> 50% ≤ 75% - - - -> 75% ≤ 100% - - - -> 100% ≤ 650% - - - -> 650% ≤ 850% - - - -1250% - - - -Deductions - - 5 -RBA sub-total 6,402 474 6,808 502IAA≤ 10% 5,935 425 6,013 432> 10% ≤ 25% 6,350 806 5,382 686> 25% ≤ 35% 54 19 35 12> 35% ≤ 50% 76 38 36 18> 50% ≤ 75% 126 95 111 83> 75% ≤ 100% - - 14 14> 100% ≤ 650% 8 21 6 15> 650% ≤ 850% - - - -1250% - - - -Deductions 14 - 8 -IAA sub-total 12,563 1,404 11,605 1,260
Other≤ 10% 70 4 66 4> 10% ≤ 25% 400 66 386 64> 25% ≤ 35% 681 238 740 259> 35% ≤ 50% 35 17 53 27> 50% ≤ 75% - - - -> 75% ≤ 100% 1,154 1,146 1,111 1,102> 100% ≤ 650% - - - -> 650% ≤ 850% - - - -1250% - 2 - 2Deductions - - - -Other sub-total 2,340 1,473 2,356 1,458Total 21,305 3,351 20,769 3,220
Pillar 3 report
2016
50
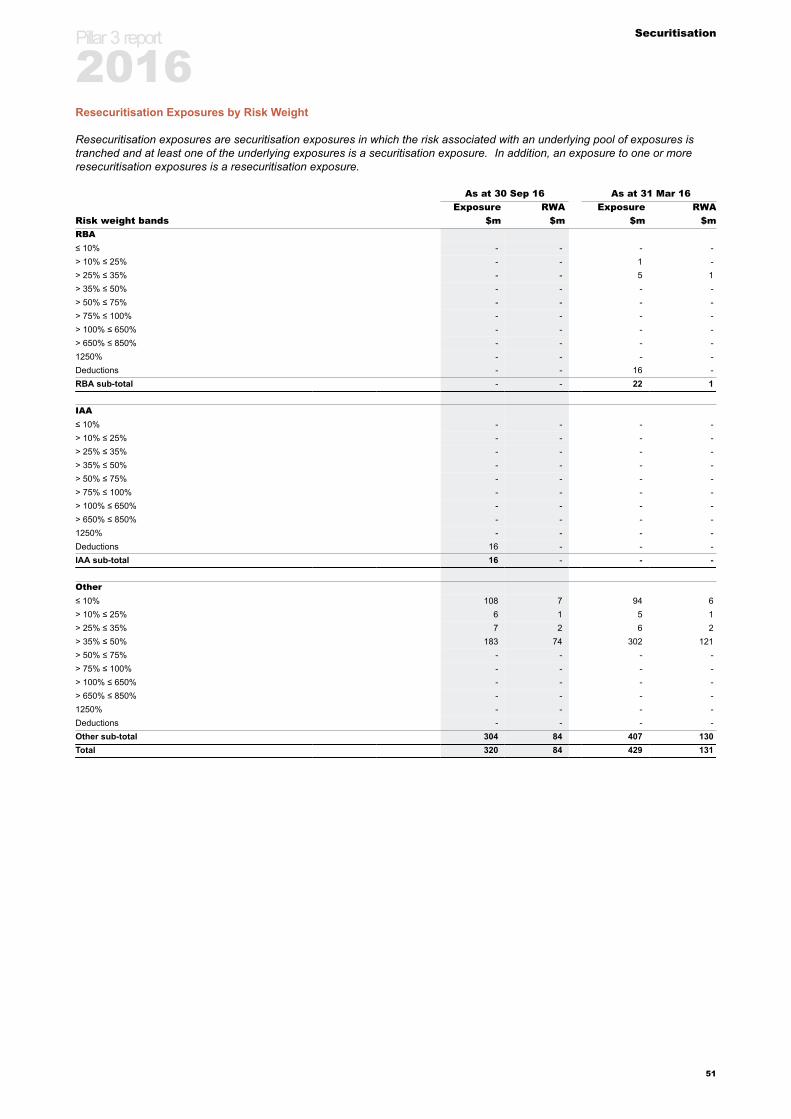
Securitisation
Resecuritisation Exposures by Risk Weight
Resecuritisation exposures are securitisation exposures in which the risk associated with an underlying pool of exposures istranched and at least one of the underlying exposures is a securitisation exposure. In addition, an exposure to one or moreresecuritisation exposures is a resecuritisation exposure.
As at 30 Sep 16 As at 31 Mar 16Exposure RWA Exposure RWA
Risk weight bands $m $m $m $mRBA≤ 10% - - - -> 10% ≤ 25% - - 1 -> 25% ≤ 35% - - 5 1> 35% ≤ 50% - - - -> 50% ≤ 75% - - - -> 75% ≤ 100% - - - -> 100% ≤ 650% - - - -> 650% ≤ 850% - - - -1250% - - - -Deductions - - 16 -RBA sub-total - - 22 1
IAA≤ 10% - - - -> 10% ≤ 25% - - - -> 25% ≤ 35% - - - -> 35% ≤ 50% - - - -> 50% ≤ 75% - - - -> 75% ≤ 100% - - - -> 100% ≤ 650% - - - -> 650% ≤ 850% - - - -1250% - - - -Deductions 16 - - -IAA sub-total 16 - - -
Other≤ 10% 108 7 94 6> 10% ≤ 25% 6 1 5 1> 25% ≤ 35% 7 2 6 2> 35% ≤ 50% 183 74 302 121> 50% ≤ 75% - - - -> 75% ≤ 100% - - - -> 100% ≤ 650% - - - -> 650% ≤ 850% - - - -1250% - - - -Deductions - - - -Other sub-total 304 84 407 130Total 320 84 429 131
Pillar 3 report
2016
51
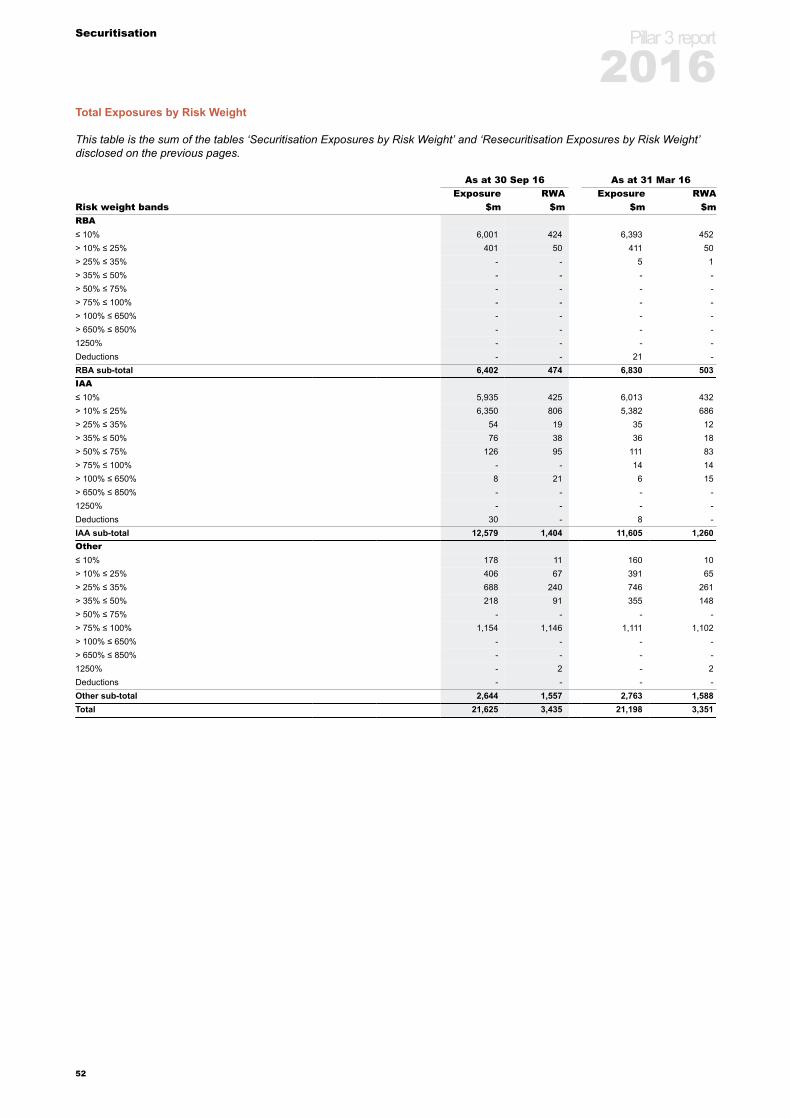
Securitisation
Total Exposures by Risk Weight
This table is the sum of the tables ‘Securitisation Exposures by Risk Weight’ and ‘Resecuritisation Exposures by Risk Weight’disclosed on the previous pages.
As at 30 Sep 16 As at 31 Mar 16Exposure RWA Exposure RWA
Risk weight bands $m $m $m $mRBA≤ 10% 6,001 424 6,393 452> 10% ≤ 25% 401 50 411 50> 25% ≤ 35% - - 5 1> 35% ≤ 50% - - - -> 50% ≤ 75% - - - -> 75% ≤ 100% - - - -> 100% ≤ 650% - - - -> 650% ≤ 850% - - - -1250% - - - -Deductions - - 21 -RBA sub-total 6,402 474 6,830 503IAA≤ 10% 5,935 425 6,013 432> 10% ≤ 25% 6,350 806 5,382 686> 25% ≤ 35% 54 19 35 12> 35% ≤ 50% 76 38 36 18> 50% ≤ 75% 126 95 111 83> 75% ≤ 100% - - 14 14> 100% ≤ 650% 8 21 6 15> 650% ≤ 850% - - - -1250% - - - -Deductions 30 - 8 -IAA sub-total 12,579 1,404 11,605 1,260Other≤ 10% 178 11 160 10> 10% ≤ 25% 406 67 391 65> 25% ≤ 35% 688 240 746 261> 35% ≤ 50% 218 91 355 148> 50% ≤ 75% - - - -> 75% ≤ 100% 1,154 1,146 1,111 1,102> 100% ≤ 650% - - - -> 650% ≤ 850% - - - -1250% - 2 - 2Deductions - - - -Other sub-total 2,644 1,557 2,763 1,588Total 21,625 3,435 21,198 3,351
Pillar 3 report
2016
52
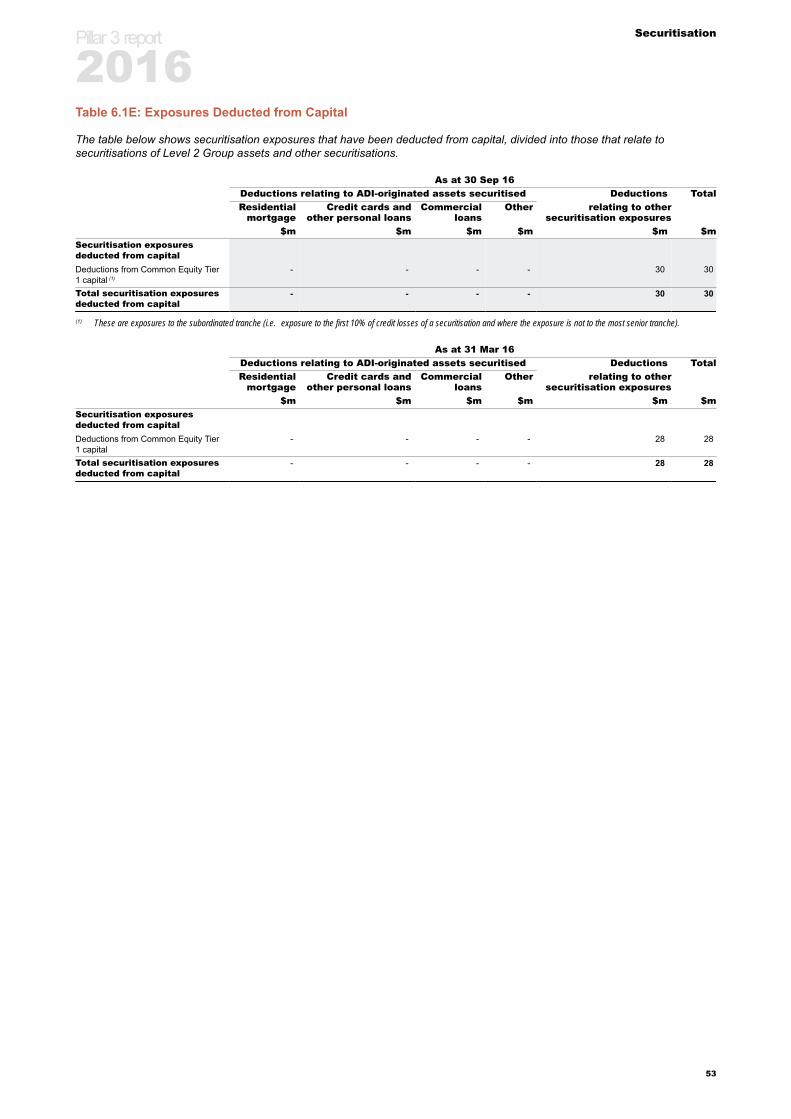
Securitisation
Table 6.1E: Exposures Deducted from Capital
The table below shows securitisation exposures that have been deducted from capital, divided into those that relate tosecuritisations of Level 2 Group assets and other securitisations.
As at 30 Sep 16Deductions relating to ADI-originated assets securitised Deductions TotalResidential
mortgageCredit cards and
other personal loansCommercial
loansOther relating to other
securitisation exposures$m $m $m $m $m $m
Securitisation exposuresdeducted from capitalDeductions from Common Equity Tier1 capital (1)
- - - - 30 30
Total securitisation exposuresdeducted from capital
- - - - 30 30
(1) These are exposures to the subordinated tranche (i.e. exposure to the first 10% of credit losses of a securitisation and where the exposure is not to the most senior tranche).
As at 31 Mar 16Deductions relating to ADI-originated assets securitised Deductions TotalResidential
mortgageCredit cards and
other personal loansCommercial
loansOther relating to other
securitisation exposures$m $m $m $m $m $m
Securitisation exposuresdeducted from capitalDeductions from Common Equity Tier1 capital
- - - - 28 28
Total securitisation exposuresdeducted from capital
- - - - 28 28
Pillar 3 report
2016
53

Securitisation
6.2 Level 2 Group Owned Securitised Assets
The Level 2 Group securitises its own assets for funding,liquidity risk and capital management purposes.
In doing this, the Level 2 Group acts as the originator,seller and servicer of assets from the Level 2 Group’sbalance sheet. This includes responsibility for collectinginterest and principal on the securitised assets. The Level2 Group may or may not retain an exposure tosecuritisation SPVs to which the Level 2 Group has soldassets. It may also manage or provide facilities for thesecuritisation (including credit enhancements, liquidity andfunding facilities), roles which are outlined in Section 6.1Third Party Securitisation.
This section includes information about the Level 2 Group'sinternal securitisation pools of residential mortgage-backedsecurities (RMBS). These securities have been developedas a source of contingent liquidity to support the Level 2Group's liquid asset holdings outlined in Section 9.1Funding and Liquidity Risk.
Structure and Organisation
GALCO and subsidiary ALCOs are responsible for theoversight of management’s performance, and of thecompliance and governance frameworks around balancesheet risks, including secured funding (which incorporatesowned asset securitisation).
The GBSLR Policy and GBSLR Secured Funding Standardset out the principles and control framework for securedfunding. Among other forms of secured funding, it appliesto traditional securitisation, synthetic securitisation and acombination of the two.
The risk appetite for secured funding is reviewed annuallyand is set as part of the Level 2 Group Annual FundingPlan, approved by the Board.
Management
Securitisation exposures, risks and capital must complywith the requirements outlined in APS 120. Compliancewith the requirements of APS 120 is achieved throughensuring that the Level 2 Group:
• deals with the SPV and its investors on an arm’s lengthbasis and on market terms and conditions
• clearly discloses the nature and limitations of itsinvolvement in a securitisation
• takes the necessary precautions to ensure that theLevel 2 Group does not give the perception that it willsupport a securitisation that is in excess of its explicitcontractual obligations (i.e. implicit support).
The Level 2 Group and subsidiary Treasuries haveresponsibility for the management of secured funding,including:
• secured funding strategy and plan development,incorporating the setting of funding indices and securedfunding targets (forming part of the Annual FundingPlan)
• execution of securitisation transactions• ongoing management of securitisation transactions.
At the Level 2 Group level, Group Treasury is alsoresponsible for the oversight of secured funding plans andstrategies, and for ensuring that activities across the Level2 Group are coordinated and Level 2 Group objectives areachieved.
The GBSLR team are responsible for the independentoversight of secured funding execution and managementconducted by the Level 2 Group and SubsidiaryTreasuries, and monitoring secured funding activity toensure it is conducted within the requirements of the Level2 Group’s secured funding framework and policies.
Measurement
The Level 2 Group's measurement framework for ownasset securitisation is consistent with the frameworkoutlined in Section 6.1 Third Party Securitisation. Businessunit finance and risk functions perform regularmeasurement and reporting in relation to owned assetsecuritisation, including the impact on capital, provisioning,outstanding issuance and run-off. BNZ is also governedby local regulatory requirements and reports its ownedasset securitisation to the RBNZ using its local regulatorymethodology.
Monitoring and Reporting
Reporting is conducted periodically including:
• pool performance for each securitisation transaction• investor and regulatory reporting• rating agency and financial reporting• funding plan updates to GALCO and subsidiary ALCOs.
Any key issues arising are also presented to the GRRMCand BRC each month via the GCRO report.
Accounting Treatment
Through its securitisation program, the Level 2 Groupengages in two main activities:
• it packages and sells loans (principally housingmortgage loans) and other finance receivables assecurities to investors through a series of securitisationvehicles
• it develops securities as a source of contingent liquidityto support the Level 2 Group's liquid asset holdings.
The Level 2 Group is entitled to any residual income of thesecuritisation SPVs after all payments to investors andcosts of the program have been met.
The Level 2 Group is considered to hold the majority of theresidual risks and benefits within the securitisation SPVsand all relevant financial assets continue to be held on theLevel 2 Group balance sheet. A liability is recognised forthe proceeds of the funding transaction. The transactionsare therefore considered financings rather than sales.
Pillar 3 report
2016
54
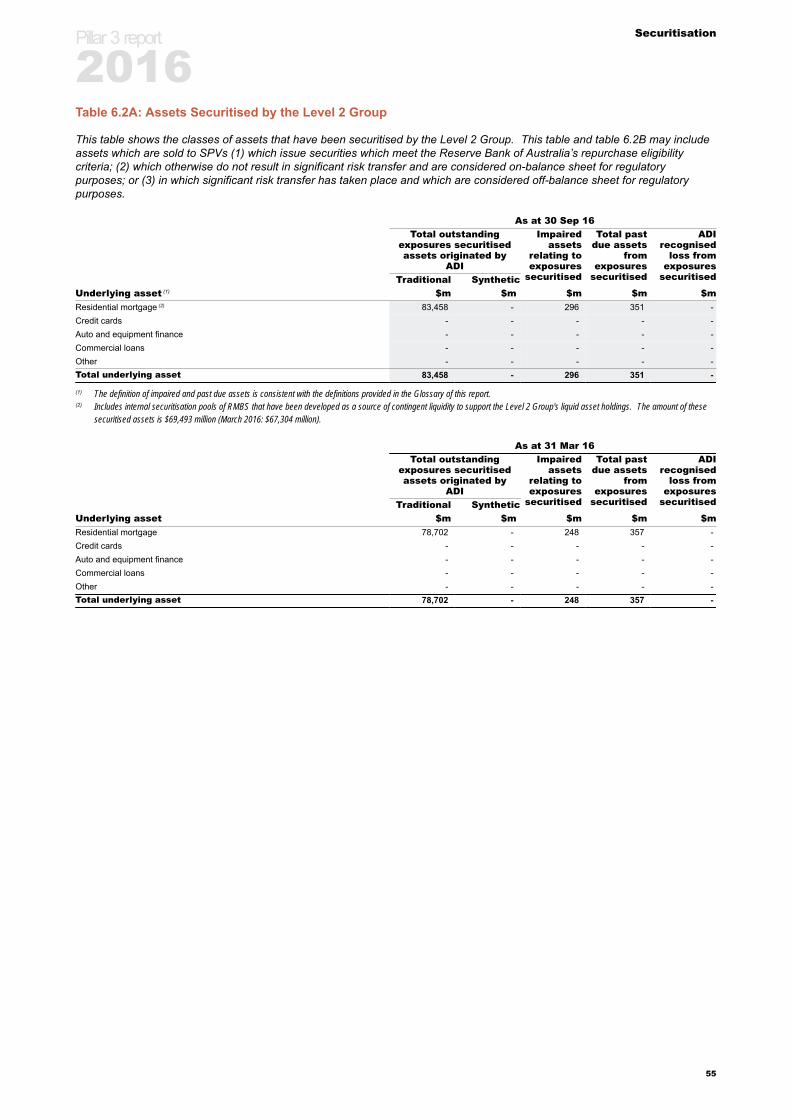
Securitisation
Table 6.2A: Assets Securitised by the Level 2 Group
This table shows the classes of assets that have been securitised by the Level 2 Group. This table and table 6.2B may includeassets which are sold to SPVs (1) which issue securities which meet the Reserve Bank of Australia’s repurchase eligibilitycriteria; (2) which otherwise do not result in significant risk transfer and are considered on-balance sheet for regulatorypurposes; or (3) in which significant risk transfer has taken place and which are considered off-balance sheet for regulatorypurposes.
As at 30 Sep 16Total outstanding
exposures securitisedassets originated by
ADI
Impairedassets
relating toexposures
securitised
Total pastdue assets
fromexposures
securitised
ADIrecognised
loss fromexposures
securitisedTraditional SyntheticUnderlying asset (1) $m $m $m $m $mResidential mortgage (2) 83,458 - 296 351 -Credit cards - - - - -Auto and equipment finance - - - - -Commercial loans - - - - -Other - - - - -Total underlying asset 83,458 - 296 351 -
(1) The definition of impaired and past due assets is consistent with the definitions provided in the Glossary of this report.(2) Includes internal securitisation pools of RMBS that have been developed as a source of contingent liquidity to support the Level 2 Group's liquid asset holdings. The amount of these
securitised assets is $69,493 million (March 2016: $67,304 million).
As at 31 Mar 16Total outstanding
exposures securitisedassets originated by
ADI
Impairedassets
relating toexposures
securitised
Total pastdue assets
fromexposures
securitised
ADIrecognised
loss fromexposures
securitisedTraditional SyntheticUnderlying asset $m $m $m $m $mResidential mortgage 78,702 - 248 357 -Credit cards - - - - -Auto and equipment finance - - - - -Commercial loans - - - - -Other - - - - -Total underlying asset 78,702 - 248 357 -
Pillar 3 report
2016
55
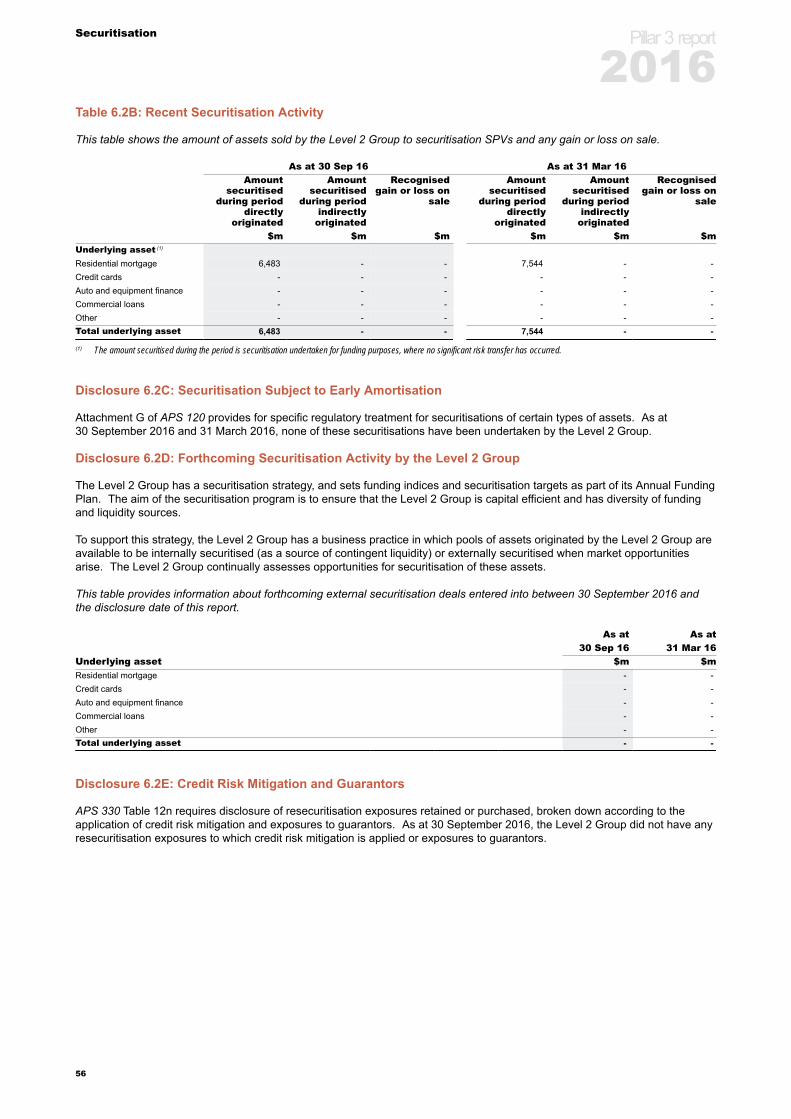
Securitisation
Table 6.2B: Recent Securitisation Activity
This table shows the amount of assets sold by the Level 2 Group to securitisation SPVs and any gain or loss on sale.
As at 30 Sep 16 As at 31 Mar 16Amount
securitisedduring period
directlyoriginated
Amountsecuritised
during periodindirectly
originated
Recognisedgain or loss on
sale
Amountsecuritised
during perioddirectly
originated
Amountsecuritised
during periodindirectly
originated
Recognisedgain or loss on
sale
$m $m $m $m $m $mUnderlying asset (1)
Residential mortgage 6,483 - - 7,544 - -Credit cards - - - - - -Auto and equipment finance - - - - - -Commercial loans - - - - - -Other - - - - - -Total underlying asset 6,483 - - 7,544 - -
(1) The amount securitised during the period is securitisation undertaken for funding purposes, where no significant risk transfer has occurred.
Disclosure 6.2C: Securitisation Subject to Early Amortisation
Attachment G of APS 120 provides for specific regulatory treatment for securitisations of certain types of assets. As at30 September 2016 and 31 March 2016, none of these securitisations have been undertaken by the Level 2 Group.
Disclosure 6.2D: Forthcoming Securitisation Activity by the Level 2 Group
The Level 2 Group has a securitisation strategy, and sets funding indices and securitisation targets as part of its Annual FundingPlan. The aim of the securitisation program is to ensure that the Level 2 Group is capital efficient and has diversity of fundingand liquidity sources.
To support this strategy, the Level 2 Group has a business practice in which pools of assets originated by the Level 2 Group areavailable to be internally securitised (as a source of contingent liquidity) or externally securitised when market opportunitiesarise. The Level 2 Group continually assesses opportunities for securitisation of these assets.
This table provides information about forthcoming external securitisation deals entered into between 30 September 2016 andthe disclosure date of this report.
As at As at30 Sep 16 31 Mar 16
Underlying asset $m $mResidential mortgage - -Credit cards - -Auto and equipment finance - -Commercial loans - -Other - -Total underlying asset - -
Disclosure 6.2E: Credit Risk Mitigation and Guarantors
APS 330 Table 12n requires disclosure of resecuritisation exposures retained or purchased, broken down according to theapplication of credit risk mitigation and exposures to guarantors. As at 30 September 2016, the Level 2 Group did not have anyresecuritisation exposures to which credit risk mitigation is applied or exposures to guarantors.
Pillar 3 report
2016
56

Market Risk
Section 7
Market Risk
Introduction
The Level 2 Group makes a distinction between traded andnon-traded market risks for the purpose of managingmarket risk. This section relates to traded market risk.Non-traded market risk is discussed in Section 9 BalanceSheet and Liquidity Risk.
The Level 2 Group undertakes trading activities to supportits clients and to profit in the short term from differences inmarkets, such as interest rates, foreign exchange rates,commodity prices, equity prices and credit spreads.Traded market risk is the potential for losses or gains toarise from trading activities undertaken by the Level 2Group as a result of the movement of market prices.
The Level 2 Group’s exposure to market risk arises out ofits trading activities which are principally carried out byProduct & Markets Fixed Income, Currencies &Commodities (FICC) and BNZ. This exposure is quantifiedfor regulatory capital purposes using both the APRA-approved internal model approach and the standardmethod, details of which are provided below.
Other business units within the Level 2 Group do notconduct trading books.
Management and Governance
The Level 2 Group’s risk appetite in relation to market riskis determined by the Board and is expressed in the NABGroup Risk Appetite Statement, and governed by theTraded Market Risk Policy and Standards.
The Market Risk Appetite Statement complements theNAB Group Risk Appetite Statement by providing furtherdepth on the allocation of risk appetite to asset classes,regions and trading desks as well as detailing permittedproducts and markets.
The overall framework of Traded Market Risk Policy,Standards and the Risk Appetite Statement providedirection for the monitoring, oversight, escalation andgovernance of traded market risk including delegatedauthorities, risk measurement, and reporting and controlstandards. These policies are consistent with theprudential regulatory requirements.
The market risk profile of the NAB Group is overseen bythe senior executive management of the NAB Group viathe BRC, GRRMC, Group Credit & Market Risk Committee(GCMRC), and Product & Markets Risk ManagementCommittee (P&M RMC).
The Product & Markets Market Risk Sub-committee (P&MMRSC) manages market risk with the followingresponsibilities:
• designing and implementing of policies and proceduresto ensure market risk is managed within the appetite setby the Board
• reviewing market risks for consistency with approvedmarket risk settings and the NAB Group’s Risk Appetite
• overseeing the effectiveness and appropriateness of therisk management framework
• reviewing and approving models• escalating market risk issues to the higher committees
as necessary.
Group Market Risk is an independent unit, separate fromthe trading activities units, with responsibility for the dailymeasurement and monitoring of market risk exposures.Group Market Risk has the following key controls in placefor effective internal management as well as compliancewith the prudential requirements:
• trading authorities and responsibilities are defined andmonitored at all levels
• a comprehensive and controlled framework of riskreporting and limit breach management
• new product approval process and usage authoritypermitting desk to transact a particular product
• daily end of day and intra-day risk oversight as well asperiodic desk review
• backtesting of VaR results under internal models forcapital adequacy
• segregation of duties in the origination, processing, andvaluation of transactions operated under clear andindependent reporting lines
• regular and effective reporting of market risk toexecutive management and the Board
• periodic review and update of compliance with internaland regulatory policies
• independent and periodic internal audit review ofcompliance with policies, procedures, process andlimits.
Key methodologies for compliance with the prudentialrequirements for positions held in the trading book are:
• models that are used to determine risk and financialprofit and loss for the NAB Group are independentlyvalidated with the review outcome documented andreported to P&M MRSC on a regular basis
• all trades are fairly valued daily using independentlysourced and validated rates in accordance with FinanceRates and Revaluation Policy
• use of Model Reserve Framework and Fair ValueAdjustments to support compliance with prudentialvalidations.
Measurement
VaR estimates the likelihood that a given portfolio’s losseswill exceed a certain amount. The Level 2 Group usesVaR estimates for both regulatory capital calculations inaccordance with Prudential Standard APS 116 CapitalAdequacy: Market Risk, and for internal risk controlpurposes.
The Level 2 Group is accredited by APRA to use ahistorical simulation model to simulate the daily change inmarket factors. VaR is calculated for all trades on anindividual basis using a full revaluation approach. Forcapital purposes, VaR for products modelled using theInternal Model is calculated in Australian dollars on a
Pillar 3 report
2016
57

Market Risk
globally diversified basis in accordance with the followingparameters:
• confidence level - 99 per cent one tail• holding period - 10 days (1 day VaR scaled by square
root of time)• observation period - 550 days (unweighted, updated
daily).
VaR limits are assigned to individual trading desks andregions or product lines in accordance with the Market RiskAppetite Statement.
Group Market Risk monitors positions daily against therelevant limits and escalates any breaches in accordancewith Market Risk standards and procedures. Additionally,Group Market Risk performs backtesting analysis toassess the validity of the VaR numbers when compared tothe actual and hypothetical trading outcomes and toescalate any anomalies that may arise. Results of thebacktesting are overseen by the P&M MRSC.
Stressed VaR is calculated using the same methodologyas VaR but with an observation period based on a one-year period of significant market volatility.
Stress testing is carried out daily to test the profit and lossimplications of extreme but plausible scenarios, and also toreveal hidden sensitivities in the portfolio that only becometransparent when modelling extreme market moves.
‘Stop loss limits’ represent trigger points at which anovernight or accumulated loss incurred by a trading deskwould lead to escalation in accordance with agreedprocedures.
Sensitivity and other market risk limits are set by GroupMarket Risk to manage market risk at a more granularlevel, for example to manage concentration risk. Theselimits are monitored by Product & Markets FICC andindependently by Group Market Risk.
Product & Markets FICC are responsible for managing risk,in order to deliver profits, while ensuring compliance withall limits and policies.
Capital Methodology
As detailed in the following table, the Level 2 Group isaccredited by APRA to use the Internal Model Approach(IMA) under APS116 for all trading asset classes except forspecific interest rate risk, equities, carbon, and someforeign exchange risk from banking book portfolios. Theseasset classes are managed with regulatory capitalcalculated as an add-on to that from IMA. There are twotypes of market risk measures related to regulatory capital:
• general market risk which is related to changes in theoverall market prices
• specific market risk which is related to changes for thespecific issuer.
In accordance with APS 110, the RWA equivalent fortraded market risk using the IMA is the capital requirementmultiplied by 12.5.
Pillar 3 report
2016
58
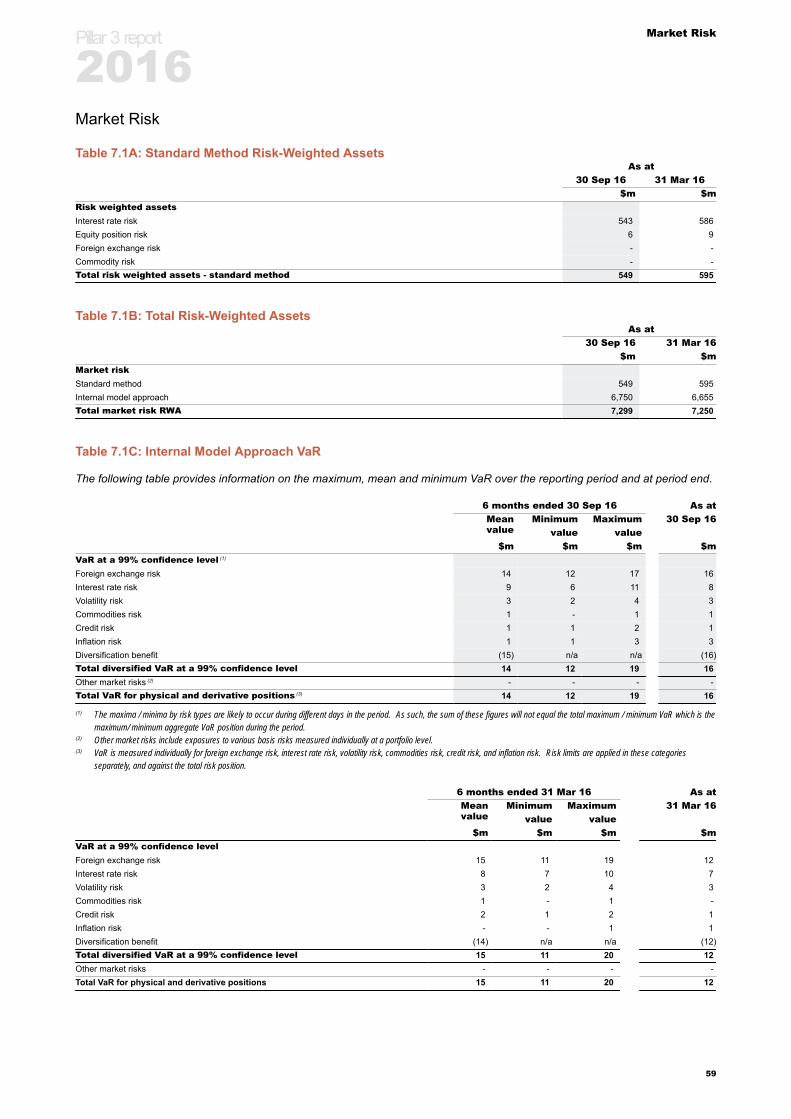
Market Risk
Market Risk
Table 7.1A: Standard Method Risk-Weighted AssetsAs at
30 Sep 16 31 Mar 16$m $m
Risk weighted assetsInterest rate risk 543 586Equity position risk 6 9Foreign exchange risk - -Commodity risk - -Total risk weighted assets - standard method 549 595
Table 7.1B: Total Risk-Weighted AssetsAs at
30 Sep 16 31 Mar 16$m $m
Market riskStandard method 549 595Internal model approach 6,750 6,655Total market risk RWA 7,299 7,250
Table 7.1C: Internal Model Approach VaR
The following table provides information on the maximum, mean and minimum VaR over the reporting period and at period end.
6 months ended 30 Sep 16 As atMeanvalue
Minimum Maximum 30 Sep 16value value
$m $m $m $mVaR at a 99% confidence level (1)
Foreign exchange risk 14 12 17 16Interest rate risk 9 6 11 8Volatility risk 3 2 4 3Commodities risk 1 - 1 1Credit risk 1 1 2 1Inflation risk 1 1 3 3Diversification benefit (15) n/a n/a (16)Total diversified VaR at a 99% confidence level 14 12 19 16Other market risks (2) - - - -Total VaR for physical and derivative positions (3) 14 12 19 16
(1) The maxima / minima by risk types are likely to occur during different days in the period. As such, the sum of these figures will not equal the total maximum / minimum VaR which is themaximum/ minimum aggregate VaR position during the period.
(2) Other market risks include exposures to various basis risks measured individually at a portfolio level.(3) VaR is measured individually for foreign exchange risk, interest rate risk, volatility risk, commodities risk, credit risk, and inflation risk. Risk limits are applied in these categories
separately, and against the total risk position.
6 months ended 31 Mar 16 As atMeanvalue
Minimum Maximum 31 Mar 16value value
$m $m $m $mVaR at a 99% confidence levelForeign exchange risk 15 11 19 12Interest rate risk 8 7 10 7Volatility risk 3 2 4 3Commodities risk 1 - 1 -Credit risk 2 1 2 1Inflation risk - - 1 1Diversification benefit (14) n/a n/a (12)Total diversified VaR at a 99% confidence level 15 11 20 12Other market risks - - - -Total VaR for physical and derivative positions 15 11 20 12
Pillar 3 report
2016
59
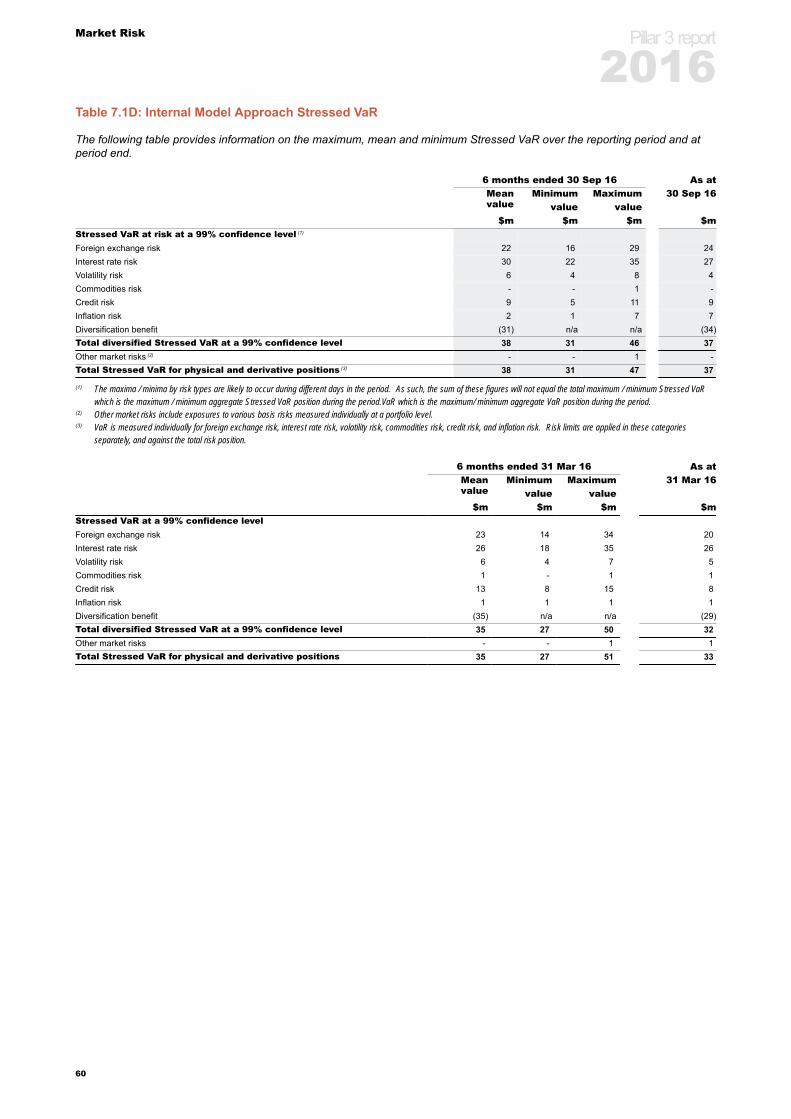
Market Risk
Table 7.1D: Internal Model Approach Stressed VaR
The following table provides information on the maximum, mean and minimum Stressed VaR over the reporting period and atperiod end.
6 months ended 30 Sep 16 As atMeanvalue
Minimum Maximum 30 Sep 16value value
$m $m $m $mStressed VaR at risk at a 99% confidence level (1)
Foreign exchange risk 22 16 29 24Interest rate risk 30 22 35 27Volatility risk 6 4 8 4Commodities risk - - 1 -Credit risk 9 5 11 9Inflation risk 2 1 7 7Diversification benefit (31) n/a n/a (34)Total diversified Stressed VaR at a 99% confidence level 38 31 46 37Other market risks (2) - - 1 -Total Stressed VaR for physical and derivative positions (3) 38 31 47 37
(1) The maxima / minima by risk types are likely to occur during different days in the period. As such, the sum of these figures will not equal the total maximum / minimum Stressed VaRwhich is the maximum / minimum aggregate Stressed VaR position during the period.VaR which is the maximum/ minimum aggregate VaR position during the period.
(2) Other market risks include exposures to various basis risks measured individually at a portfolio level.(3) VaR is measured individually for foreign exchange risk, interest rate risk, volatility risk, commodities risk, credit risk, and inflation risk. Risk limits are applied in these categories
separately, and against the total risk position.
6 months ended 31 Mar 16 As atMeanvalue
Minimum Maximum 31 Mar 16value value
$m $m $m $mStressed VaR at a 99% confidence levelForeign exchange risk 23 14 34 20Interest rate risk 26 18 35 26Volatility risk 6 4 7 5Commodities risk 1 - 1 1Credit risk 13 8 15 8Inflation risk 1 1 1 1Diversification benefit (35) n/a n/a (29)Total diversified Stressed VaR at a 99% confidence level 35 27 50 32Other market risks - - 1 1Total Stressed VaR for physical and derivative positions 35 27 51 33
Pillar 3 report
2016
60
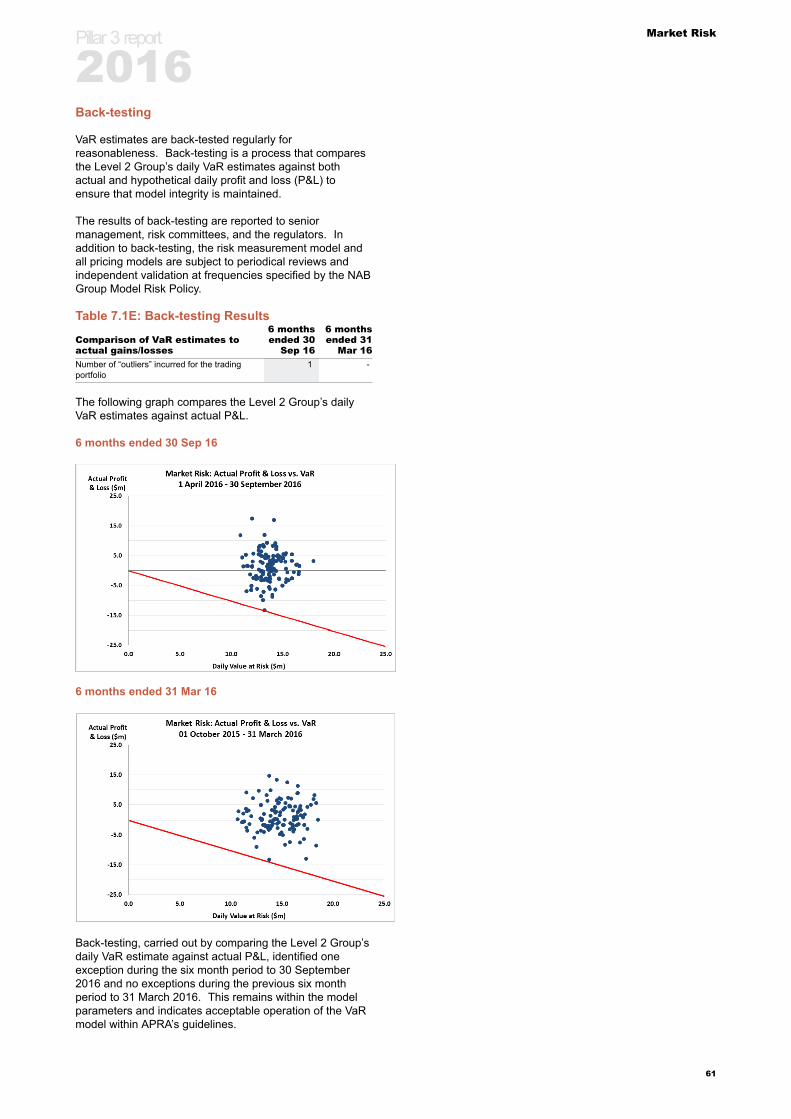
Market Risk
Back-testing
VaR estimates are back-tested regularly forreasonableness. Back-testing is a process that comparesthe Level 2 Group’s daily VaR estimates against bothactual and hypothetical daily profit and loss (P&L) toensure that model integrity is maintained.
The results of back-testing are reported to seniormanagement, risk committees, and the regulators. Inaddition to back-testing, the risk measurement model andall pricing models are subject to periodical reviews andindependent validation at frequencies specified by the NABGroup Model Risk Policy.
Table 7.1E: Back-testing Results
Comparison of VaR estimates toactual gains/losses
6 monthsended 30
Sep 16
6 monthsended 31
Mar 16Number of “outliers” incurred for the tradingportfolio
1 -
The following graph compares the Level 2 Group’s dailyVaR estimates against actual P&L.
6 months ended 30 Sep 16
6 months ended 31 Mar 16
Back-testing, carried out by comparing the Level 2 Group’sdaily VaR estimate against actual P&L, identified oneexception during the six month period to 30 September2016 and no exceptions during the previous six monthperiod to 31 March 2016. This remains within the modelparameters and indicates acceptable operation of the VaRmodel within APRA’s guidelines.
Pillar 3 report
2016
61
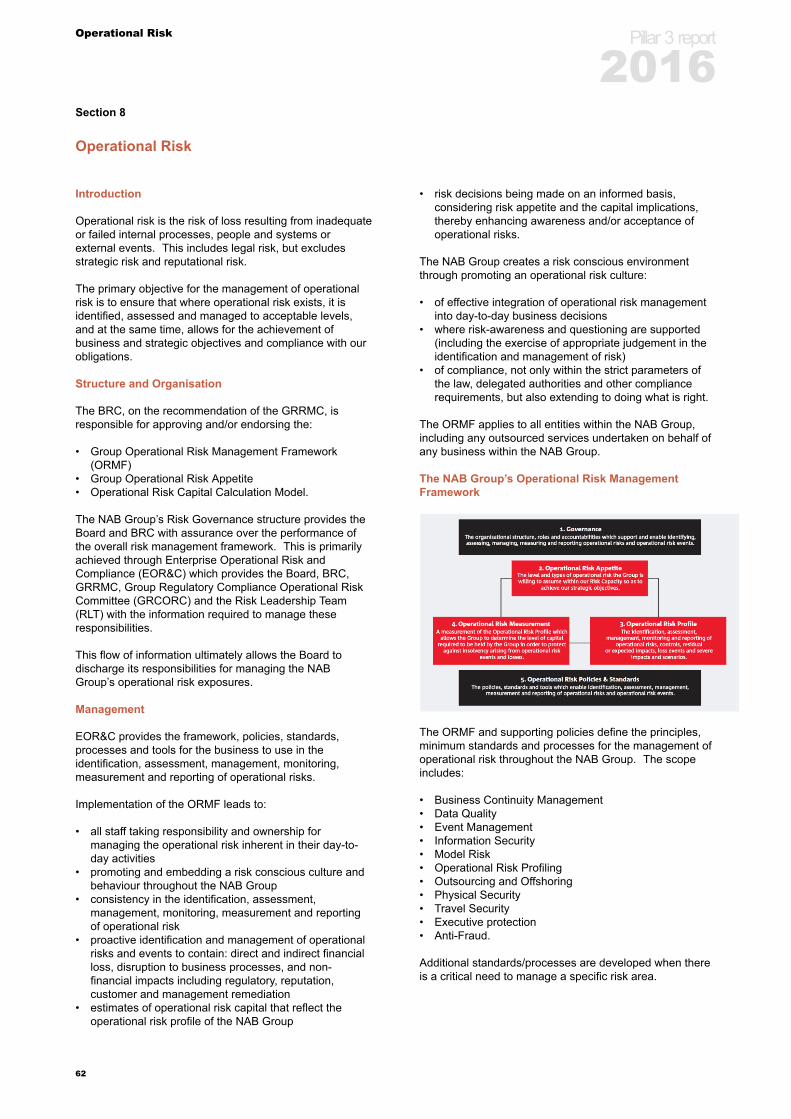
Operational Risk
Section 8
Operational Risk
Introduction
Operational risk is the risk of loss resulting from inadequateor failed internal processes, people and systems orexternal events. This includes legal risk, but excludesstrategic risk and reputational risk.
The primary objective for the management of operationalrisk is to ensure that where operational risk exists, it isidentified, assessed and managed to acceptable levels,and at the same time, allows for the achievement ofbusiness and strategic objectives and compliance with ourobligations.
Structure and Organisation
The BRC, on the recommendation of the GRRMC, isresponsible for approving and/or endorsing the:
• Group Operational Risk Management Framework(ORMF)
• Group Operational Risk Appetite• Operational Risk Capital Calculation Model.
The NAB Group’s Risk Governance structure provides theBoard and BRC with assurance over the performance ofthe overall risk management framework. This is primarilyachieved through Enterprise Operational Risk andCompliance (EOR&C) which provides the Board, BRC,GRRMC, Group Regulatory Compliance Operational RiskCommittee (GRCORC) and the Risk Leadership Team(RLT) with the information required to manage theseresponsibilities.
This flow of information ultimately allows the Board todischarge its responsibilities for managing the NABGroup’s operational risk exposures.
Management
EOR&C provides the framework, policies, standards,processes and tools for the business to use in theidentification, assessment, management, monitoring,measurement and reporting of operational risks.
Implementation of the ORMF leads to:
• all staff taking responsibility and ownership formanaging the operational risk inherent in their day-to-day activities
• promoting and embedding a risk conscious culture andbehaviour throughout the NAB Group
• consistency in the identification, assessment,management, monitoring, measurement and reportingof operational risk
• proactive identification and management of operationalrisks and events to contain: direct and indirect financialloss, disruption to business processes, and non-financial impacts including regulatory, reputation,customer and management remediation
• estimates of operational risk capital that reflect theoperational risk profile of the NAB Group
• risk decisions being made on an informed basis,considering risk appetite and the capital implications,thereby enhancing awareness and/or acceptance ofoperational risks.
The NAB Group creates a risk conscious environmentthrough promoting an operational risk culture:
• of effective integration of operational risk managementinto day-to-day business decisions
• where risk-awareness and questioning are supported(including the exercise of appropriate judgement in theidentification and management of risk)
• of compliance, not only within the strict parameters ofthe law, delegated authorities and other compliancerequirements, but also extending to doing what is right.
The ORMF applies to all entities within the NAB Group,including any outsourced services undertaken on behalf ofany business within the NAB Group.
The NAB Group’s Operational Risk ManagementFramework
The ORMF and supporting policies define the principles,minimum standards and processes for the management ofoperational risk throughout the NAB Group. The scopeincludes:
• Business Continuity Management• Data Quality• Event Management• Information Security• Model Risk• Operational Risk Profiling• Outsourcing and Offshoring• Physical Security• Travel Security• Executive protection• Anti-Fraud.
Additional standards/processes are developed when thereis a critical need to manage a specific risk area.
Pillar 3 report
2016
62
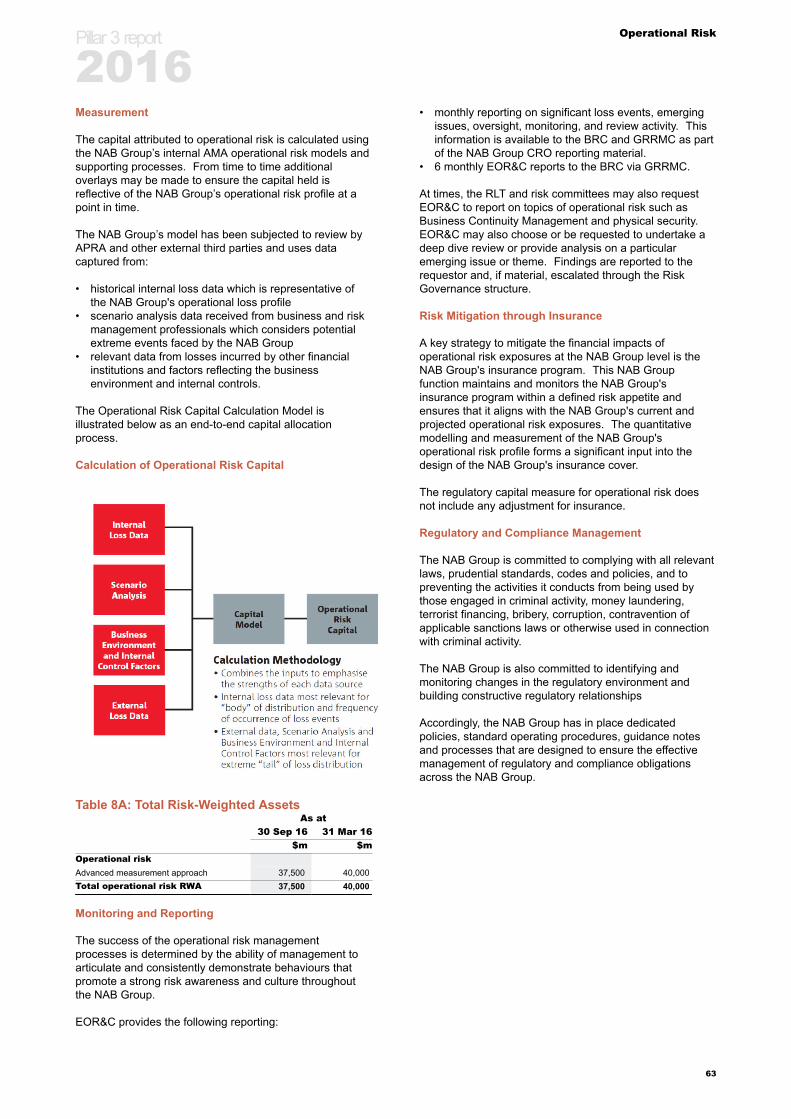
Operational Risk
Measurement
The capital attributed to operational risk is calculated usingthe NAB Group’s internal AMA operational risk models andsupporting processes. From time to time additionaloverlays may be made to ensure the capital held isreflective of the NAB Group’s operational risk profile at apoint in time.
The NAB Group’s model has been subjected to review byAPRA and other external third parties and uses datacaptured from:
• historical internal loss data which is representative ofthe NAB Group's operational loss profile
• scenario analysis data received from business and riskmanagement professionals which considers potentialextreme events faced by the NAB Group
• relevant data from losses incurred by other financialinstitutions and factors reflecting the businessenvironment and internal controls.
The Operational Risk Capital Calculation Model isillustrated below as an end-to-end capital allocationprocess.
Calculation of Operational Risk Capital
Table 8A: Total Risk-Weighted AssetsAs at
30 Sep 16 31 Mar 16$m $m
Operational riskAdvanced measurement approach 37,500 40,000Total operational risk RWA 37,500 40,000
Monitoring and Reporting
The success of the operational risk managementprocesses is determined by the ability of management toarticulate and consistently demonstrate behaviours thatpromote a strong risk awareness and culture throughoutthe NAB Group.
EOR&C provides the following reporting:
• monthly reporting on significant loss events, emergingissues, oversight, monitoring, and review activity. Thisinformation is available to the BRC and GRRMC as partof the NAB Group CRO reporting material.
• 6 monthly EOR&C reports to the BRC via GRRMC.
At times, the RLT and risk committees may also requestEOR&C to report on topics of operational risk such asBusiness Continuity Management and physical security.EOR&C may also choose or be requested to undertake adeep dive review or provide analysis on a particularemerging issue or theme. Findings are reported to therequestor and, if material, escalated through the RiskGovernance structure.
Risk Mitigation through Insurance
A key strategy to mitigate the financial impacts ofoperational risk exposures at the NAB Group level is theNAB Group's insurance program. This NAB Groupfunction maintains and monitors the NAB Group'sinsurance program within a defined risk appetite andensures that it aligns with the NAB Group's current andprojected operational risk exposures. The quantitativemodelling and measurement of the NAB Group'soperational risk profile forms a significant input into thedesign of the NAB Group's insurance cover.
The regulatory capital measure for operational risk doesnot include any adjustment for insurance.
Regulatory and Compliance Management
The NAB Group is committed to complying with all relevantlaws, prudential standards, codes and policies, and topreventing the activities it conducts from being used bythose engaged in criminal activity, money laundering,terrorist financing, bribery, corruption, contravention ofapplicable sanctions laws or otherwise used in connectionwith criminal activity.
The NAB Group is also committed to identifying andmonitoring changes in the regulatory environment andbuilding constructive regulatory relationships
Accordingly, the NAB Group has in place dedicatedpolicies, standard operating procedures, guidance notesand processes that are designed to ensure the effectivemanagement of regulatory and compliance obligationsacross the NAB Group.
Pillar 3 report
2016
63

Balance Sheet and Liquidity Risk
Section 9
Balance Sheet and Liquidity Risk
Balance Sheet and Liquidity Risk (BSLR) is primarilyconcerned with the management of various structural, non-traded market risks within the Level 2 Group’s balancesheet. Non-traded market risk arises from the Level 2Group’s banking book activity and includes capital risk,non-traded equity risk, interest rate risk, funding risk(secured and unsecured), liquidity risk and foreignexchange risk.
Structure and Organisation
The Board approved risk appetite limits are outlined in theGBSLR Policy, ancillary Standards and Limits Schedule,which provide direction for the management,measurement, monitoring, oversight, reporting andgovernance of non-traded market risks. The BRCapproves the GBSLR Policy.
The BRC and GRRMC receive regular reporting onbalance sheet management activities, along with monthlyreporting of non-traded market risk compliance and activity.
The GALCO and subsidiary ALCOs review riskmanagement strategies, compliance with risk limits andcontrols and remedial action undertaken for limit breaches.They approve the GBSLR Standards and models relatingto balance sheet and non-traded market risks.
With the exception of non-traded equity risk, the Level 2Group and relevant subsidiary Treasuries are responsiblefor the management of non-traded market risks. For non-traded equity risk, individual business lines that have beenallocated equity risk limits are responsible for managingtheir risk exposures.
GBSLR and subsidiary BSLR teams provide independentoperational oversight over the non-traded market riskframework. GBSLR is the owner of the GBSLR Policy andancillary Standards and oversees the operation of APRAapproved models to meet regulatory requirements.
Further information on the management ofGBSLR is included in the following sections of this report:
• section 4.1 Capital Adequacy• section 6.2 Level 2 Group Owned Securitised Assets• section 9.1 Funding and Liquidity Risk• section 9.2 Interest Rate Risk in the Banking Book• section 9.3 Equities Banking Book Position• section 9.4 Foreign Exchange Risk in the Banking Book
Pillar 3 report
2016
64

Balance Sheet and Liquidity Risk
9.1 Funding and Liquidity Risk
Introduction
Liquidity risk is the risk of the NAB Group being unable tomeet its financial obligations as they fall due. Theseobligations primarily include the repayment of deposits andthe repayment of borrowings and loan capital as theymature.
Funding risk is the risk which arises due to change inappetite and capacity of the market to provide adequatelong-term and short-term funds to meet the NAB Group’sstrategic plans and objectives at an acceptable cost.
The objectives of the NAB Group in managing its fundingand liquidity risks are:
• to ensure that the current and future paymentobligations of the NAB Group are met as they becomedue
• to retain adequate liquidity buffers in the Group andsubsidiary balance sheets so as to withstand severemarket and institutional disruptions
• to meet planned business funding needs over a forwardhorizon
• to maintain access to global short-term and long-termdebt capital markets and global secured fundingmarkets consistent with the target credit ratings of theNAB Group and its subsidiaries
• to diversify funding sources in terms of maturity,currency, instrument, investor type, geographic regionand by the issuing entity.
Liquidity and Funding Risk Management Framework
The NAB Group’s Liquidity Risk Management framework isapproved by the Board on an annual basis. Theframework comprises a risk appetite statement, fundingand liquidity policies, an annual funding strategy, acontingent funding plan (CFP) and an internal liquidityadequacy assessment (ILAA).
The GALCO is responsible for oversighting the NABGroup's balance sheet structure, risk settings, complianceand governance frameworks around balance sheet risksincluding funding and liquidity risk.
Group Treasury develop and execute liquidity and fundingstrategies consistent with the NAB Group Funding strategy,mandates and limits in place. Group Risk set the riskappetite limits, provide oversight and are responsible forreporting of liquidity and funding compliance against limits.Liquidity risk management objectives are communicatedmore widely through the allocation of funding and liquiditycosts to business units.
The risk appetite statement includes specific metricsrelating to liquidity and funding risk. These metrics aredetermined with reference to outcomes of liquidity stresstesting, management experience, ratings agencyexpectations and peer alignment. Liquidity stress testingincludes systemic and idiosyncratic scenarios run over amix of short and longer timeframes and include an offshoremarket closure scenario and a local market disruptionscenario.
Liquid asset holdings and a strong funding base are theprimary mitigants to liquidity risk. The size, diversity andtenor of the liquid asset portfolio and funding mix is setannually in the NAB Group funding strategy based on therisk appetite settings. The strategy is updated quarterly toreflect current market conditions and outlook.
The NAB Group’s liquid asset portfolio is maintained bygeography, currency and legal entity across NAB Ltd, BNZ,London, New York and Asian branches. The liquidityportfolio comprises a mix of:
• cash, Australian government and semi governmentsecurities;
• offshore central bank reserves and foreign sovereignsecurities; and
• a mix of negotiable certificates of deposit, bank bills,supranational bonds, covered bonds, RMBS andinternal RMBS (all available as collateral for aCommitted Liquidity Facility with the Reserve Bank ofAustralia (RBA)).
The NAB Group’s funding is sourced from:
• customer deposits generated through transactionalaccounts, savings accounts and term deposits fromindividuals, small and medium enterprises (SME) andcorporations; and
• wholesale funding debt programs in both domestic andinternational markets including Global Medium TermNotes, Covered Bond programs, RMBS, CommercialPaper and Certificates of Deposits.
The NAB Group CFP provides guidance on how the bankwill respond in the event of a liquidity crisis including clearinstructions on accountabilities, communication, escalationprocess, asset liquidation options and operationalrequirements. The NAB Group CFP is tested and updatedannually. Early warning indicators provide insight intoemerging periods of funding or liquidity stress and when totrigger the NAB Group CFP.
Measurement, Monitoring and Reporting
Liquidity risk is measured, managed and monitored dailyon a cash flow basis, using scenario analysis, gap analysisand stress testing, and addresses all regulatoryrequirements. Any non-compliance is escalated to theGALCO and Group CRO.
Monthly results are reported to Group and subsidiaryALCOs, GRRMC and BRC. The NAB Group has clearlydefined escalation procedures whereby liquidity events,both systemic and name specific, are monitored andappropriate actions outlined against triggers.
Regulatory Change
The Liquidity Coverage Ratio (LCR) and Net StableFunding Ratio (NSFR) are a key focus for the NAB Group,with compliance having been required from 1 January 2015and from 1 January 2018 respectively.
Pillar 3 report
2016
65
Balance Sheet and Liquidity Risk
9.2 Interest Rate Risk in the Banking Book
Introduction
Interest Rate Risk in the Banking Book (IRRBB) arisesfrom changes in market interest rates that adversely impactthe NAB Group’s financial condition in terms of earnings(net interest income) or economic value of the balancesheet. This includes:
• Repricing Risk, arising from changes to the overall levelof interest rates and inherent mismatches in therepricing term of banking book items
• Yield Curve Risk, arising from a change in the relativelevel of interest rates for different tenors and changes inthe slope or shape of the yield curve
• Basis Risk, arising from differences between the actualand expected interest margins on banking book itemsover the implied cost of funds of those items
• Optionality Risk, arising from the existence of stand-alone or embedded options in banking book items, tothe extent that the potential for those losses is notincluded in the above risk types.
The objective of the NAB Group’s framework is to ensurethat IRRBB is managed to optimise and stabilise the NABGroup’s economic value and earnings over an investmenthorizon.
Management
The Board approves the risk appetite for IRRBB, and setsthe overall limits for VaR and Earnings at Risk (EaR).
The key elements of the management framework forIRRBB include:
• the IRRBB Policy and Guidance Notes define thecompliance and management framework to ensure thatall interest rate risk positions in the banking book areidentified, measured, managed and reported, and arealigned to the requirements of Prudential Standard APS117: Capital Adequacy: Interest Rate Risk in theBanking book
• the NAB Group and subsidiary Treasuries areresponsible for managing the interest rate risk profile ofthe balance sheet in line with the approved risk appetite.This includes development and execution of interestrate risk management strategies
• the Funds Transfer Pricing (FTP) Policy and GuidanceNotes define the FTP mechanism in place to transferinterest rate risk out of originating business units andinto the Group Treasury functions for the managementof interest rate risk
• the NAB Group and subsidiary BSLR teams areresponsible for IRRBB monitoring and oversight and areindependent of Group Treasury. They maintain a riskframework for IRRBB and have responsibility for IRRBBmeasurement of exposures, compliance monitoring andreporting
• periodic reporting to management and governancecommittees of IRRBB exposures and compliance.
Measurement
The NAB Group has been accredited by APRA to use itsinternal model for the measurement of IRRBB. Interest
rate risk is measured, managed and monitored using boththe economic valuation approach and the earningsapproach.
The principal metrics used to measure and monitor IRRBBare as follows:
Measurement Definition
VaR
The potential loss in economic valueimplied by the static balance sheet thatarises from changes to the current yieldcurve based upon historical observationsfor a given holding period and confidencelevel.
EaR
The potential loss in earnings implied by thestatic balance sheet over a 12-monthforecast period, that arises from changes inthe current yield curve based on historicalobservations for a given holding period andconfidence level.
Market Value
The present value of all known future cashflows implied by the static balance sheet onboth a spot and historically cumulativebasis.
Embedded Value
The economic gain or loss implied by thestatic balance sheet which equates to themarket value less the book value, lessaccrued interest.
Economic ValueSensitivity (EVS)
The potential impact of a parallel decreasein interest rates on the present value of allknown future cash flows implied by thestatic balance sheet.
Net Interest IncomeSensitivity (NIIS)
The potential impact of a parallel decreasein interest rates on the earnings over a 12-month forecast period implied by the staticbalance sheet.
Stress TestingThe potential loss in earnings andeconomic value from large parallel and non-parallel yield curve shocks.
VaR and EaR are measured with a three-month holdingperiod and 99% confidence level for internal reportingpurposes.
The NAB Group incorporates behavioural modelling wherecontractual-based modelling is inappropriate for measuringIRRBB, such as for prepayments, non-bearing interestaccounts, rate locks and CET1 Capital. Any changes tothe material assumptions require subsidiary ALCO orGALCO approval.
IRRBB regulatory capital includes a value for repricing andyield curve risk, basis risk, optionality risk and embeddedvalue. The components of IRRBB regulatory capital arecalculated using a historical VaR simulation using at leastsix years of historical data at a 99% confidence level, one-year investment term of capital, and a 12-month holdingperiod.
Monitoring and Reporting
The IRRBB metrics are measured and monitored on amonthly basis as a minimum. Compliance with limits isreported to subsidiary ALCOs and GALCO on a monthlybasis. IRRBB regulatory capital is also calculated monthly.
Pillar 3 report
2016
66
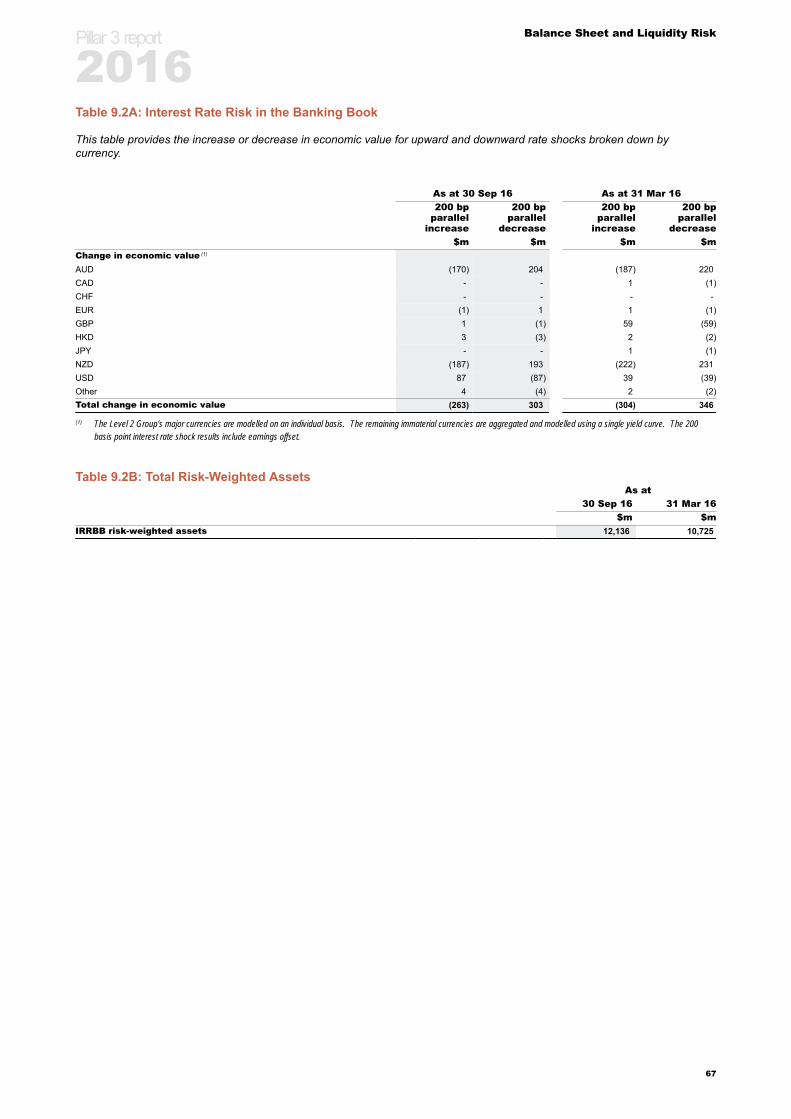
Balance Sheet and Liquidity Risk
Table 9.2A: Interest Rate Risk in the Banking Book
This table provides the increase or decrease in economic value for upward and downward rate shocks broken down bycurrency.
As at 30 Sep 16 As at 31 Mar 16200 bp
parallelincrease
200 bpparallel
decrease
200 bpparallel
increase
200 bpparallel
decrease$m $m $m $m
Change in economic value (1)
AUD (170) 204 (187) 220CAD - - 1 (1)CHF - - - -EUR (1) 1 1 (1)GBP 1 (1) 59 (59)HKD 3 (3) 2 (2)JPY - - 1 (1)NZD (187) 193 (222) 231USD 87 (87) 39 (39)Other 4 (4) 2 (2)Total change in economic value (263) 303 (304) 346
(1) The Level 2 Group’s major currencies are modelled on an individual basis. The remaining immaterial currencies are aggregated and modelled using a single yield curve. The 200basis point interest rate shock results include earnings offset.
Table 9.2B: Total Risk-Weighted AssetsAs at
30 Sep 16 31 Mar 16$m $m
IRRBB risk-weighted assets 12,136 10,725
Pillar 3 report
2016
67
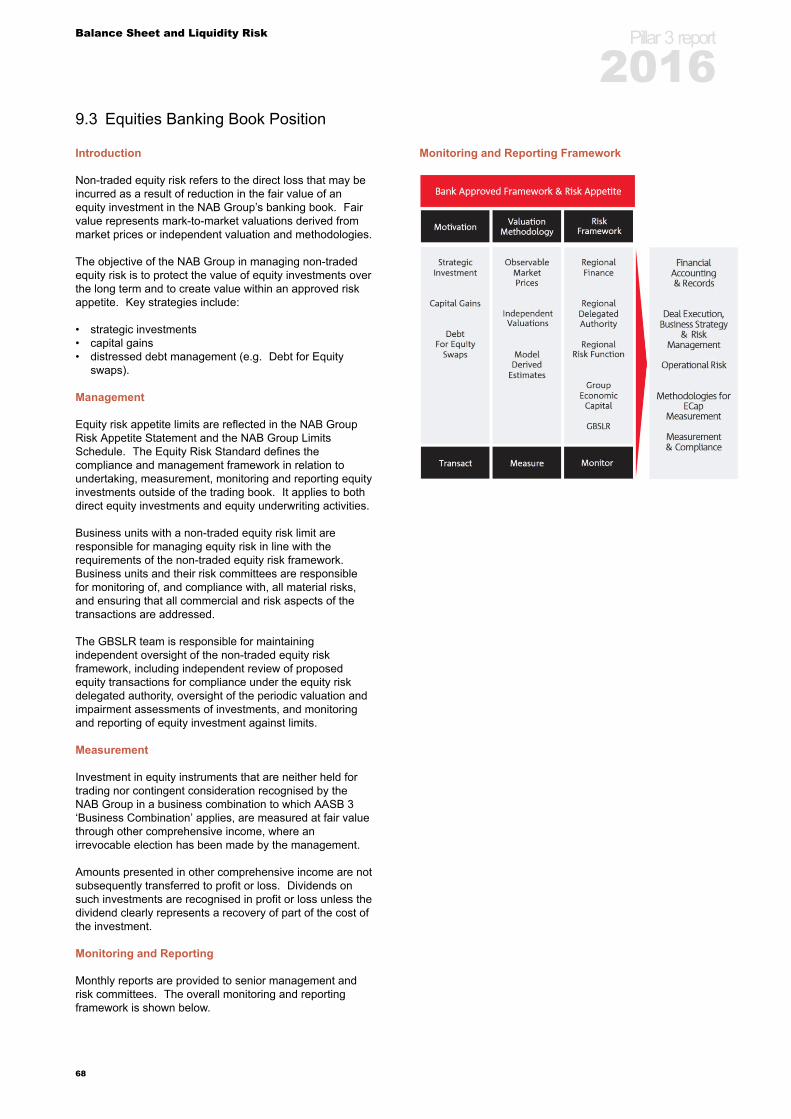
Balance Sheet and Liquidity Risk
9.3 Equities Banking Book Position
Introduction
Non-traded equity risk refers to the direct loss that may beincurred as a result of reduction in the fair value of anequity investment in the NAB Group’s banking book. Fairvalue represents mark-to-market valuations derived frommarket prices or independent valuation and methodologies.
The objective of the NAB Group in managing non-tradedequity risk is to protect the value of equity investments overthe long term and to create value within an approved riskappetite. Key strategies include:
• strategic investments• capital gains• distressed debt management (e.g. Debt for Equity
swaps).
Management
Equity risk appetite limits are reflected in the NAB GroupRisk Appetite Statement and the NAB Group LimitsSchedule. The Equity Risk Standard defines thecompliance and management framework in relation toundertaking, measurement, monitoring and reporting equityinvestments outside of the trading book. It applies to bothdirect equity investments and equity underwriting activities.
Business units with a non-traded equity risk limit areresponsible for managing equity risk in line with therequirements of the non-traded equity risk framework.Business units and their risk committees are responsiblefor monitoring of, and compliance with, all material risks,and ensuring that all commercial and risk aspects of thetransactions are addressed.
The GBSLR team is responsible for maintainingindependent oversight of the non-traded equity riskframework, including independent review of proposedequity transactions for compliance under the equity riskdelegated authority, oversight of the periodic valuation andimpairment assessments of investments, and monitoringand reporting of equity investment against limits.
Measurement
Investment in equity instruments that are neither held fortrading nor contingent consideration recognised by theNAB Group in a business combination to which AASB 3‘Business Combination’ applies, are measured at fair valuethrough other comprehensive income, where anirrevocable election has been made by the management.
Amounts presented in other comprehensive income are notsubsequently transferred to profit or loss. Dividends onsuch investments are recognised in profit or loss unless thedividend clearly represents a recovery of part of the cost ofthe investment.
Monitoring and Reporting
Monthly reports are provided to senior management andrisk committees. The overall monitoring and reportingframework is shown below.
Monitoring and Reporting Framework
Pillar 3 report
2016
68
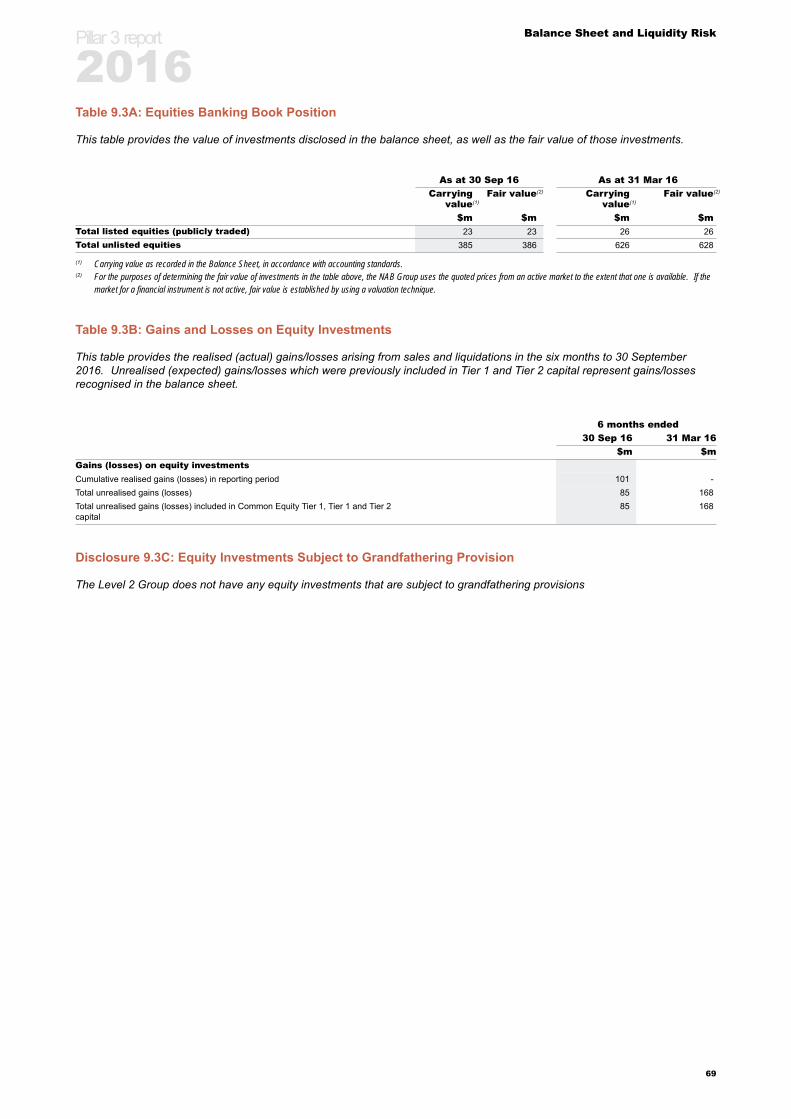
Balance Sheet and Liquidity Risk
Table 9.3A: Equities Banking Book Position
This table provides the value of investments disclosed in the balance sheet, as well as the fair value of those investments.
As at 30 Sep 16 As at 31 Mar 16Carrying
value(1)Fair value(2) Carrying
value(1)Fair value(2)
$m $m $m $mTotal listed equities (publicly traded) 23 23 26 26Total unlisted equities 385 386 626 628
(1) Carrying value as recorded in the Balance Sheet, in accordance with accounting standards.(2) For the purposes of determining the fair value of investments in the table above, the NAB Group uses the quoted prices from an active market to the extent that one is available. If the
market for a financial instrument is not active, fair value is established by using a valuation technique.
Table 9.3B: Gains and Losses on Equity Investments
This table provides the realised (actual) gains/losses arising from sales and liquidations in the six months to 30 September2016. Unrealised (expected) gains/losses which were previously included in Tier 1 and Tier 2 capital represent gains/lossesrecognised in the balance sheet.
6 months ended30 Sep 16 31 Mar 16
$m $mGains (losses) on equity investmentsCumulative realised gains (losses) in reporting period 101 -Total unrealised gains (losses) 85 168Total unrealised gains (losses) included in Common Equity Tier 1, Tier 1 and Tier 2capital
85 168
Disclosure 9.3C: Equity Investments Subject to Grandfathering Provision
The Level 2 Group does not have any equity investments that are subject to grandfathering provisions
Pillar 3 report
2016
69

Balance Sheet and Liquidity Risk
9.4 Foreign Exchange Risk in the Banking Book
The NAB Group’s banking book has exposure to riskarising from currency movements as a result ofparticipation in the global financial markets andinternational operations. Foreign Exchange Risk in theBanking Book (FXRBB) arises from both operatingbusiness activities and structural foreign exchangeexposures from foreign investments and capitalmanagement activities. Currency movements can impactprofit and loss, cash flows and the balance sheet.
The NAB Group’s objective in relation to foreign exchangerisk is to protect the NAB Group’s capital ratio from theimpact of currency movements, and to manage non-structural foreign exchange risk within risk appetite. TheNAB Group’s main structural foreign exchange exposuresare due to its investment in BNZ.
The Board approves the risk appetite for FXRBB, settingthe overall VaR limit. In addition, with guidance from theBRC, it monitors and reviews the adequacy of the NABGroup’s foreign exchange risk compliance andmanagement framework developed by management.
The key elements of the management framework forFXRBB include:
• the GBSLR Policy and FXRBB Standard define thecompliance and management framework to ensure allforeign exchange positions (both structural and non-structural) in the banking book are identified, measured,managed and reported
• the NAB Group and subsidiary Treasuries areresponsible for the development and execution offoreign exchange risk management strategies
• GBSLR and subsidiary BSLR teams provideindependent oversight. They are responsible formonitoring and oversight to ensure FXRBB is managedin compliance with the Policy and requirements of theStandard
• periodic reporting to management and governancecommittees of FXRBB exposures and compliance.
Pillar 3 report
2016
70
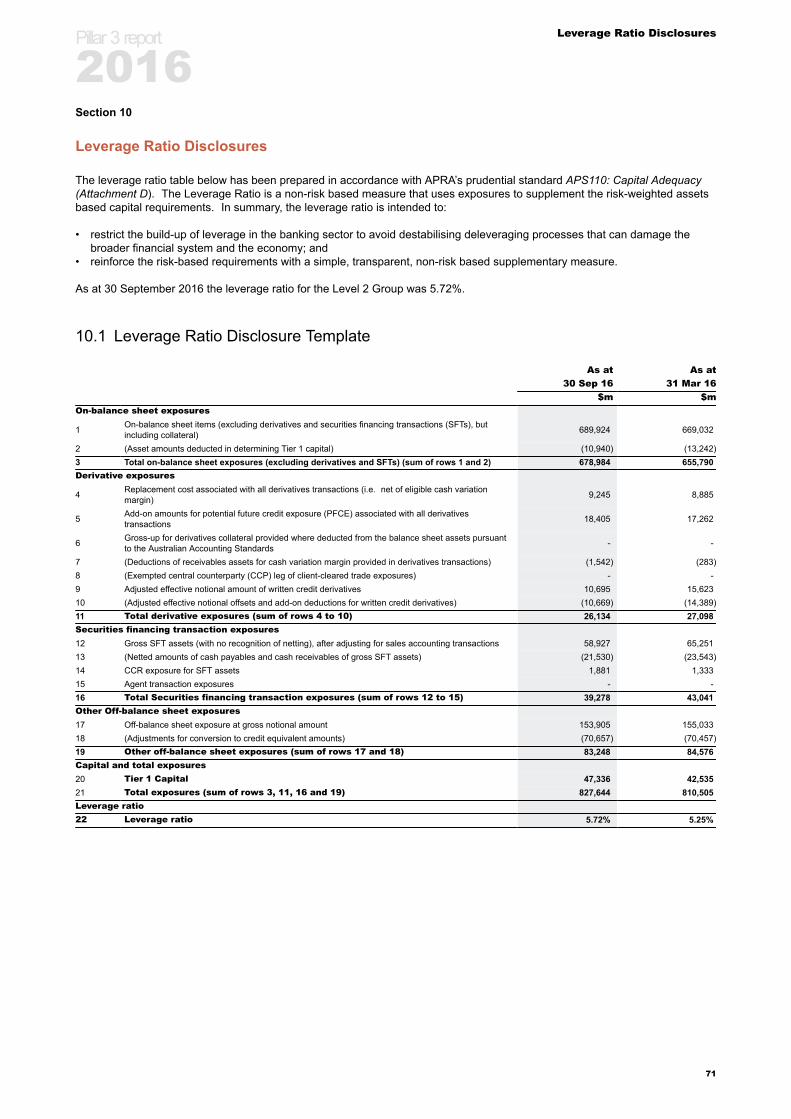
Leverage Ratio Disclosures
Section 10
Leverage Ratio Disclosures
The leverage ratio table below has been prepared in accordance with APRA’s prudential standard APS110: Capital Adequacy(Attachment D). The Leverage Ratio is a non-risk based measure that uses exposures to supplement the risk-weighted assetsbased capital requirements. In summary, the leverage ratio is intended to:
• restrict the build-up of leverage in the banking sector to avoid destabilising deleveraging processes that can damage thebroader financial system and the economy; and
• reinforce the risk-based requirements with a simple, transparent, non-risk based supplementary measure.
As at 30 September 2016 the leverage ratio for the Level 2 Group was 5.72%.
10.1 Leverage Ratio Disclosure Template
As at As at30 Sep 16 31 Mar 16
$m $mOn-balance sheet exposures
1 On-balance sheet items (excluding derivatives and securities financing transactions (SFTs), butincluding collateral) 689,924 669,032
2 (Asset amounts deducted in determining Tier 1 capital) (10,940) (13,242)3 Total on-balance sheet exposures (excluding derivatives and SFTs) (sum of rows 1 and 2) 678,984 655,790Derivative exposures
4 Replacement cost associated with all derivatives transactions (i.e. net of eligible cash variationmargin) 9,245 8,885
5 Add-on amounts for potential future credit exposure (PFCE) associated with all derivativestransactions 18,405 17,262
6 Gross-up for derivatives collateral provided where deducted from the balance sheet assets pursuantto the Australian Accounting Standards - -
7 (Deductions of receivables assets for cash variation margin provided in derivatives transactions) (1,542) (283)8 (Exempted central counterparty (CCP) leg of client-cleared trade exposures) - -9 Adjusted effective notional amount of written credit derivatives 10,695 15,62310 (Adjusted effective notional offsets and add-on deductions for written credit derivatives) (10,669) (14,389)11 Total derivative exposures (sum of rows 4 to 10) 26,134 27,098Securities financing transaction exposures12 Gross SFT assets (with no recognition of netting), after adjusting for sales accounting transactions 58,927 65,25113 (Netted amounts of cash payables and cash receivables of gross SFT assets) (21,530) (23,543)14 CCR exposure for SFT assets 1,881 1,33315 Agent transaction exposures - -16 Total Securities financing transaction exposures (sum of rows 12 to 15) 39,278 43,041Other Off-balance sheet exposures17 Off-balance sheet exposure at gross notional amount 153,905 155,03318 (Adjustments for conversion to credit equivalent amounts) (70,657) (70,457)19 Other off-balance sheet exposures (sum of rows 17 and 18) 83,248 84,576Capital and total exposures20 Tier 1 Capital 47,336 42,53521 Total exposures (sum of rows 3, 11, 16 and 19) 827,644 810,505Leverage ratio22 Leverage ratio 5.72% 5.25%
Pillar 3 report
2016
71

Leverage Ratio Disclosures
10.2 Summary Comparison of Accounting Assets vs Leverage Ratio Exposure Measure
As at As at30 Sep 16 31 Mar 16
$m $mItems1 Total consolidated assets as per published financial statements 777,622 868,730
2 Adjustment for investments in banking, financial, insurance or commercial entities that are consolidated for accountingpurposes but outside the scope of regulatory consolidation 1,122 (90,630)
3 Adjustment for assets held on the balance sheet in a fiduciary capacity pursuant to the Australian Accounting Standards butexcluded from the Leverage Ratio exposure measure - -
4 Adjustments for derivative financial instruments (25,289) (40,262)5 Adjustment for SFTs (i.e. repos and similar secured lending) 1,881 1,3336 Adjustment for off-balance sheet exposures (i.e. conversion to credit equivalent amounts of off-balance sheet exposures) 83,248 84,5767 Other adjustments (10,940) (13,242)8 Leverage ratio exposure 827,644 810,505
At 30 September 2016 the Leverage Ratio for the NAB Level 2 Group of 5.72% remains above the BCBS minimum requirementof 3.0% for banks that have not been identified as a G-SIB. Furthermore, the ratio exceeds the appropriate range of between3–5 per cent as recommended by the Financial System Inquiry calculated in accordance with the Basel framework.
The minimum Leverage Ratio is yet to be determined by APRA, with Pillar 1 compliance not expected to be required until1 January 2018.
Over the half year to 30 September 2016, the Leverage Ratio increased by 47 basis points to 5.72%. This uplift waspredominately due to the increase in Tier 1 Capital of $4.8 billion (+59 basis points), which includes cash earnings less thepayment of the 2016 interim dividend net of Dividend Reinvestment Plan (DRP) participation, the 80% sale of NAB’s Wealth lifeinsurance business, the issuance proceeds from NAB Capital Notes 2 and the sale of CYBG AT1 instruments.
On-balance sheet items (excluding derivatives and securities financing transactions (SFTs), but including collateral) for the NABLevel 2 Group have increased by $23 billion (-16 basis points) to $679 billion, while net movements to other leverage ratioexposure categories contributed a net 4 basis point increase to the ratio.
Pillar 3 report
2016
72

Liquidity Coverage Ratio
Section 11
Liquidity Coverage Ratio
The Liquidity Coverage Ratio (LCR) is a metric that measures the adequacy of High Quality Liquid Assets (HQLA) available tomeet net cash outflows (NCO) over a 30-day period during a severe liquidity stress scenario. The APRA minimum coveragelevel is 100% for both the Level 2 NAB Group and NAB Ltd from 1 January 2015.
The NAB Group LCR for the quarters ended 30 September 2016, 30 June 2016 and 31 March 2016 is presented in the Table11.1 LCR Disclosure Template which reflects the Basel standard disclosure template and is based on a simple average of dailyLCR outcomes excluding weekends.
Liquidity Coverage Ratio Commentary
The NAB Group maintains well diversified and high qualityliquid asset portfolios to support regulatory and internalrequirements in the various countries in which it operates.
Average liquid assets for the quarter were $147 billion ofwhich HQLA comprised $91 billion. The HQLA consistsprimarily of Level 1 assets which include cash, depositswith Central Banks, Australian Semi Government andCommonwealth Government securities and securitiesissued by foreign sovereigns.
Alternative Liquid Assets (ALA) relate to the CommittedLiquidity Facility (CLF) provided by the Reserve Bank ofAustralia (RBA). HQLA held in Bank of New Zealandwhich is excess to meeting an LCR of 115% is excludedreflecting liquidity portability considerations. The amountexcluded was on average $2.4 billion during the quarter to30 September 2016.
The CLF value used in the LCR calculation is the lesser ofthe undrawn portion of the facility granted to the NABGroup and the value of the collateral the NAB Groupchooses to hold at any given time to support the facility andits liquidity requirements. This collateral is a combinationof internal Residential Mortgage Backed Securities (RMBS)and other RBA repo eligible securities including bank billsand third party RMBS. The drawn portion of the CLFrelates to accounts held with the RBA for the settlement ofpayment obligations. The NAB Group has an availableCLF of $55.4 billion during the period 1 January 2016 to31 December 2016.
LCR NCO represents the net cash flows that couldpotentially occur from on and off balance sheet activitieswithin a 30 day severe liquidity stress scenario. The cashflows are calculated by applying APRA prescribed run-offfactors to maturing debt and deposits and inflow factors toassets. High run-off factors are applied to sophisticatedinvestors and depositors including long term and short termdebt holders, financial institution and corporate depositors.Lower run off factors are applied to deposits less likely tobe withdrawn in a period of severe stress. These includedeposits from people and from small medium enterprises.Deposits from corporate and financial institutions which areconsidered to be operational in nature also attract a lowerrun off, for example deposits from the NAB custodybusiness. NAB conducts an annual review of itsinterpretation of the LCR definitions. During 2015/2016NAB revised the methodology for determining operationaldeposit excess amounts and cash inflows from fullyperforming exposures.
Cash outflows arising from business activities that createcontingent funding and collateral requirements such asrepo funding and derivatives and the extension of creditand liquidity facilities to customers are also captured withinthe LCR calculation along with an allowance for debtbuyback requests.
The NAB Group manages its LCR position daily within atarget range that reflects management risk appetite acrossthe legal entity structure, major currencies and jurisdictionsin which business activities are undertaken.
Q3 2016 vs Q2 2016
Average holdings of liquid assets and NCO both decreasedreflecting the Clydesdale Bank exit which occurred midwaythrough the March 2016 quarter.
Q4 2016 V Q3 2016
No movement in the liquid asset portfolio. NCO increasedriven by a combination of higher derivative cash outflowsreflecting material funding maturities during the period andby lower cash inflows from methodology change.
Pillar 3 report
2016
73
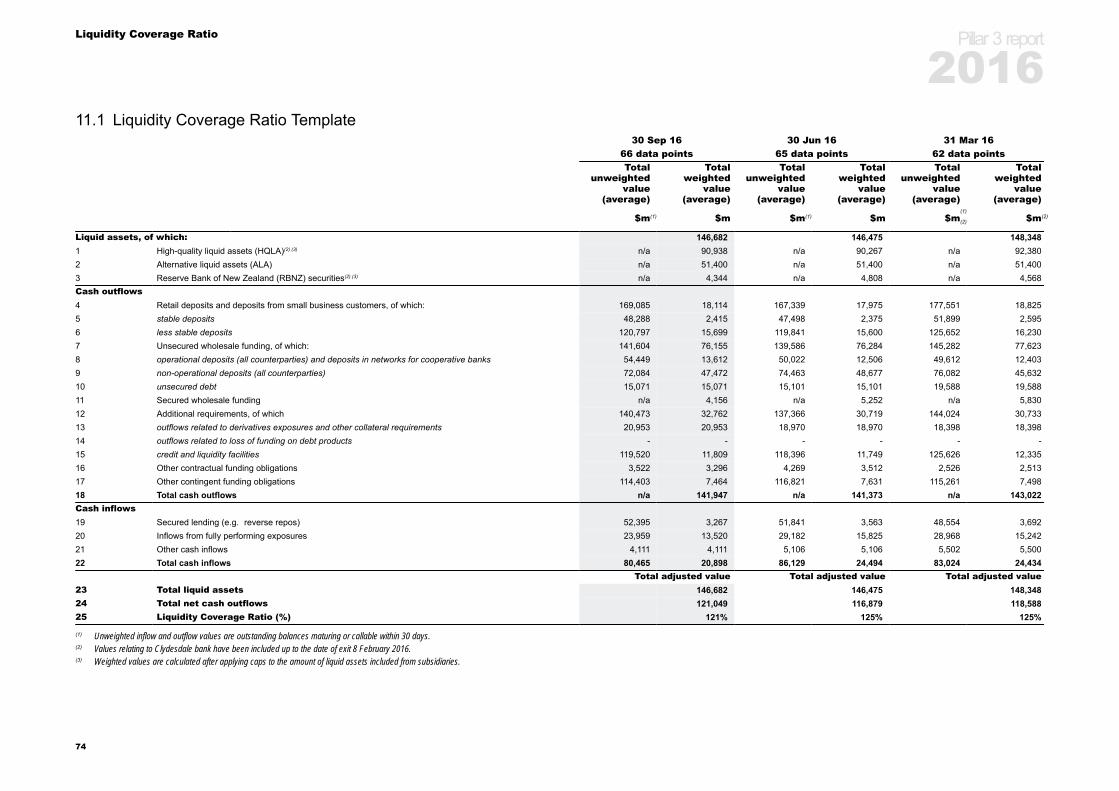
Liquidity Coverage Ratio
11.1 Liquidity Coverage Ratio Template30 Sep 16 30 Jun 16 31 Mar 16
66 data points 65 data points 62 data pointsTotal
unweightedvalue
(average)
Totalweighted
value(average)
Totalunweighted
value(average)
Totalweighted
value(average)
Totalunweighted
value(average)
Totalweighted
value(average)
$m(1) $m $m(1) $m $m(1)
(2) $m(2)
Liquid assets, of which: 146,682 146,475 148,3481 High-quality liquid assets (HQLA)(2) (3) n/a 90,938 n/a 90,267 n/a 92,3802 Alternative liquid assets (ALA) n/a 51,400 n/a 51,400 n/a 51,4003 Reserve Bank of New Zealand (RBNZ) securities(2) (3) n/a 4,344 n/a 4,808 n/a 4,568Cash outflows4 Retail deposits and deposits from small business customers, of which: 169,085 18,114 167,339 17,975 177,551 18,8255 stable deposits 48,288 2,415 47,498 2,375 51,899 2,5956 less stable deposits 120,797 15,699 119,841 15,600 125,652 16,2307 Unsecured wholesale funding, of which: 141,604 76,155 139,586 76,284 145,282 77,6238 operational deposits (all counterparties) and deposits in networks for cooperative banks 54,449 13,612 50,022 12,506 49,612 12,4039 non-operational deposits (all counterparties) 72,084 47,472 74,463 48,677 76,082 45,63210 unsecured debt 15,071 15,071 15,101 15,101 19,588 19,58811 Secured wholesale funding n/a 4,156 n/a 5,252 n/a 5,83012 Additional requirements, of which 140,473 32,762 137,366 30,719 144,024 30,73313 outflows related to derivatives exposures and other collateral requirements 20,953 20,953 18,970 18,970 18,398 18,39814 outflows related to loss of funding on debt products - - - - - -15 credit and liquidity facilities 119,520 11,809 118,396 11,749 125,626 12,33516 Other contractual funding obligations 3,522 3,296 4,269 3,512 2,526 2,51317 Other contingent funding obligations 114,403 7,464 116,821 7,631 115,261 7,49818 Total cash outflows n/a 141,947 n/a 141,373 n/a 143,022Cash inflows19 Secured lending (e.g. reverse repos) 52,395 3,267 51,841 3,563 48,554 3,69220 Inflows from fully performing exposures 23,959 13,520 29,182 15,825 28,968 15,24221 Other cash inflows 4,111 4,111 5,106 5,106 5,502 5,50022 Total cash inflows 80,465 20,898 86,129 24,494 83,024 24,434
Total adjusted value Total adjusted value Total adjusted value23 Total liquid assets 146,682 146,475 148,34824 Total net cash outflows 121,049 116,879 118,58825 Liquidity Coverage Ratio (%) 121% 125% 125%
(1) Unweighted inflow and outflow values are outstanding balances maturing or callable within 30 days.(2) Values relating to Clydesdale bank have been included up to the date of exit 8 February 2016.(3) Weighted values are calculated after applying caps to the amount of liquid assets included from subsidiaries.
Pillar 3 report
2016
74
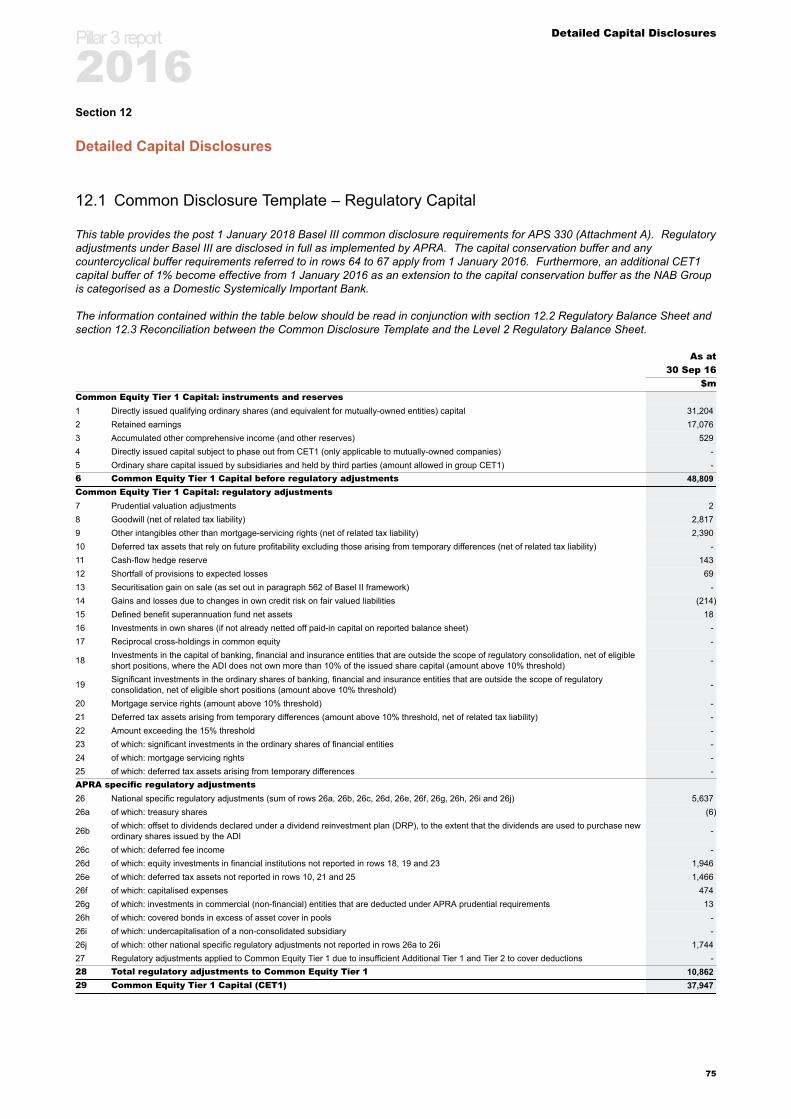
Detailed Capital Disclosures
Section 12
Detailed Capital Disclosures
12.1 Common Disclosure Template – Regulatory Capital
This table provides the post 1 January 2018 Basel III common disclosure requirements for APS 330 (Attachment A). Regulatoryadjustments under Basel III are disclosed in full as implemented by APRA. The capital conservation buffer and anycountercyclical buffer requirements referred to in rows 64 to 67 apply from 1 January 2016. Furthermore, an additional CET1capital buffer of 1% become effective from 1 January 2016 as an extension to the capital conservation buffer as the NAB Groupis categorised as a Domestic Systemically Important Bank.
The information contained within the table below should be read in conjunction with section 12.2 Regulatory Balance Sheet andsection 12.3 Reconciliation between the Common Disclosure Template and the Level 2 Regulatory Balance Sheet.
As at30 Sep 16
$mCommon Equity Tier 1 Capital: instruments and reserves1 Directly issued qualifying ordinary shares (and equivalent for mutually-owned entities) capital 31,2042 Retained earnings 17,0763 Accumulated other comprehensive income (and other reserves) 5294 Directly issued capital subject to phase out from CET1 (only applicable to mutually-owned companies) -5 Ordinary share capital issued by subsidiaries and held by third parties (amount allowed in group CET1) -6 Common Equity Tier 1 Capital before regulatory adjustments 48,809Common Equity Tier 1 Capital: regulatory adjustments7 Prudential valuation adjustments 28 Goodwill (net of related tax liability) 2,8179 Other intangibles other than mortgage-servicing rights (net of related tax liability) 2,39010 Deferred tax assets that rely on future profitability excluding those arising from temporary differences (net of related tax liability) -11 Cash-flow hedge reserve 14312 Shortfall of provisions to expected losses 6913 Securitisation gain on sale (as set out in paragraph 562 of Basel II framework) -14 Gains and losses due to changes in own credit risk on fair valued liabilities (214)15 Defined benefit superannuation fund net assets 1816 Investments in own shares (if not already netted off paid-in capital on reported balance sheet) -17 Reciprocal cross-holdings in common equity -
18 Investments in the capital of banking, financial and insurance entities that are outside the scope of regulatory consolidation, net of eligibleshort positions, where the ADI does not own more than 10% of the issued share capital (amount above 10% threshold) -
19 Significant investments in the ordinary shares of banking, financial and insurance entities that are outside the scope of regulatoryconsolidation, net of eligible short positions (amount above 10% threshold) -
20 Mortgage service rights (amount above 10% threshold) -21 Deferred tax assets arising from temporary differences (amount above 10% threshold, net of related tax liability) -22 Amount exceeding the 15% threshold -23 of which: significant investments in the ordinary shares of financial entities -24 of which: mortgage servicing rights -25 of which: deferred tax assets arising from temporary differences -APRA specific regulatory adjustments26 National specific regulatory adjustments (sum of rows 26a, 26b, 26c, 26d, 26e, 26f, 26g, 26h, 26i and 26j) 5,63726a of which: treasury shares (6)
26b of which: offset to dividends declared under a dividend reinvestment plan (DRP), to the extent that the dividends are used to purchase newordinary shares issued by the ADI -
26c of which: deferred fee income -26d of which: equity investments in financial institutions not reported in rows 18, 19 and 23 1,94626e of which: deferred tax assets not reported in rows 10, 21 and 25 1,46626f of which: capitalised expenses 47426g of which: investments in commercial (non-financial) entities that are deducted under APRA prudential requirements 1326h of which: covered bonds in excess of asset cover in pools -26i of which: undercapitalisation of a non-consolidated subsidiary -26j of which: other national specific regulatory adjustments not reported in rows 26a to 26i 1,74427 Regulatory adjustments applied to Common Equity Tier 1 due to insufficient Additional Tier 1 and Tier 2 to cover deductions -28 Total regulatory adjustments to Common Equity Tier 1 10,86229 Common Equity Tier 1 Capital (CET1) 37,947
Pillar 3 report
2016
75
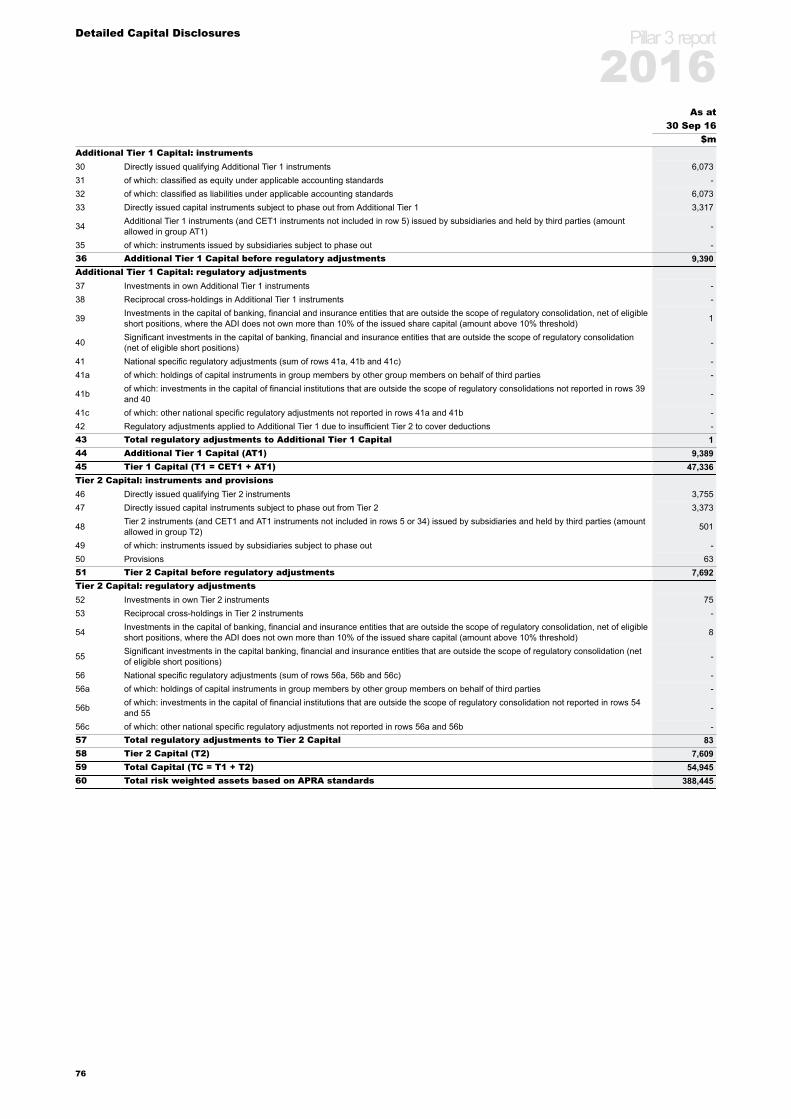
Detailed Capital Disclosures
As at30 Sep 16
$mAdditional Tier 1 Capital: instruments30 Directly issued qualifying Additional Tier 1 instruments 6,07331 of which: classified as equity under applicable accounting standards -32 of which: classified as liabilities under applicable accounting standards 6,07333 Directly issued capital instruments subject to phase out from Additional Tier 1 3,317
34 Additional Tier 1 instruments (and CET1 instruments not included in row 5) issued by subsidiaries and held by third parties (amountallowed in group AT1) -
35 of which: instruments issued by subsidiaries subject to phase out -36 Additional Tier 1 Capital before regulatory adjustments 9,390Additional Tier 1 Capital: regulatory adjustments37 Investments in own Additional Tier 1 instruments -38 Reciprocal cross-holdings in Additional Tier 1 instruments -
39 Investments in the capital of banking, financial and insurance entities that are outside the scope of regulatory consolidation, net of eligibleshort positions, where the ADI does not own more than 10% of the issued share capital (amount above 10% threshold) 1
40 Significant investments in the capital of banking, financial and insurance entities that are outside the scope of regulatory consolidation(net of eligible short positions) -
41 National specific regulatory adjustments (sum of rows 41a, 41b and 41c) -41a of which: holdings of capital instruments in group members by other group members on behalf of third parties -
41b of which: investments in the capital of financial institutions that are outside the scope of regulatory consolidations not reported in rows 39and 40 -
41c of which: other national specific regulatory adjustments not reported in rows 41a and 41b -42 Regulatory adjustments applied to Additional Tier 1 due to insufficient Tier 2 to cover deductions -43 Total regulatory adjustments to Additional Tier 1 Capital 144 Additional Tier 1 Capital (AT1) 9,38945 Tier 1 Capital (T1 = CET1 + AT1) 47,336Tier 2 Capital: instruments and provisions46 Directly issued qualifying Tier 2 instruments 3,75547 Directly issued capital instruments subject to phase out from Tier 2 3,373
48 Tier 2 instruments (and CET1 and AT1 instruments not included in rows 5 or 34) issued by subsidiaries and held by third parties (amountallowed in group T2) 501
49 of which: instruments issued by subsidiaries subject to phase out -50 Provisions 6351 Tier 2 Capital before regulatory adjustments 7,692Tier 2 Capital: regulatory adjustments52 Investments in own Tier 2 instruments 7553 Reciprocal cross-holdings in Tier 2 instruments -
54 Investments in the capital of banking, financial and insurance entities that are outside the scope of regulatory consolidation, net of eligibleshort positions, where the ADI does not own more than 10% of the issued share capital (amount above 10% threshold) 8
55 Significant investments in the capital banking, financial and insurance entities that are outside the scope of regulatory consolidation (netof eligible short positions) -
56 National specific regulatory adjustments (sum of rows 56a, 56b and 56c) -56a of which: holdings of capital instruments in group members by other group members on behalf of third parties -
56b of which: investments in the capital of financial institutions that are outside the scope of regulatory consolidation not reported in rows 54and 55 -
56c of which: other national specific regulatory adjustments not reported in rows 56a and 56b -57 Total regulatory adjustments to Tier 2 Capital 8358 Tier 2 Capital (T2) 7,60959 Total Capital (TC = T1 + T2) 54,94560 Total risk weighted assets based on APRA standards 388,445
Pillar 3 report
2016
76
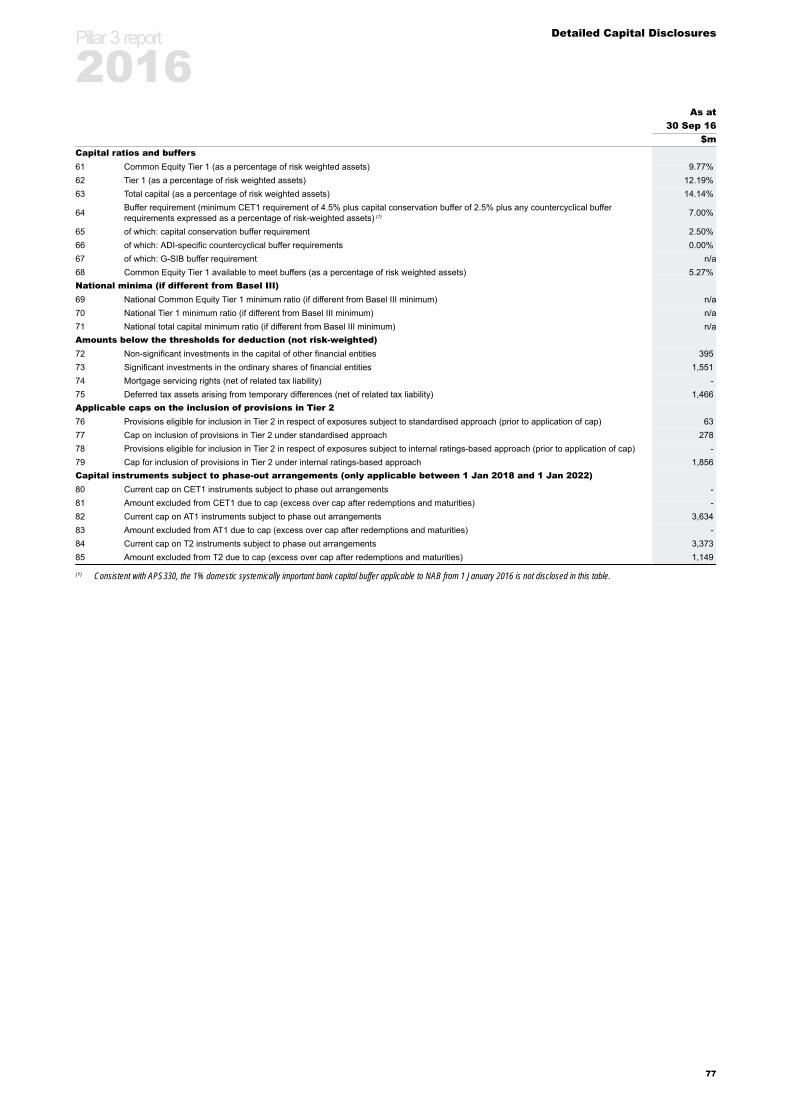
Detailed Capital Disclosures
As at30 Sep 16
$mCapital ratios and buffers61 Common Equity Tier 1 (as a percentage of risk weighted assets) 9.77%62 Tier 1 (as a percentage of risk weighted assets) 12.19%63 Total capital (as a percentage of risk weighted assets) 14.14%
64 Buffer requirement (minimum CET1 requirement of 4.5% plus capital conservation buffer of 2.5% plus any countercyclical bufferrequirements expressed as a percentage of risk-weighted assets) (1) 7.00%
65 of which: capital conservation buffer requirement 2.50%66 of which: ADI-specific countercyclical buffer requirements 0.00%67 of which: G-SIB buffer requirement n/a68 Common Equity Tier 1 available to meet buffers (as a percentage of risk weighted assets) 5.27%National minima (if different from Basel III)69 National Common Equity Tier 1 minimum ratio (if different from Basel III minimum) n/a70 National Tier 1 minimum ratio (if different from Basel III minimum) n/a71 National total capital minimum ratio (if different from Basel III minimum) n/aAmounts below the thresholds for deduction (not risk-weighted)72 Non-significant investments in the capital of other financial entities 39573 Significant investments in the ordinary shares of financial entities 1,55174 Mortgage servicing rights (net of related tax liability) -75 Deferred tax assets arising from temporary differences (net of related tax liability) 1,466Applicable caps on the inclusion of provisions in Tier 276 Provisions eligible for inclusion in Tier 2 in respect of exposures subject to standardised approach (prior to application of cap) 6377 Cap on inclusion of provisions in Tier 2 under standardised approach 27878 Provisions eligible for inclusion in Tier 2 in respect of exposures subject to internal ratings-based approach (prior to application of cap) -79 Cap for inclusion of provisions in Tier 2 under internal ratings-based approach 1,856Capital instruments subject to phase-out arrangements (only applicable between 1 Jan 2018 and 1 Jan 2022)80 Current cap on CET1 instruments subject to phase out arrangements -81 Amount excluded from CET1 due to cap (excess over cap after redemptions and maturities) -82 Current cap on AT1 instruments subject to phase out arrangements 3,63483 Amount excluded from AT1 due to cap (excess over cap after redemptions and maturities) -84 Current cap on T2 instruments subject to phase out arrangements 3,37385 Amount excluded from T2 due to cap (excess over cap after redemptions and maturities) 1,149
(1) Consistent with APS330, the 1% domestic systemically important bank capital buffer applicable to NAB from 1 January 2016 is not disclosed in this table.
Pillar 3 report
2016
77
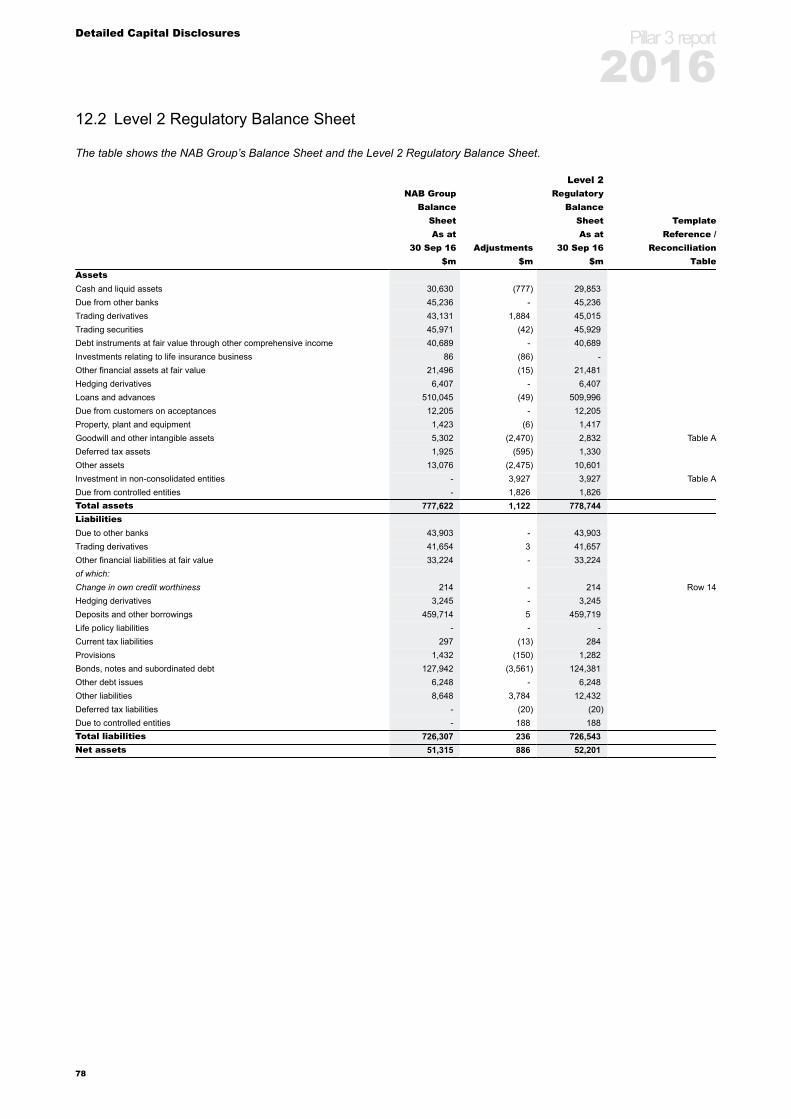
Detailed Capital Disclosures
12.2 Level 2 Regulatory Balance Sheet
The table shows the NAB Group’s Balance Sheet and the Level 2 Regulatory Balance Sheet.
Level 2NAB Group Regulatory
Balance BalanceSheet Sheet TemplateAs at As at Reference /
30 Sep 16 Adjustments 30 Sep 16 Reconciliation$m $m $m Table
AssetsCash and liquid assets 30,630 (777) 29,853Due from other banks 45,236 - 45,236Trading derivatives 43,131 1,884 45,015Trading securities 45,971 (42) 45,929Debt instruments at fair value through other comprehensive income 40,689 - 40,689Investments relating to life insurance business 86 (86) -Other financial assets at fair value 21,496 (15) 21,481Hedging derivatives 6,407 - 6,407Loans and advances 510,045 (49) 509,996Due from customers on acceptances 12,205 - 12,205Property, plant and equipment 1,423 (6) 1,417Goodwill and other intangible assets 5,302 (2,470) 2,832 Table ADeferred tax assets 1,925 (595) 1,330Other assets 13,076 (2,475) 10,601Investment in non-consolidated entities - 3,927 3,927 Table ADue from controlled entities - 1,826 1,826Total assets 777,622 1,122 778,744LiabilitiesDue to other banks 43,903 - 43,903Trading derivatives 41,654 3 41,657Other financial liabilities at fair value 33,224 - 33,224of which:Change in own credit worthiness 214 - 214 Row 14Hedging derivatives 3,245 - 3,245Deposits and other borrowings 459,714 5 459,719Life policy liabilities - - -Current tax liabilities 297 (13) 284Provisions 1,432 (150) 1,282Bonds, notes and subordinated debt 127,942 (3,561) 124,381Other debt issues 6,248 - 6,248Other liabilities 8,648 3,784 12,432Deferred tax liabilities - (20) (20)Due to controlled entities - 188 188Total liabilities 726,307 236 726,543Net assets 51,315 886 52,201
Pillar 3 report
2016
78
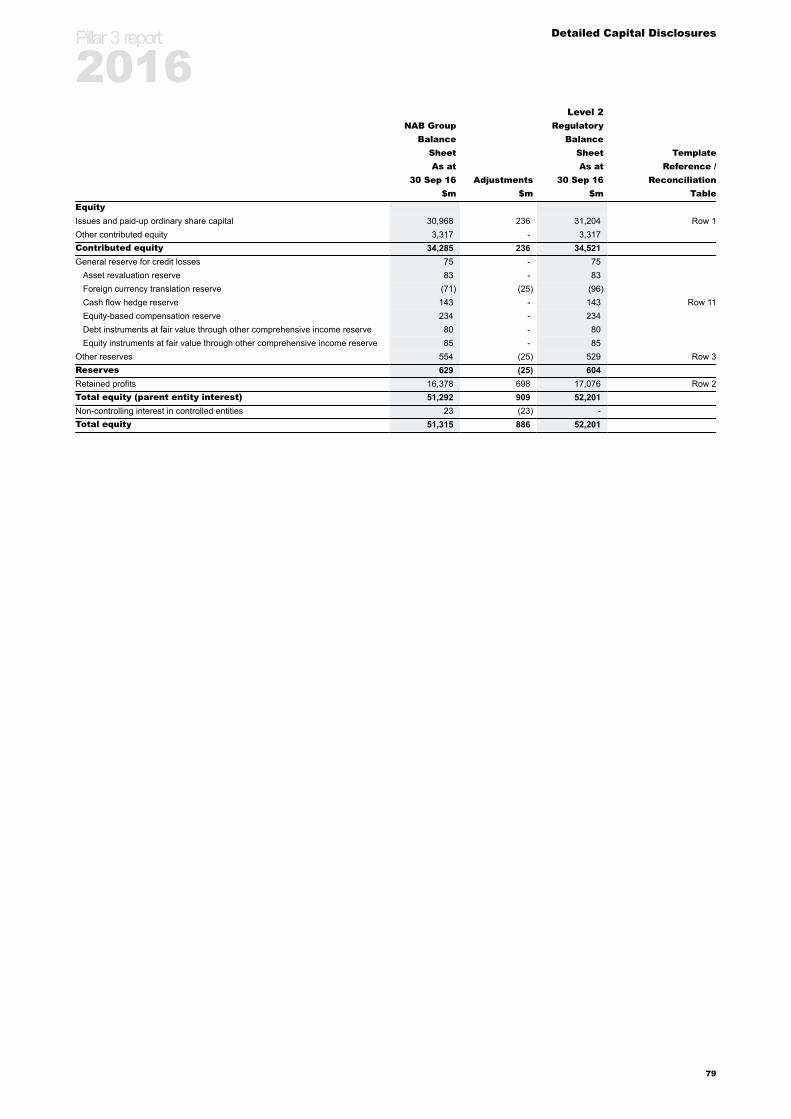
Detailed Capital Disclosures
Level 2NAB Group Regulatory
Balance BalanceSheet Sheet TemplateAs at As at Reference /
30 Sep 16 Adjustments 30 Sep 16 Reconciliation$m $m $m Table
EquityIssues and paid-up ordinary share capital 30,968 236 31,204 Row 1Other contributed equity 3,317 - 3,317Contributed equity 34,285 236 34,521General reserve for credit losses 75 - 75
Asset revaluation reserve 83 - 83Foreign currency translation reserve (71) (25) (96)Cash flow hedge reserve 143 - 143 Row 11Equity-based compensation reserve 234 - 234Debt instruments at fair value through other comprehensive income reserve 80 - 80Equity instruments at fair value through other comprehensive income reserve 85 - 85
Other reserves 554 (25) 529 Row 3Reserves 629 (25) 604Retained profits 16,378 698 17,076 Row 2Total equity (parent entity interest) 51,292 909 52,201Non-controlling interest in controlled entities 23 (23) -Total equity 51,315 886 52,201
Pillar 3 report
2016
79
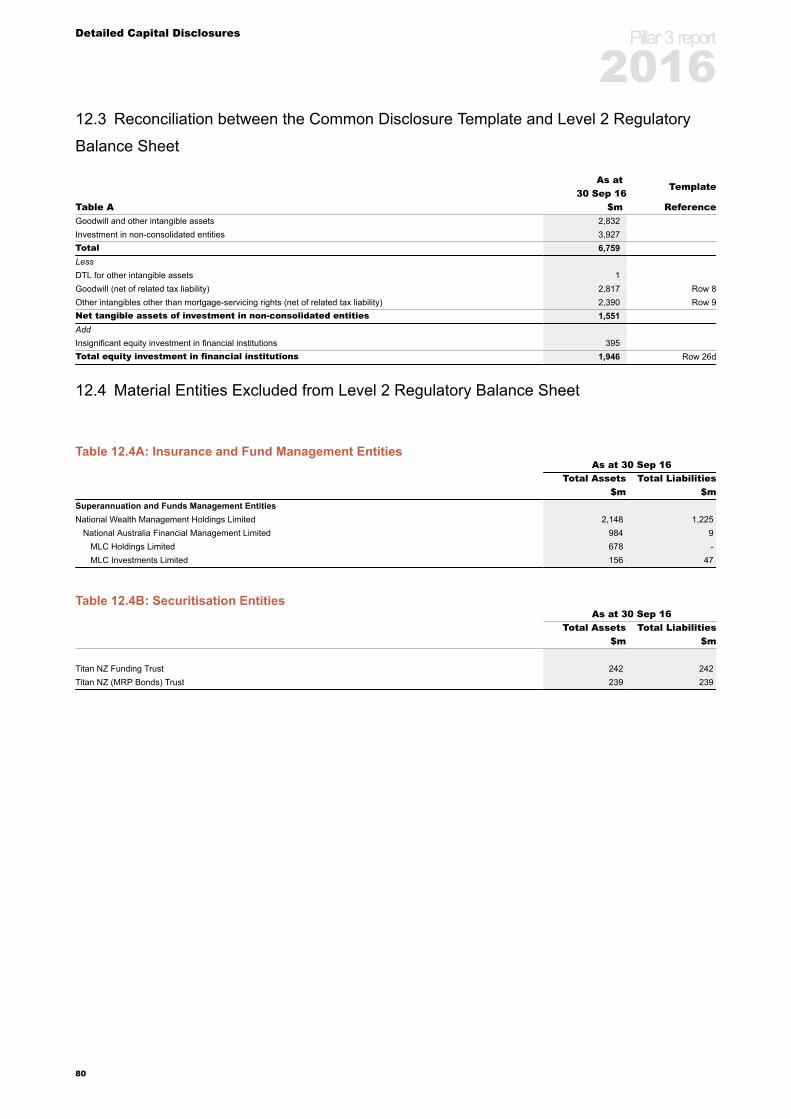
Detailed Capital Disclosures
12.3 Reconciliation between the Common Disclosure Template and Level 2 Regulatory
Balance Sheet
As atTemplate
30 Sep 16Table A $m ReferenceGoodwill and other intangible assets 2,832Investment in non-consolidated entities 3,927Total 6,759LessDTL for other intangible assets 1Goodwill (net of related tax liability) 2,817 Row 8Other intangibles other than mortgage-servicing rights (net of related tax liability) 2,390 Row 9Net tangible assets of investment in non-consolidated entities 1,551AddInsignificant equity investment in financial institutions 395Total equity investment in financial institutions 1,946 Row 26d
12.4 Material Entities Excluded from Level 2 Regulatory Balance Sheet
Table 12.4A: Insurance and Fund Management EntitiesAs at 30 Sep 16
Total Assets Total Liabilities$m $m
Superannuation and Funds Management EntitiesNational Wealth Management Holdings Limited 2,148 1,225
National Australia Financial Management Limited 984 9MLC Holdings Limited 678 -MLC Investments Limited 156 47
Table 12.4B: Securitisation EntitiesAs at 30 Sep 16
Total Assets Total Liabilities$m $m
Titan NZ Funding Trust 242 242Titan NZ (MRP Bonds) Trust 239 239
Pillar 3 report
2016
80
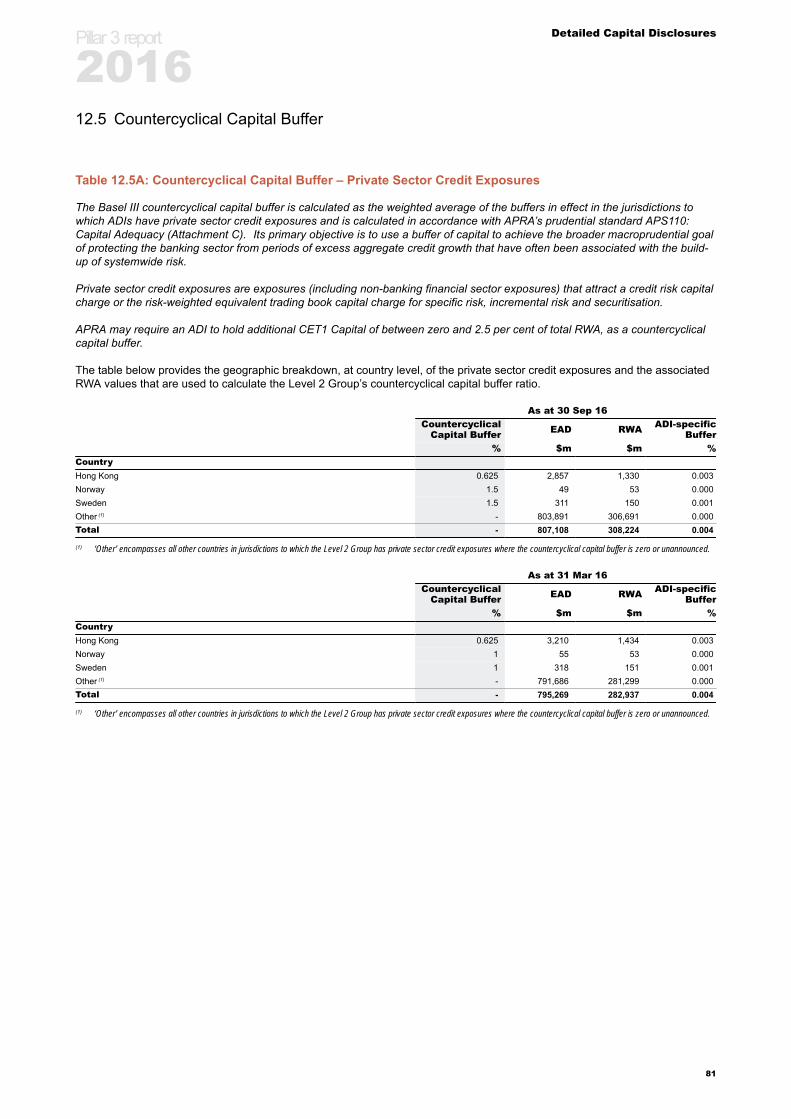
Detailed Capital Disclosures
12.5 Countercyclical Capital Buffer
Table 12.5A: Countercyclical Capital Buffer – Private Sector Credit Exposures
The Basel III countercyclical capital buffer is calculated as the weighted average of the buffers in effect in the jurisdictions towhich ADIs have private sector credit exposures and is calculated in accordance with APRA’s prudential standard APS110:Capital Adequacy (Attachment C). Its primary objective is to use a buffer of capital to achieve the broader macroprudential goalof protecting the banking sector from periods of excess aggregate credit growth that have often been associated with the build-up of systemwide risk.
Private sector credit exposures are exposures (including non-banking financial sector exposures) that attract a credit risk capitalcharge or the risk-weighted equivalent trading book capital charge for specific risk, incremental risk and securitisation.
APRA may require an ADI to hold additional CET1 Capital of between zero and 2.5 per cent of total RWA, as a countercyclicalcapital buffer.
The table below provides the geographic breakdown, at country level, of the private sector credit exposures and the associatedRWA values that are used to calculate the Level 2 Group’s countercyclical capital buffer ratio.
As at 30 Sep 16Countercyclical
Capital Buffer EAD RWA ADI-specificBuffer
% $m $m %CountryHong Kong 0.625 2,857 1,330 0.003Norway 1.5 49 53 0.000Sweden 1.5 311 150 0.001Other (1) - 803,891 306,691 0.000Total - 807,108 308,224 0.004
(1) ‘Other’ encompasses all other countries in jurisdictions to which the Level 2 Group has private sector credit exposures where the countercyclical capital buffer is zero or unannounced.
As at 31 Mar 16Countercyclical
Capital Buffer EAD RWA ADI-specificBuffer
% $m $m %CountryHong Kong 0.625 3,210 1,434 0.003Norway 1 55 53 0.000Sweden 1 318 151 0.001Other (1) - 791,686 281,299 0.000Total - 795,269 282,937 0.004
(1) ‘Other’ encompasses all other countries in jurisdictions to which the Level 2 Group has private sector credit exposures where the countercyclical capital buffer is zero or unannounced.
Pillar 3 report
2016
81
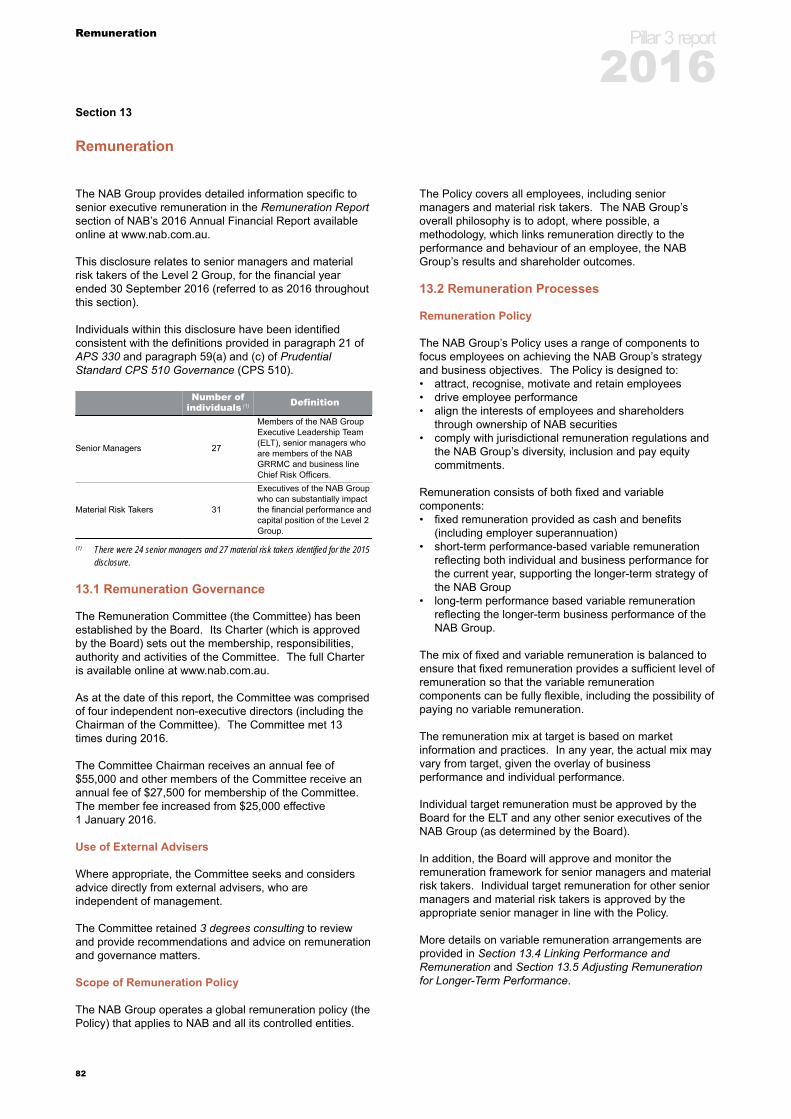
Remuneration
Section 13
Remuneration
The NAB Group provides detailed information specific tosenior executive remuneration in the Remuneration Reportsection of NAB’s 2016 Annual Financial Report availableonline at www.nab.com.au.
This disclosure relates to senior managers and materialrisk takers of the Level 2 Group, for the financial yearended 30 September 2016 (referred to as 2016 throughoutthis section).
Individuals within this disclosure have been identifiedconsistent with the definitions provided in paragraph 21 ofAPS 330 and paragraph 59(a) and (c) of PrudentialStandard CPS 510 Governance (CPS 510).
Number ofindividuals (1) Definition
Senior Managers 27
Members of the NAB GroupExecutive Leadership Team(ELT), senior managers whoare members of the NABGRRMC and business lineChief Risk Officers.
Material Risk Takers 31
Executives of the NAB Groupwho can substantially impactthe financial performance andcapital position of the Level 2Group.
(1) There were 24 senior managers and 27 material risk takers identified for the 2015disclosure.
13.1 Remuneration Governance
The Remuneration Committee (the Committee) has beenestablished by the Board. Its Charter (which is approvedby the Board) sets out the membership, responsibilities,authority and activities of the Committee. The full Charteris available online at www.nab.com.au.
As at the date of this report, the Committee was comprisedof four independent non-executive directors (including theChairman of the Committee). The Committee met 13times during 2016.
The Committee Chairman receives an annual fee of$55,000 and other members of the Committee receive anannual fee of $27,500 for membership of the Committee.The member fee increased from $25,000 effective1 January 2016.
Use of External Advisers
Where appropriate, the Committee seeks and considersadvice directly from external advisers, who areindependent of management.
The Committee retained 3 degrees consulting to reviewand provide recommendations and advice on remunerationand governance matters.
Scope of Remuneration Policy
The NAB Group operates a global remuneration policy (thePolicy) that applies to NAB and all its controlled entities.
The Policy covers all employees, including seniormanagers and material risk takers. The NAB Group’soverall philosophy is to adopt, where possible, amethodology, which links remuneration directly to theperformance and behaviour of an employee, the NABGroup’s results and shareholder outcomes.
13.2 Remuneration Processes
Remuneration Policy
The NAB Group’s Policy uses a range of components tofocus employees on achieving the NAB Group’s strategyand business objectives. The Policy is designed to:• attract, recognise, motivate and retain employees• drive employee performance• align the interests of employees and shareholders
through ownership of NAB securities• comply with jurisdictional remuneration regulations and
the NAB Group’s diversity, inclusion and pay equitycommitments.
Remuneration consists of both fixed and variablecomponents:• fixed remuneration provided as cash and benefits
(including employer superannuation)• short-term performance-based variable remuneration
reflecting both individual and business performance forthe current year, supporting the longer-term strategy ofthe NAB Group
• long-term performance based variable remunerationreflecting the longer-term business performance of theNAB Group.
The mix of fixed and variable remuneration is balanced toensure that fixed remuneration provides a sufficient level ofremuneration so that the variable remunerationcomponents can be fully flexible, including the possibility ofpaying no variable remuneration.
The remuneration mix at target is based on marketinformation and practices. In any year, the actual mix mayvary from target, given the overlay of businessperformance and individual performance.
Individual target remuneration must be approved by theBoard for the ELT and any other senior executives of theNAB Group (as determined by the Board).
In addition, the Board will approve and monitor theremuneration framework for senior managers and materialrisk takers. Individual target remuneration for other seniormanagers and material risk takers is approved by theappropriate senior manager in line with the Policy.
More details on variable remuneration arrangements areprovided in Section 13.4 Linking Performance andRemuneration and Section 13.5 Adjusting Remunerationfor Longer-Term Performance.
Pillar 3 report
2016
82

Remuneration
Other features of the Policy
Malus
The Board has absolute discretion, subject to compliancewith the law, to adjust any performance-based componentsof remuneration downwards, or to zero, to protect thefinancial soundness of the NAB Group. In addition, theBoard may vary vesting of deferred incentives and long-term incentives if the NAB Group’s financial performanceor risk management have significantly deteriorated over thevesting period. A qualitative overlay may be applied thatreflects the NAB Group’s management of business risks,shareholder expectations and the quality of the financialresults.
This discretion can be applied at any time and may impactunvested equity awards and performance-basedremuneration yet to be awarded, whether in cash or equity.In exercising its discretion, the Board will consider whetherthe remuneration is appropriate given later individual orbusiness performance. Malus may apply to anyemployees across the NAB Group, by division, by roleand/or employee, depending on circumstances.
Clawback
In the UK, variable remuneration for some UK MaterialRisk Takers, including retention awards, is subject toclawback for up to 7 years from the award date.
The UK employees will be required to repay, up to the fullamount, any performance-based remuneration, where theBoard (in its absolute discretion) determines that one ormore of the following circumstances have arisen before theseventh anniversary of the relevant award date:• the employee has participated in, or was responsible
for, conduct which resulted in significant losses to theNAB Group or relevant business
• the employee has failed to meet appropriate standardsof fitness and propriety
• the NAB Group has reasonable evidence of employeemisbehaviour or material error
• the NAB Group or the relevant business suffered amaterial failure of risk management, taking into accountthe employee’s level of responsibility.
Minimum shareholding policy
Members of the ELT are required to accumulate and retainNAB equity over a five year period from commencement inan ELT role, to the value of two times fixed remunerationfor the Group CEO and one times fixed remuneration forother senior executives.
Details of senior executive shareholdings in NAB are setout in NAB’s 2016 Annual Financial Report available onlineat www.nab.com.au.
Commencement, retention and guaranteed incentives
Commencement awards enable buy-out of unvested equityfrom previous employment. The amount, timing andperformance hurdles relevant to any such awards arebased on satisfactory evidence. The awards are primarilyprovided in the form of shares or performance rights,subject to performance hurdles, restrictions and certainforfeiture conditions, including forfeiture on resignation,
unique to each offer. Guaranteed incentives or bonusesdo not support the NAB Group’s performance-basedculture and are not provided as part of the Policy.
The NAB Group provides retention awards for keyemployees in roles where retention is critical over amedium-term timeframe (generally two to three years).These are normally provided in the form of shares orperformance rights, subject to a restriction period,achievement of individual performance standards andforfeiture conditions, including forfeiture on resignation.
Remuneration Policy Review
The Committee reviewed the Policy during 2016 to ensure:• that the Executive LTI performance hurdles support
delivery of the One NAB Plan (see Section 13.4 LinkingPerformance and Remuneration - Executive Long-TermIncentive Plan for further information)
• the minimum amount of STI deferred is comparable toexternal peers.
Risk and Financial Control Employees
Risk and financial control employees (as defined inparagraph 59(b) of CPS 510) are critical to effectivemanagement of risk across the NAB Group.
Independence from the business for these employees isassured through:• setting the remuneration mix so that variable
remuneration is not significant enough to encourageinappropriate behaviours while remaining competitivewith the external market
• the Risk or Finance function determining remunerationdecisions, and not the business the employees support
• performance measures and targets set align with theNAB Group and/or are specific to the Risk or Financefunction
• NAB Group performance and / or function performancebeing a key component for calculating employeevariable remuneration.
The Committee reviews remuneration structures for theseemployees and oversees the overall remunerationoutcomes for employees in these roles at least annually.
Pillar 3 report
2016
83
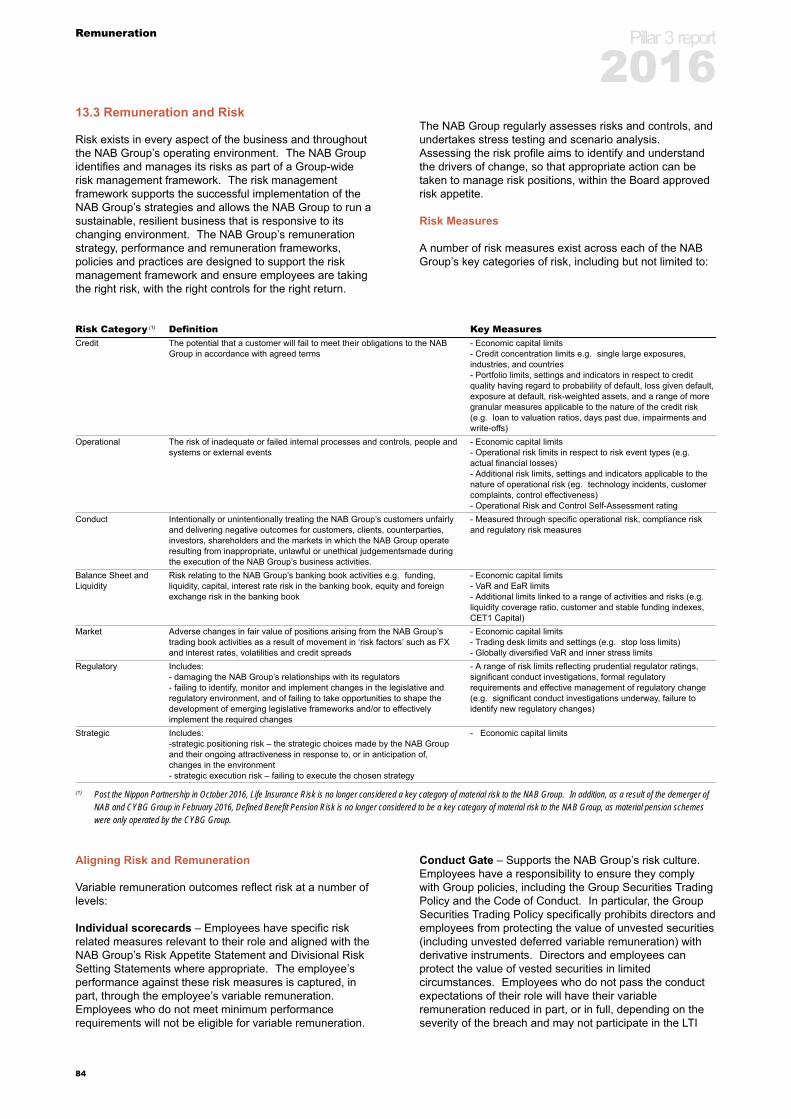
Remuneration
13.3 Remuneration and Risk
Risk exists in every aspect of the business and throughoutthe NAB Group’s operating environment. The NAB Groupidentifies and manages its risks as part of a Group-widerisk management framework. The risk managementframework supports the successful implementation of theNAB Group’s strategies and allows the NAB Group to run asustainable, resilient business that is responsive to itschanging environment. The NAB Group’s remunerationstrategy, performance and remuneration frameworks,policies and practices are designed to support the riskmanagement framework and ensure employees are takingthe right risk, with the right controls for the right return.
The NAB Group regularly assesses risks and controls, andundertakes stress testing and scenario analysis.Assessing the risk profile aims to identify and understandthe drivers of change, so that appropriate action can betaken to manage risk positions, within the Board approvedrisk appetite.
Risk Measures
A number of risk measures exist across each of the NABGroup’s key categories of risk, including but not limited to:
Risk Category (1) Definition Key MeasuresCredit The potential that a customer will fail to meet their obligations to the NAB
Group in accordance with agreed terms- Economic capital limits- Credit concentration limits e.g. single large exposures,industries, and countries- Portfolio limits, settings and indicators in respect to creditquality having regard to probability of default, loss given default,exposure at default, risk-weighted assets, and a range of moregranular measures applicable to the nature of the credit risk(e.g. loan to valuation ratios, days past due, impairments andwrite-offs)
Operational The risk of inadequate or failed internal processes and controls, people andsystems or external events
- Economic capital limits- Operational risk limits in respect to risk event types (e.g.actual financial losses)- Additional risk limits, settings and indicators applicable to thenature of operational risk (eg. technology incidents, customercomplaints, control effectiveness)- Operational Risk and Control Self-Assessment rating
Conduct Intentionally or unintentionally treating the NAB Group’s customers unfairlyand delivering negative outcomes for customers, clients, counterparties,investors, shareholders and the markets in which the NAB Group operateresulting from inappropriate, unlawful or unethical judgementsmade duringthe execution of the NAB Group’s business activities.
- Measured through specific operational risk, compliance riskand regulatory risk measures
Balance Sheet andLiquidity
Risk relating to the NAB Group’s banking book activities e.g. funding,liquidity, capital, interest rate risk in the banking book, equity and foreignexchange risk in the banking book
- Economic capital limits- VaR and EaR limits- Additional limits linked to a range of activities and risks (e.g.liquidity coverage ratio, customer and stable funding indexes,CET1 Capital)
Market Adverse changes in fair value of positions arising from the NAB Group’strading book activities as a result of movement in ‘risk factors’ such as FXand interest rates, volatilities and credit spreads
- Economic capital limits- Trading desk limits and settings (e.g. stop loss limits)- Globally diversified VaR and inner stress limits
Regulatory Includes:- damaging the NAB Group’s relationships with its regulators- failing to identify, monitor and implement changes in the legislative andregulatory environment, and of failing to take opportunities to shape thedevelopment of emerging legislative frameworks and/or to effectivelyimplement the required changes
- A range of risk limits reflecting prudential regulator ratings,significant conduct investigations, formal regulatoryrequirements and effective management of regulatory change(e.g. significant conduct investigations underway, failure toidentify new regulatory changes)
Strategic Includes:-strategic positioning risk – the strategic choices made by the NAB Groupand their ongoing attractiveness in response to, or in anticipation of,changes in the environment- strategic execution risk – failing to execute the chosen strategy
- Economic capital limits
(1) Post the Nippon Partnership in October 2016, Life Insurance Risk is no longer considered a key category of material risk to the NAB Group. In addition, as a result of the demerger ofNAB and CYBG Group in February 2016, Defined Benefit Pension Risk is no longer considered to be a key category of material risk to the NAB Group, as material pension schemeswere only operated by the CYBG Group.
Aligning Risk and Remuneration
Variable remuneration outcomes reflect risk at a number oflevels:
Individual scorecards – Employees have specific riskrelated measures relevant to their role and aligned with theNAB Group’s Risk Appetite Statement and Divisional RiskSetting Statements where appropriate. The employee’sperformance against these risk measures is captured, inpart, through the employee’s variable remuneration.Employees who do not meet minimum performancerequirements will not be eligible for variable remuneration.
Conduct Gate – Supports the NAB Group’s risk culture.Employees have a responsibility to ensure they complywith Group policies, including the Group Securities TradingPolicy and the Code of Conduct. In particular, the GroupSecurities Trading Policy specifically prohibits directors andemployees from protecting the value of unvested securities(including unvested deferred variable remuneration) withderivative instruments. Directors and employees canprotect the value of vested securities in limitedcircumstances. Employees who do not pass the conductexpectations of their role will have their variableremuneration reduced in part, or in full, depending on theseverity of the breach and may not participate in the LTI
Pillar 3 report
2016
84
Remuneration
Plan and/or may have deferred STI and/or LTI forfeited/lapsed. They may also be subject to other disciplinaryaction.
STI pool measures – The financial measures used todetermine the STI pool capture a number of material risks(see Section 13.4 Linking Performance and Remunerationfor further discussion on how the financial measures takeaccount of risk).
Risk adjustment of business outcomes – TheCommittee may recommend to the Board adjustment of thefinancial outcomes upon which variable remuneration isdetermined based on a qualitative overlay that reflects theNAB Group’s management of business risks, shareholderexpectations and the quality of the financial results.
During 2016, NAB Group’s material risk categories wereupdated:
• Defined Benefit Pension risk was removed as no longerconsidered material on full divestment of CYBG PLCthrough a demerger and Initial Public Offering inFebruary 2016
• Life Insurance was removed as no longer considered amaterial risk with the sale of 80% of NAB Wealth’s lifeinsurance business to Nippon Life Insurance Companywith effect from September 2016
• Conduct risk has been identified as a distinct materialrisk category as it directs the Group’s focus to customeroutcomes.
13.4 Linking Performance and Remuneration
Performance is linked to remuneration through both fixedand variable remuneration components.
Fixed remuneration is set based on a combination of theindividual's capability and experience, market position(assessed against the relevant NAB fixed remunerationrange), internal relativities, work performance and payequity considerations.
Short-Term Incentives
STI is determined based on a combination of business andindividual performance.
Business performance is measured by a mix of growth incash earnings, cash Return on Equity (ROE), and Returnon Total Allocated Equity (ROTAE). These measuresreasonably capture the effects of a number of materialrisks and minimise actions that promote short-term resultsat the expense of longer-term business growth andsuccess. The STI pool is calculated for the NAB Groupusing the following key performance measures:
Performance Measures Weighting- Group cash earnings 40%- ROE 30%- Group ROTAE 30%
An employee’s individual performance is assessed againstwhat they have delivered and how they have achieved theoutcomes. An employee’s scorecard defines performancemeasures and targets relevant to the employee’s role thatsupport delivery of the NAB Group’s longer-term strategy.
A behavioural assessment and conduct requirements alsoform part of the employee’s overall performance outcome.
Examples of performance measures used across the NABGroup in 2016 were:
Example Performance MeasuresCustomer - Customer Adocacy (Net Promoter Score) (1)
Shareholdervalue
- ROE- Cash earnings- Revenue- Expenses
Risk
- Risk Appetite Statement and Divisional RSS- Management of events/losses/breaches as incurredincluding material controllable events- Satisfies Prudential and Conduct requirements- 1st line risk accountabilities
Key deliverables
- Delivery of specific projects- Process/technology change- Employee engagement- Diversity and Inclusion
(1) Net Promoter Score® and NPS® are registered trademarks of Bain & Company,Satmetrix Systems and Fred Reichheld.
A portion of the STI is provided as deferred equity ordeferred cash. This allows time to confirm that the initialbusiness and individual performance outcomes arerealised and if not, for the STI to be adjusted downwards.
STI plans link to the NAB Group and business performanceby delivering smaller STI pools when performance is lessthan target and larger STI pools when performance isabove target.
Executive Long-Term Incentive Plan
The Executive LTI Plan helps to drive managementdecisions concerning the long-term prosperity of the NABGroup. The Executive LTI Plan has four to five yearperformance periods.
The performance measures for the Executive LTI awardedin respect of 2016 are:• NAB Group’s cash ROE growth compared to the other
three major Australian Banks (Australia and NewZealand Banking Group Limited, Commonwealth Bankof Australia and Westpac Group).
• NAB’s TSR performance relative to the TSRperformance of a selection of financial servicescompanies in the S&P/ASX 200.
A list of the companies used for the LTI TSR performancemeasure can be found online at www.nab.com.au. NABGroup’s cash ROE growth ranking and NAB’s TSR rankingcompared to the peer groups will determine the proportionof performance rights that will vest.
Customer Advocacy Incentive Award
Supporting NAB's focus on the customer, some executivesreceived a share award during 2016, aimed to rewardexecutives for NAB’s customer advocacy outcomes. Theaward is restricted for approximately 2 years and the levelof vesting is subject to achievement of NPS objectives setat the beginning of the performance period and serviceconditions.
Pillar 3 report
2016
85
Remuneration
Adjustment of Remuneration
Poor performance during a performance period will bereflected in the STI awarded or amount of LTI that vests atthe end of the vesting period. If performance issignificantly weak, this may result in no STI being awardedand/or no LTI vesting.
The Committee, in consultation with the BRC, reviewsfinancial and risk outcomes at the end of the performanceyear and recommends to the Board, the size of the STIpool, taking into account a qualitative overlay that reflectsthe NAB Group’s management of business risks (seeSection 13.3 Remuneration and Risk), shareholderexpectations and the quality of the financial results.
13.5 Adjusting Remuneration for Longer-TermPerformance
Longer-term performance is reflected in the design of NABGroup’s variable remuneration arrangements.
STI plans contain annual performance metrics that are setto achieve the NAB Group’s longer-term strategy. Deferralof a portion of the STI reward allows for the reward to beadjusted after the initial performance assessment to reflectlonger-term performance outcomes.
The NAB Group’s LTI plan has a minimum four yearperformance period to align management decisions withthe achievement of sustained positive performance by NABGroup.
Deferral Arrangements
STI rewards are subject to deferral for all senior managersand material risk takers depending on the STI plan andjurisdictional requirements:
Role Grouping Deferral Arrangement (1)
ELT50% of STI is deferred equally over 2yearsLTI is deferred for no less than 4 years.
Senior Managers and Material RiskTakers (not in categories below) 25% of STI is deferred for 1 year
UK Senior Managers and MaterialRisk Takers earning more than£500,000 variable remuneration
60% of STI is deferred over 3 years
Other UK Senior Managers andMaterial Risk Takers on Group STInot meeting de minimis conditions (2)
40% of STI is deferred for 3 years
UK Senior Managers and MaterialRisk Takers on Financial MarketsSpecialist Incentive Plan who areEGMs or GMs and earning lessthan £500,000 variableremuneration
50% of STI deferred equally over 3years
Other UK Senior Managers andMaterial Risk Takers on FinancialMarkets Specialist Incentive Plan
50% of STI deferred equally over 2years
(1) Other deferral arrangements apply to employees not identified as seniormanagers or material risk takers.
(2) De minimis conditions are variable remuneration is no more than 33% of totalremuneration and total remuneration is no more than £500,000 .
Deferred STI amounts are generally provided in eithershares or performance rights.
For UK Material Risk Takers, half of any ‘up-front’ cash STIpayment is provided as equity subject to a six monthretention period and a further six month retention period
applies to deferred STI and LTI after performanceconditions have been satisfied. The retained amounts arerestricted from being sold, transferred or exercised by theemployee during the retention period. No furtherperformance conditions apply to retention equity.
Deferred STI and unvested LTI may be further adjusted asdescribed in Section 13.2 Remuneration Processes –Malus and Clawback.
Once an award has vested or the performance restrictionshave ceased, no further adjustment or ‘Malus’ applies.Clawback may be applied to vested awards in the UK.
13.6 Forms of Variable Remuneration
The NAB Group provides variable remuneration in thefollowing forms:
Form Use
Cash
- All or a portion of the STI award that relates tothe current performance year- Occasionally for deferred STI where anemployee is entitled to receive deferred STI but hasceased employment with the NAB Group prior toallocation of any shares or performance rights- Retention and recognition awards- Commencement awards.
Shares
- Deferred STI (except as noted otherwise)- General employee share offers- Retention and recognition awards- Commencement awards.
Performance rights
- Deferred STI for executives receiving an LTIaward or for jurisdictional reasons- LTI awards- Retention and recognition awards- Commencement awards.
Generally, the NAB Group aims to provide deferred STIand LTI awards as equity to align the interests ofemployees and shareholders. Performance rights areprovided where NAB Group does not consider itappropriate to pay dividends during deferral or restrictionperiods.
The mix of different forms of variable remuneration isdependent on the employee’s role and external marketrelativities.
All employees are eligible to participate in an STI plan. STIawards will generally be provided in a combination of cashand equity as described above in Deferral Arrangements(see Section 13.5 Adjusting Remuneration for Longer-TermPerformance).
LTI awards are provided to senior executives of the NABGroup. Not all senior managers or material risk takers willparticipate in the LTI program. Senior managers andmaterial risk takers who do not participate in the LTIprogram will generally receive deferred STI shares.
Retention, recognition and commencement awards areprovided to an employee depending on circumstances.The quantum and form will vary depending on the specificcircumstances at the time of the award.
Pillar 3 report
2016
86
Remuneration
13.7 Quantitative Remuneration Disclosures
Table 13.7A: Total Value of Remuneration Awards
As at 30 Sep 16 As at 30 Sep 15Senior Managers Material Risk Takers Senior Managers Material Risk Takers
Unrestricted Deferred Unrestricted Deferred Unrestricted Deferred Unrestricted Deferred$000 $000 $000 $000 $000 $000 $000 $000
Fixedremuneration Cash-based (1) 17,784 - 15,666 - 18,503 - 14,662 -Other (2) 850 - 947 - 807 - 888 -Variableremuneration (3)
Cash-based (4) 10,233 - 13,554 - 9,391 - 11,425 -Equity (5) - 15,414 - 10,273 - 12,188 - 8,105
(1) Includes cash salary, cash allowances, short-term compensated absences (such as annual leave entitlements accrued but not taken during the year), motor vehicle benefits, parking,relocation costs and other benefits (including any related fringe benefits tax).
(2) Other fixed remuneration includes employer contributions to superannuation (in Australia and New Zealand) and National Insurance Contributions (in the UK) and long service leaveentitlements accrued but not taken during the year. The long service leave entitlements are recognised as accruing on an annual basis subject to an actuarial calculation.
(3) 26 (2015: 24) senior managers and 30 (2015: 27) material risk takers received variable remuneration in respect of the relevant year. In 2016, some senior managers and material risktakers did not receive variable remuneration as they ceased employment with the NAB Group during the relevant year.
(4) The cash component of the STI received in respect of the relevant year.(5) Equity includes all shares and share-linked instruments. Amounts are determined based on the grant date fair value amortised on a straight line basis over the expected vesting period.
The amount shown is the portion relating to the relevant year accounting expense accrual and includes amounts relating to the relevant year and prior year awards.
Table 13.7B: Deferred RemunerationAs at 30 Sep 16 As at 30 Sep 15Senior
ManagersMaterial Risk
TakersSenior
ManagersMaterial Risk
Takers$000 $000 $000 $000
Total outstanding deferred remuneration (1) 48,608 19,802 48,738 21,963Cash-based 867 - - -Equity 47,742 19,802 48,738 21,963Paid out during the year (2) 7,577 7,602 8,116 12,121Reductions due to explicit adjustments (3) (20,692) (1,833) (5,266) (3,044)Reductions due to implicit adjustments (1,083) (1,494) (269) (325)
(1) The value of deferred cash awards is the grant value and for deferred equity awards is the grant fair value. Outstanding deferred remuneration provided as shares and share-linkedinstruments is fully exposed to ex post explicit and/or implicit adjustments.
(2) Includes the value of vested awards using the closing share price of NAB shares on the vesting date for all senior managers and material risk takers during the relevant year.(3) Includes any reductions to awards as a result of forfeitures and lapses due to failure to meet performance hurdles, resignations, or malus adjustments for all senior managers and
material risk takers during the relevant year. The value was calculated using the closing share price of NAB shares on the forfeiture or lapsing date.
Table 13.7C: Other Remuneration
As at 30 Sep 16 As at 30 Sep 15Senior Managers Material Risk Takers Senior Managers Material Risk TakersNo. of
individualsTotal
amountNo. of
individualsTotal
amountNo. of
individualsTotal
amountNo. of
individualsTotal
amount$000 $000 $000 $000
Commencementawards (1) 2 3,676 1 2,035 1 1,002 2 551
Terminationpayments (2) 3 3,062 2 1,033 1 174 1 127
(1) The full value of these awards and payments is shown with no expensing adjustments made.(2) Termination payments are made in accordance with the relevant NAB Enterprise Agreement and/or the employee’s employment agreement. Employees may also retain shares and
performance rights in accordance with the relevant terms and conditions of each grant, which remain subject to the relevant performance hurdles and restriction periods. Thesearrangements are in line with the NAB Group’s policy and practice in such circumstances.
Pillar 3 report
2016
87
Remuneration
13.8 London Branch Remuneration Disclosures
The following quantitative disclosures are applicable to NAB’s London Branch operations only. They have been prepared inaccordance with Article 450 of the European Union Capital Requirements Regulation for the year ended 30 September 2016.All monetary amounts are in GBP.
Individuals included in this section of the disclosure meet the following definitions:
UK Material Risk Takers Roles
Senior Management Includes senior management of NAB’s London Branch operations and NAB Group senior management who havesignificant management accountability for NAB’s London Branch operations.
Other Material Risk TakersIncludes employees performing Significant Influence Functions, employees who have responsibility and accountability foractivities that could have a material impact on London Branch’s risk profile, and employees in independent riskmanagement, compliance or internal audit function roles.
Table 13.8A: Aggregate Remuneration of Material Risk Takers by Operating SegmentLondon Branch Independent
Control Function(1) Total
Number of Material Risk Takers 36 17 53Total remuneration (£000) 11,883 5,971 17,854
(1) Includes Risk, Internal Audit and Compliance employees.
Table 13.8B: Total Value of Remuneration AwardsSenior
ManagementOther Material
Risk Takers Total
Number of Material Risk Takers 28 25 53
Senior Management Other Material RiskTakers Total
£000 £000 £000Fixed remuneration 8,546 4,596 13,142Variable remuneration (cash) 1,386 980 2,366Variable remuneration (retained shares) 422 201 623Deferred remuneration (equity) (1) 1,009 714 1,723Deferred remuneration (cash) (1) - - -Total variable remuneration 2,817 1,895 4,712Total remuneration 11,363 6,491 17,854
(1) The NAB Group provides all deferred remuneration in Company equity or cash.
Table 13.8C: Deferred RemunerationSenior
ManagementOther Material
Risk Takers Total
£000 £000 £000Outstanding - vested 94 70 164Outstanding - unvested 3,498 1,904 5,402Awarded during the year 1,767 773 2,541Vested during the year 1,900 647 2,548Reductions during the year through performance adjustments (26) - (26)
Table 13.8D: Other RemunerationSenior
Management(1)Other Material
Risk Takers(1)
Termination payments (£000) 470 248Number of beneficiaries 2 2Highest award to a single beneficiary (£000) 275 134
(1) No sign-on bonuses, commencement or retention awards were provided to senior managers or material risk takers during 2016.
Pillar 3 report
2016
88

Remuneration
Table 13.8E: Remuneration by BandRemuneration band (£000) (1) Number of Material Risk Takers851 - 1,277 2Less than 851 51Total 53
(1) Total remuneration has been calculated including fixed remuneration, allowances, variable remuneration in relation to the performance year, and fees for non- executive directors.Variable remuneration includes the annual short-term incentive and the long-term incentive award in respect of the 2016 financial year. Bands have been converted using a rate of 1Euro = £0.8517, consistent with the European Commissions’ currency converter for September 2016.
Pillar 3 report
2016
89
Glossary
Section 14
Glossary
Term Description
ABCP Asset-Backed Commercial Paper being a form of commercial paper that is collateralised by other financial assets. It is a short-termdebt instrument created by an issuing party (typically a bank or other financial institution).
Additional regulatory provisionsThat portion of collective provisions covering facilities where any assessment of probability of default or loss would give rise to areasonable expectation that the facilities in question will need in the short term to be subject to a write-down or write-off, orassessment for impairment on an individual facility basis.
ADI Authorised Deposit-taking Institution.
Additional Tier 1 CapitalAdditional Tier 1 Capital comprises high quality components of capital that satisfy the following essential characteristics: (a) provide apermanent and unrestricted commitment of funds; (b) are freely available to absorb losses; (c) rank behind the claims of depositorsand other more senior creditors in the event of winding up of the issuer; and (d) provide for fully discretionary capital distributions
Advanced IRB approach (IRB)The Advanced Internal Ratings Based (IRB) approach refers to the processes employed by the NAB Group to estimate credit risk.This is achieved through the use of internally developed models to assess potential credit losses using the outputs from the PD, LGDand EaD models.
AMAAdvanced Measurement Approach (AMA) is the risk estimation process used for the NAB Group’s operational risk. It combinesinternally developed risk estimation processes with an integrated risk management process, embedded within the business with lossevent management.
ANZSIC Australian and New Zealand Standard Industrial Classification.APRA Australian Prudential Regulation Authority.APS Prudential Standards issued by APRA applicable to ADIs.
Alternative Liquid Assets (ALA)
Alternative liquid assets are made available in jurisdictions where there is insufficient supply of HQLA in the domestic currency tomeet the aggregate demand of banks with significant exposures in the domestic currency in the Liquidity Coverage Ratio (LCR)framework. The Committed Liquidity Facility (CLF) provided by the Reserve Bank of Australia to Australian banks is treated as anALA in the LCR.
Alternative StandardisedApproach (ASA) Alternative Standardised Approach is the risk estimation process used for the NAB Group’s operational risk.
Back-testing
Back-testing refers to the process undertaken to monitor performance of the NAB Group’s risk models. Historical data is used tocompare the actual outcomes to the expected outcomes.
Theoretical (or hypothetical) back-testing refers to the process whereby the trading positions at the end of the preceding day arerevalued using the end-of-day rates for that day and then again at the succeeding day’s closing rates. The difference between thetwo mark-to-market values of the portfolio which represents the profit and loss that would have occurred had there been notransactions on the day, is compared with the VaR. VaR is also compared with the actual daily traded profit and loss as a cross-check of the reasonableness of the theoretical portfolio movement.
Basel Accord
The Basel regulatory framework (which includes Basel II, Basel 2.5 and Basel III) is the global benchmark for assessing banks’capital adequacy. The guidelines are aimed at promoting a more resilient banking system through the development of capitaladequacy standards that are more accurately aligned with the individual risk profile of institutions, by offering greater flexibility forsupervisors to recognise and encourage the use of more sophisticated risk management techniques.
Board Board of Directors of NAB.BRC Board Risk Committee.
Capital adequacyCapital adequacy is the outcome of identifying and quantifying the major risks the NAB Group is exposed to, and the capital that theNAB Group determines as an appropriate level to hold for these risks, as well as its strategic and operational objectives, including itstarget credit rating.
Cash earnings
Cash earnings is defined as net profit attributable to owners of NAB from continuing operations, adjusted for the items NAB considersappropriate to better reflect the underlying performance of the NAB Group. Cash earnings for the September 2016 full year hasbeen adjusted for the following:- Distributions- Treasury shares- Fair value and hedge ineffectiveness- Life insurance economic assumption variation- Amortisation of acquired intangible assets- Sale and demerger transaction costs.
Cash Return on Equity (ROE) Cash ROE is calculated as cash earnings divided by average shareholders’ equity, excluding non-controlling interests and otherequity instruments and adjusted for treasury shares.
CDO Collateralised Debt Obligation.
Central Counterparty (CCP) A clearing house which interposes itself, directly or indirectly, between counterparties to contracts traded in one or more financialmarkets, becoming the buyer to every seller and the seller to every buyer.
CLO Collateralised Loan Obligation.
Committed Liquidity Facility(CLF)
The Reserve Bank of Australia will establish a committed liquidity facility (CLF) as part of Australia's implementation of the Basel IIIliquidity reform, which will provide high-quality liquidity to commercial banks to assist them in meeting the Basel III liquidityrequirements.
Common Equity Tier 1 (CET1)Capital
Common Equity Tier 1 (CET1) Capital is recognised as the highest quality component of capital. It is subordinated to all otherelements of funding, absorbs losses as and when they occur, has full flexibility of dividend payments and has no maturity date. It ispredominately comprised of common shares; retained earnings; undistributed current year earnings; as well as other elements asdefined under APS111 - Capital Adequacy: Measurement of Capital.
Conduct Gate All employees must satisfy threshold measures for compliance which reflect a range of internal and external regulatory requirements.
Corporate (including SME) Corporate (including SME) consists of corporations, partnerships or proprietorships not elsewhere classified and includes non-banking entities held by banks.
Pillar 3 report
2016
90
Glossary
Term Description
Credit derivativesCredit derivatives include single-name credit default and certain total rate of return swaps, cash funded credit linked notes and first-to-default and second-to-default credit derivative basket products. ADIs may also recognise many more complex credit derivativesthat do not fall into the list above, that have been approved by APRA.
Credit derivative transactions In relation to securitisation exposures, credit derivative transactions are those in which the credit risk of a pool of assets is transferredto the NAB Group, usually through the use of credit default swaps.
Credit enhancements
Credit enhancements are arrangements in which the NAB Group holds a securitisation exposure that is able to absorb losses in thepool, providing credit protection to investors or other parties to the securitisation. A first loss credit enhancement is available toabsorb losses in the first instance. A second loss credit enhancement is available to absorb losses after first loss creditenhancements have been exhausted.
Credit Value Adjustment (CVA) A capital charge to reflect potential mark-to-market losses due to counterparty migration risk on bilateral OTC derivative contracts.
The Credit Risk function All areas reporting directly to EGM Enterprise Risk & Chief Credit Officer including Operational Risk & Compliance, Risk Appetite &Analytics, Credit Risk, Risk Governance and Strategic Business Services.
Default Fund Clearing members’ funded or unfunded contributions towards, or underwriting of, a CCP’s mutualised loss sharing arrangements.
Derivative transactions In relation to securitisation exposures, derivative transactions include interest rate and currency derivatives provided to securitisationSPVs, but do not include credit derivative transactions.
EaD Exposure at Default (EaD) is an estimate of the total committed credit exposure expected to be drawn at the time of default for acustomer or facility that the NAB Group would incur in the event of a default. It is used in the calculation of RWA.
Earnings at Risk (EaR) Earnings at Risk (EaR) is a mathematical technique that uses statistical analysis of historical data to estimate the likelihood that agiven portfolio’s net interest margin losses will exceed a certain amount over a 12 month period.
Economic capital Economic capital represents the NAB Group’s internal assessment of the amount of capital required to protect against potentialunexpected future losses arising from its business activities, in line with its target credit rating.
Economic profit Economic profit represents cash earnings less capital costs whereby capital costs is allocated equity multiplied by the cost of equity.
ELE The Extended Licensed Entity (ELE) comprises the ADI itself and any APRA approved subsidiary entities assessed as effectivelypart of a single ‘stand-alone’ entity, as defined in Prudential Standard APS 222 Associations with Related Entities.
Eligible financial collateral
Eligible financial collateral, under the standardised approach, will be the amount of cash collateral, netting and eligible bonds andequities. Eligible financial collateral, under the IRB approach, for corporate, sovereign and bank portfolios, is limited to the collateralitems detailed in paragraphs 4 and 23 of Attachment G of APS 112. Recognition of eligible financial collateral is subject to theminimum conditions detailed in that same Attachment, paragraph 6.
ESG Risk Environmental, Social and Governance Risk.
Fair value The price that would be received to sell an asset or paid to transfer a liability in an orderly transaction between market participants atmeasurement date.
Foundation IRB (FIRB)Foundation Internal Ratings Based (FIRB) approach refers to an alternative approach to advanced IRB defined under the BaselAccord where a Group develops its own PD models and seeks approval from its regulator to use these in the calculation of regulatorycapital, and the regulator provides a supervisory estimate for LGD and EaD.
General Reserve for CreditLosses (GRCL)
The general reserve for credit losses (GRCL) is an estimate of the reasonable and prudent expected credit losses over the remaininglife of the portfolio and on non-defaulted assets. The reserve is a compliance requirement under APS 220 - Credit Quality. TheGRCL is calculated as a collective provision for doubtful debts, excluding securitisation and provision on default no-loss assets. Thedifference between the GRCL and accounting collective provision is covered with an additional top-up, created through a transferfrom retained earnings to a reserve, to reflect losses expected as a result of future events that are not recognised in the NAB Group’scollective provision for accounting purposes.
GRCL calculation methodology
The GRCL is calculated as a collective provision for doubtful debts, excluding securitisation and provision on default no-loss assets.The difference between the GRCL and accounting collective provision is covered with an additional top-up, created through atransfer from retained earnings to reflect losses expected as a result of future events that are not recognised in the NAB Group’scollective provision for accounting purposes. All collective provisions on defaulted or otherwise non-performing assets, regardless ofexpected loss, are reported as additional regulatory specific provisions.
GRRMC Group Risk Return Management Committee.
Guarantees
Guarantors under the standardised approach are recognised according to APS 112 Attachment F paragraph 3. The secured portionof an exposure is weighted according to the risk weight appropriate to the guarantor and the unsecured portion is weighted accordingto the risk weight applicable to the original counterparty (Refer to Attachment A for the appropriate risk weights). Under the IRBapproach, for corporate, sovereign and bank portfolios, the ADI may recognise credit risk mitigation in the form of guarantees andcredit derivatives according to the FIRB substitution approach where an ADI uses supervisory estimates of LGD (refer to APS 113Attachment B paragraph 49), an AIRB substitution approach where the ADI has approval from APRA to use its own estimates ofLGD (refer to APS 113 Attachment B paragraph 60) and, for certain exposures, a double default approach (refer to APS 113Attachment B paragraph 67). An ADI may decide, separately for each eligible exposure, to apply either the relevant substitutionapproach or the double default approach. For retail portfolios there are two approaches for the recognition of credit risk mitigation inthe form of guarantees and credit derivatives under the retail IRB approach, a substitution approach (refer to APS 113 Attachment Cparagraph 19) and, for certain exposures, a double default approach (refer to APS 113 Attachment C paragraph 28). An ADI maydecide separately for each eligible exposure to apply either the substitution approach or the double default approach.
High Quality Liquid Assets(HQLA)
HQLA refers to high quality liquid assets determined in accordance with APS 210 Liquidity (APS210). These assets include notesand coins, central bank reserves and highly rated marketable securities issued or guaranteed by central banks or governments.
IAA Internal Assessment Approach.
ICAAPInternal Capital Adequacy Assessment Process (ICAAP) is the mechanism developed and used by the NAB Group to determinecapital requirements as outlined under Basel III. It results in the NAB Group identifying and assessing all risks to which it is exposedand allocating an appropriate level of capital to each.
IFRS International Financial Reporting Standards.
IMAInternal Model Approach (IMA) describes the approach used in the assessment of traded market risk. The NAB Group uses, underapproval from APRA, the IMA to calculate general market risk for all transactions in the trading book other than those covered by theStandard Method.
Pillar 3 report
2016
91
Glossary
Term Description
Impaired facilities
Impaired facilities consist of:- Retail loans (excluding unsecured portfolio managed facilities) which are contractually past due 90 days with security insufficient tocover principal and arrears of interest revenue- Non-retail loans which are contractually past due and there is sufficient doubt about the ultimate collectability of principal andinterest; and- Impaired off-balance sheet credit exposures where current circumstances indicate that losses may be incurred.- Unsecured portfolio managed facilities are also classified as impaired assets when they become 180 days past due (if not writtenoff).
Investment earnings onRetained Earnings (IoRE)
Investment earnings (net of tax) on shareholders’ retained profits and capital from life businesses, net of capital funding costs, IoREis comprised of three items:- Investment earnings on surplus assets which are held in the Statutory Funds to meet capital adequacy requirements under the LifeInsurance Act 1995 (Cth);- Interest on deferred acquisition costs (net of reinsurance) included in insurance policy liabilities resulting from the unwind ofdiscounting; andLess the borrowing costs of any capital funding initiatives.
IoRE discount rate variation The profit impact of a change in value of deferred acquisition costs (net of reinsurance) included in insurance policy liabilitiesresulting from a movement in the inflation adjusted risk-free discount rate.
IRB approachThe internal ratings based (IRB) approach refers to the processes employed by the NAB Group to estimate credit risk. This isachieved through the use of internally developed models to assess the potential credit losses using the outputs from the probability ofdefault, loss given default and exposure at default models.
IRRBB Interest rate risk in the banking book.
Level 2 Group The Level 2 Group, being NAB and the entities it controls subject to certain exceptions set out in Section 2 Scope of Application ofthis report.
Level 3 conglomerate Group Contains APRA-regulated entities with material operations across more than one APRA-regulated industry and/or unregulatedentities.
Leverage RatioThe Leverage Ratio is a simple, transparent; non-risk based supplementary measure that use exposures to supplement the risk-weighted assets based capital requirements and is prepared in accordance with APRA’s Prudential Standard APS110: CapitalAdequacy.
LGD Loss Given Default (LGD) is an estimate of the expected severity of loss for a credit exposure following a default event. RegulatoryLGDs reflect a stressed economic condition at the time of default. It is used in the calculation of RWA.
Liquidity Coverage Ratio (LCR)LCR is a new measure announced as part of the Basel III liquidity reforms that came into force on 1 January 2015. The ratiomeasures the amount of high quality liquid assets held that can be converted to cash easily and immediately in private markets, tototal net cash flows required to meet the NAB Group’s liquidity needs for a 30 day calendar liquidity stress scenario.
Liquidity facilitiesLiquidity facilities are provided by the NAB Group to an SPV for the primary purpose of funding any timing mismatches betweenreceipts of funds on underlying exposures and payments on securities issued by the SPV (asset liquidity facilities), or to cover theinability of the SPV to roll over ABCP (standby liquidity facilities).
Loan to value ratio Loan to Value Ratio (LVR) is the ratio between the loan and value of the security provided.
Masterscale Masterscale is a consistent series of grades applied to credit exposures that allows the NAB Group to place every credit exposureinto a specific grade or range that represents the likelihood of a credit default. This allows comparison of customers and portfolios.
NAB National Australia Bank Limited ABN 12 004 044 937.NAB Group NAB and its controlled entities.
Net Promoter Score (NPS)
NPS is a customer advocacy measure used in many industries, including financial services. NPS measures how likely a customerwould be to recommend NAB to a friend or colleague. It is based on one key question: ‘On a scale of 0 - 10, how likely would you beto recommend NAB to your friend or colleague?’ The overall score is calculated by subtracting the percentage of customers thatanswer 6 or below (‘detractors’) from the percentage of customers that answer 9 or 10 (‘promoters’). NPS allows for continuouscustomer feedback providing a greater understanding of what matters to customers to improve the customer experience.
While the segments referenced are NAB defined customer segments, the score is derived using industry provided survey data fromRoy Morgan Research for Consumer customers and the Business Financial Services Monitor provided by DBM Consulting forBusiness customers.
Net Stable Funding Ratio(NSFR)
NSFR is a measure announced as part of the Basel III liquidity reforms that will apply from January 2018. The ratio establishes aminimum acceptable amount of stable funding (the portion of those types and amounts of equity and liability financing expected to bereliable sources of funds over a one-year time horizon under conditions of extended stress) based on the liquidity characteristics ofan ADI’s assets and activities over a one-year horizon. Finalised requirements are still to be outlined by the Basel Committee andAPRA.
Net write-offs Write-offs on loans at amortised cost and Fair Value loans net of recoveries.Non-retail credit Non-retail credit broadly refers to credit exposure to business customers. It excludes retail credit defined below.Non-traded book Non-traded book refers to the investment in securities held by the NAB Group through to maturity.The Operational Risk function All areas reporting directly to the General Manager, Operational Risk and Compliance.
Past due facilities ≥ 90 days Past due facilities ≥ 90 days consist of well-secured assets that are more than 90 days past due and portfolio-managed facilities thatare not well secured and between 90 and 180 days past due.
Performance rights
A performance right is a right to acquire one NAB ordinary share, once the performance right has vested based on achievement ofthe related performance hurdle or at the Board’s discretion. Each performance right entitles the holder to be provided with one NABordinary share subject to adjustment for capital actions. A performance right is issued at no charge to the employee employee andthere is no exercise price to be paid to exercise the performance right. Performance rights may be used instead of shares due tojurisdictional reasons including awards such as deferred STI and commencement and other retention programs. The terms andconditions, including lapsing, will vary for each particular grant. Performance rights are issued by NAB under the National AustraliaBank Performance Rights Plan. The design of the performance rights plan (and the expected outcome for senior executives) seeksto comply with ASX Corporate Governance Principles and Recommendations, and those set out in the Investment and FinancialServices Association’s (IFSA) ‘Executive Equity Plan Guidelines’, Guidance Note 12. The main departure from the IFSA guidelinesis that performance rights issued by NAB have no exercise price. Shares will be issued on exercise of performance rights. Nodividend income is provided to the employee until the end of the restriction period and the performance conditions have been metand the performance rights are exercised.
Pillar 3 report
2016
92
Glossary
Term Description
PD Probability of Default (PD) is an estimate of the likelihood of a customer defaulting or not repaying their borrowings and otherobligations to the NAB Group in the next 12 months.
Point in Time Point in Time (PiT) within this document refers to risk models that estimate the likelihood of default and resulting loss over a 12-month period having regard to the current economic conditions.
Qualifying revolving retailexposures For the purposes of regulatory reporting, credit cards are referred to as qualifying revolving retail.
RBA Reserve Bank of Australia.
Regulatory capitalRegulatory capital is the total capital held by the NAB Group as a buffer against potential losses arising from the business the NABGroup operates in. Unlike economic capital, it is calculated based on guidance and standards provided by the NAB Group’sregulators, including APRA. It is designed to support stability in the banking system and protect depositors.
Regulatory expected lossRegulatory Expected Loss (EL) is a calculation of the estimated loss that may be experienced by the NAB Group over the next 12months. Regulatory EL calculations are based on the PD, LGD and EaD values of the portfolio at the time of the estimate whichincludes stressed LGDs for economic conditions. As such, regulatory EL is not an estimate of long-run average expected loss.
ResecuritisationResecuritisation exposures are securitisation exposures in which the risk associated with an underlying pool of exposures is tranchedand at least one of the underlying exposures is a securitisation exposure. In addition, an exposure to one or more resecuritisationexposures is a resecuritisation exposure.
Retail credit
For the purposes of managing credit, two broad categories are used: retail credit and non-retail credit. This reflects the differentapproaches to the sales and ongoing management of credit and is consistent with the approach required under the Basel Accord.Retail credit refers to the credit provided to retail or personal customers. For the purposes of regulatory capital, retail credit iscategorised into four groups: residential mortgages, credit cards (or qualifying revolving credit), retail SME and other.
Return on Total Allocated Equity(ROTAE)
ROTAE is a function of cash earnings, combined divisional RWA (and by capital adequacy for Wealth Management) and targetregulatory capital ratios.
Risk appetite Risk appetite defines the level of risk the NAB Group is prepared to accept as part of its business. The resulting level of risk is adirect input into the NAB Group’s capital requirements.
Risk Management Framework(RMF) NAB identifies and manages risk using the RMF.
Risk-Weighted Assets (RWA) A quantitative measure of the NAB Group’s risk, required by the APRA risk-based capital adequacy framework, covering credit riskfor on- and off-balance sheet exposures, market risk, operational risk and interest rate risk in the banking book.
RMC Risk Management Committee.Securities Securities include the purchase of securitisation debt securities for either trading or banking book purposes.
Securitisation Structured finance technique which involves pooling, packaging cash-flows and converting financial assets into securities that can besold to investors.
Senior executives Persons who are (or were) members of the Executive Leadership Team, including executive directors.
Senior managers
Consistent with paragraph 21 of APS 330 and paragraph 59(a) of Prudential Standard CPS 510 Governance (CPS 510), seniormanagers are Responsible Persons under the NAB Group’s Fit and Proper Policy, including members of the NAB Group ExecutiveLeadership Team, senior managers who are members of the NAB GRRMC and business line Chief Risk Officers. Non-executivedirectors of the NAB Group and NAB’s appointed auditor are excluded.London Branch senior managers are defined in Section 13.8.
SME Small and medium sized enterprises.SGA Specialised Group Assets.
Specific provisions Specific provisions for prudential purposes include all provisions for impairment assessed on an individual basis in accordance withIFRS excluding securitisation.
Sponsor The entity that establishes the securitisation SPVs including ABCP conduits and often provides other services.
Standardised approachStandardised refers to an alternative approach to the assessment of risk (notably credit and operational) whereby the institution usesexternal rating agencies to assist in assessing credit risk and/or the application of specific values provided by regulators to determineRWA.
Statutory Fund A Statutory Fund is a fund that is established in the records of a life company; and relates solely to the life insurance business ofNAB or a particular part of that business.
Stress testing Stress testing refers to a technique whereby the NAB Group’s capital position is assessed against a number of different scenariosused to determine the movement on expected losses and subsequent impact on capital.
Through the cycle Through the Cycle (TtC) within this document refers to risk models that estimate the likelihood of default and resulting loss over a 12-month period having regard to the impact of an economic downturn.
Tier 1 Capital Tier 1 Capital comprises Common Equity Tier 1 (CET1) Capital and instruments issued by the NAB Group that meet the criteria forinclusion as Addition Tier 1 capital set out in APS111 - Capital Adequacy: Measurement of Capital
Tier 1 Capital ratio Tier 1 Capital as defined by APRA divided by RWA.
Tier 2 Capital Tier 2 Capital includes other components of capital that, to varying degrees, fall short of the quality of Tier 1 Capital but nonethelesscontribute to the overall strength of an ADI and its capacity to absorb losses.
Tier 2 Capital ratio Tier 2 Capital as defined by APRA divided by RWA.Total Capital Total capital is the sum of Tier 1 capital and Tier 2 capital, as defined by APRA.Total Capital ratio Total capital ratio is the sum of Tier 1 capital and Tier 2 capital, as defined by APRA, divided by risk-weighted assets.
Total Shareholder Return (TSR)Total Shareholder Return (TSR) is a concept used to compare the performance of different companies’ securities over time. Itcombines share price appreciation and dividends paid to show the total return to the shareholder. The absolute size of the TSR willvary with stock markets, but the relative position reflects the market perception of overall performance relative to a reference group.
Traded book Traded book refers to the NAB Group’s investment portfolio that is traded or exchanged in the market from time to time that reflectsmarket opportunities.
Value at Risk (VaR) Value at Risk (VaR) is a mathematical technique that uses statistical analysis of historical data to estimate the likelihood that a givenportfolio’s losses will exceed a certain amount.
Warehouse facilities Warehouse facilities are lending facilities provided by the NAB Group to an SPV for the financing of exposures in a pool. These maybe on a temporary basis pending the issue of securities or on an on-going basis.
Write-offs Write-offs represent credit losses in accordance with accounting rules.
Pillar 3 report
2016
93

Reference to APS 330 Tables
Section 15
Reference to APS 330 Tables
Table of Contents Reference Title APS 330 ReferenceTable 4.1A Risk-Weighted Assets APS 330 Table 6b-fTable 4.1B Capital Ratios APS 330 Table 6gTable 4.2A Regulatory Capital Structure n/aTable 5.1A Credit Risk Exposures Summary APS 330 Table 7iTable 5.1B Total and Average Credit Risk Exposures APS 330 Table 7bTable 5.1C Exposures by Geography APS 330 Table 7cTable 5.1D Exposures by Industry APS 330 Table 7dTable 5.1E Exposures by Maturity APS 330 Table 7eTable 5.1F Provisions by Asset Class APS 330 Table 9eTable 5.1G (i) Loss Experience APS 330 Table 9fTable 5.1G (ii) Accuracy of Risk Estimates – PD and EaD APS 330 Table 9fTable 5.1G (iii) Accuracy of Risk Estimates – LGD APS 330 Table 9fTable 5.1H Provisions by Industry APS 330 Table 7fTable 5.1I Provisions by Geography APS 330 Table 7gTable 5.1J Movement in Provisions APS 330 Table 7hTable 5.2A Standardised Exposures by Risk Weight APS 330 Table 8bTable 5.2B Standardised Exposures by Risk Grade n/aTable 5.2C Supervisory Slotting by Risk Weight APS 330 Table 8bTable 5.3A Non-Retail Exposure by Risk Grade APS 330 Table 9dTable 5.3B Retail Exposure by Risk Grade APS 330 Table 9dTable 5.4A Mitigation by Eligible Collateral APS 330 Table 10bTable 5.4B Mitigation by Guarantees and Credit Derivatives APS 330 Table 10cTable 5.5A(i) Net Derivatives Credit Exposure APS 330 Table 11bTable 5.5A(ii) Distribution of Current Credit Exposure APS 330 Table 11bTable 5.5B Credit Derivative Transactions APS 330 Table 11cTable 6.1A Total Securitisation Exposures n/aTable 6.1B Type of Exposure APS 330 Table 12kTable 6.1C Recent Third Party Securitisation Activity n/aTable 6.1D Exposures by Risk Weight APS 330 Table 12lTable 6.1E Exposures Deducted from Capital APS 330 Table 12lTable 6.2A Assets Securitised by the Level 2 Group APS 330 Table 12g & hTable 6.2B Recent Securitisation Activity APS 330 Table 12jDisclosure 6.2C Securitisation Subject to Early Amortisation APS 330 Table 12mDisclosure 6.2D Forthcoming Securitisation Activity by the Level 2 Group APS 330 Table 12iDisclosure 6.2E Credit Risk Mitigation and Guarantors APS 330 Table 12nn/a n/a APS 330 Table 12o – wTable 7.1A Standard Method Risk-Weighted Assets APS 330 Table 13bTable 7.1B Total Risk-Weighted Assets n/aTable 7.1C Internal Model Approach VaR APS 330 Table 14dTable 7.1D Internal Model Approach Stressed VaR APS 330 Table 14dTable 7.1E Back-testing Results APS 330 Table 14dTable 8A Total Risk-Weighted Assets n/aTable 9.2A Interest Rate Risk in the Banking Book APS 330 Table 17bTable 9.2B Total Risk-Weighted Assets n/aTable 9.3A Equities Banking Book Position APS 330 Table 16b-cTable 9.3B Gains and Losses on Equities Investments APS 330 Table 16d-eDisclosure 9.3C Equity Investments Subject to Grandfathering Provision APS 330 Table 16fTable 10.1 Leverage Ratio Disclosure APS 330 Attachment E Table 18, 18a
Table 10.2 Summary comparison of accounting assets vs leverage ratioexposure measure APS 330 Attachment E Table 19
Table 11.1 Liquidity Coverage Ratio disclosure APS 330 Attachment F Table 20Table 12.1 Common Disclosure Template – Regulatory Capital APS 330 Attachment ATable 12.2 Level 2 Regulatory Balance Sheet APS 330 Para 12a, 12c, 12d
Table 12.3 Reconciliation between the Common Disclosure Templateand Level 2 Regulatory Balance Sheet APS 330 Para 12d
Table 12.4A Insurance and Fund Management Entities APS 330 Para 12b, Para 12Table 12.4B Securitisation Entities APS 330 Para 12b, Para 12
Table 12.5A Countercyclical Capital Buffer – Private Sector CreditExposures APS 330 Attachment A, Para 2
Section 13.1-13.6 Remuneration APS 330 Attachment G Table 21a-g
Pillar 3 report
2016
94

Reference to APS 330 Tables
Table of Contents Reference Title APS 330 ReferenceTable 13.7A Total Value of Remuneration Awards APS 330 Attachment G Table 21h,jTable 13.7B Deferred Remuneration APS 330 Attachment G Table 21i,kTable 13.7C Other Remuneration APS 330 Attachment G Table 21h
Table 13.8A Aggregate Remuneration of Material Risk Takers byOperating Segment n/a
Table 13.8B Total Value of Remuneration Awards n/aTable 13.8C Deferred Remuneration n/aTable 13.8D Other Remuneration n/aTable 13.8E Remuneration by Band n/a
Pillar 3 report
2016
95