Embed Size (px)
Citation preview

2016 Pillar III Disclosure
ALBILAD INVESTMENT COMPANY
Page 2 of 15
Table of Contents
Contents
1 Background .............................................................................................................................................................. 3
2 Scope of Application ................................................................................................................................................ 3
3 Capital Structure ...................................................................................................................................................... 4
4 Capital Adequacy ..................................................................................................................................................... 5
5 Risk Management .................................................................................................................................................... 6
5.1 Risk Management Governance ........................................................................................................................... 6
5.2 Pillar III Governance............................................................................................................................................. 7
5.3 Credit Risk and Counterparty Credit Risk ............................................................................................................ 7
5.4 Credit Risk mitigation .......................................................................................................................................... 8
5.5 Market Risk .......................................................................................................................................................... 9
5.6 Operational Risk .................................................................................................................................................. 9
5.7 Operational Risk Assessment .............................................................................................................................. 9
5.8 Liquidity Risk ...................................................................................................................................................... 10
LIST OF TABLES Table1 : Capital Structure .......................................................................................................................................... 4
Table 2: A comparison of Capital Adequacy ratio of 2015 & 2016 ........................................................................... 6
Table 3: Credit Quality Steps and CRA mapping ........................................................................................................ 7
Table 4: Geographic Distribution of Exposures ....................................................................................................... 8
Table 5: Residual Contractual Maturity Profile ......................................................................................................... 8
Table 6: Operational Risk Capital ............................................................................................................................. 10
Table 7: Liquidity Risk Bucketing ............................................................................................................................. 10
Page 3 of 15
1 Background
AlBilad Investment Company (“the Company”) is authorized and regulated by the Capital Market Authority
(“CMA”) as the investment entity of Bank AlBilad (an Islamic Sharia compliant bank). The Capital requirement
for the firm is determined in accordance with the CMA regulations set out in Part 7 and Annex 10 of the
Prudential Rules for Pillar III - Disclosure & Reporting. The Prudential Rules emphasize the requirements for
authorized persons’ financial prudence and the requirement to present a framework composed of three
pillars:
Pillar I: defines the minimum capital requirements, (the firm has to maintain at all times capital
resource in excess or equivalent to the amount of the capital required).
Pillar II: outlines the process for the assessment of all risks, capital adequacy once all risks are taken
into consideration and the determination as to whether any additional capital should be assigned to
cover the additional risks not covered in Pillar I. This process is conducted internally and shall be
approved by the Board of Directors.
Pillar III: provides the rules for the disclosure of capital and risk management information, and requires
the firm to publish that information. The disclosure shall be reviewed and updated on an annual basis
on website www.albilad-capital.com
The purpose of Pillar III is to ensure that authorized persons have assessed the key pieces of information which
includes Capital, Risk exposure, Risk Assessment Process and the capital adequacy requirements. It shall
therefore rearrange the disclosure requirements as set out in Annexure 10 of the Prudential Regulation as well
as includes additional suggested disclosure requirements with illustrative forms to provide added quality for
the Pillar III disclosures.
The current Pillar III Report is prepared for AlBilad Investment Company.
2 Scope of Application
The Company is a limited liability company incorporated in the Kingdom of Saudi Arabia under the
Commercial Registration No. 1010240489 dated 11 Dhal Qaeda 1428H (corresponding to November 20, 2007)
issued in Riyadh. The Company is the investment banking arm of Bank AlBilad, a full commercial bank
authorized by the Saudi Arabian Monetary Agency (“SAMA”) and operating under Islamic Sharia principles.
The Company was formed in accordance with the CMA Resolution No. 2-38-2007 dated 8 Rajab 1428H
(corresponding to July 22, 2007) .The Company is CMA licensed to offer investment services such as Asset
Management, Brokerage, Margin Financing, Investment Banking , Arranging , underwriting , custody along
Page 4 of 15
with Research and Advisory services that comply with the Sharia rules. The main services offered are organized
around brokerage, asset management and investment banking. The Company offers only Islamic investment
solutions based on Sharia principles and is backed by a team of professionals with wide experience in
providing investment services and solutions to individual and institutional clients within the Kingdom of Saudi
Arabia.
AlBilad Capital , based on the existing business model and the liquidity in overall business didn’t suffer any
material or legal impediment to the prompt transfer of capital or repayment of liabilities between AlBilad
Capital and the related business partners/subsidiaries/associates. At the same time AlBilad Capital have
investment in a subsidiary that has been disclosed separately in the Financial Statements at the time of
preparing and publishing this disclosure.
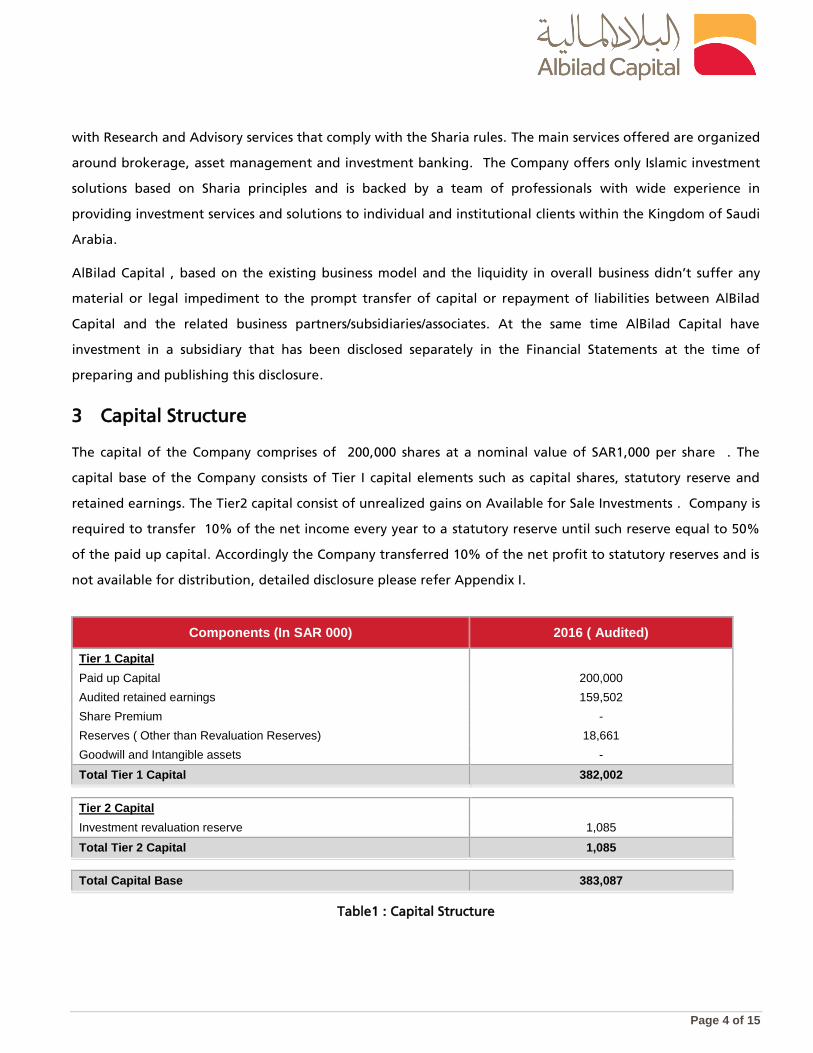
3 Capital Structure
The capital of the Company comprises of 200,000 shares at a nominal value of SAR1,000 per share . The
capital base of the Company consists of Tier I capital elements such as capital shares, statutory reserve and
retained earnings. The Tier2 capital consist of unrealized gains on Available for Sale Investments . Company is
required to transfer 10% of the net income every year to a statutory reserve until such reserve equal to 50%
of the paid up capital. Accordingly the Company transferred 10% of the net profit to statutory reserves and is
not available for distribution, detailed disclosure please refer Appendix I.
Components (In SAR 000) 2016 ( Audited)
Tier 1 Capital
Paid up Capital 200,000
Audited retained earnings 159,502
Share Premium -
Reserves ( Other than Revaluation Reserves) 18,661
Goodwill and Intangible assets -
Total Tier 1 Capital 382,002
Tier 2 Capital
Investment revaluation reserve 1,085
Total Tier 2 Capital 1,085
Total Capital Base 383,087
Table1 : Capital Structure
Page 5 of 15
4 Capital Adequacy
The Company has a positive capital ratio after taking into consideration risks which the Company is subject to,
and applying appropriate capital charges. The Company monitors its capital positions and capital requirements
to cover all kinds of risk under (Pillar 1) - credit, market and operational risk as per the Prudential Regulations.
Moreover, it produces a monthly Capital Adequacy Model Report to the CMA. All new usages of capital are
thoroughly considered in the context of their risk-return profile and capital impact. Furthermore the Company
considers it prudent to maintain a capital buffer above minimum capital requirements at all times. This is
reflected in the risk appetite statement of the Company.
According to the Prudential Rules, CMA has prescribed the framework and guidance regarding the minimum
regulatory capital requirements and its calculations. Prudential rules are based on Pillar I, Pillar II and Pillar III .
Pillar III regulates how information’s regarding risk management, capital requirements, capital adequacy etc.
should be made to Public.
AlBilad’ s approach in assessing its capital adequacy to support current as well as future business activities
works around the following principles :
The capital requirements for the new business model will be assessed in relation to its risk profile by
doing a test analysis of the Risk before implementing any new business strategy to ensure that the
Company’s revised capital ratio will be in line with the minimum capital requirements of CMA and the
buffer required by the Board risk appetite statement .
Review of Internal Capital Adequacy Assessment Process (ICAAP) , prepared by the Risk department,
reviewed by Audit Committee and final approval by the Board of directors.
The Company always maintains above the minimum capital ratio to ensure the business continuity,
which avoids interruptions while implementing new business policies .
The Company’s capital projections represents conservative levels of capital to support its projected
activities, cover all material risks and are in line with its risk appetite and operating environment.
The above monitoring and control procedures are applied at an early stage to prevent capital from falling
below the minimum levels as required to the Risk profile. The Company consistently maintains capital
adequacy ratio above 1 as required by the Capital Market Authority . The total capital base has been increased
by 12% with adequate surplus capital to implement future business plans in line with regulations . Also the
credit risk has been increased as the Company started activating the Margin Murabaha financing to its clients
that has proportionately decreased the surplus capital.
Page 6 of 15
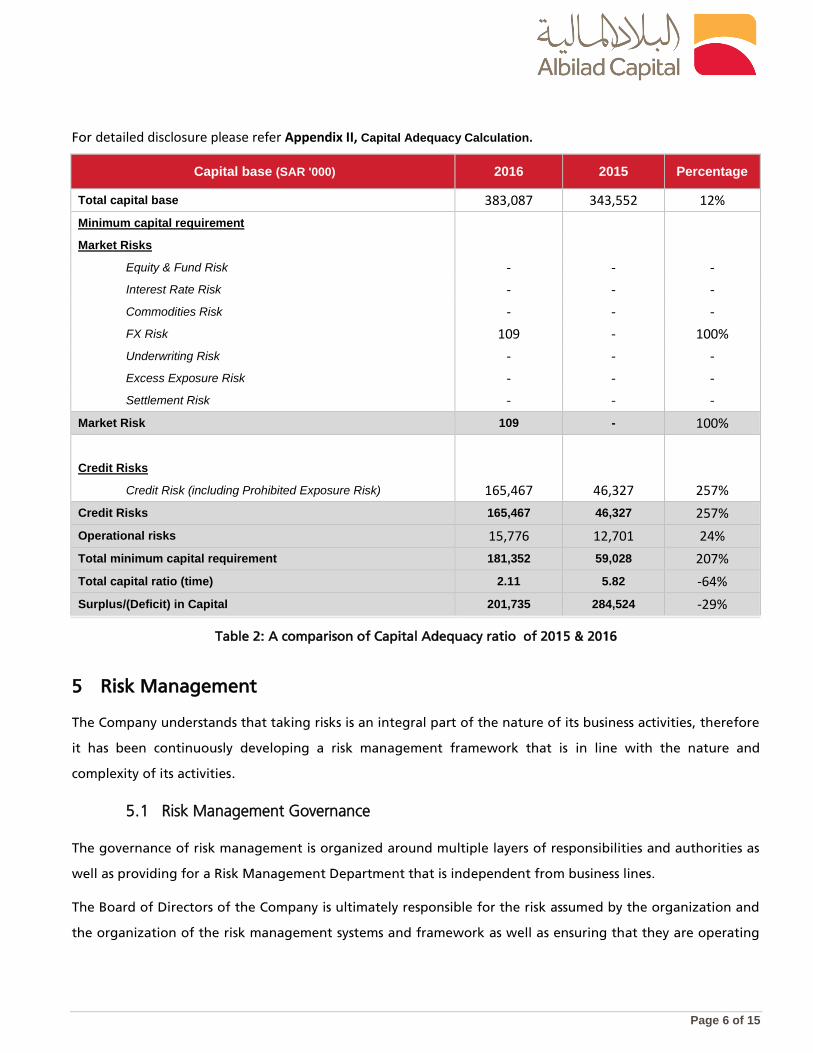
For detailed disclosure please refer Appendix II, Capital Adequacy Calculation.
Capital base (SAR '000) 2016 2015 Percentage
Total capital base 383,087 343,552 12%
Minimum capital requirement
Market Risks
Equity & Fund Risk - - -
Interest Rate Risk - - -
Commodities Risk - - -
FX Risk 109 - 100%
Underwriting Risk - - -
Excess Exposure Risk - - -
Settlement Risk - - -
Market Risk 109 - 100%
Credit Risks
Credit Risk (including Prohibited Exposure Risk) 165,467 46,327 257%
Credit Risks 165,467 46,327 257%
Operational risks 15,776 12,701 24%
Total minimum capital requirement 181,352 59,028 207%
Total capital ratio (time) 2.11 5.82 -64%
Surplus/(Deficit) in Capital 201,735 284,524 -29%
Table 2: A comparison of Capital Adequacy ratio of 2015 & 2016
5 Risk Management
The Company understands that taking risks is an integral part of the nature of its business activities, therefore
it has been continuously developing a risk management framework that is in line with the nature and
complexity of its activities.
5.1 Risk Management Governance
The governance of risk management is organized around multiple layers of responsibilities and authorities as
well as providing for a Risk Management Department that is independent from business lines.
The Board of Directors of the Company is ultimately responsible for the risk assumed by the organization and
the organization of the risk management systems and framework as well as ensuring that they are operating
Page 7 of 15
effectively. In order to best manage its responsibilities a risk management strategy, systems and framework
were set and supervised by the risk management committee.
The Risk Management Department reports directly to the CEO to promote its independence from business
lines. The Department is responsible for the design and implementation of the independent risk management
process and framework throughout the entire Company and its activities. All members of the senior
management team are responsible for the risks run by their respective activities and for the adherence to and
enforcement of the risk policies and procedures.
5.2 Pillar III Governance
The disclosure under the pillar III regulation is the responsibility of the Management of the Company. The
process is managed by the Risk Management Department, in collaboration with the Finance Department and
under the supervision and authority of the CEO, who will review and approve pillar III disclosures .The
Company discloses the information at www.albilad-capital.com in addition to including the related disclosures
in the annual financial statements that are approved by the Board of Directors of the Company.
5.3 Credit Risk and Counterparty Credit Risk
The commonly accepted definition of credit risk is the risk of economic loss from the failure of an obligor to
perform according to the terms and conditions of a contract or agreement. This is the main capital risk for the
Company as most of its assets are short term murabaha placements with financial institutions. However, this
risk is mitigated by the short term nature of the placements as well as by the Company’s counterparty
selection process. There is currently no usage of derivatives and the Company does not have off-balance -sheet
exposures. ( Details : Appendix III)
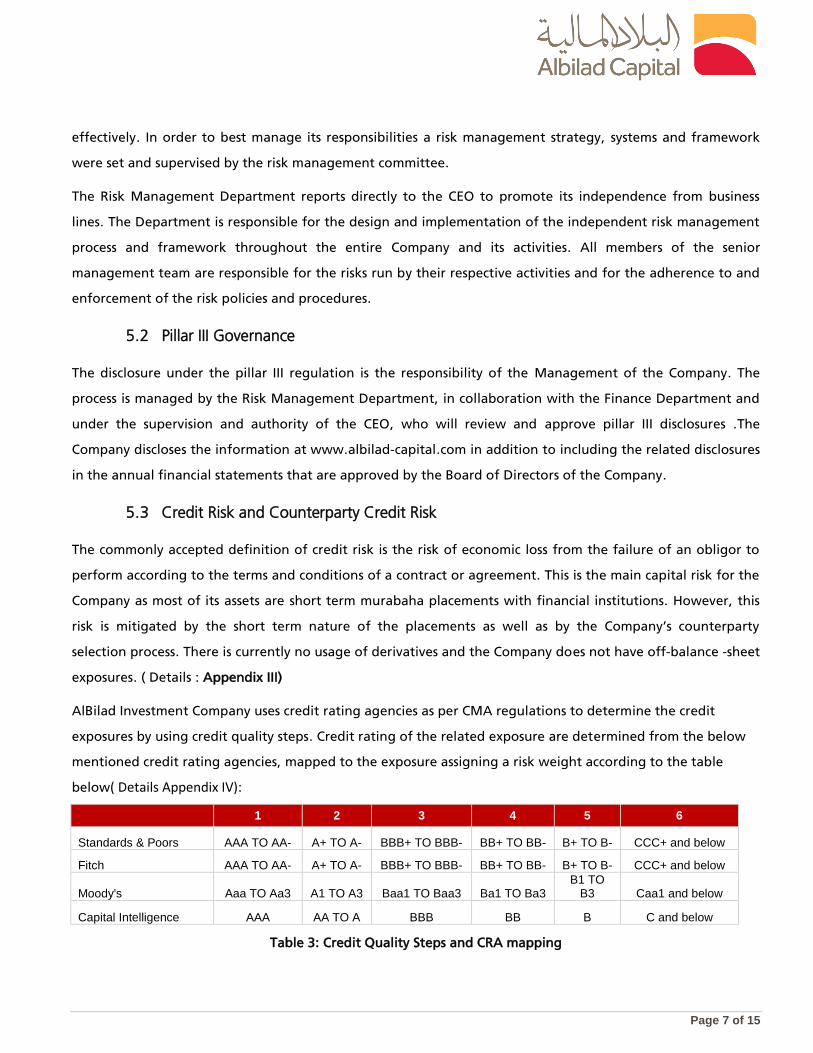
AlBilad Investment Company uses credit rating agencies as per CMA regulations to determine the credit
exposures by using credit quality steps. Credit rating of the related exposure are determined from the below
mentioned credit rating agencies, mapped to the exposure assigning a risk weight according to the table
below( Details Appendix IV):
1 2 3 4 5 6
Standards & Poors AAA TO AA- A+ TO A- BBB+ TO BBB- BB+ TO BB- B+ TO B- CCC+ and below
Fitch AAA TO AA- A+ TO A- BBB+ TO BBB- BB+ TO BB- B+ TO B- CCC+ and below
Moody's Aaa TO Aa3 A1 TO A3 Baa1 TO Baa3 Ba1 TO Ba3 B1 TO
B3 Caa1 and below
Capital Intelligence AAA AA TO A BBB BB B C and below
Table 3: Credit Quality Steps and CRA mapping
Page 8 of 15
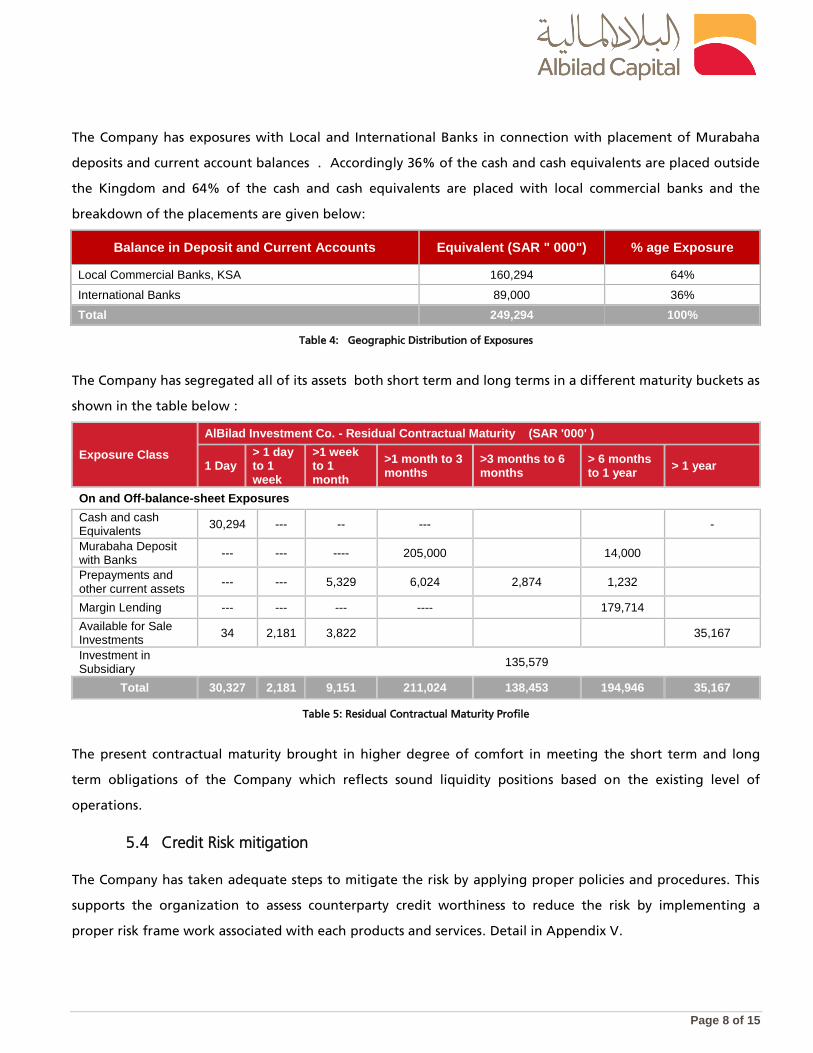
The Company has exposures with Local and International Banks in connection with placement of Murabaha
deposits and current account balances . Accordingly 36% of the cash and cash equivalents are placed outside
the Kingdom and 64% of the cash and cash equivalents are placed with local commercial banks and the
breakdown of the placements are given below:
Balance in Deposit and Current Accounts Equivalent (SAR " 000") % age Exposure
Local Commercial Banks, KSA 160,294 64%
International Banks 89,000 36%
Total 249,294 100%
Table 4: Geographic Distribution of Exposures
The Company has segregated all of its assets both short term and long terms in a different maturity buckets as
shown in the table below :
Exposure Class
AlBilad Investment Co. - Residual Contractual Maturity (SAR '000' )
1 Day > 1 day to 1 week
>1 week to 1 month
>1 month to 3 months
>3 months to 6 months
> 6 months to 1 year
> 1 year
On and Off-balance-sheet Exposures
Cash and cash Equivalents
30,294 --- -- ---
-
Murabaha Deposit with Banks
--- --- ---- 205,000 14,000
Prepayments and other current assets
--- --- 5,329 6,024 2,874 1,232
Margin Lending --- --- --- ---- 179,714
Available for Sale Investments
34 2,181 3,822 35,167
Investment in Subsidiary
135,579
Total 30,327 2,181 9,151 211,024 138,453 194,946 35,167
Table 5: Residual Contractual Maturity Profile
The present contractual maturity brought in higher degree of comfort in meeting the short term and long
term obligations of the Company which reflects sound liquidity positions based on the existing level of
operations.
5.4 Credit Risk mitigation
The Company has taken adequate steps to mitigate the risk by applying proper policies and procedures. This
supports the organization to assess counterparty credit worthiness to reduce the risk by implementing a
proper risk frame work associated with each products and services. Detail in Appendix V.
Page 9 of 15
5.5 Market Risk
Broadly defined, market risk is the risk of economic loss from the devaluation of an investment due to moves
in market factors. The four most common market-risk factors are interest rates, foreign-exchange rates, equity
prices, and commodity prices. The Company exposure to market risk is low. The computation of the market
risk capital requirement is managed in line with the methods defined in the CMA guidelines for capital
computation for different components of trading portfolio of the firm.
As of 31st December 2016, Company has investments in listed equities which are held under AFS investments
and disclosed under non-trading book exposures .Cash balances in foreign currencies are subject to foreign
currency risk charges. Otherwise majority of the investments were made in fixed income earning instruments
and doesn’t carry any capital charge under this group .
5.6 Operational Risk
The definition of operational risk used is the one adopted by the Basel regulations. This definition states that
operational risk is the risk of loss resulting from inadequate or failed internal processes, people and systems,
or from external events. Operational risk is an important factor for a financial institution. The Company
continuously considers these risks and has adopted the conservative methodology of Pillar I to adequately
cover these risks in terms of capital requirements.
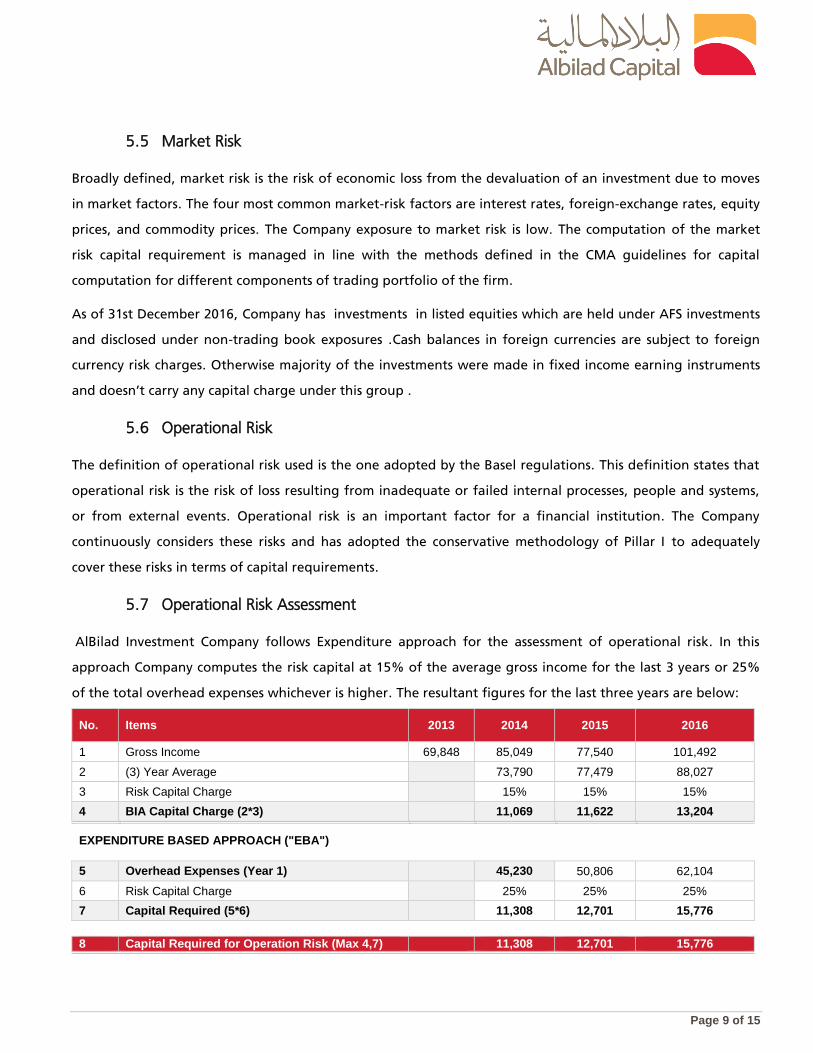
5.7 Operational Risk Assessment
AlBilad Investment Company follows Expenditure approach for the assessment of operational risk. In this
approach Company computes the risk capital at 15% of the average gross income for the last 3 years or 25%
of the total overhead expenses whichever is higher. The resultant figures for the last three years are below:
No. Items 2013 2014 2015 2016
1 Gross Income 69,848 85,049 77,540 101,492
2 (3) Year Average
73,790 77,479 88,027
3 Risk Capital Charge
15% 15% 15%
4 BIA Capital Charge (2*3)
11,069 11,622 13,204
EXPENDITURE BASED APPROACH ("EBA")
5 Overhead Expenses (Year 1)
45,230 50,806 62,104
6 Risk Capital Charge
25% 25% 25%
7 Capital Required (5*6)
11,308 12,701 15,776
8 Capital Required for Operation Risk (Max 4,7)
11,308 12,701 15,776
Page 10 of 15
Table 6: Operational Risk Capital
5.8 Liquidity Risk
Liquidity risk is the risk of financial loss to an institution, arising from its inability to have enough funds to
meet its contractual obligations. The Company manages this risk by monitoring its cash flow projections as
well as its liquidity ratios. The Company has the vast majority of its assets with maturities that are distributed
between immediate availability to one year maturities. The short term liabilities are limited in size and are of
an operational nature. These liabilities are a portion of the short term assets. Overall the liquidity profile of
the Company is strong with sufficient funds to cover for its current and future liquidity needs.
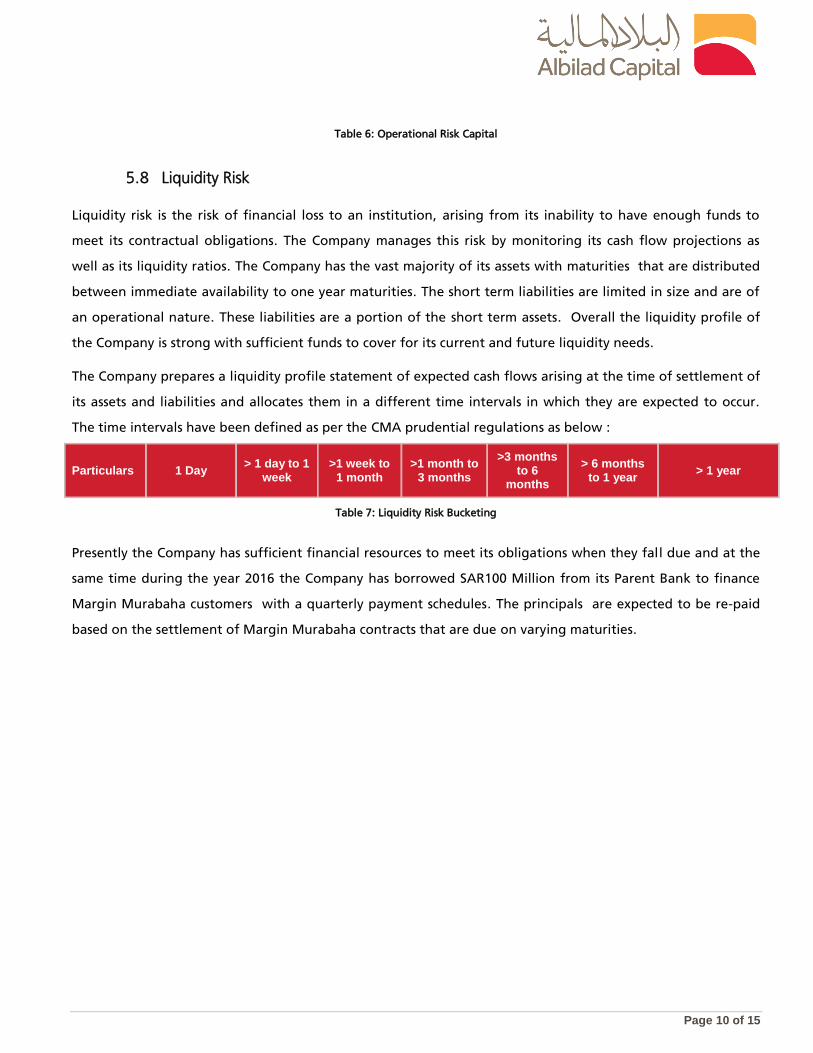
The Company prepares a liquidity profile statement of expected cash flows arising at the time of settlement of
its assets and liabilities and allocates them in a different time intervals in which they are expected to occur.
The time intervals have been defined as per the CMA prudential regulations as below :
Particulars 1 Day > 1 day to 1
week >1 week to
1 month >1 month to
3 months
>3 months to 6
months
> 6 months to 1 year
> 1 year
Table 7: Liquidity Risk Bucketing
Presently the Company has sufficient financial resources to meet its obligations when they fall due and at the
same time during the year 2016 the Company has borrowed SAR100 Million from its Parent Bank to finance
Margin Murabaha customers with a quarterly payment schedules. The principals are expected to be re-paid
based on the settlement of Margin Murabaha contracts that are due on varying maturities.
Page 11 of 15
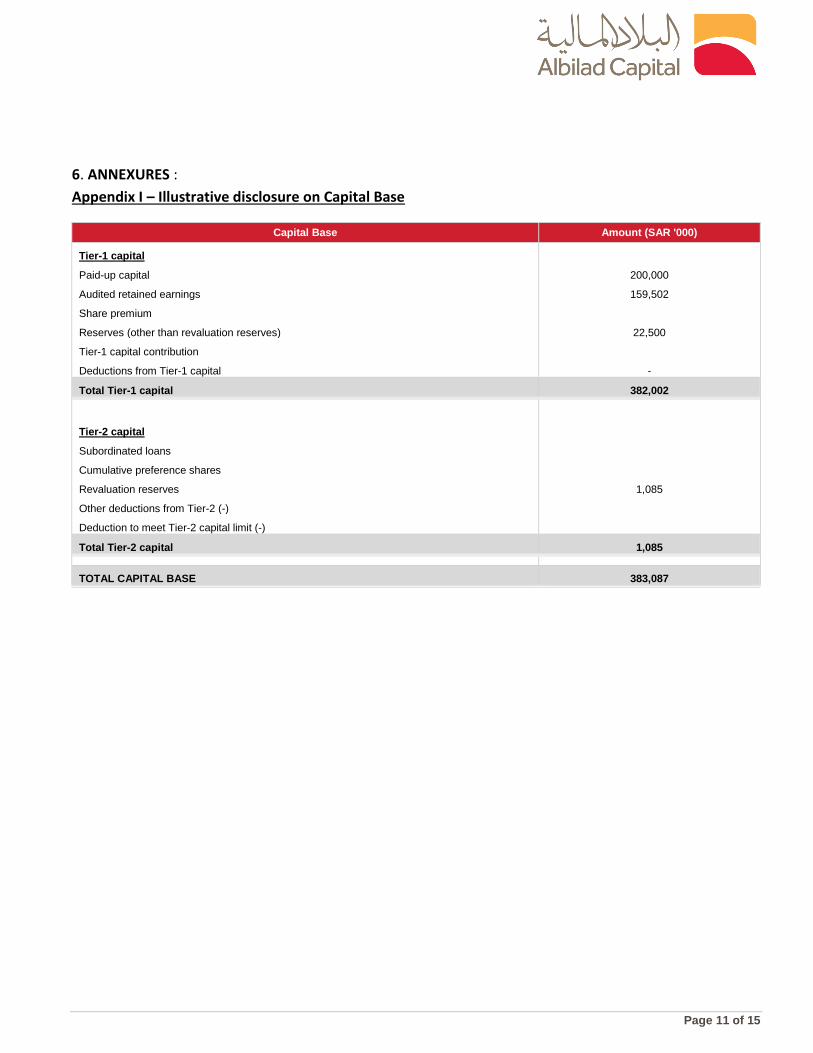
6. ANNEXURES :
Appendix I – Illustrative disclosure on Capital Base
Capital Base Amount (SAR '000)
Tier-1 capital
Paid-up capital 200,000
Audited retained earnings 159,502
Share premium
Reserves (other than revaluation reserves) 22,500
Tier-1 capital contribution
Deductions from Tier-1 capital -
Total Tier-1 capital 382,002
Tier-2 capital
Subordinated loans
Cumulative preference shares
Revaluation reserves 1,085
Other deductions from Tier-2 (-)
Deduction to meet Tier-2 capital limit (-)
Total Tier-2 capital 1,085
TOTAL CAPITAL BASE 383,087
Page 12 of 15
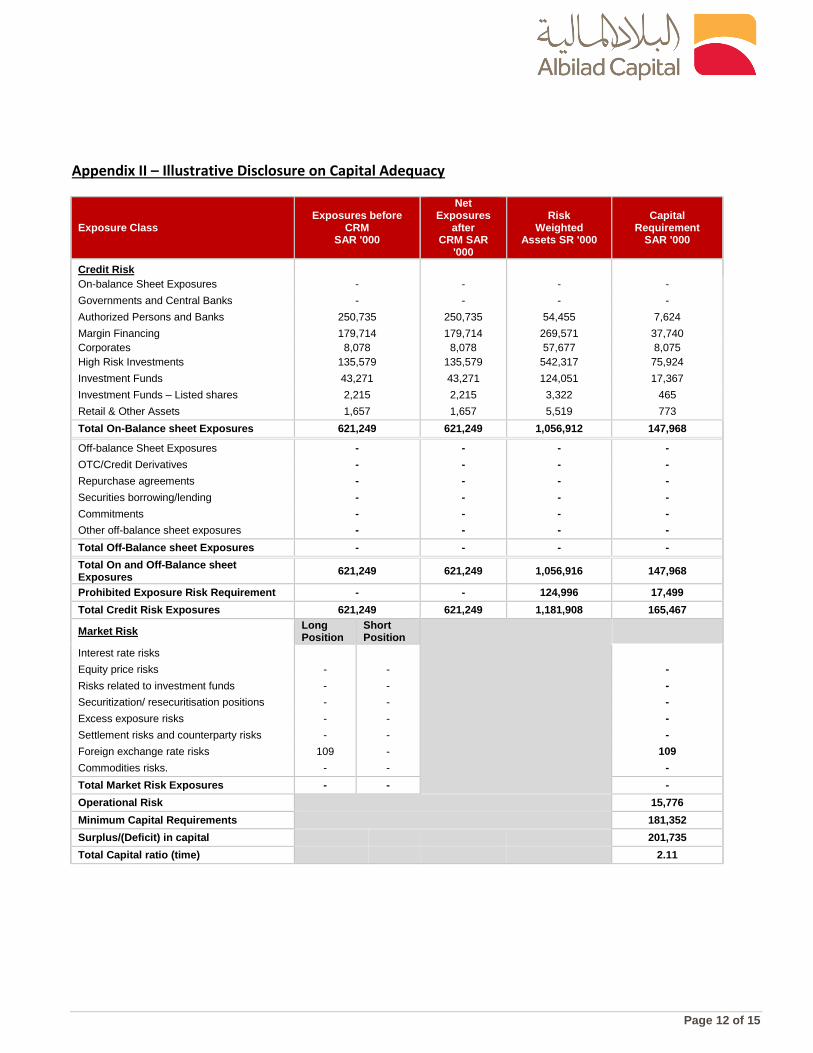
Appendix II – Illustrative Disclosure on Capital Adequacy
Exposure Class Exposures before
CRM SAR '000
Net Exposures
after CRM SAR
'000
Risk Weighted
Assets SR '000
Capital Requirement
SAR '000
Credit Risk On-balance Sheet Exposures - - - -
Governments and Central Banks - - - -
Authorized Persons and Banks 250,735 250,735 54,455 7,624
Margin Financing 179,714 179,714 269,571 37,740
Corporates 8,078 8,078 57,677 8,075
High Risk Investments 135,579 135,579 542,317 75,924
Investment Funds 43,271 43,271 124,051 17,367
Investment Funds – Listed shares 2,215 2,215 3,322 465
Retail & Other Assets 1,657 1,657 5,519 773
Total On-Balance sheet Exposures 621,249 621,249 1,056,912 147,968
Off-balance Sheet Exposures - - - -
OTC/Credit Derivatives - - - -
Repurchase agreements - - - -
Securities borrowing/lending - - - -
Commitments - - - -
Other off-balance sheet exposures - - - -
Total Off-Balance sheet Exposures - - - -
Total On and Off-Balance sheet Exposures
621,249 621,249 1,056,916 147,968
Prohibited Exposure Risk Requirement - - 124,996 17,499
Total Credit Risk Exposures 621,249 621,249 1,181,908 165,467
Market Risk Long Position
Short Position
Interest rate risks
Equity price risks - - -
Risks related to investment funds - - -
Securitization/ resecuritisation positions - - -
Excess exposure risks - - -
Settlement risks and counterparty risks - - -
Foreign exchange rate risks 109 - 109
Commodities risks. - - -
Total Market Risk Exposures - - -
Operational Risk
15,776
Minimum Capital Requirements
181,352
Surplus/(Deficit) in capital
201,735
Total Capital ratio (time)
2.11
Page 13 of 15
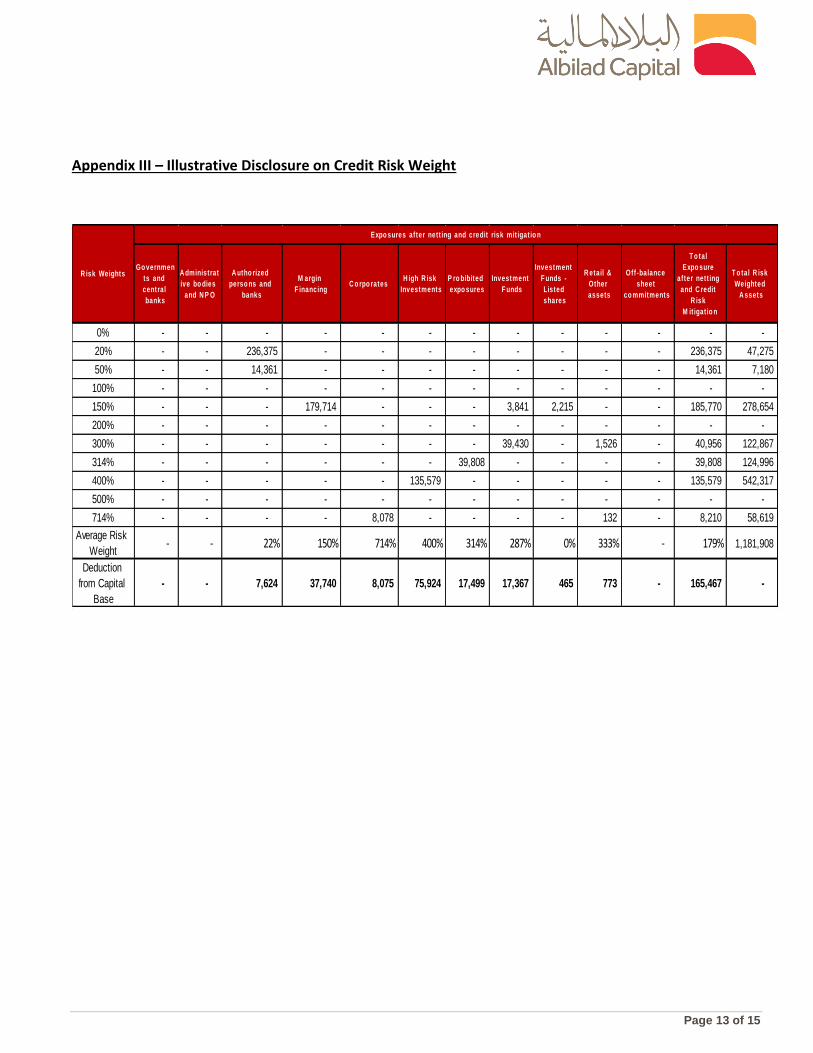
Appendix III – Illustrative Disclosure on Credit Risk Weight
Go vernmen
ts and
central
banks
A dministrat
ive bo dies
and N P O
A utho rized
perso ns and
banks
M argin
F inancingC o rpo rates
H igh R isk
Investments
P ro bibited
expo sures
Investment
F unds
Investment
F unds -
Listed
shares
R etail &
Other
assets
Off-balance
sheet
co mmitments
T o tal
Expo sure
after nett ing
and C redit
R isk
M it igat io n
T o tal R isk
Weighted
A ssets
0% - - - - - - - - - - - - -
20% - - 236,375 - - - - - - - - 236,375 47,275
50% - - 14,361 - - - - - - - - 14,361 7,180
100% - - - - - - - - - - - - -
150% - - - 179,714 - - - 3,841 2,215 - - 185,770 278,654
200% - - - - - - - - - - - - -
300% - - - - - - - 39,430 - 1,526 - 40,956 122,867
314% - - - - - - 39,808 - - - - 39,808 124,996
400% - - - - - 135,579 - - - - - 135,579 542,317
500% - - - - - - - - - - - - -
714% - - - - 8,078 - - - - 132 - 8,210 58,619
Average Risk
Weight - - 22% 150% 714% 400% 314% 287% 0% 333% - 179% 1,181,908
Deduction
from Capital
Base
- - 7,624 37,740 8,075 75,924 17,499 17,367 465 773 - 165,467 -
R isk Weights
Expo sures after nett ing and credit risk mit igat io n
Page 14 of 15
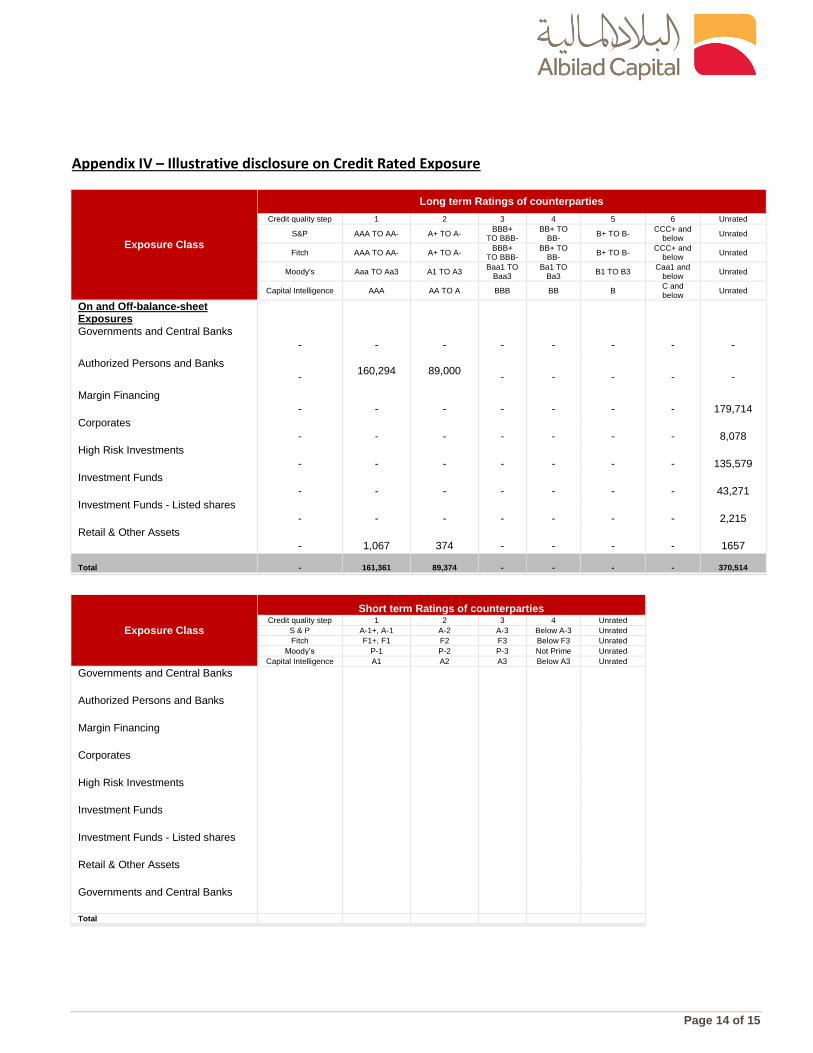
Appendix IV – Illustrative disclosure on Credit Rated Exposure
Exposure Class
Long term Ratings of counterparties
Credit quality step 1 2 3 4 5 6 Unrated
S&P AAA TO AA- A+ TO A- BBB+
TO BBB- BB+ TO
BB- B+ TO B-
CCC+ and below
Unrated
Fitch AAA TO AA- A+ TO A- BBB+
TO BBB- BB+ TO
BB- B+ TO B-
CCC+ and below
Unrated
Moody's Aaa TO Aa3 A1 TO A3 Baa1 TO
Baa3 Ba1 TO
Ba3 B1 TO B3
Caa1 and below
Unrated
Capital Intelligence AAA AA TO A BBB BB B C and below
Unrated
On and Off-balance-sheet Exposures
Governments and Central Banks -
-
-
-
-
-
-
-
Authorized Persons and Banks -
160,294
89,000
-
-
-
-
-
Margin Financing -
-
-
-
-
-
-
179,714
Corporates -
-
-
-
-
-
-
8,078
High Risk Investments -
-
-
-
-
-
-
135,579
Investment Funds -
-
-
-
-
-
-
43,271
Investment Funds - Listed shares -
-
-
-
-
-
-
2,215
Retail & Other Assets -
1,067
374
-
-
-
-
1657
Total -
161,361
89,374
-
-
-
-
370,514
Exposure Class
Short term Ratings of counterparties
Credit quality step 1 2 3 4 Unrated
S & P A-1+, A-1 A-2 A-3 Below A-3 Unrated
Fitch F1+, F1 F2 F3 Below F3 Unrated
Moody’s P-1 P-2 P-3 Not Prime Unrated
Capital Intelligence A1 A2 A3 Below A3 Unrated
Governments and Central Banks
Authorized Persons and Banks
Margin Financing
Corporates
High Risk Investments
Investment Funds
Investment Funds - Listed shares
Retail & Other Assets
Governments and Central Banks
Total
Page 15 of 15
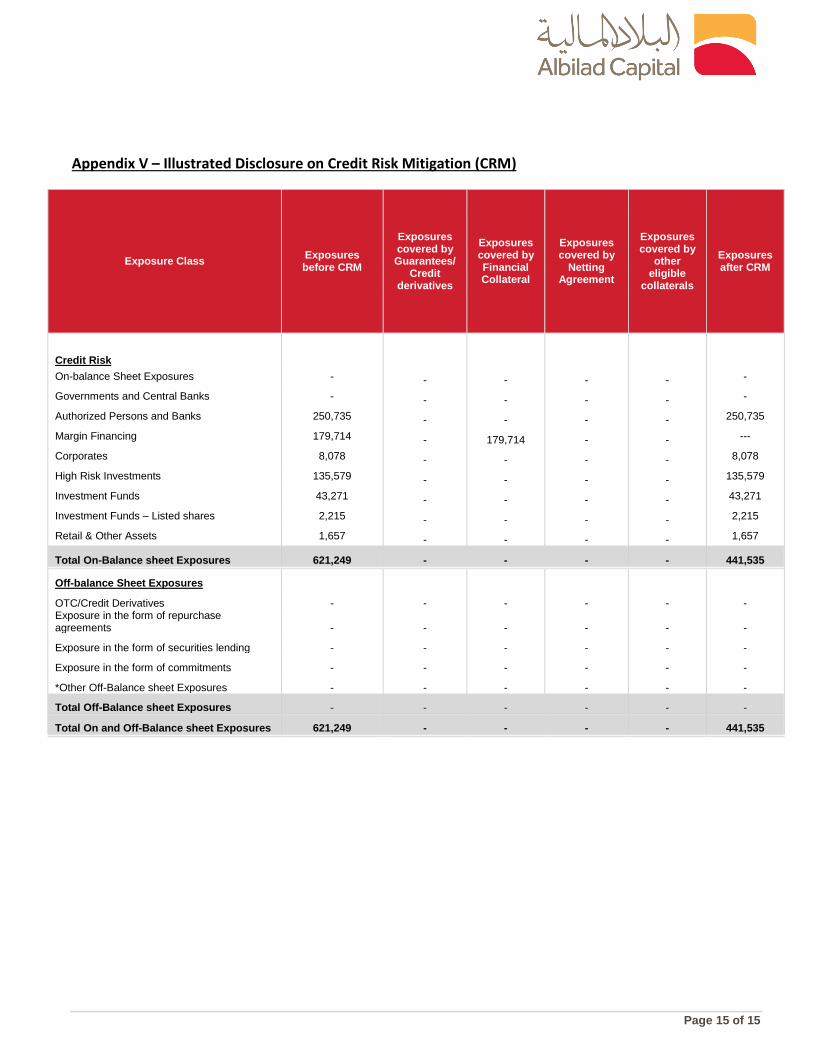
Appendix V – Illustrated Disclosure on Credit Risk Mitigation (CRM)
Exposure Class Exposures before CRM
Exposures covered by Guarantees/
Credit derivatives
Exposures covered by Financial Collateral
Exposures covered by
Netting Agreement
Exposures covered by
other eligible
collaterals
Exposures after CRM
Credit Risk On-balance Sheet Exposures - - - - - -
Governments and Central Banks - - - - - -
Authorized Persons and Banks 250,735 - - - - 250,735
Margin Financing 179,714 - 179,714 - - ---
Corporates 8,078 - - - - 8,078
High Risk Investments 135,579 - - - - 135,579
Investment Funds 43,271 - - - - 43,271
Investment Funds – Listed shares 2,215 - - - - 2,215
Retail & Other Assets 1,657 - - - - 1,657
Total On-Balance sheet Exposures 621,249 - - - - 441,535
Off-balance Sheet Exposures
OTC/Credit Derivatives - - - - - - Exposure in the form of repurchase agreements - - - - - -
Exposure in the form of securities lending - - - - - -
Exposure in the form of commitments - - - - - -
*Other Off-Balance sheet Exposures - - - - - -
Total Off-Balance sheet Exposures - - - - - -
Total On and Off-Balance sheet Exposures 621,249 - - - - 441,535