Embed Size (px)
Citation preview

FINANCIAL REPOR T2016


Report of the Executive Vice President 2
Investment Report 4
Independent Auditors Report 9
Consolidated Statements of Financial Position 11
Consolidated Statement of Activities 12
Consolidated Statements of Cash Flows 13
Notes to the Consolidated Financial Statements 14
Administration and Trustees 37

2
To the Board of Trustees of Northwestern University:
Northwestern finished the year ending August 31, 2016, with a strong balance sheet
and positive operating results of $34.8 million. The 2016 Financial Report highlights the
University’s financial health and capacity.
At just under $10 billion in 2016, our endowment remains a key driver of Northwestern’s
financial strength. The investment portfolio continues to meet long-term objectives despite
fluctuations in the world economy and financial markets. Total assets grew to $13.7 billion,
an increase of over $224 million from the prior year, with net assets increasing to more than
$11 billion. The Consolidated Statements of Financial Position show results consistent with
the University’s AAA credit rating, attesting to Northwestern’s robust capacity to advance
its priorities.
This strong financial position enables the University to enhance its distinction among the
best global universities. Ambitious strategic plans are guiding programmatic and capital
investments in undergraduate student aid, faculty recruitment and retention, and global
strategy developments. Highly visible outcomes of the University’s capital plan include
completion of Kresge Centennial Hall’s renovation, near completion of the Kellogg School of
Management’s Global Hub, and renovations to the Mudd Building and Wirtz Center for the
Performing Arts. The University broke ground in 2016 on the Louis A. Simpson and Kimberly K.
Querrey Biomedical Research Center and the Ryan Fieldhouse and Walter Athletics Center
and began several campus housing renovation and construction projects.
Report of the Executive Vice President

3
While Northwestern closed fiscal year 2016 with a strong financial performance, considerable
pressures on higher education resources emphasize the importance of the University’s
striking the right balance between programmatic and financial risks and opportunities.
Generous support from the University’s alumni and friends enables our continued
programmatic investments and builds our foundation for excellence in teaching and research.
In a year when philanthropic support exceeded targets, the University surpassed $3 billion in
new gifts and commitments as part of We Will. The Campaign for Northwestern, and annual
fundraising eclipsed $600 million for the third time in Northwestern history.
With the ongoing commitment of the exceptional Northwestern community of faculty,
students, and staff, I am confident we will continue to build on our successes and maintain
our ability to leverage financial capacity in support of ambitious strategic plans.
Nim Chinniah
Executive Vice President

4
Investment Report
For the first time in seven years, most large US endow-
ments produced negative returns after enduring a
difficult fiscal year, which for most ended June 30,
2016. The US central bank raised interest rates once
during the period, only to remain on the sidelines
through November 2016. Commodities stabilized
and oil rebounded after dramatically declining in the
first quarter of the year. US large-capitalization equi-
ties led world equity indices as the S&P 500 posted a
13 percent gain during the fiscal year. Other developed
international economies posted much smaller returns,
while Europe actually declined 3 percent—primarily
due to the sell-off caused by the United Kingdom’s
Brexit vote. Despite a 12 percent rally, emerging mar-
ket equities have compounded at a negative annual-
ized rate for five years.
Against this backdrop, the University’s diversified
portfolio had a small gain of 1.9 percent for the fiscal
year ended August 31, 2016. The Long-Term Balanced
Pool declined in value by $64 million to $9.8 billion as
spending outpaced investment gains. On August 31,
2016, the University’s investment assets, including
cash and separately invested University holdings,
totaled $10.4 billion.
The University’s Total Investment PoolsThe University maintains three primary investment
pools: the Long-Term Balanced Pool, Treasury funds,
and separately invested assets. Each investment cat-
egory has a specific set of objectives.
The Long-Term Balanced Pool, used for endowed and
quasi-endowed purposes, is managed with the objec-
tive of long-term total return. It is a “unitized fund”
using mutual fund accounting principles. Because of
its size and long-term orientation, performance data
and investment strategy information in the discussion
that follows relate to the Long-Term Balanced Pool.
Treasury funds are money market funds used for
cash reserves and to preserve principal and main-
tain liquidity; intermediate-term bond and bond-like
investments with a one- to two-year horizon, for fund-
ing planned capital expenditures; and working capital
funds held by the University, which are generated
through the temporary differences between operat-
ing receipts and disbursements. These funds are not
unitized. The income from investing them is used for
general operating purposes. Working capital invest-
ments are held in a variety of money market instru-
ments or, if not needed within 90 days, are invested in
the Long-Term Balanced Pool.
Separately invested funds are donated funds, includ-
ing restricted investments and some life-income
plans. These assets may not be merged with other
assets for consolidated management.
The table below illustrates the net asset values and
unitized information for the University’s investment
pools for the past five years.
History of the Merged Pools as of August 31, 2016
2012 2013 2014 2015 2016
Long-Term Balanced Pool
Net asset value (in thousands of dollars) $7,186,794 $7,850,651 $9,704,003 $9,867,262 $9,803,725
Number of units (in thousands) 35,155 36,390 40,169 41,601 42,577
Net asset value per unit $204.43 $215.74 $241.58 $237.19 $230.26
Payout amount per unit
Current earned income ($0.75) $0.11 ($0.08) ($1.21) ($1.13)
Previously reinvested realized gains withdrawn $9.07 $8.63 $9.01 $10.44 $10.84
Total payout per unit $8.32 $8.74 $8.93 $9.23 $9.71
Summary of net asset values (in thousands of dollars)
Treasury pool funds $146,675 $157,003 $169,951 $609,600 $452,866
Separately invested funds 89,328 136,625 158,383 150,851 138,118
Total net asset value (in thousands of dollars) $7,422,797 $8,144,279 $10,032,337 $10,627,713 $10,394,709

5
Asset Allocation for the Long-Term Balanced PoolThe Investments Committee of the University annu-
ally reviews asset allocation policy for the Long-Term
Balanced Pool. During fiscal year 2016, the Committee
ratified the Investment Office’s recommendations of
a 2 percent increase in the absolute return target and
a corresponding 2 percent decrease in real assets.
Subjective considerations such as liquidity and
inflation/deflation protection were also part of the
analysis.
The next table, which incorporates these changes,
displays the current asset allocation policy for the
University. Reflecting the Investment Office’s bias
against market timing or tactical asset allocation as
a primary driver of value added, actual allocations
varied from targeted levels by modest amounts. The
Investment Office seeks to generate higher returns
with appropriate risk levels and will review the cur-
rent asset allocation mix in fiscal year 2017.
Policy Portfolio Targets and Ranges
Range Target August 31, 2016 Difference
US equity 9–15% 12% 12.6% 0.6%
International equity 13–19% 16% 16.4% 0.4%
Fixed income 9–15% 12% 11% -1%
High-yield credit 0–10% 5% 3.4% -1.6%
Absolute return 16–24% 20% 20.4% 0.4%
Private investments 15–23% 19% 20.1% 1.1%
Real assets 12–20% 16% 15.4% -0.6%
Cash 0% 0.7% 0.7%
Primary Investment Performance Objective: Preserving Purchasing Power and Growing IncomeThe principal objective for Northwestern’s Long-
Term Balanced Pool is to preserve purchasing power
and to provide a growing stream of income to fund
University programs. The pool seeks to achieve an
annual total rate of return (i.e., actual income plus
appreciation) equal to inflation plus actual spending.
This objective of preserving purchasing power empha-
sizes the need for a long-term perspective in formulat-
ing both spending and investment policies. A more
detailed look at the University’s spending guideline is
on page 8 of this report.
The University’s investments historically have
grown at a rate exceeding the objective. For the 12
months ended August 31, 2016, the portfolio increased
1.9 percent, underperforming the objective by 4 per-
cent. However, over longer time horizons, the portfolio
outperformed the objective by 1.3 percent, 1.6 percent,
0.3 percent, and 1 percent for the 3-year, 5-year, 10-year,
and 15-year periods, respectively, as shown in the table
below.
Annualized Returns: Exceeding the Objective
1-year 3-year 5-year 10-year 15-year
Annual total return* 1.9% 6.9% 7.4% 6.6% 7.8%
– Spending 4.1% 3.9% 3.9% 4% 4.1%
– University management fee and support 0.7% 0.7% 0.7% 0.6% 0.6%
– Inflation 1.1% 1% 1.2% 1.7% 2.1%
= Above or below objective -4% 1.3% 1.6% 0.3% 1%
* Total returns are net of fees and are calculated on annual changes in net asset value. They may differ from payout distributions.

6
Secondary Investment Performance Objective: Benchmark ComparisonsThe pool’s 1.9 percent return for the 12-month period
underperformed the 4.7 percent return of the com-
posite benchmark, a blend of the benchmark returns
for each asset class weighted by the policy allocation
targets. Underperformance was primarily due to poor
security selection by managers and to volatile global
equity markets. During this difficult fiscal year, all
seven portfolios lagged behind their benchmarks, yet
real assets was the only asset class to post a negative
return on an absolute basis (-1.5 percent). In particular,
the US equity portfolio substantially underperformed
on a relative basis (3.3 percent versus 11.4 percent),
yet it was the third-best performer on an absolute
basis. Fixed income was the top performer on an
absolute basis, but this was counterbalanced by its
underperformance on a relative basis (4.6 percent ver-
sus 5.1 percent). High-yield credit and absolute return
underperformed their benchmarks by 9 percent and
4.7 percent, respectively. The first chart that follows
shows returns and benchmarks for all asset classes for
the fiscal year.
For the five-year period ended August 31, 2016, the
Long-Term Balanced Pool outperformed the compos-
ite benchmark (7.4 percent versus 7 percent), as shown
in the second chart. Four of the seven portfolios
exceeded their benchmarks over five years, while only
fixed income and real assets underperformed on both
an absolute and relative basis. Two of the asset classes
were double-digit performers, reflecting the recovery
from the global financial crisis, particularly in the
United States. A more detailed explanation of activity
and performance follows the five-year performance
chart below.
Long-Term Balanced Pool: Fiscal 2016 Net Performance Relative to Benchmarks (in percentages)
n Northwestern n Benchmark
US equity International equity
Fixed income High-yield credit
Absolute return
Private investments
Real assets Totals
Long-Term Balanced Pool: Five-Year Net Performance Relative to Benchmarks (in percentages)
n Northwestern n Benchmark
US equity International equity
Fixed income High-yield credit
Absolute return
Private investments
Real assets Totals
13.5 14.4
6.4
2.9 2.1 2.2
8.1 7.3 6.65.1
12.4
3.3 4.3
7.4 7.0
11.7
3.3
11.4
3.7 4.3 4.6 5.1
0.2
9.2
0.3
5.02.3 3.0
-1.5 -0.81.9
4.7

7
Marketable Securities CategoriesUS equity was the third-best-performing asset class in
absolute terms during the fiscal year, gaining 3.3 per-
cent. On a relative basis, the portfolio significantly
underperformed the 11.4 percent gain of its Russell
3000 benchmark, primarily due to manager selection.
Over five years, the portfolio has underperformed its
benchmark by 0.9 percent (13.5 percent versus 14.4 per-
cent). On a longer-term basis, it has outperformed in
10 of the last 15 fiscal years. In addition, on an absolute
basis, US equity was the best-performing asset class
over the 5-year period, as the US stock market outper-
formed all other asset classes during this time.
The international equity portfolio gained 3.7 percent
for the fiscal year and, in absolute terms, was the
second-best-performing asset class. For the last five
years, this portfolio was the best-performing asset
class on a relative basis, returning 6.4 percent versus
the 2.9 percent return of its benchmark (67 percent
MSCI EAFE Index; 33 percent MSCI EM Index). A
heavier weight to smaller-capitalization foreign
stocks, as well as outstanding manager selection, has
helped this portfolio over the five-year period, outper-
forming in 12 of the last 15 fiscal years.
The fixed income portfolio posted the best return
of all asset classes during the fiscal year. It under-
performed on a relative basis, returning 4.6 percent
versus 5.1 percent for its benchmark. For the last five
years, fixed income slightly underperformed on a
relative basis, returning 2.1 percent versus 2.2 percent
for its benchmark. It has outperformed in 8 of the last
15 fiscal years due to superior active management and
exposure to global and inflation-protected bonds.
High-Yield Credit CategoryThe high-yield credit portfolio includes tactical invest-
ments in distressed debt and other credit instruments
with fixed income characteristics but more specific
risk tied to the securities and their underlying cash
flows. Up by 0.2 percent during the fiscal year, the
portfolio significantly underperformed the 9.2 percent
gain posted by the benchmark Merrill Lynch High-
Yield Master II Index. On a relative basis, it was the
worst performer, as the index soared to levels the
Investment Office views as unsustainable. For the five-
year period, the high-yield credit portfolio returned
8.1 percent versus 7.3 percent for the benchmark and
was the third-best performer on an absolute basis. The
portfolio was cash-flow negative (total distributions
less new investments or capital calls), with distribu-
tions of $35.1 million and capital calls of $41.9 million,
for a net cash flow of -$6.8 million.
Absolute Return CategoryComprising a diversified selection of hedge fund strat-
egies, this portfolio aims to provide equity-like returns
with low correlation to the equity markets. For the
fiscal year, it gained 0.3 percent, below the 5 percent
return of its benchmark (80 percent Treasury bills plus
400 basis points; 20 percent MSCI All-Country World
Index). The portfolio’s return of 6.6 percent for the
five-year period was positive on an absolute basis and
exceeded its benchmark, which was up 5.1 percent.
Northwestern’s absolute return portfolio is diversi-
fied among long-short equity managers (34 percent)
and uncorrelated, event-driven, and other hedge fund
strategies. These remaining hedge funds (66 percent)
tend to be less sensitive to movements in the equity
markets and represent diversifying strategies.
Private Investments CategoryThe private investments portfolio includes invest-
ments in global buyout, growth equity, and venture
capital funds. This portfolio posted an absolute return
of 2.3 percent for the fiscal year and was the second-
best absolute performer for the five-year period, gain-
ing 12.4 percent annualized. In addition, on a relative
basis it outperformed the Burgiss Private Investments
benchmark return of 11.7 percent. Increased profitabil-
ity at underlying portfolio companies and merger and
acquisition activity significantly bolstered returns for
the five-year period. However, a slowdown in portfolio
company profitability during the fiscal year, coupled
with considerable weakness in the initial public offer-
ing environment relative to the robustness of the past
several years, resulted in lower returns.
Cash flows were strong for the current fiscal year,
as the portfolio was cash-flow positive for the fifth
consecutive year since the global financial crisis.
The portfolio experienced a decrease in trade sales,
recapitalizations, and public offerings, resulting in
less distributions from the portfolio companies than
in the prior fiscal year. For fiscal year 2016, private
investment distributions were $370.7 million and
capital calls were $241.3 million, for a net cash flow of
$129.4 million.

8
Real Assets CategoryThe real assets portfolio includes the University’s
investments in energy, timber, real estate, and publicly
traded investments in commodity and energy equity
funds. This portfolio underperformed its benchmark
return (a mix of energy, real estate, and commodities)
on a relative basis in fiscal year 2016, losing 1.5 percent
versus a 0.8 percent loss. Returns were diverging, as
real estate actually rose 8.8 percent while natural
resources fell by 10.7 percent in the last 12 months.
The portfolio gained 3.3 percent for the five-year
period, reflecting the impact of retreating global com-
modity prices. Distribution activity was down from
the prior fiscal year, primarily due to lower realiza-
tions in private partnership real estate and energy
investments. With distributions of $210.5 million and
capital calls of $281.6 million, the net cash flow was
-$71.1 million for fiscal year 2016.
Long-Term Balanced Pool Spending GuidelineTo sustain the Long-Term Balanced Pool’s long-term
earning ability and provide adequate resources to the
University, the Board of Trustees in fiscal year 2006
ratified a revised spending guideline that blends two
elements:
• Market element adjusts annual endowment spend-
ing to the long-term sustainable target spending of
4.35 percent of the average actual market value of the
endowment for the 12 months ended October 31 of
the prior fiscal year. This component of the spending
rate receives a 30 percent weighting in the spending
rate calculation.
• Spending element increases the previous year’s
spending rate by actual inflation plus budget growth
(1.5 percent). This element of the spending rate
receives a weight of 70 percent.
The spending rate for fiscal year 2016 was 4.1 per-
cent. The amount per unit for fiscal year 2017, calcu-
lated using the guideline above, is $10.01.
Payout Determined by Spending Guideline
2012 2013 2014 2015 2016
Spending per unit $8.32 $8.74 $8.93 $9.23 $9.71
Net asset value per unit $204.43 $215.74 $241.58 $237.19 $230.26
Annual spending rate* 3.98% 4.08% 3.83% 3.78% 4.07%
Total (in millions) $288.30 $313.17 $350.02 $378.74 $409.44
Growth in total spending 3.11% 8.62% 11.77% 8.21% 8.11%
* Annual spending rate is calculated as spending per unit divided by the two-year average net asset value per unit after distribution of the annual contribution to the budget.
The Long-Term Balanced Pool: In ConclusionNorthwestern’s portfolio posted a lower-than-
expected return during this volatile and challeng-
ing fiscal year, the second consecutive fiscal year of
approximately 2 percent gains. Unlike last year, this
fiscal year was hampered by poor relative perfor-
mance among active managers. However, the Long-
Term Balanced Pool is poised to continue to grow and
support the University’s needs. Its success is based on
the diversification and the skill of outstanding money
managers worldwide in meeting investment objec-
tives over long time horizons. Despite short-run fears
that returns in the next decade will be lower than in
the last 10 years, Northwestern leadership retains its
long-term investment focus and is confident in the
portfolio’s prospects for future appreciation.
William H. McLean
Vice President and Chief Investment Officer

9
Independent Auditors Report
To the Board of Trustees of Northwestern University:
We have audited the accompanying consolidated financial statements of Northwestern
University (the “University”), which comprise the consolidated statements of financial position
as of August 31, 2016, and 2015, the related consolidated statements of activities for the year
ended August 31, 2016, and of cash flows for the years ended August 31, 2016, and 2015.
Management’s Responsibility for the Consolidated Financial Statements
Management is responsible for the preparation and fair presentation of the consolidated
financial statements in accordance with accounting principles generally accepted in the United
States of America; this includes the design, implementation, and maintenance of internal control
relevant to the preparation and fair presentation of consolidated financial statements that are
free from material misstatement, whether due to fraud or error.
Auditors’ Responsibility
Our responsibility is to express an opinion on the consolidated financial statements based on our
audits. We conducted our audits in accordance with auditing standards generally accepted in the
United States of America. Those standards require that we plan and perform the audit to obtain
reasonable assurance about whether the consolidated financial statements are free from mate-
rial misstatement.
An audit involves performing procedures to obtain audit evidence about the amounts and
disclosures in the consolidated financial statements. The procedures selected depend on our
judgment, including the assessment of the risks of material misstatement of the consolidated
financial statements, whether due to fraud or error. In making those risk assessments, we
Roseann, the new letter is titled: Report of Independent Auditors

10
consider internal control relevant to the University’s preparation and fair presentation of the
consolidated financial statements in order to design audit procedures that are appropriate in
the circumstances, but not for the purpose of expressing an opinion on the effectiveness of the
University’s internal control. Accordingly, we express no such opinion. An audit also includes
evaluating the appropriateness of accounting policies used and the reasonableness of significant
accounting estimates made by management, as well as evaluating the overall presentation of the
consolidated financial statements. We believe that the audit evidence we have obtained is
sufficient and appropriate to provide a basis for our audit opinion.
Opinion
In our opinion, the consolidated financial statements referred to above present fairly, in all
material respects, the financial position of Northwestern University as of August 31, 2016, and
2015, and the changes in its net assets for the year ended August 31, 2016, and its cash flows for
the years ended August 31, 2016, and 2015, in accordance with accounting principles generally
accepted in the United States of America.
Other Matter
We previously audited the consolidated statement of financial position as of August 31, 2015, and
the related consolidated statements of activities and of cash flows for the year then ended (not
presented herein), and in our report dated January 22, 2016, we expressed an unmodified opin-
ion on those consolidated financial statements. In our opinion, the information set forth in the
accompanying summarized financial information as of August 31, 2015, for the year then ended
is consistent, in all material respects, with the audited consolidated financial statements from
which it has been derived.
February 2, 2017
11
Consolidated Statements of Financial PositionAs of August 31, 2016, and August 31, 2015
(in thousands of dollars) 2016 2015
Assets
Cash and cash equivalents $215,375 $277,129
Accounts receivable, net 326,446 282,926
Notes receivable, net 156,428 146,760
Contributions receivable, net 263,423 169,018
Investments 10,312,782 10,497,764
Land, buildings, and equipment, net 2,368,598 2,043,447
Other assets 17,125 18,731
Total assets $13,660,177 $13,435,775
Liabilities
Accounts payable and accrued expenses $265,979 $223,461
Deferred revenue 289,083 270,962
Deposits payable and actuarial liability of annuities payable 140,836 123,770
Government advances for student loans 37,766 38,830
Asset retirement obligations 2,940 121,035
Bonds, notes, and other debt payable 1,909,164 1,864,739
Total liabilities $2,645,768 $2,642,797
Net assets
Unrestricted $6,986,925 $6,822,964
Temporarily restricted 2,472,172 2,555,415
Permanently restricted 1,555,312 1,414,599
Total net assets $11,014,409 $10,792,978
Total liabilities and net assets $13,660,177 $13,435,775
See Notes to the Consolidated Financial Statements, beginning on page 14.

12
Consolidated Statement of ActivitiesFor the fiscal year ended August 31, 2016, and summarized financial information for the fiscal year ended August 31, 2015
Operating expenses
Salaries, wages, and benefits 1,242,279 1,242,279 1,147,813
Services, supplies, travel, and other 554,631 554,631 538,037
Depreciation and ARO accretion 123,225 123,225 117,831
Operations of plant, rent, and equipment 109,283 109,283 90,700
Utilities and communications 55,210 55,210 53,969
Royalty and trademark fees 41,278 41,278 47,889
Interest on indebtedness 40,248 40,248 37,094
Total operating expenses 2,166,154 — — 2,166,154 2,033,333
Excess (deficit) of operating revenues over expenses 103,321 (68,487) — 34,834 111,084
Nonoperating revenues and expenses
Private gifts and grants for buildings and equipment 1,597 1,597 10,845
Restricted private gifts 82,903 $142,131 225,034 287,972
Net gain (loss) on annuity obligations 4,756 (1,418) 3,338 (9,302)
Investment returns, reduced by operating distribution (10,073) (102,415) (112,488) (274,116)
Change in value of derivative instruments (1,557) (1,557) (1,552)
Other nonoperating net revenues 70,673 70,673 4,301
Excess (deficit) of nonoperating revenues over expenses 60,640 (14,756) 140,713 186,597 18,148
Change in net assets 163,961 (83,243) 140,713 221,431 129,232
Beginning net assets 6,822,964 2,555,415 1,414,599 10,792,978 10,663,746
Ending net assets $6,986,925 $2,472,172 $1,555,312 $11,014,409 $10,792,978
See Notes to the Consolidated Financial Statements, beginning on page 14.
(in thousands of dollars) 2016 2015
Operating revenues Unrestricted Temporarily restricted
Permanently restricted Total Total
Tuition and fees $963,001 $963,001 $911,130
(less scholarships and fellowships) (381,713) (381,713) (343,380)
Net tuition and fees 581,288 581,288 567,750
Auxiliary services 79,036 79,036 77,226
Grants and contracts 595,774 595,774 565,589
Private gifts 200,892 200,892 202,428
Investment return designated for operations 357,775 $151,234 509,009 473,875
Sales and services 161,615 161,615 154,686
Professional fees 31,345 31,345 24,150
Royalties and trademarks 41,236 41,236 77,486
Other income 793 793 1,227
Total operating revenues 2,049,754 151,234 — 2,200,988 2,144,417
Net assets released from restrictions 219,721 (219,721) — —
Total operating revenues and other additions (reductions) 2,269,475 (68,487) — 2,200,988 2,144,417

13
Consolidated Statements of Cash FlowsFor the fiscal years ended August 31, 2016, and August 31, 2015
(in thousands of dollars) 2016 2015
Cash flows from operating activities
Change in net assets $221,431 $129,232
Adjustments to reconcile change in net assets to net cash provided by (used in) operating activities
Depreciation 117,398 112,083
Accretion for asset retirement obligations 5,827 5,748
Asset retirement obligations settled (2,780) (172)
Change in estimated asset retirement obligations, net (71,851) —
Net losses on retirements and sales of buildings and equipment 6 1,527
Net amortization of discounts (and accretion) of premiums on bonds payable (1,040) (1,063)
Allowance for student loans receivable 667 527
Net realized and unrealized gains on investments (343,820) (148,346)
Gift of contributed securities (49,919) (139,961)
Proceeds from sale of contributed securities 49,919 39,057
Change in value of derivative instruments 1,557 1,552
Private gifts and grants for buildings and equipment (1,597) (10,845)
Changes in assets and liabilities
Accounts receivable (43,520) (11,309)
Contributions receivable (94,405) (69,055)
Other assets 1,710 (648)
Accounts payable and accrued expenses 64,049 (4,454)
Deferred revenue 18,121 4,672
Government advances for student loans (1,064) 55
Net cash provided by (used in) operating activities (129,311) (91,400)
Cash flows from investing activities
Purchases of investments (1,666,214) (2,372,293)
Proceeds from sales of investments 2,203,250 2,138,701
Acquisitions of land, buildings, and equipment (515,140) (307,625)
Proceeds from sale of buildings or equipment 102 1,047
Student loans disbursed (25,385) (26,391)
Principal collected on student loans 29,892 28,722
Other (23,076) (7,478)
Net cash provided by (used in) investing activities 3,429 (545,317)
Decrease in cash and cash equivalents (61,754) (89,029)
Cash and cash equivalents at beginning of year 277,129 366,158
Cash and cash equivalents at end of year $215,375 $277,129
Supplemental disclosure of cash flow information
Accrued liabilities for construction in progress $31,466 $22,582
Capitalized interest 24,135 15,041
Cash paid for interest 66,480 46,867
Cash flows from financing activities
Proceeds from issuance of bonds payable and notes payable 50,000 686,017
Refunding of revenue bonds payable — (149,164)
Principal payments on notes, bonds, and other debt payable (4,535) (3,805)
Proceeds from private gifts and grants for buildings and equipment 1,597 10,845
Increase in deposits payable and annuities payable 17,066 3,795
Net cash provided by (used in) financing activities 64,128 547,688
See Notes to the Consolidated Financial Statements, beginning on page 14.

14
1. Summary of Significant Accounting Policies
University ActivitiesNorthwestern University (Northwestern or the
University) is a major private research university with
more than 21,000 students enrolled in 12 academic
divisions on two lakefront campuses in Evanston and
Chicago and an international campus in Doha, Qatar.
Northwestern’s mission is to provide the highest-
quality education for its students, to develop innova-
tive programs in research, and to sustain an academic
community that embraces these enterprises. Activi-
ties supporting its mission may be classified as either
operating or nonoperating. Operating revenues include
student tuition, research funding, investment return
designated for operations, educational sales and
services, private gifts, royalties, and auxiliary services.
Operating expenses reflect support for all functions
of the University. Nonoperating activities include
unrealized gains and losses on investments, temporar-
ily restricted gifts for building, and all permanently
restricted endowment gifts.
Basis of Accounting
General
The University maintains its accounts and prepares its
consolidated financial statements on the accrual basis
of accounting in conformity with generally accepted
accounting principles in the United States of America
(GAAP). The Financial Accounting Standards Board
(FASB) Accounting Standards Codification (ASC) is the
source of authoritative GAAP. The University prepares
its consolidated financial statements in accordance
with the Not-for-Profit Entities Topic of the FASB ASC.
These statements include all wholly owned subsidiar-
ies. All significant intercompany transactions and
accounts have been eliminated.
Net Asset Classifications
Net assets and the flow of those net assets are classi-
fied in three categories according to the existence or
absence of donor-imposed restrictions. For further
discussion of the classification of donor-restricted
endowment funds and disclosures about both donor-
restricted and board-designated endowment funds,
see note 9.
The category Permanently Restricted Net Assets
applies to gifts, trusts, and pledges whose donors
required that the principal be held in perpetuity and
that only the income be available for stipulated pro-
gram operations.
The category Temporarily Restricted Net Assets
includes gifts for which donor-imposed restrictions
have not been met (these are primarily future capital
projects), as well as trust activity and pledges receiv-
able whose ultimate use is not permanently restricted.
In addition, the excess of the fair value over the
historical cost of permanently restricted endowments
is classified as temporarily restricted net assets until
appropriated for expenditure.
The category Unrestricted Net Assets describes funds
that are legally available for any purpose and have no
donor-imposed restrictions. All revenues, expenses,
gains, and losses are classified as unrestricted net
assets unless they are changes in temporarily or
permanently restricted net assets. Net unrealized
losses on permanently restricted endowment funds
for which the historical cost exceeds fair value are
recorded as a reduction to unrestricted net assets.
Revenue from temporarily restricted sources is
reclassified as unrestricted revenue when the circum-
stances of the restriction have been fulfilled. Donor-
restricted revenues whose restrictions are met within
the same fiscal year are reported as unrestricted rev-
enue. The expiration of a donor-imposed restriction
on a contribution is recognized in the period in which
the restriction expires. All expenditures are reported
in the unrestricted class of net assets, since the use
of restricted contributions in accordance with the
donor’s stipulations causes the release of the restric-
tion. Donor-restricted purposes include instruction,
research, library collections, scholarship and awards,
and building construction.
Fair Value MeasurementsThe University makes fair value measurements and
enhanced disclosures about fair value measurements
as required by the Fair Value Measurements and
Disclosures Topic of the FASB ASC. For further discus-
sion, see notes 4 and 8.
Cash and Cash EquivalentsCash reflects currency and deposits or other accounts
with financial institutions that may be deposited or
withdrawn without restriction or penalty. Cash equiv-
alents represent short-term and highly liquid invest-
ments that convert readily to cash and carry little risk
of change in value at maturity due to interest-rate
Notes to the Consolidated Financial StatementsFor the fiscal years ended August 31, 2016, and August 31, 2015

15
changes; maturities of the investments are three
months or less at the date of purchase.
ContributionsContributions received, including unconditional
promises to give (pledges), are recognized by the
University as revenues at their fair values. Private
gifts, including unconditional promises to give,
are recognized as revenues in the period received.
Conditional promises to give are not included in rev-
enue until the conditions are substantially met.
InvestmentsInvestments in securities and financial instruments
are recorded at fair value. The University values its
investments using a hierarchy of valuation inputs
based on the extent to which the inputs are observ-
able in the marketplace. Observable inputs reflect
market data obtained from sources independent of
the reporting entity; unobservable inputs reflect the
entity’s own assumptions about how market par-
ticipants would value an asset or a liability based on
the best information available. Valuation techniques
used to measure fair value must maximize the use of
observable inputs and minimize the use of unobserv-
able inputs. The fair value hierarchy is based on three
levels of inputs, of which the first two are considered
observable and the last unobservable, that may be
used to measure fair value. The following describes
this hierarchy and the primary valuation methodolo-
gies used by the University for financial instruments
measured at fair value on a recurring basis:
Level 1: Quoted prices in active markets for identical
assets or liabilities. Market-price data are generally
obtained from relevant exchanges or dealer markets.
Level 2: Inputs other than Level 1 that are observ-
able either directly or indirectly, such as quoted prices
in markets that are not active, or other inputs that
are observable or can be corroborated by observable
market data for substantially all of the same term of
the assets or liabilities. Inputs are obtained from vari-
ous sources, including market participants, dealers,
and brokers.
Level 3: Unobservable inputs that are supported by
little or no market activity and are significant to the
fair value of the assets or liabilities.
A financial instrument’s categorization within the
valuation hierarchy is based on the lowest level of
input significant to the fair value measurement. In
the event that changes in the inputs used in the fair
value measurement of an asset or liability result in
a transfer of the fair value measurement to a differ-
ent categorization, such transfers between fair value
categories are recognized at the end of the reporting
period. The categorization of an investment is based
upon its pricing transparency and liquidity and does
not necessarily correspond to the University’s per-
ceived risk of that investment. As a practical expedi-
ent as permitted under GAAP, the reported net asset
value (NAV) of investments with external managers is
used to estimate their fair value. Investments that use
NAV as a practical expedient for valuation purposes
are shown separately from the valuation hierarchy.
For further discussion, see note 4.
Equity securities with readily determinable fair val-
ues and debt securities are valued at the last sale price
(if quotations are readily available) or at the closing
bid price in the principal market in which such securi-
ties are normally traded (if no sale price is available).
The fair values for these securities are classified as
Level 1 because the securities have observable market
inputs. Certain fixed income securities are valued
based on dealer-supplied valuations; since these secu-
rities have significant other observable inputs, they
are classified as Level 2.
The estimated fair values of equity securities that do
not have readily determined fair values, and of other
investments that are generally less liquid, are based on
valuation information received on the relevant entity
and may include last sale information or independent
appraisals of value. In addition, standard valuation
techniques, including discounted cash flow models
or valuation multiples based on comparable invest-
ments, may be used. The fair values for these securi-
ties are classified as Level 3, reflecting significant
unobservable inputs that are supported by little or no
market inputs.
Investments in certain real assets and other invest-
ments are recorded at acquisition or construction
cost, or at fair value as of donation date if received as
a contribution. The University performs a periodic
assessment of these assets for impairment by compar-
ing the future cash flows expected from the asset to
the carrying value of the asset. An impairment loss is
recognized for the difference between estimated fair
value and carrying value. In management’s opinion,

16
no impairment of investments held at cost existed
as of August 31, 2016. For further discussion of such
investments, see note 4.
The methods described above may produce a fair
value that may not be indicative of net realizable
value or of future fair values. Furthermore, while the
University believes its valuation methods are appro-
priate and consistent with those of other market
participants, the use of different methodologies or
assumptions to determine the fair value of certain
financial instruments could result in a different esti-
mate of fair value at the reporting date.
Investment income is recorded on the accrual basis,
and purchases and sales of investment securities are
reflected on a trade-date basis.
Derivative Financial InstrumentsThe University uses various financial instruments to
obtain equity market exposure (e.g., equity price risk)
of an underlying investment strategy; if applicable,
these have a reference index (e.g., S&P 500) that is the
same as, or highly correlated with, the reference index
of the investment strategy. Such instruments are not
designated as hedges for accounting purposes and are
recorded at fair value.
The University enters into swap agreements to
hedge future interest-rate movements. It may also
add various interest-rate options to hedge the overall
portfolio and use an interest-rate swap agreement to
hedge variable interest-rate exposure. Interest-rate
swaps are valued using observable inputs, such as
quotations received from the counterparty, dealers, or
brokers, whenever they are available and considered
reliable. If and when models are used, the value of the
interest-rate swap depends on the contractual terms of
and specific risks inherent in the instrument, as well
as the availability and reliability of observable inputs.
Such inputs include market prices for reference securi-
ties, yield curves, credit curves, measures of volatility,
and prepayment rates as well as correlations of such
inputs. The interest-rate swaps classified within Level
3 have unobservable inputs with little or no market
activity. For further discussion, see notes 4 and 8.
Fair Values of Financial Instruments Other Than InvestmentsThe fair values of financial instruments other than
investments are based on a variety of factors. In some
cases, fair values represent quoted market prices for
identical or comparable instruments. In other cases,
fair values have been estimated based on assumptions
about the amount and timing of estimated future cash
flows and assumed discount rates reflecting varying
degrees of risk. Accordingly, the fair values may not
represent actual values that could have been realized
at year-end or that will be realized in the future.
Accounts and Notes ReceivableAccounts receivable are recorded at net realizable
value. Those generally expected to be collected within
one year are carried without an allowance. The allow-
ance for student accounts receivable is based on an
analysis of outstanding account balances and is calcu-
lated using percentages based on historical collection
data applied to the outstanding accounts receivable
balances. Accounts receivable deemed to be uncollect-
ible are expensed at that time.
Notes receivable are recorded at net realizable value
and are predominantly student loans with varying
maturities. Notes receivable deemed to be uncollect-
ible are expensed at that time.
Management assesses the adequacy of the allow-
ance for credit losses on a regular basis by performing
ongoing analysis of the student loan portfolio. Factors
considered are differing economic risks associated
with each loan category, the financial condition of spe-
cific borrowers, the economic environment in which
the borrowers operate, the level of delinquent loans,
and other significant influences. Loans disbursed
under federally guaranteed student loan programs
have special provisions. Based on this evaluation and
management judgment, an uncollectible percentage
is calculated and applied to each category of student
loan balances outstanding. Management considers the
allowance for student loan portfolio credit losses to be
prudent and reasonable.
Contributions ReceivableContributions receivable arising from unconditional
promises to give are carried net of an allowance for
uncollectible pledges. Additionally, uncon ditional
promises are presented at estimated fair value
con sidering duration and collection risk. There were
no significant conditional promises to give as of
August 31, 2016, and August 31, 2015.

17
Land, Buildings, and EquipmentThe value of land, buildings, and equipment is
recorded at cost or, if received as gifts, at fair value at
the date of the gift. Significant renewals and replace-
ments are capitalized. The cost of repairs and main-
tenance is expensed as incurred. Purchases of library
books and works of art are also expensed.
Depreciation is calculated using the straight-line
method over the useful lives of the equipment, which
are estimated to be 3 to 20 years; of the buildings and
land improvements, which are estimated to be up to
40 years; and of the leasehold improvements, which
are estimated to be the shorter of the useful life or the
lease term. The useful life of land is deemed indefinite
and not depreciable.
The University reviews long-lived assets for impair-
ment by comparing the future cash flows expected
from the asset to the carrying value of the asset. If the
carrying value of an asset exceeds the sum of esti-
mated undiscounted future cash flows, an impairment
loss is recognized for the difference between esti-
mated fair value and carrying value. In management’s
opinion, no impairment existed as of August 31, 2016.
Charitable Remainder TrustsCharitable remainder trusts are classified as perma-
nently restricted net assets if, upon termination of the
trust, the donor permanently restricts the remain-
ing trust assets. If the remainder is not permanently
restricted by the donor, the charitable remainder trust
assets are recorded as temporarily restricted net assets.
Annuities PayableAnnuities payable consist of annuity payments cur-
rently due and the actuarial amount of annuities
payable. The actuarial amount of annuities payable is
the present value of the aggregate liability for annuity
payments over the expected lives of the beneficiaries.
Self-Insurance ReservesThe University maintains a self-insurance program
for general liability, professional liability, and certain
employee and student insurance coverages. This
pro gram is supplemented with commercial excess
insurance above the University’s self-insurance reten-
tion. The reserves for self-insurance and postretire-
ment medical and life insurance benefits are based
on actuarial studies and management estimates. See
notes 10 and 12 for additional discussion.
Asset Retirement ObligationsThe University records all known asset retirement
obligations (ARO) for which the fair value of the
liability can be reasonably estimated, including cer-
tain obligations relating to regulatory remediation.
ARO covered include those for which an entity has a
legal obligation to perform an asset retirement activ-
ity; however, the timing and/or method of settling the
obligation are conditional on a future event that may
or may not be within the control of the entity. The
reserves for ARO are based on analyses of University
assets, review of applicable regulatory and other guid-
ance, and management estimates.
Revenue RecognitionRevenues from tuition and fees are reported in the
fiscal year in which they are earned, including pro-
rata adjustments for educational programs crossing
over fiscal years. Fiscal year 2017 fall-quarter tuition
and fees, billed but not earned in fiscal year 2016,
are reported as deferred revenue in fiscal year 2016.
Similarly, fiscal year 2016 fall-quarter tuition and fees,
billed but not earned in fiscal year 2015, are reported
as deferred revenue in fiscal year 2015.
Revenues from auxiliary services, such as resi-
dence and food services, represent fees for goods and
services furnished to University students, faculty, and
staff; these revenues are recognized in the fiscal year
in which the goods and services are provided. Grants
and contracts revenue is recognized as expenses are
incurred. Professional fees arise from faculty and
department services provided to external institutions
such as hospitals. Sales and services revenues repre-
sent fees for services and goods provided to external
parties in the course of educational activities and also
include revenues from the provision of physical plant
services and goods to external institutions contiguous
to the University campuses. Trademark and royalty
revenues arise from licensing of innovative technolo-
gies, copyrights, and other intellectual property; these
revenues are recognized in the fiscal year in which
they are earned. Other income includes revenues not
otherwise categorized that are also recognized in the
fiscal year in which they are earned.
Federal Grants and Contracts RevenueThe University receives funding or reimbursement
from federal agencies. In addition, indirect cost

18
recovery on federal grants and contracts is based on
an institutional rate negotiated with its cognizant fed-
eral agency, the United States Department of Health
and Human Services.
Income TaxesThe Internal Revenue Service has determined that the
University is exempt from income taxes under Section
501(c)(3) of the US Internal Revenue Code, except with
regard to unrelated business income, which is taxed at
corporate income tax rates. The University files federal
and various state and local tax returns. The statute
of limitations on the University’s federal tax returns
remains open for fiscal years 2012 through 2016.
The University makes an assessment of individual
tax positions and follows a process for recognition
and measurement of uncertain tax positions. Tax
positions are evaluated on whether they meet the
“more likely than not” standard for sustainability on
examination by tax authorities.
Uses of Estimates in the Preparation of Financial StatementsThe preparation of financial statements in conformity
with GAAP requires management to make estimates
and assumptions that affect the reported amounts
of assets and liabilities; the disclosure of contingent
assets and liabilities at the date of the consolidated
financial statements; and the reported amounts of rev-
enues and expenses during the relevant period. Actual
results could differ from those estimates.
The University believes that the methods and
assumptions used are appropriate.
Subsequent EventsThe University has evaluated subsequent events in
accordance with the FASB ASC Subsequent Event
Topic through February 2, 2017, the date when finan-
cial statements were issued. The University did not
identify any subsequent events to be disclosed.
Recent Accounting PronouncementsIn August 2016, the FASB issued Accounting Standards
Update (ASU) 2016-14, “Not-for-Profit Entities:
Presentation of Financial Statements of Not-for-Profit
Entities,” the first phase of improvements to financial
reporting and presentation. The guidance addresses
net asset classifications, and reporting and disclo-
sures about liquidity, financial performance, expenses,
and cash flows. The standard is effective in fiscal year
2019 for the University, and its impact on policies,
procedures, and the consolidated financial statements
is under evaluation.
In February 2016, the FASB issued ASU 2016-02,
“Leases,” new guidance to increase the transparency
and comparability of lease reporting by recognizing
lease assets and liabilities on the balance sheet and
disclosing key information about leasing activities.
The principal difference from previous guidance is
that the lease assets and liabilities that arise from
operating leases with terms greater than one year
should be recognized in the statement of financial
position. The standard is effective in fiscal year 2020
for the University, and its impact on policies, proce-
dures, and the consolidated financial statements is
under evaluation.
In January 2016, the FASB issued ASU 2016-01,
“Financial Instruments—Overall: Recognition and
Measurement of Financial Assets and Financial
Liabilities,” affecting accounting for equity invest-
ments and financial liabilities under the fair value
option and certain presentation and disclosure
requirements for financial instruments. The standard
is effective in fiscal year 2019 for the University, and
its impact on policies, procedures, and the consoli-
dated financial statements is under evaluation.
In May 2014, the FASB issued ASU 2014-09, “Revenue
from Contracts with Customers,” a new revenue
recognition topic in the Codification. In August 2015,
ASU 2015-14 was issued to defer the effective date of
ASU 2014-09 for all entities for one year. Now effec-
tive in fiscal year 2019 for the University, it provides a
principle-based framework to replace earlier industry-
specific and rule-based revenue recognition stan-
dards. Under the new ASU, revenue is recognized at an
amount that reflects consideration to which the entity
expects to be entitled from another entity in exchange
for contracted services or goods that are an output
of its ordinary activities. This approach requires use
of more judgments and estimates by management, as
well as more disclosures to describe estimation meth-
ods, inputs, and assumptions used. The University
is evaluating the impact of its implementation on
policies, procedures, and the consolidated financial
statements.

19
Summarized Comparative InformationThe financial statements include certain prior-year
summarized comparative information in total but
not by net asset class. Such information does not
include sufficient detail to constitute a presentation in
conformity with GAAP. Accordingly, such information
should be read in conjunction with the University’s
financial statements for the year ended August 31,
2015, from which the summarized information
was derived.
2. Accounts Receivable and Notes Receivable
Accounts receivable are summarized on the consolidated statements of financial position as follows:
(in thousands of dollars) August 31, 2016 August 31, 2015
Research and other sponsored programs support $89,320 $76,966
Student receivables 139,608 121,654
Royalty receivables 16,157 23,000
Other receivables 82,032 61,909
Accounts receivable subtotal 327,117 283,529
Less allowances for student uncollectible amounts (671) (603)
Total accounts receivable $326,446 $282,926
Notes receivable are summarized on the consolidated statements of financial position as follows:
(in thousands of dollars) August 31, 2016 August 31, 2015
Notes receivable $159,917 $149,582
Less allowances for student uncollectible amounts (3,489) (2,822)
Total notes receivable $156,428 $146,760
Activity within the allowances was insignificant for fiscal years 2016 and 2015.
3. Contributions ReceivableContributions receivable consisted of the following:
(in thousands of dollars) August 31, 2016 August 31, 2015
Unconditional promises expected to be collected in
Less than one year $47,660 $41,058
One year to five years 150,658 78,200
More than five years 118,781 91,715
Fair value and other reserves
Fair value adjustment (47,133) (33,878)
Other reserves (6,543) (8,077)
Total contributions receivable $263,423 $169,018
Contributions receivable are discounted based on
the weighted average borrowing rates for short-term
and long-term bonds, notes, and other debt payable
to correspond to the terms of the pledges receivable.
The discount rate for pledges made in fiscal years
2016 and 2015 was 3.5 percent; the discount rate for
pledges made in prior fiscal years ranged from 2.7 to
6.5 percent.
20
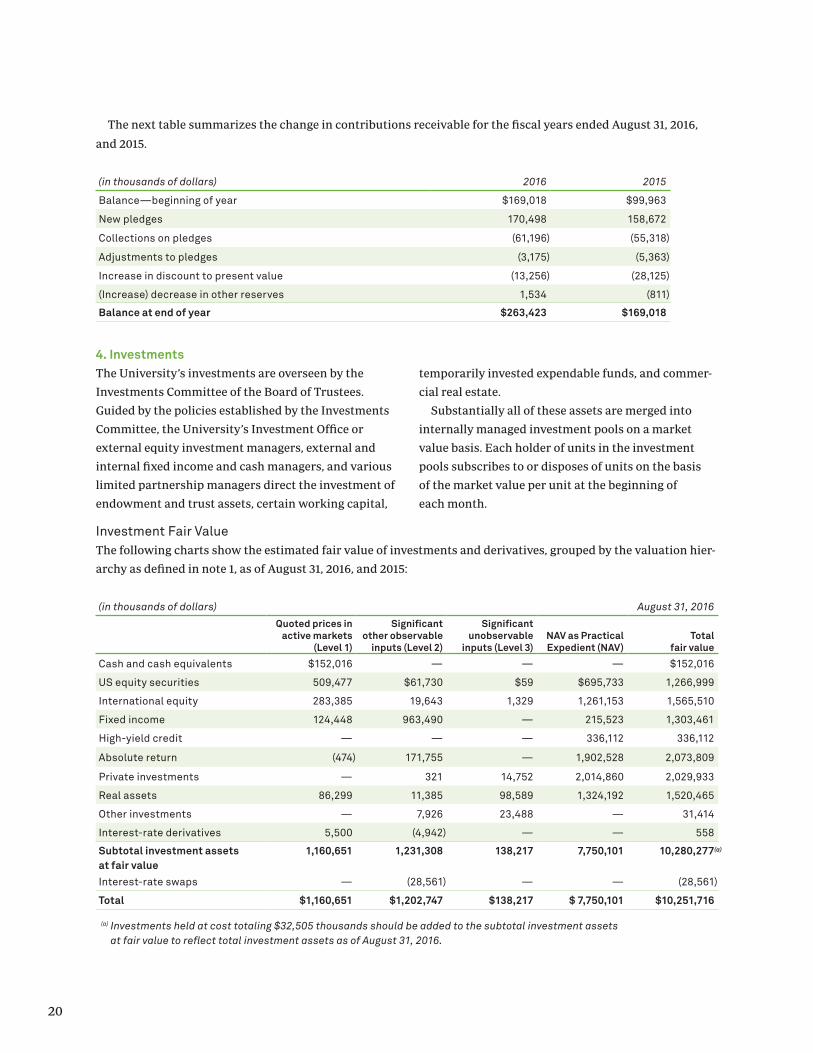
The next table summarizes the change in contributions receivable for the fiscal years ended August 31, 2016,
and 2015.
(in thousands of dollars) 2016 2015
Balance—beginning of year $169,018 $99,963
New pledges 170,498 158,672
Collections on pledges (61,196) (55,318)
Adjustments to pledges (3,175) (5,363)
Increase in discount to present value (13,256) (28,125)
(Increase) decrease in other reserves 1,534 (811)
Balance at end of year $263,423 $169,018
4. InvestmentsThe University’s investments are overseen by the
Investments Committee of the Board of Trustees.
Guided by the policies established by the Investments
Committee, the University’s Investment Office or
external equity investment managers, external and
internal fixed income and cash managers, and various
limited partnership managers direct the investment of
endowment and trust assets, certain working capital,
temporarily invested expendable funds, and commer-
cial real estate.
Substantially all of these assets are merged into
internally managed investment pools on a market
value basis. Each holder of units in the investment
pools subscribes to or disposes of units on the basis
of the market value per unit at the beginning of
each month.
Investment Fair ValueThe following charts show the estimated fair value of investments and derivatives, grouped by the valuation hier-
archy as defined in note 1, as of August 31, 2016, and 2015:
(in thousands of dollars) August 31, 2016
Quoted prices in active markets
(Level 1)
Significant other observable
inputs (Level 2)
Significant unobservable
inputs (Level 3)NAV as Practical Expedient (NAV)
Total fair value
Cash and cash equivalents $152,016 — — — $152,016
US equity securities 509,477 $61,730 $59 $695,733 1,266,999
International equity 283,385 19,643 1,329 1,261,153 1,565,510
Fixed income 124,448 963,490 — 215,523 1,303,461
High-yield credit — — — 336,112 336,112
Absolute return (474) 171,755 — 1,902,528 2,073,809
Private investments — 321 14,752 2,014,860 2,029,933
Real assets 86,299 11,385 98,589 1,324,192 1,520,465
Other investments — 7,926 23,488 — 31,414
Interest-rate derivatives 5,500 (4,942) — — 558
Subtotal investment assets at fair value
1,160,651 1,231,308 138,217 7,750,101 10,280,277
Interest-rate swaps — (28,561) — — (28,561)
Total $1,160,651 $1,202,747 $138,217 $ 7,750,101 $10,251,716
(a) Investments held at cost totaling $32,505 thousands should be added to the subtotal investment assets at fair value to reflect total investment assets as of August 31, 2016.
(a)

21
(in thousands of dollars) August 31, 2015
Quoted prices in active markets
(Level 1)
Significant other observable
inputs (Level 2)
Significant unobservable
inputs (Level 3)NAV as Practical Expedient (NAV)
Total fair value
Cash and cash equivalents $476,756 — — — $476,756
US equity securities 537,839 $67,061 — $696,404 1,301,304
International equity 309,097 26,469 $63 1,160,180 1,495,809
Fixed income 337,513 750,837 — 205,316 1,293,666
High-yield credit — — — 337,109 337,109
Absolute return (5,917) 298,749 — 1,773,810 2,066,642
Private investments — 321 16,903 2,026,851 2,044,075
Real assets 67,427 2,595 101,502 1,248,323 1,419,847
Other investments — 9,970 24,325 455 34,750
Interest-rate derivatives — (6,261) — — (6,261)
Subtotal investment assets at fair value
1,722,715 1,149,741 142,793 7,448,448 10,463,697
Interest-rate swaps — (27,004) — — (27,004)
Total $1,722,715 $1,122,737 $142,793 $ 7,448,448 $10,436,693
(a) Investments held at cost totaling $34,067 thousands should be added to the subtotal investment assets at fair value to reflect total investment assets as of August 31, 2015.
Investments included as NAV as Practical Expedient
consist primarily of the University’s ownership in
external investments (principally limited partner-
ship interests in long-only equity and credit, hedge,
private equity, real estate, and other similar funds).
As a practical expedient, when quoted market prices
are not available, the estimated fair values of these
investments are generally based on reported partners’
capital or NAV provided by the associated external
investment managers. In cases where the practical
expedient threshold is not met, such as an investment
not being in compliance with GAAP, or where a state-
ment of partners’ capital is not provided, the invest-
ment is reported as Level 3. Since a range of possible
values exists for these partnership investments, the
estimated values may be materially different from
the values that would have been used had a ready
market for these partnerships existed. The University
exercises diligence in assessing the policies, proce-
dures, and controls of external investment managers;
management’s assessment includes a valuation review
process of the most recent available audited and
unaudited financial statements and discussions with
the majority of external investment managers about
the aggregate carrying value of the respective invest-
ments at August 31, 2016. The assessment may result
in adjustment to the external managers’ valuations
of the securities’ fair value if those valuations are not
in accordance with GAAP. Management reviewed the
valuation policies for all partnerships in which the
University is invested and deemed that its policies are
appropriate and that the carrying amount of these
assets represents a reasonable estimate of fair value. A
small number of investments within certain partner-
ships may have holdings at a carrying value of cost. In
the absence of another basis, management has deter-
mined this method to be appropriate for these specific
investments and representative of an approximation
of the fair value.
The following tables summarize changes in
the investments and derivatives classified by the
University in Level 3 of the fair value hierarchy for the
fiscal years ended August 31, 2016, and 2015:
(a)

22
(in thousands of dollars) August 31, 2015 August 31, 2016
Fair value Purchases Sales and settlements
Unrealized gains (losses)
Realized gains (losses)
Transfers into and out of Level 3 Fair value
US equity securities — $141 ($91) $74 ($65) $59
International equity $63 1,089 656 (479) 1,329
Private investments 16,903 2,777 (671) (4,257) 14,752
Real assets 101,502 10,346 (8,192) (6,623) 1,556 98,589
Other investments 24,325 (837) 23,488
Total investments $142,793 14,353 (8,954) (10,987) 1,012 — $138,217
(in thousands of dollars) August 31, 2014 August 31, 2015
Fair value Purchases Sales and settlements
Unrealized gains (losses)
Realized gains (losses)
Transfers into and out of Level 3 Fair value
US equity securities $71 ($71) —
International equity 249 ($131) ($17) ($38) $63
Private investments 13,216 $2,958 (802) 1,884 (32) (321) 16,903
Real assets 94,343 40,332 (5,986) (28,430) 1,243 101,502
Other investments 20,733 (711) 4,303 24,325
Total investments $128,612 43,290 (7,630) (22,260) 1,173 (392) $142,793
There were no significant transfers or reclassifica-
tions between Levels 1 and 2 during fiscal years 2016
and 2015. In fiscal year 2016, there were no transfers
into or out of Level 3. In fiscal year 2015, the transfers
out of Level 3 consisted primarily of investments
reclassified from Level 3 to Level 2 based on observ-
able discounted cash flow inputs.
As of August 31, 2016, and 2015, investments held
at cost included real estate totaling $19.4 million.
Investments held at cost also included property
co-ownerships, mortgages, and other investments
totaling $13.1 million and $14.7 million as of August 31,
2016, and 2015, respectively.
The next table presents funding obligations and
redemption terms of investments by asset class.
The University is required under certain partner-
ship agreements to advance additional funding up to
specified levels over a period of several years. These
uncalled commitments have fixed expiration dates
and other termination clauses. At August 31, 2016, the
University was committed to making future capital
contributions in the amount of $1,986 million, primar-
ily in the next five years, as detailed on the next page.
Certain agreements also contain notice periods, lock-
ups, and gates that limit the University’s ability to
initiate redemptions.

23
(in thousands of dollars)Fair
valueRemaining
lifeUncalled
commitments Redemption terms Redemption restrictions
US equity securities
$1,266,999 No limit — Daily to annually, with 1–90-day notice periods
Lock-up provisions ranging from none to 1 year
International equity
1,565,510 No limit $18,557 Daily to annually, with 1–90-day notice periods
Lock-up provisions ranging from none to 2 years
Fixed income 1,303,461 No limit — Daily to quarterly, with 1–90-day notice periods
No lock-up provisions
High-yield credit
336,112 No limit to 12 years
149,505 Certain partnerships ineligible for redemption; other funds
quarterly to annually, with 90-day notice periods
Certain partnerships not redeemable; lock-up provisions on all other funds, ranging from
none to 1 year with side pockets
Absolute return
2,073,809 No limit — Weekly to annually, with 5–120-day notice periods
Lock-up provisions ranging from none to 3 years; side pockets on
many funds
Private investments
2,029,933 1–12 years 930,113 Partnerships ineligible for redemption
Not redeemable
Real assets 1,520,465 No limit to 14 years
887,692 Partnerships ineligible for redemption; commodity and
equity funds are weekly to quarterly, with 1–45-day
notice periods
Drawdown partnerships not redeemable; no restriction on
commodity and equity funds
Cash and cash equivalents for investment purposes
include bank accounts holding cash and money mar-
ket funds consisting of short-term US Treasury securi-
ties. Cash and cash equivalents are highly liquid and
are carried at amortized cost, which approximates
fair value.
Northwestern’s marketable securities categories
include investments in US equities, international
equity, and fixed income strategies via separately
managed accounts, partnerships, and commingled
funds. US equity strategies include large-, mid-, and
small-cap public equities. One investment in this
category currently may not be redeemed over the next
year, while two others may only be partially redeemed.
International equities include developed market
(ex–US public equities) and emerging market strate-
gies. Two investments in this category may only be
partially redeemed over the next year.
Fixed income strategies include US government
securities, agency securities, inflation-linked bonds
(TIPS), corporate bonds, global bonds, and short-term
cash investments. As of August 31, 2016, one invest-
ment in this category may only be partially redeemed
over the next year.
The high-yield credit portfolio includes investments
in distressed debt and other credit instruments with
fixed income characteristics but more specific risk
tied to the securities and their underlying cash flows.
The absolute return portfolio is weighted toward
long-short equity managers, uncorrelated strategies,
and diversifying event-driven or hedged tactical credit
strategies. Two investments in this portfolio currently
may not be redeemed over the next year due to lock-
up provisions. As of August 31, 2016, the remaining
investments have either full or partial liquidity over
the next year, with the exception of those having side
pockets.
The private investments portfolio includes invest-
ments in global buyout and venture capital funds. The
real assets portfolio includes the University’s invest-
ments in energy, timber, real estate, and public invest-
ments in some commodity and equity funds.
Management’s estimate of the lives of the funds
could vary significantly depending on the investment
decisions of the external fund managers, changes in
the University’s portfolio, and other circumstances.
Furthermore, the University’s obligation to fund these
commitments may be waived by the fund managers
for a variety of reasons, including the market environ-
ment and/or changes in investment strategy.

24
Investment ReturnThe components of total investment return were as follows:
(in thousands of dollars) August 31, 2016 August 31, 2015
Investment income $52,987 $46,696
Net realized gains 440,499 518,214
Net change in fair values, unrealized (96,965) (365,151)
Total investment return $396,521 $199,759
Investment return designated for operations is defined as the investment payout, according to the spending
guideline for the Long-Term Balanced Pool and the actual investment income for all other investments. Gross
investment income from specific investments held at cost totaled $13.7 million and $18.6 million at August 31,
2016, and 2015, respectively. Investment expenses related to specific investments held at cost totaled $2.8 million
and $2.4 million at August 31, 2016, and 2015, respectively. All other investment returns are categorized as non-
operating. As reflected in the consolidated statement of activities, investment return was as follows:
(in thousands of dollars) August 31, 2016 August 31, 2015
Changes in unrestricted net assets
Operating: investment return $357,775 $334,562
Nonoperating: investment returns, reduced by operating distribution (10,073) (214,941)
Changes in temporarily restricted net assets
Operating: investment return 151,234 139,313
Nonoperating: investment returns, reduced by operating distribution (102,415) (59,175)
Total investment return $396,521 $199,759
Certain expenses paid directly by the University for
investment management and custody services totaled
$56 million and $59.6 million for the fiscal years
ended August 31, 2016, and 2015, respectively, and have
been netted against investment earnings.
Derivative Financial InstrumentsThe University has entered into hedging transactions
via various interest-rate swaps and options and has
maintained those positions since fiscal year 2010.
These instruments are held in the fixed income asset
class of investments within Level 2.
Credit exposure represents the University’s poten-
tial loss if all the counterparties fail to perform under
the terms of the contracts, and if all collateral, if any,
becomes worthless. This exposure is measured by the
fair value of the cash collateral held at the counter-
parties at the reporting date. The University manages
its exposure to credit risk by using highly rated
counterparties, establishing risk-control limits, and
obtaining collateral where appropriate. As a result, the
University has limited credit risk. The University has
entered into margin collateral agreements with major
investment banks that impose a $1 million threshold
on both parties. As of August 31, 2016, the University
posted collateral of $5.5 million to one counterparty.
To date, the University has not incurred any losses on
derivative financial instruments due to counterparty
nonperformance.
The University has hired an external manager to
use derivative financial instruments to obtain market
exposure in equity and fixed income indices on excess
cash balances. The University regularly reviews the
use of derivative financial instruments by each of the
managers of alternative investment funds in which it
participates. While these outside managers generally
use such instruments for hedging purposes, deriva-
tive financial instruments are employed for trading
purposes by numerous independent asset managers of
the University.
For further discussion of credit-related derivatives,
see note 8.

25
The following tables summarize the derivative financial instruments held by the University as of August 31,
2016, and 2015:
(in thousands of dollars) August 31, 2016
Notional amount Assets Liabilities Fiscal year net gain (loss)
Investment-related derivatives
Interest-rate swaptions $400,000 $5,500 ($4,942) ($2,360)
Equity futures 52,701 4,451 — 3,091
Total investment-related 452,701 9,951 (4,942) 731
Credit-related derivatives
Interest-rate swaps 125,000 — (28,561) (1,557)
Total credit-related 125,000 — (28,561) (1,557)
Total derivative financial instruments $577,701 $9,951 ($33,503) ($826)
(in thousands of dollars) August 31, 2015
Notional amount Assets Liabilities Fiscal year net gain (loss)
Investment-related derivatives
Interest-rate swaptions $400,000 $7,000 ($6,261) ($98)
Equity futures 78,337 9,878 — (9,552)
Total investment-related 478,337 16,878 (6,261) (9,650)
Credit-related derivatives
Interest-rate swaps 125,000 — (27,004) (1,552)
Total credit-related 125,000 — (27,004) (1,552)
Total derivative financial instruments $603,337 $16,878 ($33,265) ($11,202)
5. Land, Buildings, and EquipmentLand, buildings, and equipment consisted of the following:
(in thousands of dollars) August 31, 2016 August 31, 2015
Land $29,089 $28,389
Construction in progress 606,726 542,730
Buildings and leasehold improvements 2,712,816 2,393,140
Equipment 552,482 517,152
Accumulated depreciation (1,532,515) (1,437,964)
Total land, buildings, and equipment $2,368,598 $2,043,447
The estimated cost to complete construction in
progress at August 31, 2016, is $749.6 million. Costs
included in construction in progress are building
and leasehold improvement capitalizations. Building
costs are funded by bonds, gifts (received or pledged),
grants, and unrestricted funds.
Under the University’s interest capitalization policy,
actual interest expense incurred during the period of
construction of an asset for University use is capital-
ized until that asset is substantially completed and
ready for use. The capitalized cost is reflected in the
total cost of the asset and depreciated over the useful
life of the asset. Assets may include buildings and
major equipment.

26
Asset Retirement ObligationsIn fiscal year 2016, management made a change in estimate of ARO based on an enhanced evaluation methodol-
ogy, performance of a comprehensive study, and recalculations of remediation risks, assumptions, and costs. As
a result of a change in estimate, the adjustment to the ARO liability eliminated the net asset retirement cost and
reduced the net book value of the associated fixed assets, resulting in a nonoperating gain. Building assets were
reduced by $62.9 million and accumulated depreciation was reduced by $13.6 million on the consolidated state-
ments of financial position, and a nonoperating gain of $71.9 million was recorded on the consolidated statement
of activities.
ARO were adjusted during fiscal years 2016 and 2015 as follows:
(in thousands of dollars) August 31, 2016 August 31, 2015
Balance at beginning of year $121,035 $115,459
Liabilities settled in current period (2,780) (172)
Accretion expense 5,827 5,748
Change in estimated cash flows (121,142) —
Balance at end of year $2,940 $121,035
Lease ObligationsThe University is obligated under numerous operating
leases to pay base rent through the lease expiration
dates. Operating leases consist primarily of leases
for the use of real property and have terms expiring
in various years through fiscal year 2030. Real estate
lease expenses totaled $12.5 million and $12.3 million
at August 31, 2016, and 2015, respectively. Sublease
rentals totaled $3 million and $3.1 million at August 31,
2016, and 2015, respectively. At August 31, 2016, there
were no subleases that are noncancelable for one year
or more. The future minimum lease payments under
noncancelable operating leases through August 31 of
each period are shown at right.
(in thousands of dollars)
2017 $13,081
2018 13,300
2019 12,928
2020 12,099
2021 11,101
2022 and thereafter 31,897
Total $94,406
Rentals Under LeasesThe University is entitled under numerous operating
leases to receive rental payments. Operating leases
consist primarily of leases for the use of real property
and have terms expiring in various years through
fiscal year 2021. The future minimum rental pay-
ments under noncancelable operating leases through
August 31 of each period are shown at right.
(in thousands of dollars)
2017 $1,881
2018 1,924
2019 1,968
2020 536
2021 36
2022 and thereafter —
Total $6,345

27
6. Other AssetsOther assets are summarized on the consolidated statements of financial position as follows:
(in thousands of dollars) August 31, 2016 August 31, 2015
Prepaid bond expenses $8,816 $9,155
Inventories 2,602 2,864
Other assets 5,707 6,712
Total other assets $17,125 $18,731
7. Deposits Payable and Actuarial Liability of Annuities PayableDeposits payable and actuarial liability of annuities payable are summarized on the consolidated statements of
financial position as follows:
(in thousands of dollars) August 31, 2016 August 31, 2015
Agency deposits payable $87,804 $83,666
Actuarial liability of annuities payable 21,882 22,669
Student loan deposits payable 10,436 13,041
Other deposits payable 20,714 4,394
Total deposits payable and actuarial liability of annuities payable $140,836 $123,770
8. Bonds, Notes, and Other Debt PayableBonds and notes payable are as follows:
(in thousands of dollars) August 31, 2016 August 31, 2015
Illinois Finance Authority (IFA)–Series 2004 $135,800 $135,800
IFA–Series 2008 125,000 125,000
Taxable–Series 2012 200,000 200,000
Taxable–Series 2013 577,660 582,195
Less unamortized loss on Taxable–Series 2013 (2,349) (2,451)
Taxable–Series 2015 500,000 500,000
Less unamortized loss on Taxable–Series 2015 (634) (657)
IFA–Series 2015 128,545 128,545
Plus unaccreted premium on Tax-Exempt–Series 2015 15,142 16,307
Bonds payable subtotal 1,679,164 1,684,739
Notes payable–commercial paper, taxable 230,000 180,000
Total bonds and notes payable $1,909,164 $1,864,739
Debt issuance Interest-rate mode Interest rate Maturity
IFA–Series 2004 Variable .62%(a) December 1, 2034
IFA–Series 2008 Variable .6%(a) December 1, 2046
Taxable–Series 2012 Fixed 4.2% December 1, 2039, to December 1, 2047
Taxable–Series 2013 Fixed 4.48%(b) December 1, 2015, to December 1, 2044
Taxable–Series 2015 Fixed 3.78%(b) December 1, 2038, to December 1, 2048
IFA–Series 2015 Fixed 4.24%(b) December 1, 2022, to December 1, 2028
Notes payable–commercial paper, taxable Fixed .49%(b) September 1, 2016, to October 3, 2016
(a) Interest rate reset weekly(b) Weighted average interest rate at August 31, 2016

28
Total obligations including bonds and notes pay-
able at August 31, 2016, are scheduled to mature
through August 31 of each period as noted below. The
schedule has been prepared based on the contractual
maturities of the debt outstanding at August 31, 2016.
Accordingly, if remarketing of bonds fails in future
periods, debt repayments may become more acceler-
ated than presented here. The potential failed remar-
ketings coincide with the interest rate reset dates and
amounts noted above.
(in thousands of dollars)
2017 $234,715
2018 4,770
2019 4,935
2020 5,085
2021 5,450
Thereafter 1,642,050
Total $1,897,005
Bonds Payable
The IFA–Series 2015 Revenue Bonds were issued to
acquire, construct, renovate, improve, and equip cer-
tain educational facilities of the University as defined
in the Illinois Finance Authority Act and to pay certain
expenses incurred in connection with the issuance
of the bonds as permitted under the Illinois Finance
Authority Act, subject to conditions set forth in a trust
indenture between the Illinois Finance Authority (IFA)
and Wells Fargo Bank, National Association (NA); and
a loan agreement between the University and the IFA.
The Taxable–Series 2015 Fixed Rate Bonds were
issued to acquire, construct, renovate, and equip
certain educational facilities of the University, to
refund $145.1 million of the University’s outstanding
IFA–Series 2006 Revenue Bonds, and to pay certain
expenses incurred in connection with the redemption
and the issuance of the bonds, subject to conditions
set forth in a trust indenture between the University
and Wells Fargo Bank, NA.
The Taxable–Series 2013 Fixed Rate Bonds were
issued to acquire, construct, renovate, and equip
certain educational facilities of the University, to
refund $185 million of the University’s outstanding
IEFA–Series 2003 Fixed Rate Revenue Bonds, and to
pay certain expenses incurred in connection with
the redemption and issuance of the bonds, subject to
conditions set forth in a trust indenture between the
University and Wells Fargo Bank, NA.
The Taxable–Series 2012 Fixed Rate Bonds were
issued to acquire, construct, and equip certain edu-
cational facilities of the University and to pay certain
costs relating to the issuance of the bonds, subject to
conditions set forth in a trust indenture between the
University and Wells Fargo Bank, NA.
The IFA–Series 2008 Adjustable Rate Revenue Bonds
were issued to acquire, construct, renovate, remodel,
improve, and equip certain educational facilities
of the University as defined in the Illinois Finance
Authority Act and to pay certain expenses incurred in
connection with the issuance of the bonds as permit-
ted under the Illinois Finance Authority Act, subject to
conditions set forth in a trust indenture between the
IFA and Wells Fargo Bank, NA; and a loan agreement
between the University and the IFA. The bonds may
operate in a daily, weekly, adjustable, or auction-rate
mode.
The IFA–Series 2006 Revenue Bonds were issued
to refund $145.1 million of the University’s outstand-
ing IEFA–Series 1997 Adjustable Medium-Term
Revenue Bonds and to pay certain expenses incurred
in connection with the issuance and advance refund-
ing of the bonds, all as permitted under the Illinois
Finance Authority Act and subject to conditions set
forth in a trust indenture between the IFA and Wells
Fargo Bank, NA; and a loan agreement between the
University and the IFA.
The IFA–Series 2004 Adjustable Rate Revenue
Bonds were issued to acquire, construct, renovate,
improve, and equip certain educational facilities
of the University as defined in the Illinois Finance
Authority Act and to pay certain expenses incurred in
connection with the issuance of the bonds as permit-
ted under the Illinois Finance Authority Act, subject to
conditions set forth in a trust indenture between the
IFA and Wells Fargo Bank, NA; and a loan agreement
between the University and the IFA. The bonds may
operate in a daily, weekly, adjustable, or auction-rate
mode.

29
Derivative Financial InstrumentsThe University has entered into interest-rate swap
agreements to hedge variable interest-rate exposure
related to its variable rate debt. The agreements
effectively fix the interest rate from 4.12 percent
to 4.38 percent. The notional value is $125 million
through expiration on August 31, 2023.
The University recognized a net unrealized loss on
the swap investment totaling $1.6 million for the fiscal
year ended August 31, 2016, and a net unrealized loss of
$1.6 million for the fiscal year ended August 31, 2015.
The fair values of the swap position were in a liability
position of $28.6 million and $27 million as of August 31,
2016, and 2015, respectively, and are included in
accounts payable and accrued expenses on the consoli-
dated statements of financial position. Also see note 4.
Notes PayableThe University places commercial paper under a
$300 million Taxable Commercial Paper Note.
Other Debt PayableAt August 31, 2016, the University held or had the abil-
ity to draw $350 million in standby lines of credit to
supplement working capital requirements as follows:
(in thousands of dollars)
Expiration date Available credit
December 9, 2016(a) $25,000
June 30, 2017 50,000
June 30, 2017 25,000
July 21, 2017 125,000
October 17, 2017 50,000
March 31, 2018 75,000
Total $350,000
(a) Renewed on December 9, 2016, through December 8, 2017.
9. EndowmentsThe FASB ASC Not-for-Profit Entities Presentation
of Financial Statements Subtopic provides guidance
on the net asset classification of donor-restricted
endowment funds for not-for-profit organizations
subject to an enacted version of the Uniform Prudent
Management of Institutional Funds Act (UPMIFA)
and improves disclosure about an organization’s
endowment funds, both donor-restricted and
board-designated, regardless of whether the organiza-
tion is subject to UPMIFA.
The University interprets UPMIFA as requiring
that the fair value of the original donor-restricted
endowment gift be preserved as of the gift date unless
there are explicit donor stipulations to the contrary.
Therefore, the University classifies as permanently
restricted net assets the original value of gifts donated
to the permanent endowment, the original value of
subsequent gifts, and accumulations to the permanent
endowment made in accordance with the applicable
donor gift instrument at the time the accumulation
was added to the fund. The remaining portion of the
donor-restricted endowment fund that is not clas-
sified in permanently restricted net assets is clas-
sified as temporarily restricted net assets until it is
appropriated for University expenditure in a manner
consistent with UPMIFA’s standard of prudence. In
accordance with UPMIFA, the University considers
the following factors in determining to appropriate or
accumulate donor-restricted endowment funds:
• The duration and preservation of the
endowment fund
• The purposes of the institution and of the
endowment fund
• General economic conditions
• The possible effects of inflation or deflation
• The expected total return from income and
appreciation of investments
• Other resources of the institution
• The institutional investment policy
The University’s endowment consists of about 2,500
individual donor-restricted endowment funds and
about 1,000 funds it designates to function as endow-
ments. The net assets associated with endowment
funds, including funds designated by the University to
function as endowments, are classified and reported
based on whether there are donor-imposed restric-
tions. Institution-designated endowment funds
include quasi-endowments established by specific
Board of Trustees approval as well as endowments
created by management under general guidelines and
policies approved by the Board of Trustees.

30
The following tables present the endowment net asset composition by type of fund at fair value as of
August 31, 2016, and 2015:
(in thousands of dollars) August 31, 2016
Endowment net asset composition by type of fund Unrestricted
Temporarily restricted
Permanently restricted Total
Donor-restricted endowment funds ($3,039) $2,235,406 $1,411,130 $3,643,497
Institution-designated endowment funds 3,834,670 3,834,670
Total endowment funds $3,831,631 $2,235,406 $1,411,130 $7,478,167
(in thousands of dollars) August 31, 2015
Endowment net asset composition by type of fund Unrestricted
Temporarily restricted
Permanently restricted Total
Donor-restricted endowment funds ($487) $2,333,376 $1,342,956 $3,675,845
Institution-designated endowment funds 3,912,184 3,912,184
Total endowment funds $3,911,697 $2,333,376 $1,342,956 $7,588,029
Investment and Spending PoliciesThe University’s endowment is primarily invested
in the Long-Term Balanced Pool. The Investments
Committee of the Board of Trustees annually reviews
asset allocation policy for the pool.
The principal objective for the Long-Term Balanced
Pool is to preserve purchasing power and to provide
a growing stream of income to fund University
programs. On average, the pool seeks to achieve an
annual total rate of return (i.e., actual income plus
appreciation) equal to inflation plus actual spending.
This objective of preserving purchasing power empha-
sizes the need for a long-term perspective in formulat-
ing both spending and investment policies.
The Board of Trustees has adopted a guideline for
the annual spending rate from the University’s
Long-Term Balanced Pool. The calculation blends
market and spending elements for the total annual
spending rate.
The market element is an amount equal to
4.35 percent of the market value of a unit in the pool,
averaged for the 12 months ended October 31 of the
prior fiscal year. It is weighted at 30 percent in deter-
mining the total. The spending element is an amount
equal to the current fiscal year’s spending amount
increased by 1.5 percent plus the actual rate of infla-
tion. It is weighted at 70 percent in determining
the total.
If investment income received is not sufficient
to support the total-return objective, the balance is
provided from realized and unrealized gains. If the
income received is in excess of the objective, the bal-
ance is reinvested in the Long-Term Balanced Pool on
behalf of the unit holders.
The University’s policy is to allocate the current
income of all other investment pools.

31
Changes in Endowment Net AssetsThe following tables represent the changes in endowment net assets for the years ended August 31, 2016,
and 2015:
(in thousands of dollars) August 31, 2016
Unrestricted Temporarily restricted
Permanently restricted Total
Endowment net assets, beginning of year $3,911,697 $2,333,376 $1,342,956 $7,588,029
Net investment loss (4,824) (7,189) (12,013)
Net appreciation, realized and unrealized 32,527 54,829 87,356
Total investment return 27,703 47,640 — 75,343
Contributions 285 63,747 64,032
Appropriation of endowment assets for expenditure (158,125) (151,234) — (309,359)
Other changes
Transfers to create institutional funds 139,902 — — 139,902
Transfers of institutional funds per donor requirement 173 6,425 6,598
Spending of institution-designated endowment fund
(86,378) — — (86,378)
Other reclassifications (3,168) 5,166 (1,998) —
Endowment net assets, end of year $3,831,631 $2,235,406 $1,411,130 $7,478,167
(in thousands of dollars) August 31, 2015
Unrestricted Temporarily restricted
Permanently restricted Total
Endowment net assets, beginning of year $3,925,634 $2,397,857 $1,177,625 $7,501,116
Net investment loss (6,706) (6,687) (13,393)
Net appreciation, realized and unrealized 85,039 85,664 170,703
Total investment return 78,333 78,977 — 157,310
Contributions 831 153,777 154,608
Appropriation of endowment assets for expenditure (147,932) (139,562) — (287,494)
Other changes
Transfers to create institutional funds 106,937 — — 106,937
Transfers of institutional funds per donor requirement (66) 7,720 7,654
Spending of institution-designated endowment fund
(52,102) — — (52,102)
Other reclassifications 827 (4,661) 3,834 —
Endowment net assets, end of year $3,911,697 $2,333,376 $1,342,956 $7,588,029
Underwater Endowment FundsThe University monitors endowment funds to identify
those for which historical cost was more than fair
value. As of August 31, 2016, and 2015, the historical
cost of such accounts was approximately $196 mil-
lion and $39.6 million, and the market value totaled
$193 million and $39.1 million, respectively. Associated
unrealized losses are recorded in the unrestricted net
assets classification; subsequent gains increase unre-
stricted net assets.

32
10. Retirement PlansThe University maintains two contributory retirement
plans for its eligible faculty and staff. The plans offer
employees two investment company options, Teachers
Insurance and Annuity Association (TIAA) and College
Retirement Equities Fund (CREF), and the mutual
funds offered by Fidelity Investments. Participating
employee and University contributions are immedi-
ately vested. The University contributed $71.1 million
and $66.9 million to the two plans in 2016 and 2015,
respectively. It expects to contribute $75.3 million to
the two plans in 2017.
The University currently sponsors a healthcare
plan permitting retirees to continue participation on
a “pay-all” basis; it has no liability for participants
past age 65. The retiree contribution is based on the
average per-capita cost of coverage for the plan’s
entire group of active employees and retirees rather
than the per-capita cost for retirees only. Retirees
are also eligible to participate in certain tuition
reimbursement plans and may receive a payment for
sick days accumulated at retirement. The accrued cost
for post employment benefits was $11.3 million and
$13 million at August 31, 2016, and 2015, respectively,
and is included in accounts payable and accrued
expenses on the consolidated statements of financial
position.
The University recognizes an asset or a liability in
the consolidated statements of financial position for
the plans’ overfunded or underfunded status. The
asset or liability is the difference between the fair
value of plan assets and the related benefit obligation,
defined as the projected benefit obligation for post-
employment benefit programs and the accumulated
postretirement benefit obligation (APBO) for post-
retirement benefit programs, such as a retiree health-
care plan. In the consolidated statement of activities,
the University recognizes actuarial gains or losses
and prior service costs or credits that arise during the
period but are not components of net periodic benefit
cost. The University measures plan assets and obliga-
tions as of the date of its fiscal year-end and makes
specified disclosures for the upcoming fiscal year.
The University funds the benefit costs as they are incurred. The following table sets forth the plan’s obligations,
benefits paid, contributions, net periodic postretirement benefit cost, and assets:
(in thousands of dollars) August 31, 2016 August 31, 2015
Benefit obligations $14,273 $12,567
Benefits paid 930 1,219
Employer contributions 334 654
Contributions from participants 596 565
Net periodic postretirement benefit cost 857 1,702
Fair value of plan assets — —
The accumulated other comprehensive income
included in unrestricted net assets on the consoli-
dated statements of financial position totaled net
gains of $1.6 million and $2.8 million as of August 31,
2016, and 2015, respectively; a decrease of $1.2 million
due to net losses during the fiscal year.
The APBO was $14.3 million and $12.6 million at
August 31, 2016, and 2015, respectively, and is included
in accounts payable and accrued expenses on the con-
solidated statements of financial position.
The following tables present key actuarial assump-
tions used in determining APBO as of August 31, 2016,
and 2015. For both fiscal years 2016 and 2015, the
ultimate healthcare cost trend rate was 5 percent, and
the year when the trend rate will reach the ultimate
trend rate was 2023.

33
Additional assumptions used to determine benefit obligations were as follows:
August 31, 2016 August 31, 2015
Settlement (discount) rate 3% 3.9%
Weighted average rate of increase in future compensation levels 3% 3%
Healthcare cost trend rate 6.75% 7%
Next, the assumptions used to determine net periodic benefit cost:
August 31, 2016 August 31, 2015
Discount rate 3.9% 3.6%
Weighted average rate of increase in future compensation levels 3% 3%
Healthcare cost trend rate 7% 7.25%
A one-percentage-point change in assumed healthcare cost trend rates would have had these effects in fiscal
year 2016:
(in thousands of dollars) 1% point decrease 1% point increase
(Decrease) increase in total of service and interest cost ($64) $73
(Decrease) increase in postretirement benefit obligation (523) 589
Estimated future benefit payments reflecting antici-
pated service, as appropriate, are expected to be paid
as shown below:
(in thousands of dollars)
2017 $677
2018 553
2019 610
2020 720
2021 795
2022–26 4,790
Total $8,145
The University offers a deferred compensation
plan under Internal Revenue Code 457(b) to a select
group of management and highly compensated
employees. There is no University contribution related
to this deferred compensation plan. The University has
recorded both an asset and a liability related to the
deferred compensation plan that totaled $64.6 million
and $56.4 million in fiscal years 2016 and 2015, respec-
tively; these are included in investments and deposits
payable and actuarial liability of annuities payable on
the consolidated statements of financial position.

34
11. Related PartiesMembers of the University’s Board of Trustees, senior
management, and faculty may on occasion be associ-
ated either directly or indirectly with entities doing
business with the University. The University bylaws
and conflict of interest policies establish guidelines
for disclosure and regulation of such activities as
circumstances warrant. When such associations
exist, measures are taken, in the best interests of the
University, to mitigate any actual or perceived conflict.
Transactions with related parties may include invest-
ment management, common membership in invest-
ment partnerships or other investment vehicles, and
the purchase of goods or services.
Northwestern Medical Group (NMG) is a not-for-
profit, multispecialty physician organization com-
mitted to providing clinical care to patients and to
supporting the research and academic endeavors
of Northwestern’s Feinberg School of Medicine
(Feinberg). NMG is governed by a board of directors,
and its physicians are full-time faculty members
or researchers at Feinberg. It is a wholly owned
subsidiary of Northwestern Memorial Healthcare
Corporation (NMHC), the not-for-profit parent cor-
poration of Northwestern Memorial Hospital (NMH),
which is the primary teaching hospital of Feinberg.
As such, NMHC and NMG are related parties of the
University. Under terms of agreements effective in
fiscal year 2014 between the University, NMG, and
NMHC, the University receives recurring contribu-
tions from NMHC to support the Feinberg research
and education programs, basic and applied biomedi-
cal research facilities and programs, and research and
educational support services.
As of August 31, 2016, accounts receivable aris-
ing from operational activities with NMHC totaled
$18.5 million and are included in accounts receivable
on the consolidated statements of financial position.
For the year ended August 31, 2016, contributions
totaling $133.8 million have been made from NMHC to
the University and are included in private gifts on the
consolidated statement of activities.
As of August 31, 2015, accounts receivable aris-
ing from operational activities with NMHC totaled
$7.6 million and are included in accounts receivable
on the consolidated statements of financial posi-
tion. Through August 31, 2015, contributions totaled
$137.5 million from NMHC to the University; these are
included in private gifts on the consolidated state-
ment of activities.
12. Self-Insurance Reserves and Other ContingenciesReserves for losses under the University’s self-
insurance program, aggregating $7.3 million and
$5.8 million at August 31, 2016, and 2015, respectively,
include reserves for probable known losses and for
losses incurred but not yet reported. A portion of the
reserves pertaining to professional, general, and auto-
mobile liability has been determined on a discounted
present-value basis. The discount rate was 7.5 percent
in fiscal years 2016 and 2015. Self-insurance reserves
are based on estimates of historical loss experience,
and while management believes that the reserves
are adequate, the ultimate liabilities may be more or
less than the amounts provided. These reserves are
included in accounts payable and accrued expenses on
the consolidated statements of financial position.
Under an agreement in effect through fiscal year
2013 between the University and NMG, a proportion-
ate share of primary medical professional liability
costs that arise out of events prior to November 1,
2004, was borne by NMG. As a part of the clinical
integration agreement between NMG, NMHC, and the
University, signed September 1, 2013, any remaining
liabilities related to the period prior to November 1,
2004, are the obligations of the University and
included in the reserves, beginning in fiscal year 2014,
for losses noted above.
In August 2009, the University, as originating
lender, began participation in a student loan secu-
ritization program. It sold student loans to a school
trust totaling $65 million in 2009, $19.8 million in
2010, and $22.5 million in 2012; the University issued

35
University-guaranteed notes, which were purchased
by a funding trust that procures financing to support
the lending program. The programs are managed to
break even and generate no servicing assets or liabili-
ties. Guaranteed notes under these programs totaled
$29.3 million and $39.3 million as of August 31, 2016,
and 2015, respectively. These loans are included in
notes receivable and deposits payable on the con-
solidated statements of financial position. Reserves
in anticipation of securitized student loan future
defaults totaled $100,000 and $122,000 at August 31,
2016, and 2015, respectively. Notes receivable on
the consolidated statements of financial position
are shown net of these reserves in fiscal years 2016
and 2015.
In October 2013, the University purchased a
$61 million portfolio of private education loans from
a lending agency; these loans were previously pur-
chased by the lending agency from the University
prior to 2009 and were serviced by the University.
As of August 31, 2016, and 2015, respectively, these
loans totaled $30.6 million and $41.6 million, and
are included in notes receivable on the consolidated
statements of financial position. The University con-
tinues to service the repurchased loans. At August 31,
2016, and 2015, $104,000 and $129,000, respectively,
were reserved in anticipation of future defaults. Notes
receivable on the consolidated statements of financial
position are shown net of these reserves in fiscal years
2016 and 2015.
From time to time, various claims and suits gener-
ally incidental to the conduct of normal business are
pending or may arise against the University. It is the
opinion of management of the University, after taking
into account insurance coverage, that any losses from
the resolution of pending litigation should not have a
material effect on the University’s financial position
or results of operations.
All funds expended in connection with government
grants and contracts are subject to audit by govern-
ment agencies. While any ultimate liability from
audits of government grants and contracts by govern-
ment agencies cannot be determined at present, man-
agement believes that it should not have a material
effect on the University’s financial position or results
of operations.
13. Grants and ContractsGrants and contracts are summarized on the consolidated statement of activities as follows:
(in thousands of dollars) August 31, 2016 August 31, 2015
Federal grants $444,304 $408,533
Private grants and contracts 147,960 154,017
State grants 3,510 3,039
Total grants and contracts $595,774 $565,589

36
14. Functional Classification of Expenses
Expenses by functional categories reflect salaries,
wages, benefits, goods, and services used for those
specific purposes. The University has allocated func-
tional expenses for maintenance of facilities, as well
as for depreciation, accretion for asset retirement
obligations, and interest on indebtedness, to other
functional categories based on the functional use of
space on the University’s campuses.
Operating expenses incurred in the fiscal years
ended August 31, 2016, and 2015, were as follows:
(in thousands of dollars) August 31, 2016
Maintenance of facilities
Depreciation and accretion
Interest on indebtedness
All other operating expenses Total
Instruction $26,936 $18,154 $5,930 $771,599 $822,619
Research 48,148 32,452 10,599 371,850 463,049
Academic support 34,682 23,375 7,635 217,736 283,428
Student services 21,728 14,645 4,783 157,574 198,730
Institutional support 9,628 6,489 2,120 272,242 290,479
Auxiliary services 41,707 28,110 9,181 28,851 107,849
Total $182,829 $123,225 $40,248 $1,819,852 $2,166,154
(in thousands of dollars) August 31, 2015
Maintenance of facilities
Depreciation and accretion
Interest on indebtedness
All other operating expenses Total
Instruction $24,956 $17,530 $5,518 $714,441 $762,445
Research 42,981 30,193 9,505 347,691 430,370
Academic support 33,348 23,426 7,375 214,213 278,362
Student services 21,587 15,164 4,774 150,399 191,924
Institutional support 6,804 4,780 1,505 255,326 268,415
Auxiliary services 38,063 26,738 8,417 28,599 101,817
Total $167,739 $117,831 $37,094 $1,710,669 $2,033,333

Administration and Trustees
Northwestern University is an equal opportunity, affirmative action educator and employer. © 2017 Northwestern University. All rights reserved. Produced by Global Marketing and Communications. 2-17/320/RM-VL/2360
Morton Schapiro, PhD
President
Daniel I. Linzer, PhD
Provost
Nim Chinniah, MBA
Executive Vice President
Mary L. Baglivo, MS
Vice President for Global
Marketing and Chief
Marketing Officer
Alan K. Cubbage, JD
Vice President for
University Relations
Philip L. Harris, JD
Vice President and
General Counsel
Marilyn McCoy, MPP
Vice President for
Administration and
Planning
William H. McLean, MBA
Vice President and
Chief Investment Officer
Robert McQuinn, MBA
Vice President for
Alumni Relations and
Development
Eric G. Neilson, MD
Vice President for
Medical Affairs
James J. Phillips, PhD
Vice President for
Athletics and Recreation
Sean Reynolds, MA
Vice President for
Information Technology
and Chief Information
Officer
Patricia Telles-Irvin, EdD
Vice President for
Student Affairs
Joseph T. Walsh Jr., PhD
Vice President for
Research
Financial Leadership Team
Pamela S. Beemer
Vice President for
Human Resources
John L. D’Angelo
Vice President for
Facilities Management
James M. Hurley
Vice President for Budget
and Planning
Ingrid S. Stafford
Vice President for
Financial Operations
and Treasurer
Marcia Isaacson
Associate Vice President
for Compliance and
Chief Compliance Officer
Michael Szczepanek
Associate Vice President
for Finance
Luke Figora
Assistant Vice President
for Risk Management and
Environmental Health
and Safety
Nicole Van Laan
Controller
Michael S. Daniels
Senior Associate
Controller and Executive
Director of Research
Financial Operations
Nancy L. Pinchar
Associate Controller and
Director of Accounting
Services
2016–17 Board of Trustees
Mark A. Angelson
Peter J. Barris
Carol L. Bernick
Christine E. Brennan
Steven A. Cahillane
Christopher B. Combe
Edith Watkins Cooper
A. Steven Crown
Richard H. Dean
Deborah L. DeHaas
James A. DeNaut
Charles W. Douglas
Michael W. Ferro Jr.
D. Cameron Findlay
Dennis J. FitzSimons
T. Bondurant French
Christopher B. Galvin
H. Patrick Hackett Jr.
Dean M. Harrison
(ex officio)
Jay C. Hoag
Jane S. Hoffman
Edward C. Hutcheson Jr.
David G. Kabiller
Nancy Trienens Kaehler
Adam R. Karr
Ellen Philips Katz
Melih Z. Keyman
Harreld N. Kirkpatrick III
Lester B. Knight
Timothy K. Krauskopf
Ellen Kullman
Bill Lambert
Mark A. Ledogar
(ex officio)
Ivy Beth Lewis
J. Landis Martin
Samir Mayekar
(ex officio)
W. James McNerney Jr.
Wendy M. Nelson
Pin Ni
Phebe N. Novakovic
William A. Osborn (chair)
Jane DiRenzo Pigott
Brian S. Posner
Paula Pretlow
J. B. Pritzker
Kimberly Querrey
Michael A. Reinsdorf
M. Jude Reyes
Virginia M. Rometty
Patrick G. Ryan Jr.
David A. Sachs
Michael J. Sacks
E. Scott Santi
Muneer A. Satter
Andrew E. Senyei
Michael S. Shannon
Gwynne E. Shotwell
Benjamin W. Slivka
Timothy P. Sullivan
Charles A. Tribbett III
Jeffrey W. Ubben
Julia A. Uihlein
Frederick H. Waddell
Mark R. Walter
Sona Wang
David B. Weinberg
Miles D. White
Michael R. Wilbon
Stephen R. Wilson
W. Rockwell Wirtz
Life Trustees
William F. Aldinger
Lee Phillip Bell
Judith S. Block
Neil G. Bluhm
Deborah H. Brady
Duane L. Burnham
John A. Canning Jr.
Nicholas D. Chabraja
Dennis H. Chookaszian
Donald C. Clark
George A. Cohon
Franklin A. Cole
Philip M. Condit
John W. Croghan
Lester Crown
Bonnie S. Daniels
John M. Eggemeyer
Raymond F. Farley
W. James Farrell
Barbara Gaines
James L. Garard Jr.
Lavern N. Gaynor
Eric J. Gleacher
J. Douglas Gray
Herbert W. Gullquist
J. Ira Harris
Thomas Z. Hayward Jr.
George E. Johnson
Daniel S. Jones
James R. Kackley
Jerome P. Kenney
James L. Ketelsen
William S. Kirsch
Martin J. Koldyke
Harry M. Kraemer Jr.
Duane R. Kullberg
Alan M. Leventhal
Lawrence F. Levy
Edward M. Liddy
John Jeffry Louis
Ann Lurie
Robert A. Lurie
Martha Grimes Mabie
John W. Madigan
R. Eden Martin
Arthur C. Martinez
James R. McManus
Newton N. Minow
Lee M. Mitchell
Leo F. Mullin
Robin Chemers Neustein
James J. O’Connor
Dale Park Jr.
Harry J. Pearce
Jerry K. Pearlman
Jerry M. Reinsdorf
John W. Rowe
Patrick G. Ryan
Paul Sagan
William E. Sagan
Robert P. Saltzman
James P. Schadt
Charles E. Schroeder
D. Gideon Searle
Gordon I. Segal
Louis A. Simpson
Harold B. Smith
William D. Smithburg
Judith A. Sprieser
Thomas C. Theobald
Richard L. Thomas
Howard J. Trienens
Betty A. Van Gorkom
John R. Walter
Lawrence A. Weinbach
Judd A. Weinberg
William J. White
Stephen M. Wolf