Embed Size (px)
Citation preview

2016 RETAIL FUELS REPORT

NACS RETAIL FUELS REPORTThe NACS Retail Fuels Report, now in its 15th year, explains market conditions that affect gas prices—and what to watch for in 2016.
INTRODUCTION 2
WHO SELLS AMERICA’S FUEL? 3Convenience stores sell 80% of the gasoline in the United States—most are one-store businesses.
THE PRICE PER GALLON 6Retail fuels prices are ultimately determined by four sets of costs: crude oil, taxes, refining costs, and distribution and marketing.
WHY GAS PRICES GO UP IN THE SPRING 8Summer-blend fuels, infrastructure maintenance and an increase in seasonal demand all create challenges that can affect retail fuels prices.
PLASTIC AT THE PUMP 11The use of credit and debit cards is incredibly convenient. But that convenience comes at a cost.
GRAPHICS Convenience Store Census 13
Are You Average? 14
The Fueling Industry at a Glance 15
Gasoline Taxes by State 16
2016 NACS Retail Fuels Report | 1
About NACS NACS was founded August 14, 1961, as the National Association of Convenience Stores. The U.S. convenience store industry, with more than 154,000 stores across the country, posted $696 billion in total sales in 2014, of which $483 billion were motor fuels sales. NACS has 2,100 retail and 1,700 supplier member companies, which do business in nearly 50 countries.
NACS serves the convenience and fuel retailing industry by providing industry knowledge, connections and advocacy to ensure the competitive viability of its members’ businesses. The association serves as the industry’s voice in the federal government and its issues are as varied as the industry it represents, from swipe fees to motor fuels.
For more information, visit www.nacsonline.com.
2 | 2016 NACS Retail Fuels Report
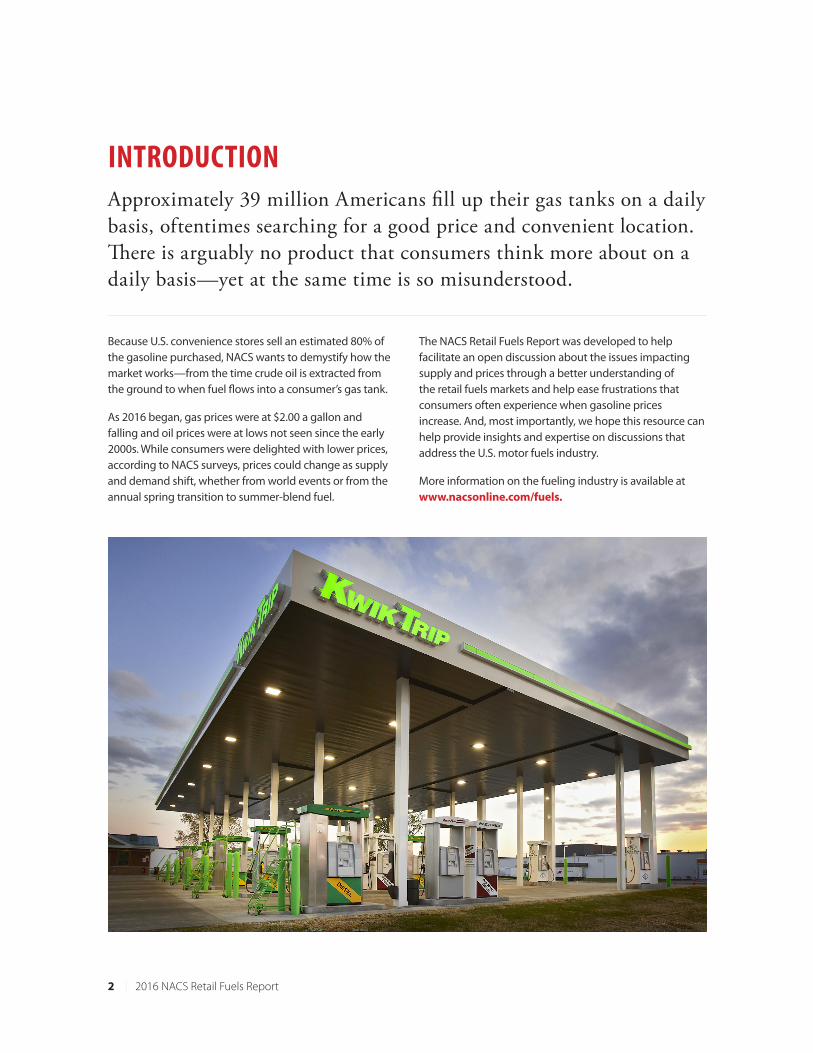
INTRODUCTIONApproximately 39 million Americans fill up their gas tanks on a daily basis, oftentimes searching for a good price and convenient location. There is arguably no product that consumers think more about on a daily basis—yet at the same time is so misunderstood.
Because U.S. convenience stores sell an estimated 80% of the gasoline purchased, NACS wants to demystify how the market works—from the time crude oil is extracted from the ground to when fuel flows into a consumer’s gas tank.
As 2016 began, gas prices were at $2.00 a gallon and falling and oil prices were at lows not seen since the early 2000s. While consumers were delighted with lower prices, according to NACS surveys, prices could change as supply and demand shift, whether from world events or from the annual spring transition to summer-blend fuel.
The NACS Retail Fuels Report was developed to help facilitate an open discussion about the issues impacting supply and prices through a better understanding of the retail fuels markets and help ease frustrations that consumers often experience when gasoline prices increase. And, most importantly, we hope this resource can help provide insights and expertise on discussions that address the U.S. motor fuels industry.
More information on the fueling industry is available at www.nacsonline.com/fuels.

Single-store operators account for 59% of all convenience stores selling fuel.
WHO SELLS AMERICA’S FUEL?There are more than a 154,000 convenience stores in the United States, and more than 124,000 of these retail outlets sell motor fuels. In fact, U.S. convenience stores sell 80% of the gasoline purchased by Americans who fuel up their vehicles about four to five times each month.
But who owns these retail fueling locations? The answer is that it’s highly unlikely the owner is an oil company, and it’s very likely the store is being run by an independent operator with ties to the community.
Overall, the convenience retailing industry is dominated by single-store operators, which account for 59% of all convenience stores selling fuel (73,433 stores total). While major oil companies have essentially exited the retail fuels business, it often looks like they dominate the retail landscape. Many single-store operators may not have the resources to brand their stores separately from the companies they sell and promote on their canopies, often leading to consumer misperceptions that they are businesses owned and operated by a major oil company.
(Source: NACS/Nielsen 2016 Convenience Industry Store Count)
How Fuel Retailers Operate Major oil companies have essentially exited the retail fuels business, but it often looks like they dominate the retail landscape. About half of the fueling stations in the United States sell a brand of fuel from one of the 15 major refiners/suppliers, which often makes the signage touting a particular fuel brand seem like an oil company owns the store.
The contractual relationship for fuels is much like that inside the store, where beverage companies often help provide branded fountain dispensers that dispense a branded soft drink. Both the oil company and the beverage company help the retailer sell product, but that doesn’t mean they own the store.
Major oil companies shed their retail portfolios to better utilize their assets in upstream production (oil refining and/or oil production). But there is obvious value to having a company name displayed in front of millions of consumers every day, which is why the major oil companies continue to brand stations they don’t own or operate. Another reason is that branded relationships provide oil companies a guaranteed customer for their product, and at predictable volumes.
OWNERSHIP OF U.S. CONVENIENCE STORES SELLING FUEL
1 Store
51–200 Stores
201–500 Stores
500+ Stores
11–50 Stores
2–10 Stores59%
4.3%
8.9%
5.5%
5.6%
16.7%
2016 NACS Retail Fuels Report | 3

The Benefits of Being Branded For retailers, being branded means consumer recognition. More than half of all convenience stores selling fuels (59%) are single-store operations, so having a branded contract with a major refiner/supplier instantly provides a retailer with a familiar brand for their top product: motor fuels.
While the price of gasoline is the No. 1 consideration for most consumers on where they decide to purchase gasoline, one out of 11 motorists said that the brand of fuel determines where they purchase gasoline. A branded contract guarantees fuel supply, especially when supplies are tight. Supply guarantees can smooth out extreme price volatility seen in the wholesale gas markets.
There also are non-fuel benefits to branding. Operators can take advantage of the oil company’s knowledge in retail best practices for attracting customers and employee training tools. Retailers can also receive financial support such as an imaging allowance (loan) to improve the look of the store.
The Benefits of Being Unbranded Other retails prefer to be unbranded. At unbranded stations, the fuel brand is usually the same as the store name. While this fuel doesn’t have a proprietary additive package, it does have a general additive package that meets all federal and local fuels requirements. Stores typically seek to be unbranded if they feel that their store name is strong enough to convey trust in their product.
In most instances, unbranded gasoline has lower wholesale prices because there are not the added benefits of branded fuel, whether that includes marketing support, the additive package or market intelligence. Unbranded retailers are able to find the best “deal” for wholesale product on the open market, regardless of brand. They may also enter into supply arrangements with a branded company to purchase fuel that is sold as unbranded.
If supplies are tight, unbranded retailers may have more trouble obtaining product, since oil companies first service their stores, their branded contracts and other contracts. When supply is limited, unbranded retailers must compete for what’s available, and wholesale prices are often much higher.
Contractual Terms for Branded Contracts While every contract differs, here is a broad overview of what is included in these contracts:
• Length: A typical contract is for 10 years, although contracts may be as long as 20 years or as short as 3 years for renewed contracts.
• Volume requirements: Contracts typically set forth a certain amount of fuel each month that retailers must sell. Usually retailers can sell more than the agreed-to amount, but when supply disruptions exist, they may be put on allocation and only given a percentage of what they historically receive in a given time period. This enables the supplier to more efficiently manage fuel distribution to all branded outlets in an equitable fashion.
• Image requirements: A branded retailer receives marketing muscle from its oil company partner, which may include broad advertising to encourage in-store sales. Also, the oil company may provide financial incentives to display its brands. This also depends on who operates the station and whether the store owner has access to capital. In exchange, the oil company expects the store to adhere to certain imaging requirements, including specific colors, logos and signage, standards of cleanliness and service. The oil company often relies on mystery-shopping programs to assess compliance.
• Wholesale price requirements: A branded retailer must purchase fuel from a branded supplier or distributor. Branded contracts benchmark the wholesale price to common fuels indexes, such as Platt’s, plus a premium of a few cents for brand/marketing support. Some branded contracts also stipulate the retail markup on the fuel through a “consignment agreement,” whereby the supplier or distributor retains ownership of the fuel until it is sold and pays the retailer a commission.
4 | 2016 NACS Retail Fuels Report

2016 NACS Retail Fuels Report | 5
Types of Branded Retailers There are different ownership structures within the branded station universe:
• Regional company or chain operated: A chain of convenience stores with a common name that operates the branded locations. In many cases, a chain may sell different brands at different stores, based on the needs of the marketplace and terms of contracts that may have been carried forward from stores that were acquired from other operators. Many operations of this kind serve as distributors to themselves and maintain supply agreements with the branded oil companies.
• Lessee dealers: The dealer/retailer owns the business. A major or regional oil company or a distributor owns the land and building and leases it to a dealer. The dealer operates the location and pays rent to the owner, as opposed to an open dealer who owns the property. This arrangement gives the oil company or distributor a guaranteed supply outlet for its petroleum products, pursuant to a supply contract. A typical lessee dealer may operate more than one facility and does not wholesale gasoline or sell to other dealers.
• Open dealer operated: The independent dealer purchases fuel from the oil company or a distributor, supplies fuel to the station, and possibly others, owns the business and owns or leases the building/facility independent from any supply agreement. The dealer may contract with a manager to run the business or run it himself.
• Company operated: A “salary operation” where a major or regional oil company or a distributor owns the building/facility and the business. The company pays a salary to the managers/proprietors and supplies fuel to the location. This is also known as company-operated and direct operated retail.

6 | 2016 NACS Retail Fuels Report
THE PRICE PER GALLONRetail gasoline prices are among the most recognizable price points in American commerce. And with good reason: Gasoline purchases account for approximately 4%–5% of consumer spending. The U.S. Energy Information Administration estimated that the average U.S. household spent about $2,000 for gasoline in 2015.
At the same time, gas prices are among the least understood prices in the country because they often appear to increase or decrease on a daily basis without much warning. Here is a primer on what goes into the price of a gallon of gasoline, and what causes prices to go up or down and vary from state to state and store to store.
There are four broad factors that can impact retail prices:
• Fuel Type: Typically, stores that sell fuel under the brand name of a refiner pay a premium for that fuel, which covers marketing support and signage, as well as the proprietary fuel’s additive package. These branded stores also tend to face less wholesale price volatility when there are supply disruptions.
• Delivery Method: Retailers who purchase fuels via “dealer tank wagon” have the fuel delivered directly to the station by the refiner. They may pay a higher price than those who receive their fuels at “the rack” or terminal. In addition, a retailer may contract with a jobber to deliver the fuel to his stations or operate his own trucks—the choice will influence his overall cost.
• Length of Contract: Even if they sell unbranded fuels, retailers may have long-term contracts with a specific refiner. The length of the contract and its associated terms can affect the price that retailers pay for fuels.
• Volume: Retailers may receive a better deal based on the amount of fuels that they purchase, whether based on volume per store or total number of stores.
Even within a specific company, stores may not each have the same arrangements, since companies often sell multiple brands of fuels, especially if they have acquired sites with existing supply contracts.
But no matter who owns the station, retail fuels prices are ultimately affected by four sets of costs:
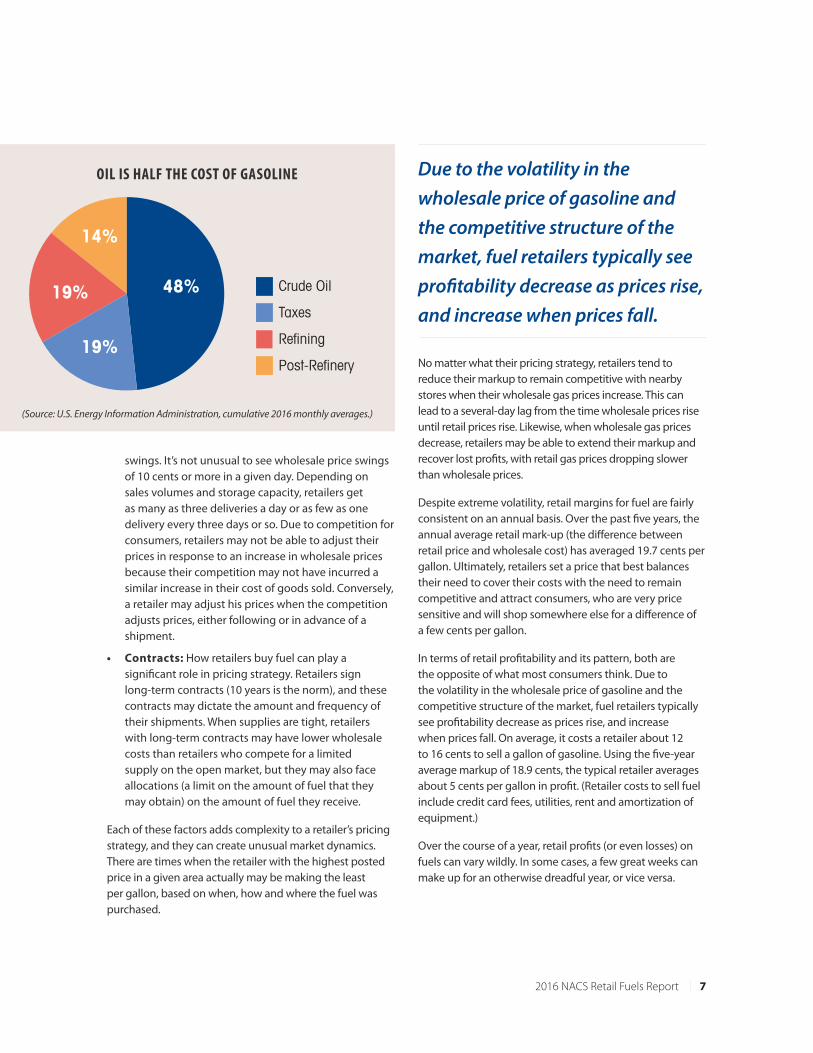
• Crude oil prices have by far the biggest effect on retail prices. Crude oil costs are responsible for about half of the cost of a gallon of gasoline. In 2015, crude oil costs were 48% of the retail price of gasoline. While there may be slight variations in the costs of refining or distributing and retailing fuels, crude oil prices can experience huge swings.
• Taxes are largely per gallon, although some areas have sales taxes on fuels, and those taxes increase as the price increases. There sometimes are significant disparities between stations located in the same market area but in different cities, counties or states. (See map of state tax rates on page 13.)
• Refining costs include the labor, materials, energy and other costs necessary for refining crude oil into gasoline, as well as the profits to refinery owners.
• Distribution and marketing costs are the price component that includes distributing and marketing gasoline from refiners to wholesale marketers and/or retail marketers, and the profits made by the wholesale and retail marketers.
Sales strategies can also impact gas prices. Fuel retailers face the same question that all retailers face: sell at a low profit per unit and make up for it on volume, or sell at a higher profit per unit and expect less volume? But there also are several considerations in setting fuel prices that retailers of other products don’t face:
• Wholesale Price Changes: Competing retailers in a given area may have very different wholesale prices based on when they purchased their fuel, especially during times of extreme price volatility. Gasoline is a commodity, and its wholesale price can have wild
2016 NACS Retail Fuels Report | 7
• swings. It’s not unusual to see wholesale price swings of 10 cents or more in a given day. Depending on sales volumes and storage capacity, retailers get as many as three deliveries a day or as few as one delivery every three days or so. Due to competition for consumers, retailers may not be able to adjust their prices in response to an increase in wholesale prices because their competition may not have incurred a similar increase in their cost of goods sold. Conversely, a retailer may adjust his prices when the competition adjusts prices, either following or in advance of a shipment.
• Contracts: How retailers buy fuel can play a significant role in pricing strategy. Retailers sign long-term contracts (10 years is the norm), and these contracts may dictate the amount and frequency of their shipments. When supplies are tight, retailers with long-term contracts may have lower wholesale costs than retailers who compete for a limited supply on the open market, but they may also face allocations (a limit on the amount of fuel that they may obtain) on the amount of fuel they receive.
Each of these factors adds complexity to a retailer’s pricing strategy, and they can create unusual market dynamics. There are times when the retailer with the highest posted price in a given area actually may be making the least per gallon, based on when, how and where the fuel was purchased.
No matter what their pricing strategy, retailers tend to reduce their markup to remain competitive with nearby stores when their wholesale gas prices increase. This can lead to a several-day lag from the time wholesale prices rise until retail prices rise. Likewise, when wholesale gas prices decrease, retailers may be able to extend their markup and recover lost profits, with retail gas prices dropping slower than wholesale prices.
Despite extreme volatility, retail margins for fuel are fairly consistent on an annual basis. Over the past five years, the annual average retail mark-up (the difference between retail price and wholesale cost) has averaged 19.7 cents per gallon. Ultimately, retailers set a price that best balances their need to cover their costs with the need to remain competitive and attract consumers, who are very price sensitive and will shop somewhere else for a difference of a few cents per gallon.
In terms of retail profitability and its pattern, both are the opposite of what most consumers think. Due to the volatility in the wholesale price of gasoline and the competitive structure of the market, fuel retailers typically see profitability decrease as prices rise, and increase when prices fall. On average, it costs a retailer about 12 to 16 cents to sell a gallon of gasoline. Using the five-year average markup of 18.9 cents, the typical retailer averages about 5 cents per gallon in profit. (Retailer costs to sell fuel include credit card fees, utilities, rent and amortization of equipment.)
Over the course of a year, retail profits (or even losses) on fuels can vary wildly. In some cases, a few great weeks can make up for an otherwise dreadful year, or vice versa.
Due to the volatility in the wholesale price of gasoline and the competitive structure of the market, fuel retailers typically see profitability decrease as prices rise, and increase when prices fall.
Post-Refinery
Refining
Taxes
Crude Oil48%
19%
19%
14%
OIL IS HALF THE COST OF GASOLINE
(Source: U.S. Energy Information Administration, cumulative 2016 monthly averages.)

8 | 2016 NACS Retail Fuels Report
Year Date Price Peak Date Price Increase % increase
2015 February 2 $2.068 June 15 $2.835 76.7¢ 37.1
2014 February 3 $3.292 April 28 $3.713 42.1¢ 12.8
2013 February 4 $3.538 Feb. 25 $3.784 24.6¢ 7.0
2012 February 6 $3.482 April 2 $3.941 45.9¢ 13.2
2011 February 7 $3.132 May 9 $3.965 83.3¢ 26.6
2010 February 1 $2.661 May 10 $2.905 24.4¢ 9.2
2009 February 2 $1.892 June 22 $2.691 79.9¢ 42.2
2008 February 4 $2.978 July 21 $4.104 $1.126 37.8
2007 February 5 $2.191 May 21 $3.218 $1.027 46.9
2006 February 6 $2.342 May 15 $2.947 60.5¢ 25.8
2005 February 7 $1.909 April 11 $2.280 37.1¢ 19.4
2004 February 2 $1.616 May 24 $2.064 44.8¢ 27.7
2003 February 3 $1.527 March 17 $1.728 20.1¢ 13.2
2002 February 4 $1.116 April 8 $1.413 29.7¢ 26.6
2001 February 5 $1.443 May 14 $1.713 27.0¢ 18.7
2000 February 7 $1.325 June 19 $1.681 35.6¢ 26.9
(Source: U.S. Energy Information Administration)
WHY GAS PRICES GO UP IN THE SPRINGHistorically, by springtime U.S. gas prices begin to increase and generally peak around Memorial Day. Most consumers assume that prices peak at this point because of the advent of the summer-drive season. But is that the case?
To a certain extent, seasonal demand is a factor. But there are other events that, with demand, collectively have a greater effect on prices each spring, leading to price peaks right before Memorial Day. In six of the past 16 years (38% of the time), the seasonal peak took place between May 9 and May 24.
Crude oil prices drive gas prices, but how the crude oil is processed also plays a significant role in price increases. The petroleum industry’s switchover to summer-blend fuels, a process that begins each February and ends June 1, creates challenges that also affect retail fuels prices. Since final implementation of the Clean Air Act Amendments in 2000, the seasonal transition to summer-blend fuel has
helped gasoline prices climb significantly before they reach their peak. Comparing prices the first week in February to their seasonal peak, increases have ranged from a low of 20 cents per gallon in 2003 to a high of $1.13 per gallon in 2008; on average, the annual increase is 53 cents per gallon.
Refinery maintenance is also a factor because maintenance schedules are based on gasoline demand. Demand for gasoline in the United States is generally the lowest during the first two months of the year, so refinery maintenance, known as a “turnaround,” is often scheduled during the first quarter. Another reason for scheduling turnarounds during this period is that it falls between peak heating oil

2016 NACS Retail Fuels Report | 9
season and peak summer drive season, allowing refineries to retool for summer-blend fuels.
After first-quarter maintenance, refineries switch to summer-blend production in April. The U.S. Environmental Protection Agency (EPA) defines April to June as the “transition season” for fuel production. Refineries lead this transition and switch over to summer-blend production in March and April.
There are also more fuels to produce during the transition season. In the winter months, only a few fuels are used across the United States. However, because of various state or regional requirements, 14 different fuel specifications are required for the summer months. Refineries must produce enough for each area to ensure that there are no supply shortages.
In addition to added costs to produce the fuel, prices are also affected by increased demand, maintenance costs and capacity decreases.
The end point in a series of handoffs to prepare for summer-blend fuel is the date that retailers must sell the fuel. In most areas of the country that require summer-blend fuels, retailers have until June 1 to switch to summer-grade gas.
Some retailers must sell summer-blend fuels much earlier. In Northern California, retailers must sell summer-blend fuel on May 1, a month earlier than the rest of the country, and in Southern California, the deadline is two months earlier: April 1. One reason why California has a longer summer-blend period than other states is its longer period of high temperatures, particularly in the desert areas, which are located in the air district with the worst quality of air.
Other key deadlines put stress on the system. Nationwide, refiners must produce summer-blend fuel no later than April 1. (Obviously, deadlines are earlier for California’s fuels.) From refineries, fuels travel through pipelines at about 4 miles per hour, or 100 miles per day. Fuels refined on the Gulf Coast can take several weeks to reach storage terminals throughout the country, which is why the deadline to have summer-blend fuel at terminals and storage facilities is May 1—a month after the transition at the refineries.
The May 1 deadline for terminals is considered one of the biggest factors in seasonal price increases. Terminals have to fully purge their systems of winter-blend fuels and be near empty to make the transition and be in compliance. Those terminals out of compliance face stiff penalties, so most terminal operators would rather be out of inventory than out of compliance. This regulatory requirement leads to lower inventories at the terminal. Combined with increased demand, this puts upward pressure on prices.
Demand is often cited as the main reason for spring price increases. In 2015, U.S. demand for petroleum products averaged 19.4 million barrels/day, of which 9.2 million barrels/day were gasoline. But world demand for oil is around 94 million barrels/day, more than four times the total of U.S. demand and 10 times U.S. demand for gasoline alone. U.S. demand for gasoline has declined from its peak in 2007, but world demand for oil has increased, which elevates oil prices and subsequently drives gas prices. While demand has increased, supply has increased even faster the past two years and this oversupply of product has helped push oil and gas prices downward.
10 | 2016 NACS Retail Fuels Report
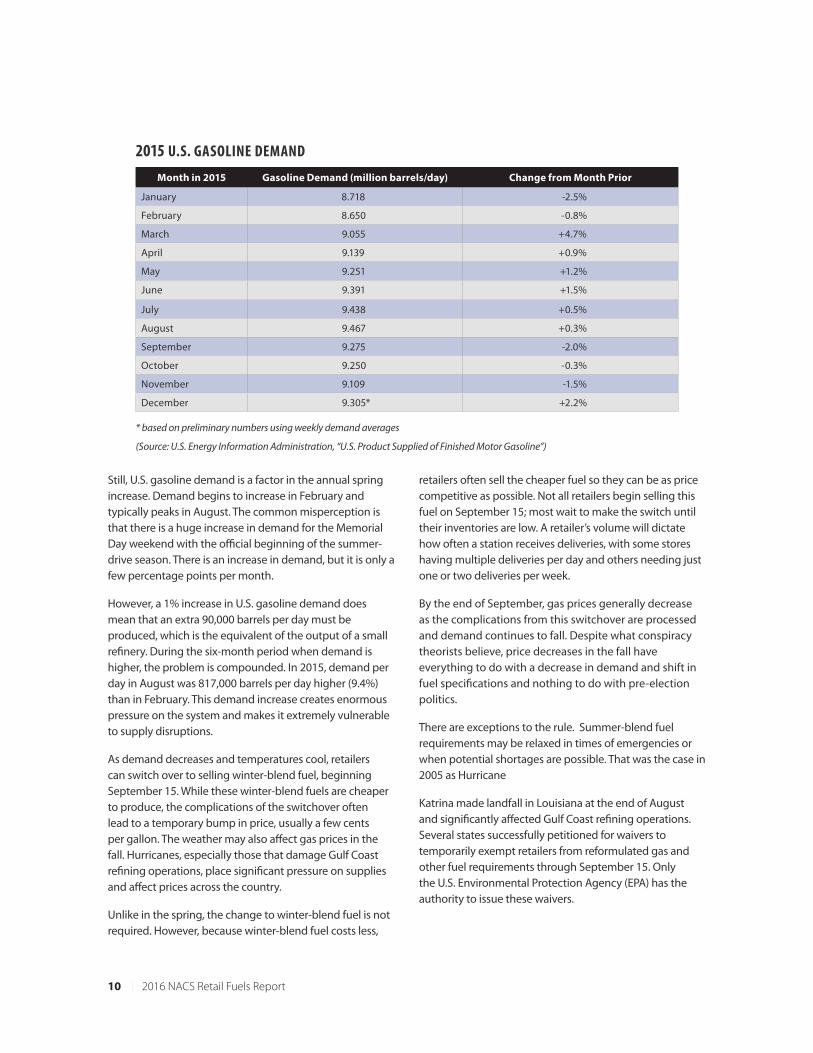
Still, U.S. gasoline demand is a factor in the annual spring increase. Demand begins to increase in February and typically peaks in August. The common misperception is that there is a huge increase in demand for the Memorial Day weekend with the official beginning of the summer-drive season. There is an increase in demand, but it is only a few percentage points per month.
However, a 1% increase in U.S. gasoline demand does mean that an extra 90,000 barrels per day must be produced, which is the equivalent of the output of a small refinery. During the six-month period when demand is higher, the problem is compounded. In 2015, demand per day in August was 817,000 barrels per day higher (9.4%) than in February. This demand increase creates enormous pressure on the system and makes it extremely vulnerable to supply disruptions.
As demand decreases and temperatures cool, retailers can switch over to selling winter-blend fuel, beginning September 15. While these winter-blend fuels are cheaper to produce, the complications of the switchover often lead to a temporary bump in price, usually a few cents per gallon. The weather may also affect gas prices in the fall. Hurricanes, especially those that damage Gulf Coast refining operations, place significant pressure on supplies and affect prices across the country.
Unlike in the spring, the change to winter-blend fuel is not required. However, because winter-blend fuel costs less,
retailers often sell the cheaper fuel so they can be as price competitive as possible. Not all retailers begin selling this fuel on September 15; most wait to make the switch until their inventories are low. A retailer’s volume will dictate how often a station receives deliveries, with some stores having multiple deliveries per day and others needing just one or two deliveries per week.
By the end of September, gas prices generally decrease as the complications from this switchover are processed and demand continues to fall. Despite what conspiracy theorists believe, price decreases in the fall have everything to do with a decrease in demand and shift in fuel specifications and nothing to do with pre-election politics.
There are exceptions to the rule. Summer-blend fuel requirements may be relaxed in times of emergencies or when potential shortages are possible. That was the case in 2005 as Hurricane
Katrina made landfall in Louisiana at the end of August and significantly affected Gulf Coast refining operations. Several states successfully petitioned for waivers to temporarily exempt retailers from reformulated gas and other fuel requirements through September 15. Only the U.S. Environmental Protection Agency (EPA) has the authority to issue these waivers.
2015 U.S. GASOLINE DEMAND
Month in 2015 Gasoline Demand (million barrels/day) Change from Month Prior
January 8.718 -2.5%
February 8.650 -0.8%
March 9.055 +4.7%
April 9.139 +0.9%
May 9.251 +1.2%
June 9.391 +1.5%
July 9.438 +0.5%
August 9.467 +0.3%
September 9.275 -2.0%
October 9.250 -0.3%
November 9.109 -1.5%
December 9.305* +2.2%
* based on preliminary numbers using weekly demand averages
(Source: U.S. Energy Information Administration, “U.S. Product Supplied of Finished Motor Gasoline”)
2016 NACS Retail Fuels Report | 11
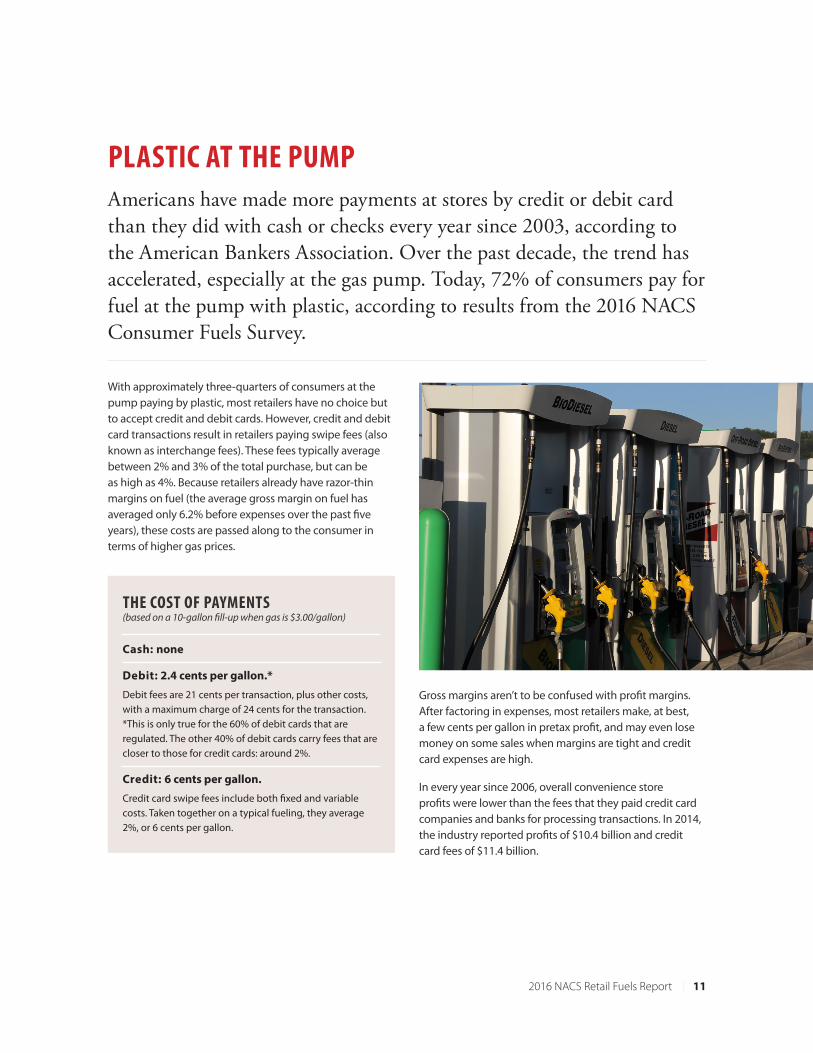
PLASTIC AT THE PUMPAmericans have made more payments at stores by credit or debit card than they did with cash or checks every year since 2003, according to the American Bankers Association. Over the past decade, the trend has accelerated, especially at the gas pump. Today, 72% of consumers pay for fuel at the pump with plastic, according to results from the 2016 NACS Consumer Fuels Survey.
With approximately three-quarters of consumers at the pump paying by plastic, most retailers have no choice but to accept credit and debit cards. However, credit and debit card transactions result in retailers paying swipe fees (also known as interchange fees). These fees typically average between 2% and 3% of the total purchase, but can be as high as 4%. Because retailers already have razor-thin margins on fuel (the average gross margin on fuel has averaged only 6.2% before expenses over the past five years), these costs are passed along to the consumer in terms of higher gas prices.
Gross margins aren’t to be confused with profit margins. After factoring in expenses, most retailers make, at best, a few cents per gallon in pretax profit, and may even lose money on some sales when margins are tight and credit card expenses are high.
In every year since 2006, overall convenience store profits were lower than the fees that they paid credit card companies and banks for processing transactions. In 2014, the industry reported profits of $10.4 billion and credit card fees of $11.4 billion.
THE COST OF PAYMENTS (based on a 10-gallon fill-up when gas is $3.00/gallon)
Cash: none
Debit: 2.4 cents per gallon.*
Debit fees are 21 cents per transaction, plus other costs, with a maximum charge of 24 cents for the transaction. *This is only true for the 60% of debit cards that are regulated. The other 40% of debit cards carry fees that are closer to those for credit cards: around 2%.
Credit: 6 cents per gallon.
Credit card swipe fees include both fixed and variable costs. Taken together on a typical fueling, they average 2%, or 6 cents per gallon.
12 | 2016 NACS Retail Fuels Report
Skimming Fuel dispensers can also be attractive targets for thieves looking to steal credit and debit card information by “skimming,” an aggressive tactic used to illegally obtain consumer card data for fraudulent purposes. Skimming can occur at the point of sale or when a card leaves someone’s sight for a brief period of time. Fuel dispensers are among the potential targets for skimming. In these cases, a third-party card-reading device is installed either outside or inside a fuel dispenser, which allows a thief to capture a customer’s credit and debit card information.
Every day, 39 million Americans fuel their vehicles and 28 million (72% of all fuel customers) pay for their fuel by debit or credit card. There is no reliable data on the number of skimming incidents but they are a small fraction of overall fill-ups. Most often, only one skimmer is installed at a site that may have from 8 to 24 fuel payment points. When a skimmer is installed, it captures an average of 30 to 100 cards per day. Even if a skimmer were undetected for two weeks, it would capture data on less than 1,500 cards.
There are three types of payment points most associated with skimming:
• Fuel dispensers: Convenience stores sell 80% of the gas purchased in the United States, and more than 124,000 convenience stores sell fuel. The U.S. con-venience store industry has 765,000 fuel dispensers (customers can fill up on each side of a dispenser) and approximately 1.45 million dispenser payment points.
• Restaurants and bars: An unscrupulous server can swipe a customer’s card in a skimmer in addition to swiping the card legally when taking payment. There are an estimated 600,000 restaurants in the United States.
• ATMs: Skimming devices can be attached to ATMs to gather card information. There are about 425,000 ATMs in the United States, with an estimated 150,000 at convenience stores. ATMs located outdoors and outside of a bank are potentially more vulnerable.
EMV Liability Shift EMV is a globally accepted card specification that uses an embedded microchip to provide dynamically unique data protection when the card is inserted into a chip-card reader. EMV is an acronym for Europay, MasterCard and Visa, and is a payment specification created by EMVCo (a special entity owned by Visa, MasterCard, American Express, Discover, JCB and UnionPay). After the October 2015 liability shift, U.S. card-accepting merchants without the ability to accept EMV cards may be liable for fraudulent transactions. A similar liability shift also occurs for fuel island payment terminals after October 2017.
To comply with EMV in the United States, convenience stores face added costs in upgrading their terminals and software to accept EMV transactions. EMV payments use a computer chip located on the front of the payment card to transmit data from the card to the card reader. The chip is intended to reduce fraud and theft of consumer data.
In October 2015, Jared Scheeler, a convenience store operator in North Dakota with four Hub convenience stores, testified before the U.S. House Small Business Committee that the transition to EMV at three existing stores, including making the point-of-sale operating systems and fuel dispensers EMV compatible, has cost him approximately $44,500 per store. At a fourth store, Scheeler purchased six new fuel dispensers at $17,000 each, in addition to an EMV compatible point of sale card reader at $2,000 for in-store purchases; the total upgrade at that store has cost him more than $100,000.
Across the entire convenience and fuel retailing industry, the average cost per store to become EMV compliant is about $30,000. With more than 154,000 convenience stores across the United States, the industry will pay more than $3.9 billion to move to EMV.
Unlike the rest of the world, in the United States, new EMV cards do not require the use of a PIN (personal identification number), which weakens the effectiveness of EMV and protecting consumers from fraud. A 2013 Federal Reserve study revealed that not using PIN carries 400% more fraud, which is why PIN use is the de facto standard for world payments.To comply with EMV in the United
States, convenience stores face added costs in upgrading their terminals and software to accept EMV transactions.

2016 NACS Retail Fuels Report | 13
U.S. CONVENIENCE STORE INDUSTRY
U.S. C-STORE COUNT BY REGION
As of December 31, 2015
1 32,761
2
37,645 3
23,495
4
24,498 5
13,363
6
22,433
Total
154,195
Convenience stores account for 34.2% of retail
outlets in the United States tracked by Nielsen.
Conveniencestores
(Source: Nielsen as of December 31, 2015)
154,195
Superettes/Supermarkets/Supercenters
51,055 Drugstores
41,969DollarStores
27,378
The NACS/Nielsen Convenience Store Census NACS denes a convenience store as a retail business that provides the public with a convenient location to quickly purchase a wide variety of consumable products and services, generally food and gasoline. While not a xed requirement, convenience stores have the following general characteristics:
1. Building size of fewer than 5,000 square feet.
2. Off-street parking and/or convenient pedestrian access.
3. Extended hours of operation, with many open 24 hours, seven days a week.
4. Offer at least 500 stock keeping units (SKUs).
5. Product mix includes a signicant mix of tobacco, beverages, snacks, candy and grocery items.
Since 1995, NACS has worked with Nielsen to accurately count and classify businesses in the convenience and fuel retail channel of trade. This store count is based on the convenience store universe, tracked and marketed by Nielsen, and is endorsed by NACS. View a detailed store count fact sheet at nacsonline.com/storecount.
The U.S. convenience retailing industry has roughly doubled in size over the last three decades. At year-end 1985, the store count was 90,900 stores, at year-end 1995 the store count was 101,100 stores and at year-end 2005 the store count was 140,665 stores.
14 | 2016 NACS Retail Fuels Report
HOW DO AMERICANS GET TO WORK?
THE AVERAGE AMERICAN VECHICLE
GAS CUSTOMERS
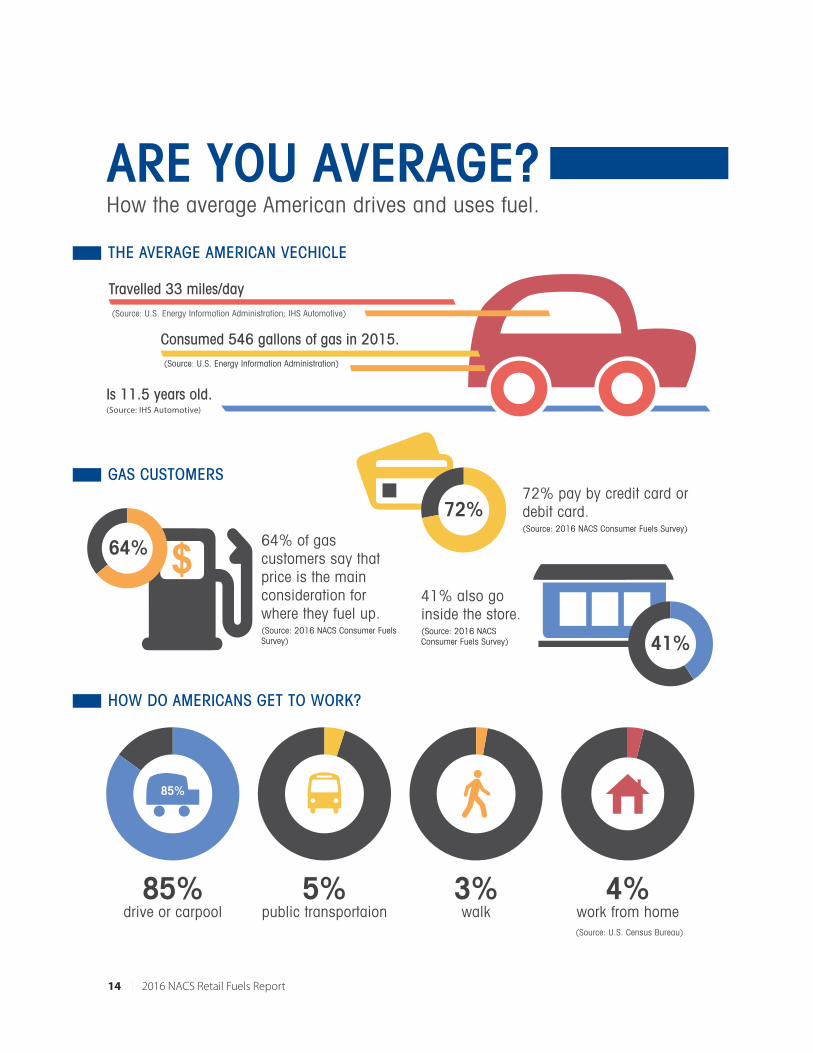
ARE YOU AVERAGE?How the average American drives and uses fuel.
41% also go inside the store.(Source: 2016 NACS Consumer Fuels Survey)
(Source: U.S. Energy Information Administration)
85%
85%drive or carpool
5%public transportaion
3%walk
4%work from home(Source: U.S. Census Bureau)
(Source: U.S. Energy Information Administration; IHS Automotive)
64% of gas customers say that price is the main consideration for where they fuel up.(Source: 2016 NACS Consumer Fuels Survey)
72% pay by credit card or debit card.(Source: 2016 NACS Consumer Fuels Survey)
$64%
Is 11.5 years old.
Travelled 33 miles/day
Consumed 546 gallons of gas in 2015.
(Source: IHS Automotive)
72%
41%

2016 NACS Retail Fuels Report | 15
THE FUELING INDUSTRY AT A GLANCE
Over the past �ve years,
retailer gross margins have averaged 6.2% (19.7 cents per gallon). (Source: OPIS)
A record 17.5 million cars and light trucks were sold in 2015.
Light-duty truck sales accounted for 56% of all vehicle sales. (Source: Autodata Corp.)
56%
There are 257.9 million registered vehicles in the United States.
(Source: IHS Automotive)
257.9 m
There are 124,374 convenience stores selling motor fuels in the United States.
Less than 0.4% are owned by one of the �ve major oil companies.(Source: NACS/Nielsen 2016 Convenience Industry Store Count)
U.S. gasoline demand increased 2.6% to 9.2 million barrels per day in 2015.(Source: U.S. Energy Information Administration, Short-Term Energy Outlook, January 2016)
9.2 MILLION BARRELS PER DAY
6.2%
2.6%
> 0.4%

16 | 2016 NACS Retail Fuels Report
Greater than 49.5 cents/gallon
40.0–49.5 cents/gallon
Less than 40.0 cents/gallon
U.S. Average: 47.99 cents/gallon
62.90
49.50
59.02
52.25
50.40
46.15
42.40
47.81
37.40
30.65
60.75
37.28
38.40
35.40 40.20
38.41
39.27 49.42
35.15
40.73
53.6539.80
44.40
48.94
46.4068.80
61.04
48.41
48.2951.60
54.98
48.86
42.23
37.19
40.4042.43
46.10
48.40
41.40
47.00
50.40
48.58
51.30
35.70
MA 44.94RI 52.40CT 55.91NJ 32.90DE 41.40MD 51.00DC 41.90
GASOLINE TAXESCombined Local, State and Federal (cents per gallon)
(Source: American Petroleum Institute, as of January 14, 2016; for informational purposes only and should not be relied upon or used for compliance purposes.)

COPYRIGHT © 2016, BY NACS | All rights reserved. No part of this publication may be reproduced or used in any form or by any means—graphic, mechanical or electronic, including photocopying, taping, recording or information storage and retrieval systems, without the prior, written permission of the publisher.
National Association of Convenience Stores1600 Duke Street, Alexandria, VA 22314703/684-3600www.nacsonline.com