Embed Size (px)
Citation preview

henrysmiller.com
2016 TRENDS 2017 OUTLOOK
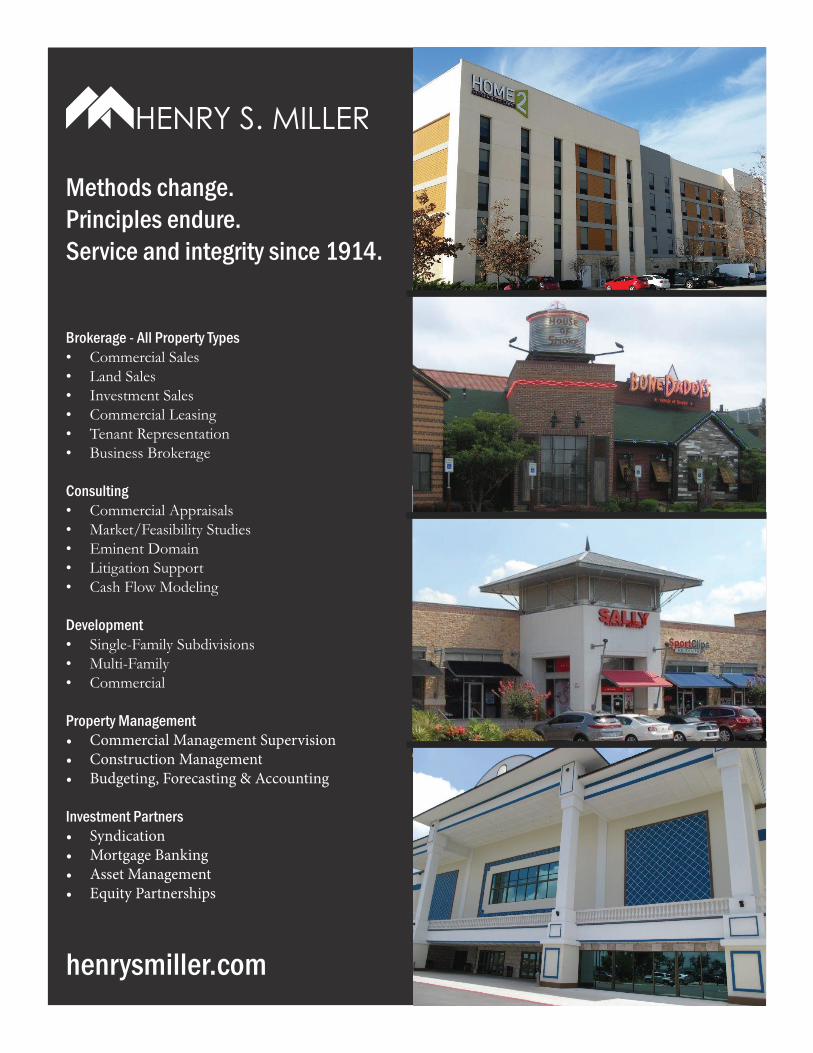
Methods change. Principles endure. Service and integrity since 1914.
Brokerage - All Property Types• Commercial Sales• Land Sales• Investment Sales• Commercial Leasing• Tenant Representation• Business Brokerage
Consulting• Commercial Appraisals• Market/Feasibility Studies• Eminent Domain• Litigation Support• Cash Flow Modeling
Development• Single-Family Subdivisions• Multi-Family• Commercial
Property Management• Commercial Management Supervision• Construction Management• Budgeting, Forecasting & Accounting
Investment Partners• Syndication• Mortgage Banking• Asset Management• Equity Partnerships
henrysmiller.com

2016 TRENDS | 2017 OUTLOOK henrysmiller.com
We’re enjoying a prolonged commercial real estate cycle in the United States with prices steadily increasing since the Great Recession. In fact, commercial real estate prices have risen 104% just since 2010, according to Real Capital Analytics. I believe we have a lot more runway ahead of us for the reasons described below.
Most U.S. economic leading indicators, such as housing starts, consumer confidence index and industry capacity utilization rates, suggest a steadily growing economy, according to the June 2017 ITR Economics Report. The report shows that employment and wages are rising, up 1.8% and 3.5% respectively over last year. While this makes it difficult for companies to find low-cost qualified labor, it should have a positive impact on retail sales as consumers have more disposable income. This is reflected in data which shows that U.S. retail sales rose 1.5% over last year, as consumers are spending more on discretionary items such as dining out and traveling. The report also indicates that business-to-business and industrial activity are rising as measured by U.S. nondefense capital goods new orders. Firms are willing and able to invest in new orders and capital expenditures. In addition, the DOW and S&P 500 continue to close at record highs.Texas Governor Greg Abbott noted recently that if Texas were its own country, it would be the 10th largest economy in the world, ahead of Australia, Canada and Russia. According to the Texas Comptroller of Public Accounts, the Texas population is one of the largest and fastest growing in the country. Texas has one of the nation’s highest birth rates and ranks toward the top in domestic and international migration – a formula for strong population growth. In addition, Texas is among the youngest states, and its youth population continues to expand as many other states contract. Dallas-Fort Worth is currently the largest metropolitan area in Texas with a population of 7.1 million. According to the American City Business Journals’
population database, a projected 10.9 million people will be living in North Texas by 2040, which is a 53.5% increase over the next 25 years. The Houston metropolitan area is expected to increase to 11.1 million people by 2040, a 66.7% increase over the current population of 6.6 million. Austin’s population is projected to increase 98.5%, which is by far the largest increase for any major market.
Henry S. Miller Company is taking full advantage of the favorable market conditions. Our brokerage operation is having one of its best years ever as transactions are up dramatically. Our development business is busy with several exciting new projects. We recently broke ground on a 763-unit CubeSmart self-storage facility in Garland and an 82-lot single family subdivision called Adkisson Ranch in Shady Shores. In addition, we recently purchased development sites for new single-family, multi-family and retail projects with several more in the pipeline. We sold Silverlake Shopping Center in Houston and Mexia Plaza Shopping Center, resulting in very successful investments for our partners. We currently own and operate over one million square feet of commercial real estate, consisting of 15 shopping centers and one medical office building located in Texas, Oklahoma, Arkansas and Mississippi. Rents and net operating income are up across our portfolio.
With over 100 years in the business, Henry S. Miller remains the leading independent, full-service commercial real estate development, brokerage, appraisal and consulting operation in Texas. With offices in Dallas, Houston, Austin, San Antonio and El Paso, we’re your first call for any commercial real estate needs in Texas. Methods change. Principals endure. Service and integrity since 1914!
Greg Miller
President & CEOHenry S. Miller Companies
Greg Miller

2016 TRENDS | 2017 OUTLOOK henrysmiller.com
Greg MillerPresident & CEO
EXECUTIVE BRANCH
Geraldine “Tincy” MillerChair Lady
Robert DuBoisCFO
Mark O’BriantManaging Director
Dan ArnoldEVP
BROKERAGE
Dan SpikaEVP/Principal
Darrell HurmisEVP/Principal
Frank BullockEVP Managing Director
Jim BrownlowSr. VP / Managing Partner, Capital Markets
EQUITY PARTNERS
Chris FarrarDirector, Capital Markets
Corporate Services Industrial/Office
Investments/ Land Retail
APPRAISAL / CONSULTING
Mark O’BriantPresident
PROPERTY MANAGEMENT
&
Mark SmithSr. VP
DEVELOPMENT
William “Bill” BushManaging Director
Steve DonoskyPresident
Commercial Multi-Family Single-Family
Dustin GrafPrincipal
FRANCHISE OFFICES
Rick StoesPrincipal
Shawn AckermanPrincipal
Keith CielhoPrincipal
Austin El Paso Houston San Antonio
EXECUTIVE LEADERSHIP TEAM

2016 TRENDS | 2017 OUTLOOK henrysmiller.com
TRENDSThe information contained herein represents the results of participants surveyed in the commercial real estate markets of North Texas for year-end 2016. The respondents include local and national developers, asset managers, loan officers in local and national lending institutions, brokers, as well as appraisers/consultants, mortgage bankers and individual investors.
CAPITALIZATION RATES What capitalization rates are being achieved, or do you see reflected by the market?
Capitalization Rates (%)
Property TypeGoing In Stabilized Reversion
Avg Low High Avg Low High Avg Low High
CLAS
S A
Apartments 4.89% 4.50% 5.50% 4.90% 4.00% 5.50% 5.56% 4.00% 6.75%
Office 6.25% 5.50% 7.50% 6.51% 5.00% 7.00% 6.94% 6.75% 7.50%
Retail 6.13% 4.50% 9.00% 6.12% 4.50% 7.00% 6.22% 4.50% 8.00%
Industrial 6.01% 4.00% 7.50% 6.03% 4.50% 7.00% 6.15% 4.50% 7.00%
Hotel 7.00% 7.00% 7.00% 7.25% 7.00% 7.50% 7.50% 7.00% 8.00%
Ground Leases 4.50% 4.50% 4.50% 5.00% 5.00% 5.00% 5.50% 5.50% 5.50%
Net Lease 5.85% 4.10% 7.50% 5.56% 4.25% 7.00% 5.87% 4.30% 8.00%
CLAS
S B
Apartments 6.04% 5.75% 6.75% 6.20% 5.25% 7.00% 6.50% 5.50% 7.00%
Office 7.27% 6.50% 8.50% 8.02% 6.80% 11.00% 8.11% 7.35% 9.00%
Retail 7.40% 6.00% 9.50% 7.56% 6.25% 9.00% 7.57% 6.00% 10.00%
Industrial 7.17% 5.00% 8.50% 7.44% 6.50% 8.50% 7.51% 6.00% 8.50%
Hotel 8.17% 8.00% 8.50% 8.50% 8.00% 9.00% 8.50% 8.00% 9.00%
Ground Leases 5.25% 5.00% 5.50% 5.75% 5.50% 6.00% 6.50% 6.50% 6.50%
Net Lease 6.80% 5.50% 8.50% 6.62% 5.90% 8.00% 6.72% 5.00% 8.00%
CLAS
S C
Apartments 7.47% 6.50% 9.00% 7.59% 7.00% 8.50% 7.88% 6.50% 9.00%
Office 8.09% 7.50% 9.50% 8.62% 7.30% 10.00% 8.75% 7.75% 10.00%
Retail 8.30% 7.00% 10.00% 8.45% 7.00% 10.00% 8.40% 7.50% 9.50%
Industrial 7.73% 6.00% 9.50% 8.06% 7.00% 9.00% 8.00% 7.00% 9.00%
Hotel 9.17% 9.00% 9.50% 9.50% 9.00% 10.00% 9.50% 9.00% 10.00%
Ground Leases 6.00% 5.50% 6.50% 6.50% 6.00% 7.00% 7.50% 7.50% 7.50%
Net Lease 7.52% 5.50% 9.50% 7.42% 6.50% 9.00% 7.32% 5.70% 9.00%
REQUIRED LAND YIELDS What are your IRR requirements for the following?
Required Land Yields (%)Leveraged Equity Rates Unleveraged Equity Rates
Property Type Avg Mode Low High Avg Mode Low High
Residential Lot Development 35.50% 0.00% 20.00% 70.00% 21.25% 0.00% 13.00% 30.00%
Speculative Land Purchase 33.00% 0.00% 20.00% 50.00% 33.75% 50.00% 13.00% 50.00%

2016 TRENDS | 2017 OUTLOOK henrysmiller.com
EQUITY RETURNS What are your anticipated required equity returns for the following investment types?Equity Returns (%)
Leveraged Equity Rates Unleveraged Equity RatesProperty Type Avg Mode Low High Avg Mode Low HighApartments 10.50% - 6.00% 15.00% 6.75% - 5.00% 8.50%
Office 13.25% 9.00% 9.00% 18.00% 9.88% - 7.00% 13.00%
Retail 15.88% - 9.00% 20.00% 10.38% - 8.00% 15.00%
Industrial 12.50% 9.00% 9.00% 17.00% 9.50% - 7.50% 13.00%
Hotel 18.00% 18.00% 18.00% 18.00% 10.00% - 9.00% 11.00%
Net Leases 10.25% - 7.00% 13.00% 8.75% - 6.00% 13.00%
Discount Rates (%)Property Type Average Mode Low HighApartments 7.45% - 4.00% 13.50%
Office 9.40% 8.00% 5.00% 18.00%
Retail 9.65% 8.00% 5.00% 18.00%
Industrial 9.75% 7.50% 7.50% 18.00%
Hotel 13.50% - 9.00% 18.00%
Restaurant 6.00% - 6.00% 6.00%
DISCOUNT RATES What leveraged yields or discount rates do you see reflected by the market?
Revenue and Expense Expectations (%)
Property Type
Year 1 Year 2 Year 3
Rev Exp Rev Exp Rev Exp
AVER
AGE
Apartments 3.07% 2.92% 2.93% 2.58% 2.50% 2.75%
Office 3.13% 3.32% 3.37% 3.29% 3.65% 3.41%
Retail 2.42% 2.71% 2.50% 2.45% 2.54% 2.38%
Industrial 2.80% 2.93% 2.73% 2.80% 2.72% 2.81%
Hotel 2.75% 2.75% 2.75% 2.75% 2.75% 2.75%
MOD
E
Apartments 3.00% 3.00% 3.00% 3.00% - 3.00%
Office 3.00% 3.00% 2.50% 3.00% 3.00% 3.00%
Retail 3.00% 3.00% 3.00% 3.00% 3.00% 3.00%
Industrial 3.00% 3.00% 3.00% 2.50% 3.00% 2.50%
Hotel - - - - - -
RANG
E
Apartments 6.00% 5.00% 5.00% 3.00% 5.00% 4.00%
Office 6.00% 8.00% 10.0% 8.00% 12.0% 8.00%
Retail 3.00% 7.00% 3.00% 4.00% 3.00% 3.00%
Industrial 3.00% 3.00% 3.00% 2.50% 3.00% 2.50%
Hotel - - - - - -
REVENUE & EXPENSE EXPECTATIONS What growth rates do you anticipate for revenue and expenses during the next few years?
Holding Period (years)Property Type Average Mode Low HighApartments 5.56 7.00 3.00 7.00
Office 5.47 5.00 1.00 10.00
Retail 5.58 5.00 3.00 10.00
Industrial 6.21 5.00 4.00 10.00
Hotel 6.00 7.00 4.00 7.00
Restaurant 7.17 5.00 5.00 9.00
HOLDING PERIOD What do you consider to be a reasonable holding (acquistion to resale) period?
2016 TRENDS | 2017 OUTLOOK henrysmiller.com
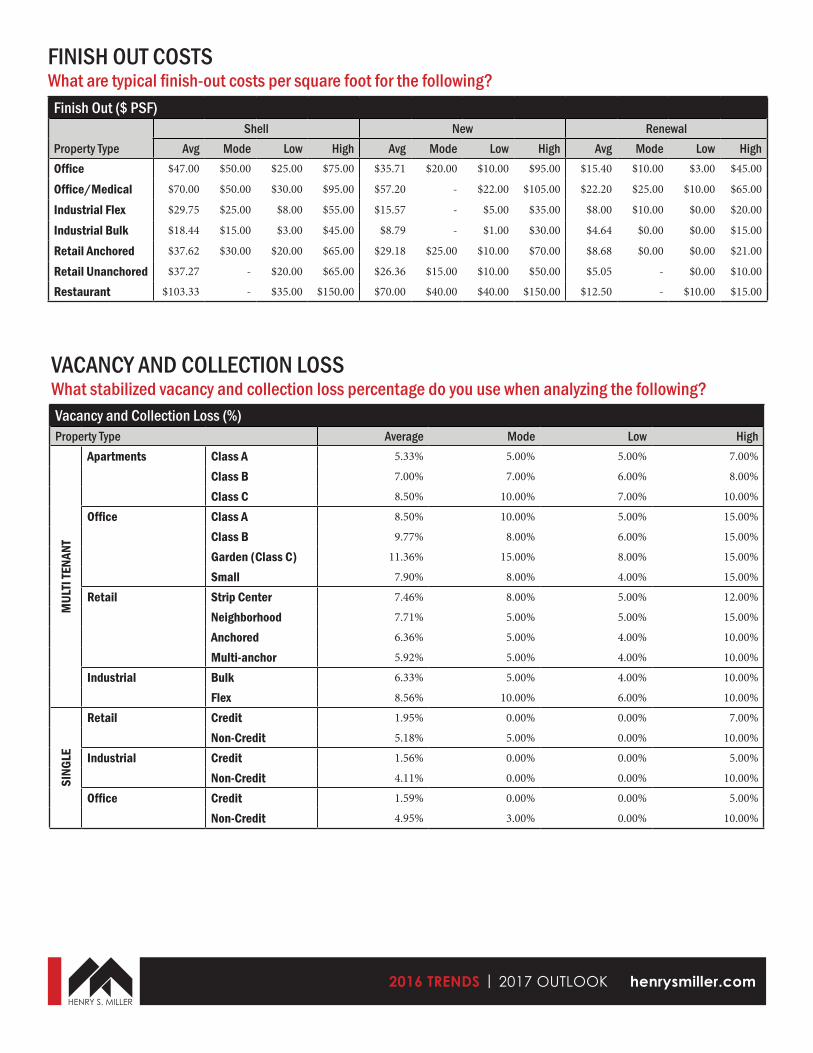
FINISH OUT COSTS What are typical finish-out costs per square foot for the following?
Finish Out ($ PSF)Shell New Renewal
Property Type Avg Mode Low High Avg Mode Low High Avg Mode Low HighOffice $47.00 $50.00 $25.00 $75.00 $35.71 $20.00 $10.00 $95.00 $15.40 $10.00 $3.00 $45.00
Office/Medical $70.00 $50.00 $30.00 $95.00 $57.20 - $22.00 $105.00 $22.20 $25.00 $10.00 $65.00
Industrial Flex $29.75 $25.00 $8.00 $55.00 $15.57 - $5.00 $35.00 $8.00 $10.00 $0.00 $20.00
Industrial Bulk $18.44 $15.00 $3.00 $45.00 $8.79 - $1.00 $30.00 $4.64 $0.00 $0.00 $15.00
Retail Anchored $37.62 $30.00 $20.00 $65.00 $29.18 $25.00 $10.00 $70.00 $8.68 $0.00 $0.00 $21.00
VACANCY AND COLLECTION LOSS What stabilized vacancy and collection loss percentage do you use when analyzing the following?Vacancy and Collection Loss (%)Property Type Average Mode Low High
MUL
TI TE
NANT
Apartments Class A 5.33% 5.00% 5.00% 7.00%
Class B 7.00% 7.00% 6.00% 8.00%
Class C 8.50% 10.00% 7.00% 10.00%
Office Class A 8.50% 10.00% 5.00% 15.00%
Class B 9.77% 8.00% 6.00% 15.00%
Garden (Class C) 11.36% 15.00% 8.00% 15.00%
Small 7.90% 8.00% 4.00% 15.00%
Retail Strip Center 7.46% 8.00% 5.00% 12.00%
Neighborhood 7.71% 5.00% 5.00% 15.00%
Anchored 6.36% 5.00% 4.00% 10.00%
Multi-anchor 5.92% 5.00% 4.00% 10.00%
Industrial Bulk 6.33% 5.00% 4.00% 10.00%
Flex 8.56% 10.00% 6.00% 10.00%
SING
LE
Retail Credit 1.95% 0.00% 0.00% 7.00%
Non-Credit 5.18% 5.00% 0.00% 10.00%
Industrial Credit 1.56% 0.00% 0.00% 5.00%
Non-Credit 4.11% 0.00% 0.00% 10.00%
Office Credit 1.59% 0.00% 0.00% 5.00%
Non-Credit 4.95% 3.00% 0.00% 10.00%
Retail Unanchored $37.27 - $20.00 $65.00 $26.36 $15.00 $10.00 $50.00 $5.05 - $0.00 $10.00
Restaurant $103.33 - $35.00 $150.00 $70.00 $40.00 $40.00 $150.00 $12.50 - $10.00 $15.00

2016 TRENDS | 2017 OUTLOOK henrysmiller.com
Sources of FundsSource Average Mode Low HighLocal Bank 36.54% 30.00% 5.00% 80.00%
Non-Texas Bank 18.26% 10.00% 5.00% 50.00%
Conduit Lender/CM BS Lender 17.86% 5.00% 5.00% 50.00%
Insurance 10.05% 5.00% 1.00% 25.00%
Pension 9.78% 5.00% 0.00% 35.00%
Preferred Equity 15.10% 5.00% 0.00% 50.00%
Other (Owner-Financed Gov’t) 10.06% 10.00% 0.00% 40.00%
SOURCES OF FUNDS What are the sources of funds for financing today’s transactions?
REASONABLE MARKETING PERIOD What do you consider to be a reasonable marketing period?
Reasonable Marketing Period (months)Property Type Average Mode Low High
Apar
tmen
ts Class A 4.00 3.00 3.00 6.00
Class B 4.67 6.00 3.00 6.00
Other 6.00 6.00 6.00 6.00
Offic
e
High Rise 9.46 6.00 2.00 24.00
Class A Suburban 7.62 8.00 2.00 12.00
Class B 9.81 8.00 2.00 24.00
Other 10.50 10.00 2.00 22.00
Reta
il
Regional 8.69 6.00 2.00 36.00
Community 8.80 6.00 2.00 24.00
Neighborhood 8.27 6.00 2.00 18.00
Unanchored 8.80 12.00 2.00 12.00
Land Ground Leases 7.59 6.00 5.00 12.00
Fee Simple 10.28 12.00 6.00 12.00
Indu
stria
l Bulk Warehouse 8.33 4.00 2.00 24.00
Office/Warehouse 8.00 8.00 2.00 18.00
Tech Flex 7.27 8.00 2.00 12.00
Hote
ls
Full Service 6.00 - 2.00 10.00
Limited Service 6.00 8.00 2.00 8.00
Economy 6.00 - 2.00 10.00
Henry S. Miller Realty Services, LLC is a full service Real Estate Company providing brokerage, leasing, asset and property management, corpo-rate services, investment banking, development, construction management, consulting and appraisal services. Since 1914, the Henry S. Miller family of companies have been building a reputation on strong leadership, great integrity, and wise investment.
Current StatusVery Good 82.2%
Somewhat Good 17.7%
CURRENT NORTH TEXAS RE MARKET How would you describe the current status of the current RE market for N Texas?
Future StatusIt will drastically decline 2%
It will drastically improve 32%
It will moderately decline 14%
It will likely maintain (neutral) 52%
FUTURE NORTH TEXAS RE MARKET In what direction do you anticipate the RE market in N Texas is heading in the near future?

2016 TRENDS | 2017 OUTLOOK henrysmiller.com
AUSTINDustin Graf
HOUSTONShawn Ackerman
SAN ANTONIOKeith Cielho
Main Market drivers (?) 2-3 OR Very general description of main industry types
Tech, state government & education Oil, Technology, Medical Tourism, Bio-Med, Technology, Data Centers, Call Centers
Describe your market in ten words or less.
150 net migrants a day huge job growth Strong job market and high residential growth Stable market with large labor pool; affordable cost of living.
What don’t we already know about your market?
Although Austin is one of the hottest and most desirable markets in the country, many local businesses are being priced out of Austin due to ever increasing rents. This is being caused by increasing land costs for developers that trickles down to the tenants. Austin MSA is in an adjustment period with these higher rents even though the rates are still lower than Houston and Dallas. This has caused huge growth in secondary/tertiary markets.
Houston is more than just oil. We have the largest medical center in the world and it continues to expand. The job market has high growth due to a diversified workforce and affordable housing.
Class A multifamily enjoys high occupancies. Redevelopment of inner city with quality mixed use developments: THE PEARL, Broadway, Southtown/King William, Hemisfair, Riverwalk area. Office market seeing positive absorption and increase in rental rates. Retail market is stable with small high impact centers being developed. Influx of restaurants. After a 10 year dry spell, we are seeing new luxury brand hotels being built.
What cyclical shifts are you seeing and what do you think is the cause?ORAre you seeing any signs of a cyclical change in trends? If so, why and if not, what would likely cause a change.
Retail has cooled off due to lack of supply and the challenges retail has faced due to competition from online retailers. The office market has experienced negative net absorption for the first time in a while due to the delivery of new construction with vacancies. This will level out as 1,150,000 sf of space will be absorbed in the next quarter. Overall, 2.8 million square feet of office space is currently under construction while rental rates are increasing and vacancy rates are holding strong. There continues to be a need for more industrial space despite several industrial projects being delivered.
We are seeing oil and NASA employees shifting to more technology industries. They are highly skilled and educated labor. This pattern will continue even after oil prices rise. This diversification of employee based business will allow the Houston job growth to continue for many years to come.
Developers have shifted from delivering power and big box centers with shadow space to smaller high impact and high visibility centers at corners and major thoroughfares. Development of multifamily and housing and retail/restaurant in inner city locations like lower Broadway, the PEARL area, Southtown and King William, DIgnowity Hill. These developments are attracting a younger demographic who are natives returning to SA to find good jobs in technology.
How long have you been in this industry and what changes have you witnessed?
I have been in the industry for 20 years and I have seen two recessions due mostly to a lack of a diverse economy. The “Tech Bubble” in 2000 impacted Austin greatly because the economy was almost all government and university based. Technology was the first new industry which left Austin too vulnerable when it crashed. Austin was very prepared for the 2008 recession as we were very diversified and had the highest population growth in the country. The CRE market remains very strong and it is making deals more difficult than ever as acquisition prices continue to increase. I believe that a market correction is coming soon which will reopen more development opportunities.
I have been working in real estate for over 25 years I have seen the ups and downs in the Houston economy which were mainly due to heavy oil related job sectors. However, after the oil crisis in the 80’s, Houston diversified from just oil. The medical field with the expansion of the medical center created the largest one in the world. Technology is the key to Houston continued growth. We have a strong, educated labor force living in an affordable housing market.
Have been in this business in SA since 1983. Up until the 90’s all the new high end growth took place between Hwy 281 and IH 10. This has now shifted to the east towards IH 35 as well as to the West towards Hwy 151. More higher end and luxury hotel brands being built all over the City offering leisure and business travelers, and conventioneers more lodging options.
What are the biggest challenges for the CRE in the next few years?
The industry is one of the few that has yet to experience disruption from technology. This will eventually hit our industry and change it in a number of ways. Locally, as mentioned above, I see Austin losing its “weird” factor due to local businesses not being able to afford to work and live in town.
I see that so many developers chase the same dream so to speak. For example, Houston had 30,000 new apartment units under construction in 2015/2016. It seems that a niche market turns into a glut once the word gets out. Overbuilding in the office market hurt Houston in the 80’s and I see it still happening in certain pockets throughout the city such as the Energy Corridor. Houston needs to slow down construction so the market can catch up. My worry, is Houston hasn’t quite learned from its mistakes.
The biggest challenge is the tight credit market and underwriting standards. High land prices and an increase in labor and construction costs continue to plague developers who are delivering space at high rental rates. High rents for retail and office coupled with increasing NNN charges pose a challenge to tenants in terms of occupancy cost to revenues. This can all be solved with an increased circulation of money in a vibrant and robust economic recovery.
What would you do with fifteen minutes of fame?
I would try to get an extension of at least an additional 45 minutes.
I would use that time to be a positive role model to others.
Teach the new generation how to manage time and balance life; and return phone calls.
Franchise Market Update
2016 TRENDS | 2017 OUTLOOK henrysmiller.com
Overview The current development boom in the North Texas commercial real estate market is continuing in the first quarter of 2017. This year marks the seventh year of the current real estate cycle that began in 2010, the first year of recovery after the recession of 2008-2009. The Dallas/Fort Worth market area is now designated the #1 market in the nation for overall real estate prospects by the Urban Land Institute.
Much of the economic growth in Dallas/Fort Worth is attributed to corporate relocations and job creation. Over 100 companies have relocated to the area since 2010. Commercial construction totaled over $6 billion in the Dallas/Fort Worth market area in 2016, a nearly 30% increase over 2015. Office absorption totaled 5.3 million square feet in 2016, the highest amount in the country. With the wave of corporate relocations, new office construction currently totals 9.4 million square feet with another 26 million on the drawing board. The market area also has 18.5 million square feet of industrial projects under construction. And Dallas/Fort Worth leads the country in new single family home starts and was ranked second in the country in multifamily construction in 2016. New retail construction in 2016 totaled 5.2 million square feet with current occupancy at 92%. The pace of growth is expected to continue throughout 2017 and beyond. In evaluating the dynamics of the North Texas real estate market, in addition to our own observations, we review here the forecasts and predictions of the most reputable market studies recently published and draw conclusions from their collective findings. These reports by real estate industry leaders focus on the outlook for 2017 in the U.S. with a specific focus on Dallas/Fort Worth.
Forbes “Best Buy Cities”Forbes published a detailed analysis of the U.S. housing market in January, 2017 entitled “Best Buy Cities: Where to Invest in Housing in 2017.” As Forbes put it “these are markets where you can make an investment, you are probably going to get a good return and you are not taking an extraordinary risk.” The study concludes that when it comes to measuring risk and reward in real estate, “cities in the southern half of the country look to be in the sweet spot.” The study tracked more than 300 housing markets and analyzed housing indicators as well as broader growth trends in each market area. They narrowed these markets down to the top 20 markets nationally.
To compile the Top 20 list Forbe’s analysts began with 330 markets and removed markets with a population below 500,000 and then discarded those that ranked the worst on key metrics. To determine the Top 20 markets they selected those that scored well across five measures: annual job growth, three-year population growth (2012-2015), annual home price growth, and affordability.
The study places Dallas at the top of the top 20 markets. The researchers note that this ranking is based on historic job growth (3.9% in the last year) and a 6.2% population growth in the last three years. The State of Texas is also ranked on top in terms of state rankings, with Fort Worth ranked No.9 and San Antonio ranked No. 20. The Great Recession and housing downturn “did not hit Texas quite as hard as the rest of the country, meaning it came back quicker and has been adding jobs faster than the rest of the country,” according to the study’s writers.
Outlook for the Texas Economy: The Real Estate Center, Texas A & M UniversityThis study, published in December, 2016 concludes that job growth continued at a very strong pace in Texas in 2016 with service-providing jobs representing much of that growth - mainly in health, education, leisure activities and governmental jobs. The energy sector improved in the 4th Quarter of 2016 as energy prices reached their highest level since 2014.
The study concludes that the Texas economy “appears solid and expectations are optimistic for 2017.” As a cautionary note, the study also states that “potential headwinds to the Texas economy include trade uncertainty [with Mexico], volatile energy prices and national political uncertainty.”
Regarding the North Texas market area, the A & M study noted that the total supply of lots for housing continues to lag behind the demand for new housing. The supply of houses in the Dallas market was 2.1 months at year-end, both in Dallas and Fort Worth. A 6.5 months’ supply is considered a balanced housing market.
Emerging Trends in Real Estate 2017: Price Waterhouse Coopers US and the Urban Land InstituteIn this comprehensive industry forecast markets are ranked based on interviews and surveys from more than 1,800 leading real estate experts including investors, fund managers, developers, lenders, brokers, advisors and consultants.
Based on this study, Austin leads with the Number 1 slot, switching positions with Dallas/Fort Worth which was ranked No.1 for 2016. The capital of Texas has consistently met the top criteria for recent real estate market attractiveness. Factors evaluated include: a diverse economy; a growing population base made up of an educated labor force; and the “hip” factor that makes Austin attractive to the millennial-dominated workforce.
Ranked No. 2, the Dallas/Fort Worth market is described in this study as “rapidly approaching the level where it is considered as a core primary market,” similar to gateway cities such as New York, Miami,
Commercial Real Estate Forecast for 2017
Chris Burrow, DirectorDillon Cook, Senior AssociateEric Leyendecker, Financial Analyst Jordan Harris, Research Analyst

2016 TRENDS | 2017 OUTLOOK henrysmiller.com
San Francisco Los Angeles, and Seattle. The Dallas/Fort Worth area is perceived as a business-friendly environment that offers an attractive cost of doing business, an adequate and well-educated workforce, and world-class transportation access by air, rail, and road. The labor force continues to be supported by a reasonable cost of living that continues to attract in-migration, the study’s researchers state.
The Dallas/Fort Worth economy has continued to diversify and has exposure to growing medical facilities and an expanding technology sector, according to the report. A number of colleges and universities in the metro area support the education level of the workforce, while coordination with the community college network is used to train workers for positions that do not require a four-year college degree.
Real Estate Review: Texas Real Estate Council and Dallas Regional Chamber, Winter 2016The Dallas Regional Chamber tracks all real estate sectors in their quarterly studies. The most recent report states that population growth, immigration and corporate relocations continue to have a positive impact on the Dallas/Fort Worth real estate market. As demand outpaces supply, building activity has increased, particularly the in-town Dallas submarket where several new high-density multifamily and office projects are underway. Downtown Dallas is also seeing a resurgence of activity. Nearly 51,000 rental units are under construction in the market area.
More than 122,000 new jobs were added in Dallas/Fort Worth in 2016, leading the nation in percentage growth. New companies that announced relocations included Jacobs Engineering, Charles Schwab, Jamba Juice, Thompson Reuters, and McKesson. More relocations are expected in 2017. At year-end 2016 the Chamber was in discussion with principals initiating 40 active projects. They include 9 corporate headquarters, 8 corporate offices, 12 manufacturing deals, 5 information technology projects, 3 distribution centers, and 3 confidential and unspecified deals.
Conclusion For those of us who are active in the commercial real estate business on a daily basis, the strong Texas economy and the strong pace of real estate investment and development activity in the Dallas/Fort Worth market are undeniable. One of the most common questions we hear from property owners and investors is “how much longer do you think this cycle is going to last?”
Since we deal with very sophisticated buyers, and many who have been in the business a long time, they are understandably curious how many more years the market can sustain itself, particularly after a run of seven solid years. As of this writing we see positives and negatives – but fortunately the positives far outweigh the negatives as we look forward to 2017 and beyond.
Here are our predictions based on the above studies and our own read of the market:
• Corporate relocations to Dallas will continue over the next several years and continue to support large, carefully planned mixed-use development projects in both Dallas and Fort Worth. The primary beneficiaries of such projects will be North Dallas, Plano, Frisco, Grapevine, McKinney, Allen/Fairview, and North Fort Worth/Alliance.
• As a result of the above, along with continued in-migration to North Texas, the Dallas/Fort Worth housing market will continue to be strong for the next several years.
• Neighborhood grocery-anchored retail centers will continue to be built in suburban Dallas/Fort Worth markets where single family home construction is active (e.g. Mckinney, Allen, Prosper, Celina, Rockwall, North Fort Worth and along major corridors in Kaufman County).
• Traditional big-box anchored retail centers will continue to face challenges as more stores go dark (e.g. Sears, Kmart, Macy’s, J.C. Penney, Sports Authority, etc.). These often well-located properties represent excellent opportunities for redevelopment and repurposing, a trend that is expected to continue for many years to come.
• Foreign investment in North Texas real estate land and commercial properties will continue with a likely increase in funds from European, Canadian, Middle Eastern and South Asian countries and a decrease in the flow of funds from China (due to recent governmental restrictions on funds transfers).
• An increase in the flow of funds into commercial properties from stock funds and institutional investors seeking to hedge against inflation.
• The proposed infrastructure initiative and the Dallas to Houston bullet train appear to be increasingly likely. If so, Texas will be a big beneficiary in the form of construction dollars and construction jobs in rural areas.
• Foreign trade with Mexico will likely be reduced if protectionist trade measures are implemented. Texas manufacturers and farmers will likely be impacted more than those in any other state but Central and South Texas companies would bear the brunt of the decline.
Commercial Real Estate Forecast for 2017 continued...
2016 TRENDS | 2017 OUTLOOK henrysmiller.com
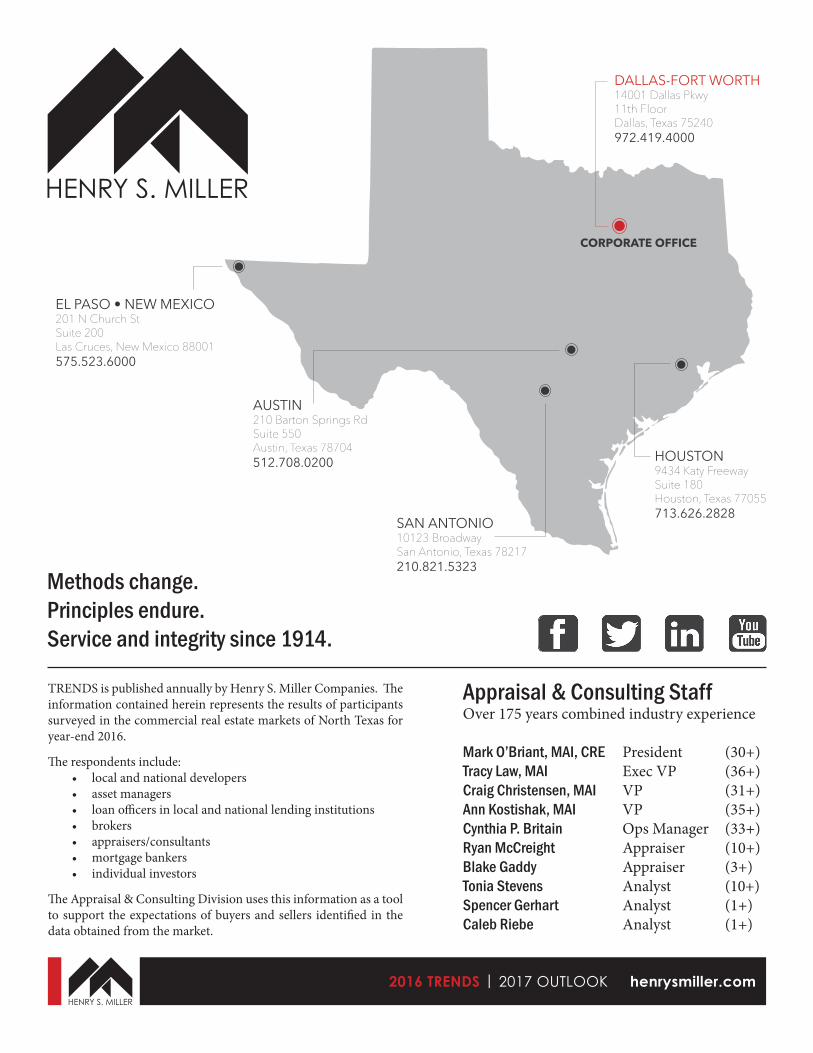
Appraisal & Consulting Staff Over 175 years combined industry experience
Mark O’Briant, MAI, CRE President (30+) Tracy Law, MAI Exec VP (36+)Craig Christensen, MAI VP (31+) Ann Kostishak, MAI VP (35+)Cynthia P. Britain Ops Manager (33+)Ryan McCreight Appraiser (10+)Blake Gaddy Appraiser (3+)Tonia Stevens Analyst (10+) Spencer Gerhart Analyst (1+)Caleb Riebe Analyst (1+)
TRENDS is published annually by Henry S. Miller Companies. The information contained herein represents the results of participants surveyed in the commercial real estate markets of North Texas for year-end 2016.
The respondents include:• local and national developers• asset managers• loan officers in local and national lending institutions• brokers• appraisers/consultants• mortgage bankers• individual investors
The Appraisal & Consulting Division uses this information as a tool to support the expectations of buyers and sellers identified in the data obtained from the market.
Methods change. Principles endure. Service and integrity since 1914.
HOUSTON9434 Katy FreewaySuite 180Houston, Texas 77055713.626.2828
DALLAS-FORT WORTH14001 Dallas Pkwy11th FloorDallas, Texas 75240972.419.4000
AUSTIN210 Barton Springs RdSuite 550Austin, Texas 78704512.708.0200
SAN ANTONIO10123 BroadwaySan Antonio, Texas 78217210.821.5323
EL PASO • NEW MEXICO201 N Church StSuite 200Las Cruces, New Mexico 88001575.523.6000
CORPORATE OFFICE