Embed Size (px)
Citation preview
TRI National Analysis 2016 www.epa.gov/trinationalanalysis/ January 2018
Introduction to the 2016 TRI National Analysis
Industries and businesses in the United States use chemicals to make the products we depend
on, such as pharmaceuticals, computers, paints, clothing, and automobiles. While the majority
of chemicals included on the Toxics Release Inventory (TRI) chemical list are managed by
industrial facilities to minimize releases into the environment, releases do still occur as part of
their business operations. It is your right to know what TRI chemicals are being used in your
community, how they are managed, how much is released into the environment, and whether
such quantities are increasing or decreasing over time.
The TRI is a publicly available database maintained by EPA that tracks the management of
certain chemicals. The information contained in the TRI is submitted by U.S. facilities in industry
sectors such as manufacturing, metal mining, electric utilities, and commercial hazardous waste
management. Under the Emergency Planning and Community Right-to-Know Act (EPCRA),
facilities must report to EPA details about their releases of TRI-listed chemicals for the prior
calendar year by July 1. The Pollution Prevention Act (PPA) requires facilities to submit
additional information on pollution prevention and other waste management activities of TRI
chemicals. For calendar year 2016, more than 21,000 facilities submitted data to TRI.
Each year, EPA prepares and publishes the TRI National Analysis, which summarizes recently
submitted TRI data, trends, special topics, and interprets the findings from the perspective of
EPA’s mission to protect human health and the environment. The two charts below show: 1)
how chemical wastes were managed in 2016; and 2) how the portion of wastes that were
disposed of or otherwise released were handled.
TRI National Analysis 2016 www.epa.gov/trinationalanalysis/ January 2018
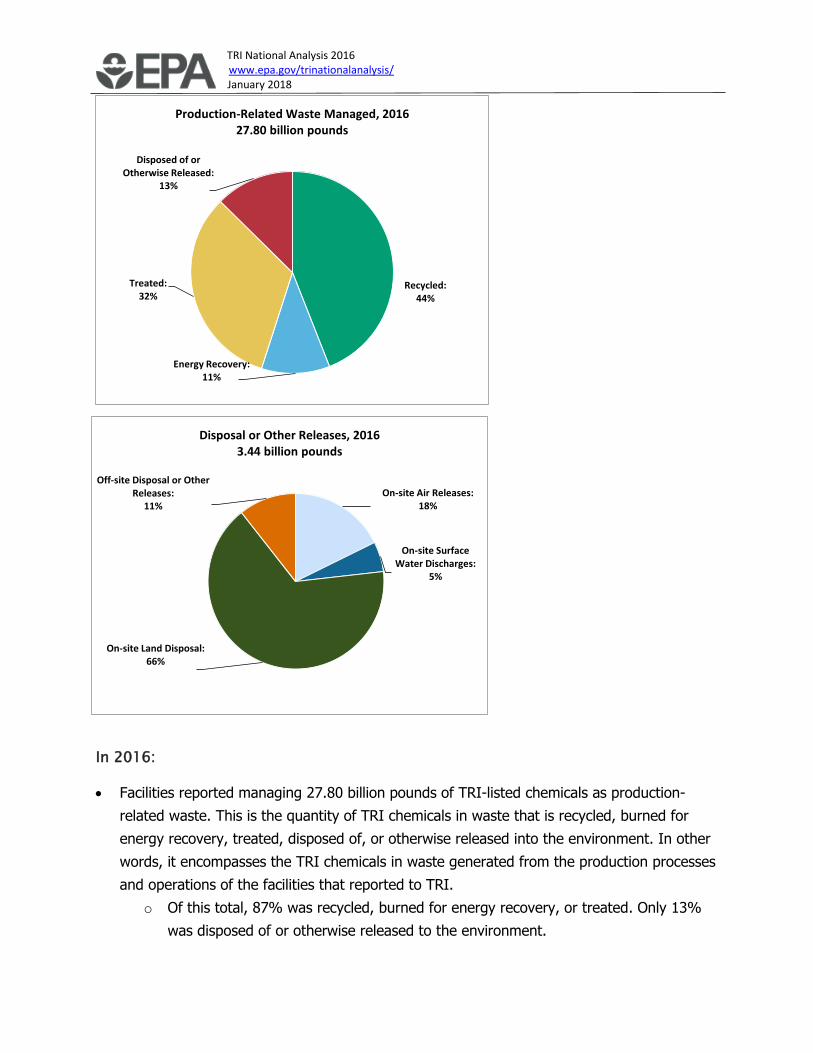
In 2016:
• Facilities reported managing 27.80 billion pounds of TRI-listed chemicals as production-
related waste. This is the quantity of TRI chemicals in waste that is recycled, burned for
energy recovery, treated, disposed of, or otherwise released into the environment. In other
words, it encompasses the TRI chemicals in waste generated from the production processes
and operations of the facilities that reported to TRI.
o Of this total, 87% was recycled, burned for energy recovery, or treated. Only 13%
was disposed of or otherwise released to the environment.
Recycled:44%
Energy Recovery:11%
Treated:32%
Disposed of or Otherwise Released:
13%
Production-Related Waste Managed, 201627.80 billion pounds
On-site Air Releases: 18%
On-site Surface Water Discharges:
5%
On-site Land Disposal: 66%
Off-site Disposal or Other Releases:
11%
Disposal or Other Releases, 20163.44 billion pounds

TRI National Analysis 2016 www.epa.gov/trinationalanalysis/ January 2018
• For chemical wastes that were disposed of or otherwise released, facilities also reported
where the wastes were released – to air, water, or land, on-site or off-site. Most waste was
disposed of on-site to land (including landfills, other land disposal, and underground
injection).
• As highlighted in the Releases of Chemicals section, releases to air continued to decline in
2016. Since 2006, air releases reported to TRI decreased by 58% (829 million pounds).

TRI National Analysis 2016 www.epa.gov/trinationalanalysis/ January 2018
What’s in the 2016 TRI National Analysis
The Toxics Release Inventory (TRI) National Analysis is prepared and published annually, and
the 2016 TRI National Analysis is EPA's summary and interpretation of TRI data reported for
activities that occurred at facilities during 2016. It offers valuable information for improving our
understanding of how the environment and communities may be affected by TRI chemicals,
and is a snapshot of the data at one point in time. To conduct your own analysis of TRI data,
the most recent data available are accessible from the TRI Data and Tools webpage.
Additional information is presented in the following sections of the TRI National Analysis:
• Pollution Prevention and Waste Management presents the types of pollution prevention
activities that facilities have implemented, and trends on recycling, energy recovery,
treatment, and releases of TRI chemical waste generated and managed as part of
industrial operations.
• Releases of Chemicals presents trends in releases of TRI chemicals to air, water, and
land, including a focus on selected chemicals of special concern.
• Industry Sectors highlights TRI chemical waste management trends for five industry
sectors: manufacturing, pharmaceutical manufacturing, chemical manufacturing, metal
mining, and electric utilities.
• Where You Live presents analyses of the quantities of TRI chemicals specific to U.S.
geographic areas: state, city, county, ZIP code, metropolitan area and micropolitan area,
and by Large Aquatic Ecosystems (LAEs), such as the Chesapeake Bay, as well as
information about facilities in Indian country.
• TRI and Beyond presents TRI data used in conjunction data from other environmental
programs, such as chemical production reported to EPA under the Toxic Substances
Control Act (TSCA). TRI as a model for other pollutant release and transfer inventories
around the world is also discussed in this section.

TRI National Analysis 2016 www.epa.gov/trinationalanalysis/ January 2018
TRI Data Considerations
As with any dataset, there are several factors to consider when reviewing results or using the
Toxics Release Inventory (TRI) data. Key factors associated with data presented in the TRI
National Analysis are summarized below; for more information see Factors to Consider When
Using Toxics Release Inventory Data.
• Covered sectors and chemicals. TRI includes information reported by many industry
sectors on the quantities of many chemicals that are released or otherwise managed as
waste, but it does not contain such information on all chemicals manufactured,
processed or otherwise used by facilities or from facilities in all industry sectors within
the United States. A list of the sectors covered by TRI is available on the TRI webpage,
as well as a current list of the chemicals reportable to the TRI Program.
• TRI trends. The list of TRI chemicals has changed over the years; as a result, trend
graphs in the TRI National Analysis include only those chemicals that were reportable for
the entire time period presented so that the year-to-year data are comparable. Results
which focus only on the year 2016 include all chemicals reportable for 2016. Thus, the
results for 2016 analyses may differ slightly from results presented in trend analyses,
which include 2016 and previous years.
• Data quality. Facilities determine the quantities of chemicals they report to TRI using
the best-available data. Each year, EPA conducts an extensive data quality review that
includes contacting facilities to review potential errors in reported information. This data
quality review ensures the National Analysis is based on accurate and useful
information.
• Risk. The quantity of TRI chemicals released is not an indicator of potential health risks
posed by the chemicals. Although TRI data generally cannot indicate the extent to which
individuals may have been exposed to chemicals, TRI data can be used as a starting
point to evaluate the potential for exposure and whether TRI chemical releases might
pose risks to human health and the environment. For more information on the potential
hazard and risk posed by disposal or other releases of TRI chemicals, see the Hazard
and Potential Risk of TRI Chemicals section.
• Late submissions. TRI reporting forms submitted to EPA after the July 1 reporting
deadline may not be processed in time to be included in the National Analysis. While
revisions can be submitted after the July 1 reporting deadline, the data used to develop
the National Analysis is frozen in mid-October. Therefore, revisions received after this
TRI National Analysis 2016 www.epa.gov/trinationalanalysis/ January 2018
freeze date will not be reflected in the National Analysis. Those late revisions will be
incorporated into the TRI dataset during the March refresh of the data.
• Double-counting. The National Analysis presents summaries of many quantitative data
elements (see “Quick Facts” below) including releases to the environment, which occur
on-site and off-site after wastes are transferred to another business for further waste
management. When aggregating releases across facilities, such as national totals, EPA
adjusts off-site releases to eliminate double counting of releases if the receiving facility
also reports to TRI.
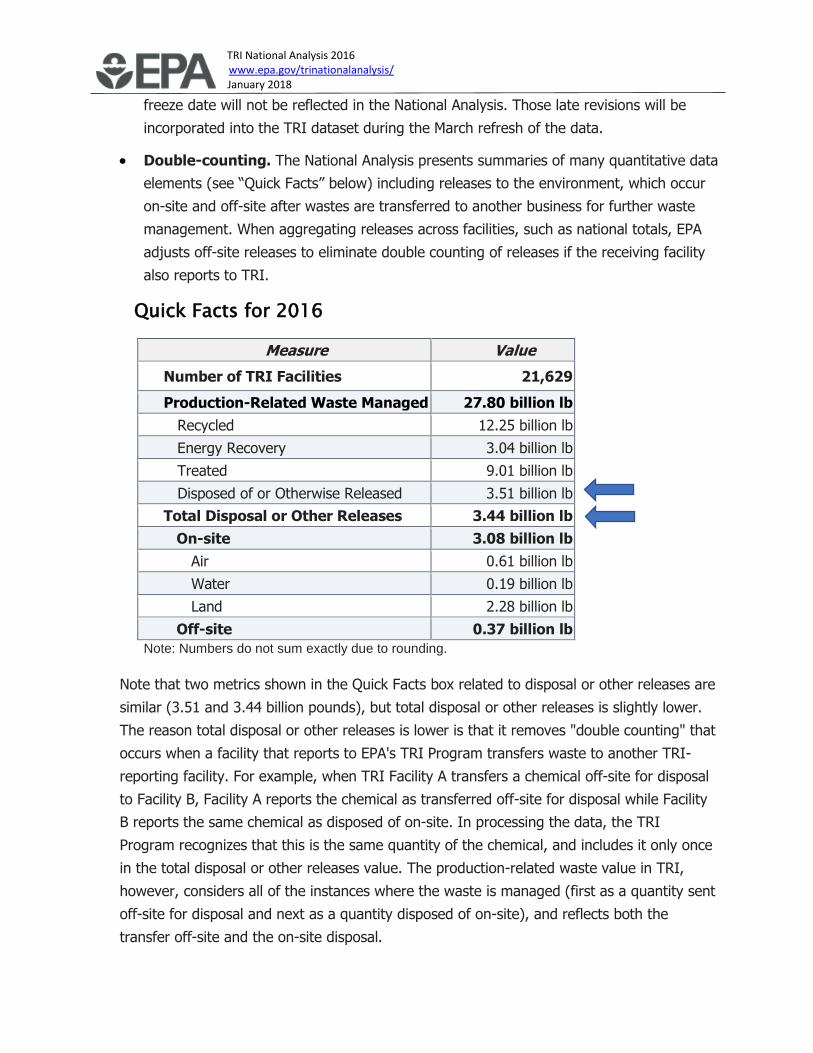
Quick Facts for 2016
Measure Value
Number of TRI Facilities 21,629
Production-Related Waste Managed 27.80 billion lb
Recycled 12.25 billion lb
Energy Recovery 3.04 billion lb
Treated 9.01 billion lb
Disposed of or Otherwise Released 3.51 billion lb
Total Disposal or Other Releases 3.44 billion lb
On-site 3.08 billion lb
Air 0.61 billion lb
Water 0.19 billion lb
Land 2.28 billion lb
Off-site 0.37 billion lb
Note: Numbers do not sum exactly due to rounding.
Note that two metrics shown in the Quick Facts box related to disposal or other releases are
similar (3.51 and 3.44 billion pounds), but total disposal or other releases is slightly lower.
The reason total disposal or other releases is lower is that it removes "double counting" that
occurs when a facility that reports to EPA's TRI Program transfers waste to another TRI-
reporting facility. For example, when TRI Facility A transfers a chemical off-site for disposal
to Facility B, Facility A reports the chemical as transferred off-site for disposal while Facility
B reports the same chemical as disposed of on-site. In processing the data, the TRI
Program recognizes that this is the same quantity of the chemical, and includes it only once
in the total disposal or other releases value. The production-related waste value in TRI,
however, considers all of the instances where the waste is managed (first as a quantity sent
off-site for disposal and next as a quantity disposed of on-site), and reflects both the
transfer off-site and the on-site disposal.
TRI National Analysis 2016 www.epa.gov/trinationalanalysis/ January 2018
1
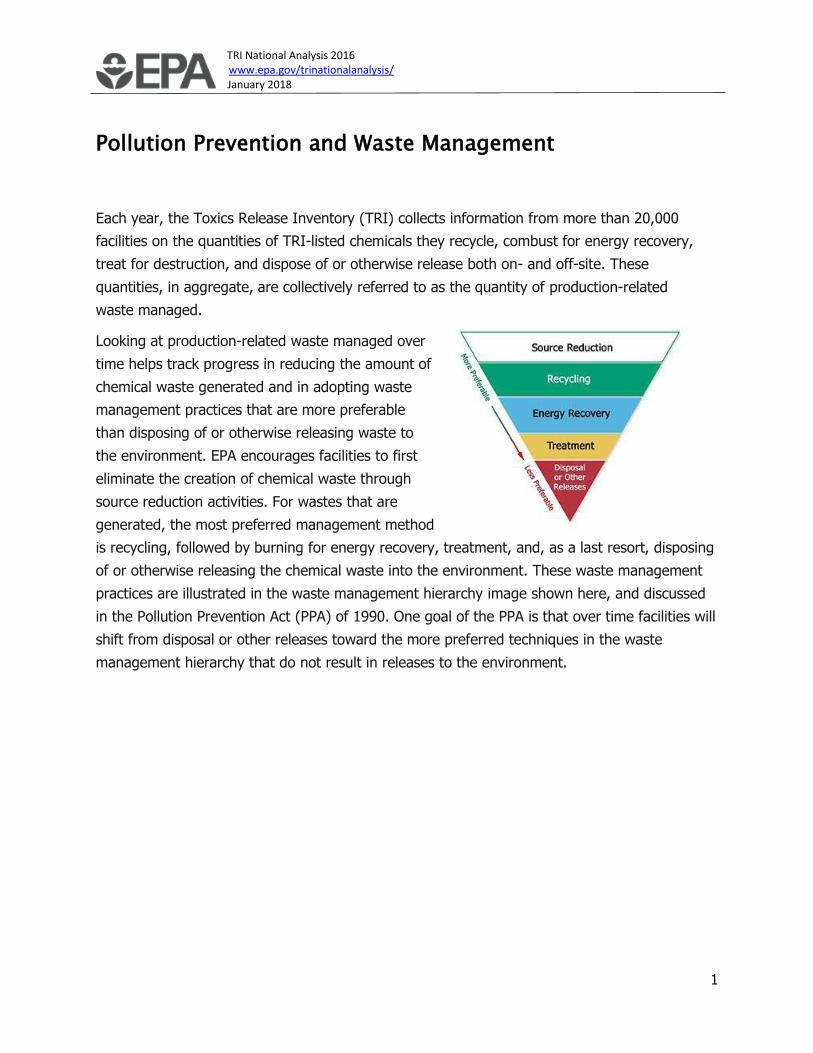
Pollution Prevention and Waste Management
Each year, the Toxics Release Inventory (TRI) collects information from more than 20,000
facilities on the quantities of TRI-listed chemicals they recycle, combust for energy recovery,
treat for destruction, and dispose of or otherwise release both on- and off-site. These
quantities, in aggregate, are collectively referred to as the quantity of production-related
waste managed.
Looking at production-related waste managed over
time helps track progress in reducing the amount of
chemical waste generated and in adopting waste
management practices that are more preferable
than disposing of or otherwise releasing waste to
the environment. EPA encourages facilities to first
eliminate the creation of chemical waste through
source reduction activities. For wastes that are
generated, the most preferred management method
is recycling, followed by burning for energy recovery, treatment, and, as a last resort, disposing
of or otherwise releasing the chemical waste into the environment. These waste management
practices are illustrated in the waste management hierarchy image shown here, and discussed
in the Pollution Prevention Act (PPA) of 1990. One goal of the PPA is that over time facilities will
shift from disposal or other releases toward the more preferred techniques in the waste
management hierarchy that do not result in releases to the environment.
TRI National Analysis 2016 www.epa.gov/trinationalanalysis/ January 2018
2
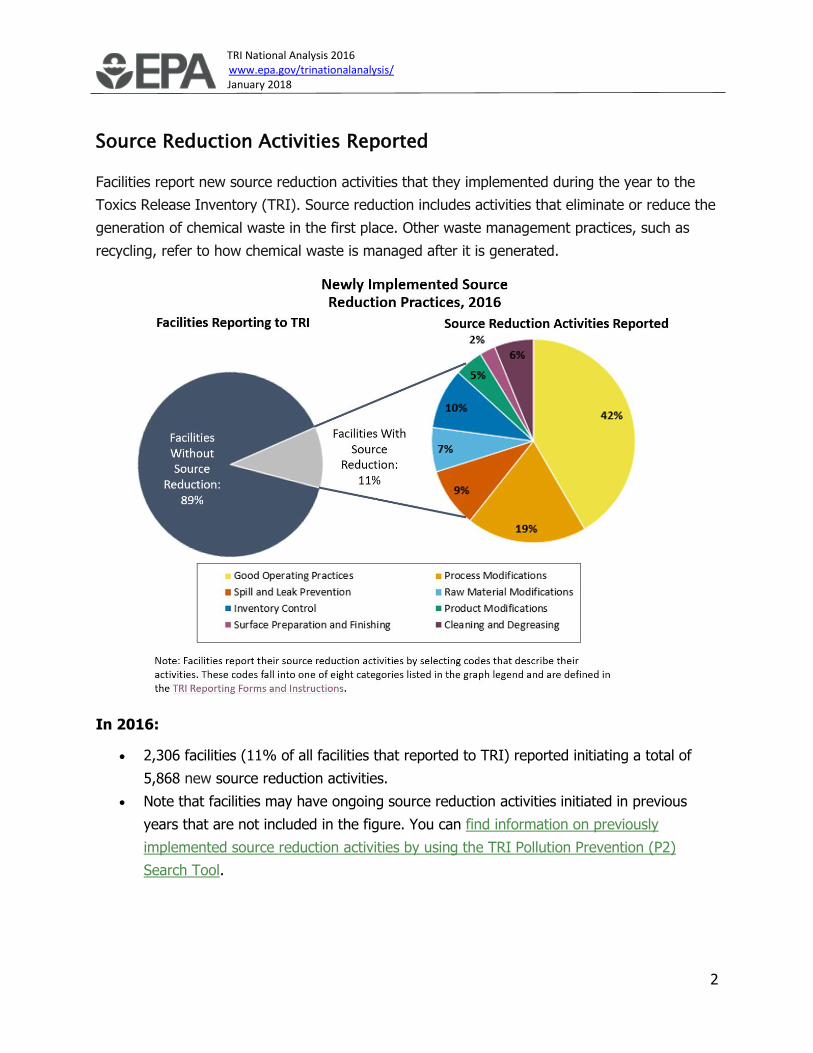
Source Reduction Activities Reported
Facilities report new source reduction activities that they implemented during the year to the
Toxics Release Inventory (TRI). Source reduction includes activities that eliminate or reduce the
generation of chemical waste in the first place. Other waste management practices, such as
recycling, refer to how chemical waste is managed after it is generated.
In 2016:
• 2,306 facilities (11% of all facilities that reported to TRI) reported initiating a total of
5,868 new source reduction activities.
• Note that facilities may have ongoing source reduction activities initiated in previous
years that are not included in the figure. You can find information on previously
implemented source reduction activities by using the TRI Pollution Prevention (P2)
Search Tool.
TRI National Analysis 2016 www.epa.gov/trinationalanalysis/ January 2018
3
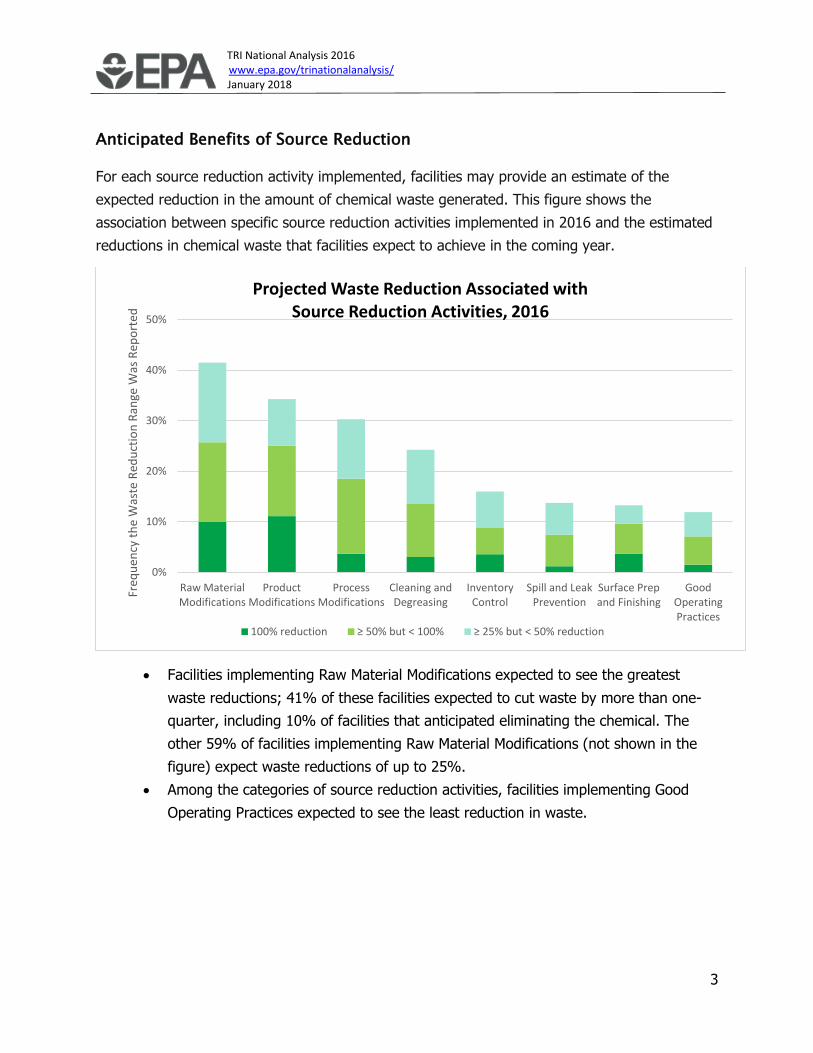
Anticipated Benefits of Source Reduction
For each source reduction activity implemented, facilities may provide an estimate of the
expected reduction in the amount of chemical waste generated. This figure shows the
association between specific source reduction activities implemented in 2016 and the estimated
reductions in chemical waste that facilities expect to achieve in the coming year.
• Facilities implementing Raw Material Modifications expected to see the greatest
waste reductions; 41% of these facilities expected to cut waste by more than one-
quarter, including 10% of facilities that anticipated eliminating the chemical. The
other 59% of facilities implementing Raw Material Modifications (not shown in the
figure) expect waste reductions of up to 25%.
• Among the categories of source reduction activities, facilities implementing Good
Operating Practices expected to see the least reduction in waste.
0%
10%
20%
30%
40%
50%
Raw MaterialModifications
ProductModifications
ProcessModifications
Cleaning andDegreasing
InventoryControl
Spill and LeakPrevention
Surface Prepand Finishing
GoodOperatingPractices
Freq
uen
cy t
he
Was
te R
edu
ctio
n R
ange
Was
Rep
ort
ed
Projected Waste Reduction Associated with Source Reduction Activities, 2016
100% reduction ≥ 50% but < 100% ≥ 25% but < 50% reduction
TRI National Analysis 2016 www.epa.gov/trinationalanalysis/ January 2018
4
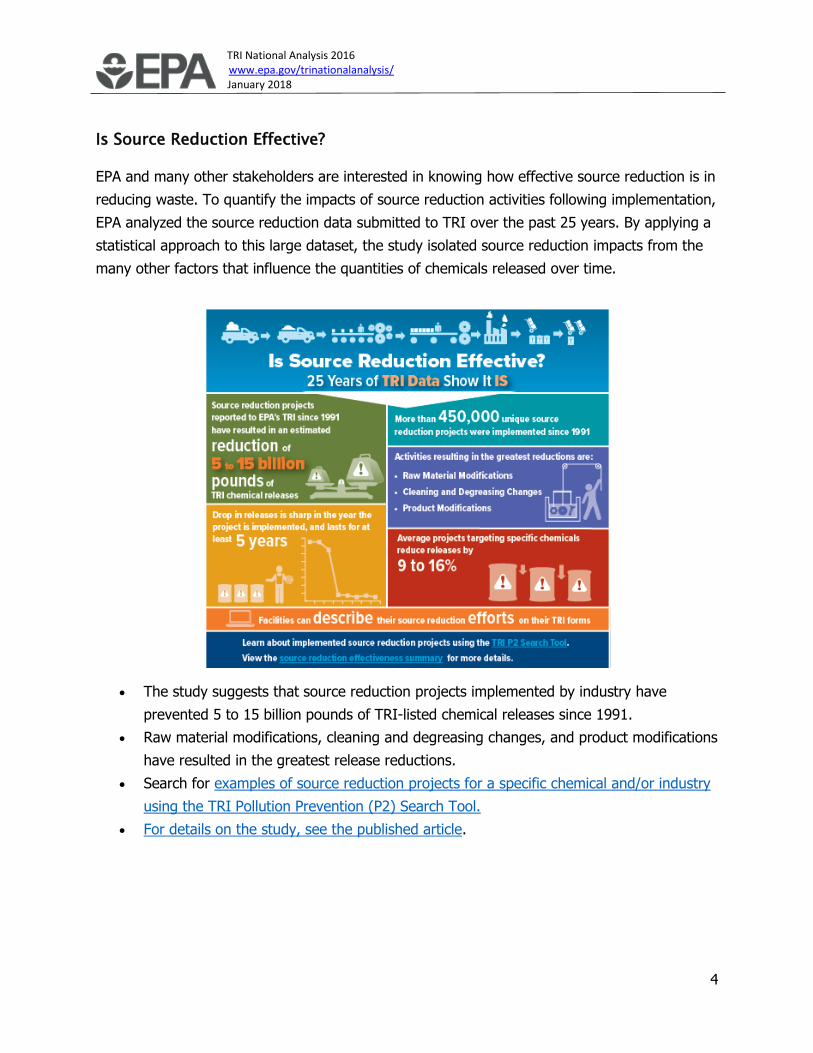
Is Source Reduction Effective?
EPA and many other stakeholders are interested in knowing how effective source reduction is in
reducing waste. To quantify the impacts of source reduction activities following implementation,
EPA analyzed the source reduction data submitted to TRI over the past 25 years. By applying a
statistical approach to this large dataset, the study isolated source reduction impacts from the
many other factors that influence the quantities of chemicals released over time.
• The study suggests that source reduction projects implemented by industry have
prevented 5 to 15 billion pounds of TRI-listed chemical releases since 1991.
• Raw material modifications, cleaning and degreasing changes, and product modifications
have resulted in the greatest release reductions.
• Search for examples of source reduction projects for a specific chemical and/or industry
using the TRI Pollution Prevention (P2) Search Tool.
• For details on the study, see the published article.
TRI National Analysis 2016 www.epa.gov/trinationalanalysis/ January 2018
5
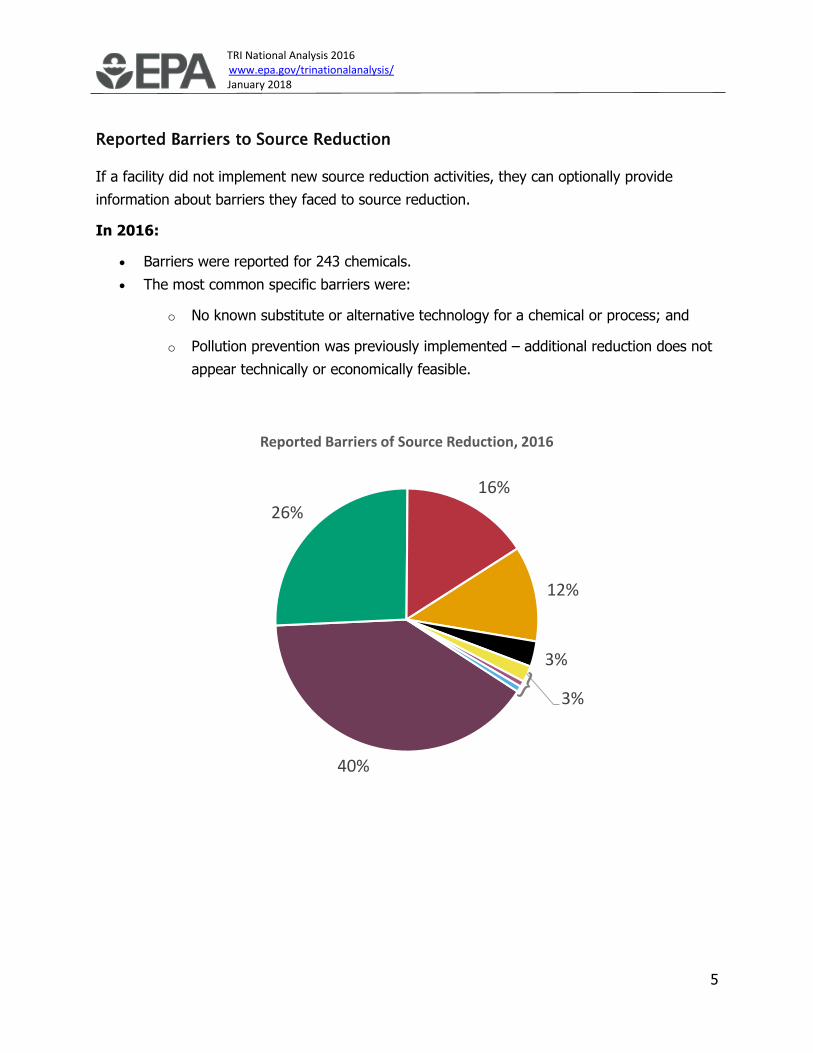
Reported Barriers to Source Reduction
If a facility did not implement new source reduction activities, they can optionally provide
information about barriers they faced to source reduction.
In 2016:
• Barriers were reported for 243 chemicals.
• The most common specific barriers were:
o No known substitute or alternative technology for a chemical or process; and
o Pollution prevention was previously implemented – additional reduction does not
appear technically or economically feasible.
40%
26%
16%
12%
3%
3%
Reported Barriers of Source Reduction, 2016

TRI National Analysis 2016 www.epa.gov/trinationalanalysis/ January 2018
6
To see examples of reported barriers to source reduction, click on the color-coded
legend.
No known substitutes or alternative technologies (41%)
Example:
An explosives manufacturing facility is unable to eliminate lead from the manufacturing
process because lead is an essential constituent in producing delay components for non-
electric and electric. [Click to view facility details in the Pollution Prevention (P2) Tool]
Pollution prevention previously implemented - additional reduction does not
appear technically or economically feasible (16%)
Example:
A pharmaceutical manufacturing facility had previously implemented source reduction
activities to reduce methanol including eliminating the use of methanol in formulations
and changing to dry formulations where possible, but current batches that use methanol
cannot be changed. [Click to view facility details in the P2 Tool]
Concern that product quality may decline as a result of source reduction (12%)
Example:
An organic chemical manufacturing facility utilizes methanol in its cleaning process and
found that other solvents could not be substituted due to product contamination. [Click
to view facility details in the P2 Tool]
Insufficient capital to install new source reduction equipment or implement
new source reduction activities/initiatives (3%)
Example:
A leather, hide tanning, and finishing facility releases chromium compounds. The facility
is exploring new filtration equipment to recycle chrome even though it’s currently too
expensive. [Click to view facility details in the P2 Tool]
Specific regulatory/permit burdens (2%)
Example:
A pharmaceutical facility’s FDA-qualified process determines the amount of phenol
required and therefore the amount of waste generated. [Click to view facility details in
the P2 Tool]
TRI National Analysis 2016 www.epa.gov/trinationalanalysis/ January 2018
7
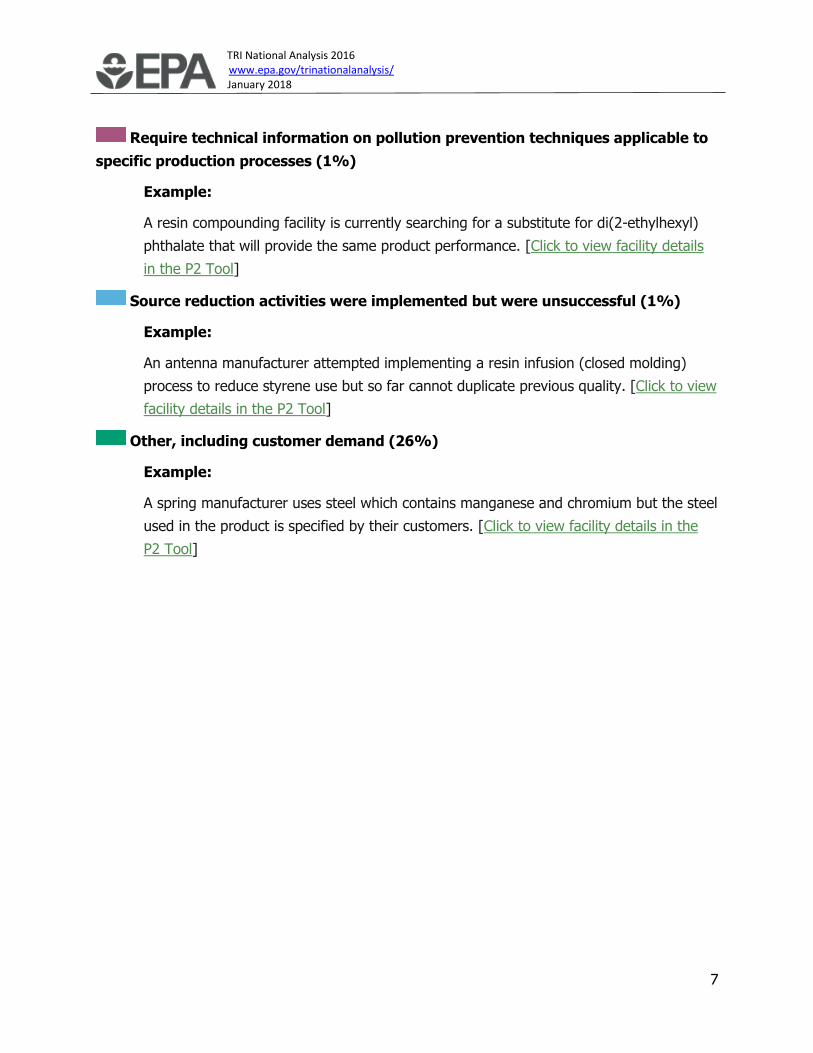
Require technical information on pollution prevention techniques applicable to
specific production processes (1%)
Example:
A resin compounding facility is currently searching for a substitute for di(2-ethylhexyl)
phthalate that will provide the same product performance. [Click to view facility details
in the P2 Tool]
Source reduction activities were implemented but were unsuccessful (1%)
Example:
An antenna manufacturer attempted implementing a resin infusion (closed molding)
process to reduce styrene use but so far cannot duplicate previous quality. [Click to view
facility details in the P2 Tool]
Other, including customer demand (26%)
Example:
A spring manufacturer uses steel which contains manganese and chromium but the steel
used in the product is specified by their customers. [Click to view facility details in the
P2 Tool]

TRI National Analysis 2016 www.epa.gov/trinationalanalysis/ January 2018
8
Source Reduction Activities by Chemical
For the chemicals with the highest source reduction reporting rates over the last 5 years, this
figure shows the types of activities implemented, and the percent change in the quantity of
waste managed.
From 2012 to 2016:
• Chemicals with the highest source reduction reporting rate were: antimony, N-methyl-2-
pyrrolidone, dichloromethane (DCM, also known as methylene chloride),
trichloroethylene, and di(2-ethylhexyl) phthalate.
• The type of source reduction activity implemented for these chemicals varies depending
on their use in industrial operations and the chemical’s characteristics. For example:
o Raw material modification is commonly reported as a source reduction
activity to reduce waste of di (2-ethylhexyl) phthalate (DEHP), a plasticizer,
and antimony compounds, used in electronics, batteries, and as a component of

TRI National Analysis 2016 www.epa.gov/trinationalanalysis/ January 2018
9
fire retardants. Many facilities report that they are replacing these chemicals with
environmentally preferable alternatives.
o Cleaning and degreasing, including changing to aqueous cleaners, is
implemented for common industrial solvents such
as trichloroethylene (TCE), dichloromethane (DCM, also known as methylene
chloride), and N-methyl-2-pyrrolidone (NMP).
• The quantity of waste managed over the last 5 years decreased considerably for DCM
and DEHP. For the other chemicals shown in the figure, waste quantities have increased.
While quantities of waste managed overall increased by 18% over this post-recession
time period, the increases in quantities of antimony, NMP, and TCE waste managed
exceeded this average increase. Use of NMP expanded in recent years as a substitute for
chlorinated solvents such as DCM.
Facilities may also report additional details to TRI about their source reduction, recycling, or
pollution control activities.
Examples of additional pollution prevention-related information for 2016:
• N-methyl-2-pyrrolidone: A semiconductor manufacturer replaced N-methyl-2-pyrrolidone
with de-ionized water for the cleaning processes of certain tools. [Click to view facility
details in the Pollution Prevention (P2) Tool]
• Dichloromethane: A maintenance products manufacturer is phasing out the use of
dichloromethane as a solvent, reducing its use by 64% in 2016. [Click to view facility
details in the P2 Tool]
• Trichloroethylene: A precision machining facility started using a vacuum vapor
degreasing system which will eliminate the use of trichloroethylene as a solvent. [Click
to view facility details in the P2 Tool]
• Di (2-ethylhexyl) phthalate: A rubber product manufacturer has been replacing di(2-
ethylhexyl) phthalate with a new chemical in existing formulations, and excluding the
chemical from use in new formulations. [Click to view facility details in the P2 Tool]
• Antimony Compounds: A resins manufacturer changed from using antimony trioxide
powder to propylene pellets with antimony trioxide incorporated into the pellet resulting
in less waste than the powder. [Click to view facility details in the P2 Tool]
You can compare facilities’ waste management methods and trends for any TRI chemical by
using the TRI P2 Search Tool.
TRI National Analysis 2016 www.epa.gov/trinationalanalysis/ January 2018
10
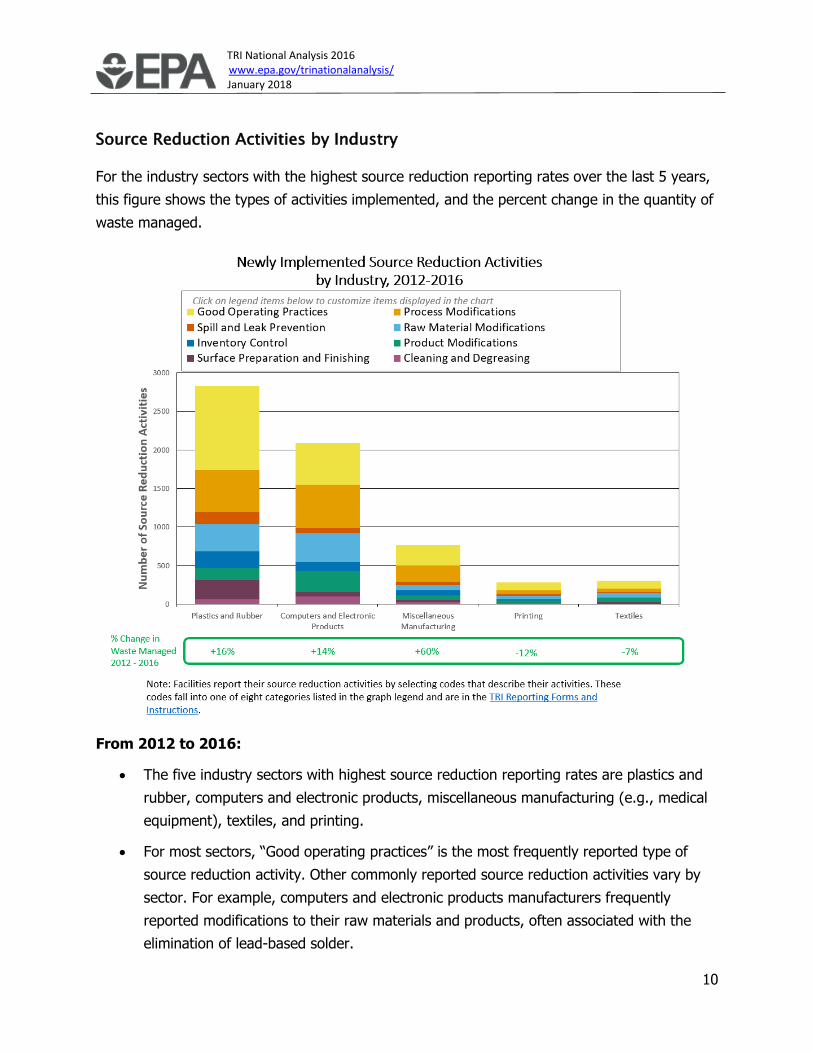
Source Reduction Activities by Industry
For the industry sectors with the highest source reduction reporting rates over the last 5 years,
this figure shows the types of activities implemented, and the percent change in the quantity of
waste managed.
From 2012 to 2016:
• The five industry sectors with highest source reduction reporting rates are plastics and
rubber, computers and electronic products, miscellaneous manufacturing (e.g., medical
equipment), textiles, and printing.
• For most sectors, “Good operating practices” is the most frequently reported type of
source reduction activity. Other commonly reported source reduction activities vary by
sector. For example, computers and electronic products manufacturers frequently
reported modifications to their raw materials and products, often associated with the
elimination of lead-based solder.
TRI National Analysis 2016 www.epa.gov/trinationalanalysis/ January 2018
11
• Facilities may also report additional details to TRI about their source reduction,
recycling, or pollution control activities.
Examples of additional pollution prevention-related information for 2016
• Plastics and Rubber: A garden tools manufacturer improved the recovery process for
scrap hose from 50% recovery (by weight) to 75%. [Click to view facility details in the
Pollution Prevention (P2) Tool]
• Computers and Electronic Products: A printed circuit board assembly facility designs
most new products as lead-free assemblies reducing the overall use of lead. [Click to
view facility details in the P2 Tool]
• Miscellaneous Manufacturing: A medical instrument manufacturer began using
chemical totes rather than drums to minimize generation of empty containers for
disposal. [Click to view facility details in the P2 Tool]
• Textiles: A fabric coating manufacturer minimized adhesive usage while maintaining
good adhesion and flame test results to reduce the amount of antimony in waste [Click
to view facility details in the P2 Tool]
• Printing: A printer reduced glycol ether air emissions by replacing one solvent based
ink containing 90% glycol ether compounds with a UV ink containing little or no glycol
ethers. [Click to view facility details in the P2 Tool]
You can view all reported pollution prevention activities and compare facilities’ waste
management methods and trends for any TRI chemical by using the TRI P2 Search Tool.
TRI National Analysis 2016 www.epa.gov/trinationalanalysis/ January 2018
12
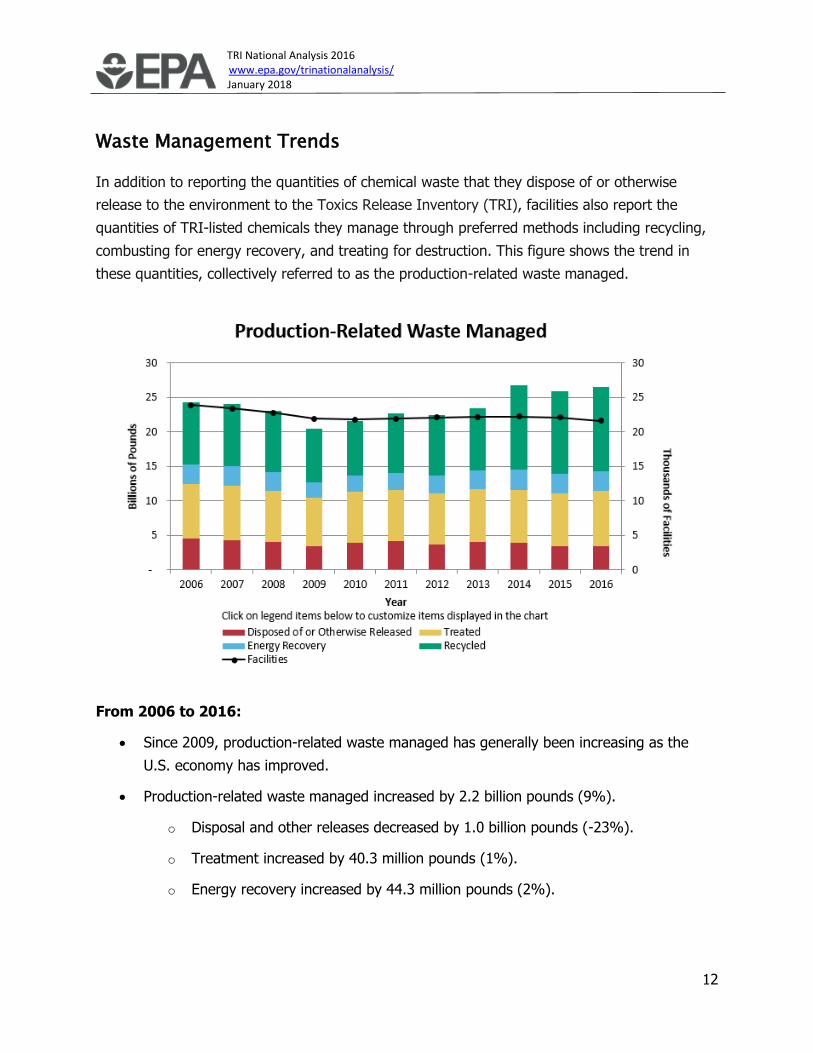
Waste Management Trends
In addition to reporting the quantities of chemical waste that they dispose of or otherwise
release to the environment to the Toxics Release Inventory (TRI), facilities also report the
quantities of TRI-listed chemicals they manage through preferred methods including recycling,
combusting for energy recovery, and treating for destruction. This figure shows the trend in
these quantities, collectively referred to as the production-related waste managed.
From 2006 to 2016:
• Since 2009, production-related waste managed has generally been increasing as the
U.S. economy has improved.
• Production-related waste managed increased by 2.2 billion pounds (9%).
o Disposal and other releases decreased by 1.0 billion pounds (-23%).
o Treatment increased by 40.3 million pounds (1%).
o Energy recovery increased by 44.3 million pounds (2%).
TRI National Analysis 2016 www.epa.gov/trinationalanalysis/ January 2018
13
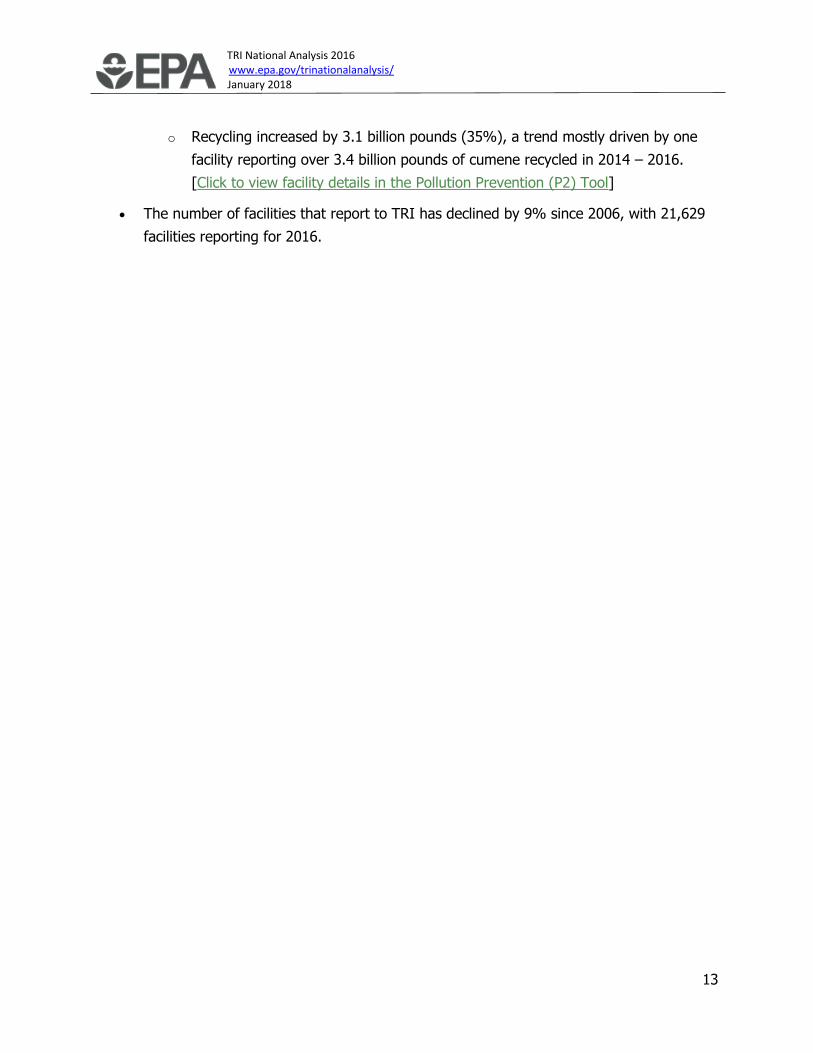
o Recycling increased by 3.1 billion pounds (35%), a trend mostly driven by one
facility reporting over 3.4 billion pounds of cumene recycled in 2014 – 2016.
[Click to view facility details in the Pollution Prevention (P2) Tool]
• The number of facilities that report to TRI has declined by 9% since 2006, with 21,629
facilities reporting for 2016.
TRI National Analysis 2016 www.epa.gov/trinationalanalysis/ January 2018
14
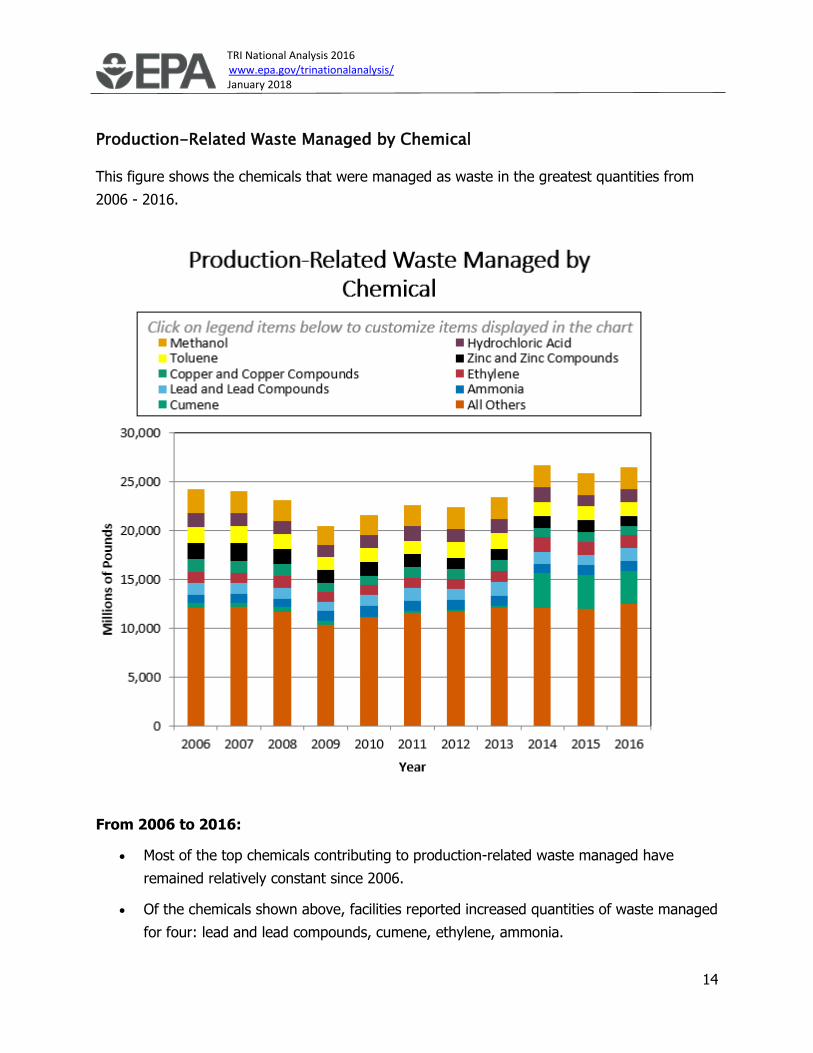
Production-Related Waste Managed by Chemical
This figure shows the chemicals that were managed as waste in the greatest quantities from
2006 - 2016.
From 2006 to 2016:
• Most of the top chemicals contributing to production-related waste managed have
remained relatively constant since 2006.
• Of the chemicals shown above, facilities reported increased quantities of waste managed
for four: lead and lead compounds, cumene, ethylene, ammonia.
TRI National Analysis 2016 www.epa.gov/trinationalanalysis/ January 2018
15
o Production-related waste of lead and lead compounds increased by 19%.
o Cumene increased six-fold, mostly driven by one facility reporting over 3.4 billion
pounds of cumene recycled in 2014 – 2016. [Click to view facility details in the
Pollution Prevention (P2) Tool]
o Ethylene increased by 17% and ammonia increased by 10%.
From 2015 to 2016:
• Facilities reported the greatest decreases in overall waste quantities for these chemicals:
o Zinc and zinc compounds, decreased by 114 million pounds (-10%)
o Copper and copper compounds, decreased by 94 million pounds (-9%)
• Lead and lead compounds, increased by 316 million pounds (30%)
TRI National Analysis 2016 www.epa.gov/trinationalanalysis/ January 2018
16
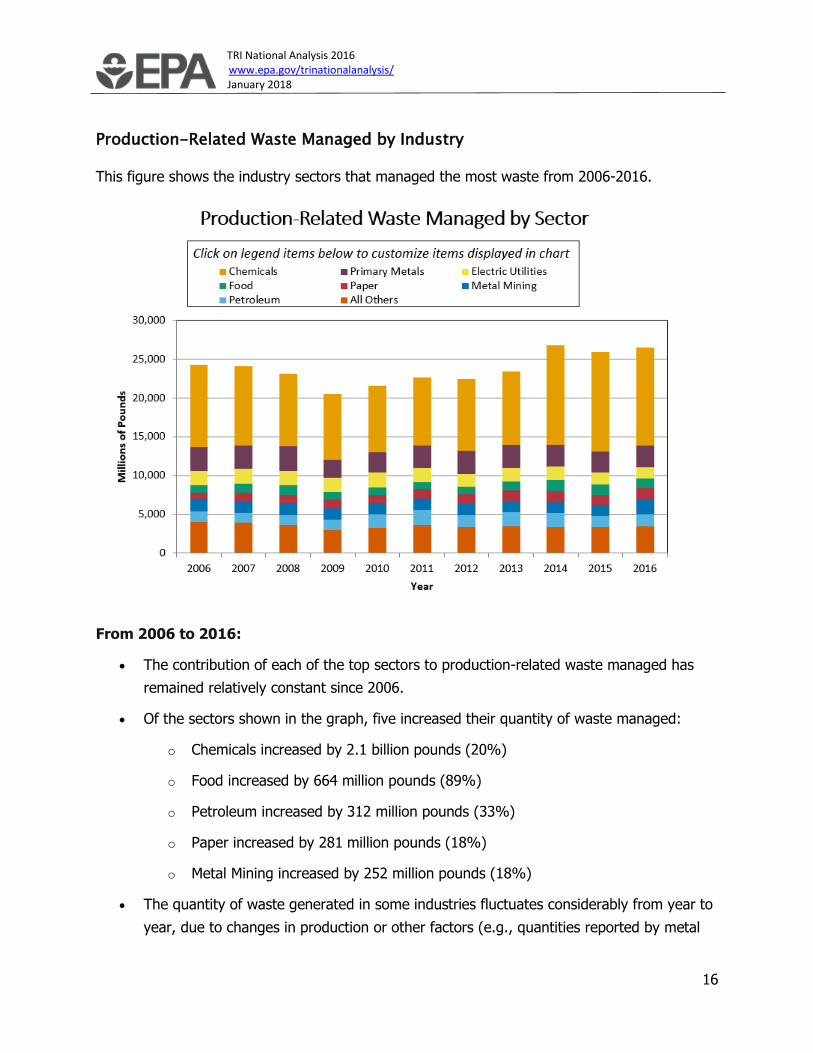
Production-Related Waste Managed by Industry
This figure shows the industry sectors that managed the most waste from 2006-2016.
From 2006 to 2016:
• The contribution of each of the top sectors to production-related waste managed has
remained relatively constant since 2006.
• Of the sectors shown in the graph, five increased their quantity of waste managed:
o Chemicals increased by 2.1 billion pounds (20%)
o Food increased by 664 million pounds (89%)
o Petroleum increased by 312 million pounds (33%)
o Paper increased by 281 million pounds (18%)
o Metal Mining increased by 252 million pounds (18%)
• The quantity of waste generated in some industries fluctuates considerably from year to
year, due to changes in production or other factors (e.g., quantities reported by metal

TRI National Analysis 2016 www.epa.gov/trinationalanalysis/ January 2018
17
mining facilities can change significantly based on changes in the composition of waste
rock).
From 2015 to 2016:
• Industry sectors with the greatest reported changes in overall waste quantities are:
o Paper increased by 521 million pounds (38%)
o Metal Mining increased by 248 million pounds (18%)
TRI National Analysis 2016 www.epa.gov/trinationalanalysis/ January 2018
18
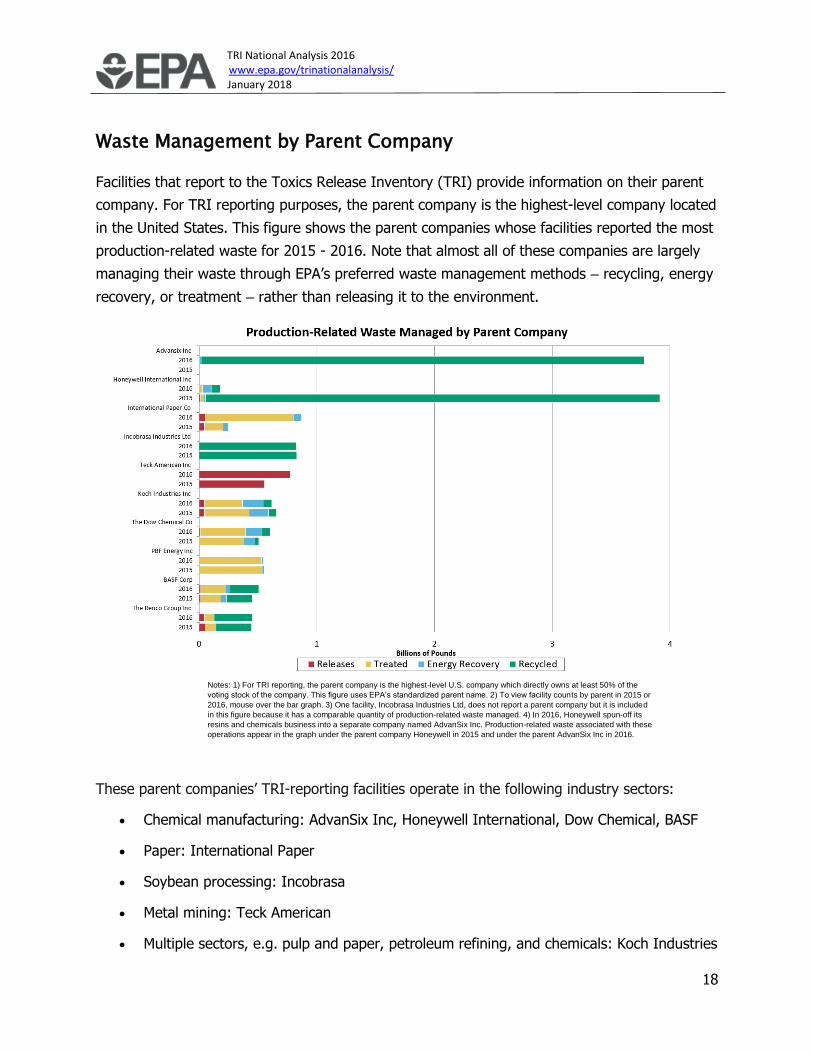
Waste Management by Parent Company
Facilities that report to the Toxics Release Inventory (TRI) provide information on their parent
company. For TRI reporting purposes, the parent company is the highest-level company located
in the United States. This figure shows the parent companies whose facilities reported the most
production-related waste for 2015 - 2016. Note that almost all of these companies are largely
managing their waste through EPA’s preferred waste management methods – recycling, energy
recovery, or treatment – rather than releasing it to the environment.
These parent companies’ TRI-reporting facilities operate in the following industry sectors:
• Chemical manufacturing: AdvanSix Inc, Honeywell International, Dow Chemical, BASF
• Paper: International Paper
• Soybean processing: Incobrasa
• Metal mining: Teck American
• Multiple sectors, e.g. pulp and paper, petroleum refining, and chemicals: Koch Industries
Notes: 1) For TRI reporting, the parent company is the highest-level U.S. company which directly owns at least 50% of the
voting stock of the company. This figure uses EPA’s standardized parent name. 2) To view facility counts by parent in 2015 or
2016, mouse over the bar graph. 3) One facility, Incobrasa Industries Ltd, does not report a parent company but it is included
in this figure because it has a comparable quantity of production-related waste managed. 4) In 2016, Honeywell spun-off its
resins and chemicals business into a separate company named AdvanSix Inc. Production-related waste associated with these
operations appear in the graph under the parent company Honeywell in 2015 and under the parent AdvanSix Inc in 2016.

TRI National Analysis 2016 www.epa.gov/trinationalanalysis/ January 2018
19
• Petroleum refining: PBF Energy
• Metal Smelting: The Renco Group
The quantity reported by AdvanSix for 2016 can be ascribed primarily to cumene recycling at a
facility that was owned by Honeywell International in 2015. This facility uses cumene as a
feedstock to manufacture phenol, a widely used TRI-covered chemical that is produced in very
large quantities. This facility is among the largest manufacturers of phenol in North America and
has implemented a number of steps to increase its recovery and recycling of cumene.
Most of these top parent companies reported implementing one or more new source reduction
activities in 2016. Some of these companies also reported additional (optional) information to
TRI about their pollution prevention or waste management activities.
Examples of additional pollution prevention-related information for 2016:
• An International Paper facility implemented a comprehensive chemical screening
program for new products purchased or used on the site to help minimize or eliminate
the use of lead and other PBTs when suitable alternatives are available. [Click to view
facility details in the Pollution Prevention (P2) Tool]
• A Dow Chemical facility instituted a clearinghouse to exchange materials that would
otherwise be discarded and utilizes a program to allow employees to take product that
would otherwise be discarded to minimize the release of diisocyanates. [Click to view
facility details in the P2 Tool]
To conduct a similar type of parent company comparison for a given sector, chemical, or
geographic location, use the TRI P2 Search Tool.
TRI National Analysis 2016 www.epa.gov/trinationalanalysis/ January 2018
20
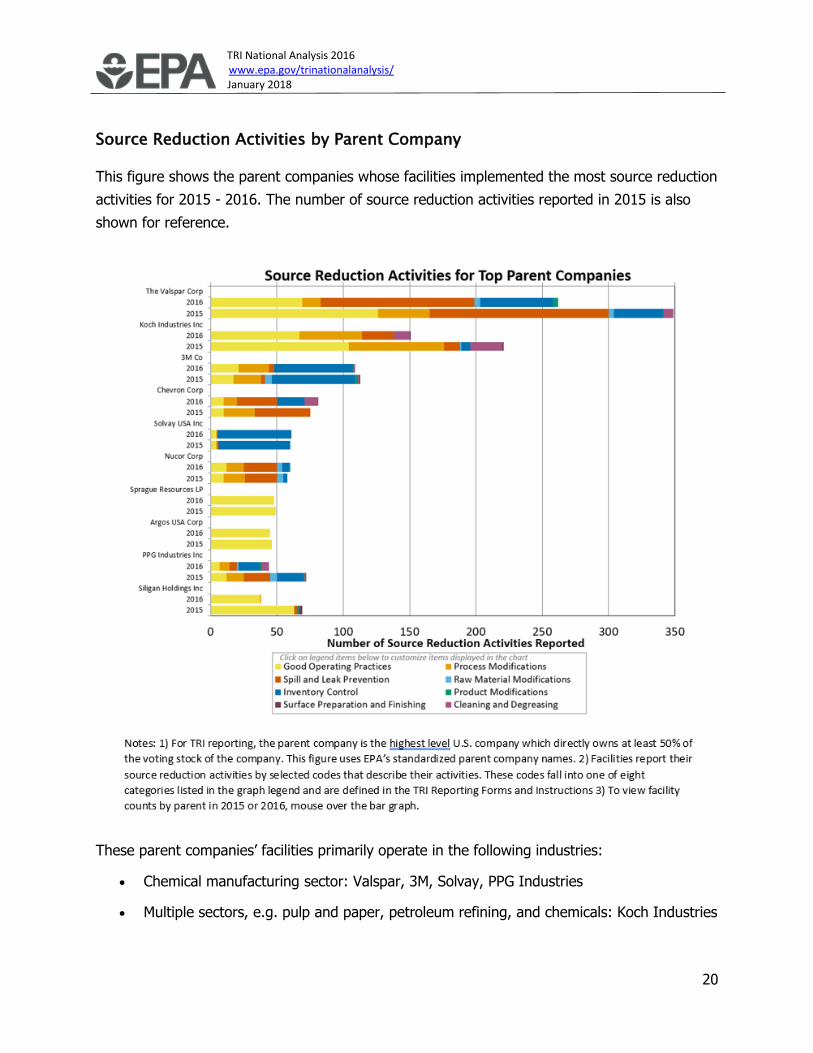
Source Reduction Activities by Parent Company
This figure shows the parent companies whose facilities implemented the most source reduction
activities for 2015 - 2016. The number of source reduction activities reported in 2015 is also
shown for reference.
These parent companies’ facilities primarily operate in the following industries:
• Chemical manufacturing sector: Valspar, 3M, Solvay, PPG Industries
• Multiple sectors, e.g. pulp and paper, petroleum refining, and chemicals: Koch Industries
TRI National Analysis 2016 www.epa.gov/trinationalanalysis/ January 2018
21
• Multiple petroleum-related sectors, e.g. petroleum refining, bulk petroleum, chemicals:
Chevron
• Steel manufacturing: Nucor
• Bulk petroleum industry (store and distribute crude petroleum and petroleum products):
Sprague Resources
• Cement manufacturing: Argos
• Metal containers: Silgan Holdings
Good operating practices, such as improving maintenance scheduling and installation of quality
monitoring systems, are the most commonly reported types of source reduction activities for
these parent companies. Spill and leak prevention and process modifications are also commonly
reported.
Some of these parent companies submitted additional text to EPA with their TRI reports
describing their pollution prevention or waste management activities.
Examples of additional pollution prevention-related information for 2016:
• A 3M facility reduced releases of numerous chemicals by sequencing changeovers to
reduce the need to perform a clean-up. This reduces the amount of cleaning solution
used in the processes as well as waste generated. More processes in the plant have
started using this technique. [Click to view facility details in the Pollution Prevention (P2)
Tool]
• A Koch Industries paperboard facility modified a recovery boiler from bark burning to
natural gas and no longer burns bark at the facility. [Click to view facility details in the
P2 Tool]
• PPG Industries chemists are reformulating products to eliminate lead. The process will
take multiple years as customers will need to approve the changes. [Click to view facility
details in the P2 Tool]
You can find P2 activities reported by a specific parent company and compare facilities’ waste
management methods and trends for any TRI chemical by using the TRI P2 Search Tool.
TRI National Analysis 2016 www.epa.gov/trinationalanalysis/ January 2018
22
Transfers Off-site for Waste Management
Toxics Release Inventory (TRI) facilities report the quantities of chemicals that they transfer off-
site for waste management. Chemicals may be sent off-site for treatment, recycling, energy
recover, or disposal. Use the interactive tool to explore where TRI chemicals in waste were sent
in 2016, and explore off-site transfers for any chemical or sector of interest.

TRI National Analysis 2016 www.epa.gov/trinationalanalysis/ January 2018
1
Releases of Chemicals
Disposal or other releases of Toxics Release Inventory (TRI) chemicals into the environment
occur in several ways. Chemicals may be disposed of on a facility’s property by being released
to the air, water or land. Facilities may also ship (transfer) wastes that contain TRI chemicals to
an off-site location for treatment or disposal. Note that most disposal or other release practices
are subject to a variety of regulatory requirements designed to minimize potential harm to
human health and the environment. To learn more about what EPA is doing to help limit the
release of TRI chemicals to the environment, see EPA's laws and regulations webpage.
Evaluating releases of TRI-listed chemicals can help identify potential concerns and gain a
better understanding of potential risks that may be posed by the releases. This evaluation can
also help identify priorities and opportunities for government and communities to work with
industry to reduce chemical releases and potential associated risks. However, it is important to
consider that the quantity of releases is not an indicator of potential health impacts posed by
the chemicals. Human health risks resulting from exposure to TRI chemicals are governed by
many factors, as discussed further in the Hazard and Potential
Risk of TRI Chemicals section.
Many factors can affect trends in releases at facilities, including
production rates, management practices, the composition of raw
materials used, and the installation of control technologies.
The following graph shows the disposal or other releases of TRI
chemicals, including on-site disposal to land, water, and air,
and off-site transfers for disposal.
Helpful Concepts
What is a release?
In the context of TRI, a “release”
of a chemical generally refers to a
chemical that is emitted to the air,
discharged to water, or placed in
some type of land disposal unit.
TRI National Analysis 2016 www.epa.gov/trinationalanalysis/ January 2018
2
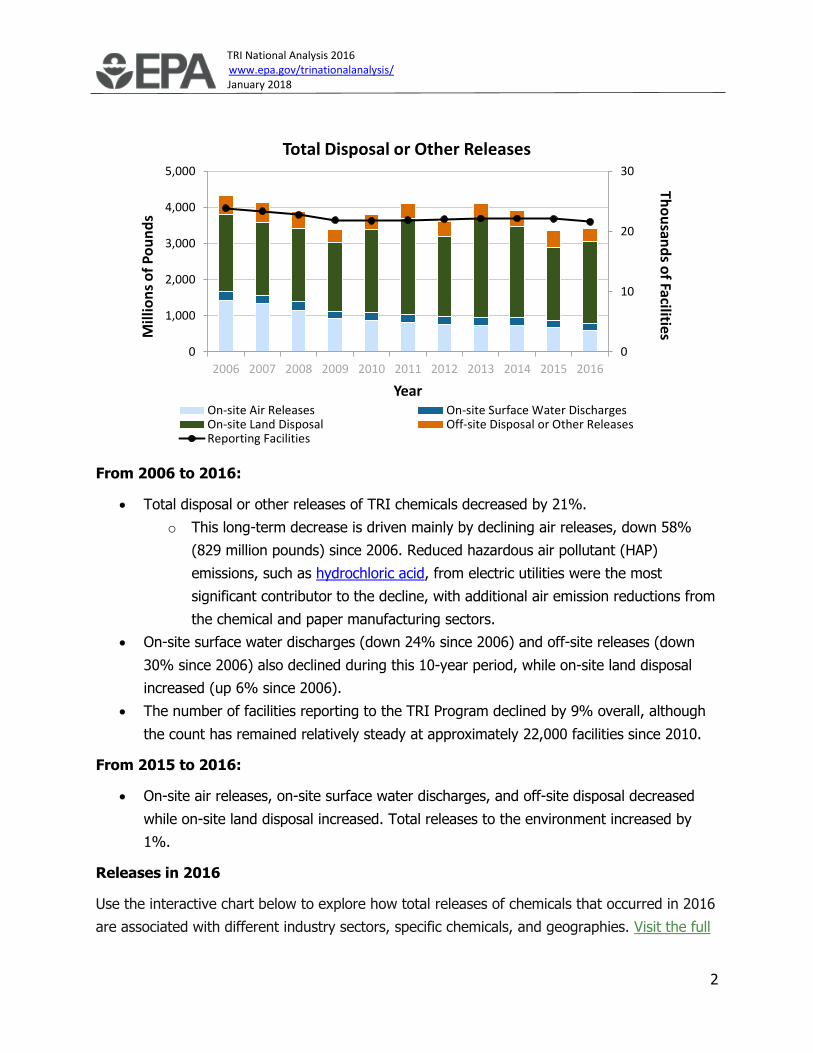
From 2006 to 2016:
• Total disposal or other releases of TRI chemicals decreased by 21%.
o This long-term decrease is driven mainly by declining air releases, down 58%
(829 million pounds) since 2006. Reduced hazardous air pollutant (HAP)
emissions, such as hydrochloric acid, from electric utilities were the most
significant contributor to the decline, with additional air emission reductions from
the chemical and paper manufacturing sectors.
• On-site surface water discharges (down 24% since 2006) and off-site releases (down
30% since 2006) also declined during this 10-year period, while on-site land disposal
increased (up 6% since 2006).
• The number of facilities reporting to the TRI Program declined by 9% overall, although
the count has remained relatively steady at approximately 22,000 facilities since 2010.
From 2015 to 2016:
• On-site air releases, on-site surface water discharges, and off-site disposal decreased
while on-site land disposal increased. Total releases to the environment increased by
1%.
Releases in 2016
Use the interactive chart below to explore how total releases of chemicals that occurred in 2016
are associated with different industry sectors, specific chemicals, and geographies. Visit the full
0
10
20
30
0
1,000
2,000
3,000
4,000
5,000
2006 2007 2008 2009 2010 2011 2012 2013 2014 2015 2016
Tho
usan
ds o
f FacilitiesMill
ion
s o
f P
ou
nd
s
Year
Total Disposal or Other Releases
On-site Air Releases On-site Surface Water DischargesOn-site Land Disposal Off-site Disposal or Other ReleasesReporting Facilities
TRI National Analysis 2016 www.epa.gov/trinationalanalysis/ January 2018
3
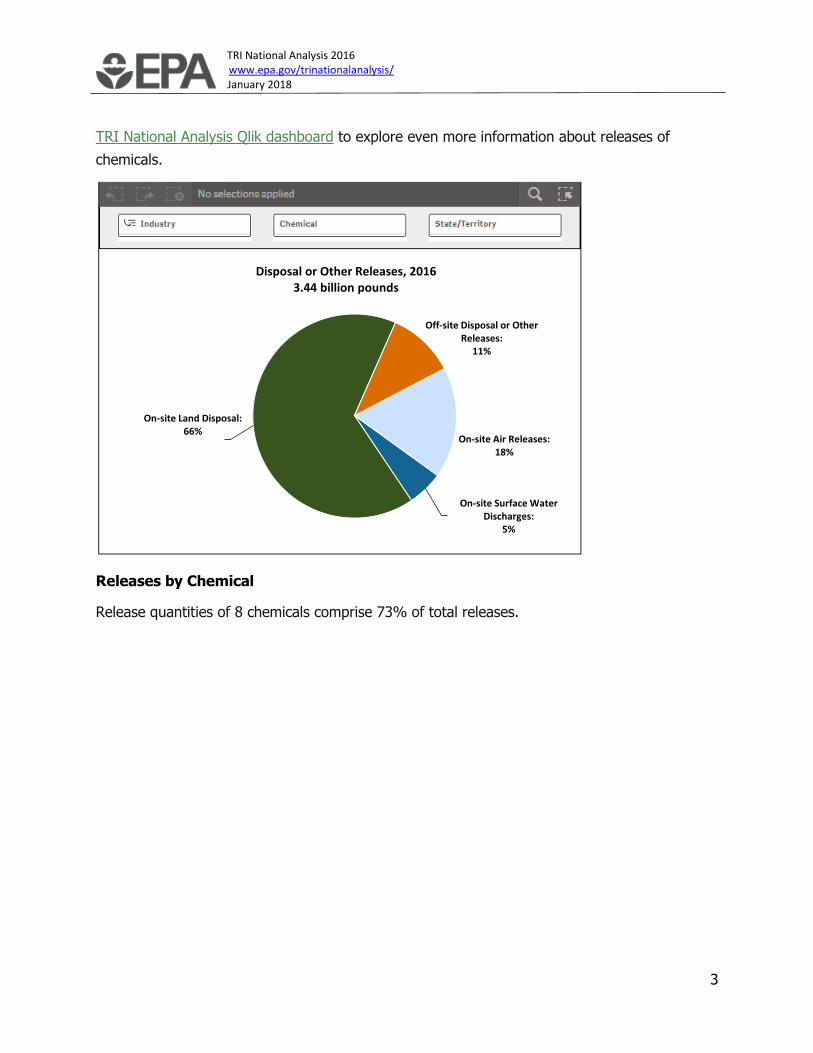
TRI National Analysis Qlik dashboard to explore even more information about releases of
chemicals.
Releases by Chemical
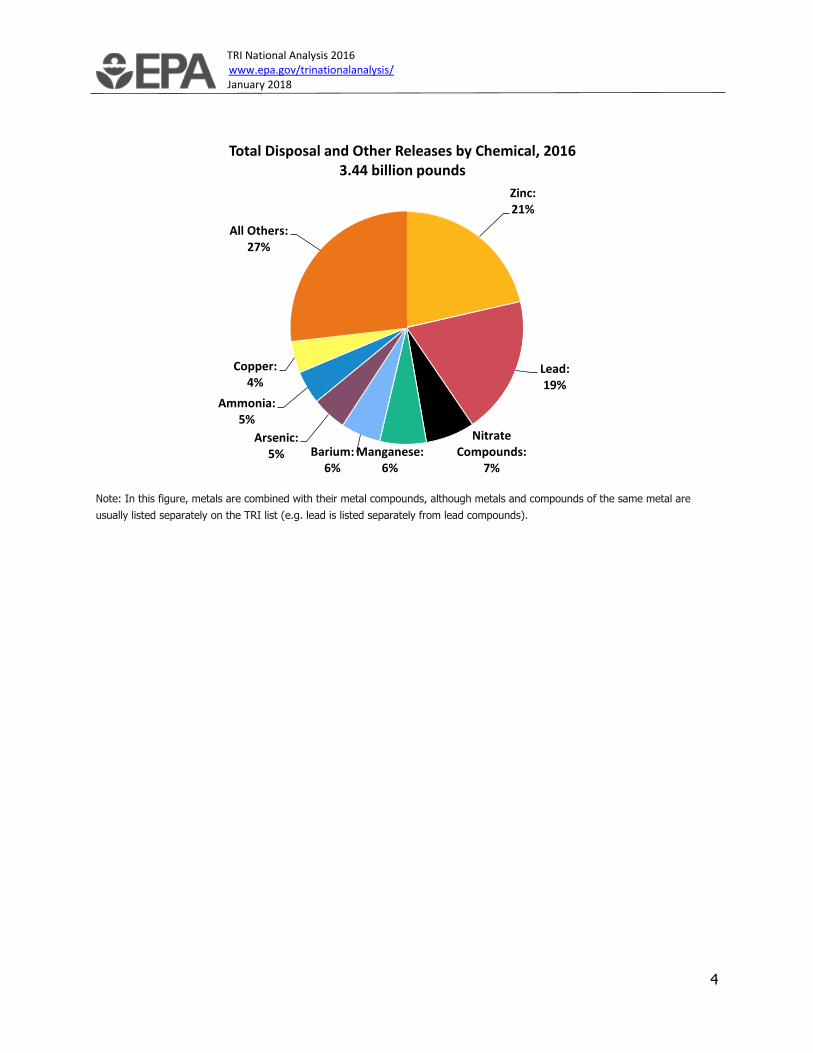
Release quantities of 8 chemicals comprise 73% of total releases.
On-site Air Releases: 18%
On-site Surface Water Discharges:
5%
On-site Land Disposal: 66%
Off-site Disposal or Other Releases:
11%
Disposal or Other Releases, 20163.44 billion pounds
TRI National Analysis 2016 www.epa.gov/trinationalanalysis/ January 2018
4
Note: In this figure, metals are combined with their metal compounds, although metals and compounds of the same metal are
usually listed separately on the TRI list (e.g. lead is listed separately from lead compounds).
Zinc:21%
Lead:19%
Nitrate Compounds:
7%Manganese:
6%Barium:
6%
Arsenic:5%
Ammonia:5%
Copper:4%
All Others:27%
Total Disposal and Other Releases by Chemical, 20163.44 billion pounds
TRI National Analysis 2016 www.epa.gov/trinationalanalysis/ January 2018
5
Releases by Industry
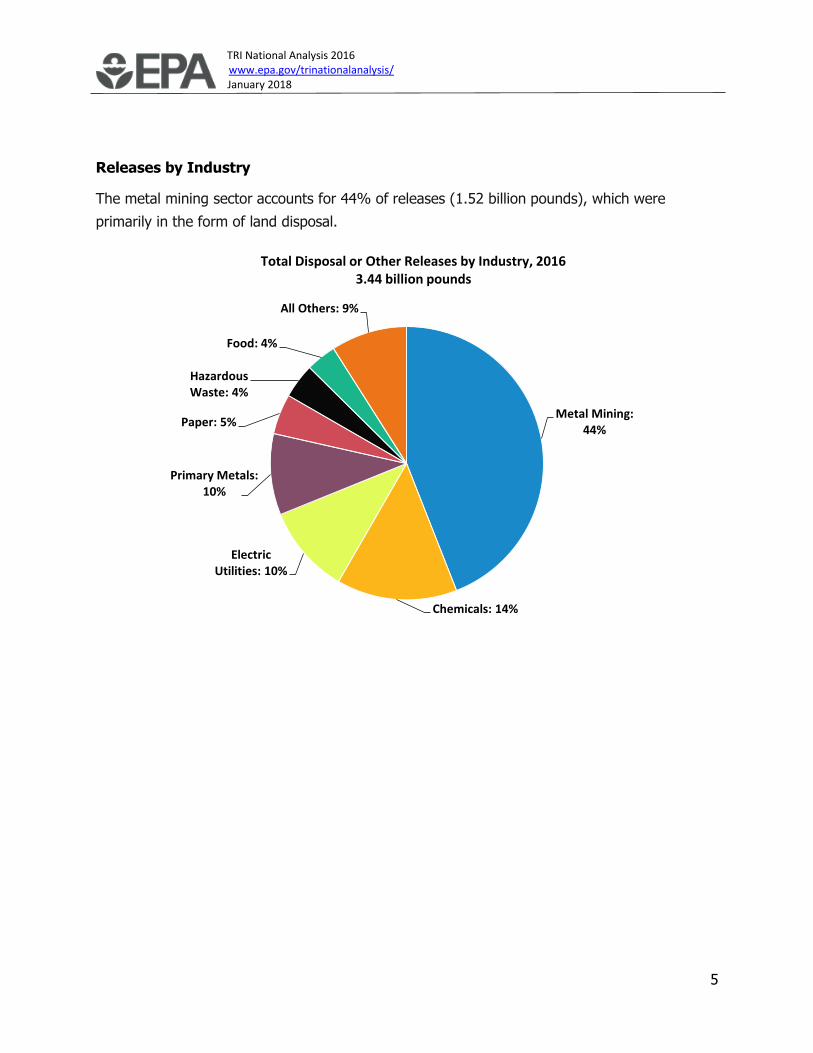
The metal mining sector accounts for 44% of releases (1.52 billion pounds), which were
primarily in the form of land disposal.
Metal Mining:44%
Chemicals: 14%
Electric Utilities: 10%
Primary Metals:10%
Paper: 5%
Hazardous Waste: 4%
Food: 4%
All Others: 9%
Total Disposal or Other Releases by Industry, 20163.44 billion pounds
TRI National Analysis 2016 www.epa.gov/trinationalanalysis/ January 2018
6
Hazard and Potential Risk of TRI Chemicals
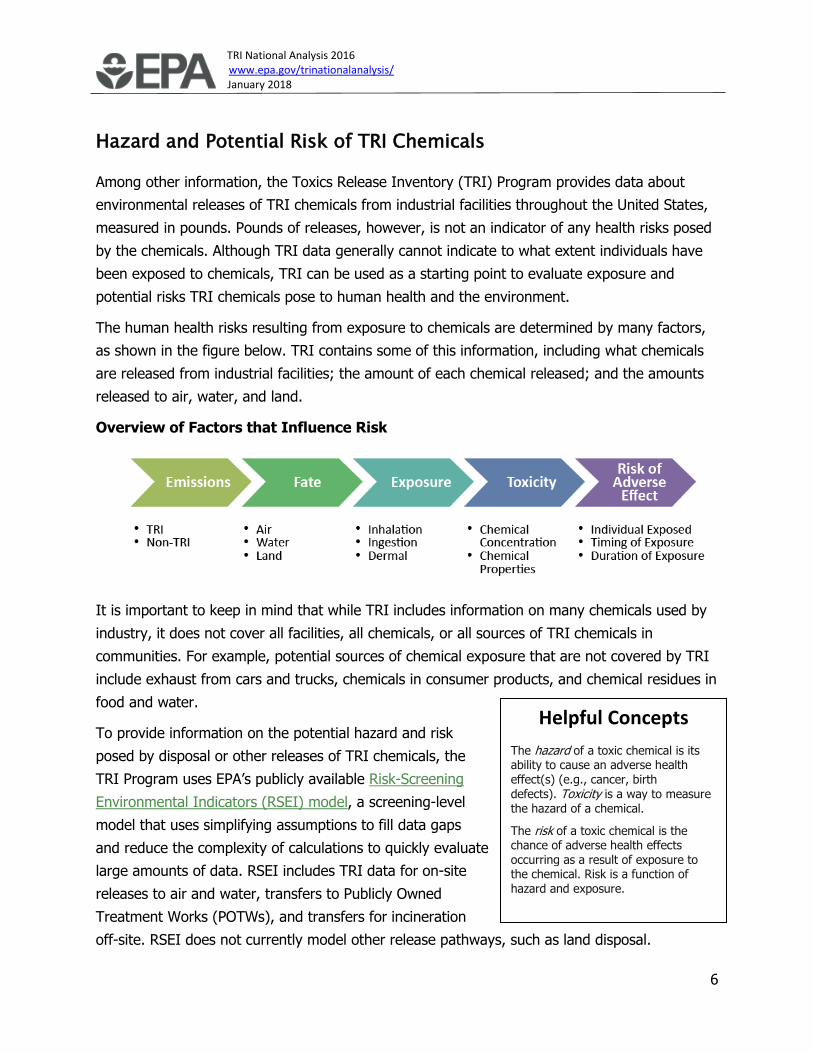
Among other information, the Toxics Release Inventory (TRI) Program provides data about
environmental releases of TRI chemicals from industrial facilities throughout the United States,
measured in pounds. Pounds of releases, however, is not an indicator of any health risks posed
by the chemicals. Although TRI data generally cannot indicate to what extent individuals have
been exposed to chemicals, TRI can be used as a starting point to evaluate exposure and
potential risks TRI chemicals pose to human health and the environment.
The human health risks resulting from exposure to chemicals are determined by many factors,
as shown in the figure below. TRI contains some of this information, including what chemicals
are released from industrial facilities; the amount of each chemical released; and the amounts
released to air, water, and land.
Overview of Factors that Influence Risk
It is important to keep in mind that while TRI includes information on many chemicals used by
industry, it does not cover all facilities, all chemicals, or all sources of TRI chemicals in
communities. For example, potential sources of chemical exposure that are not covered by TRI
include exhaust from cars and trucks, chemicals in consumer products, and chemical residues in
food and water.
To provide information on the potential hazard and risk
posed by disposal or other releases of TRI chemicals, the
TRI Program uses EPA’s publicly available Risk-Screening
Environmental Indicators (RSEI) model, a screening-level
model that uses simplifying assumptions to fill data gaps
and reduce the complexity of calculations to quickly evaluate
large amounts of data. RSEI includes TRI data for on-site
releases to air and water, transfers to Publicly Owned
Treatment Works (POTWs), and transfers for incineration
off-site. RSEI does not currently model other release pathways, such as land disposal.
Helpful Concepts
The hazard of a toxic chemical is its ability to cause an adverse health effect(s) (e.g., cancer, birth defects). Toxicity is a way to measure the hazard of a chemical.
The risk of a toxic chemical is the chance of adverse health effects
occurring as a result of exposure to the chemical. Risk is a function of hazard and exposure.
TRI National Analysis 2016 www.epa.gov/trinationalanalysis/ January 2018
7
RSEI produces hazard estimates and unitless risk “scores,” which represent relative chronic
human health risk. Each type of result can be compared to other results of the same type.
• RSEI hazard estimates consist of the pounds
released multiplied by the chemical's toxicity
weight. They do not include any exposure
modeling or population estimates.
• RSEI risk scores are estimates of potential
human risk based on pathway-specific modeling
of chemical concentrations at specific points in
the environment, such as in the air around a
facility or in the water downstream from a
facility.
Note that the RSEI model should only be used for screening-level activities such as trend
analyses that compare potential relative risk from year to year, or ranking and prioritization of
chemicals or industry sectors for strategic planning. RSEI does not provide a formal risk
assessment, which typically requires site-specific information, more refined exposure
information, and detailed population distributions.
RSEI: Risk-Screening
Environmental
Indictors
RSEI results consider more than just chemical quantities released.
• RSEI hazard results also consider: o Toxicity of the chemical
• RSEI scores also consider: o Location of releases o Toxicity of the chemical o Fate and transport o Human exposure pathway
TRI National Analysis 2016 www.epa.gov/trinationalanalysis/ January 2018
8
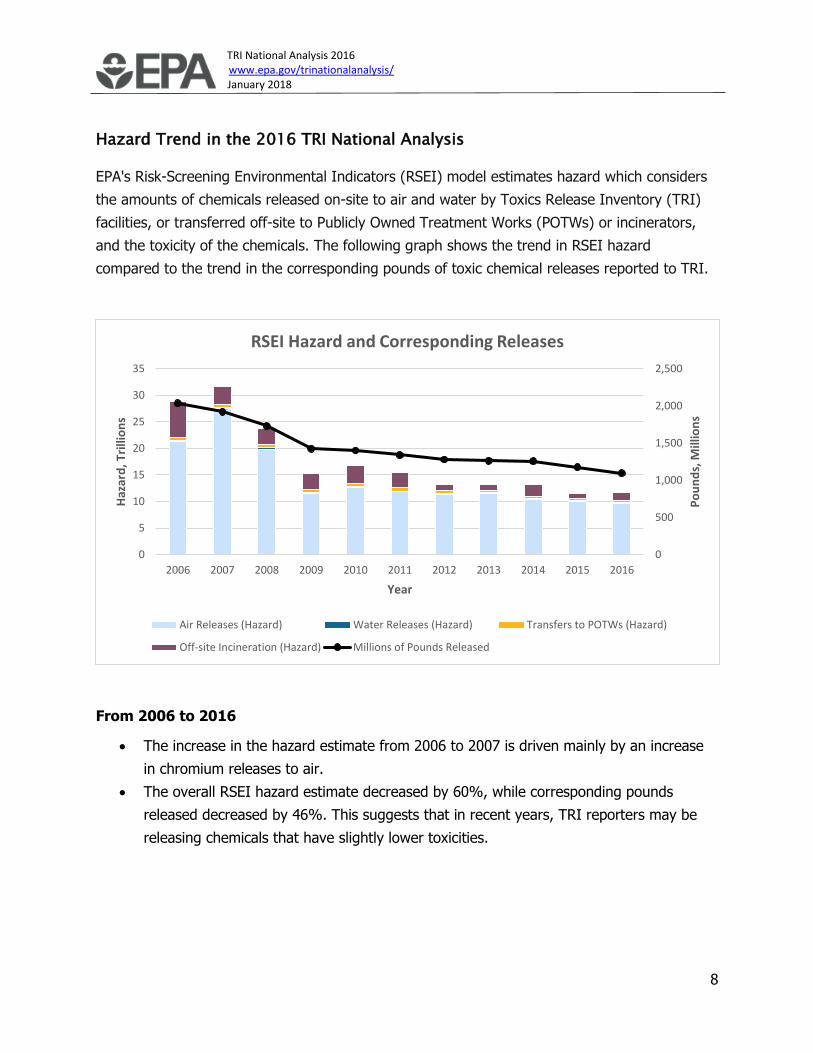
Hazard Trend in the 2016 TRI National Analysis
EPA's Risk-Screening Environmental Indicators (RSEI) model estimates hazard which considers
the amounts of chemicals released on-site to air and water by Toxics Release Inventory (TRI)
facilities, or transferred off-site to Publicly Owned Treatment Works (POTWs) or incinerators,
and the toxicity of the chemicals. The following graph shows the trend in RSEI hazard
compared to the trend in the corresponding pounds of toxic chemical releases reported to TRI.
From 2006 to 2016
• The increase in the hazard estimate from 2006 to 2007 is driven mainly by an increase
in chromium releases to air.
• The overall RSEI hazard estimate decreased by 60%, while corresponding pounds
released decreased by 46%. This suggests that in recent years, TRI reporters may be
releasing chemicals that have slightly lower toxicities.
0
500
1,000
1,500
2,000
2,500
0
5
10
15
20
25
30
35
2006 2007 2008 2009 2010 2011 2012 2013 2014 2015 2016
Po
un
ds,
Mill
ion
s
Haz
ard
, Tri
llio
ns
Year
RSEI Hazard and Corresponding Releases
Air Releases (Hazard) Water Releases (Hazard) Transfers to POTWs (Hazard)
Off-site Incineration (Hazard) Millions of Pounds Released

TRI National Analysis 2016 www.epa.gov/trinationalanalysis/ January 2018
9
Risk Trend in the 2016 TRI National Analysis
EPA's Risk-Screening Environmental Indicators (RSEI) model estimates risk “scores” that
represent relative chronic human health risk and can be compared to RSEI-generated scores
from other years. RSEI scores are different from RSEI hazard estimates because they also
consider the location of the release, its fate and transport through the environment, and the
route and extent of potential human exposure. The following graph shows the trend in the RSEI
score compared to the trend in the corresponding pounds of toxic chemical releases.
From 2006 to 2016
• The overall RSEI score estimate decreased by 56%, while corresponding pounds
released decreased by 46%. The large decrease in RSEI score between 2007 and 2009
was driven by a large decrease in chromium releases from three facilities.
RSEI Dashboard
• Use the EPA's Risk-Screening Environmental Indicators (RSEI) EasyRSEI dashboard to
view the national trend in RSEI hazard and RSEI score, or use the Dashboard’s filter
capabilities to view RSEI information for a specific chemical or location of interest.
0
500
1,000
1,500
2,000
2,500
0
200
400
600
800
1,000
1,200
1,400
2006 2007 2008 2009 2010 2011 2012 2013 2014 2015 2016
Po
un
ds,
Mill
ion
s
Sco
re, M
illio
ns
Year
RSEI Score and Corresponding Releases
Air Releases (Score) Water Releases (Score) Transfers to POTWs (Score)
Off-site Incineration (Score) Millions of Pounds Released

TRI National Analysis 2016 www.epa.gov/trinationalanalysis/ January 2018
10
Air Releases
Air emissions reported to the Toxics Release Inventory (TRI) continue to decline, serving as a
primary driver of decreased total releases. Air releases include both fugitive air emissions and
point source air emissions. This graph shows the trend in the pounds of chemicals released to
air as reported to TRI.
From 2006 to 2016:
• Air releases declined significantly, serving as a primary driver of decreases in total
releases.
• Air releases decreased by 58% (829 million pounds).
o Hydrochloric acid, sulfuric acid, hydrogen fluoride, methanol, toluene, and
styrene were the chemicals with the greatest reductions in air releases since
2006.
o The decrease is driven by electric utilities due to: decreased emissions of
Hazardous Air Pollutants (HAPs), such as hydrochloric acid; a shift from coal to
other fuel sources; implementation of regulations; and the installation of control
technologies at coal-fired power plants. Note that only those electric utilities that
combust coal or oil to generate power for distribution into commerce are covered
under TRI reporting requirements.
0
500
1,000
1,500
2006 2007 2008 2009 2010 2011 2012 2013 2014 2015 2016
Mill
ion
s o
f P
ou
nd
s
Year
On-site Air Releases
Fugitive Air Emissions Stack Air Emissions

TRI National Analysis 2016 www.epa.gov/trinationalanalysis/ January 2018
11
o Electric utilities accounted for more than 85% of nationwide reductions in air
releases of hydrochloric acid and sulfuric acid from 2006 to 2016.
• Air releases of OSHA carcinogens also decreased; see the Air Releases of OSHA
Carcinogens figure.
• Air releases of other chemicals of special concern, including lead and mercury, also
decreased; see the Chemicals of Special Concern section.
• Air releases are often regulated by other programs as well, such as under Title V of the
Clean Air Act, which requires major sources of air pollutants to obtain and comply with
an operating permit.
In 2016:
• Ammonia, followed by methanol, accounted for the greatest air releases of TRI
chemicals.
• Since 2015, air releases decreased by 11%.
TRI National Analysis 2016 www.epa.gov/trinationalanalysis/ January 2018
12
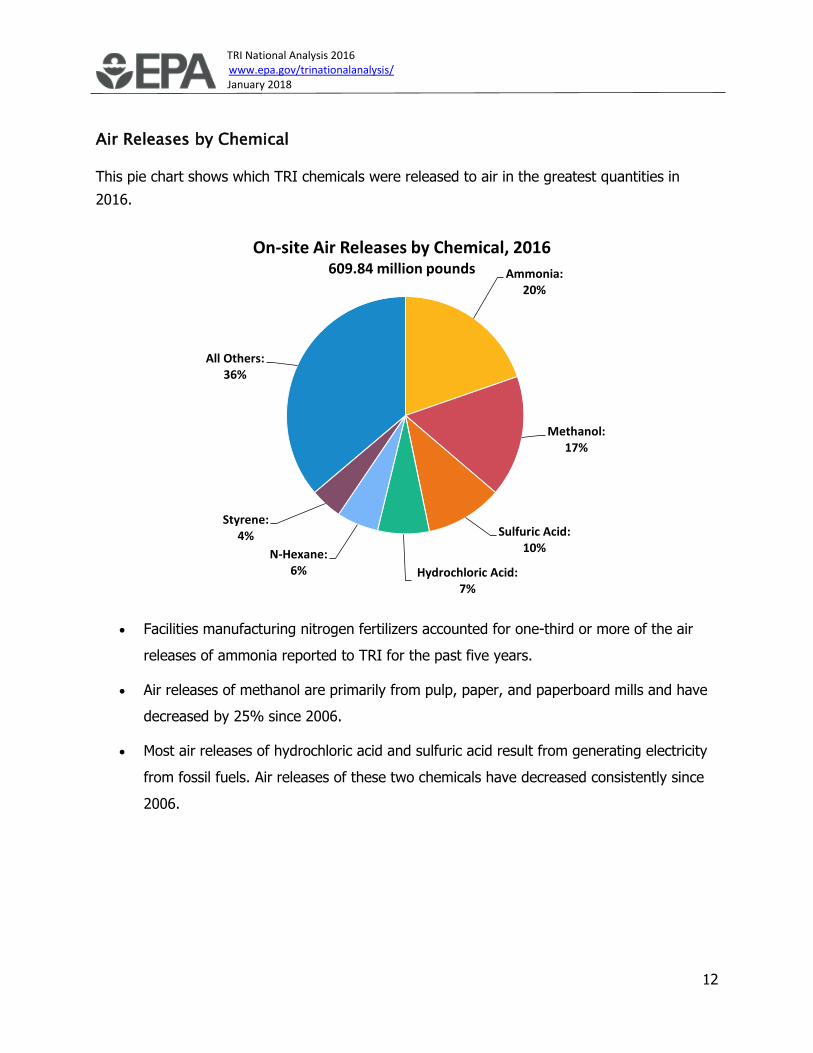
Air Releases by Chemical
This pie chart shows which TRI chemicals were released to air in the greatest quantities in
2016.
• Facilities manufacturing nitrogen fertilizers accounted for one-third or more of the air
releases of ammonia reported to TRI for the past five years.
• Air releases of methanol are primarily from pulp, paper, and paperboard mills and have
decreased by 25% since 2006.
• Most air releases of hydrochloric acid and sulfuric acid result from generating electricity
from fossil fuels. Air releases of these two chemicals have decreased consistently since
2006.
Ammonia:20%
Methanol:17%
Sulfuric Acid:10%
Hydrochloric Acid:7%
N-Hexane:6%
Styrene:4%
All Others:36%
On-site Air Releases by Chemical, 2016609.84 million pounds

TRI National Analysis 2016 www.epa.gov/trinationalanalysis/ January 2018
13
Air Releases by Industry
This pie chart shows the TRI-covered industry sectors that reported the greatest releases of TRI
chemicals to air in 2016.
• Chemicals, paper, and the electric utility sectors accounted for the greatest releases to
air in 2016. Air releases in these three industries have decreased since 2015:
o Chemicals: 2% decrease (2.5 million pounds)
o Paper: 7% decrease (8.5 million pounds)
o Electric utilities: 35% decrease (47.0 million pounds)
Chemicals:26%
Paper:21%
Electric Utilities:14%
Food:7%
Petroleum:6%
Plastics and Rubber:5%
Transportation Equipment:
4%
All Others:17%
Air Releases by Industry, 2016609.84 million pounds
TRI National Analysis 2016 www.epa.gov/trinationalanalysis/ January 2018
14
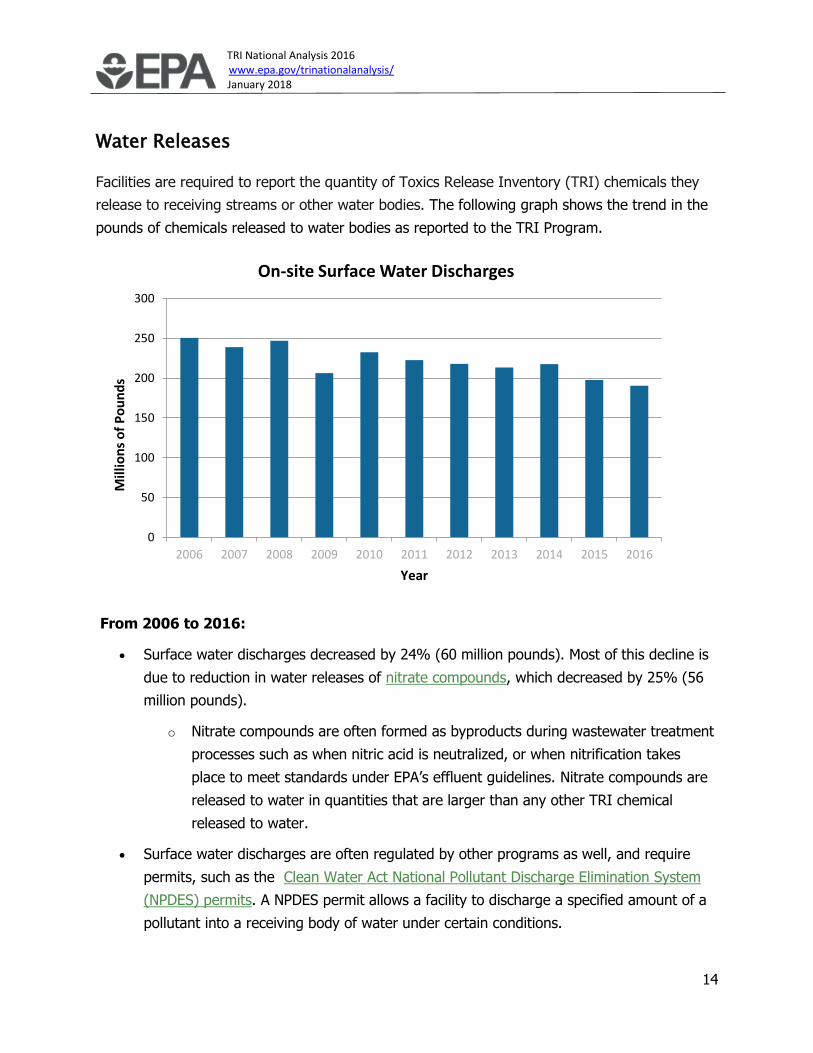
Water Releases
Facilities are required to report the quantity of Toxics Release Inventory (TRI) chemicals they
release to receiving streams or other water bodies. The following graph shows the trend in the
pounds of chemicals released to water bodies as reported to the TRI Program.
From 2006 to 2016:
• Surface water discharges decreased by 24% (60 million pounds). Most of this decline is
due to reduction in water releases of nitrate compounds, which decreased by 25% (56
million pounds).
o Nitrate compounds are often formed as byproducts during wastewater treatment
processes such as when nitric acid is neutralized, or when nitrification takes
place to meet standards under EPA’s effluent guidelines. Nitrate compounds are
released to water in quantities that are larger than any other TRI chemical
released to water.
• Surface water discharges are often regulated by other programs as well, and require
permits, such as the Clean Water Act National Pollutant Discharge Elimination System
(NPDES) permits. A NPDES permit allows a facility to discharge a specified amount of a
pollutant into a receiving body of water under certain conditions.
0
50
100
150
200
250
300
2006 2007 2008 2009 2010 2011 2012 2013 2014 2015 2016
Mill
ion
s o
f P
ou
nd
s
Year
On-site Surface Water Discharges

TRI National Analysis 2016 www.epa.gov/trinationalanalysis/ January 2018
15
• Surface water discharges of other TRI chemicals, many of which are more toxic to
humans than nitrate compounds, have been decreasing at a faster rate. Releases to
water are discussed further in the next few figures starting with water releases by
chemical.
In 2016:
• Nitrate compounds alone accounted for 88% of the total quantity of all TRI chemicals
discharged to surface waters.
TRI National Analysis 2016 www.epa.gov/trinationalanalysis/ January 2018
16
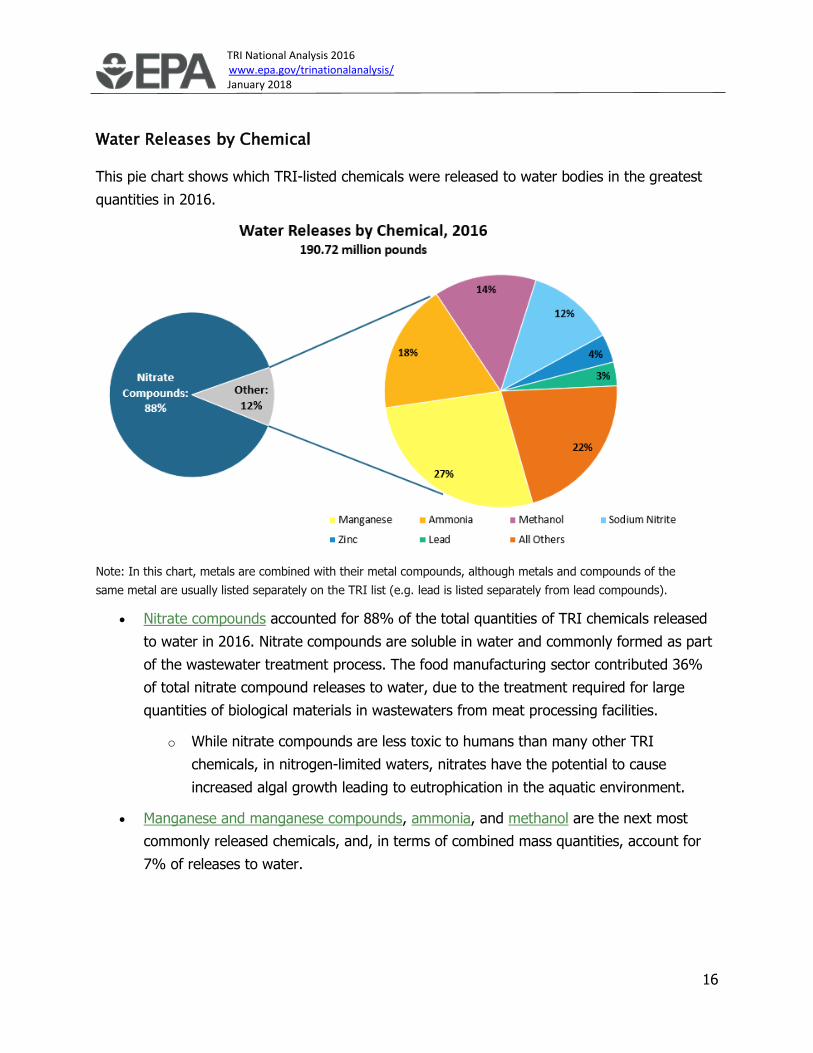
Water Releases by Chemical
This pie chart shows which TRI-listed chemicals were released to water bodies in the greatest
quantities in 2016.
Note: In this chart, metals are combined with their metal compounds, although metals and compounds of the
same metal are usually listed separately on the TRI list (e.g. lead is listed separately from lead compounds).
• Nitrate compounds accounted for 88% of the total quantities of TRI chemicals released
to water in 2016. Nitrate compounds are soluble in water and commonly formed as part
of the wastewater treatment process. The food manufacturing sector contributed 36%
of total nitrate compound releases to water, due to the treatment required for large
quantities of biological materials in wastewaters from meat processing facilities.
o While nitrate compounds are less toxic to humans than many other TRI
chemicals, in nitrogen-limited waters, nitrates have the potential to cause
increased algal growth leading to eutrophication in the aquatic environment.
• Manganese and manganese compounds, ammonia, and methanol are the next most
commonly released chemicals, and, in terms of combined mass quantities, account for
7% of releases to water.

TRI National Analysis 2016 www.epa.gov/trinationalanalysis/ January 2018
17
Water Releases by Industry
This pie chart shows the TRI-covered industry sectors that reported the greatest releases of TRI
chemicals to water bodies for 2016.
• The food manufacturing sector accounted for approximately one-third of water releases
in 2016, which is similar to its contribution over the past 10 years.
• Nitrate compounds accounted for 97% of the releases to water from the food
manufacturing sector. Nitrate compounds are relatively less toxic to humans than many
other TRI chemicals discharged to surface waters, but are formed in large quantities by
this sector during wastewater treatment processes due to the high biological content of
wastewater.
• Surface water discharges are often regulated by other EPA programs as well, such as
the program established under the Clean Water Act that issues National Pollutant
Discharge Elimination System (NPDES) permits. A NPDES permit is typically a license for
a facility to discharge a specified amount of a pollutant into a receiving body of water
under certain conditions.
Food: 33%
Primary Metals:16%
Chemicals: 14%
Petroleum: 13%
Paper: 8%
All Others: 16%
Water Releases by Industry, 2016190.72 million pounds
TRI National Analysis 2016 www.epa.gov/trinationalanalysis/ January 2018
18
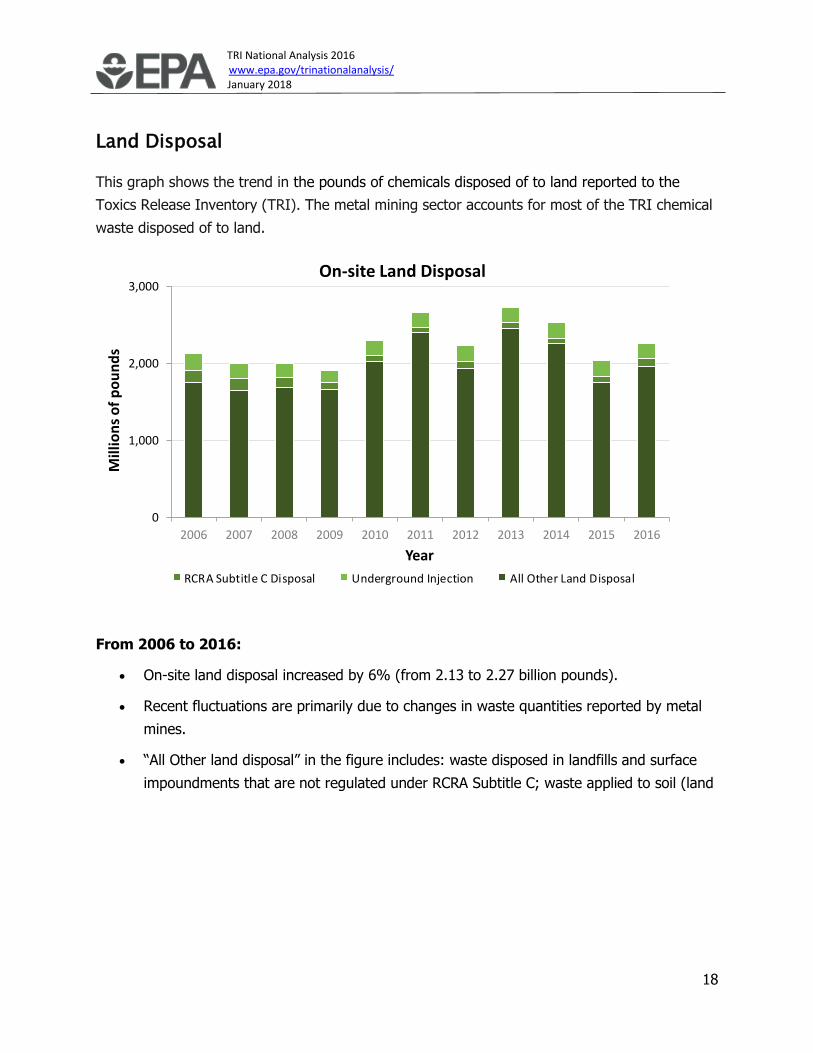
Land Disposal
This graph shows the trend in the pounds of chemicals disposed of to land reported to the
Toxics Release Inventory (TRI). The metal mining sector accounts for most of the TRI chemical
waste disposed of to land.
From 2006 to 2016:
• On-site land disposal increased by 6% (from 2.13 to 2.27 billion pounds).
• Recent fluctuations are primarily due to changes in waste quantities reported by metal
mines.
• “All Other land disposal” in the figure includes: waste disposed in landfills and surface
impoundments that are not regulated under RCRA Subtitle C; waste applied to soil (land
0
1,000
2,000
3,000
2006 2007 2008 2009 2010 2011 2012 2013 2014 2015 2016
Mill
ion
s o
f p
ou
nd
s
Year
On-site Land Disposal
Other Land Disposal RCRA Subtitle C Disposal Underground Injection
0
200
400
600
800
1,000
2006 2007 2008 2009 2010 2011 2012 2013 2014 2015 2016
Mil
lio
ns
of
Po
un
ds
Year
On-site Land Disposal Excluding Metal Mines
RCRA Subtitle C Disposal Underground Injection All Other Land Disposal
TRI National Analysis 2016 www.epa.gov/trinationalanalysis/ January 2018
19
treatment/application farming); and any
other land disposal. Most of the TRI
chemical waste reported as “other land
disposal” is from the disposal of waste rock
at metal mines.
• Disposal to land is often regulated by other
programs as well, such as under
the Resource Conservation and Recovery
Act (RCRA).
In 2016:
• Land disposal trends are largely driven by
the metal mining sector, which accounted
for 66% of land disposal quantities. Click
the button under the figure above to view
the land disposal trend with metal mines excluded from the analysis.
• Most of these quantities were made up of either lead and lead compounds (28%) or zinc
and zinc compounds (27%).
Metal mining facilities typically handle large volumes of material. In this sector, even a small
change in the chemical composition of the mineral deposit being mined can lead to big changes
in the amount of TRI-listed chemicals reported nationally. In recent years mines have cited
changes in production of waste rock, changes in the composition of waste rock, and the closure
of a heap leach pad as the primary reasons for the reported variability in land disposal of TRI
chemicals. Changes in waste rock composition can have an especially pronounced effect on TRI
reporting because of a regulatory exemption that applies based on a chemical’s concentration in
the rock, regardless of total chemical quantities generated.
Regulations require that waste rock be placed in engineered structures that contain
contaminants and may also require that waste rock and tailings piles and heap leach pads be
stabilized and re-vegetated to provide for productive post-mining land use.
For more information on waste management by the mining industry, see the Metal Mining
sector profile.
Helpful Concepts
What is underground injection?
Underground injection involves placing fluids
underground in porous formations through wells.
What is RCRA Subtitle C disposal?
The RCRA Subtitle C Disposal category in TRI
includes disposal to landfills and surface
impoundments authorized to accept hazardous waste
under the Recourse Conservation and Recovery Act
(RCRA). RCRA design standards include a double
liner, a leachate collection and removal system, and
a leak detection system. Operators must also comply
with RCRA inspection, monitoring, and release
response requirements.
TRI National Analysis 2016 www.epa.gov/trinationalanalysis/ January 2018
20
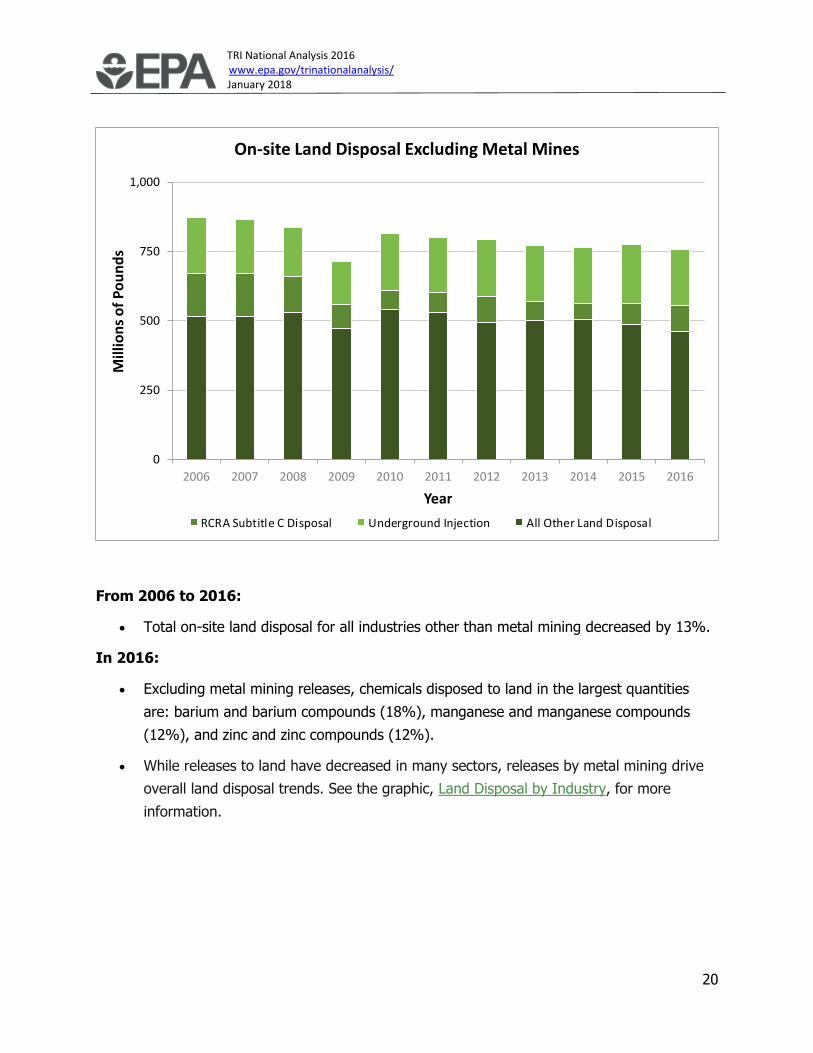
From 2006 to 2016:
• Total on-site land disposal for all industries other than metal mining decreased by 13%.
In 2016:
• Excluding metal mining releases, chemicals disposed to land in the largest quantities
are: barium and barium compounds (18%), manganese and manganese compounds
(12%), and zinc and zinc compounds (12%).
• While releases to land have decreased in many sectors, releases by metal mining drive
overall land disposal trends. See the graphic, Land Disposal by Industry, for more
information.
0
250
500
750
1,000
2006 2007 2008 2009 2010 2011 2012 2013 2014 2015 2016
Mill
ion
s o
f P
ou
nd
s
Year
On-site Land Disposal Excluding Metal Mines
Other Land Disposal RCRA Subtitle C Disposal Underground Injection
0
200
400
600
800
1,000
2006 2007 2008 2009 2010 2011 2012 2013 2014 2015 2016
Mil
lio
ns
of
Po
un
ds
Year
On-site Land Disposal Excluding Metal Mines
RCRA Subtitle C Disposal Underground Injection All Other Land Disposal
TRI National Analysis 2016 www.epa.gov/trinationalanalysis/ January 2018
21
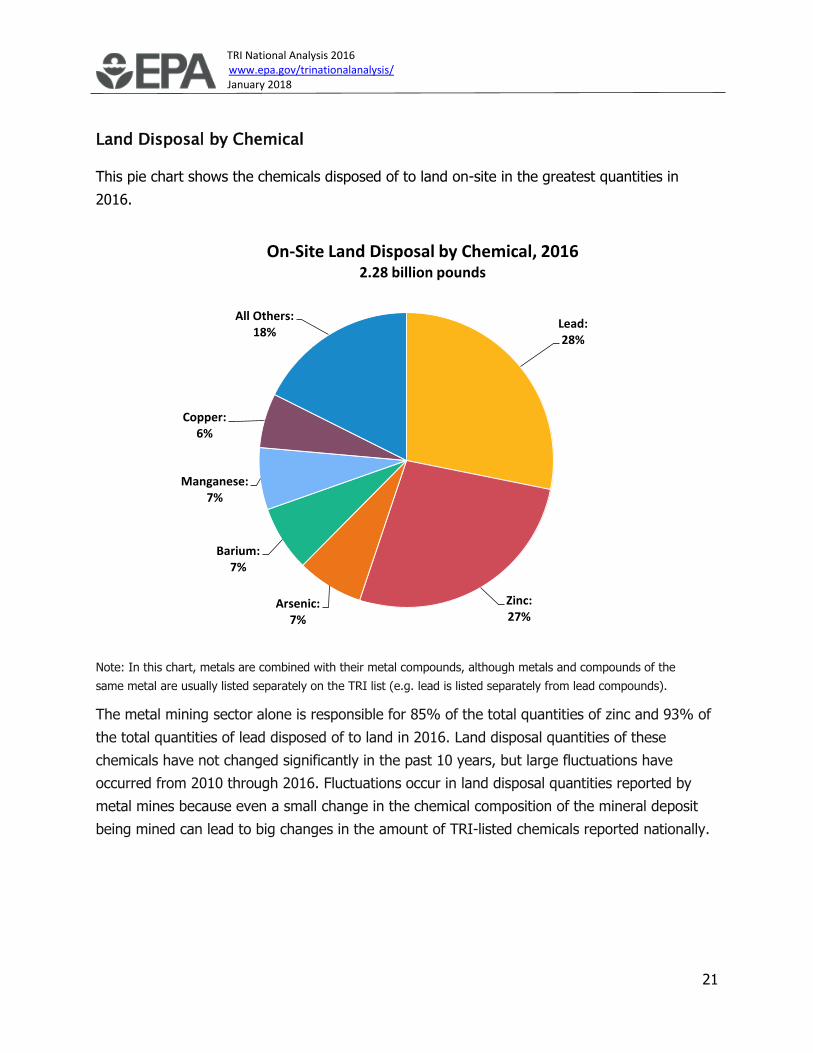
Land Disposal by Chemical
This pie chart shows the chemicals disposed of to land on-site in the greatest quantities in
2016.
Note: In this chart, metals are combined with their metal compounds, although metals and compounds of the
same metal are usually listed separately on the TRI list (e.g. lead is listed separately from lead compounds).
The metal mining sector alone is responsible for 85% of the total quantities of zinc and 93% of
the total quantities of lead disposed of to land in 2016. Land disposal quantities of these
chemicals have not changed significantly in the past 10 years, but large fluctuations have
occurred from 2010 through 2016. Fluctuations occur in land disposal quantities reported by
metal mines because even a small change in the chemical composition of the mineral deposit
being mined can lead to big changes in the amount of TRI-listed chemicals reported nationally.
Lead:28%
Zinc:27%
Arsenic:7%
Barium:7%
Manganese:7%
Copper:6%
All Others:18%
On-Site Land Disposal by Chemical, 20162.28 billion pounds

TRI National Analysis 2016 www.epa.gov/trinationalanalysis/ January 2018
22
Land Disposal by Industry
This pie chart shows the TRI-covered industry sectors that reported the greatest quantities of
TRI chemicals disposed of to land on-site for 2016.
• The metal mining sector accounted for the majority of releases to land in 2016, mostly
due to chemicals contained in waste rock.
• The relative contribution by each industry sector to on-site land disposal has not
changed considerably in recent years.
Metal Mining:66%
Chemicals: 11%
Electric Utilities:9%
Primary Metals:6%
Hazardous Waste: 5%
All Others: 3%
On-site Land Disposal by Sector, 20162.28 billion pounds
TRI National Analysis 2016 www.epa.gov/trinationalanalysis/ January 2018
23
Chemicals of Special Concern
In this section, we take a closer look at some Toxics Release Inventory (TRI) chemicals that are
of special concern: 1) persistent, bioaccumulative, and toxic (PBT) chemicals; and 2) known or
suspected human carcinogens.
Chemicals designated as PBTs are not only toxic, but also remain in the environment for a long
time where they tend to build up in the tissue of organisms throughout the food web. These
organisms serve as food sources for other organisms, including humans, that are sensitive to
the toxic effects of PBT chemicals.
Reporting requirements for the sixteen specific chemicals and four chemical categories
designated as PBT chemicals on the TRI list of chemicals for Reporting Year 2016 are more
stringent than for other TRI chemicals. See TRI’s PBT webpage for the full list of PBT chemicals.
This section focuses on the following PBT chemicals: lead and lead
compounds; mercury and mercury compounds; and dioxin and dioxin-like compounds.
There are also 191 chemicals included on the TRI chemical list that the Occupational Safety and
Health Administration (OSHA) includes on its list of carcinogens. These chemicals also have
different TRI reporting requirements. This section presents the trend in air emissions for OSHA
carcinogens. A full list of these chemicals can be found on the TRI basis of OSHA carcinogens
webpage.
TRI National Analysis 2016 www.epa.gov/trinationalanalysis/ January 2018
24
Lead Releases Trend
This graph shows the trend in the pounds of lead and lead compounds disposed of or otherwise
released by TRI reporting facilities including manufacturing facilities, metal mines, electric
utilities, and hazardous waste treatment and disposal facilities.
From 2006 to 2016:
• Total releases of lead and lead compounds rose and fell between 2006 and 2016, with
an overall increase of 34%.
• Total releases especially fluctuated between 2010 and 2016. The metal mining sector
accounts for most of the disposal of lead and lead compounds, driving the overall trend.
For example, metal mines reported 90% of total lead and lead compound releases for
2016.
From 2015 to 2016:
• Total releases of lead and lead compounds increased by 16% (92 million pounds).
0
250
500
750
1,000
2006 2007 2008 2009 2010 2011 2012 2013 2014 2015 2016
Mill
ion
s o
f P
ou
nd
s
Year
Total Disposal or Other Releases of Lead and Lead Compounds
On-Site Air Releases On-site Surface Water Discharges
On-site Land Disposal Off-site Disposal or Other Releases
TRI National Analysis 2016 www.epa.gov/trinationalanalysis/ January 2018
25
This graph shows the trend in the pounds of lead and lead compounds disposed of or otherwise
released, but excludes quantities reported by the metal mining sector.
From 2006 to 2016:
• Metal mining accounts for the majority of releases of lead and lead compounds.
• Releases of lead and lead compounds have decreased by 4% (19 million pounds) among
the other sectors. The increase shown between 2014 and 2015 was primarily due to
one hazardous waste management facility that reported releases of 24.9 million pounds
of lead compounds for 2015 compared to less than 0.5 million pounds for 2014 and
2016.
0
10
20
30
40
50
60
70
80
90
2006 2007 2008 2009 2010 2011 2012 2013 2014 2015 2016
Mill
ion
s o
f P
ou
nd
s
Year
Total Disposal or Other Releases of Lead and Lead Compounds, Excluding Metal Mining
On-Site Air Releases On-site Surface Water Discharges
On-site Land Disposal Off-site Disposal or Other Releases

TRI National Analysis 2016 www.epa.gov/trinationalanalysis/ January 2018
26
Lead Air Releases Trend
This graph shows the trend in the pounds of lead and lead compounds released to air.
From 2006 to 2016:
• Air releases of lead and lead compounds decreased by 63%. The primary metals and
electric utilities industry sectors have driven this decrease with decreased air releases of
336,000 pounds and 129,000 pounds, respectively.
• The primary metals sector, which includes iron and steel manufacturers and smelting
operations, reported the greatest quantities of releases of lead and lead compounds to
air.
From 2015 to 2016:
• Air releases of lead and lead compounds decreased by 6%.
• In 2016, 31% of air releases were from the primary metals industry sector.
0
250
500
750
1,000
1,250
2006 2007 2008 2009 2010 2011 2012 2013 2014 2015 2016
Tho
usa
nd
s o
f P
ou
nd
s
Year
On-Site Air Releases of Leadand Lead Compounds
TRI National Analysis 2016 www.epa.gov/trinationalanalysis/ January 2018
27
Mercury Air Releases Trend
This graph shows the trend in the pounds of mercury and mercury compounds released to air
by TRI reporting facilities.
From 2006 to 2016:
• Releases of mercury and mercury compounds to air decreased by 66%.
• Electric utilities are driving the decline in mercury air emissions, with an 85% reduction
(80,000 pounds). For more information on the declining trend in mercury air emissions
from electric utilities, see the sector profile.
In 2016:
• The primary metals sector, which includes iron and steel manufacturers and smelting
operations, accounted for 31% of the mercury and mercury compounds air emissions
reported to TRI.
0
25
50
75
100
125
150
175
2006 2007 2008 2009 2010 2011 2012 2013 2014 2015 2016
Tho
usa
nd
s o
f P
ou
nd
s
Year
On-Site Air Releases of Mercury and Mercury Compounds

TRI National Analysis 2016 www.epa.gov/trinationalanalysis/ January 2018
28
Dioxin and Dioxin-like Compound Releases Trend
This graph shows the trend in the grams of dioxin and dioxin-like compounds disposed of or
otherwise released by TRI-reporting facilities from 2010 to 2016.
Dioxin and dioxin-like compounds (dioxins) are persistent, bioaccumulative, and toxic chemicals
(PBTs) characterized by EPA as probable human carcinogens. Dioxins are the unintentional
byproducts of many forms of combustion and several industrial chemical processes.
From 2010 to 2016:
• Since 2010, dioxin grams released increased by 114%.
o This increase in dioxin releases is largely driven by increased on-site land
disposal from a non-ferrous metal smelting and refining facility.
From 2015 to 2016:
• Releases of dioxins increased by 25%. This increase is driven by increased on-site
disposal at a hazardous waste treatment facility (reporting dioxin releases for the first
time in 2016) and at a non-ferrous metal smelting and refining facility.
0
40,000
80,000
2010 2011 2012 2013 2014 2015 2016
Gra
ms
Year
Total Disposal or Other Releases, Dioxinand Dioxin-like Compounds
On-site Air Releases On-site Surface Water Discharges
On-site Land Disposal Total Off-site Disposal or Other Releases

TRI National Analysis 2016 www.epa.gov/trinationalanalysis/ January 2018
29
• In 2016, most (60%) of the quantity released was disposed on-site to land.
Dioxins Releases by Industry
TRI also requires facilities to report data on 17 types, or congeners, of dioxin. These congeners
have a wide range of toxic potencies. The mix of dioxins from one source can have a very
different level of toxicity than the same total amount, but different mix, from another source.
These varying toxic potencies can be taken into account using Toxic Equivalency Factors
(TEFs), which are based on each congener’s toxic potency. EPA multiplies the total grams of
each congener reported by facilities by the associated TEF to obtain a toxicity weight, and sums
all congeners for a total of grams in toxicity equivalents (grams-TEQ). Analyzing dioxins in
grams-TEQ is useful when comparing disposal or other releases of dioxin from different sources
or different time periods, where the mix of congeners may vary.
The following two pie charts show: 1) the TRI-covered industry sectors that reported the
greatest releases of dioxin and dioxin-like compounds in grams, compared to 2) the industry
sectors that reported the greatest releases of grams in toxicity equivalents (grams-TEQ). Note
that only those TRI reports that included the congener detail for calculating grams-TEQ are
included in these charts.

TRI National Analysis 2016 www.epa.gov/trinationalanalysis/ January 2018
30
• Various industry sectors may dispose of or otherwise release very different mixes
of dioxin congeners.
• The chemical manufacturing industry accounted for 49% and the primary metals sector
for 43% of total grams of dioxins released.
• However, when TEFs are applied, the primary metals sector accounted for 80% and the
chemical manufacturing sector for just 12% of the total grams-TEQ released.
Primary Metals:43%
Chemicals:49%
Hazardous Waste Management:
6%
Paper:1%
All Others:1%
Releases of Dioxin and Dioxin-like Compoundsby Industry, 2016
Grams
Primary Metals:80%
Chemicals:12%
Paper:3%
Electric Utilities2%
All Others:3%
Grams-TEQ
TRI National Analysis 2016 www.epa.gov/trinationalanalysis/ January 2018
31
TRI National Analysis 2016 www.epa.gov/trinationalanalysis/ January 2018
32
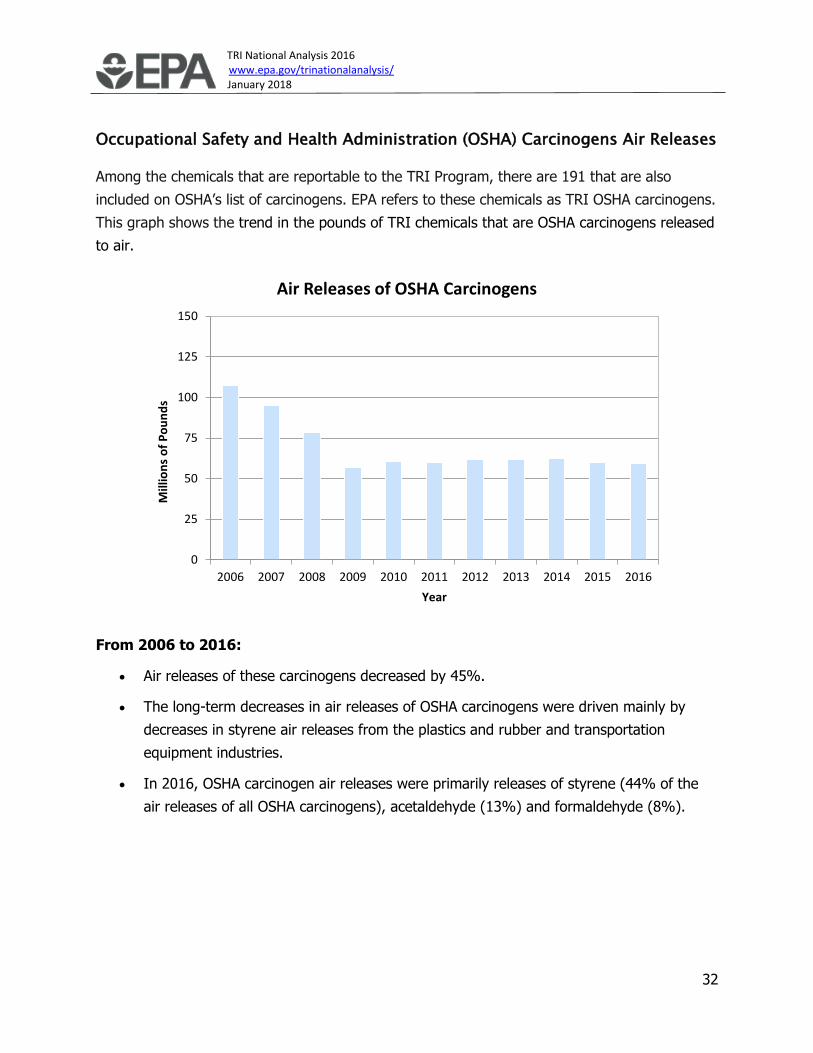
Occupational Safety and Health Administration (OSHA) Carcinogens Air Releases
Among the chemicals that are reportable to the TRI Program, there are 191 that are also
included on OSHA’s list of carcinogens. EPA refers to these chemicals as TRI OSHA carcinogens.
This graph shows the trend in the pounds of TRI chemicals that are OSHA carcinogens released
to air.
From 2006 to 2016:
• Air releases of these carcinogens decreased by 45%.
• The long-term decreases in air releases of OSHA carcinogens were driven mainly by
decreases in styrene air releases from the plastics and rubber and transportation
equipment industries.
• In 2016, OSHA carcinogen air releases were primarily releases of styrene (44% of the
air releases of all OSHA carcinogens), acetaldehyde (13%) and formaldehyde (8%).
0
25
50
75
100
125
150
2006 2007 2008 2009 2010 2011 2012 2013 2014 2015 2016
Mill
ion
s o
f P
ou
nd
s
Year
Air Releases of OSHA Carcinogens

TRI National Analysis 2016 www.epa.gov/trinationalanalysis/ January 2018
33
Non-Production-Related Waste
Non-production-related waste refers to quantities of Toxics Release Inventory (TRI) chemicals
disposed of or released, or transferred off-site, as the result of one-time events, rather than due
to standard production activities. These events may include remedial actions, such as
decommissioning a heap leach pad, catastrophic events, or other one-time events not
associated with normal production processes. Non-production-related waste is included in a
facility’s total disposal or other releases, but not as part of its production-related waste
managed. The following graph shows the annual quantities of non-production-related waste
reported to the TRI Program.
• Non-production-related waste from all facilities was below 35 million pounds in all years
except for 2013 when a mining facility reported a one-time release of 193 million
pounds due to decommissioning a heap leach pad. The facility reported zero releases in
2014 and did not report in 2015 or 2016.
• For 2016, facilities reported 15 million pounds of one-time, non-production-related
releases of TRI chemicals.
• Releases resulting from the flooding and destruction caused by the hurricanes in 2017
(e.g., Harvey, Irma, and Maria) will not be reflected in the TRI reporting until next year
when calendar year 2017 reports, due July 1, 2018, are submitted.
0
40
80
120
160
200
240
2006 2007 2008 2009 2010 2011 2012 2013 2014 2015 2016
Mill
ion
s o
f P
ou
nd
s
Year
Non-Production-Related Waste

TRI National Analysis 2016 www.epa.gov/trinationalanalysis/ January 2018
1
Comparing Industry Sectors
This section examines which sectors contributed the most to production-related waste managed
and released in 2016, and highlights several industry sectors to show trends occurring over
time. It also discusses the trends among federal facilities, which report to the Toxics Release
Inventory (TRI) regardless of sector. For analysis purposes, the TRI Program has aggregated
the North American Industry Classification System (NAICS) codes at the 3- and 4-digit levels,
creating 29 industry sector categories. To learn more about which business activities are subject
to TRI reporting requirements, see this list of covered NAICS codes.
The industries that are subject to TRI reporting requirements vary substantially in size, scope,
composition, and business type. As a result, the amounts and types of chemicals used,
generated, and managed by facilities within a given industry sector often differ greatly from
those of facilities in other sectors. For facilities in the same sector, however, the processes,
products, and regulatory requirements are often similar, resulting in similar manufacture,
processing, or other use of chemicals. Looking at chemical waste management trends within a
sector can identify emerging issues, highlight progress made in improving environmental
performance, and reveal opportunities for better waste management practices.
Chemicals:47%
Primary Metals:10%
Petroleum:8%
Paper:7%
Metal Mining:6%
Electric Utilities:5%
Food:5%
All others12%
Production-Related Waste Managed by Industry, 2016
27.8 billion pounds

TRI National Analysis 2016 www.epa.gov/trinationalanalysis/ January 2018
2
Seven industry sectors reported 88% of the quantities of TRI chemicals managed as
production-related waste in 2016. A majority (65%) of TRI chemical waste managed originated
from three sectors: chemical manufacturing (47%), primary metals (10%), and petroleum
products manufacturing, primarily from petroleum refineries (8%).
This pie chart shows that 91% of the quantities of TRI chemicals disposed of or otherwise
released originated from seven of the 29 industry sectors that are subject to the TRI reporting
requirements. More than two-thirds originated from three industry sectors: metal mining (44%),
chemical manufacturing (14%), and electric utilities (10%).
For more details on how the amounts and proportions of TRI chemicals managed as waste have
changed over time, see the production-related waste managed by industry trend graph.
For more information on the breakdown of these releases by medium, see land disposal by
industry, air releases by industry, and water releases by industry.
Metal Mining: 44%
Chemicals: 14%
Electric Utilities:10%
Primary Metals:10%
Paper: 5%
Hazardous Waste:4%
Food: 4%
All Others: 9%
Total Disposal or Other Releases by Industry, 2016
3.44 billion pounds
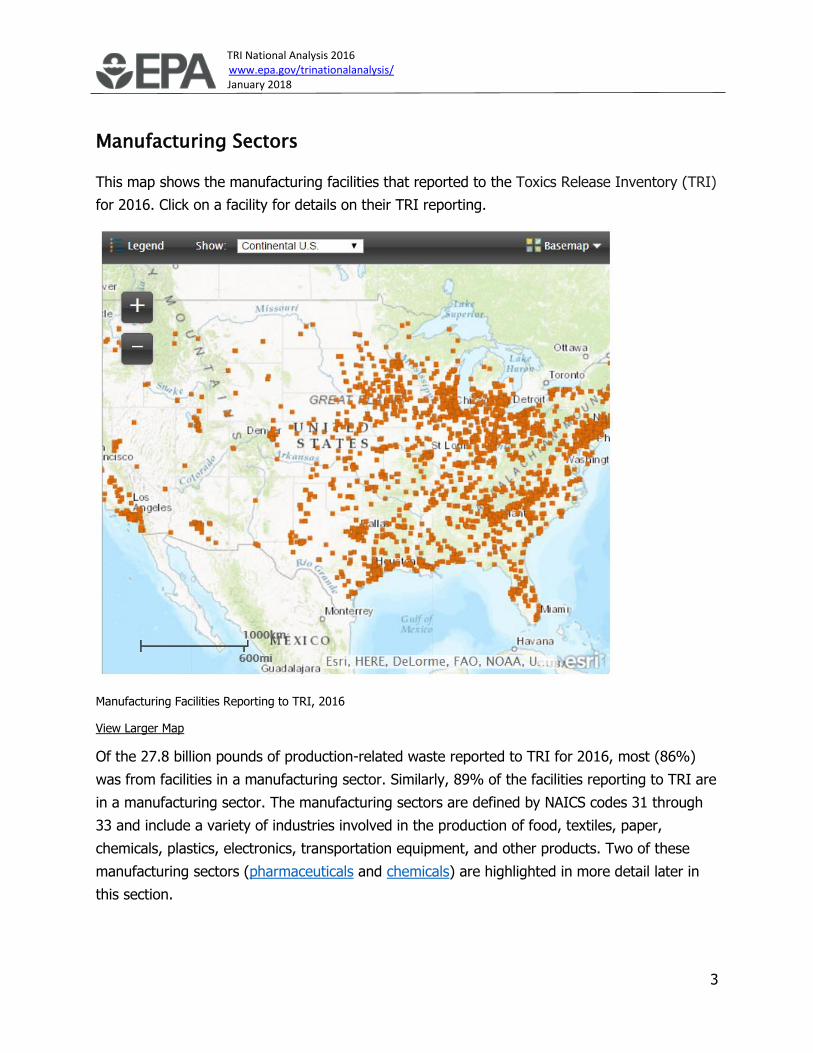
TRI National Analysis 2016 www.epa.gov/trinationalanalysis/ January 2018
3
Manufacturing Sectors
This map shows the manufacturing facilities that reported to the Toxics Release Inventory (TRI)
for 2016. Click on a facility for details on their TRI reporting.
Manufacturing Facilities Reporting to TRI, 2016
View Larger Map
Of the 27.8 billion pounds of production-related waste reported to TRI for 2016, most (86%)
was from facilities in a manufacturing sector. Similarly, 89% of the facilities reporting to TRI are
in a manufacturing sector. The manufacturing sectors are defined by NAICS codes 31 through
33 and include a variety of industries involved in the production of food, textiles, paper,
chemicals, plastics, electronics, transportation equipment, and other products. Two of these
manufacturing sectors (pharmaceuticals and chemicals) are highlighted in more detail later in
this section.
TRI National Analysis 2016 www.epa.gov/trinationalanalysis/ January 2018
4
The industry sectors not categorized under manufacturing include metal mining, coal mining,
electric utilities, chemical wholesalers, petroleum terminals, hazardous waste management, and
others.

TRI National Analysis 2016 www.epa.gov/trinationalanalysis/ January 2018
5
Quick Facts for 2016: Manufacturing Sectors (NAICS 31-33)
Number of Facilities that Reported to TRI 19,190
Number of Facilities with New Source Reduction Activities 2,180
Production-Related Waste Managed 23,802.9 million lb
Recycled 11,928.7 million lb
Energy Recovery 2,912.6 million lb
Treated 7,539.5 million lb
Disposed or Otherwise Released 1,422.1 million lb
Total Disposal or Other Releases 1,394.4 million lb
On-site 1,105.6 million lb
Air 514.3 million lb
Water 172.1 million lb
Land 419.3 million lb
Off-site 288.7 million lb
Note: Numbers may not sum exactly due to rounding.
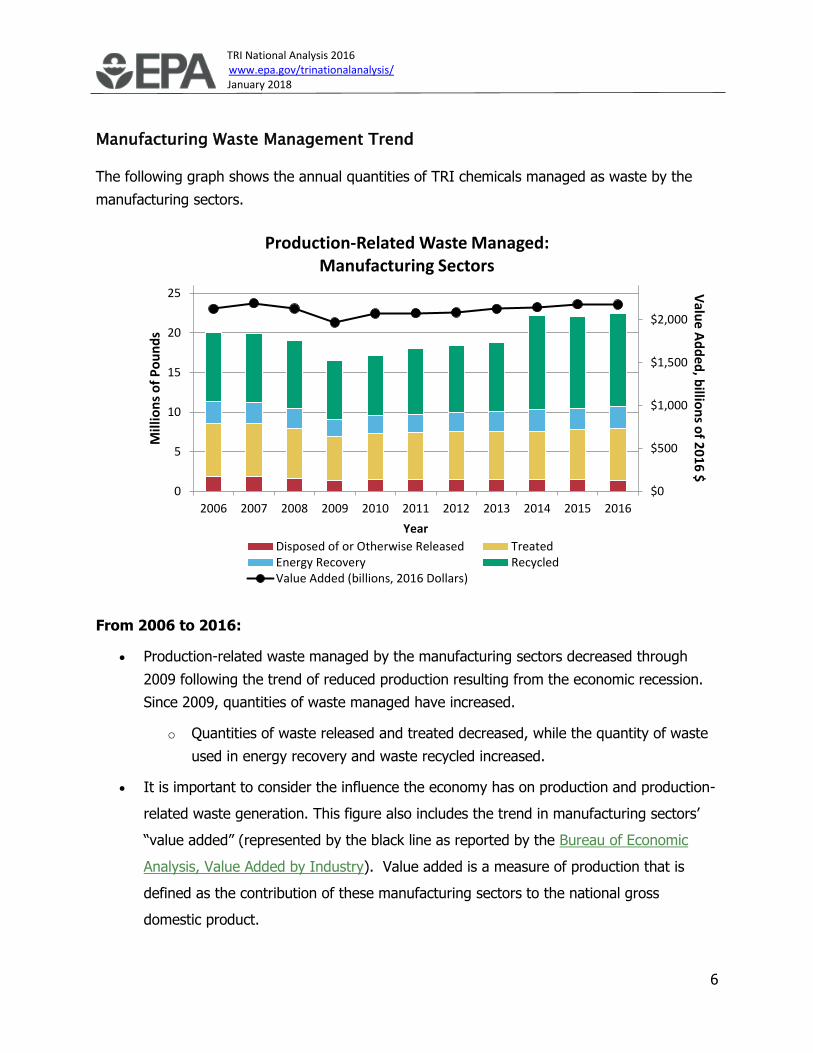
TRI National Analysis 2016 www.epa.gov/trinationalanalysis/ January 2018
6
Manufacturing Waste Management Trend
The following graph shows the annual quantities of TRI chemicals managed as waste by the
manufacturing sectors.
From 2006 to 2016:
• Production-related waste managed by the manufacturing sectors decreased through
2009 following the trend of reduced production resulting from the economic recession.
Since 2009, quantities of waste managed have increased.
o Quantities of waste released and treated decreased, while the quantity of waste
used in energy recovery and waste recycled increased.
• It is important to consider the influence the economy has on production and production-
related waste generation. This figure also includes the trend in manufacturing sectors’
“value added” (represented by the black line as reported by the Bureau of Economic
Analysis, Value Added by Industry). Value added is a measure of production that is
defined as the contribution of these manufacturing sectors to the national gross
domestic product.
$0
$500
$1,000
$1,500
$2,000
0
5
10
15
20
25
2006 2007 2008 2009 2010 2011 2012 2013 2014 2015 2016
Valu
e Ad
ded
, billio
ns o
f 20
16
$
Mill
ion
s o
f P
ou
nd
s
Year
Production-Related Waste Managed: Manufacturing Sectors
Disposed of or Otherwise Released TreatedEnergy Recovery RecycledValue Added (billions, 2016 Dollars)
TRI National Analysis 2016 www.epa.gov/trinationalanalysis/ January 2018
7
o Production-related waste managed by the manufacturing sectors increased by
12%, while value added by the manufacturing sectors increased by 2%.
However, the large increase in recycled waste for 2014 – 2016 is due to the
quantity of recycled cumene reported by one facility. Excluding this amount, the
total quantities of the manufacturing sectors’ production-related waste decreased
by 5% since 2006, even as value added increased.
From 2015 to 2016:
• Production-related waste managed increased by 2% (395 million pounds).
• In 2016, only 6% of the manufacturing sectors’ waste was released into the
environment, while the rest was managed through treatment, energy recovery, and
recycling.
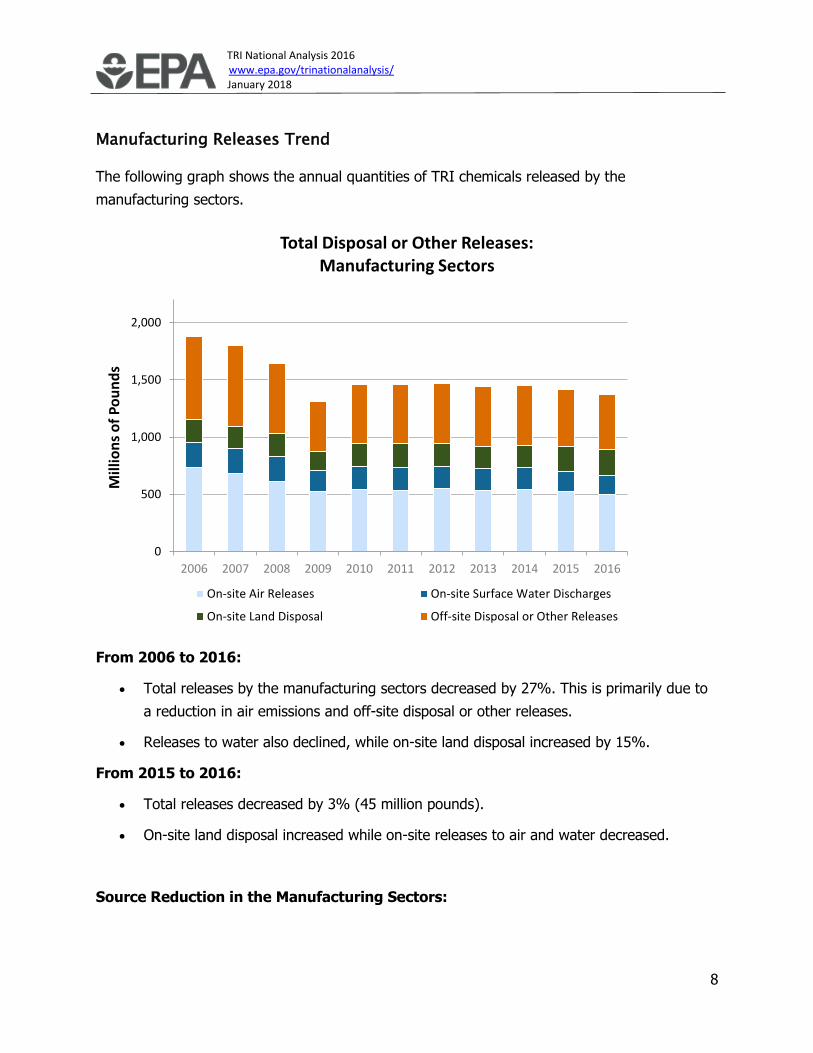
TRI National Analysis 2016 www.epa.gov/trinationalanalysis/ January 2018
8
Manufacturing Releases Trend
The following graph shows the annual quantities of TRI chemicals released by the
manufacturing sectors.
From 2006 to 2016:
• Total releases by the manufacturing sectors decreased by 27%. This is primarily due to
a reduction in air emissions and off-site disposal or other releases.
• Releases to water also declined, while on-site land disposal increased by 15%.
From 2015 to 2016:
• Total releases decreased by 3% (45 million pounds).
• On-site land disposal increased while on-site releases to air and water decreased.
Source Reduction in the Manufacturing Sectors:
0
500
1,000
1,500
2,000
2006 2007 2008 2009 2010 2011 2012 2013 2014 2015 2016
Mill
ion
s o
f P
ou
nd
s
Year
Total Disposal or Other Releases:Manufacturing Sectors
On-site Air Releases On-site Surface Water Discharges
On-site Land Disposal Off-site Disposal or Other Releases
TRI National Analysis 2016 www.epa.gov/trinationalanalysis/ January 2018
9
Eleven percent of manufacturing facilities initiated source reduction activities to reduce TRI
chemical use and waste generation in 2016. The most commonly reported types of source
reduction activitites were good operating practices and process modifications. For example, a
plastic products manufacturing facility replaced styrene solvent with acetone and water-based
cleaners, and expanded their product lines using polyethylene-based productions rather than
styrene-based products. TRI’s Pollution Prevention Search Tool can help you learn more about
pollution prevention opportunities in this sector.
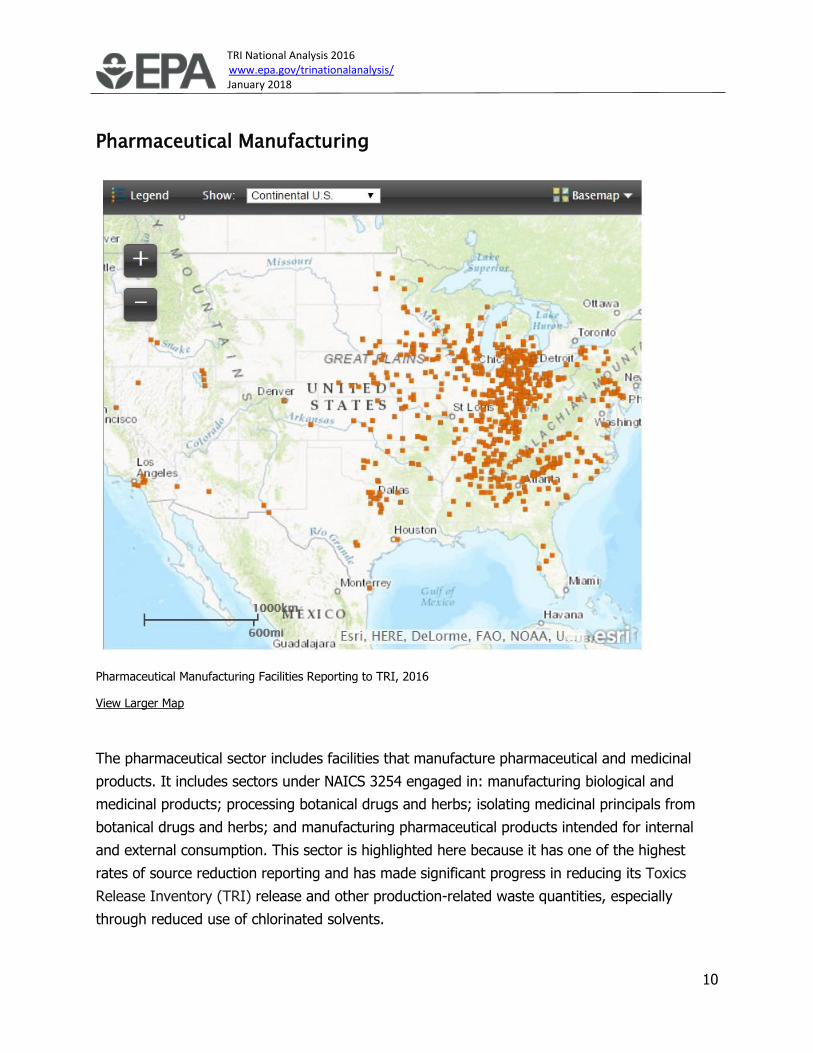
TRI National Analysis 2016 www.epa.gov/trinationalanalysis/ January 2018
10
Pharmaceutical Manufacturing
Pharmaceutical Manufacturing Facilities Reporting to TRI, 2016
View Larger Map
The pharmaceutical sector includes facilities that manufacture pharmaceutical and medicinal
products. It includes sectors under NAICS 3254 engaged in: manufacturing biological and
medicinal products; processing botanical drugs and herbs; isolating medicinal principals from
botanical drugs and herbs; and manufacturing pharmaceutical products intended for internal
and external consumption. This sector is highlighted here because it has one of the highest
rates of source reduction reporting and has made significant progress in reducing its Toxics
Release Inventory (TRI) release and other production-related waste quantities, especially
through reduced use of chlorinated solvents.

TRI National Analysis 2016 www.epa.gov/trinationalanalysis/ January 2018
11
Quick Facts for 2016: Pharmaceutical Manufacturing (NAICS 3254)
Number of Facilities that Reported to TRI 170
Number of Facilities with New Source Reduction Activities 34
Production-Related Waste Managed 198.5 million lb
Recycled 69.4 million lb
Energy Recovery 49.7 million lb
Treated 75.1 million lb
Disposed or Otherwise Released 4.3 million lb
Total Disposal or Other Releases 4.0 million lb
On-site 3.1 million lb
Air 2.4 million lb
Water 0.6 million lb
Land 0.1 million lb
Off-site 0.9 million lb

TRI National Analysis 2016 www.epa.gov/trinationalanalysis/ January 2018
12
Pharmaceutical Manufacturing Waste Management Trend
The following graph shows the annual quantities of TRI chemicals managed as waste by the
pharmaceutical industry.
From 2006 to 2016:
• Production-related waste managed by the pharmaceutical sector decreased through
2009, following the trend of reduced production resulting from the economic recession.
Since 2009, quantities of waste managed increased through 2014, at which point
production-related waste began to decrease. Overall, waste quantities have decreased
by 30%.
• Production (represented by the black line as reported by the Federal Reserve Board,
Industrial Production Index) decreased by 18%.
From 2015 to 2016:
• Production-related waste decreased by 8% (17 million pounds).
• In 2016, only 2% of the sector’s waste was released into the environment, while the
rest was managed through treatment, energy recovery, and recycling.
0
20
40
60
80
100
0
50
100
150
200
250
300
2006 2007 2008 2009 2010 2011 2012 2013 2014 2015 2016
Pro
du
ction
Ind
ex (20
06
= 10
0)
Mill
ion
s o
f P
ou
nd
s
Year
Production-Related Waste Managed: Pharmaceutical Manufacturing
Disposed of or Otherwise Released TreatedEnergy Recovery RecycledProduction

TRI National Analysis 2016 www.epa.gov/trinationalanalysis/ January 2018
13
Pharmaceutical Manufacturing Releases Trend
The following graph shows the annual quantities of TRI chemicals released by the
pharmaceutical industry.
From 2006 to 2016:
• The sector’s total disposal or other releases decreased by 56% since 2006. This is
primarily due to reductions in on-site land disposal.
From 2015 to 2016:
• Total releases decreased by 11% (0.5 million pounds).
0
2
4
6
8
10
2006 2007 2008 2009 2010 2011 2012 2013 2014 2015 2016
Mill
ion
s o
f P
ou
nd
s
Year
Total Disposal or Other Releases: Pharmaceutical Manufacturing
On-site Air Releases On-site Surface Water Discharges
On-site Land Disposal Off-site Disposal or Other Releases
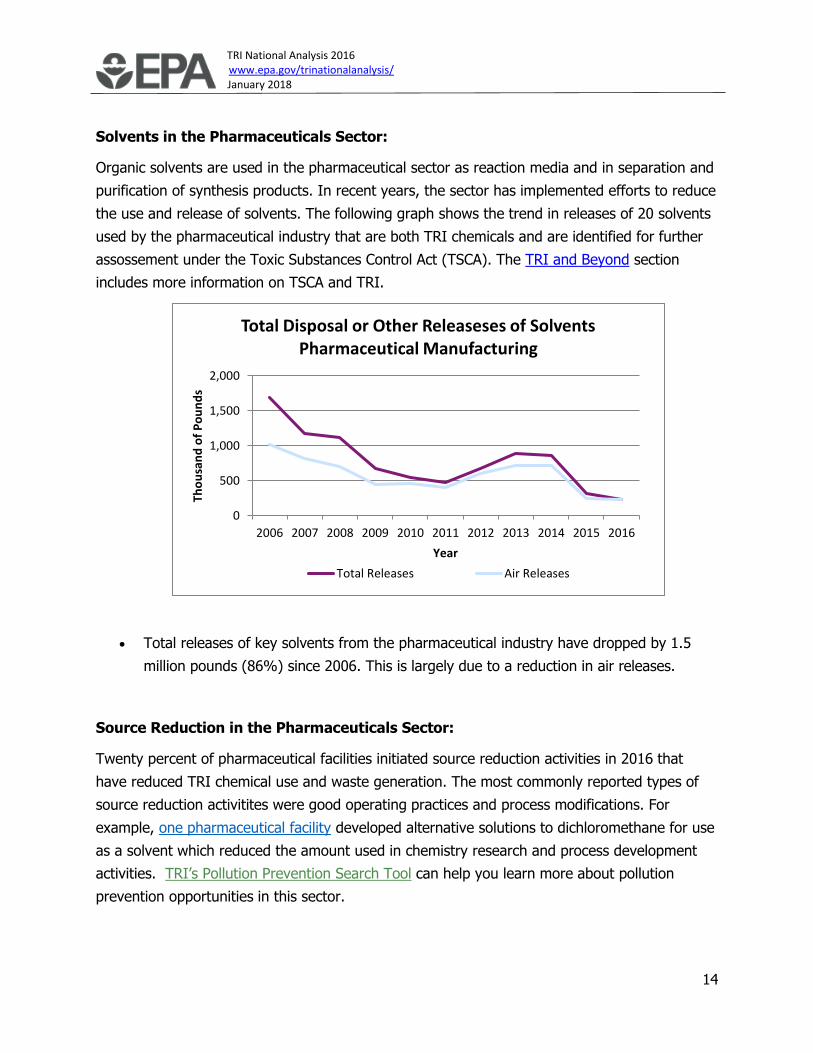
TRI National Analysis 2016 www.epa.gov/trinationalanalysis/ January 2018
14
Solvents in the Pharmaceuticals Sector:
Organic solvents are used in the pharmaceutical sector as reaction media and in separation and
purification of synthesis products. In recent years, the sector has implemented efforts to reduce
the use and release of solvents. The following graph shows the trend in releases of 20 solvents
used by the pharmaceutical industry that are both TRI chemicals and are identified for further
assossement under the Toxic Substances Control Act (TSCA). The TRI and Beyond section
includes more information on TSCA and TRI.
• Total releases of key solvents from the pharmaceutical industry have dropped by 1.5
million pounds (86%) since 2006. This is largely due to a reduction in air releases.
Source Reduction in the Pharmaceuticals Sector:
Twenty percent of pharmaceutical facilities initiated source reduction activities in 2016 that
have reduced TRI chemical use and waste generation. The most commonly reported types of
source reduction activitites were good operating practices and process modifications. For
example, one pharmaceutical facility developed alternative solutions to dichloromethane for use
as a solvent which reduced the amount used in chemistry research and process development
activities. TRI’s Pollution Prevention Search Tool can help you learn more about pollution
prevention opportunities in this sector.
0
500
1,000
1,500
2,000
2006 2007 2008 2009 2010 2011 2012 2013 2014 2015 2016
Tho
usa
nd
of
Po
un
ds
Year
Total Disposal or Other Releaseses of SolventsPharmaceutical Manufacturing
Total Releases Air Releases
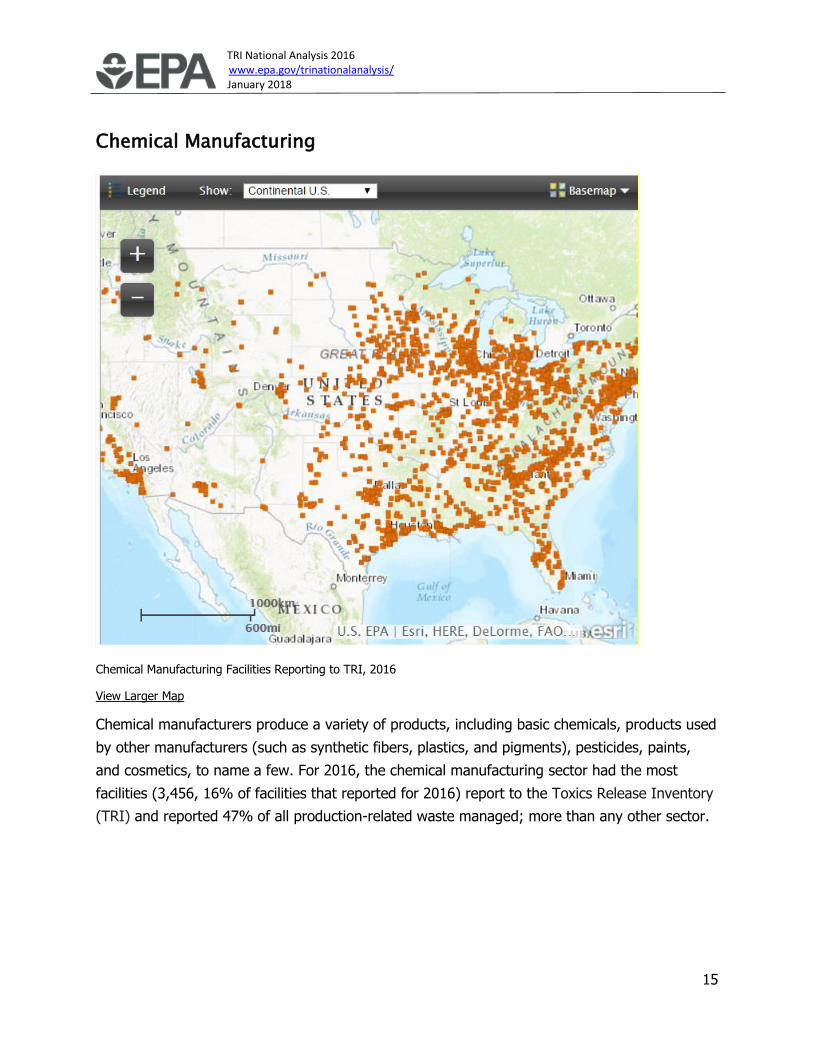
TRI National Analysis 2016 www.epa.gov/trinationalanalysis/ January 2018
15
Chemical Manufacturing
Chemical Manufacturing Facilities Reporting to TRI, 2016
View Larger Map
Chemical manufacturers produce a variety of products, including basic chemicals, products used
by other manufacturers (such as synthetic fibers, plastics, and pigments), pesticides, paints,
and cosmetics, to name a few. For 2016, the chemical manufacturing sector had the most
facilities (3,456, 16% of facilities that reported for 2016) report to the Toxics Release Inventory
(TRI) and reported 47% of all production-related waste managed; more than any other sector.
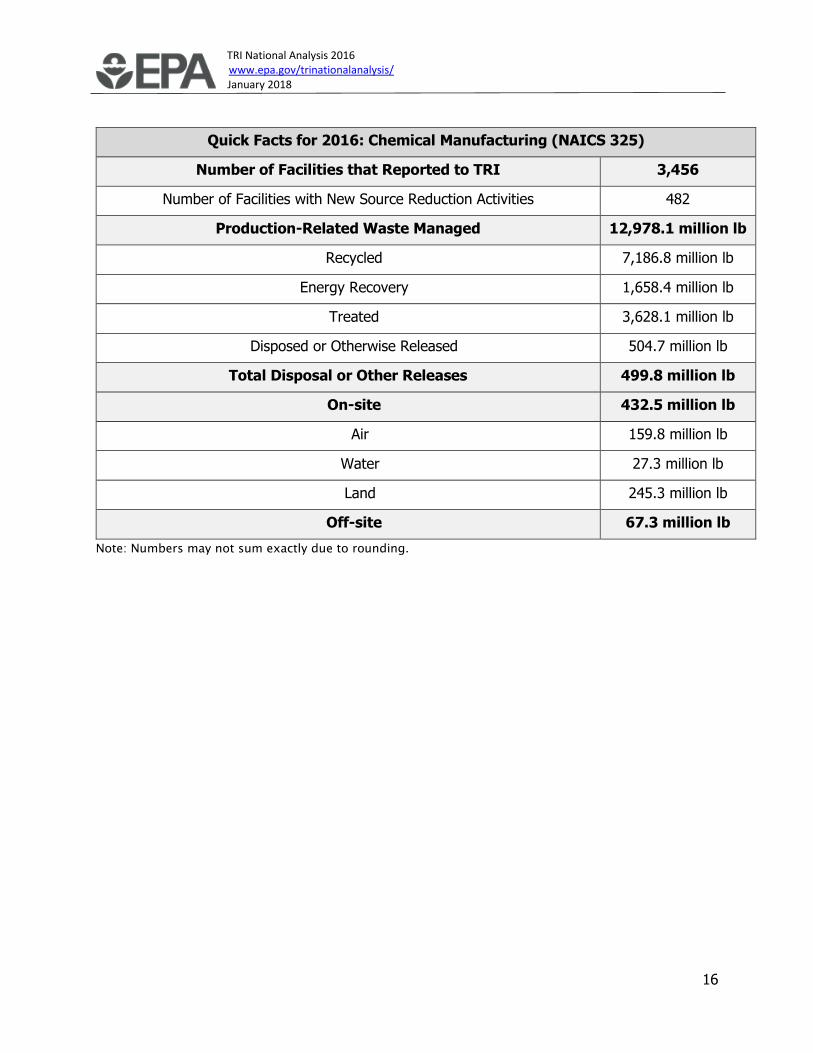
TRI National Analysis 2016 www.epa.gov/trinationalanalysis/ January 2018
16
Quick Facts for 2016: Chemical Manufacturing (NAICS 325)
Number of Facilities that Reported to TRI 3,456
Number of Facilities with New Source Reduction Activities 482
Production-Related Waste Managed 12,978.1 million lb
Recycled 7,186.8 million lb
Energy Recovery 1,658.4 million lb
Treated 3,628.1 million lb
Disposed or Otherwise Released 504.7 million lb
Total Disposal or Other Releases 499.8 million lb
On-site 432.5 million lb
Air 159.8 million lb
Water 27.3 million lb
Land 245.3 million lb
Off-site 67.3 million lb
Note: Numbers may not sum exactly due to rounding.

TRI National Analysis 2016 www.epa.gov/trinationalanalysis/ January 2018
17
Chemical Manufacturing Waste Management Trend
The following graph shows the annual quantities of TRI chemicals managed as waste by the
chemical manufacturing industry.
From 2006 to 2016:
• Production-related waste managed by the chemical manufacturing sector increased by
20%, while production (represented by the black line as reported by the Federal
Reserve Board, Industrial Production Index) decreased by 12%.
o The large increases in recycled waste in 2014, 2015, and 2016 are due to the
quantity of recycled cumene reported by one facility. Excluding this amount, the
total quantities of waste recycled decreased by 13% and production-related
waste managed decreased by 12%.
• Quantities of TRI chemicals released, treated, or used in energy recovery decreased,
while the quantities of TRI chemicals recycled increased by 63%.
From 2015 to 2016:
• Production-related waste managed decreased by 129 million pounds (1%).
• In 2016, only 4% of the sector’s waste was released into the environment, while the
rest was managed through treatment, energy recovery, and recycling.
0
15
30
45
60
75
90
105
120
0
2,000
4,000
6,000
8,000
10,000
12,000
14,000
16,000
18,000
2006 2007 2008 2009 2010 2011 2012 2013 2014 2015 2016
Pro
du
ction
Ind
ex (20
06
= 10
0)
Mill
ion
s o
f P
ou
nd
s
Year
Production-Related Waste Managed: Chemical Manufacturing
Disposed of or Otherwise Released TreatedEnergy Recovery RecycledProduction
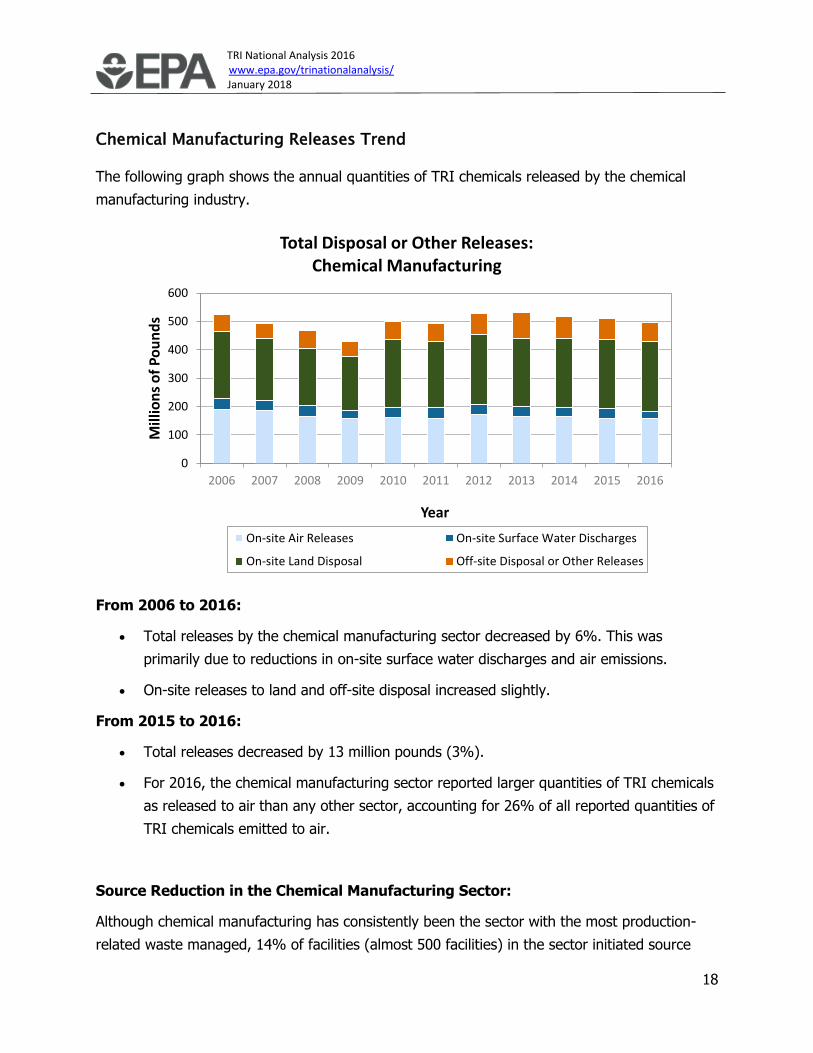
TRI National Analysis 2016 www.epa.gov/trinationalanalysis/ January 2018
18
Chemical Manufacturing Releases Trend
The following graph shows the annual quantities of TRI chemicals released by the chemical
manufacturing industry.
From 2006 to 2016:
• Total releases by the chemical manufacturing sector decreased by 6%. This was
primarily due to reductions in on-site surface water discharges and air emissions.
• On-site releases to land and off-site disposal increased slightly.
From 2015 to 2016:
• Total releases decreased by 13 million pounds (3%).
• For 2016, the chemical manufacturing sector reported larger quantities of TRI chemicals
as released to air than any other sector, accounting for 26% of all reported quantities of
TRI chemicals emitted to air.
Source Reduction in the Chemical Manufacturing Sector:
Although chemical manufacturing has consistently been the sector with the most production-
related waste managed, 14% of facilities (almost 500 facilities) in the sector initiated source
0
100
200
300
400
500
600
2006 2007 2008 2009 2010 2011 2012 2013 2014 2015 2016
Mill
ion
s o
f P
ou
nd
s
Year
Total Disposal or Other Releases: Chemical Manufacturing
On-site Air Releases On-site Surface Water Discharges
On-site Land Disposal Off-site Disposal or Other Releases

TRI National Analysis 2016 www.epa.gov/trinationalanalysis/ January 2018
19
reduction activities 2016 to reduce their TRI chemical use and waste generation. The most
commonly reported types of source reduction activities were good operating practices and
process modifications. For example, an ethyl alcohol manufacturing facility reduced waste by
discontinuing the use of anhydrous ammonia in their ethanol process. TRI’s Pollution Prevention
Search Tool can help you learn more about pollution prevention opportunities in this sector.
For more information on how this sector and others can choose safer chemicals, visit EPA’s
Safer Choice Program pages for Alternatives Assessments and the Safer Choice Ingredients List.
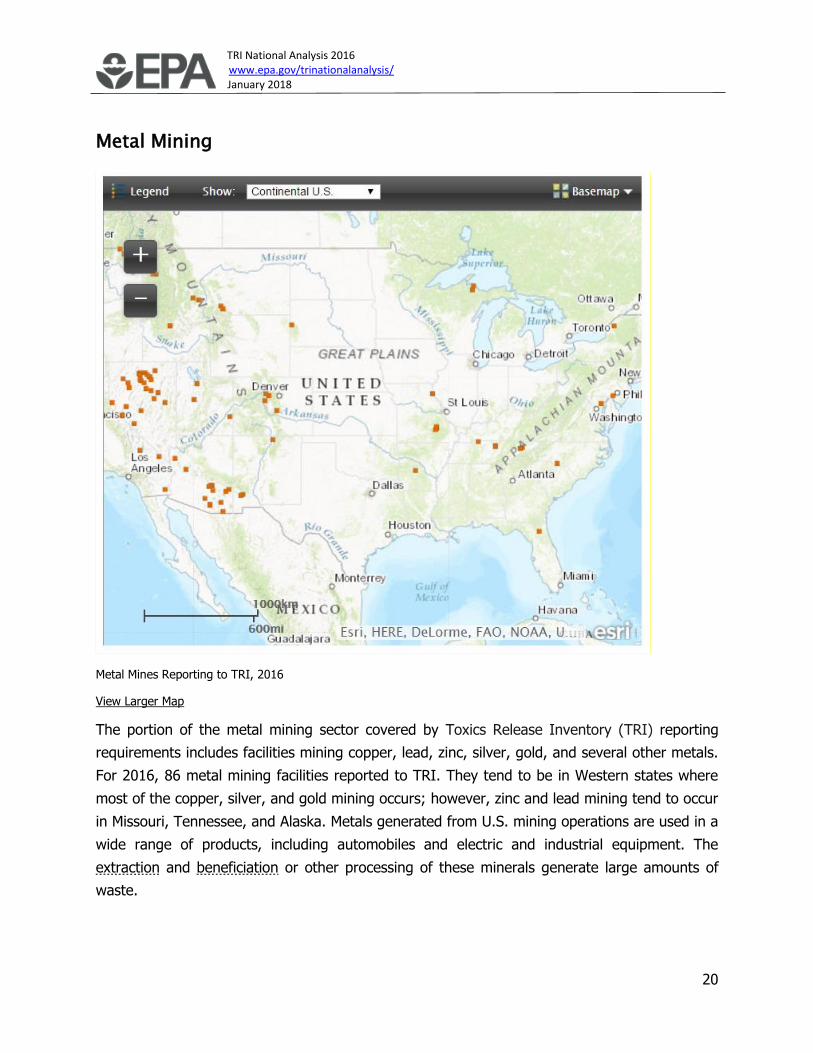
TRI National Analysis 2016 www.epa.gov/trinationalanalysis/ January 2018
20
Metal Mining
Metal Mines Reporting to TRI, 2016
View Larger Map
The portion of the metal mining sector covered by Toxics Release Inventory (TRI) reporting
requirements includes facilities mining copper, lead, zinc, silver, gold, and several other metals.
For 2016, 86 metal mining facilities reported to TRI. They tend to be in Western states where
most of the copper, silver, and gold mining occurs; however, zinc and lead mining tend to occur
in Missouri, Tennessee, and Alaska. Metals generated from U.S. mining operations are used in a
wide range of products, including automobiles and electric and industrial equipment. The
extraction and beneficiation or other processing of these minerals generate large amounts of
waste.
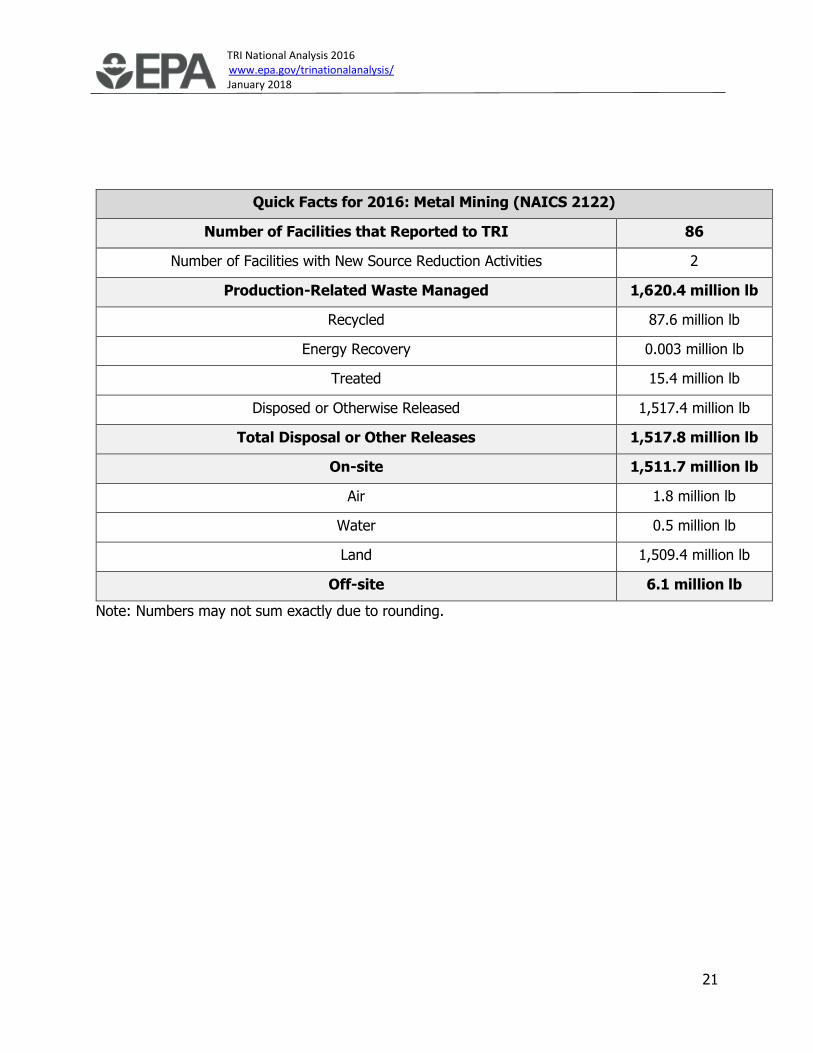
TRI National Analysis 2016 www.epa.gov/trinationalanalysis/ January 2018
21
Quick Facts for 2016: Metal Mining (NAICS 2122)
Number of Facilities that Reported to TRI 86
Number of Facilities with New Source Reduction Activities 2
Production-Related Waste Managed 1,620.4 million lb
Recycled 87.6 million lb
Energy Recovery 0.003 million lb
Treated 15.4 million lb
Disposed or Otherwise Released 1,517.4 million lb
Total Disposal or Other Releases 1,517.8 million lb
On-site 1,511.7 million lb
Air 1.8 million lb
Water 0.5 million lb
Land 1,509.4 million lb
Off-site 6.1 million lb
Note: Numbers may not sum exactly due to rounding.

TRI National Analysis 2016 www.epa.gov/trinationalanalysis/ January 2018
22
Metal Mining Waste Management Trend
The following graph shows the annual quantities of TRI chemicals managed as waste by the
metal mining industry.
From 2006 to 2016:
• While metal mining production (as reported in the United States Geological Survey)
remained relatively steady, the quantity of waste managed fluctuated.
• One factor other than production frequently cited by facilities as a contributor to the
changes in quantities of waste managed is the composition of the extracted ore and
waste rock, which can vary substantially from year to year. In some cases, small
changes in the waste’s composition can impact whether chemicals in waste rock qualify
for a concentration-based exemption from TRI reporting in one year, but not qualify for
the exemption the next year or vice versa.
From 2015 to 2016:
• The quantity of waste disposed of or otherwise released by this sector increased 19%
between 2015 and 2016.
0.0
0.6
1.2
1.8
2.4
3.0
0
500
1,000
1,500
2,000
2,500
2006 2007 2008 2009 2010 2011 2012 2013 2014 2015 2016
Millio
ns o
f Metric To
ns M
ine P
rod
uctio
nM
illio
ns
of
Po
un
ds
Year
Production-Related Waste Managed, Metal Mining
Disposed of or Otherwise Released Treated
Energy Recovery Recycled
Mine Production

TRI National Analysis 2016 www.epa.gov/trinationalanalysis/ January 2018
23
• One mine where releases of lead compounds increased significantly from 2015 to 2016
commented that lead compounds naturally occur in ore and releases are dependent on
ore grade, among other variables. Natural variation accounts for the difference in lead
compounds released from year to year.
• For 2016, 94% of the metal mining sector’s production-related waste was disposed of or
otherwise released. A majority of this waste was for metals, which were primarily
released to land on-site.
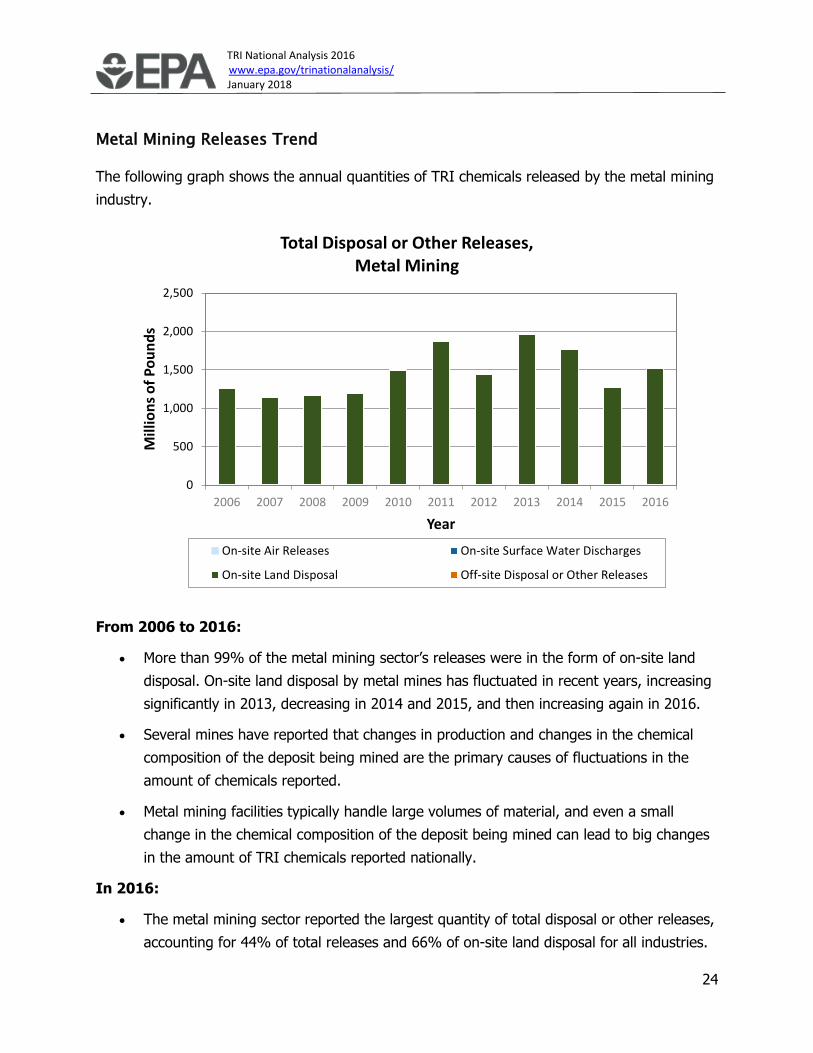
TRI National Analysis 2016 www.epa.gov/trinationalanalysis/ January 2018
24
Metal Mining Releases Trend
The following graph shows the annual quantities of TRI chemicals released by the metal mining
industry.
From 2006 to 2016:
• More than 99% of the metal mining sector’s releases were in the form of on-site land
disposal. On-site land disposal by metal mines has fluctuated in recent years, increasing
significantly in 2013, decreasing in 2014 and 2015, and then increasing again in 2016.
• Several mines have reported that changes in production and changes in the chemical
composition of the deposit being mined are the primary causes of fluctuations in the
amount of chemicals reported.
• Metal mining facilities typically handle large volumes of material, and even a small
change in the chemical composition of the deposit being mined can lead to big changes
in the amount of TRI chemicals reported nationally.
In 2016:
• The metal mining sector reported the largest quantity of total disposal or other releases,
accounting for 44% of total releases and 66% of on-site land disposal for all industries.
0
500
1,000
1,500
2,000
2,500
2006 2007 2008 2009 2010 2011 2012 2013 2014 2015 2016
Mill
ion
s o
f P
ou
nd
s
Year
Total Disposal or Other Releases, Metal Mining
On-site Air Releases On-site Surface Water Discharges
On-site Land Disposal Off-site Disposal or Other Releases
TRI National Analysis 2016 www.epa.gov/trinationalanalysis/ January 2018
25
Source Reduction in the Metal Mining Sector:
Two of the 86 metal mining facilities inititated source reduction activities in 2016 to reduce their
use of TRI chemicals, and generation of wastes that contain TRI chemicals. Wastes reported by
this sector are not especially amenable to source reduction, because they primarily reflect the
natural composition of the ore and waste rock. TRI’s Pollution Prevention Search Tool can help
you learn more about pollution prevention opportunities in this sector.
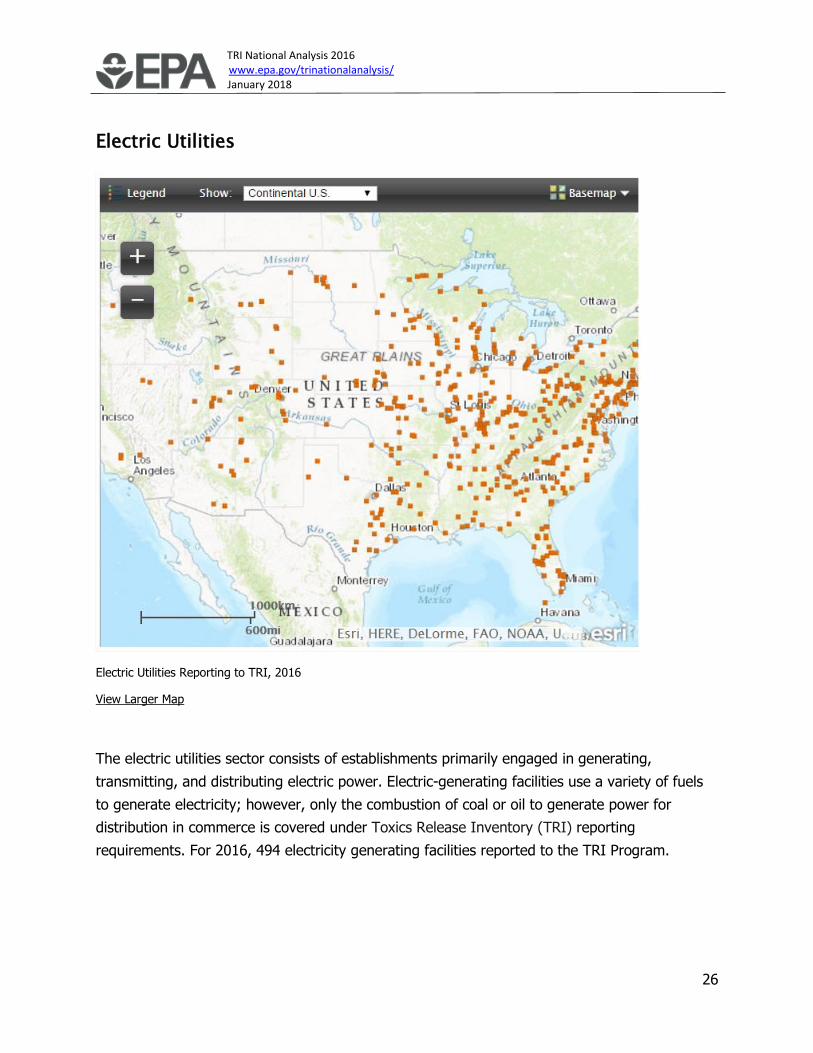
TRI National Analysis 2016 www.epa.gov/trinationalanalysis/ January 2018
26
Electric Utilities
Electric Utilities Reporting to TRI, 2016
View Larger Map
The electric utilities sector consists of establishments primarily engaged in generating,
transmitting, and distributing electric power. Electric-generating facilities use a variety of fuels
to generate electricity; however, only the combustion of coal or oil to generate power for
distribution in commerce is covered under Toxics Release Inventory (TRI) reporting
requirements. For 2016, 494 electricity generating facilities reported to the TRI Program.
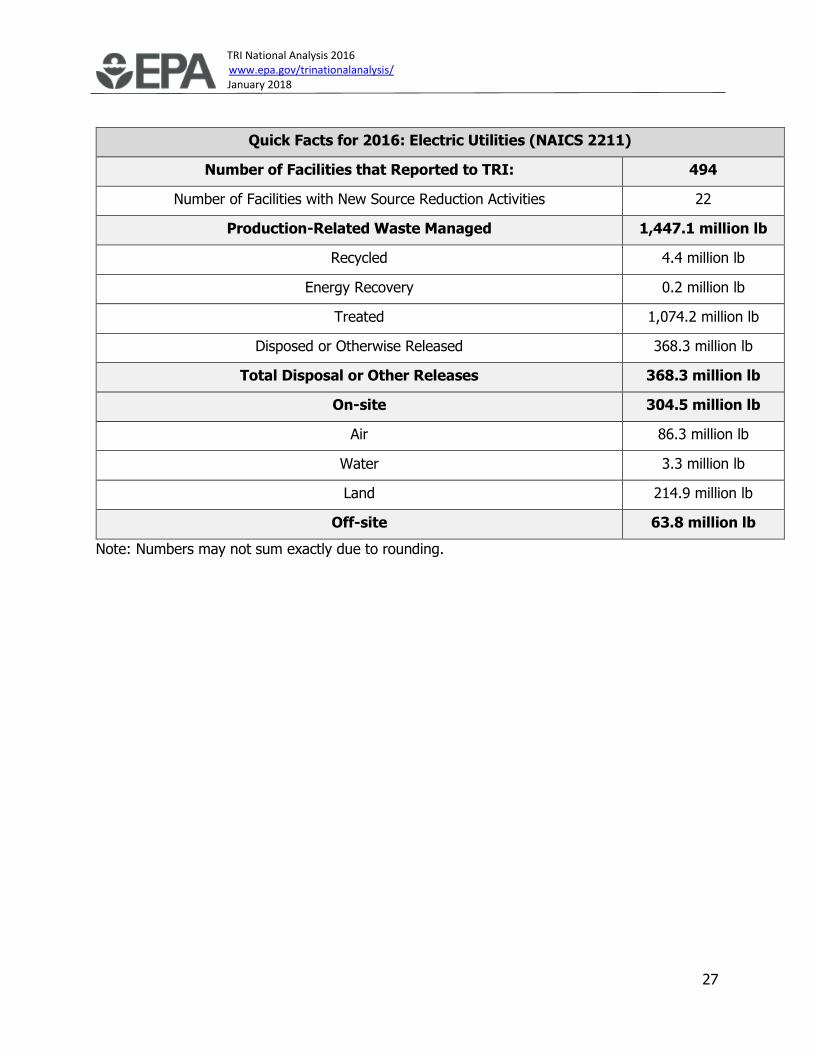
TRI National Analysis 2016 www.epa.gov/trinationalanalysis/ January 2018
27
Quick Facts for 2016: Electric Utilities (NAICS 2211)
Number of Facilities that Reported to TRI: 494
Number of Facilities with New Source Reduction Activities 22
Production-Related Waste Managed 1,447.1 million lb
Recycled 4.4 million lb
Energy Recovery 0.2 million lb
Treated 1,074.2 million lb
Disposed or Otherwise Released 368.3 million lb
Total Disposal or Other Releases 368.3 million lb
On-site 304.5 million lb
Air 86.3 million lb
Water 3.3 million lb
Land 214.9 million lb
Off-site 63.8 million lb
Note: Numbers may not sum exactly due to rounding.

TRI National Analysis 2016 www.epa.gov/trinationalanalysis/ January 2018
28
Electric Utilities Waste Management Trend
The following graph shows the annual quantities of TRI chemicals electric utility facilities
manage as waste.
From 2006 to 2016:
• Production-related waste managed decreased by 453 million pounds (24%) since 2006.
• Net electricity generation decreased by 38% (in terms of electricity generated using coal
and oil fuels as reported by the U.S. Department of Energy's Energy Information
Administration). The recent production decrease (beginning in 2014) was driven by the
industry’s transition to natural gas, as only facilities that combust coal or oil to produce
power are covered under TRI reporting requirements.
• Per gigawatt-hour (GWH) produced, releases decreased dramatically (42%), while
quantities treated increased.
In 2016:
• Approximately three-quarters of the total production-related waste was treated, while
one-quarter was released to the environment.
0.0
0.5
1.0
1.5
2.0
2.5
0
600
1,200
1,800
2,400
3,000
2006 2007 2008 2009 2010 2011 2012 2013 2014 2015 2016
Millio
ns o
f GH
W Electricity P
rod
uctio
nM
illio
ns
of
Po
un
ds
Year
Production-Related Waste Managed: Electric Utilities
Disposed of or Otherwise Released TreatedEnergy Recovery RecycledElectricity Generation
TRI National Analysis 2016 www.epa.gov/trinationalanalysis/ January 2018
29
o This is in contrast to 2006, when over half of the waste was released. This trend
is largely due to an increase in scrubbers at electric utilities that treat (or
destroy) TRI reportable acid gases that would otherwise be released on-site to
the air.
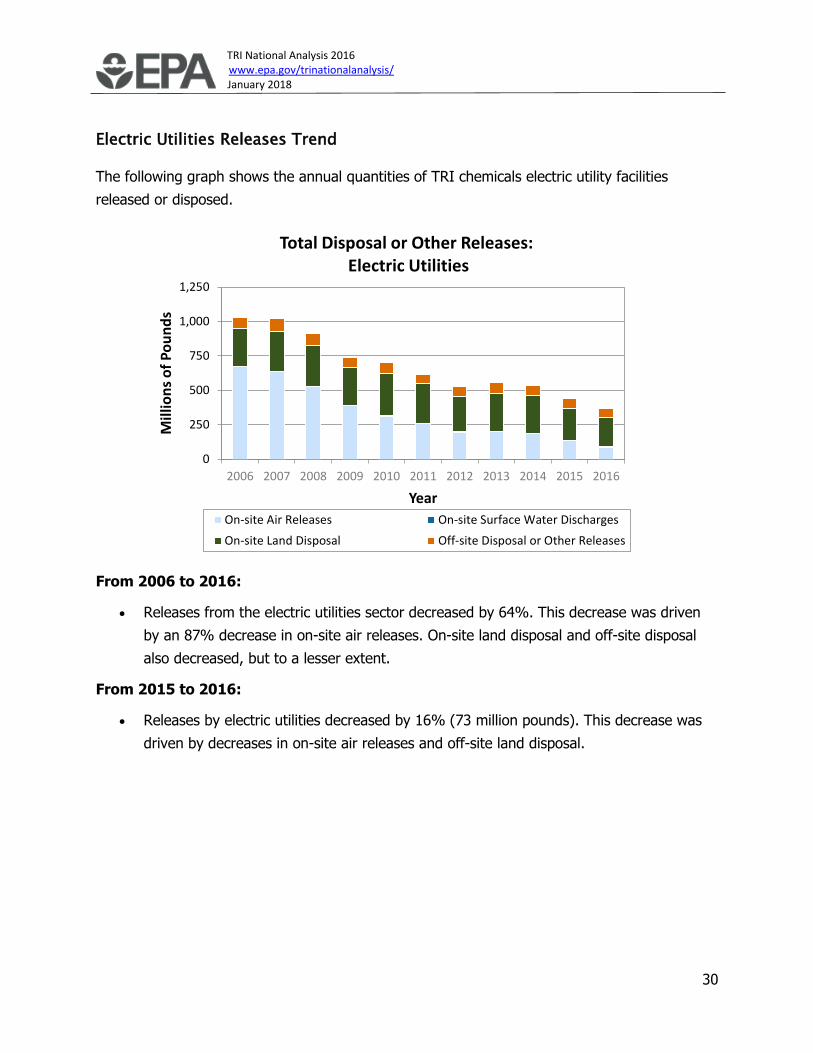
TRI National Analysis 2016 www.epa.gov/trinationalanalysis/ January 2018
30
Electric Utilities Releases Trend
The following graph shows the annual quantities of TRI chemicals electric utility facilities
released or disposed.
From 2006 to 2016:
• Releases from the electric utilities sector decreased by 64%. This decrease was driven
by an 87% decrease in on-site air releases. On-site land disposal and off-site disposal
also decreased, but to a lesser extent.
From 2015 to 2016:
• Releases by electric utilities decreased by 16% (73 million pounds). This decrease was
driven by decreases in on-site air releases and off-site land disposal.
0
250
500
750
1,000
1,250
2006 2007 2008 2009 2010 2011 2012 2013 2014 2015 2016
Mill
ion
s o
f P
ou
nd
s
Year
Total Disposal or Other Releases:Electric Utilities
On-site Air Releases On-site Surface Water Discharges
On-site Land Disposal Off-site Disposal or Other Releases

TRI National Analysis 2016 www.epa.gov/trinationalanalysis/ January 2018
31
Electric Utilities Mercury Releases
Coal and fuel oil contain trace amounts of mercury. When coal or oil is burned by power plants
to produce energy, mercury can be emitted to air in the form of stack emissions unless
removed by pollution control devices. Examining the trend in mercury emissions shows that the
sector’s releases dropped by 46% (68 thousand pounds) since 2006:
• The considerable decrease in mercury releases was driven by an 86% (79 thousand
pounds) decrease in mercury air emissions. This drop was offset somewhat by increased
releases of mercury to land.
• While decreased use of coal to generate electricity does play a role, mercury releases
per gigawatt-hour (GWh) of electricity generated dropped even more dramatically.
-
20
40
60
80
100
120
140
160
2006 2007 2008 2009 2010 2011 2012 2013 2014 2015 2016
Tho
usa
nd
s o
f P
ou
nd
s
Year
Total Disposal or Other Releases of Mercury:Electric Utilities
On-site Air Releases On-site Surface Water Discharges
On-site Land Disposal Off-site Disposal or Other Releases

TRI National Analysis 2016 www.epa.gov/trinationalanalysis/ January 2018
32
• Since 2006, net electricity generation from coal decreased by 38%, while the rate of
release of mercury to air per GWh of electricity generated from coal dropped 77%.
• In 2016, over three times as much mercury (in coal ash) was disposed of on land
compared to mercury released to air. In 2006, the amount of mercury disposed on land
was less than half that released to air. This shift in the release trend reflects higher rates
of mercury capture and disposal due to improved air emissions controls, such as
activated carbon injection systems installed at electric utilities.
• The recent rise in installations of equipment to control mercury air emissions at coal-
fired power plants to meet regulatory requirements is detailed in a data analysis by the
U.S. Energy Information Administration.
Source Reduction in the Electric Utilities Sector:
In the electric utilities sector, 22 (4%) facilities initiated source reduction activities in 2016 to
reduce their use of TRI chemicals and generation of wastes that contain TRI chemicals. Note
that adding treatment equipment is considered a control technology for TRI chemical waste that
is generated, and is not a source reduction activity that prevents waste from being generated.
The most commonly reported types of source reduction activities for this sector were good
operating practices and process modifications, which include activities such as modifying
-100%
-80%
-60%
-40%
-20%
0%
2006 2007 2008 2009 2010 2011 2012 2013 2014 2015 2016
Ch
ange
sin
ce 2
00
6Reductions in Mercury Air Emission Rate Outpace Drop in Coal Use
Coal Generation Mercury Release Factor to Air(g / MWh Coal)
Mercury Released to Air
-86%
-77%
-38%
TRI National Analysis 2016 www.epa.gov/trinationalanalysis/ January 2018
33
equipment, layout, or piping. TRI’s Pollution Prevention Search Tool can help you learn more
about pollution prevention opportunities in this sector.

TRI National Analysis 2016 www.epa.gov/trinationalanalysis/ January 2018
34
Federal Facilities
Federal Facilities Reporting to TRI, 2016
View Larger Map
Under the 1993 Executive Order 12856, “Federal Compliance with Right-to-Know Law and
Pollution Prevention Requirements,” all federal facilities are subject to the Toxics Release
Inventory (TRI) reporting requirements, regardless of the type of operations at the facility, as
described by their NAICS code. These actions were affirmed in March 2015 through Executive
Order 13693, “Planning for Federal Sustainability in the Next Decade.” Due to these requirements,
federal facilities are subject to the TRI reporting requirements.
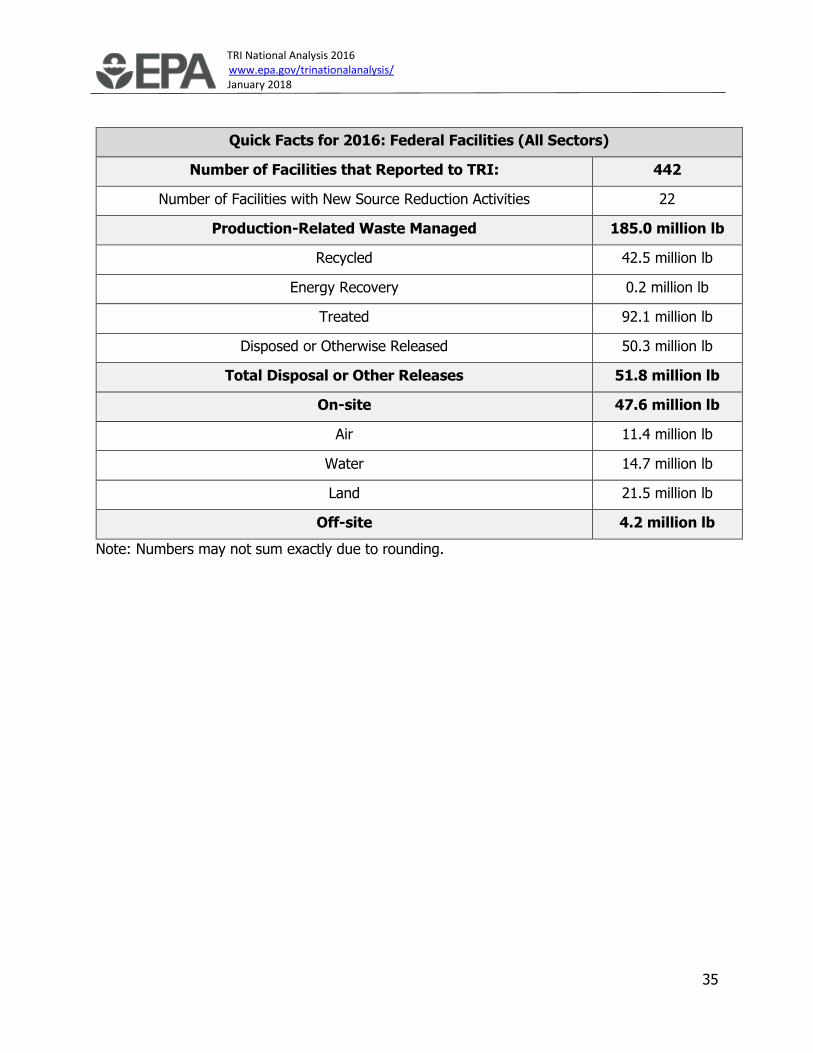
TRI National Analysis 2016 www.epa.gov/trinationalanalysis/ January 2018
35
Quick Facts for 2016: Federal Facilities (All Sectors)
Number of Facilities that Reported to TRI: 442
Number of Facilities with New Source Reduction Activities 22
Production-Related Waste Managed 185.0 million lb
Recycled 42.5 million lb
Energy Recovery 0.2 million lb
Treated 92.1 million lb
Disposed or Otherwise Released 50.3 million lb
Total Disposal or Other Releases 51.8 million lb
On-site 47.6 million lb
Air 11.4 million lb
Water 14.7 million lb
Land 21.5 million lb
Off-site 4.2 million lb
Note: Numbers may not sum exactly due to rounding.
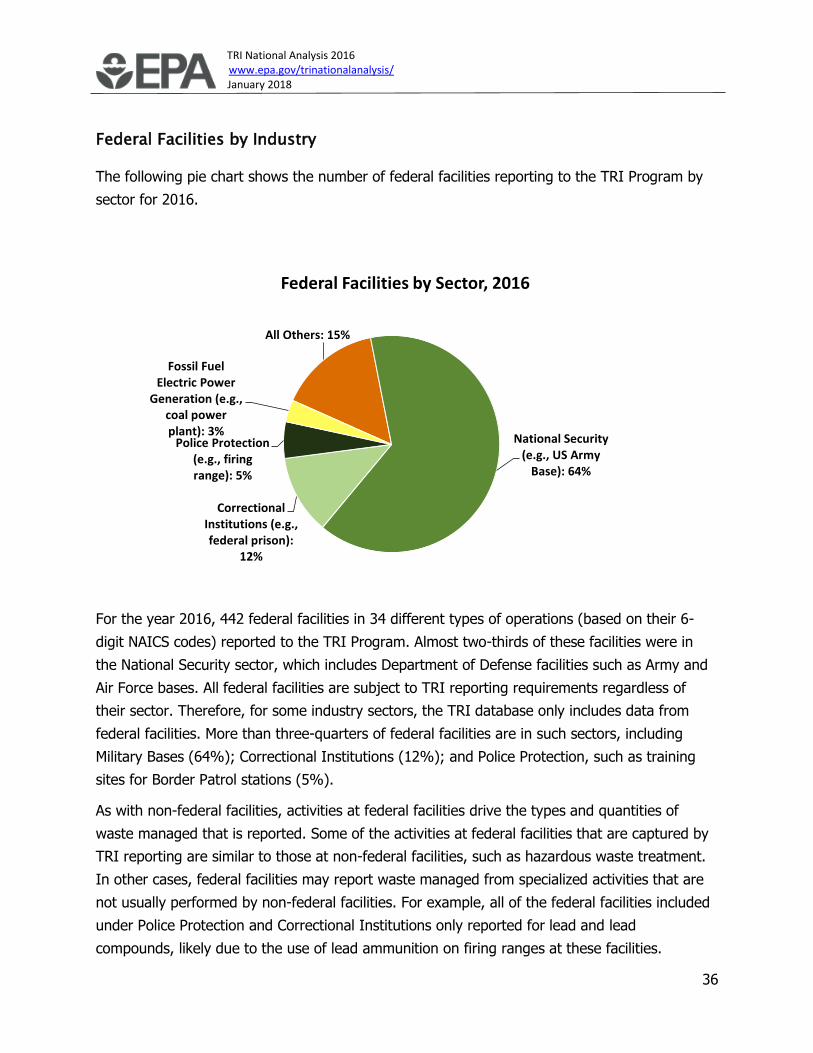
TRI National Analysis 2016 www.epa.gov/trinationalanalysis/ January 2018
36
Federal Facilities by Industry
The following pie chart shows the number of federal facilities reporting to the TRI Program by
sector for 2016.
For the year 2016, 442 federal facilities in 34 different types of operations (based on their 6-
digit NAICS codes) reported to the TRI Program. Almost two-thirds of these facilities were in
the National Security sector, which includes Department of Defense facilities such as Army and
Air Force bases. All federal facilities are subject to TRI reporting requirements regardless of
their sector. Therefore, for some industry sectors, the TRI database only includes data from
federal facilities. More than three-quarters of federal facilities are in such sectors, including
Military Bases (64%); Correctional Institutions (12%); and Police Protection, such as training
sites for Border Patrol stations (5%).
As with non-federal facilities, activities at federal facilities drive the types and quantities of
waste managed that is reported. Some of the activities at federal facilities that are captured by
TRI reporting are similar to those at non-federal facilities, such as hazardous waste treatment.
In other cases, federal facilities may report waste managed from specialized activities that are
not usually performed by non-federal facilities. For example, all of the federal facilities included
under Police Protection and Correctional Institutions only reported for lead and lead
compounds, likely due to the use of lead ammunition on firing ranges at these facilities.
All Others: 15%
National Security (e.g., US Army
Base): 64%
Correctional Institutions (e.g., federal prison):
12%
Police Protection (e.g., firing range): 5%
Fossil Fuel Electric Power
Generation (e.g., coal power plant): 3%
Federal Facilities by Sector, 2016
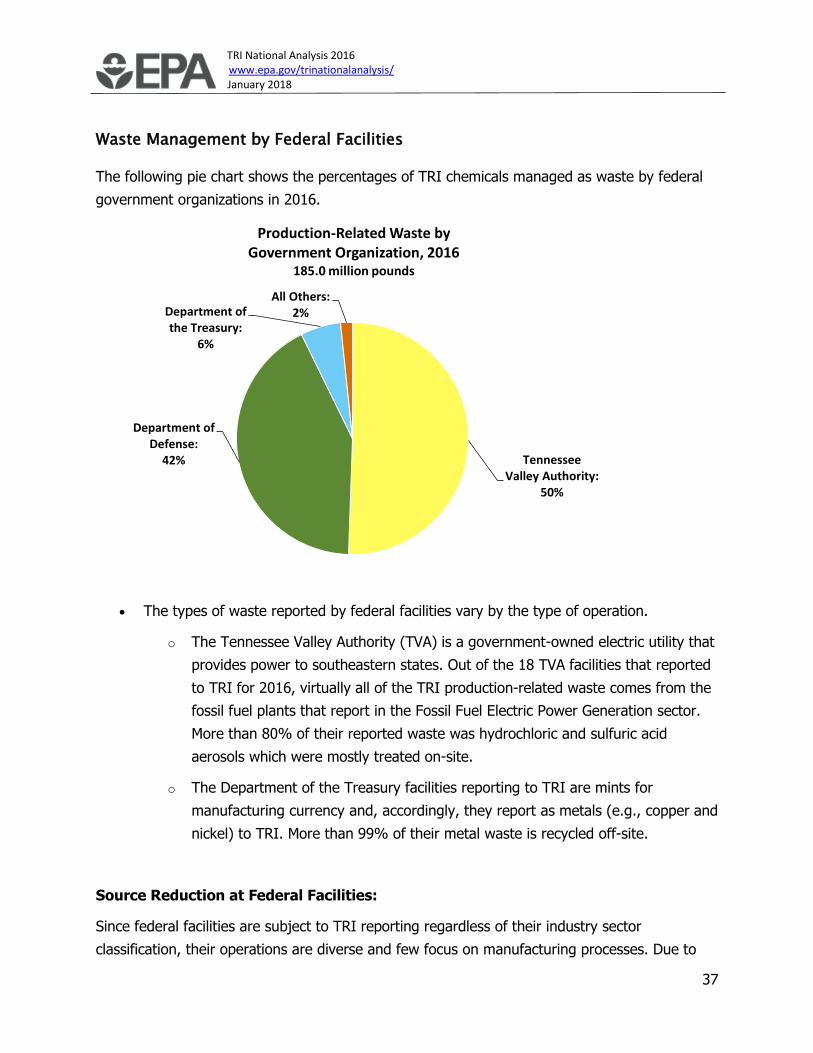
TRI National Analysis 2016 www.epa.gov/trinationalanalysis/ January 2018
37
Waste Management by Federal Facilities
The following pie chart shows the percentages of TRI chemicals managed as waste by federal
government organizations in 2016.
• The types of waste reported by federal facilities vary by the type of operation.
o The Tennessee Valley Authority (TVA) is a government-owned electric utility that
provides power to southeastern states. Out of the 18 TVA facilities that reported
to TRI for 2016, virtually all of the TRI production-related waste comes from the
fossil fuel plants that report in the Fossil Fuel Electric Power Generation sector.
More than 80% of their reported waste was hydrochloric and sulfuric acid
aerosols which were mostly treated on-site.
o The Department of the Treasury facilities reporting to TRI are mints for
manufacturing currency and, accordingly, they report as metals (e.g., copper and
nickel) to TRI. More than 99% of their metal waste is recycled off-site.
Source Reduction at Federal Facilities:
Since federal facilities are subject to TRI reporting regardless of their industry sector
classification, their operations are diverse and few focus on manufacturing processes. Due to
Tennessee Valley Authority:
50%
Department of Defense:
42%
Department of the Treasury:
6%
All Others:2%
Production-Related Waste by Government Organization, 2016
185.0 million pounds

TRI National Analysis 2016 www.epa.gov/trinationalanalysis/ January 2018
38
their unique functions, some federal facilities may face challenges in implementing source
reduction strategies to reduce chemical waste. For the 2016 reporting year, 22 federal facilities
(5%) reported implementing source reduction activities.
Facilities that do not implement source reduction activities may elect to indicate the types of
barriers to source reduction they encountered. For federal facilities, most of the facilities that
indicate barriers to implementing source reduction are national security or correctional
institutions that report on lead or copper. For example, several facilities in the National Security
sector indicated that they reported on lead because it is contained in the ammunition used on
site and they have not been able to identify ammunition that does not contain lead. However,
other federal facilities have been able to implement some source reduction activities. To find
examples of federal facilities’ source reduction activities, visit TRI’s Pollution Prevention Search
Tool and select industry sectors, such as National Security, Correctional Institutions, or Police
Protection.

TRI National Analysis 2016 www.epa.gov/trinationalanalysis/ January 2018
1
Where You Live
This section the National Analysis looks at releases and other disposal of TRI chemicals that
occurred at various geographic levels throughout the United States.
To view a summary of Toxics Release Inventory (TRI) data, select search parameters within the
top two rows or query the map directly. In addition to viewing the maps based on releases, you
can also view the maps based on "RSEI Risk-Screening Scores." RSEI risk-screening scores are
estimates of potential human health risk generated by EPA's publicly available Risk-Screening
Environmental Indicators (RSEI) model. These unitless scores represent relative human health
risk from chronic exposures to TRI chemicals and allow one to compare RSEI scores across
locations. For more on RSEI, see the Hazard and Potential Risk of TRI Chemicals section.
States
States include all U.S. territories for a total of 56 states/territories. All states have facilities that
reported releases to the TRI Program for the 2016 reporting year. The states with the greatest
number of facilities that reported are Texas, Ohio and California, which together accounted for
TRI National Analysis 2016 www.epa.gov/trinationalanalysis/ January 2018
2
20% of total reporting facilities in 2016. Selecting a state on the map will provide a pop-up
with:
• a state level summary of TRI data
• a link to the state level TRI fact sheet
• an option to zoom to the counties within the state.
Metropolitan Areas
More than 80% of the United States’ population and many of the industrial facilities that report
to the TRI Program are located in urban areas. This map option shows all metropolitan and
micropolitan statistical areas (metro and micro areas) in the United States as defined by the
Office of Management and Budget (OMB) within which TRI-reported releases occurred in 2016.
Metro and micro areas consist of one or more socially and economically integrated adjacent
counties, cities, or towns. Click on any of these areas on the map for an analysis of TRI data
specific to each.
Watersheds
A watershed is the land area that drains to a common waterway. Rivers, lakes, estuaries,
wetlands, streams, and oceans are catch basins for the land adjacent to them. Ground water
aquifers are replenished based on water flowing down through the land area above them.
Large aquatic ecosystems (LAEs) comprise multiple small watersheds and water resources
within a large geographic area. The Large Aquatic Ecosystems Council was created by the U.S.
Environmental Protection Agency in 2008 to focus on protecting and restoring the health of
critical aquatic ecosystems. Currently, there are 10 LAEs in this program. Click on any of the 10
LAEs featured on the map to see an analysis of toxic chemical releases in each LAE.
Water pollution, surface runoff, contaminated sediment, discharges of toxic chemicals, and air
emissions can affect the quality of the land, water, and living resources within an aquatic
ecosystem. Persistent, bioaccumulative and toxic chemicals can be especially problematic in
aquatic ecosystems because pollutants can accumulate in sediments and may bioaccumulate in
aquatic organisms and the tissues of fish and other wildlife within the food chain to
concentrations many times higher than in the water or air, which ultimately may cause
environmental health problems for humans and wildlife.
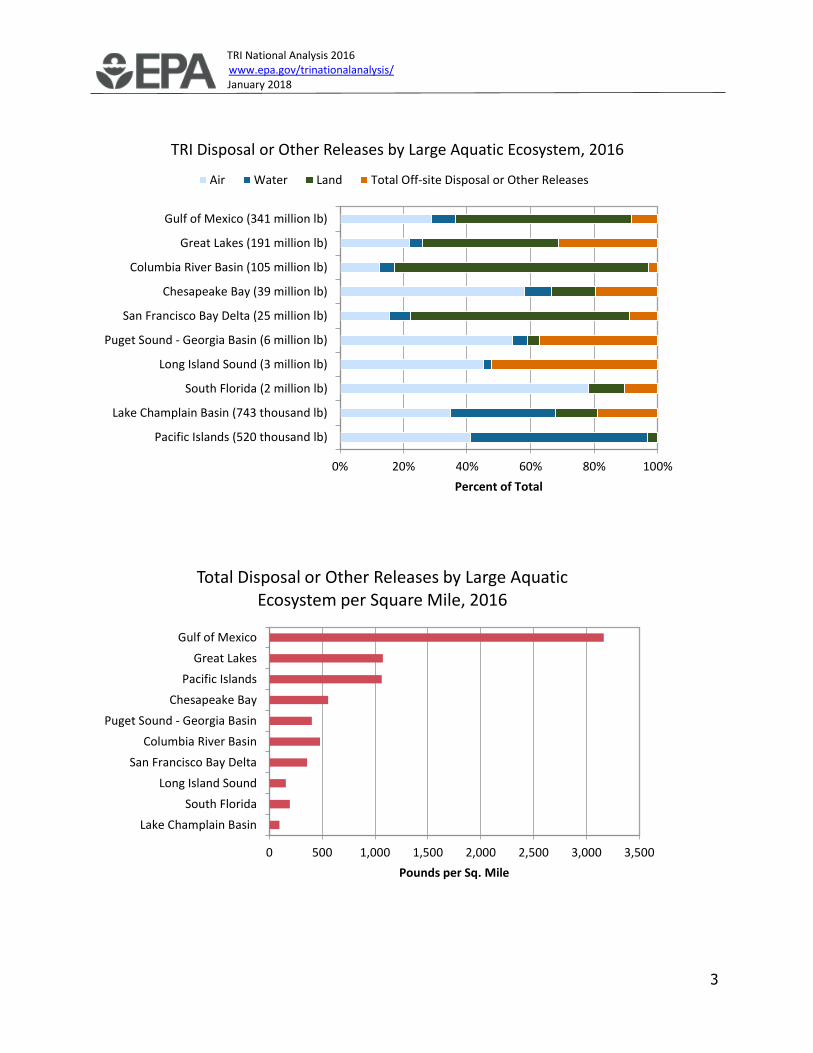
TRI National Analysis 2016 www.epa.gov/trinationalanalysis/ January 2018
3
0% 20% 40% 60% 80% 100%
Pacific Islands (520 thousand lb)
Lake Champlain Basin (743 thousand lb)
South Florida (2 million lb)
Long Island Sound (3 million lb)
Puget Sound - Georgia Basin (6 million lb)
San Francisco Bay Delta (25 million lb)
Chesapeake Bay (39 million lb)
Columbia River Basin (105 million lb)
Great Lakes (191 million lb)
Gulf of Mexico (341 million lb)
Percent of Total
TRI Disposal or Other Releases by Large Aquatic Ecosystem, 2016
Air Water Land Total Off-site Disposal or Other Releases
0 500 1,000 1,500 2,000 2,500 3,000 3,500
Lake Champlain Basin
South Florida
Long Island Sound
San Francisco Bay Delta
Columbia River Basin
Puget Sound - Georgia Basin
Chesapeake Bay
Pacific Islands
Great Lakes
Gulf of Mexico
Pounds per Sq. Mile
Total Disposal or Other Releases by Large Aquatic Ecosystem per Square Mile, 2016

TRI National Analysis 2016 www.epa.gov/trinationalanalysis/ January 2018
4
Tribal Communities
Under EPA policy, the Agency works with federally recognized tribes on a government-to-
government basis to protect the land, air, and water in Indian country and Alaska Native
villages and to support tribal assumption of program authority. Facilities located in Indian
country that meet TRI reporting requirements must indicate the appropriate three-digit Bureau
of Indian Affairs (BIA) tribal code on annual TRI reporting forms.
In 2016, there were 40 facilities located in the Indian country of 16 different federally
recognized tribes. These facilities reported a total of 25 million pounds of production-related
waste and 9 million pounds of releases (total disposal or other releases). Over 99% of the TRI
releases in Indian country occurred on-site. 94% of these releases were land releases reported
by electric utilities and metal mining facilities. In 2016, these facilities primarily released metal
compounds such as lead and barium. Lead is often present in the mineral ore disposed of by
metal mines, whereas barium is present in coal and oil burned at electric utilities.
The table below provides more details about various types of releases and waste management
reported by facilities on federally recognized tribal lands.
Quick Facts for 2016: Facilities on Tribal Lands
Number of Facilities that Reported to TRI 40
Number of Tribes with TRI Facilities 16
Production-Related Waste Managed 25.43 million lb
Recycled 7.95 million lb
Energy Recovery 3.27 million lb
Treated 5.49 million lb
Disposed or Otherwise Released 8.72 million lb
Total Disposal or Other Releases 8.72 million lb
On-site 8.68 million lb
Air 0.60 million lb
Water 3.04 thousand lb
Land 8.08 million lb
Off-site 0.04 million lb
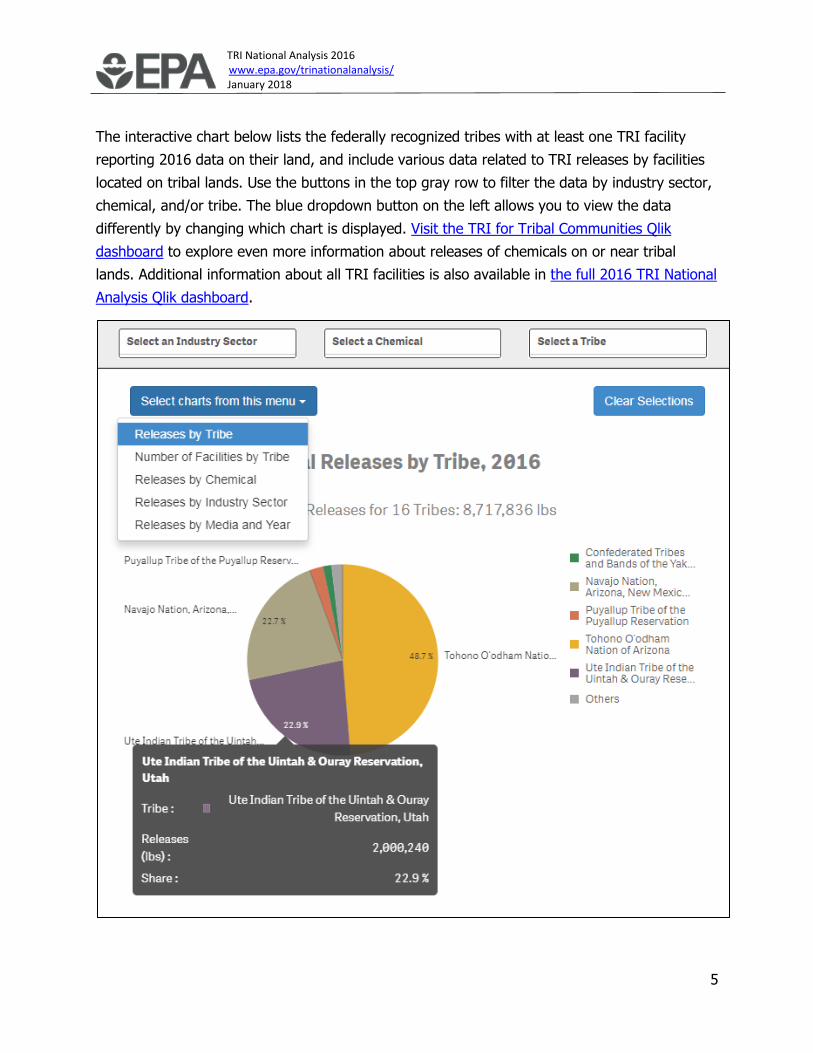
TRI National Analysis 2016 www.epa.gov/trinationalanalysis/ January 2018
5
The interactive chart below lists the federally recognized tribes with at least one TRI facility
reporting 2016 data on their land, and include various data related to TRI releases by facilities
located on tribal lands. Use the buttons in the top gray row to filter the data by industry sector,
chemical, and/or tribe. The blue dropdown button on the left allows you to view the data
differently by changing which chart is displayed. Visit the TRI for Tribal Communities Qlik
dashboard to explore even more information about releases of chemicals on or near tribal
lands. Additional information about all TRI facilities is also available in the full 2016 TRI National
Analysis Qlik dashboard.
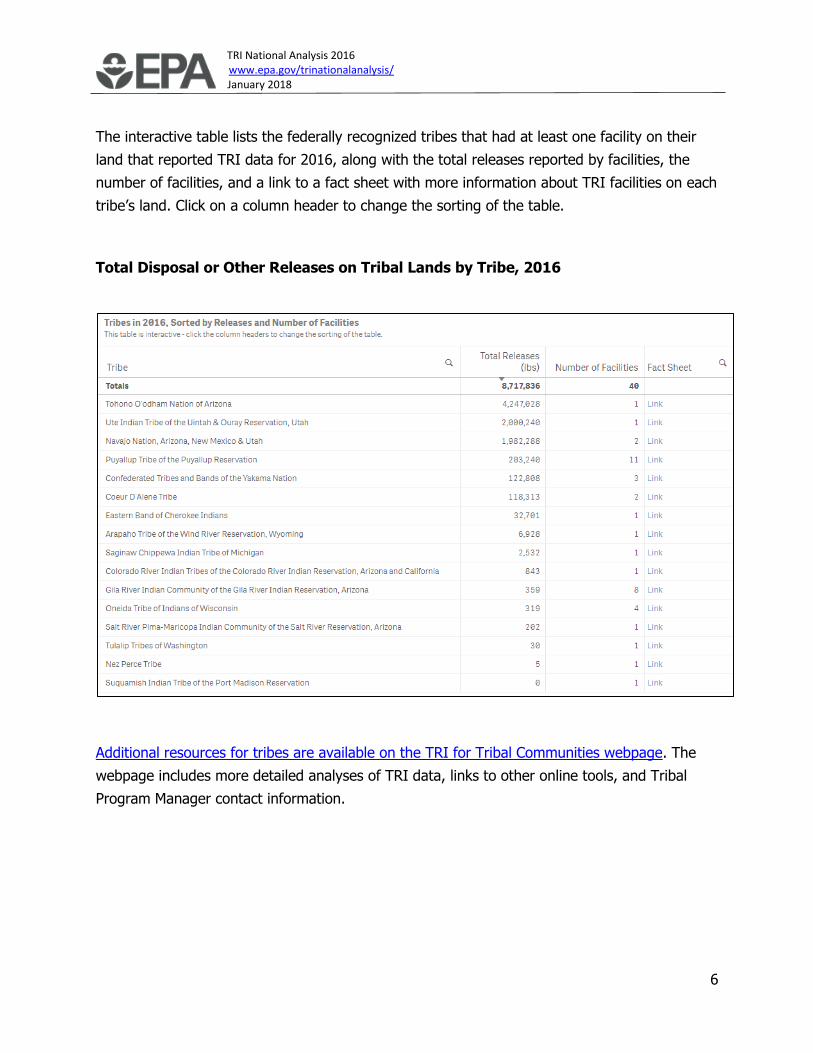
TRI National Analysis 2016 www.epa.gov/trinationalanalysis/ January 2018
6
The interactive table lists the federally recognized tribes that had at least one facility on their
land that reported TRI data for 2016, along with the total releases reported by facilities, the
number of facilities, and a link to a fact sheet with more information about TRI facilities on each
tribe’s land. Click on a column header to change the sorting of the table.
Total Disposal or Other Releases on Tribal Lands by Tribe, 2016
Additional resources for tribes are available on the TRI for Tribal Communities webpage. The
webpage includes more detailed analyses of TRI data, links to other online tools, and Tribal
Program Manager contact information.
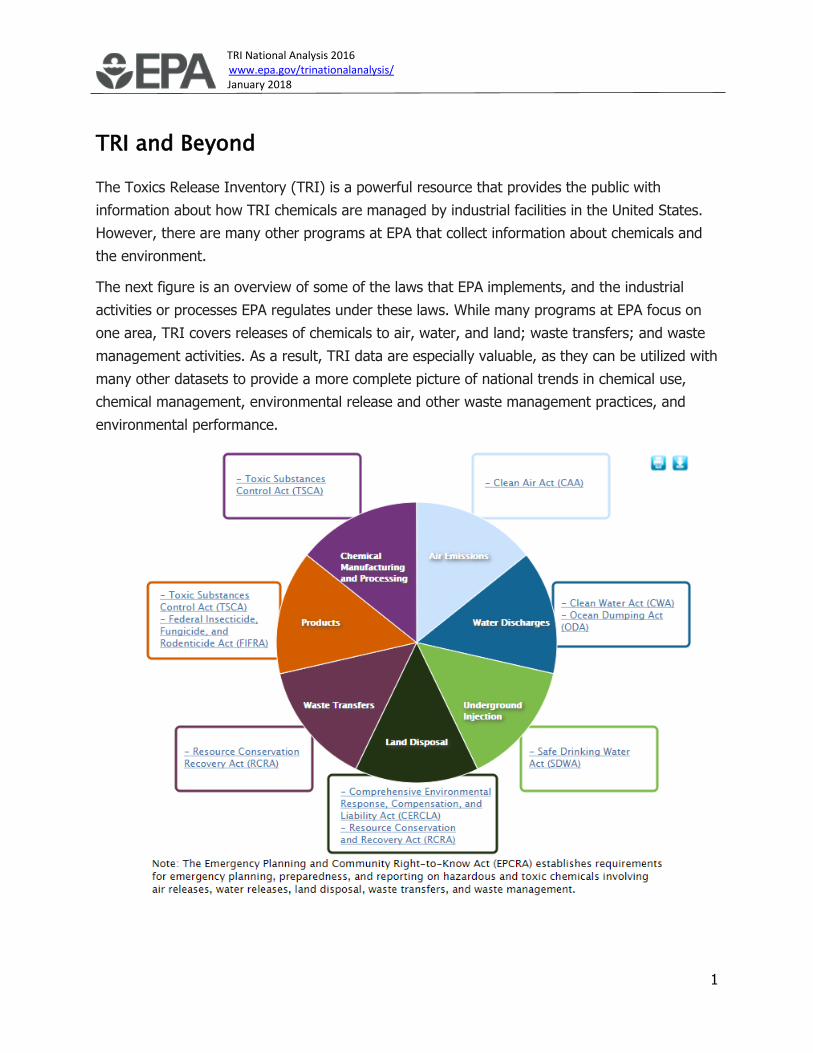
TRI National Analysis 2016 www.epa.gov/trinationalanalysis/ January 2018
1
TRI and Beyond
The Toxics Release Inventory (TRI) is a powerful resource that provides the public with
information about how TRI chemicals are managed by industrial facilities in the United States.
However, there are many other programs at EPA that collect information about chemicals and
the environment.
The next figure is an overview of some of the laws that EPA implements, and the industrial
activities or processes EPA regulates under these laws. While many programs at EPA focus on
one area, TRI covers releases of chemicals to air, water, and land; waste transfers; and waste
management activities. As a result, TRI data are especially valuable, as they can be utilized with
many other datasets to provide a more complete picture of national trends in chemical use,
chemical management, environmental release and other waste management practices, and
environmental performance.
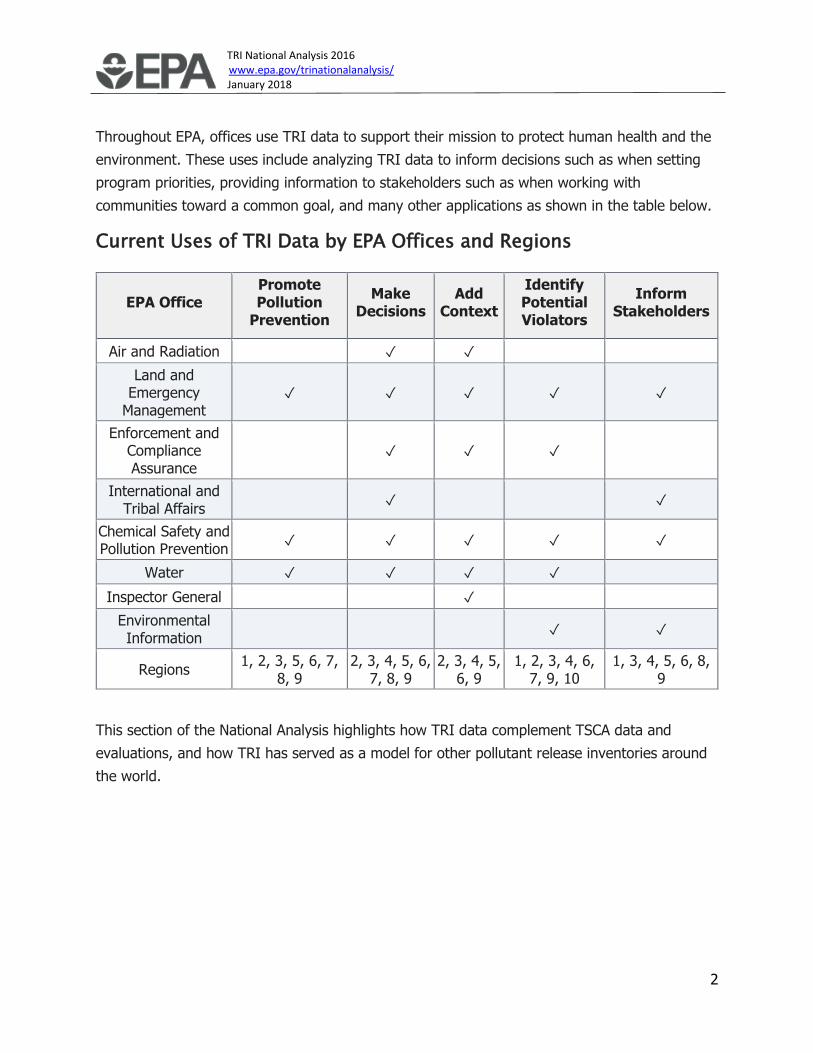
TRI National Analysis 2016 www.epa.gov/trinationalanalysis/ January 2018
2
Throughout EPA, offices use TRI data to support their mission to protect human health and the
environment. These uses include analyzing TRI data to inform decisions such as when setting
program priorities, providing information to stakeholders such as when working with
communities toward a common goal, and many other applications as shown in the table below.
Current Uses of TRI Data by EPA Offices and Regions
EPA Office Promote Pollution
Prevention
Make Decisions
Add Context
Identify Potential Violators
Inform Stakeholders
Air and Radiation ✓ ✓
Land and Emergency
Management ✓ ✓ ✓ ✓ ✓
Enforcement and Compliance Assurance
✓ ✓ ✓
International and Tribal Affairs
✓ ✓
Chemical Safety and Pollution Prevention
✓ ✓ ✓ ✓ ✓
Water ✓ ✓ ✓ ✓
Inspector General ✓
Environmental Information
✓ ✓
Regions 1, 2, 3, 5, 6, 7,
8, 9 2, 3, 4, 5, 6,
7, 8, 9 2, 3, 4, 5,
6, 9 1, 2, 3, 4, 6,
7, 9, 10 1, 3, 4, 5, 6, 8,
9
This section of the National Analysis highlights how TRI data complement TSCA data and
evaluations, and how TRI has served as a model for other pollutant release inventories around
the world.
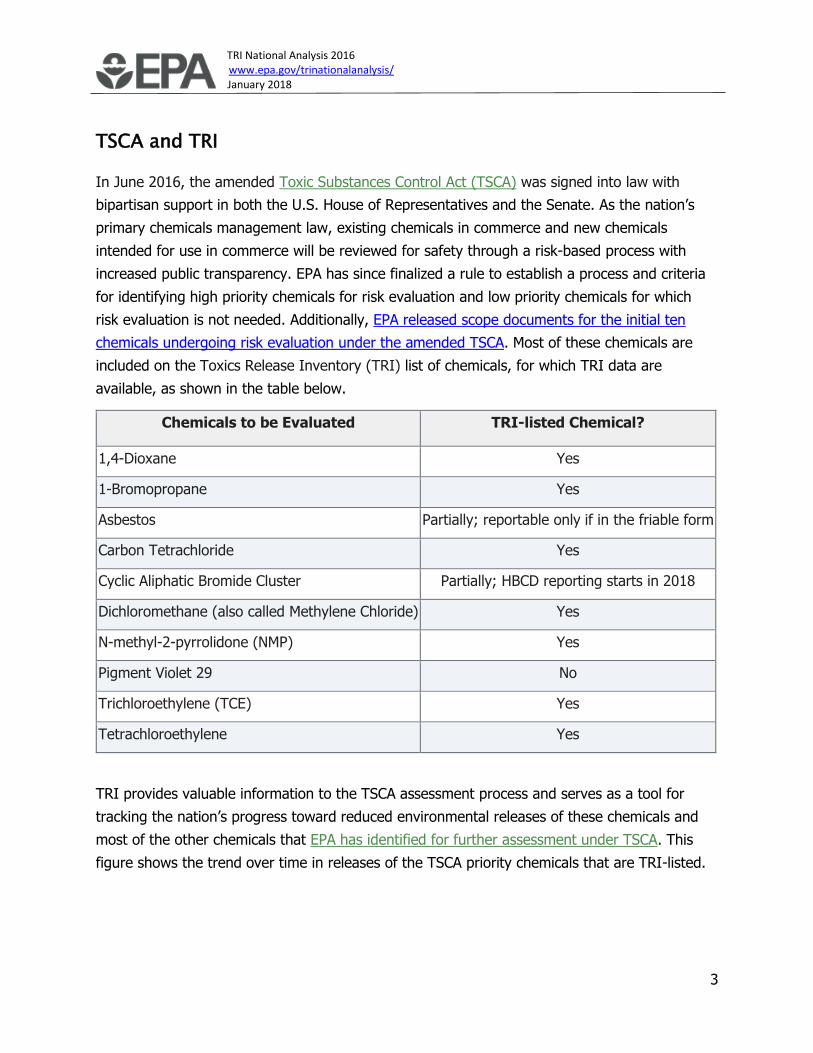
TRI National Analysis 2016 www.epa.gov/trinationalanalysis/ January 2018
3
TSCA and TRI
In June 2016, the amended Toxic Substances Control Act (TSCA) was signed into law with
bipartisan support in both the U.S. House of Representatives and the Senate. As the nation’s
primary chemicals management law, existing chemicals in commerce and new chemicals
intended for use in commerce will be reviewed for safety through a risk-based process with
increased public transparency. EPA has since finalized a rule to establish a process and criteria
for identifying high priority chemicals for risk evaluation and low priority chemicals for which
risk evaluation is not needed. Additionally, EPA released scope documents for the initial ten
chemicals undergoing risk evaluation under the amended TSCA. Most of these chemicals are
included on the Toxics Release Inventory (TRI) list of chemicals, for which TRI data are
available, as shown in the table below.
Chemicals to be Evaluated TRI-listed Chemical?
1,4-Dioxane Yes
1-Bromopropane Yes
Asbestos Partially; reportable only if in the friable form
Carbon Tetrachloride Yes
Cyclic Aliphatic Bromide Cluster Partially; HBCD reporting starts in 2018
Dichloromethane (also called Methylene Chloride) Yes
N-methyl-2-pyrrolidone (NMP) Yes
Pigment Violet 29 No
Trichloroethylene (TCE) Yes
Tetrachloroethylene Yes
TRI provides valuable information to the TSCA assessment process and serves as a tool for
tracking the nation’s progress toward reduced environmental releases of these chemicals and
most of the other chemicals that EPA has identified for further assessment under TSCA. This
figure shows the trend over time in releases of the TSCA priority chemicals that are TRI-listed.
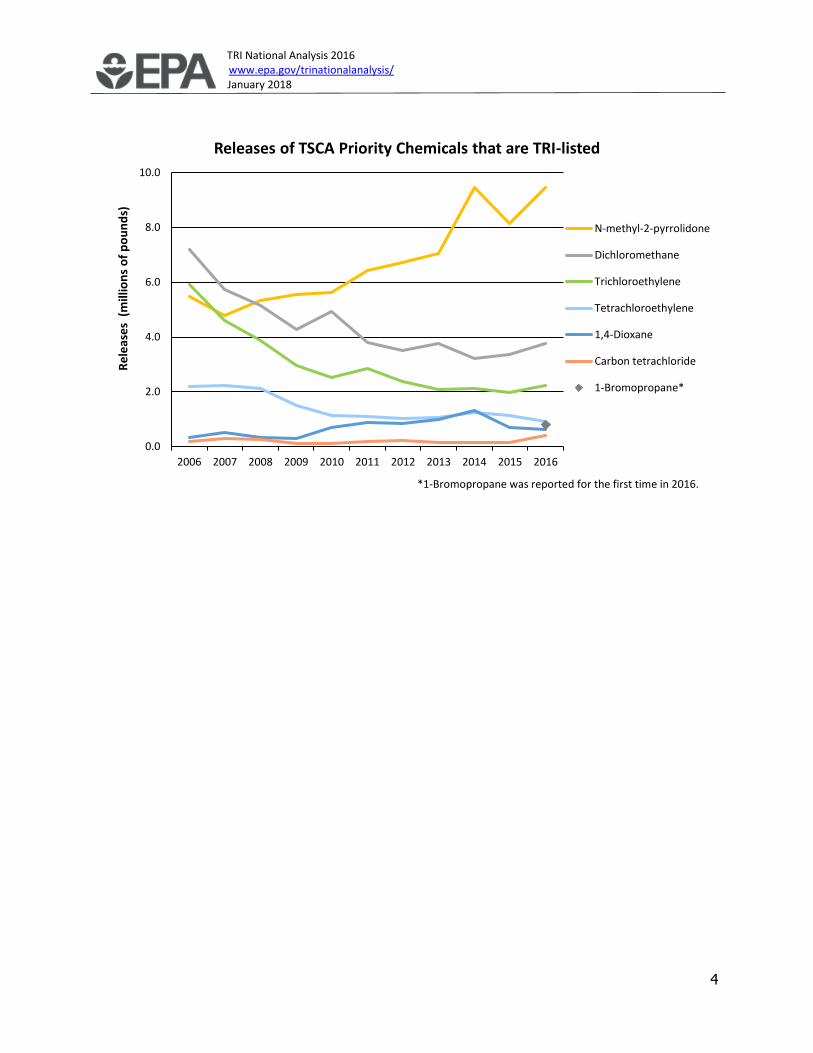
TRI National Analysis 2016 www.epa.gov/trinationalanalysis/ January 2018
4
0.0
2.0
4.0
6.0
8.0
10.0
2006 2007 2008 2009 2010 2011 2012 2013 2014 2015 2016
Re
leas
es
(m
illio
ns
of
po
un
ds)
Releases of TSCA Priority Chemicals that are TRI-listed
N-methyl-2-pyrrolidone
Dichloromethane
Trichloroethylene
Tetrachloroethylene
1,4-Dioxane
Carbon tetrachloride
1-Bromopropane*
*1-Bromopropane was reported for the first time in 2016.
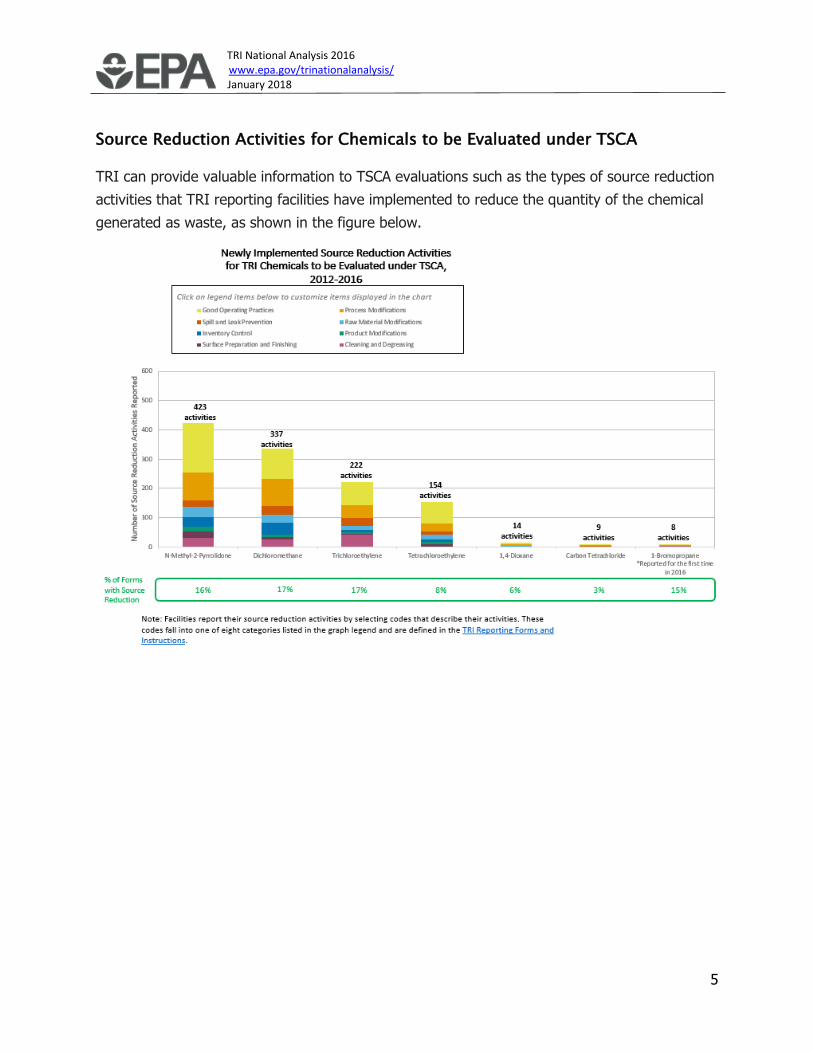
TRI National Analysis 2016 www.epa.gov/trinationalanalysis/ January 2018
5
Source Reduction Activities for Chemicals to be Evaluated under TSCA
TRI can provide valuable information to TSCA evaluations such as the types of source reduction
activities that TRI reporting facilities have implemented to reduce the quantity of the chemical
generated as waste, as shown in the figure below.

TRI National Analysis 2016 www.epa.gov/trinationalanalysis/ January 2018
6
Barriers to Source Reduction for Chemicals to be Evaluated under TSCA
Since 2014, facilities that report to TRI have the option to report barriers they encountered to
source reduction. The barriers reported to TRI are shown in the figure below for the seven
chemicals that are fully TRI-listed among the first chemicals that EPA will evaluate for potential
risks to human health and the environment under the amended Toxic Substances Control Act
(TSCA).

TRI National Analysis 2016 www.epa.gov/trinationalanalysis/ January 2018
7
Comparing TRI and Chemical Data Reporting
In addition to the chemical release and management data collected through the TRI Program,
EPA collects information about the manufacture (including import) and use of chemicals in U.S.
commerce through the Chemical Data Reporting (CDR) rule implemented under TSCA.
Combining the chemical information reported to both TRI and CDR provides a more complete
picture of a chemical’s lifecycle from sources of import and domestic manufacture to final
deposition in the environment or products.
For calendar year 2015 activities (the most recent reporting year common to both TRI and
CDR), 8,707 individual chemicals were reported to the TSCA Chemical Data Reporting (CDR),
which tracks production and imports. 499 individual chemicals and chemical categories were
reported to TRI. Of the chemicals reported to TRI, 250 (50%) were also reported to CDR. The
remaining 249 chemicals reported to TRI are either not subject to Chemical Data Reporting
under TSCA (such as pesticides, pharmaceuticals, polymers, and TRI-specific chemical
categories); the facility is exempt from CDR reporting based on business size thresholds; the
chemicals are produced in amounts below the CDR reporting thresholds; or the chemicals are
processed or used by facilities that report to TRI, but not manufactured or imported, which are
the activities required to be reported to CDR.
To illustrate how TRI information complements the TSCA chemical assessments, one chemical,
1-bromopropane (1-BP), is presented as an example.
TRI National Analysis 2016 www.epa.gov/trinationalanalysis/ January 2018
8
In 2015 (the most recent year of CDR data, which was published in 2016), ten manufacturers,
including importers, reported a total production volume of 25.9 million pounds of 1-BP
manufactured/imported. Industrial activities reported include use as an intermediate in chemical
manufacturing, processing into chemical product formulations (e.g., solvents for cleaning and
degreasing and adhesives), processing into articles (e.g., insulation), non-incorporative uses
(e.g., solvent degreasing), and repackaging. Commercial and consumer uses reported include
adhesives and sealants, cleaning and furnishing care products, and electrical and electronic
products. In 2016 (the first year 1-BP was a TRI-listed chemical), 55 facilities filed a TRI form
for 1-BP, reporting a total of 1.56 million pounds of waste, most of which (51%) was released.
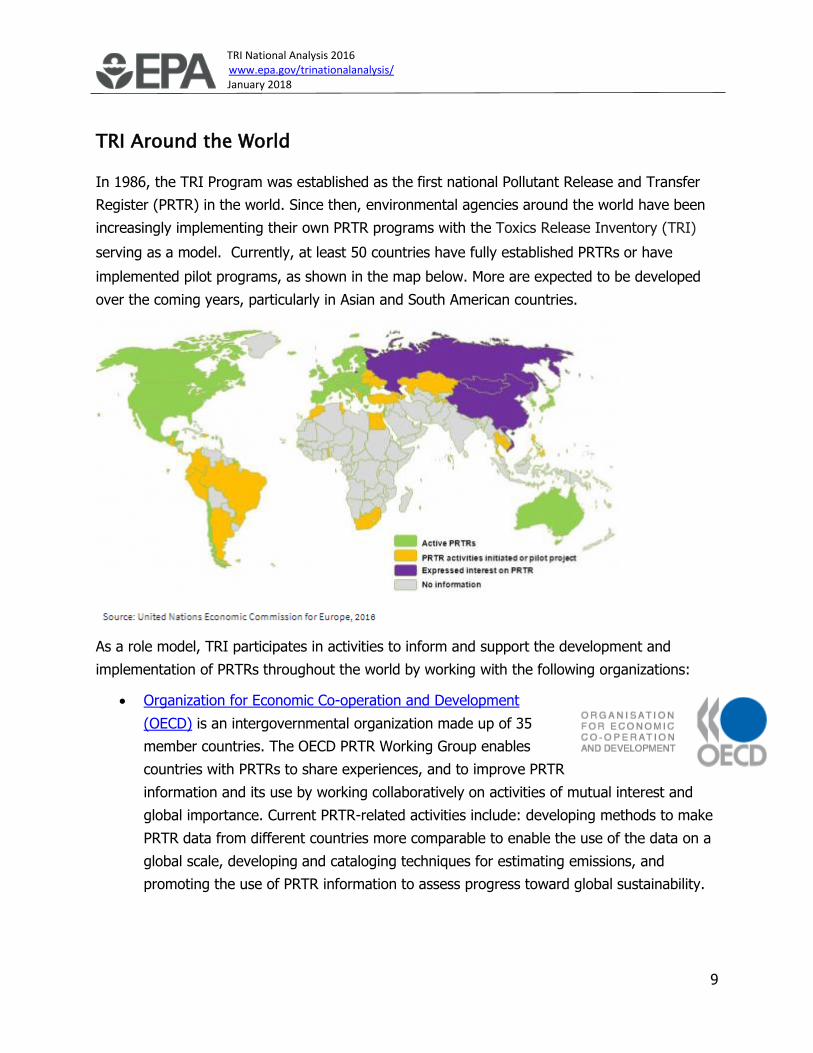
TRI National Analysis 2016 www.epa.gov/trinationalanalysis/ January 2018
9
TRI Around the World
In 1986, the TRI Program was established as the first national Pollutant Release and Transfer
Register (PRTR) in the world. Since then, environmental agencies around the world have been
increasingly implementing their own PRTR programs with the Toxics Release Inventory (TRI)
serving as a model. Currently, at least 50 countries have fully established PRTRs or have
implemented pilot programs, as shown in the map below. More are expected to be developed
over the coming years, particularly in Asian and South American countries.
As a role model, TRI participates in activities to inform and support the development and
implementation of PRTRs throughout the world by working with the following organizations:
• Organization for Economic Co-operation and Development
(OECD) is an intergovernmental organization made up of 35
member countries. The OECD PRTR Working Group enables
countries with PRTRs to share experiences, and to improve PRTR
information and its use by working collaboratively on activities of mutual interest and
global importance. Current PRTR-related activities include: developing methods to make
PRTR data from different countries more comparable to enable the use of the data on a
global scale, developing and cataloging techniques for estimating emissions, and
promoting the use of PRTR information to assess progress toward global sustainability.

TRI National Analysis 2016 www.epa.gov/trinationalanalysis/ January 2018
10
• United Nations Institute for Training and Research (UNITAR) works with
developing countries to implement new environmental programs and
transfer knowledge and technologies to them from nations with
established environmental programs. Currently, UNITAR is working with
several partners to institute PRTRs in Belarus, Cambodia, Ecuador, Kazakhstan, Moldova,
and Peru.
• The North American Commission for Environmental Cooperation (CEC) addresses
North American environmental concerns, helps prevent potential trade and
environmental conflicts, and promotes the effective enforcement of
environmental law. With established PRTRs in all three North American
countries, the CEC publishes an integrated dataset through its Taking Stock
Online website.
Read more about the TRI Around the World.